Embed Size (px)
Citation preview

2015
Revving the EngineThe 2015 North American Staffing and Recruiting Trends Report
2
3 Introduction
4 Key Findings
5 Revenue and Growth 5 Revenue Expectations
7 Headcount
8 Branch Expansion
9 Agency Health 9 Revenue from Repeat Client Business
10 Use of Vendor Management Systems
11 Performance Benchmarks 11 Most Important Metrics
12 Total Number of Placements Growth
13 Average Fill Rate in 2014
14 Average Hit Rate in 2014
15 Average Time-to-Fill in 2015
16 Average Number of Submissions per Hire
17 Average Number of Applications per Job Posting
18 Percentage of Firms’ Placements Made from Candidates in ATS
19 Compensation 19 Compensation Performance
19 Real Compensation in 2014
21 Trends for 2015 21 Opportunities and Challenges in the Next Five Years
22 Skills Shortage
23 Insights 23 Candidate Sourcing Strategies
25 Could You Do Your Job Effectively without an ATS or CRM?
26 Conclusion
27 Demographics
27 About Bullhorn
Table of Contents
In December of 2014, Bullhorn conducted its fifth annual Staffing and Recruiting Trends survey
of 1,285 agency recruiting professionals. The resulting report comprises performance benchmarks,
metrics, and revenue and compensation figures broken down by firm size, recruitment type, industry,
role recruited, and role of respondent. Recruiting professionals can use this report to compare
themselves and their firms to their peers in the recruiting industry.
For the purposes of this report, we broke down staffing and recruiting agencies into four sizes,
based on their number of recruiters and salespeople: 1-10 (small), 11-25 (lower-midsize), 26-74
(upper-midsize), and 75+ (large).
2014 was a year of continued success for the recruiting industry, and in some respects a year of
remarkable consistency. The overall rate of revenue growth, for instance, scarcely budged at all
from 2013 to 2014. However, where metrics didn’t remain static, they usually improved on last year’s
performance. The percentage of firms that experienced placement growth grew significantly, as did
overall industry fill rate and hit rate.
Even so, the rapid rate of growth representative of the last few years in the recruiting industry
does seem to have slowed. A downturn isn’t necessarily in order, but there are definitely some
warning signs to be noted. Respondents are generating significantly more revenue from repeat
client business than last year, and while that might be seen as a hallmark of consistency, it could
also signal a reduced focus on expanding the client base. Additionally, headcount and branch
expansion plans stayed roughly the same over the past year, despite placement growth and revenue
expectations growing from 2013 to 2014. Recruiting firms’ conservative plans in the face of tangible
growth and high expectations may suggest a tentative industry mindset in the wake of the recession
of the late 2000s.
Please note: some figures may not add up to 100% due to rounding.
3
Introduction
4
Metrics
• 77% of respondents
met or exceeded their
revenue goals in 2014,
equaling 2013’s rate of
success. 89% expect a
revenue increase in
2015, representing a
slight increase in
optimism from last
year’s 88%.
• Only 65% of small
recruiting firms plan
on increasing their
headcount over the
coming year, while 86%
of firms with 11 or
more recruiters and
salespeople plan to
increase hiring in 2015.
• Recruiting firms’ 2015
branch expansion
plans have a direct
relationship to firm
size – only 15% of small
firms plan to launch
new offices in 2015, but
48% of large firms plan
to do the same.
• Respondents chose
fill rate as the most
important recruiting
delivery process metric
and total number of
placements as the most
important revenue-
driving performance
metric.
• Industry-wide, fill rate
grew from 46% in 2013
to 50% in 2014. Hit
rate also increased
from last year’s 40% to
42% in 2014.
• From 2013 to 2014, the
average contract time-
to-fill increased from 6
days to 10 days and the
average permanent
time-to-fill fell from 32
days to 23 days.
• By industry,
government had both
the lowest fill rate and
hit rate in 2014.
• 75% of respondents
indicated a skills
shortage in the
industries for which
they recruit, after a dip
down to 71% in last
year’s survey.
• As in fill rate and hit
rate, government also
led the way in terms of
skills shortages, with
83% of respondents
who fill government
jobs acknowledging
a lack of qualified
candidates.
• The top three sources
of qualified candidates
in 2014 remained
unchanged from 2013:
existing candidates
from respondents’
applicant tracking
systems, referrals, and
social media.
• 77% of respondents
said that they needed
an ATS or CRM system
to do their job
effectively, including
79% of respondents
from contract firms and
82% of respondents
from temporary firms.
Key Findings
Growth Candidates
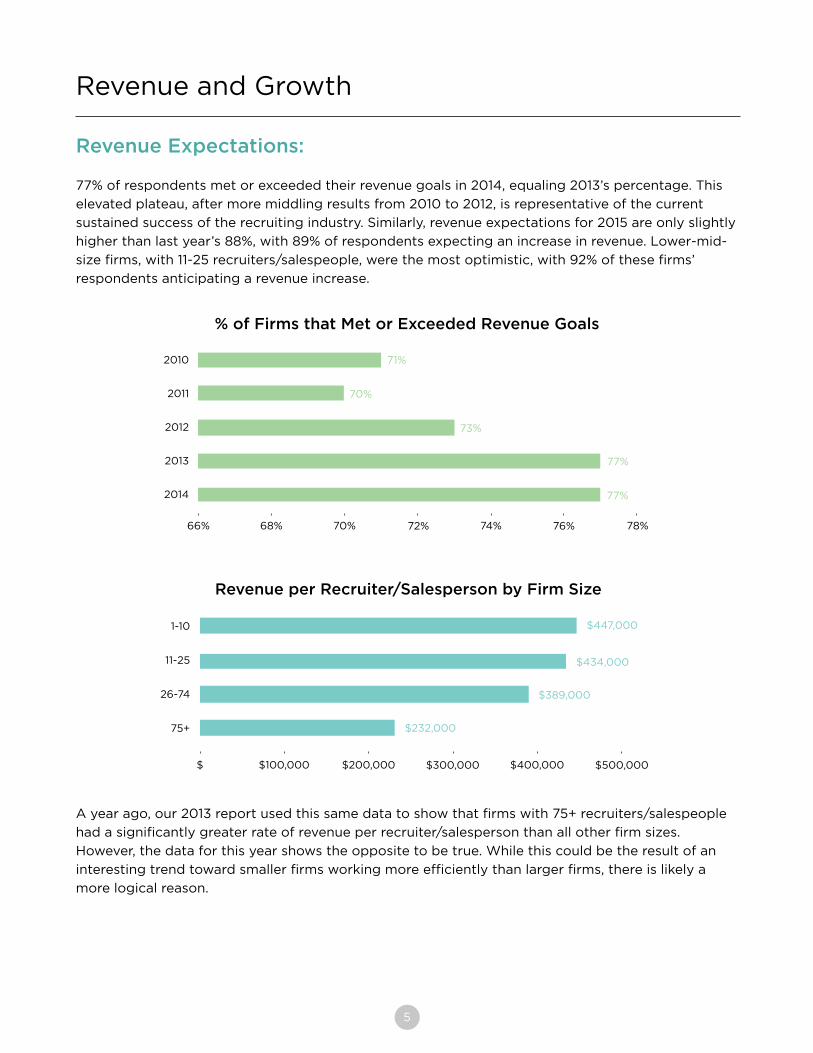
Revenue Expectations:
77% of respondents met or exceeded their revenue goals in 2014, equaling 2013’s percentage. This
elevated plateau, after more middling results from 2010 to 2012, is representative of the current
sustained success of the recruiting industry. Similarly, revenue expectations for 2015 are only slightly
higher than last year’s 88%, with 89% of respondents expecting an increase in revenue. Lower-mid-
size firms, with 11-25 recruiters/salespeople, were the most optimistic, with 92% of these firms’
respondents anticipating a revenue increase.
5
Revenue and Growth
% of Firms that Met or Exceeded Revenue Goals
2010
2011
2012
2013
2014
66% 68% 70% 72% 74% 76% 78%
77%
77%
73%
70%
71%
Revenue per Recruiter/Salesperson by Firm Size
1-10
11-25
26-74
75+
$ $100,000 $200,000 $300,000 $400,000 $500,000
$232,000
$389,000
$434,000
$447,000
A year ago, our 2013 report used this same data to show that firms with 75+ recruiters/salespeople
had a significantly greater rate of revenue per recruiter/salesperson than all other firm sizes.
However, the data for this year shows the opposite to be true. While this could be the result of an
interesting trend toward smaller firms working more efficiently than larger firms, there is likely a
more logical reason.
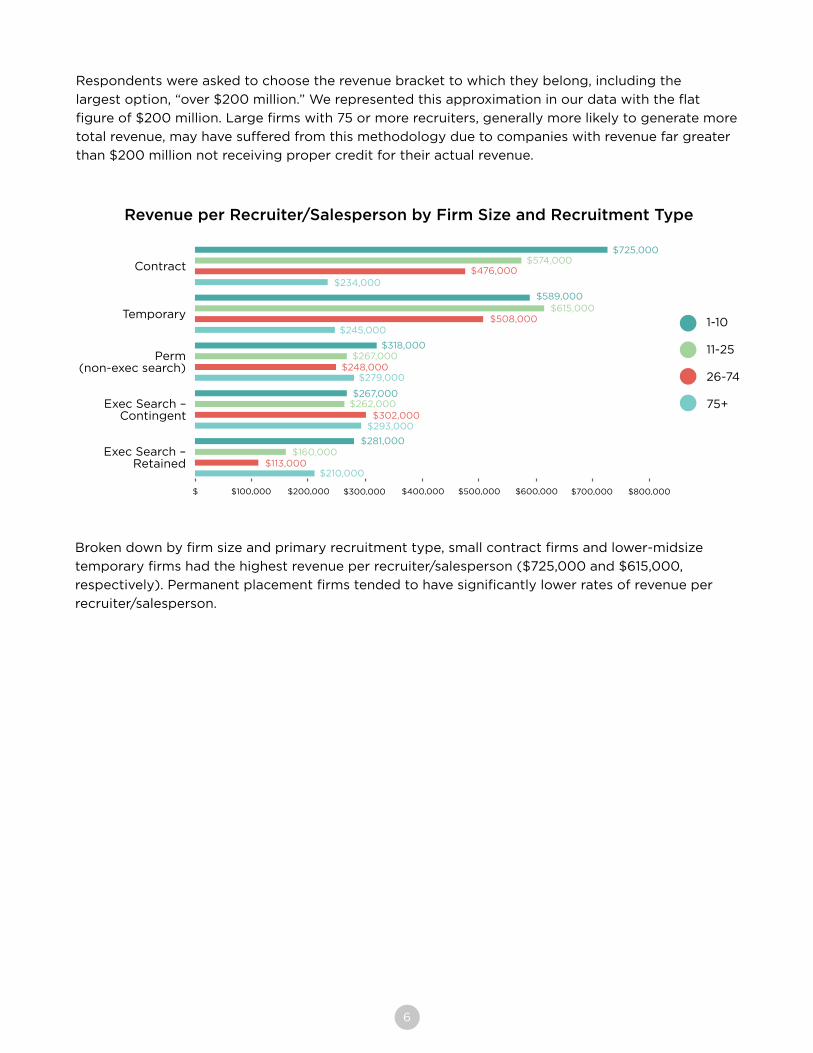
Respondents were asked to choose the revenue bracket to which they belong, including the
largest option, “over $200 million.” We represented this approximation in our data with the flat
figure of $200 million. Large firms with 75 or more recruiters, generally more likely to generate more
total revenue, may have suffered from this methodology due to companies with revenue far greater
than $200 million not receiving proper credit for their actual revenue.
6
Contract
$ $100,000 $200,000 $300,000 $400,000 $700,000
$725,000$574,000
$476,000
$589,000$615,000
$508,000
$234,000
$245,000
$318,000$267,000
$248,000$279,000
$267,000$262,000
$302,000$293,000
$281,000$160,000
$113,000$210,000
$500,000 $600,000 $800,000
Temporary
Perm(non-exec search)
Exec Search –Contingent
Exec Search –Retained
Revenue per Recruiter/Salesperson by Firm Size and Recruitment Type
Broken down by firm size and primary recruitment type, small contract firms and lower-midsize
temporary firms had the highest revenue per recruiter/salesperson ($725,000 and $615,000,
respectively). Permanent placement firms tended to have significantly lower rates of revenue per
recruiter/salesperson.
1-10
11-25
26-74
75+
7
Headcount:
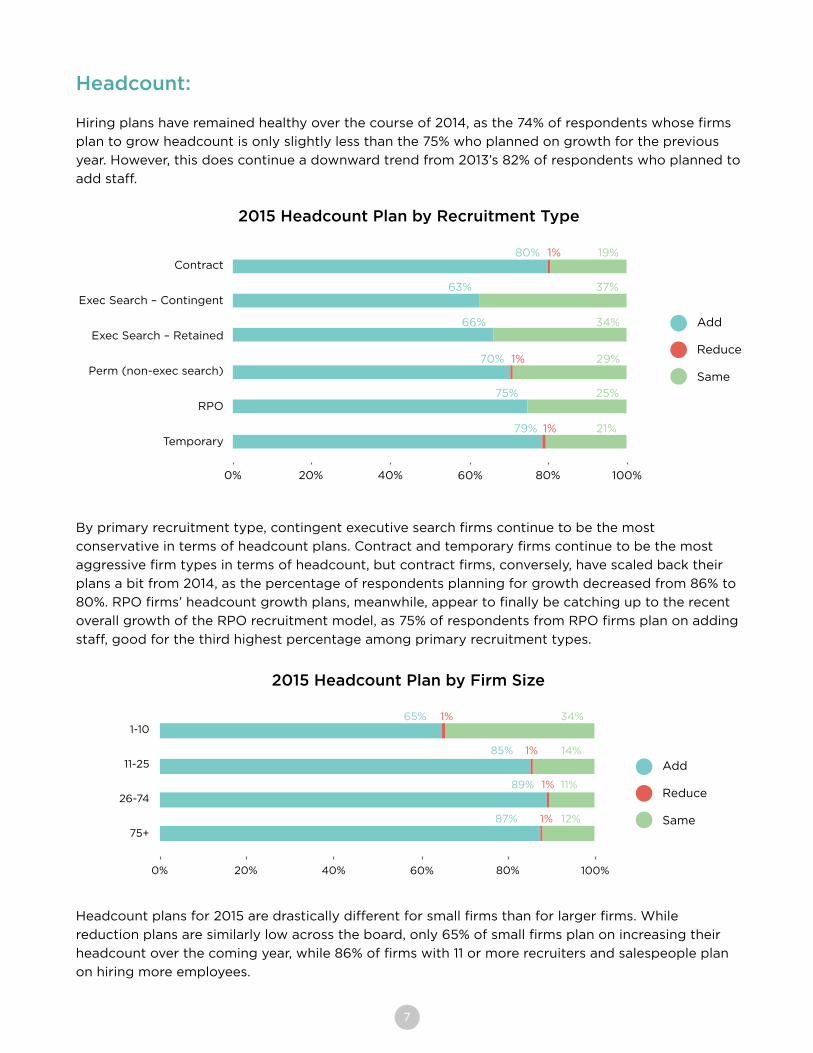
Hiring plans have remained healthy over the course of 2014, as the 74% of respondents whose firms
plan to grow headcount is only slightly less than the 75% who planned on growth for the previous
year. However, this does continue a downward trend from 2013’s 82% of respondents who planned to
add staff.
2015 Headcount Plan by Recruitment Type
Contract
Exec Search – Contingent
Exec Search – Retained
Perm (non-exec search)
RPO
Temporary
0% 20% 40% 60% 80% 100%
19%1%80%
37%63%
34%66%
29%1%70%
25%75%
21%1%79%
Add
Reduce
Same
By primary recruitment type, contingent executive search firms continue to be the most
conservative in terms of headcount plans. Contract and temporary firms continue to be the most
aggressive firm types in terms of headcount, but contract firms, conversely, have scaled back their
plans a bit from 2014, as the percentage of respondents planning for growth decreased from 86% to
80%. RPO firms’ headcount growth plans, meanwhile, appear to finally be catching up to the recent
overall growth of the RPO recruitment model, as 75% of respondents from RPO firms plan on adding
staff, good for the third highest percentage among primary recruitment types.
Headcount plans for 2015 are drastically different for small firms than for larger firms. While
reduction plans are similarly low across the board, only 65% of small firms plan on increasing their
headcount over the coming year, while 86% of firms with 11 or more recruiters and salespeople plan
on hiring more employees.
2015 Headcount Plan by Firm Size
1-10
11-25
26-74
75+
0% 20% 40% 60% 80% 100%
14%1%85%
12%1%87%
34%65% 1%
11%89% 1%
Add
Reduce
Same
8
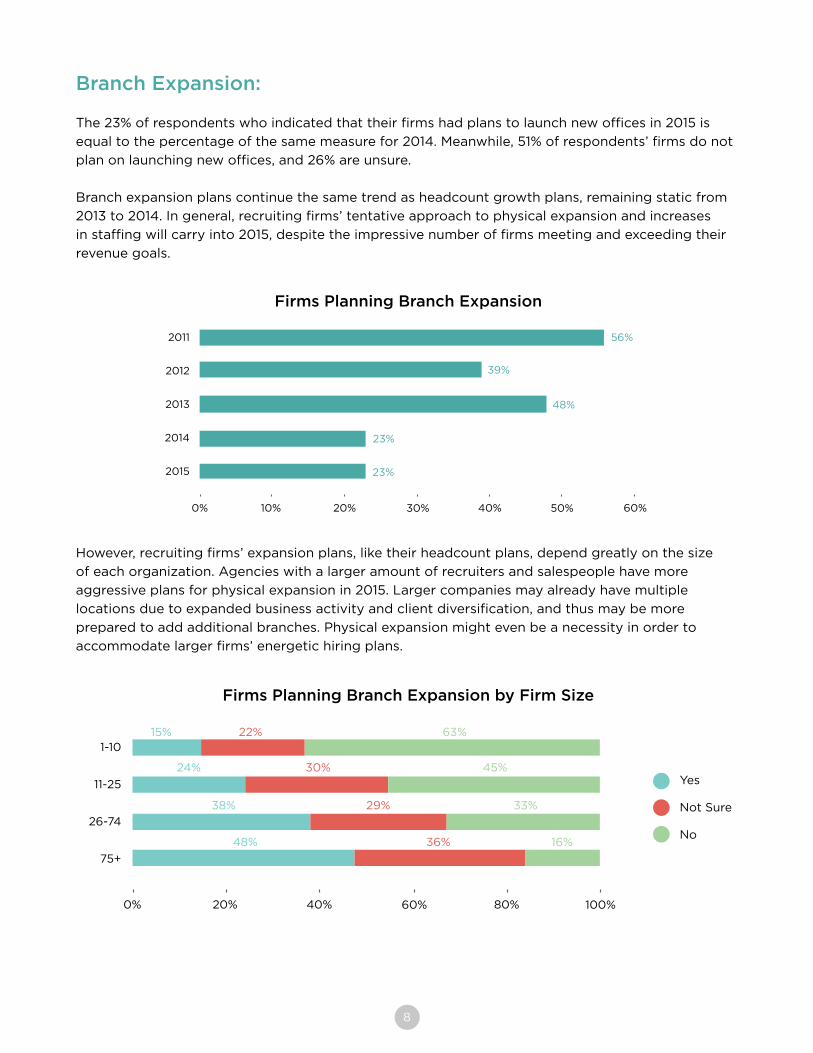
However, recruiting firms’ expansion plans, like their headcount plans, depend greatly on the size
of each organization. Agencies with a larger amount of recruiters and salespeople have more
aggressive plans for physical expansion in 2015. Larger companies may already have multiple
locations due to expanded business activity and client diversification, and thus may be more
prepared to add additional branches. Physical expansion might even be a necessity in order to
accommodate larger firms’ energetic hiring plans.
Firms Planning Branch Expansion
2011
2012
2013
2014
2015
0% 10% 20% 30% 40% 50% 60%
23%
23%
48%
39%
56%
Branch Expansion:
The 23% of respondents who indicated that their firms had plans to launch new offices in 2015 is
equal to the percentage of the same measure for 2014. Meanwhile, 51% of respondents’ firms do not
plan on launching new offices, and 26% are unsure.
Branch expansion plans continue the same trend as headcount growth plans, remaining static from
2013 to 2014. In general, recruiting firms’ tentative approach to physical expansion and increases
in staffing will carry into 2015, despite the impressive number of firms meeting and exceeding their
revenue goals.
Firms Planning Branch Expansion by Firm Size
1-10
11-25
26-74
75+
0% 20% 40% 60% 80% 100%
45%30%24%
16%36%48%
63%15% 22%
33%38% 29%
Yes
Not Sure
No
9
Revenue from Repeat Client Business:
A high percentage of revenue generated from repeat client business is a valuable indicator of
sustained service quality provided by recruiting firms. Therefore, the 79% of respondents that
generate 50% or more of their revenue from repeat client business is a solid sign of current
consistency and success in the recruiting industry. This represents a 7% increase from last year’s
72% of respondents.
Percentage of Revenue from Repeat Client Business
25%
20%
15%
10%
5%
0%0-9% 10-19% 20-29% 30-39% 40-49% 50-59% 60-69%
2%
70-79% 80-89% 90-100%
2%
4% 5%
7%
15%
12%
24%
19%
10%
Average Percentage of Revenue from Repeat Client Business by Recruitment Type
Overall
Temporary
Contract
Perm (non-exec search)
Exec Search – Contingent
Exec Search – Retained
0% 60%20% 40% 80%
57%
60%
60%
64%
73%
63%
In 2014, firms specializing in temporary staffing generated by far the most revenue from repeat client
business with a robust average of 73%, a 9% increase from 2013. Overall, firms of all sizes generate
an average of 63% of their revenue from repeat client business.
Temp firms’ increased percentage of business from repeat clients is indicative of an increase in client
retention. Not the least of several potential contributing factors to this increase is the growing usage
rate of efficiency-improving vendor management systems (VMS) by temp agencies, which will be
addressed in the next section.
Agency Health
10
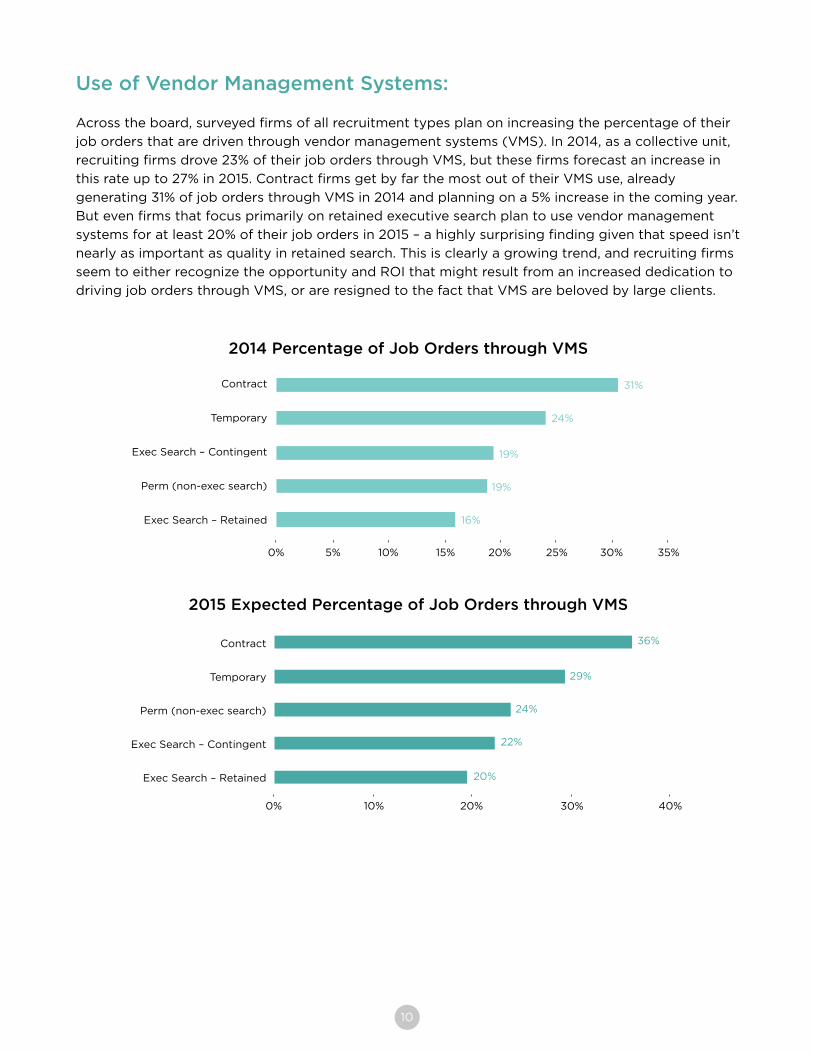
Use of Vendor Management Systems:
Across the board, surveyed firms of all recruitment types plan on increasing the percentage of their
job orders that are driven through vendor management systems (VMS). In 2014, as a collective unit,
recruiting firms drove 23% of their job orders through VMS, but these firms forecast an increase in
this rate up to 27% in 2015. Contract firms get by far the most out of their VMS use, already
generating 31% of job orders through VMS in 2014 and planning on a 5% increase in the coming year.
But even firms that focus primarily on retained executive search plan to use vendor management
systems for at least 20% of their job orders in 2015 – a highly surprising finding given that speed isn’t
nearly as important as quality in retained search. This is clearly a growing trend, and recruiting firms
seem to either recognize the opportunity and ROI that might result from an increased dedication to
driving job orders through VMS, or are resigned to the fact that VMS are beloved by large clients.
2014 Percentage of Job Orders through VMS
Contract
Temporary
Exec Search – Contingent
Perm (non-exec search)
Exec Search – Retained
0% 30%10% 15% 35%
16%
19%
19%
24%
31%
20% 25%5%
2015 Expected Percentage of Job Orders through VMS
Contract
Temporary
Perm (non-exec search)
Exec Search – Contingent
Exec Search – Retained
0% 10% 20% 30% 40%
20%
22%
24%
29%
36%
11
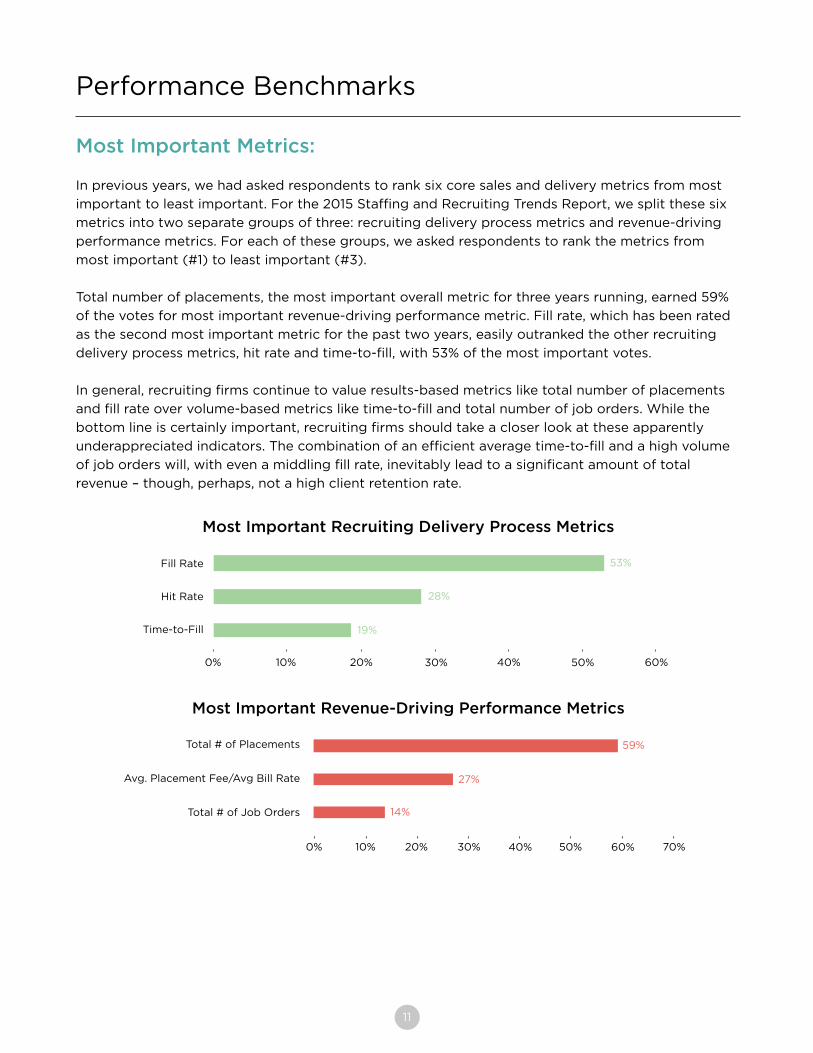
Most Important Metrics:
In previous years, we had asked respondents to rank six core sales and delivery metrics from most
important to least important. For the 2015 Staffing and Recruiting Trends Report, we split these six
metrics into two separate groups of three: recruiting delivery process metrics and revenue-driving
performance metrics. For each of these groups, we asked respondents to rank the metrics from
most important (#1) to least important (#3).
Total number of placements, the most important overall metric for three years running, earned 59%
of the votes for most important revenue-driving performance metric. Fill rate, which has been rated
as the second most important metric for the past two years, easily outranked the other recruiting
delivery process metrics, hit rate and time-to-fill, with 53% of the most important votes.
In general, recruiting firms continue to value results-based metrics like total number of placements
and fill rate over volume-based metrics like time-to-fill and total number of job orders. While the
bottom line is certainly important, recruiting firms should take a closer look at these apparently
underappreciated indicators. The combination of an efficient average time-to-fill and a high volume
of job orders will, with even a middling fill rate, inevitably lead to a significant amount of total
revenue – though, perhaps, not a high client retention rate.
Most Important Recruiting Delivery Process Metrics
Performance Benchmarks
Fill Rate
Hit Rate
Time-to-Fill
0% 10% 20% 30% 40% 50% 60%
19%
28%
53%
Most Important Revenue-Driving Performance Metrics
Total # of Placements
Avg. Placement Fee/Avg Bill Rate
Total # of Job Orders
0% 20% 30% 40% 50% 60% 70%
14%
27%
59%
10%
12
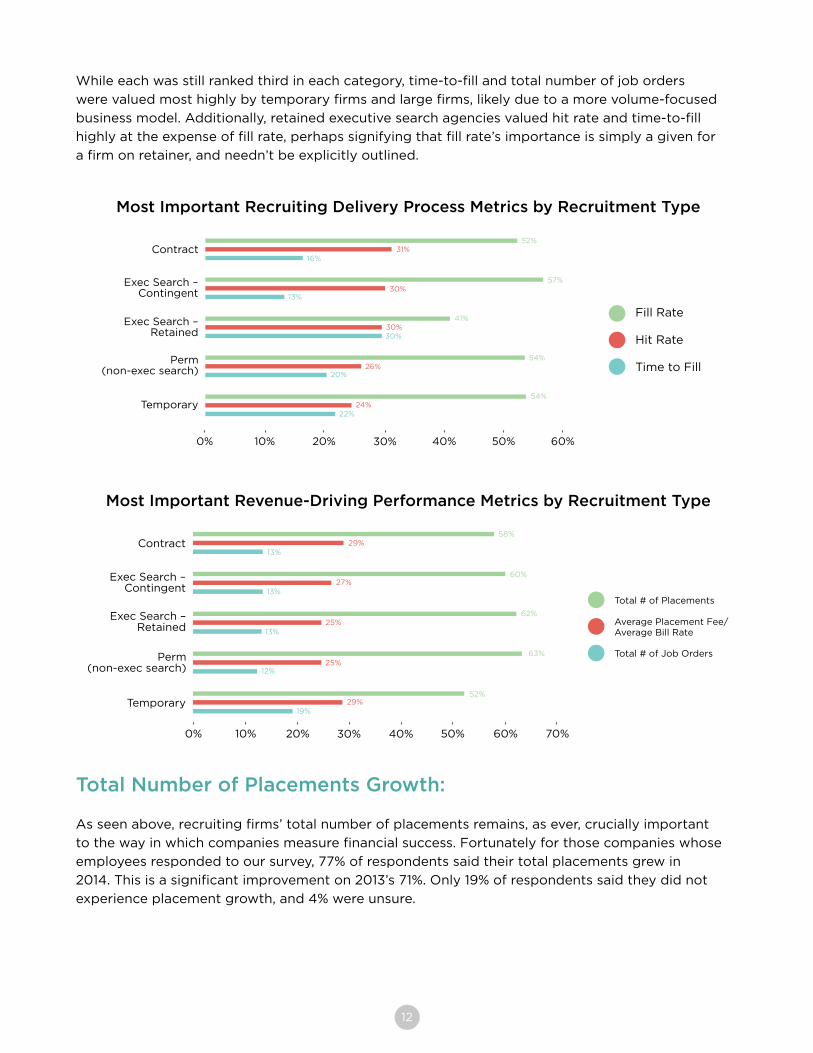
While each was still ranked third in each category, time-to-fill and total number of job orders
were valued most highly by temporary firms and large firms, likely due to a more volume-focused
business model. Additionally, retained executive search agencies valued hit rate and time-to-fill
highly at the expense of fill rate, perhaps signifying that fill rate’s importance is simply a given for
a firm on retainer, and needn’t be explicitly outlined.
Most Important Recruiting Delivery Process Metrics by Recruitment Type
Contract
0% 10% 20% 30% 40%
54%24%
22%
50% 60%
Exec Search – Contingent
Exec Search – Retained
Perm(non-exec search)
Temporary
54%26%
20%
41%30%30%
57%30%
13%
52%31%
16%
Most Important Revenue-Driving Performance Metrics by Recruitment Type
0% 20% 40% 50%
52%29%
19%
60% 70%
Contract
Exec Search –Contingent
Exec Search – Retained
Temporary
25%12%
62%25%
13%
60%27%
13%
58%29%
13%
30%10%
Perm(non-exec search)
63%
Total Number of Placements Growth:
As seen above, recruiting firms’ total number of placements remains, as ever, crucially important
to the way in which companies measure financial success. Fortunately for those companies whose
employees responded to our survey, 77% of respondents said their total placements grew in
2014. This is a significant improvement on 2013’s 71%. Only 19% of respondents said they did not
experience placement growth, and 4% were unsure.
Fill Rate
Hit Rate
Time to Fill
Total # of Placements
Average Placement Fee/Average Bill Rate
Total # of Job Orders
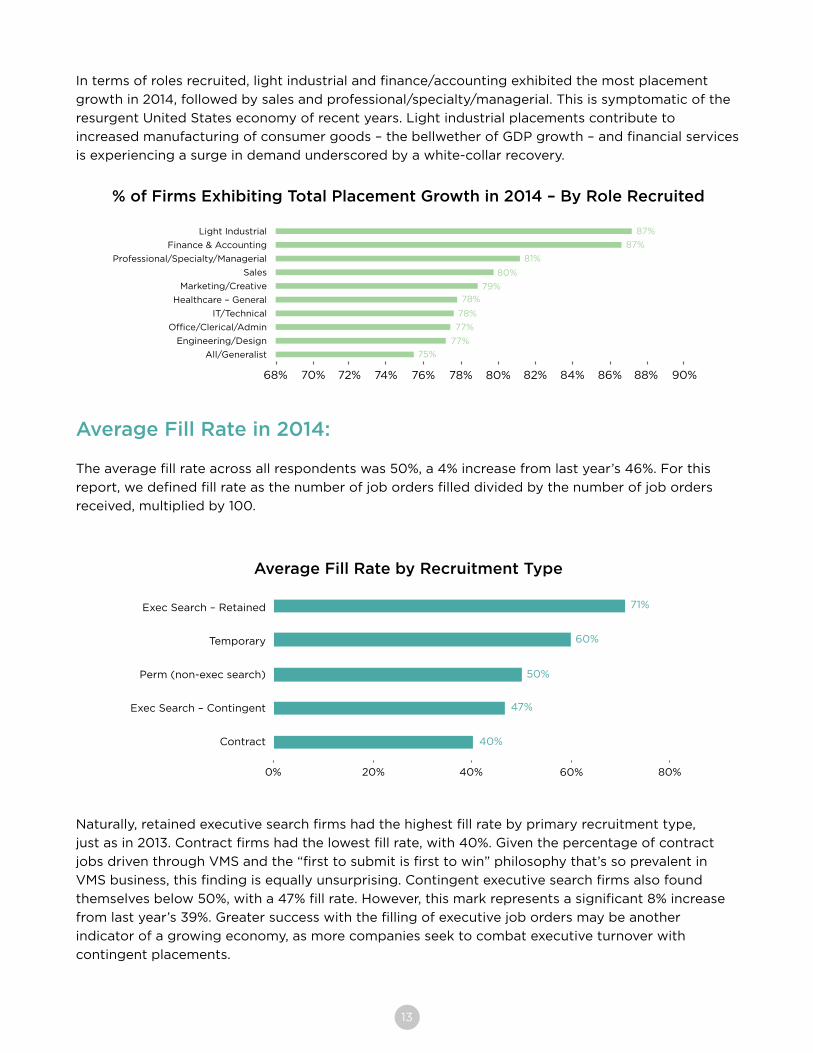
In terms of roles recruited, light industrial and finance/accounting exhibited the most placement
growth in 2014, followed by sales and professional/specialty/managerial. This is symptomatic of the
resurgent United States economy of recent years. Light industrial placements contribute to
increased manufacturing of consumer goods – the bellwether of GDP growth – and financial services
is experiencing a surge in demand underscored by a white-collar recovery.
13
% of Firms Exhibiting Total Placement Growth in 2014 – By Role Recruited
68% 72% 76% 82%
77%
77%
75%
88% 90%
Light Industrial
Finance & Accounting
Professional/Specialty/Managerial
Sales
Marketing/Creative
Healthcare – General
IT/Technical
Office/Clerical/Admin
Engineering/Design
All/Generalist
79%
78%
78%
87%
81%
80%
87%
74%70% 78% 80% 84% 86%
Average Fill Rate in 2014:
The average fill rate across all respondents was 50%, a 4% increase from last year’s 46%. For this
report, we defined fill rate as the number of job orders filled divided by the number of job orders
received, multiplied by 100.
Average Fill Rate by Recruitment Type
Exec Search – Retained
Temporary
Perm (non-exec search)
Exec Search – Contingent
Contract
0% 20% 40% 60% 80%
40%
47%
50%
60%
71%
Naturally, retained executive search firms had the highest fill rate by primary recruitment type,
just as in 2013. Contract firms had the lowest fill rate, with 40%. Given the percentage of contract
jobs driven through VMS and the “first to submit is first to win” philosophy that’s so prevalent in
VMS business, this finding is equally unsurprising. Contingent executive search firms also found
themselves below 50%, with a 47% fill rate. However, this mark represents a significant 8% increase
from last year’s 39%. Greater success with the filling of executive job orders may be another
indicator of a growing economy, as more companies seek to combat executive turnover with
contingent placements.
14
Average Fill Rate by Industry
0% 10% 30%
42%
70%
Industrial
Consumer Products
Marketing/PR/Media/Advertising
Manufacturing
Retail
Business Services
Construction
Automotive
Energy/Chemical
Pharma/Biotech/Medical Equipment
Healthcare
Telecommunications
Finance/Insurance
Technology
Government
20% 40% 50% 60%
40%
42%
43%
45%
45%
46%
51%
51%
52%
52%
53%
53%
56%
62%
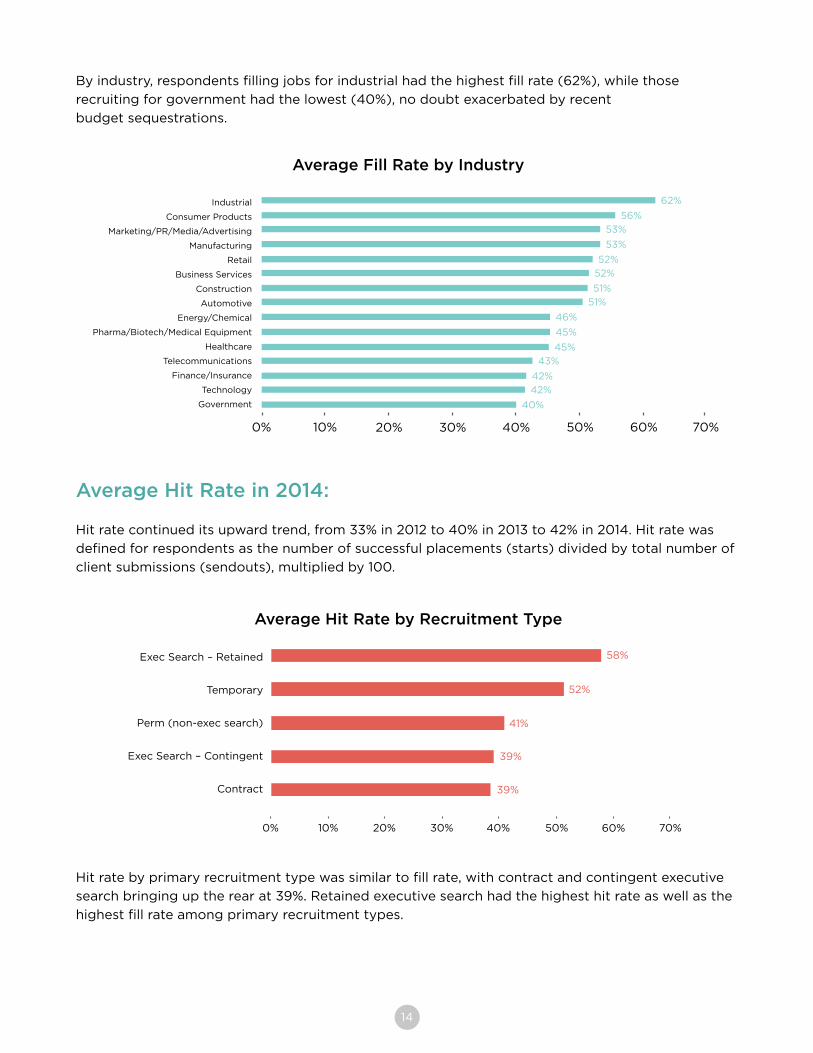
Average Hit Rate in 2014:
Hit rate continued its upward trend, from 33% in 2012 to 40% in 2013 to 42% in 2014. Hit rate was
defined for respondents as the number of successful placements (starts) divided by total number of
client submissions (sendouts), multiplied by 100.
Average Hit Rate by Recruitment Type
Exec Search – Retained
Temporary
Perm (non-exec search)
Exec Search – Contingent
Contract
0% 10% 40% 60% 70%
39%
39%
41%
52%
58%
50%30%20%
Hit rate by primary recruitment type was similar to fill rate, with contract and contingent executive
search bringing up the rear at 39%. Retained executive search had the highest hit rate as well as the
highest fill rate among primary recruitment types.
By industry, respondents filling jobs for industrial had the highest fill rate (62%), while those
recruiting for government had the lowest (40%), no doubt exacerbated by recent
budget sequestrations.
15
Average Hit Rate by Industry
0% 10% 30%
38%
Industrial
Business Services
Consumer Products
Manufacturing
Telecommunications
Marketing/PR/Media/Advertising
Healthcare
Construction
Retail
Automotive
Finance/Insurance
Energy/Chemical
Technology
Pharma/Biotech/Medical Equipment
Government
20% 40% 50% 60%
37%
38%39%39%
40%41%
42%42%
43%
44%44%44%
44%49%
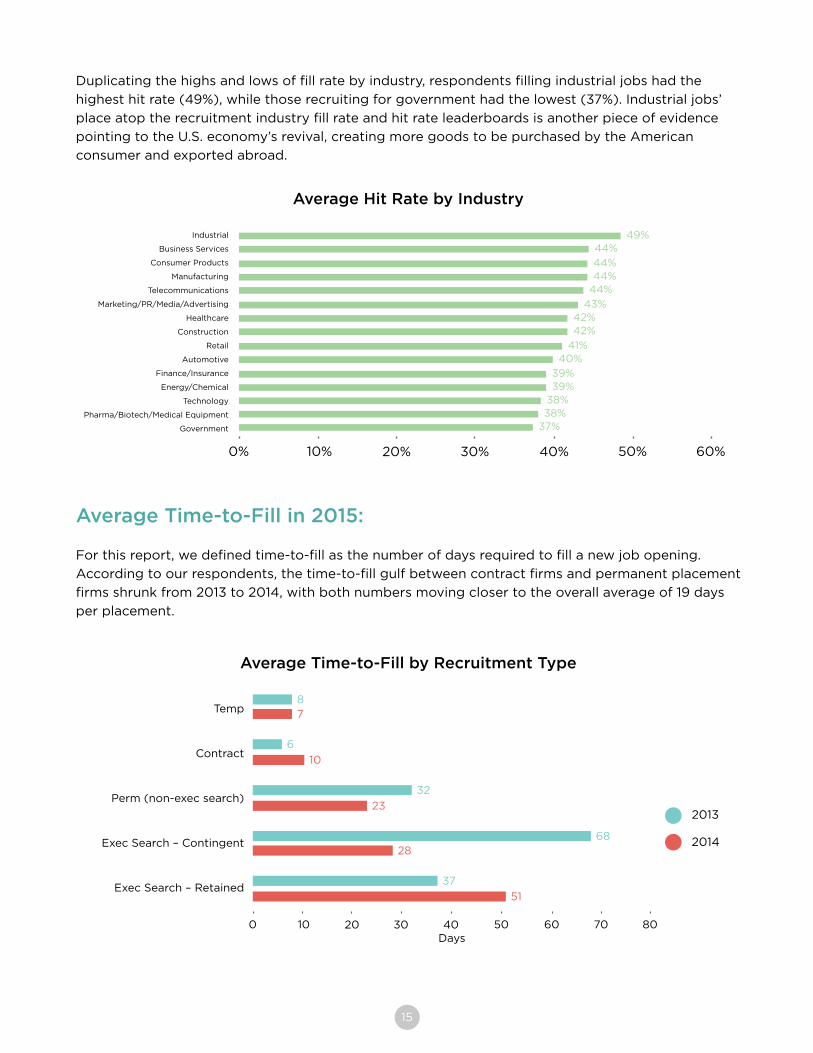
Average Time-to-Fill in 2015:
For this report, we defined time-to-fill as the number of days required to fill a new job opening.
According to our respondents, the time-to-fill gulf between contract firms and permanent placement
firms shrunk from 2013 to 2014, with both numbers moving closer to the overall average of 19 days
per placement.
Duplicating the highs and lows of fill rate by industry, respondents filling industrial jobs had the
highest hit rate (49%), while those recruiting for government had the lowest (37%). Industrial jobs’
place atop the recruitment industry fill rate and hit rate leaderboards is another piece of evidence
pointing to the U.S. economy’s revival, creating more goods to be purchased by the American
consumer and exported abroad.
Average Time-to-Fill by Recruitment Type
0 10 30
Temp
Contract
Perm (non-exec search)
Exec Search – Contingent
Exec Search – Retained
20 40 50 80
51
37
2868
23
32
10
6
78
60 70Days
2013
2014
16
Average Time-to-Fill by Industry – Permanent
0 5 15
28
TransportationSocial Services
IndustrialTelecommunications
AutomotiveConstruction
HealthcareBusiness Services
EntertainmentPharma/Biotech/Medical Equipment
Packaging/Transport/Warehouse/CargoManufacturing
Energy/ChemicalConsumer Products
Finance/InsuranceMarketing/PR/Media/Advertising
TechnologyGovernment
RetailRestaurant/Hospitality
10 20 25 35
30
2625
24
24
24
2322
22
22
22
21
21
20
30
19
19
1614
12
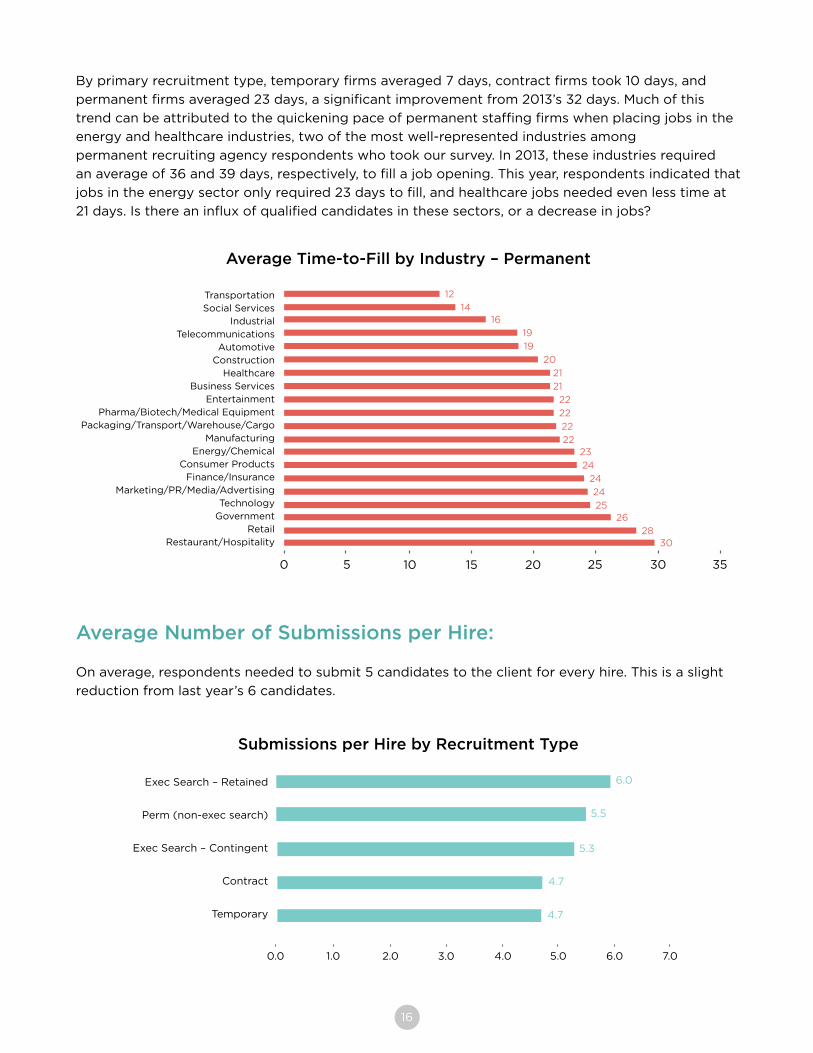
Average Number of Submissions per Hire:
On average, respondents needed to submit 5 candidates to the client for every hire. This is a slight
reduction from last year’s 6 candidates.
Submissions per Hire by Recruitment Type
Exec Search – Retained
Perm (non-exec search)
Exec Search – Contingent
Contract
Temporary
0.0 1.0 2.0 3.0 4.0
4.7
4.7
5.3
5.5
6.0
5.0 6.0 7.0
By primary recruitment type, temporary firms averaged 7 days, contract firms took 10 days, and
permanent firms averaged 23 days, a significant improvement from 2013’s 32 days. Much of this
trend can be attributed to the quickening pace of permanent staffing firms when placing jobs in the
energy and healthcare industries, two of the most well-represented industries among
permanent recruiting agency respondents who took our survey. In 2013, these industries required
an average of 36 and 39 days, respectively, to fill a job opening. This year, respondents indicated that
jobs in the energy sector only required 23 days to fill, and healthcare jobs needed even less time at
21 days. Is there an influx of qualified candidates in these sectors, or a decrease in jobs?
17
Submissions per Hire by Role Recruited
0.0 1.0 3.0
4.5
Sales
Marketing/Creative
Engineering/Design
Clinical/Scientific
Light Industrial
IT/Technical
Professional/Specialty/Managerial
All/Generalist
Office/Clerical/Admin
Finance & Accounting
Healthcare – General
2.0 4.0 5.0 6.0
4.2
4.7
4.7
4.8
5.0
5.1
5.2
5.5
6.3
6.5
7.0
Average Number of Applications per Job Posting:
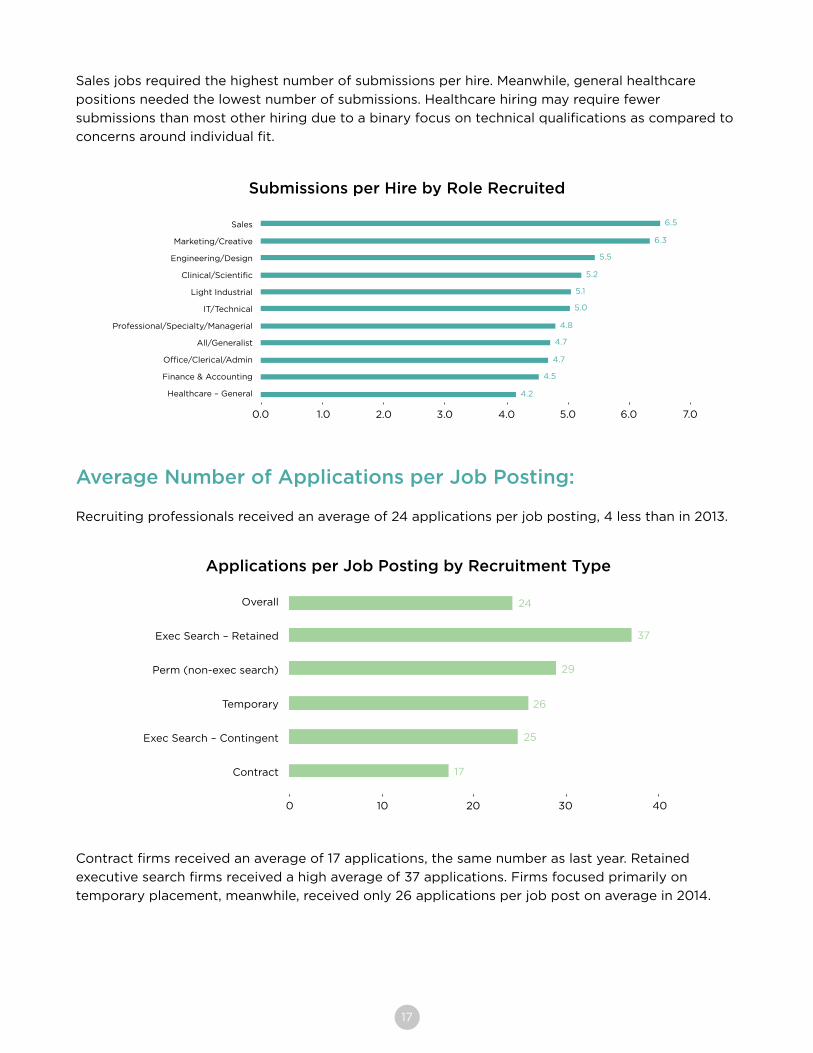
Recruiting professionals received an average of 24 applications per job posting, 4 less than in 2013.
Contract firms received an average of 17 applications, the same number as last year. Retained
executive search firms received a high average of 37 applications. Firms focused primarily on
temporary placement, meanwhile, received only 26 applications per job post on average in 2014.
Applications per Job Posting by Recruitment Type
Overall
Exec Search – Retained
Perm (non-exec search)
Temporary
Exec Search – Contingent
Contract
0 302010 40
17
25
26
29
37
24
Sales jobs required the highest number of submissions per hire. Meanwhile, general healthcare
positions needed the lowest number of submissions. Healthcare hiring may require fewer
submissions than most other hiring due to a binary focus on technical qualifications as compared to
concerns around individual fit.
18
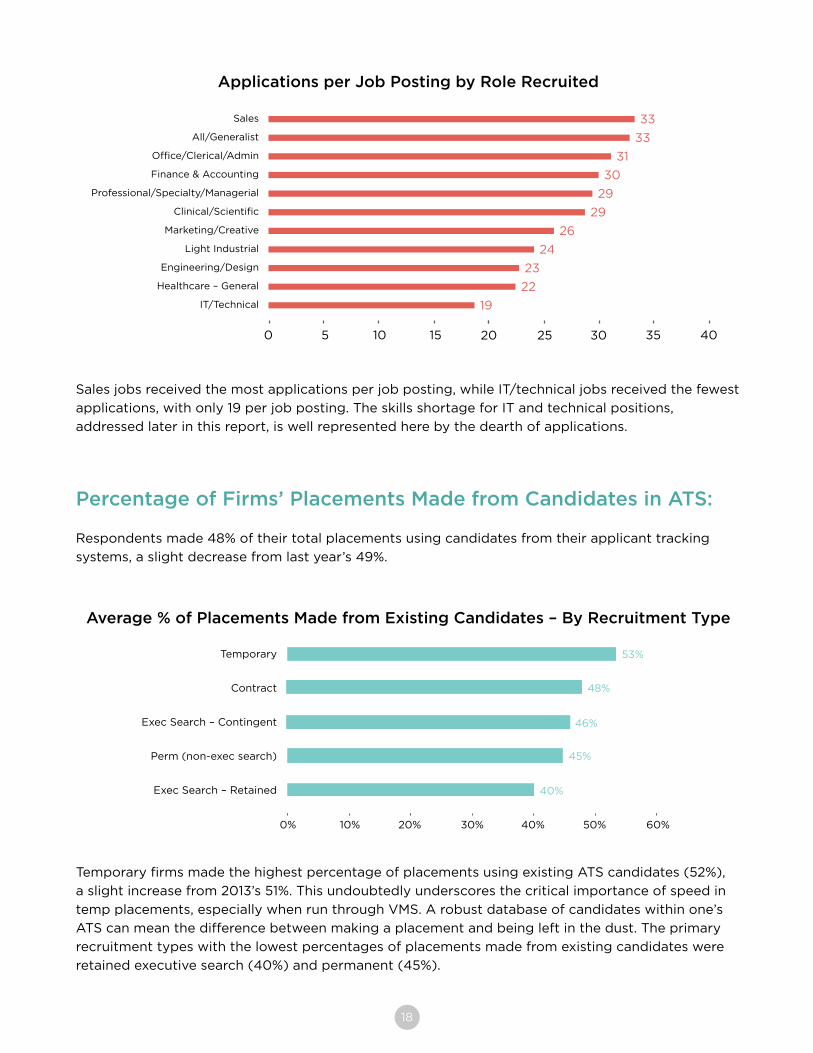
Applications per Job Posting by Role Recruited
0 5
22
Sales
All/Generalist
Office/Clerical/Admin
Finance & Accounting
Professional/Specialty/Managerial
Clinical/Scientific
Marketing/Creative
Light Industrial
Engineering/Design
Healthcare – General
IT/Technical
20 30 35 40
19
23
24
26
29
29
30
31
33
33
10 2515
Sales jobs received the most applications per job posting, while IT/technical jobs received the fewest
applications, with only 19 per job posting. The skills shortage for IT and technical positions,
addressed later in this report, is well represented here by the dearth of applications.
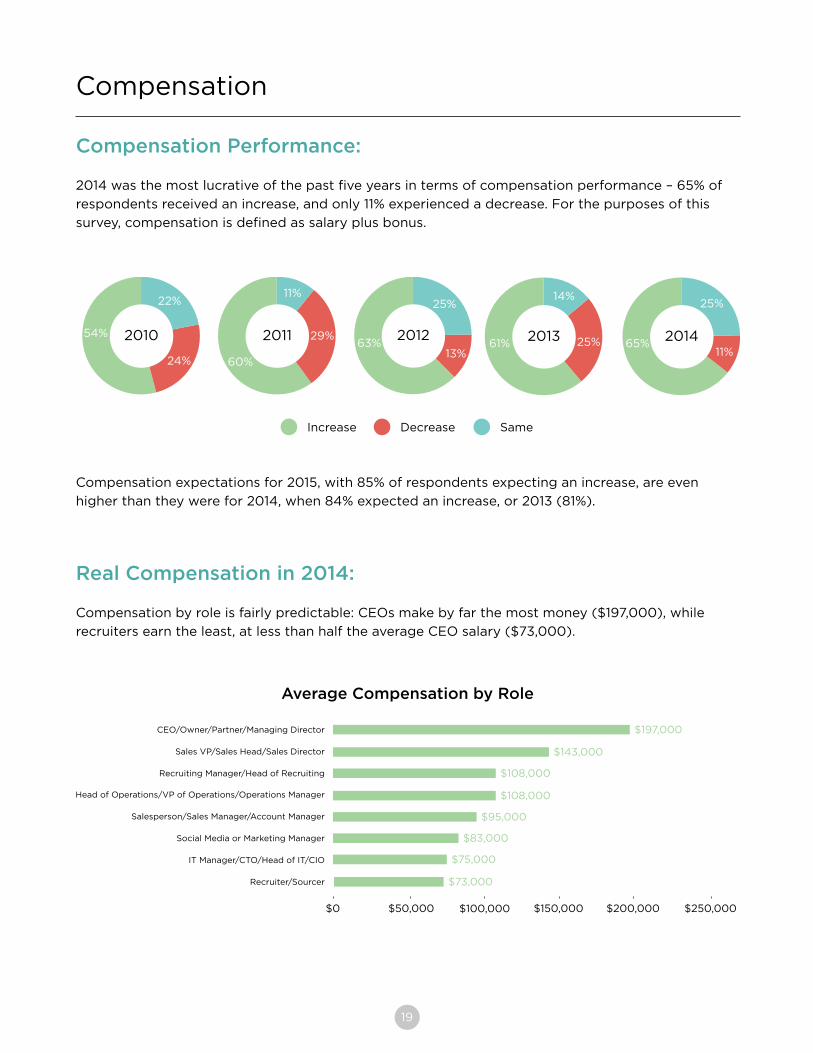
Percentage of Firms’ Placements Made from Candidates in ATS:
Respondents made 48% of their total placements using candidates from their applicant tracking
systems, a slight decrease from last year’s 49%.
Average % of Placements Made from Existing Candidates – By Recruitment Type
Temporary
Contract
Exec Search – Contingent
Perm (non-exec search)
Exec Search – Retained
0% 30%20%10% 60%
40%
45%
46%
48%
53%
40% 50%
Temporary firms made the highest percentage of placements using existing ATS candidates (52%),
a slight increase from 2013’s 51%. This undoubtedly underscores the critical importance of speed in
temp placements, especially when run through VMS. A robust database of candidates within one’s
ATS can mean the difference between making a placement and being left in the dust. The primary
recruitment types with the lowest percentages of placements made from existing candidates were
retained executive search (40%) and permanent (45%).
19
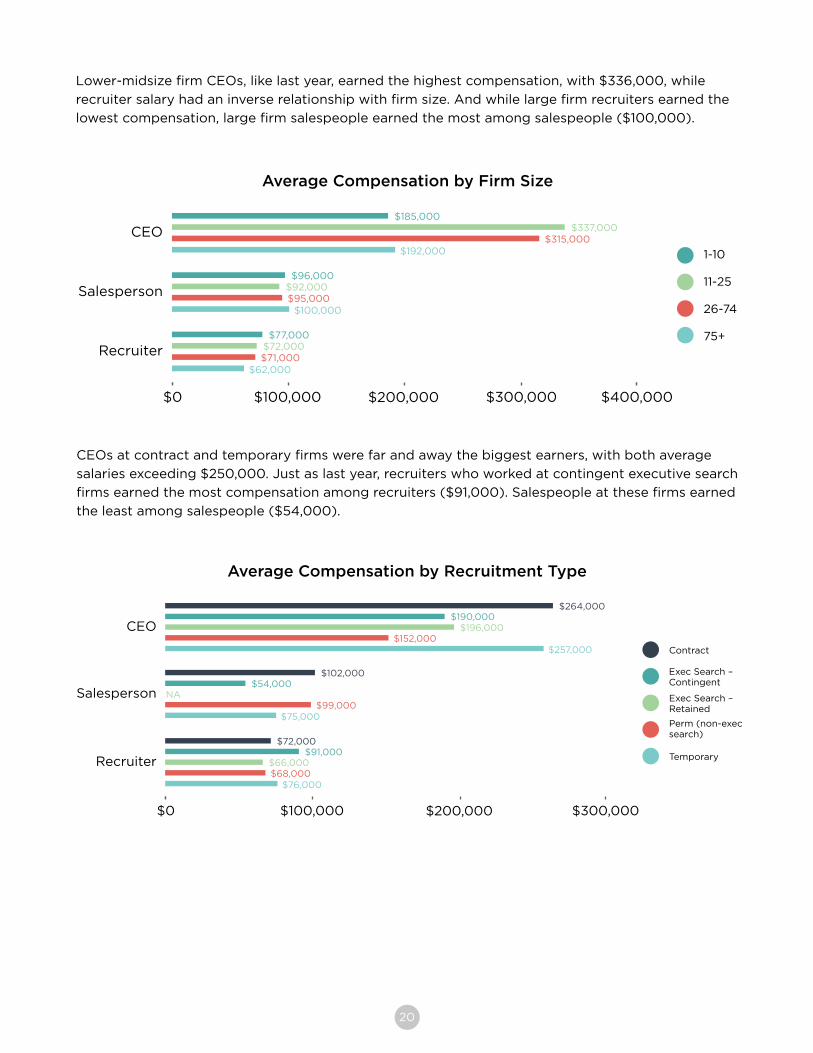
Compensation Performance:
2014 was the most lucrative of the past five years in terms of compensation performance – 65% of
respondents received an increase, and only 11% experienced a decrease. For the purposes of this
survey, compensation is defined as salary plus bonus.
Compensation
201054%
24%
22%
2011
60%
29%
11%
201263%
13%
25%
201361% 25%
14%
201465%
11%
25%
Compensation expectations for 2015, with 85% of respondents expecting an increase, are even
higher than they were for 2014, when 84% expected an increase, or 2013 (81%).
Real Compensation in 2014:
Compensation by role is fairly predictable: CEOs make by far the most money ($197,000), while
recruiters earn the least, at less than half the average CEO salary ($73,000).
Average Compensation by Role
$0 $50,000
CEO/Owner/Partner/Managing Director
Sales VP/Sales Head/Sales Director
Recruiting Manager/Head of Recruiting
Head of Operations/VP of Operations/Operations Manager
Salesperson/Sales Manager/Account Manager
Social Media or Marketing Manager
IT Manager/CTO/Head of IT/CIO
Recruiter/Sourcer
$100,000 $250,000
$73,000
$75,000
$83,000
$95,000
$108,000
$108,000
$143,000
$197,000
$150,000 $200,000
Increase SameDecrease
20
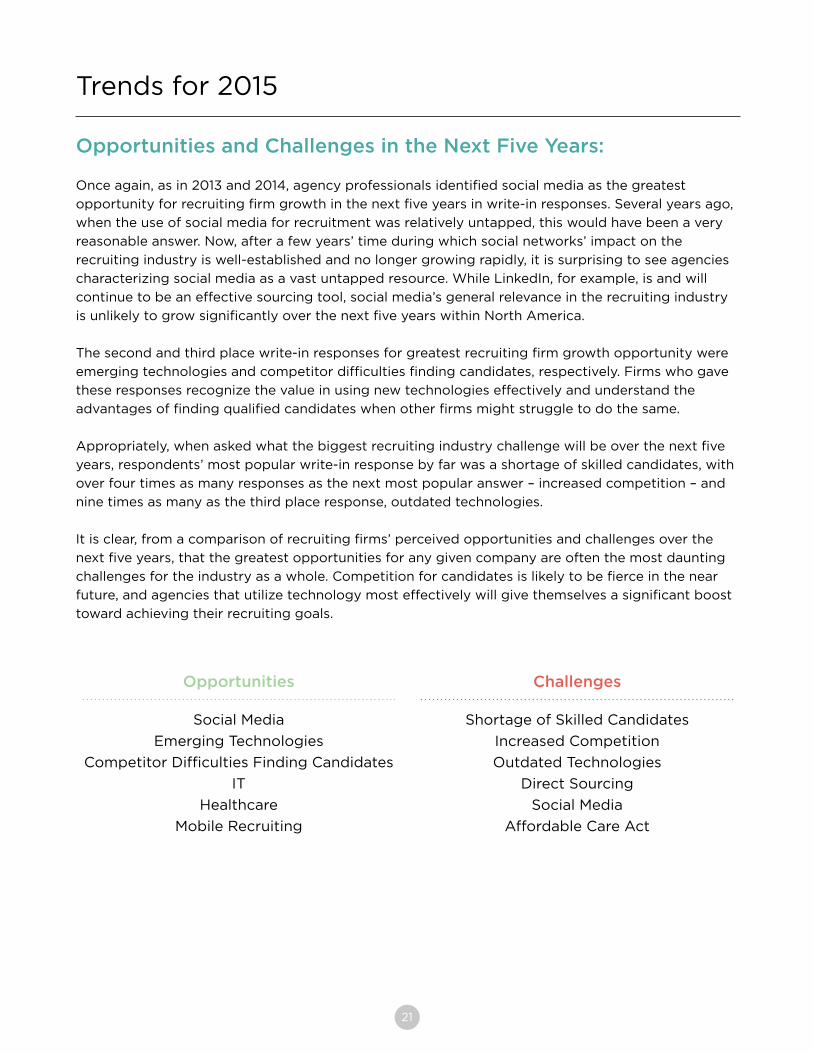
Lower-midsize firm CEOs, like last year, earned the highest compensation, with $336,000, while
recruiter salary had an inverse relationship with firm size. And while large firm recruiters earned the
lowest compensation, large firm salespeople earned the most among salespeople ($100,000).
Average Compensation by Firm Size
$0 $100,000 $200,000
$72,000$71,000
$62,000
$300,000 $400,000
CEO
$77,000
$92,000$95,000
$100,000
$96,000
$337,000$315,000
$192,000
$185,000
Salesperson
Recruiter
CEOs at contract and temporary firms were far and away the biggest earners, with both average
salaries exceeding $250,000. Just as last year, recruiters who worked at contingent executive search
firms earned the most compensation among recruiters ($91,000). Salespeople at these firms earned
the least among salespeople ($54,000).
Average Compensation by Recruitment Type
$0 $100,000 $200,000
$66,000
$76,000
$300,000
$68,000
$91,000Recruiter
$72,000
NA
$75,000$99,000
$54,000$102,000
$196,000
$257,000$152,000
$264,000$190,000
Salesperson
CEO
1-10
11-25
26-74
75+
Contract
Exec Search – Contingent
Exec Search – Retained
Perm (non-execsearch)
Temporary
21
Opportunities and Challenges in the Next Five Years:
Once again, as in 2013 and 2014, agency professionals identified social media as the greatest
opportunity for recruiting firm growth in the next five years in write-in responses. Several years ago,
when the use of social media for recruitment was relatively untapped, this would have been a very
reasonable answer. Now, after a few years’ time during which social networks’ impact on the
recruiting industry is well-established and no longer growing rapidly, it is surprising to see agencies
characterizing social media as a vast untapped resource. While LinkedIn, for example, is and will
continue to be an effective sourcing tool, social media’s general relevance in the recruiting industry
is unlikely to grow significantly over the next five years within North America.
The second and third place write-in responses for greatest recruiting firm growth opportunity were
emerging technologies and competitor difficulties finding candidates, respectively. Firms who gave
these responses recognize the value in using new technologies effectively and understand the
advantages of finding qualified candidates when other firms might struggle to do the same.
Appropriately, when asked what the biggest recruiting industry challenge will be over the next five
years, respondents’ most popular write-in response by far was a shortage of skilled candidates, with
over four times as many responses as the next most popular answer – increased competition – and
nine times as many as the third place response, outdated technologies.
It is clear, from a comparison of recruiting firms’ perceived opportunities and challenges over the
next five years, that the greatest opportunities for any given company are often the most daunting
challenges for the industry as a whole. Competition for candidates is likely to be fierce in the near
future, and agencies that utilize technology most effectively will give themselves a significant boost
toward achieving their recruiting goals.
Trends for 2015
Opportunities Challenges
Social Media
Emerging Technologies
Competitor Difficulties Finding Candidates
IT
Healthcare
Mobile Recruiting
Shortage of Skilled Candidates
Increased Competition
Outdated Technologies
Direct Sourcing
Social Media
Affordable Care Act
22
Percentage of Respondents with Shortage of Skilled Candidates – By Industry
0% 10% 30%
68%
Government
Energy/Chemical
Manufacturing
Finance/Insurance
Automotive
Technology
Business Services
Telecommunications
Healthcare
Pharma/Biotech/Medical Equipment
Retail
Industrial
Consumer Products
Marketing/PR/Media/Advertising
20% 40% 50% 60%
64%
69%
73%
73%
73%
74%
74%
76%
76%
77%
70% 80% 90%
79%
80%
83%
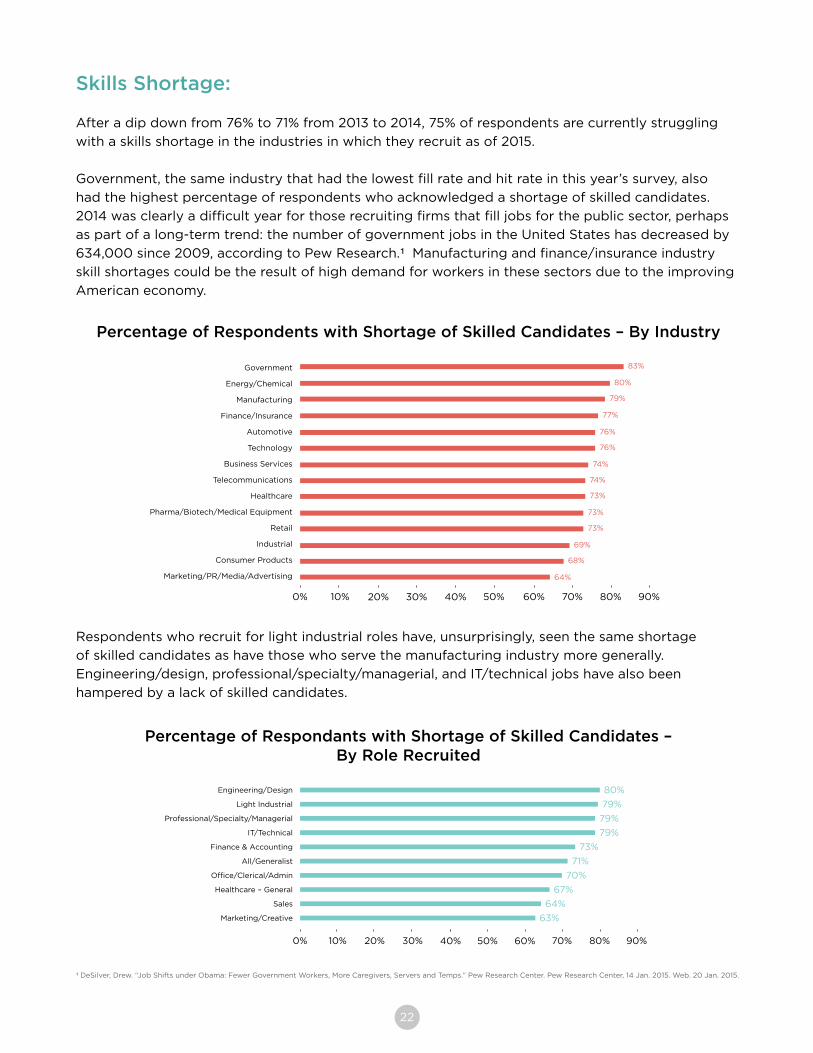
Respondents who recruit for light industrial roles have, unsurprisingly, seen the same shortage
of skilled candidates as have those who serve the manufacturing industry more generally.
Engineering/design, professional/specialty/managerial, and IT/technical jobs have also been
hampered by a lack of skilled candidates.
¹ DeSilver, Drew. “Job Shifts under Obama: Fewer Government Workers, More Caregivers, Servers and Temps.” Pew Research Center. Pew Research Center, 14 Jan. 2015. Web. 20 Jan. 2015.
Percentage of Respondants with Shortage of Skilled Candidates – By Role Recruited
0% 10%
64%
Engineering/Design
Light Industrial
Professional/Specialty/Managerial
IT/Technical
Finance & Accounting
All/Generalist
Office/Clerical/Admin
Healthcare – General
Sales
Marketing/Creative
40% 60% 70% 80%
63%
67%
70%
71%
73%
79%
79%
79%
80%
20% 50%30% 90%
Skills Shortage:
After a dip down from 76% to 71% from 2013 to 2014, 75% of respondents are currently struggling
with a skills shortage in the industries in which they recruit as of 2015.
Government, the same industry that had the lowest fill rate and hit rate in this year’s survey, also
had the highest percentage of respondents who acknowledged a shortage of skilled candidates.
2014 was clearly a difficult year for those recruiting firms that fill jobs for the public sector, perhaps
as part of a long-term trend: the number of government jobs in the United States has decreased by
634,000 since 2009, according to Pew Research.¹ Manufacturing and finance/insurance industry
skill shortages could be the result of high demand for workers in these sectors due to the improving
American economy.
23
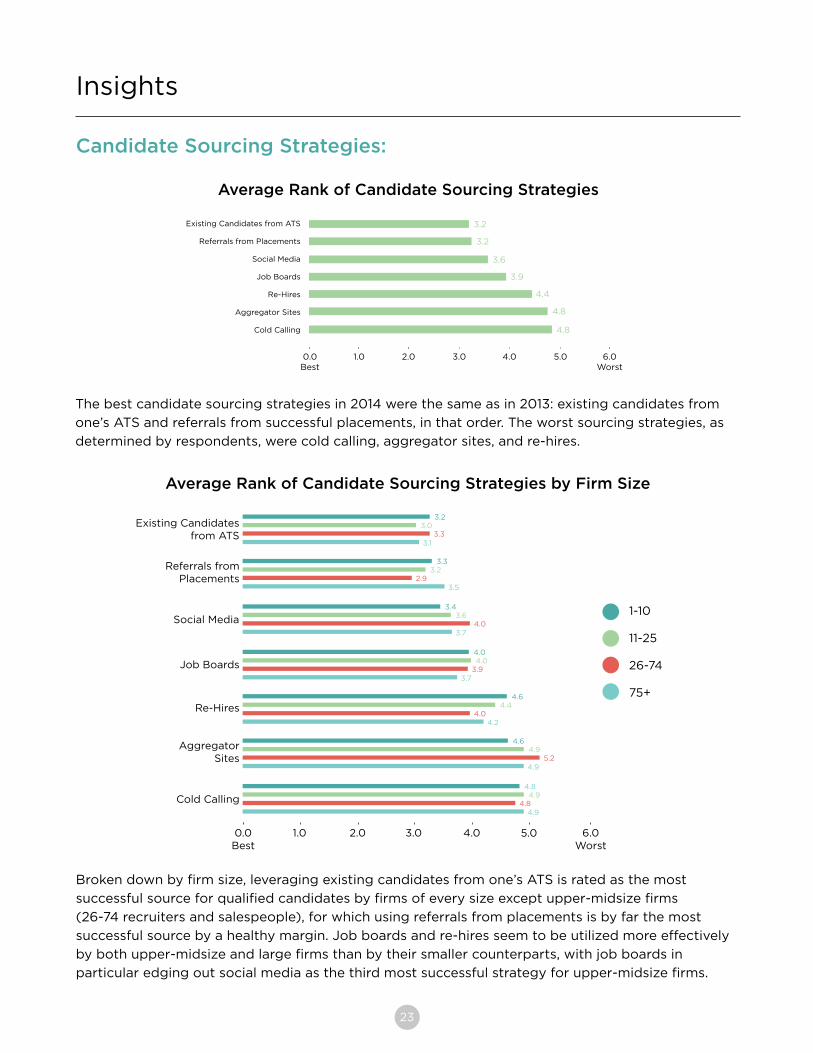
Candidate Sourcing Strategies:
Insights
Average Rank of Candidate Sourcing Strategies
0.0Best
Existing Candidates from ATS
Referrals from Placements
Social Media
Job Boards
Re-Hires
Aggregator Sites
Cold Calling
3.02.01.0 6.0Worst
4.8
4.8
4.4
3.9
3.6
3.2
3.2
4.0 5.0
The best candidate sourcing strategies in 2014 were the same as in 2013: existing candidates from
one’s ATS and referrals from successful placements, in that order. The worst sourcing strategies, as
determined by respondents, were cold calling, aggregator sites, and re-hires.
Average Rank of Candidate Sourcing Strategies by Firm Size
Broken down by firm size, leveraging existing candidates from one’s ATS is rated as the most
successful source for qualified candidates by firms of every size except upper-midsize firms
(26-74 recruiters and salespeople), for which using referrals from placements is by far the most
successful source by a healthy margin. Job boards and re-hires seem to be utilized more effectively
by both upper-midsize and large firms than by their smaller counterparts, with job boards in
particular edging out social media as the third most successful strategy for upper-midsize firms.
0.0Best
4.0 5.0
4.94.8
4.9
6.0Worst
4.8
Existing Candidatesfrom ATS
3.02.01.0
4.95.2
4.9
4.6
4.44.0
4.2
4.6
4.03.9
3.7
4.0
3.64.0
3.7
3.4
3.22.9
3.5
3.3
3.03.3
3.1
3.2
Referrals fromPlacements
Social Media
Job Boards
Re-Hires
AggregatorSites
Cold Calling
1-10
11-25
26-74
75+
24
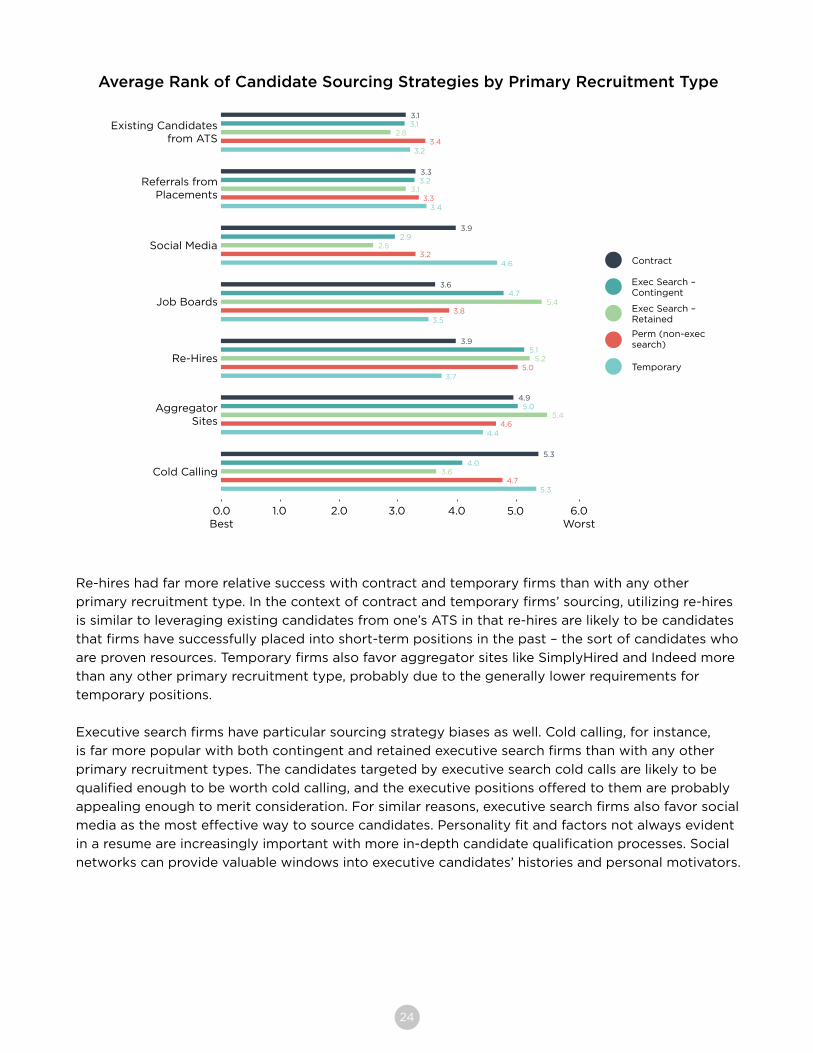
Re-hires had far more relative success with contract and temporary firms than with any other
primary recruitment type. In the context of contract and temporary firms’ sourcing, utilizing re-hires
is similar to leveraging existing candidates from one’s ATS in that re-hires are likely to be candidates
that firms have successfully placed into short-term positions in the past – the sort of candidates who
are proven resources. Temporary firms also favor aggregator sites like SimplyHired and Indeed more
than any other primary recruitment type, probably due to the generally lower requirements for
temporary positions.
Executive search firms have particular sourcing strategy biases as well. Cold calling, for instance,
is far more popular with both contingent and retained executive search firms than with any other
primary recruitment types. The candidates targeted by executive search cold calls are likely to be
qualified enough to be worth cold calling, and the executive positions offered to them are probably
appealing enough to merit consideration. For similar reasons, executive search firms also favor social
media as the most effective way to source candidates. Personality fit and factors not always evident
in a resume are increasingly important with more in-depth candidate qualification processes. Social
networks can provide valuable windows into executive candidates’ histories and personal motivators.
Average Rank of Candidate Sourcing Strategies by Primary Recruitment Type
0.0Best
4.0 5.0
3.64.7
5.3
6.0Worst
4.0
Existing Candidatesfrom ATS
3.02.01.0
Referrals fromPlacements
Social Media
Job Boards
Re-Hires
AggregatorSites
Cold Calling
5.3
5.44.6
4.4
5.04.9
5.25.0
3.7
5.13.9
5.43.8
3.5
4.73.6
2.53.2
4.6
2.93.9
3.13.3
3.4
3.23.3
2.83.4
3.2
3.13.1
Contract
Exec Search – Contingent
Exec Search – Retained
Perm (non-execsearch)
Temporary
25
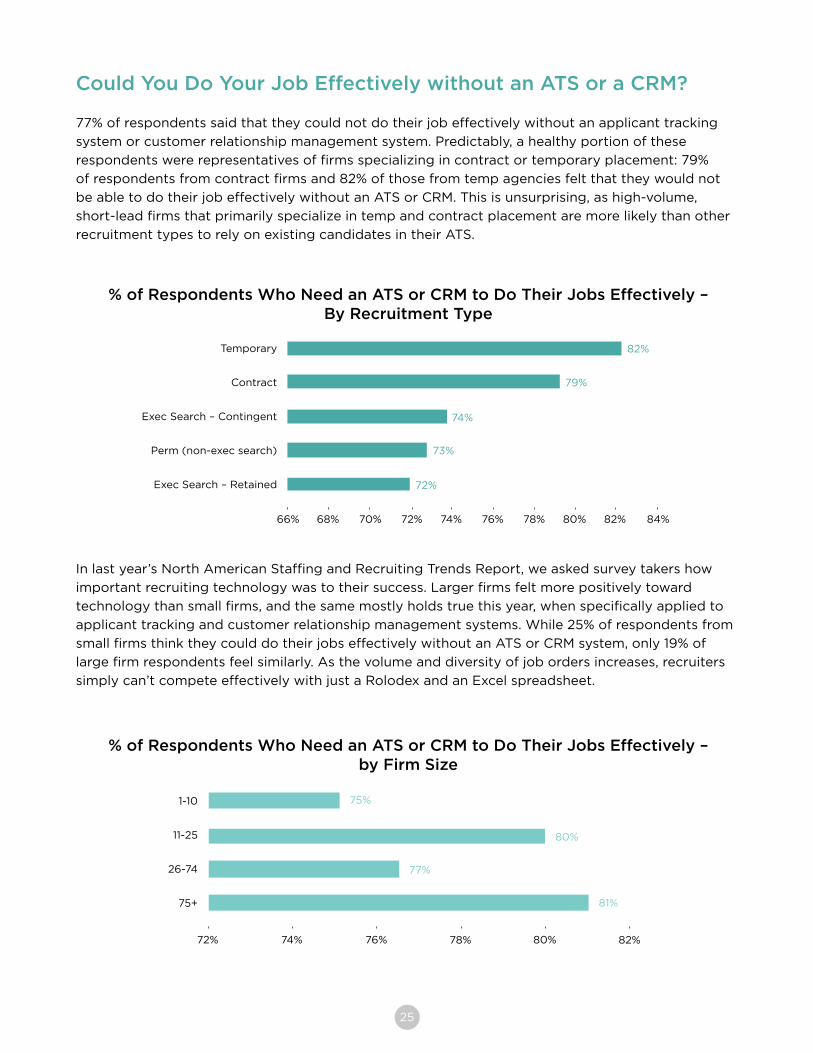
Could You Do Your Job Effectively without an ATS or a CRM?
77% of respondents said that they could not do their job effectively without an applicant tracking
system or customer relationship management system. Predictably, a healthy portion of these
respondents were representatives of firms specializing in contract or temporary placement: 79%
of respondents from contract firms and 82% of those from temp agencies felt that they would not
be able to do their job effectively without an ATS or CRM. This is unsurprising, as high-volume,
short-lead firms that primarily specialize in temp and contract placement are more likely than other
recruitment types to rely on existing candidates in their ATS.
% of Respondents Who Need an ATS or CRM to Do Their Jobs Effectively – By Recruitment Type
Temporary
Contract
Exec Search – Contingent
Perm (non-exec search)
Exec Search – Retained
66% 72%68% 70% 84%
72%
73%
74%
79%
82%
74% 82%76% 78% 80%
In last year’s North American Staffing and Recruiting Trends Report, we asked survey takers how
important recruiting technology was to their success. Larger firms felt more positively toward
technology than small firms, and the same mostly holds true this year, when specifically applied to
applicant tracking and customer relationship management systems. While 25% of respondents from
small firms think they could do their jobs effectively without an ATS or CRM system, only 19% of
large firm respondents feel similarly. As the volume and diversity of job orders increases, recruiters
simply can’t compete effectively with just a Rolodex and an Excel spreadsheet.
% of Respondents Who Need an ATS or CRM to Do Their Jobs Effectively – by Firm Size
1-10
11-25
26-74
75+
72% 74% 76% 78% 80% 82%
81%
77%
80%
75%
26
In terms of large-scale growth and planning, the recruiting industry saw more of the same in 2014.
Revenue growth and expectations, headcount plans, and branch expansion plans all stayed relatively
static over the course of the past year. While one could take those results at face value and conclude
that the industry is stuck after a steady climb and no longer moving upward, the truth is that
recruiting firms are actually continuing to experience prodigious growth. Still, though recruiting
agencies have recently experienced sustained success, their plans for the future have remained
in check.
After a 2013 with a higher revenue growth rate than each of the previous three years, the recruiting
industry as a whole held firm with a nearly identical rate over 2014. What’s more, expectations for
revenue rose as well, with 89% of respondents expecting an increase in 2015. Despite this attitude
of unbridled optimism, however, decision makers for recruiting firms have been considered and
deliberate in their investments, with hiring and branch expansion rates carrying over from those
for 2014 and staying relatively low. Meanwhile, metrics like total placements, fill rate, and hit
rate continue to improve, strengthening the recruiting industry’s value in stride with its
burgeoning growth.
All told, the recruiting industry’s outlook for the coming year is strong. 2014 was a year of high-
performance output and steady progress. Yet in the face of numbers and growth that might seem
difficult to top, recruiting agencies remain optimistic while simultaneously avoiding over-expansion.
The performance and behavior of recruiting agencies over the past year have put the industry as a
whole in excellent position to accelerate into the future.
Conclusion
27
About the Trends Report
In December of 2014, Bullhorn conducted its annual trends survey of 1,285 North American recruiting
agency professionals. Below is a breakdown of respondents by:
Firm Size (total number of sales people and recruiters)
• 1-10: 57% • 11-25: 21% • 26-74: 12% • 75+: 10%
Primary Type of Recruitment
• Permanent and/or RPO: 28% • Temporary: 12% • Contract: 38% • Executive Search: 19%
Geographic Locations
• United States: 94% • Canada: 6%
Demographics
Bullhorn creates cloud-based customer relationship management (CRM) software solutions that
help businesses grow faster and run more efficiently. As the global market leader in staffing and
recruiting software, our innovations power the operations of fast-growing start-ups up through the
world’s largest staffing brands. Headquartered in Boston, with offices in St. Louis, Richmond,
Vancouver, London, and Sydney, Bullhorn provides a full suite of recruitment software including an
applicant tracking system, customer relationship management (CRM) system, back office solution,
VMS integration, and social recruiting product. The company has more than 10,000 clients
representing nearly 350,000 users across 150 countries.
For more information: please visit www.bullhorn.com or call 617.478.9100.
About Bullhorn


![Mobile Recruiting Essentials for Staffing Firms [Webcast]](https://img.pdfslide.us/doc/110x75/55b3b695bb61ebf6028b4597/mobile-recruiting-essentials-for-staffing-firms-webcast.jpg)