Embed Size (px)
Citation preview
&
© 2015 CBRE, Inc. 2015 NORTH AMERICA PORTS & LOGISTICS ANNUAL REPORT | CBRE RESEARCH
1PAGE
2015 NORTH AMERICA
A N N U A L R E P O R T
C B R E R E S E A R C H

© 2015 CBRE, Inc. 2015 NORTH AMERICA PORTS & LOGISTICS ANNUAL REPORT | CBRE RESEARCH
International trade has a tremendous impact on a region’s economic growth. North America’s ports play an important role in the overall trade system, as billions of tons of cargo move through the ports annually via barges, ships, trains and trucks.
In response to the West Coast congestion, supply chain users are exploring diversification strategies that move some portion of inbound cargo to the East and Gulf Coasts. However, the volume of cargo that can be diverted is limited, as a majority of goods unloaded on the West Coast remain in the Western region.
The recent congestion at U.S. West Coast ports has placed a spotlight on labor and port efficiencies. Although multiple issues have contributed to congestion, the dispute between the Pacific Maritime Association (PMA) and the International Longshore and Warehouse Union (ILWU) over the union contract that governs the 29 U.S. West Coast ports was at the forefront.
In recent years, the North American ports have accommodated rising levels of international trade. Total container traffic through North American ports has grown by an annual average rate of 5.3% since 1990. More significantly, since 2010, overall container traffic has increased by 26.2%. This growth is placing a heavy burden on the entire port system—especially its workforce.
The Ports of Los Angeles and Long Beach topped the 2015 CBRE Ports and Logistics Index. With a port infrastructure well suited to handle the largest cargo container ships, proximity to the Asian export markets, a vibrant local economy, and a deep industrial real estate market, Southern California remains the preferred port market for importers and exporters alike.
The East Coast ports are gaining ground, having grown faster than their West Coast counterparts in 2014. Overall 20-foot equivalent unit (TEU) volume at the top ports grew 4.5%; East Coast volume grew 7.6% while West Coast grew 3.2%. Savannah and Charleston, ranked sixth and seventh in the Index, grew especially quickly—by 10.3% and 11.9%, respectively.

© 2015 CBRE, Inc. 2015 NORTH AMERICA PORTS & LOGISTICS ANNUAL REPORT | CBRE RESEARCH
3PAGE
INTRODUCTION
The recovery of the U.S. industrial and logistics real estate market has been driven in large part by the evolution of distribution and supply chain networks, at the beginning or end of which lay the coastal seaports. These ports— 29 on the West Coast and 16 along the East and Gulf Coasts—are the point of entry into the mas-sive U.S. economy for over $2 trillion of imports, and the exit point for a growing U.S. manufac-turing and export industry.
A well-functioning port infrastructure is inte-gral to the industrial and retail supply chain and to the U.S. economy on the whole, and a key component to a functioning port is the labor force—in particular, the longshoremen that transfer cargo off ships and onto trucks that move it along the supply chain. The recent contract dispute between the Pacific Maritime Association (PMA) and the International Long-shore and Warehouse Union (ILWU) at the West Coast ports illustrates how a reduction in labor and efficiency on the docks can have a profound impact on port throughput, retail inventories and U.S. GDP.
CBRE’s inaugural Ports and Logistics Annual Report, will examine the volume of trade that flows through North American ports and the issues—labor in particular—that can affect capacity utilization and the movement of cargo. The report also includes the first CBRE Ports and Logistics Index, which measures key port infrastructure and real estate metrics and ranks the top U.S. and Canadian port markets for in-dustrial real estate users and investors. Finally, the report includes an in-depth snapshot of each of the top 15 seaport markets, including an analysis of port infrastructure and capital invest-ment, as well as a discussion of commercial real estate trends in the markets most influenced by the ports.

© 2015 CBRE, Inc. 2015 NORTH AMERICA PORTS & LOGISTICS ANNUAL REPORT | CBRE RESEARCH
4PAGE
LABOR AND ITS IMPACT ON PORTS AND LOGISTICS
International trade has a tremendous impact on a region’s economic growth. North Ameri-ca’s ports play an important role in the overall trade system, as billions of tons of cargo move through the ports annually via barges, ships, trains and trucks. Seaports are the gateway to domestic and international trade—approximate-ly 95% of cargo by weight and 65% by value en-tering the U.S. travels by ship. Exports from the U.S. also must travel through the port system to reach their destinations.
According to the International Trade Administra-tion, foreign trade accounted for 13% of U.S. GDP in 1990. This figure had grown to 22% by 2006, and to 30% by 2013. According to the American Association of Port Authorities’ forecast, the influence of foreign trade is expected to surge to 60% by 2030. U.S. imports and exports reached a total value of nearly $5.0 trillion in 2013, of which imports accounted for $2.7 trillion. With the rapidly strengthening dollar (up 30% versus the Euro over the past 12 months) and declin-ing energy prices, U.S. imports are projected to see significant growth over the next year. As the importance of foreign trade continues to mature,
transportation through the ports will remain a crucial element in the health of the U.S. economy.
Container traffic through North American ports has grown by an annual average of 5.3% since 1990. Its greatest growth period was 2002-2006, during which it increased by 40.3%. Since 2010, it has grown 26.2%. In 2014, the top 10 ports
handled 63% of the cargo that passed through North America’s port system. As post-Panamax and larger container ships become the vessel of choice for shippers, the top ports that have the capacity to handle ships of this size will only grow in significance.
0
5
10
15
20
Panamax Post-Panamax
NewPanamax
UltraLarge
TEU (000's)
Maximum TEU Capacity
Figure 1: Maximum Ship TEU Capacity
Source: American Association of Port Authorities, 2014.
© 2015 CBRE, Inc. 2015 NORTH AMERICA PORTS & LOGISTICS ANNUAL REPORT | CBRE RESEARCH
5PAGE
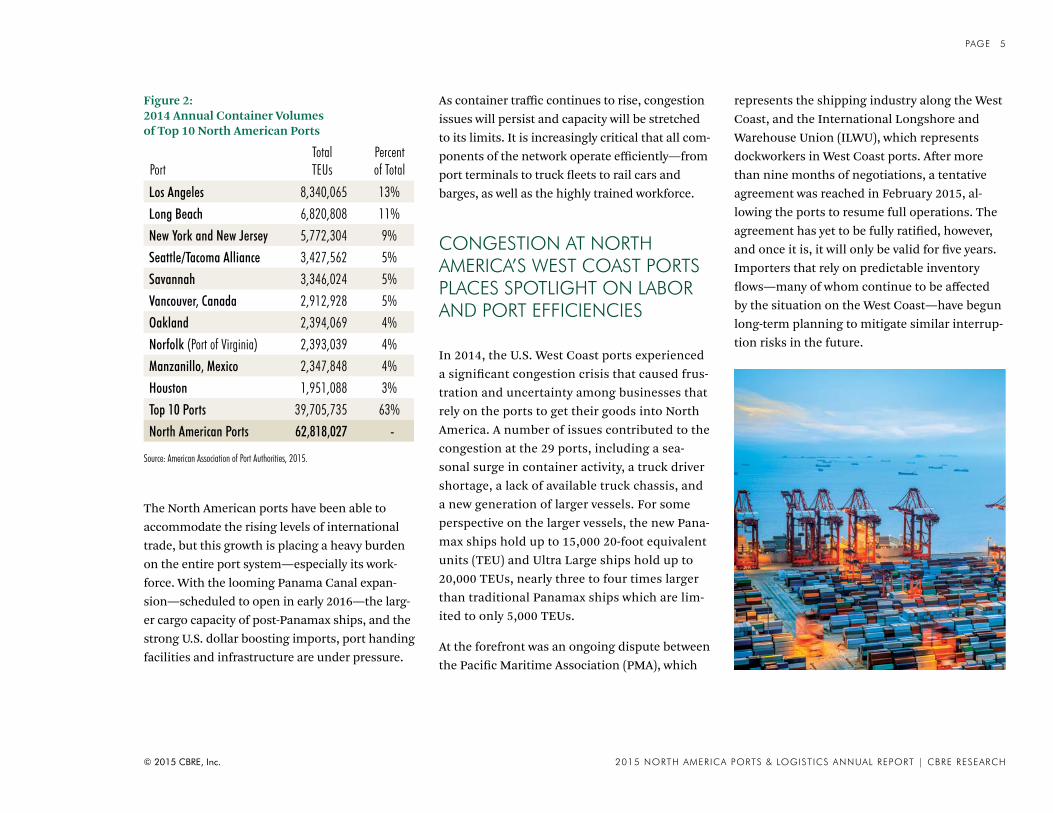
The North American ports have been able to accommodate the rising levels of international trade, but this growth is placing a heavy burden on the entire port system—especially its work-force. With the looming Panama Canal expan-sion—scheduled to open in early 2016—the larg-er cargo capacity of post-Panamax ships, and the strong U.S. dollar boosting imports, port handing facilities and infrastructure are under pressure.
As container traffic continues to rise, congestion issues will persist and capacity will be stretched to its limits. It is increasingly critical that all com-ponents of the network operate efficiently—from port terminals to truck fleets to rail cars and barges, as well as the highly trained workforce.
CONGESTION AT NORTH AMERICA’S WEST COAST PORTS PLACES SPOTLIGHT ON LABOR AND PORT EFFICIENCIES
In 2014, the U.S. West Coast ports experienced a significant congestion crisis that caused frus-tration and uncertainty among businesses that rely on the ports to get their goods into North America. A number of issues contributed to the congestion at the 29 ports, including a sea-sonal surge in container activity, a truck driver shortage, a lack of available truck chassis, and a new generation of larger vessels. For some perspective on the larger vessels, the new Pana-max ships hold up to 15,000 20-foot equivalent units (TEU) and Ultra Large ships hold up to 20,000 TEUs, nearly three to four times larger than traditional Panamax ships which are lim-ited to only 5,000 TEUs.
At the forefront was an ongoing dispute between the Pacific Maritime Association (PMA), which
represents the shipping industry along the West Coast, and the International Longshore and Warehouse Union (ILWU), which represents dockworkers in West Coast ports. After more than nine months of negotiations, a tentative agreement was reached in February 2015, al-lowing the ports to resume full operations. The agreement has yet to be fully ratified, however, and once it is, it will only be valid for five years. Importers that rely on predictable inventory flows—many of whom continue to be affected by the situation on the West Coast—have begun long-term planning to mitigate similar interrup-tion risks in the future.
Figure 2: 2014 Annual Container Volumes of Top 10 North American Ports
PortTotalTEUs
Percentof Total
Los Angeles 8,340,065 13%Long Beach 6,820,808 11%New York and New Jersey 5,772,304 9%Seattle/Tacoma Alliance 3,427,562 5%Savannah 3,346,024 5%Vancouver, Canada 2,912,928 5%Oakland 2,394,069 4%Norfolk (Port of Virginia) 2,393,039 4%Manzanillo, Mexico 2,347,848 4%Houston 1,951,088 3%Top 10 Ports 39,705,735 63%North American Ports 62,818,027 -
Source: American Association of Port Authorities, 2015.

© 2015 CBRE, Inc. 2015 NORTH AMERICA PORTS & LOGISTICS ANNUAL REPORT | CBRE RESEARCH
6PAGE
Many have considered more aggressive and di-versified supply chain and shipping strategies to minimize such risk. Some portion of their cargo will likely be diverted gradually in the coming years—probably low-cost, low-value freight, as opposed to high-value, time-sensitive freight. In response, three carrier alliances are launching services between Asia and the East Coast that will increase capacity on the route by 6%-10%. The new service will add 34 Panamax ships that will call on all the major East Coast ports. New York and New Jersey, Norfolk and Charleston are already well positioned to take advantage of this increased traffic and anticipated growth in 2016 and beyond, due to their ability to accommodate post-Panamax ships.
The backlog created by the congestion persists and will take months to unwind. Many East Coast ports have begun to see significantly more freight as a result, recording month-over-month growth of 11.5% in December 2014 and 7.6% in the first two months of 2015. Although these gains may be the result of a short-term reposi-tioning prompted by the West Coast bottleneck, East Coast port authorities expect to retain a portion of this additional volume as supply chain networks diversify.
The degree to which East Coast ports can ben-efit over the long term is limited, however, as the majority of the cargo that travels through the West Coast ports remains within the re-
gion—85% in Northern California and 60% in Southern California, as estimated by local port authorities. A wholesale shift of imports away from the West Coast is therefore not a viable long-term solution, as the costs to ship through the Panama Canal and then transport goods west far outweigh any losses that may occur during a future strike or lockout.
In an effort to learn from the West Coast labor dispute and to capitalize on the current sit-uation, the United States Maritime Alliance (USMA) and the International Longshoremen’s Association (ILA), the management and labor groups that govern the East and Gulf Coast ports, have entered into discussions to extend the union contract that is currently scheduled to expire in September 2018. By extending the current contact and ensuring long-term peace, the East and Gulf Coast ports, which have never had a work slowdown or stoppage, can provide shippers a stable, low-risk alternative for goods that are destined for the Midwest and Eastern U.S.
LABOR AND ITS IMPACT ON PORT OPERATIONS
A highly skilled workforce is a critical compo-nent of ports’ operational success. The port industry is directly and indirectly responsible
for a substantial number of jobs that have a significant effect on the national economy. Port labor includes a wide range of personnel, including, but not limited to, crane and equip-ment operators, longshoremen, harbor pilots, railroad workers and truck drivers. Labor is one of the primary keys to the success or failure of today’s competitive port and international trade environment. In recent years, recurring labor disputes, greater cargo volumes and a shortage of port workers and truck drivers have caused port efficiencies to decrease significantly, and have created an increasingly unstable environ-ment at many of North America’s ports.
According to the American Association of Port Authorities (AARA), more than 13.3 million jobs were related to the movement of cargo at North American deep-water seaports in 2007. Approxi-mately 90% were with importers, exporters and direct users of the seaports. The remaining 10% were direct, induced or indirect jobs from local firms providing support services to the seaport or those who purchase goods and services from port-related activity. The AARA has also esti-mated that for every $1 billion in manufactured goods exported through North American sea-ports, 15,000 jobs were created. Counted among the total direct jobs at ports are approximately 100,000 dockworkers and longshoremen, rep-resented by either the ILA on the East and Gulf Coasts or the ILWU on the West Coast.

© 2015 CBRE, Inc. 2015 NORTH AMERICA PORTS & LOGISTICS ANNUAL REPORT | CBRE RESEARCH
7PAGE
Boston
Savannah
Norfolk
Jacksonville
New Orleans
New York/New JerseyPhiladelphia
Miami
Charleston
Baltimore
Houston
Fort Lauderdale
Tampa
Mobile
Wilmington, NC
Wilmington, DE
BellinghamAnacortesPort Angeles
EverettSeattle/Tacoma
Olympia
Aberdeen/Grays Harbor
LongviewRanier
KalamaVancouver
AstoriaSt. Helens
Portland
North Bend
Eureka
West Sacramento
Stockton
Port ChicagoBenecia
Crockett
Richmond
OaklandRedwood City
San Francisco
Port HuenemeLos AngelesLong Beach
San Diego
WEST COAST PORTS
MANAGEMENTPacific Maritime Association
UNIONInternational Longshore and Warehouse Union
CONTRACT EXP. DATE2020 (exact date subject to ratification)
EAST COAST & GULF PORTS
MANAGEMENTUnited States Maritime Alliance
UNIONInternational Longshoreman’s Association
CONTRACT EXP. DATESeptember 2018
Figure 3: Organized Labor at the Port
INTERNATIONAL LONGSHOREMEN’S ASSOCIATION (ILA)
A union representing longshore workers along the East Coast of the U.S. and Canada, the Gulf Coast, the Great Lakes, Puerto Rico and inland waterways. The ILA represents approximately 65,000 members in more than 200 local affiliates.
INTERNATIONAL LONGSHORE AND WAREHOUSE UNION (ILWU)
A labor union representing longshore workers along the West Coast of the United States, including Hawaii and Alaska, and British Columbia, Canada. The ILWU represents approximately 42,000 members in more than 60 local affiliates.

© 2015 CBRE, Inc. 2015 NORTH AMERICA PORTS & LOGISTICS ANNUAL REPORT | CBRE RESEARCH
8PAGE
Longshoremen are responsible for loading and unloading ships, accounting for cargo and ensuring the security of people and property in and around the ports. In order to move the greater volumes of freight, they are being asked to work faster and more efficiently and to adapt to new technologies, greater scrutiny of environ-mental procedures and additional rules and reg-ulations. In many cases, these workers are also under increased pressure to meet their ports’ needs with fewer personnel. The evolution of port labor and the ability of each port’s labor to adapt to change have had a direct influence on each port’s competitive position.
In addition to the workforce at the ports, there are millions of truck drivers who move cargo to and from the ports. The vast majority of ports’ freight container volume moving in or out over land does so via trucks—they are the most basic unit of transportation and an important cog in the supply chain. Trucking companies are having a difficult time finding, hiring and retain-ing quality drivers, however. According to the American Trucking Association (ATA), nearly 9.2 billion tons of freight—70% of the U.S. total—moves over the road each year in more than 3 million heavy-duty trucks that require more
than 3 million drivers. The ATA also reports that the industry currently has 35,000 fewer drivers than it needs, and it expects the situation to worsen—to a deficit of 240,000 drivers by 2020. Due to the shallow pool of drivers, wages have been rising and are projected to grow 25% to 50% in 2015 to attract the number of drivers needed to correct the shortfall, according to the Stifel Transportation and Logistics Research Group. A wage increase of this magnitude would increase overall trucking costs by up to 18%. The lack of truckers translates directly into increased labor costs and indirectly into costs caused by de-lays at the ports. These cost increases have been estimated to add up to 20% in shipping expenses for both short drayage and long-haul transport.

© 2015 CBRE, Inc. 2015 NORTH AMERICA PORTS & LOGISTICS ANNUAL REPORT | CBRE RESEARCH
9PAGE
CONCLUSION
The success of North America’s ports is highly dependent on its infrastructure and labor force, and the smooth operation of ports is critical for the health of the economy. For the port and trade community, which includes manufactur-ers, exporters, importers, and land and ocean carriers, the efficient and effective movement of cargo through the ports is vital. The entire work-force at the ports, including longshoremen and their respective unions, must continue to work closely with port operators to ensure that the workforce is well-positioned to meet increasing demand. It is imperative that future workforce disruptions be minimized.
Many organizations are of the opinion that some type of labor reform is needed to create additional jobs, to establish a more effective structure for labor practices and to avoid a future economic disaster. At several of North America’s ports, management and labor prac-tices are severely outdated and inefficient, thus hindering the development and evolution of the ports’ infrastructure and operational environ-ment. Many such issues were closely tied to the recent West Coast labor dispute.
Lastly, unless trucking companies, logistics providers and shippers work together to resolve the ongoing driver shortage, transportation and logistics costs will increase substantially and supply chains will be at risk.
Although the location needs of supply chain users are somewhat fixed, given existing distri-bution centers and customer locations, these networks are always evolving and adjusting to meet increasingly complex inventory require-ments. Modern users are shifting to “just in time” inventory schemes, which are especially sensitive to bottlenecks slowing flow at any point along the chain. As such, when making supply chain location decisions, users must be aware of potential work issues (like the just-re-solved West Coast slowdown) and plan accord-ingly, exploring alternatives such as importing through various North American ports, bring-ing inventory in earlier, or even making use of airfreight. For industrial real estate associated with U.S. ports of entry, the net result will likely be greater demand from users and increased opportunities for Class A development—par-ticularly in the post-Panamax-ready East Coast markets like Charleston and Norfolk.

10PAGE
© 2015 CBRE, Inc. 2015 NORTH AMERICA PORTS & LOGISTICS ANNUAL REPORT | CBRE RESEARCH
In creating the CBRE Ports and Logistics Index, we aimed to
blend two major themes—port infrastructure capabilities and
real estate fundamentals. Under each theme, scores for various cri-
teria were weighted by importance and summed to provide a port’s
score for that theme. A market that ranked first in each of the criteria
would receive a total score of 1.0. While the Index is presented as an
ordinal ranking, each of the ports on this list presents its own unique
set of opportunities and challenges.
METHODOLOGY
2015 CBRE Ports andLogistics Index(Click on a port to see more detail)
PORTPORTS
INFRASTRUCTUREREAL ESTATE
MARKET OVERALLADUSTED RANKING
Los Angeles 3.9 1.5 3.0 1Long Beach 4.8 1.5 3.6 2New York and New Jersey 4.2 6.7 5.1 3Seattle/Tacoma Alliance 7.0 5.4 6.4 4Oakland 7.7 5.2 6.8 5Savannah 5.3 10.0 6.9 6Charleston 6.2 8.9 7.1 7Metro Vancouver 6.4 9.1 7.3 8Virginia (Norfolk) 5.8 11.1 7.6 9Houston 9.3 4.6 7.7 10Baltimore 8.0 7.6 7.8 11Everglades (Ft. Lauderdale) 8.8 8.5 8.7 12PortMiami 8.9 8.4 8.7 13Montréal 9.6 7.4 8.8 14Jacksonville 10.9 10.0 10.6 15

2015 NORTH AMERICA PORTS & LOGISTICS ANNUAL REPORT | CBRE RESEARCH
11PAGE
© 2015 CBRE, Inc.
Attributes related to the individual ports’ infrastruc-ture receive the greatest weighting. While the Index is not merely a list of the largest ports, it does make sense that the more prominent facilities with the most activity would receive some benefit due to their size. The Index is meant to identify opportunities for members of various parts of the real estate and logis-tics communities. Naturally, ports with greater cargo throughput, which stimulates greater local industrial real estate opportunity, should rise to the top. Total TEU volume received the most weight, while long-term growth in annual TEU volume and year-over-year growth in TEU volume each received slightly lower weight. These three measures together make up the majority of the port infrastructure ranking. It is no surprise that the largest ports—such as Los Angeles, Long Beach and New York/New Jersey—receive the largest benefit from these factors.
It should not be overlooked, however, that the Index values growth, both short-term and long-term, nearly as much as overall volume. Some ports with lower total throughput received a boost in the overall rank-ing from this perspective. Charleston and Baltimore ranked first and second, respectively, in both short- and long-term growth. The markets that followed Charleston and Baltimore in the ranking displayed more variety in terms of short- and long-term growth,
and might offer interesting prospects as growth accelerates in some markets or opportunities for lon-ger-term investments emerge in others.
Also considered in the Index were local population density and projected population growth. Because cargo that moves through a port tends to stay within the port’s region, areas in or near large population centers are likely to attract significant long-term port activity. As an example, 60% of all cargo that comes into the ports of Los Angeles and Long Beach remains in the Southern California region.
Looking at other critical port infrastructure, we con-sidered five additional components that are necessary to operate a modern logistics hub. The following cat-egories received lower weightings, and together bring the total to 100%: number of Class I rail lines serving the port, number of container terminals, mean low water channel depth, total number of cranes, and total number of post-Panamax cranes. These are key attributes for high-volume port activity and, in the case of channel depth and post-Panamax cranes, signal the readiness of the port to accommodate the larger cargo ships that are increasingly common and will be passing through the expanded Panama Canal in 2016 and beyond.
PORT RANKING INFRASTRUCTUREINDEX
Source: CBRE Research.
Port Infrastructure Score and Ranking
PORT
PORT INFRASTRUCTURE
SCORE
PORT INFRASTRUCTURE
RANKING
Los Angeles 3.9 1New York and New Jersey 4.2 2Long Beach 4.8 3Savannah 5.3 4Virginia (Norfolk) 5.8 5Charleston 6.2 6Metro Vancouver 6.4 7Seattle/Tacoma Alliance 7.0 8Oakland 7.7 9Baltimore 8.0 10Everglades (Ft. Lauderdale) 8.8 11PortMiami 8.9 12Houston 9.3 13Montréal 9.6 14Jacksonville 10.9 15
2015 NORTH AMERICA PORTS & LOGISTICS ANNUAL REPORT | CBRE RESEARCH
12PAGE
© 2015 CBRE, Inc.
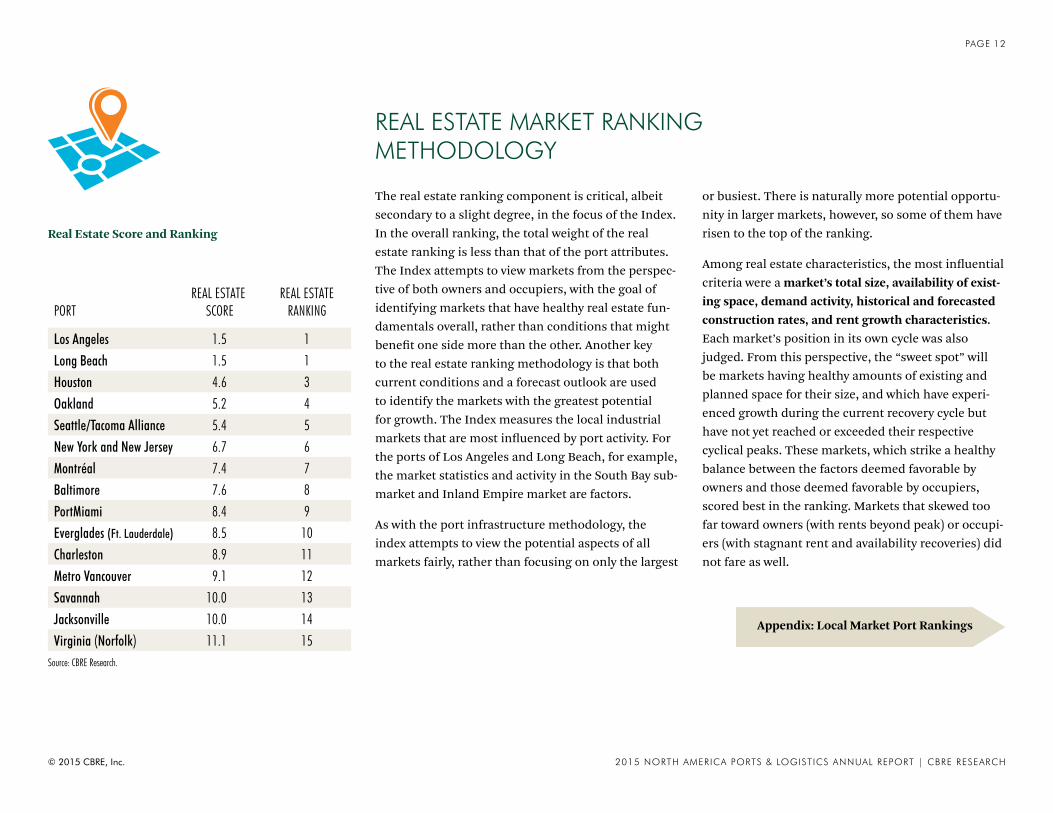
The real estate ranking component is critical, albeit secondary to a slight degree, in the focus of the Index. In the overall ranking, the total weight of the real estate ranking is less than that of the port attributes. The Index attempts to view markets from the perspec-tive of both owners and occupiers, with the goal of identifying markets that have healthy real estate fun-damentals overall, rather than conditions that might benefit one side more than the other. Another key to the real estate ranking methodology is that both current conditions and a forecast outlook are used to identify the markets with the greatest potential for growth. The Index measures the local industrial markets that are most influenced by port activity. For the ports of Los Angeles and Long Beach, for example, the market statistics and activity in the South Bay sub-market and Inland Empire market are factors.
As with the port infrastructure methodology, the index attempts to view the potential aspects of all markets fairly, rather than focusing on only the largest
or busiest. There is naturally more potential opportu-nity in larger markets, however, so some of them have risen to the top of the ranking.
Among real estate characteristics, the most influential criteria were a market’s total size, availability of exist-ing space, demand activity, historical and forecasted construction rates, and rent growth characteristics. Each market’s position in its own cycle was also judged. From this perspective, the “sweet spot” will be markets having healthy amounts of existing and planned space for their size, and which have experi-enced growth during the current recovery cycle but have not yet reached or exceeded their respective cyclical peaks. These markets, which strike a healthy balance between the factors deemed favorable by owners and those deemed favorable by occupiers, scored best in the ranking. Markets that skewed too far toward owners (with rents beyond peak) or occupi-ers (with stagnant rent and availability recoveries) did not fare as well.
REAL ESTATE MARKET RANKING METHODOLOGY
Source: CBRE Research.
PORTREAL ESTATE
SCOREREAL ESTATE
RANKING
Los Angeles 1.5 1Long Beach 1.5 1Houston 4.6 3Oakland 5.2 4Seattle/Tacoma Alliance 5.4 5New York and New Jersey 6.7 6Montréal 7.4 7Baltimore 7.6 8PortMiami 8.4 9Everglades (Ft. Lauderdale) 8.5 10Charleston 8.9 11Metro Vancouver 9.1 12Savannah 10.0 13Jacksonville 10.0 14Virginia (Norfolk) 11.1 15
Real Estate Score and Ranking
Appendix: Local Market Port Rankings

Pacific Ocean
San Pedro Bay
Long BeachMiddle Harbor
Long Beach Harbor
San Pedro Channel
LONG BEACHLOS ANGELES
H
TraPacTerminal
West BasinContainer Terminal
TurningBasin
YusenTerminal
Everport TerminalServices
Eagle MarineTerminals
APM TerminalsPacific
California UnitedTerminals
© 2015 CBRE, Inc. 2015 NORTH AMERICA PORTS & LOGISTICS ANNUAL REPORT | CBRE RESEARCH
13 APPENDIX | PAGE
PORT OF LOS ANGELES
PORT OVERVIEW
◼ The Port of Los Angeles is the largest port in the United States, in terms of TEU volume throughput. In 2014, the port handled more than 8.3 million TEUs, exceeding the volume in next busiest port—the neighboring Port of Long Beach—by more than 20%. More than 40% of the nation’s container volume flows through the L.A. and Long Beach ports.
◼ The Port of Los Angeles handles more than 150 million tons of cargo each year—more than any other port in North America. The top import items are furniture, food and perishables, consumer goods, and raw materials. The top export items are paper goods, food, and chemicals.
◼ Proximity to Asian markets, a very large local economy, and infrastructure making the port the best equipped to handle post- Panamax container ships have made the Port of L.A. the primary destination for U.S. imports from the Far East. However, the rapidly growing demand has placed a strain on port trucking services, which are struggling to find enough truck chassis to haul the cargo off the docks. This has led to increased truck wait times and higher drayage costs.
PORT FACTS
2014 Total TEU Volume (000’S) 8,340
Year-over-Year Change in TEU Volume 6.0%
Total Cranes/Post-Panamax Cranes 86/69
Channel Depth 53 ft.
Container Terminals 9
Leading Trading Partners China, Japan, South Korea, Taiwan, Thailand
Rail Operators Union Pacific, BNSF Source: Port of Los Angeles, April 2015.
Overall Infrastructure Real Estate
111
© 2015 CBRE, Inc. 2015 NORTH AMERICA PORTS & LOGISTICS ANNUAL REPORT | CBRE RESEARCH
14 APPENDIX | PAGE
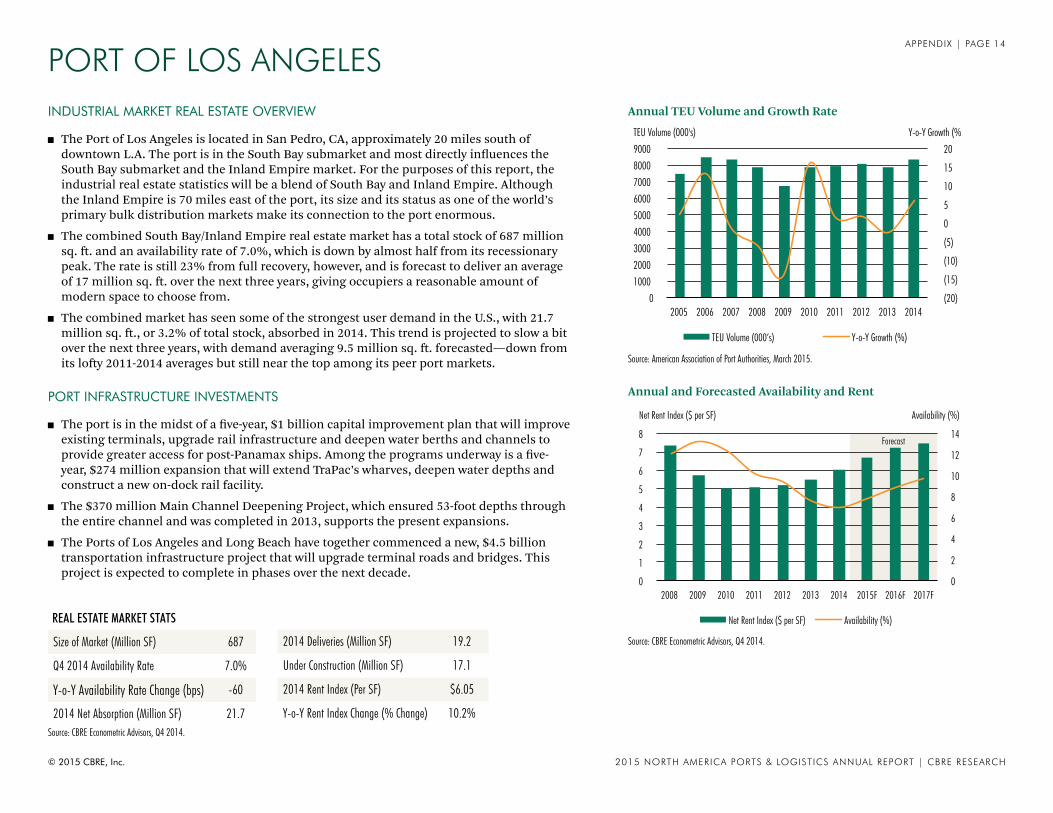
INDUSTRIAL MARKET REAL ESTATE OVERVIEW
◼ The Port of Los Angeles is located in San Pedro, CA, approximately 20 miles south of downtown L.A. The port is in the South Bay submarket and most directly influences the South Bay submarket and the Inland Empire market. For the purposes of this report, the industrial real estate statistics will be a blend of South Bay and Inland Empire. Although the Inland Empire is 70 miles east of the port, its size and its status as one of the world’s primary bulk distribution markets make its connection to the port enormous.
◼ The combined South Bay/Inland Empire real estate market has a total stock of 687 million sq. ft. and an availability rate of 7.0%, which is down by almost half from its recessionary peak. The rate is still 23% from full recovery, however, and is forecast to deliver an average of 17 million sq. ft. over the next three years, giving occupiers a reasonable amount of modern space to choose from.
◼ The combined market has seen some of the strongest user demand in the U.S., with 21.7 million sq. ft., or 3.2% of total stock, absorbed in 2014. This trend is projected to slow a bit over the next three years, with demand averaging 9.5 million sq. ft. forecasted—down from its lofty 2011-2014 averages but still near the top among its peer port markets.
PORT INFRASTRUCTURE INVESTMENTS
◼ The port is in the midst of a five-year, $1 billion capital improvement plan that will improve existing terminals, upgrade rail infrastructure and deepen water berths and channels to provide greater access for post-Panamax ships. Among the programs underway is a five-year, $274 million expansion that will extend TraPac’s wharves, deepen water depths and construct a new on-dock rail facility.
◼ The $370 million Main Channel Deepening Project, which ensured 53-foot depths through the entire channel and was completed in 2013, supports the present expansions.
◼ The Ports of Los Angeles and Long Beach have together commenced a new, $4.5 billion transportation infrastructure project that will upgrade terminal roads and bridges. This project is expected to complete in phases over the next decade.
PORT OF LOS ANGELES
REAL ESTATE MARKET STATS
Size of Market (Million SF) 687
Q4 2014 Availability Rate 7.0%
Y-o-Y Availability Rate Change (bps) -60
2014 Net Absorption (Million SF) 21.7
2014 Deliveries (Million SF) 19.2
Under Construction (Million SF) 17.1
2014 Rent Index (Per SF) $6.05
Y-o-Y Rent Index Change (% Change) 10.2%
PORT OF LOS ANGELES
(20)
(15)
(10)
(5)
0
5
10
15
20
0 1000 2000 3000 4000 5000 6000 7000 8000 9000
2005 2006 2007 2008 2009 2010 2011 2012 2013 2014
Y-o-Y Growth (%) TEU Volume (000's)
TEU Volume (000’s) Y-o-Y Growth (%)
0
2
4
6
8
10
12
14
0
1
2
3
4
5
6
7
8
2008 2009 2010 2011 2012 2013 2014 2015F 2016F 2017F
Availability (%)
Forecast
Net Rent Index ($ per SF)
Net Rent Index ($ per SF) Availability (%)
Source: CBRE Econometric Advisors, Q4 2014.
Annual and Forecasted Availability and Rent
Source: American Association of Port Authorities, March 2015.
Annual TEU Volume and Growth Rate
Source: CBRE Econometric Advisors, Q4 2014.
Pacific Ocean
San Pedro Bay
Long BeachMiddle Harbor
Long Beach Harbor
San Pedro Channel
LONG BEACHLOS ANGELES
H
Pier B -Toyota
Pier C -SSA Matson
Pier E -Hyundai
Pier G -ITS
Pier J -COSCO
Pier F -LBCT OOCL
Pier F -SSA Breakbulk
Pier A -SSA Turning
Basin
Pier T -Hanjin
WestBasin
© 2015 CBRE, Inc. 2015 NORTH AMERICA PORTS & LOGISTICS ANNUAL REPORT | CBRE RESEARCH
15 APPENDIX | PAGE
PORT OF LONG BEACH
PORT OVERVIEW
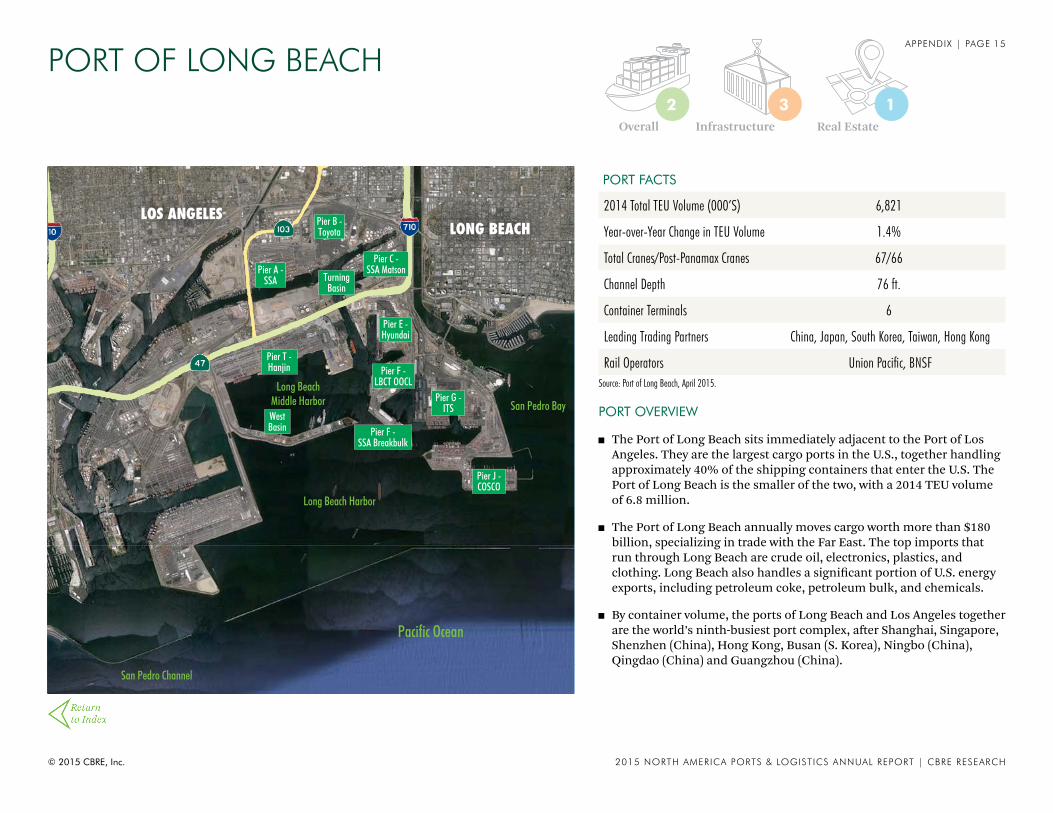
◼ The Port of Long Beach sits immediately adjacent to the Port of Los Angeles. They are the largest cargo ports in the U.S., together handling approximately 40% of the shipping containers that enter the U.S. The Port of Long Beach is the smaller of the two, with a 2014 TEU volume of 6.8 million.
◼ The Port of Long Beach annually moves cargo worth more than $180 billion, specializing in trade with the Far East. The top imports that run through Long Beach are crude oil, electronics, plastics, and clothing. Long Beach also handles a significant portion of U.S. energy exports, including petroleum coke, petroleum bulk, and chemicals.
◼ By container volume, the ports of Long Beach and Los Angeles together are the world’s ninth-busiest port complex, after Shanghai, Singapore, Shenzhen (China), Hong Kong, Busan (S. Korea), Ningbo (China), Qingdao (China) and Guangzhou (China).
PORT FACTS
2014 Total TEU Volume (000’S) 6,821
Year-over-Year Change in TEU Volume 1.4%
Total Cranes/Post-Panamax Cranes 67/66
Channel Depth 76 ft.
Container Terminals 6
Leading Trading Partners China, Japan, South Korea, Taiwan, Hong Kong
Rail Operators Union Pacific, BNSF Source: Port of Long Beach, April 2015.
Overall Infrastructure Real Estate
132

© 2015 CBRE, Inc. 2015 NORTH AMERICA PORTS & LOGISTICS ANNUAL REPORT | CBRE RESEARCH
16 APPENDIX | PAGE
INDUSTRIAL MARKET REAL ESTATE OVERVIEW
◼ The Port of Long Beach is located in Long Beach, CA, approximately 20 miles south of downtown L.A. The port is in the South Bay submarket and most directly influences the South Bay submarket and the Inland Empire market. For the purposes of this report, the industrial real estate statistics will be a blend of South Bay and Inland Empire. Although the Inland Empire is 70 miles east of the port, its size and its status as one of the world’s primary bulk distribution markets make its connection to the port enormous.
◼ The combined South Bay/Inland Empire real estate market ended 2014 with an average net rent of $6.05. This figure is almost exactly the midpoint between the pre-recession peak and the recessionary low. While this market has been among the most active in the U.S., rent growth is consistent and measured. Growth is forecast to continue at a steady average rate of 4% over the next five years.
◼ The impact of the growth of imports moving through the port can be seen in the demand for functional Class A space, especially in the Inland Empire. The combined market delivered 19.2 million sq. ft. in 2014—nearly all of it in the Inland Empire. This robust volume has roughly offset the user demand in the market, and has provided some degree of equilibrium to the market.
PORT INFRASTRUCTURE INVESTMENTS
◼ The Port of Long Beach has approved a fiscal year 2014-2015 budget that calls for $579 million in capital expenditure, including replacement of the Gerald Desmond Bridge and redevelopment of the Middle Harbor container terminal.
◼ The Middle Harbor upgrade project, which commenced in 2011, is a nine-year, $1.31 billion plan that will upgrade the wharf, water access, storage areas, and rail access. In early 2015, the project is expected to deliver new gantry and stacking cranes, which will complete the North Operations Building and the entire northern half of the project.
◼ The Ports of Los Angeles and Long Beach have together commenced a new, $4.5 billion transportation infrastructure project that will upgrade terminal roads and bridges. This project is expected to complete in phases over the next decade.
PORT OF LONG BEACH
REAL ESTATE MARKET STATS
Size of Market (Million SF) 687
Q4 2014 Availability Rate 7.0%
Y-o-Y Availability Rate Change (bps) -60
2014 Net Absorption (Million SF) 21.7
2014 Deliveries (Million SF) 19.2
Under Construction (Million SF) 17.1
2014 Rent Index (Per SF) $6.05
Y-o-Y Rent Index Change (% Change) 10.2%
Port of Long Beach
(30)
(20)
(10)
0
10
20
30
0
1000
2000
3000
4000
5000
6000
7000
8000
2005 2006 2007 2008 2009 2010 2011 2012 2013 2014
Y-o-Y Growth (%) TEU Volume (000's)
TEU Volume (000’s) Y-o-Y Growth
0
2
4
6
8
10
12
14
0
1
2
3
4
5
6
7
8
2008 2009 2010 2011 2012 2013 2014 2015F 2016F 2017F
Availability (%)
Forecast
Net Rent Index ($ per SF)
Net Rent Index ($ per SF) Availability (%)
Source: CBRE Econometric Advisors, Q4 2014.
Annual and Forecasted Availability and Rent
Source: American Association of Port Authorities, March 2015.
Annual TEU Volume and Growth Rate
Source: CBRE Econometric Advisors, Q4 2014.

© 2015 CBRE, Inc. 2015 NORTH AMERICA PORTS & LOGISTICS ANNUAL REPORT | CBRE RESEARCH
17 APPENDIX | PAGE
NewarkBay
Hud
s on
Riv e
r
East
Rive
r
LowerNew York Bay
UpperNew York BayELIZABETH
BROOKLYN
STATEN ISLAND
SECAUCUS
KEARNY
NEWARK
HOBOKEN
MANHATTAN
JERSEY CITY
NewarkInternational Airport Port Newark
Terminal
MaherTerminal
APMTerminal
BayonneBridge
Global MarineTerminal
Red HookTerminal
New YorkContainer Terminal
PORT OF NEW YORK AND NEW JERSEY
PORT OVERVIEW
◼ The Port Authority of New York and New Jersey is a joint venture between the two states. It is charged with overseeing not only port activity, but JFK and LaGuardia International Airports, as well as many of the area’s bridges and tunnels.
◼ The Port of New York and New Jersey is the largest port on the east coast and the third largest in the United States. In 2014, the port handled a record volume of more than 5.7 million TEUs, which represented a 5.6% increase over 2013. One of the primary draws of the port is its proximity to one of the nation’s most concentrated consumer markets.
◼ The port has a diverse set of trading partners and, due to its location in the northeast United States, draws shipments from all parts of the world. Trade with China represents approximately 30% of the port’s total volume, while Brazil and Vietnam are its fastest growing trade partners. Perishable items, energy, and raw materials are the largest import and export items flowing through the port.
PORT FACTS
2014 Total TEU Volume (000’S) 5,772
Year-over-Year Change in TEU Volume 5.6%
Total Cranes/Post-Panamax Cranes 61/47
Channel Depth 50 ft.
Container Terminals 6
Leading Trading Partners China, Brazil, India, Germany, ltaly, UK
Rail Operators CSX, Norfolk Southern, Canadian Pacific Source: Port of New York and New Jersey, April 2015.
Overall Infrastructure Real Estate
623

© 2015 CBRE, Inc. 2015 NORTH AMERICA PORTS & LOGISTICS ANNUAL REPORT | CBRE RESEARCH
18 APPENDIX | PAGE
INDUSTRIAL MARKET REAL ESTATE OVERVIEW
◼ The Port of New York/New Jersey is a collection of terminals in New York City and Northern New Jersey. For the purposes of this report, the industrial real estate statistics will be a blend of the Northern New Jersey (Newark and Edison) and New York City markets.
◼ For the markets connected to the port, 2014 marked an especially strong year, with 6.7 million sq. ft. of space absorbed and 5.3 million sq. ft. delivered. Because supply and demand were closely matched, the availability rate fell just 30 basis points, to 11.8%.
◼ The forecast for the next three years anticipates supply and demand remaining in balance, with net absorption and deliveries averaging approximately 3 million sq. ft. annually. Rents are projected to grow at a healthy annual rate of 3%.
PORT INFRASTRUCTURE INVESTMENTS
◼ The Port Authority of New York and New Jersey is midstream in the implementation of a $4.3 billion capital plan to invest and upgrade existing port infrastructure. Most notably, 64 feet of air draft is being added to the Bayonne Bridge to improve the accessibility of the primary terminal, Port Newark-Elizabeth, for Post-Panamax ships. Currently only the Port Jersey terminal is able to easily accommodate the larger ships. Alterations to the Bayonne Bridge are expected to be finished prior to the expansion of the Panama Canal. Road and rail infrastructure is being upgraded as well.
PORT OF NEW YORK AND NEW JERSEY
REAL ESTATE MARKET STATS
Size of Market (Million SF) 740
Q4 2014 Availability Rate 11.8%
Y-o-Y Availability Rate Change (bps) -30
2014 Net Absorption (Million SF) 6.7
2014 Deliveries (Million SF) 5.3
Under Construction (Million SF) 3.6
2014 Rent Index (Per SF) $6.07
Y-o-Y Rent Index Change (% Change) 7.3%
Forecast
Port of NY NJ
(20)
(15)
(10)
(5)
0
5
10
15
20
0
1000
2000
3000
4000
5000
6000
7000
2005 2006 2007 2008 2009 2010 2011 2012 2013 2014
Y-o-Y Growth (%) TEU Volume (000's)
TEU Volume (000’s) Y-o-Y Growth (%)
0
2
4
6
8
10
12
14
16
0
1
2
3
4
5
6
7
2008 2009 2010 2011 2012 2013 2014 2015F 2016F 2017F
Availability (%) Net Rent Index ($ per SF)
Net Rent Index ($ per SF) Availability (%)
Source: CBRE Econometric Advisors, Q4 2014.
Annual and Forecasted Availability and Rent
Source: American Association of Port Authorities, March 2015.
Annual TEU Volume and Growth Rate
Source: CBRE Econometric Advisors, Q4 2014.

© 2015 CBRE, Inc. 2015 NORTH AMERICA PORTS & LOGISTICS ANNUAL REPORT | CBRE RESEARCH
19 APPENDIX | PAGE
SEATTLE/TACOMA ALLIANCE
PORT OVERVIEW
◼ In late 2014, the Ports of Seattle and Tacoma agreed to join in a Seaport Alliance. The Alliance received initial federal approval in early 2015—the first step towards ratifying the agreement. This Seaport Alliance, which will combine operations, planning and marketing for the two ports, is expected to become official in the first half of 2015.
◼ Combined, the two ports handle the fourth largest TEU volume in North America (behind Los Angeles, Long Beach and New York/New Jersey) but they have seen their share of the overall volume slip consistently over recent years. With the combined volume for Seattle and Tacoma having fallen slightly in 2014, to 3.4 million TEUs, the Alliance may fall behind Savannah in overall volume. In fact, Savannah’s December volume was greater, but that was likely due to the short-term disruption caused by the PMA/ILWU dispute.
◼ The Seattle and Tacoma ports enjoy a measurable proximity advantage to the Asian markets, which has helped bolster trade with China, Japan, and Korea. Due also to their far north location, the Ports are virtually the exclusive port of call, due to their trade with Alaska and the North Pacific Fishing Fleet.
PORT FACTS
2014 Total TEU Volume (000’S) 3,428
Year-over-Year Change in TEU Volume -0.8%
Total Cranes/Post-Panamax Cranes 58/51
Channel Depth 50 ft.
Container Terminals 10
Leading Trading Partners China, Japan, South Korea, Vietnam, Taiwan
Rail Operators Union Pacific, BNSF
Puyallup River
The aFo ss W
a terwa y
Commencement BayHylebos Waterway
Blair Waterway
TACOMA
FIFE
H
MilesMilesMilesMilesMilesMilesMilesMilesMilesMilesMilesMilesMilesMilesMilesMilesMilesMilesMilesMilesMilesMilesMilesMilesMilesMilesMilesMilesMilesMilesMilesMilesMilesMilesMilesMilesMilesMilesMilesMilesMilesMilesMilesMilesMilesMilesMilesMilesMiles
KMKMKMKMKMKMKMKMKMKMKMKMKMKMKMKMKMKMKMKMKMKMKMKMKMKMKMKMKMKMKMKMKMKMKMKMKMKMKMKMKMKMKMKMKMKMKMKMKM 1/21/21/21/21/21/21/21/21/21/21/21/21/21/21/21/21/21/21/21/21/21/21/21/21/21/21/21/21/21/21/21/21/21/21/21/21/21/21/21/21/21/21/21/21/21/21/21/21/2
1/21/21/21/21/21/21/21/21/21/21/21/21/21/21/21/21/21/21/21/21/21/21/21/21/21/21/21/21/21/21/21/21/21/21/21/21/21/21/21/21/21/21/21/21/21/21/21/21/2
311147
Totem OceanTrailer Express
HuskyExpress
OlympicTerminal
BNSFIntermodal Yard
HyundaiIntermodal Yard
Washington UnitedTerminal
North & SouthIntermodal Yards
Duwamish Waterway
Elliot Bay
SEATTLE
H
Terminal 5 Terminal
18
Terminal 46
Terminal 30
BNSFIntermodal
Source: Port of Seattle/Tacoma, April 2015.
Overall Infrastructure Real Estate
584

© 2015 CBRE, Inc. 2015 NORTH AMERICA PORTS & LOGISTICS ANNUAL REPORT | CBRE RESEARCH
20 APPENDIX | PAGE
INDUSTRIAL MARKET REAL ESTATE OVERVIEW
◼ Overall leasing activity was strong in 2014, with 4.2 million sq. ft. of net absorption, almost 100% of which was in the warehouse segment. The submarkets closely tied to the ports—Kent Valley and Tacoma/Fife—saw mixed results, with Kent Valley posting an availability rate more than 100 bps lower than the overall market. Tacoma/Fife, on the other hand, has lagged the market with an availability rate 150 bps higher than the overall.
◼ On the whole, new construction was strong in 2014, with 2.5 million sq. ft. delivered. However, the strength of the market is best reflected by the construction pipeline of 3.4 million sq. ft., 60% of which is speculative. This is an indication of both future demand and the strength of the local economy, which has strong foundations in technology, aerospace, and manufacturing.
PORT INFRASTRUCTURE INVESTMENTS
◼ Terminal 5 at the Port of Seattle has been slated for a project that would upgrade the power and crane structure in order to accommodate the larger post-Panamax ships. At the moment, this terminal is the only one at the port that cannot handle the larger vessels. The project is due to begin in 2018.
◼ The Washington state legislature approved funding to extend SR-167 to the Port of Tacoma. This road will provide an additional route on and off the port and will help reduce overall congestion.
◼ The Port of Tacoma is renovating Pier 4 to increase its maximum ship size, from 6,500 TEUs to 18,000 TEUs, by adding post-Panamax cranes and increasing the size of the berths. The project is projected to cost $140 million.
SEATTLE/TACOMA ALLIANCE
REAL ESTATE MARKET STATS
Size of Market (Million SF) 257
Q4 2014 Availability Rate 7.4%
Y-o-Y Availability Rate Change (bps) -130
2014 Net Absorption (Million SF) 4.2
2014 Deliveries (Million SF) 2.5
Under Construction (Million SF) 3.4
2014 Rent Index (Per SF) $8.98
Y-o-Y Rent Index Change (% Change) 10.3%
Forecast
Port of Sea/Tac
-20
-15
-10
-5
0
5
10
15
20
0
500
1000
1500
2000
2500
3000
3500
4000
4500
2005 2006 2007 2008 2009 2010 2011 2012 2013 2014
Y-o-Y Growth (%) TEU Volume (000's)
TEU Volume (000’s) Y-o-Y Growth (%) 0
2
4
6
8
10
12
14
0
2
4
6
8
10
12
2008 2009 2010 2011 2012 2013 2014 2015F 2016F 2017F
Availability (%) Net Rent Index ($ per SF)
Net Rent Index ($ per SF) Availability (%)
Source: CBRE Econometric Advisors, Q4 2014.
Annual and Forecasted Availability and Rent
Source: American Association of Port Authorities, March 2015.
Annual TEU Volume and Growth Rate
Source: CBRE Econometric Advisors, Q4 2014.

© 2015 CBRE, Inc. 2015 NORTH AMERICA PORTS & LOGISTICS ANNUAL REPORT | CBRE RESEARCH
21 APPENDIX | PAGE
Oakland Inner Harbor Channel
ALAMEDA
OAKLAND
H
Ports AmericaOuter Harbor TerminalTurning
Basin
TraPacTerminal
MatsonTerminal
Charles HowardTerminal
Ben E. NutterTerminal
BNSFIntermodal Yard
Union PacificIntermodal Yard
Oakland InternationalTerminal
PORT OF OAKLAND
PORT OVERVIEW
◼ The Port of Oakland loads and discharges more than 99% of the containerized goods moving through Northern California. Oakland’s 2014 volume of 2.4 million TEUs made it the seventh busiest container port in the United States, and ranks San Francisco Bay among the three principal Pacific Coast gateways for U.S. containerized cargo, along with San Pedro Bay in southern California and Puget Sound in the Pacific Northwest.
◼ Despite the recent decrease in volumes that has resulted from the PMA/ILWU dispute, the Port of Oakland is well positioned for future growth. The port’s infrastructure (channel depth, cranes, etc.) is able to handle the largest cargo container ships, and, 85% of all inbound cargo is destined for Northern California, one of the fastest growing and most affluent regions in the U.S.—a strong indicator of future import demand.
◼ The Port of Oakland handles trade from over 100 countries but sees 75% of the volume from Asia. The primary imports are perishable items—fruit, vegetables, meat, fish, and beverages—while the primary exports are machinery and raw materials.
PORT FACTS
2014 Total TEU Volume (000’S) 2,394
Year-over-Year Change in TEU Volume 2.0%
Total Cranes/Post-Panamax Cranes 36/30
Channel Depth 50 ft.
Container Terminals 8
Leading Trading Partners China, Australia, Thailand, Taiwan, Hong Kong
Rail Operators Union Pacific, BNSF
Source: Port of Oakland, April 2015.
Overall Infrastructure Real Estate
495

© 2015 CBRE, Inc. 2015 NORTH AMERICA PORTS & LOGISTICS ANNUAL REPORT | CBRE RESEARCH
22 APPENDIX | PAGE
INDUSTRIAL MARKET REAL ESTATE OVERVIEW
◼ The Port of Oakland is located in the center of the Oakland/East Bay industrial market and has a significant influence on local warehouse demand. However, the port’s influence extends east into the Central Valley and to markets such as Sacramento and Stockton, which house larger, big box distribution centers. For the purposes of this report, the industrial real estate statistics will be a blend of Oakland/East Bay and Sacramento (which captures the eastern distribution markets).
◼ The Oakland/East Bay industrial market saw historic leasing demand in 2014 with net absorption of 4.6 million sq. ft.—the highest figure since 1994. The warehouse segment accounted for 75% of that demand, and with it came shrinking availability—the warehouse rate dropped to 5.0%, its lowest point since the dot-com era.
◼ The Central Valley market—Tracey and Stockton, for example—is situated 70 miles east of the port. Much like the Inland Empire in the south, the market is closely tied to port activity—much of Oakland’s import cargo is quickly moved to the market’s larger distribution centers for warehousing before being shipped to the end user. The Central Valley has seen a spike in demand in recent years; 2014 saw 5.1 million sq. ft. absorbed and a year-over-year drop in availability of more than 300 basis points.
PORT INFRASTRUCTURE INVESTMENTS
◼ The Oakland Global Trade & Logistics Center is a joint redevelopment project between the Port of Oakland and the City of Oakland on approximately 500 acres of land that was the former Oakland Army Base. The project, which is planned in two phases, is slated to cost $1.21 billion.
◼ Both the City and the Port have broken ground on their respective Phase I projects. Phase I will bring, among other things, a new rail yard, a new bulk marine terminal, more than 1 million sq. ft. of warehouse space and new roads to the port. Phase I will cost $500 million and will complete in two stages in 2015 and 2017.
PORT OF OAKLAND
REAL ESTATE MARKET STATS
Size of Market (Million SF) 405
Q4 2014 Availability Rate 10.8%
Y-o-Y Availability Rate Change (bps) -50
2014 Net Absorption (Million SF) 12.1
2014 Deliveries (Million SF) 2.1
Under Construction (Million SF) 4.8
2014 Rent Index (Per SF) $5.67
Y-o-Y Rent Index Change (% Change) 7.3%
Forecast
Port of Oakland
(15)
(10)
(5)
0
5
10
15
1800
1900
2000
2100
2200
2300
2400
2500
2005 2006 2007 2008 2009 2010 2011 2012 2013 2014
Y-o-Y Growth (%) TEU Volume (000's)
TEU Volume (000’s) Y-o-Y Growth (%)
0
2
4
6
8
10
12
14
16
18
0
1
2
3
4
5
6
7
2008 2009 2010 2011 2012 2013 2014 2015F 2016F 2017F
Availability (%) Net Rent Index ($ per SF)
Net Rent Index ($ per SF) Availability (%)
Source: CBRE Econometric Advisors, Q4 2014.
Annual and Forecasted Availability and Rent
Source: American Association of Port Authorities, March 2015.
Annual TEU Volume and Growth Rate
Source: CBRE Econometric Advisors, Q4 2014.

© 2015 CBRE, Inc. 2015 NORTH AMERICA PORTS & LOGISTICS ANNUAL REPORT | CBRE RESEARCH
23 APPENDIX | PAGE
SC
GA
Little Back River
Savannah River
Midd l e
Ri ve r
PORTWENTWORTH
SAVANNAH
GARDEN CITY
Argyle Turning Bas
in
MasonIntermodal Facility
Garden CityTerminal
OceanTerminal
PORT OF SAVANNAH
PORT OVERVIEW
◼ The Port of Savannah has emerged as a rapidly growing port on the east coast. With TEU growth of 10.3% from 2013 to 2014, the port is the second fastest growing port in the country. The port has become a primary choice for logistics operations due to the market’s small size, close proximity to Atlanta and major Southeastern markets, and the largest single terminal in North America.
◼ Despite its being a river port, Savannah has established itself by creating an operational environment constructed specifically for large logistics users that is free from local traffic and has ample land for industrial development. Several major international retailers have integrated the port into their logistics operations.
◼ Georgia is a right-to-work state, which has limited unions’ traction in the market, producing a history of few work stoppages. The predictability of the management and labor relationship and the consequent likelihood of port operations to remain functional has led some supply chain users to shift a portion of their inbound cargo from the west coast to Savannah.
PORT FACTS
2014 Total TEU Volume (000’S) 3,346
Year-over-Year Change in TEU Volume 10.3%
Total Cranes/Post-Panamax Cranes 33/23
Channel Depth 42 ft.
Container Terminals 2
Leading Trading Partners NE Asia, Mediterranean, SE Asia, North Europe
Rail Operators CSX, Norfolk Southern Source: Port of Savannah, April 2015.
Overall Infrastructure Real Estate
1346

© 2015 CBRE, Inc. 2015 NORTH AMERICA PORTS & LOGISTICS ANNUAL REPORT | CBRE RESEARCH
24 APPENDIX | PAGE
INDUSTRIAL MARKET REAL ESTATE OVERVIEW
◼ The significant growth in volume at the port had a large and immediate effect on the Savannah industrial market. From 2013 to 2014, demand for large blocks of distribution space spiked, with 3.6 million sq. ft. of net absorption; correspondingly, availability fell 1,960 basis points to 8.0%.
◼ With port activity projected to remain strong (and to increase with future infrastructure improvement) and with Class A space at a premium, new construction of big box warehouse and distribution is expected to accelerate in the next 12 to 24 months. In the meantime, Atlanta is benefiting as the large volume of cargo entering the port is meeting a lack of adequate local warehouse space.
PORT INFRASTRUCTURE INVESTMENTS
◼ The Savannah Harbor Expansion Project (SHEP) will deepen the Savannah Harbor federal shipping channel from 42 feet to 47 feet. The Water Resources Reform and Development Act of 2014 allocated funding for the project, which is expected to cost approximately $700 million and to begin later this year. The U.S. Army Corps of Engineers is managing the project.
◼ The State of Georgia is building a 3.1 mile road that will connect the port to I-95 at a cost of $72 million. This connector will reduce congestion at and around the port, will allow for increased volumes, and will provide better access from the port to the greater southeast region.
PORT OF SAVANNAH
REAL ESTATE MARKET STATS
Size of Market (Million SF) 27
Q4 2014 Availability Rate 8.0%
Y-o-Y Availability Rate Change (bps) -1160
2014 Net Absorption (Million SF) 3.7
2014 Deliveries (Million SF) 0.6
Under Construction (Million SF) 0.2
2014 Rent Index (Per SF) $4.05
Y-o-Y Rent Index Change (% Change) 3.6%
Forecast
Port of Savannah
(25) (20) (15) (10) (5) 0 5 10 15 20 25
0
500
1000
1500
2000
2500
3000
3500
4000
2005 2006 2007 2008 2009 2010 2011 2012 2013 2014
Y-o-Y Growth (%) TEU Volume (000's)
TEU Volume (000’s) Y-o-Y Growth (%)
0
5
10
15
20
25
30
35
40
45
0
1
2
3
4
5
2008 2009 2010 2011 2012 2013 2014 2015F 2016F 2017F
Availability (%) Net Rent Index ($ per SF)
Net Rent Index ($ per SF) Availability (%)
Source: CBRE Econometric Advisors, Q4 2014.
Annual and Forecasted Availability and Rent
Source: American Association of Port Authorities, March 2015.
Annual TEU Volume and Growth Rate
Source: CBRE Econometric Advisors, Q4 2014.
© 2015 CBRE, Inc. 2015 NORTH AMERICA PORTS & LOGISTICS ANNUAL REPORT | CBRE RESEARCH
25 APPENDIX | PAGE
Atlantic
Ocean
Cooper River
Wando River
Stono RiverCharleston
Harbor
Ashley River
Hog IslandChannel
HANAHAN
CHARLESTON
NORTH CHARLESTON
MOUNTPLEASANT
CHARLESTON
HNorth Charleston
Terminal
VeteransTerminal
Wando WelchTerminal
Columbus StreetTerminal
Union PierTerminal
CSX & Norfolk SouthernIntermodal
PORT OF CHARLESTON
PORT OVERVIEW
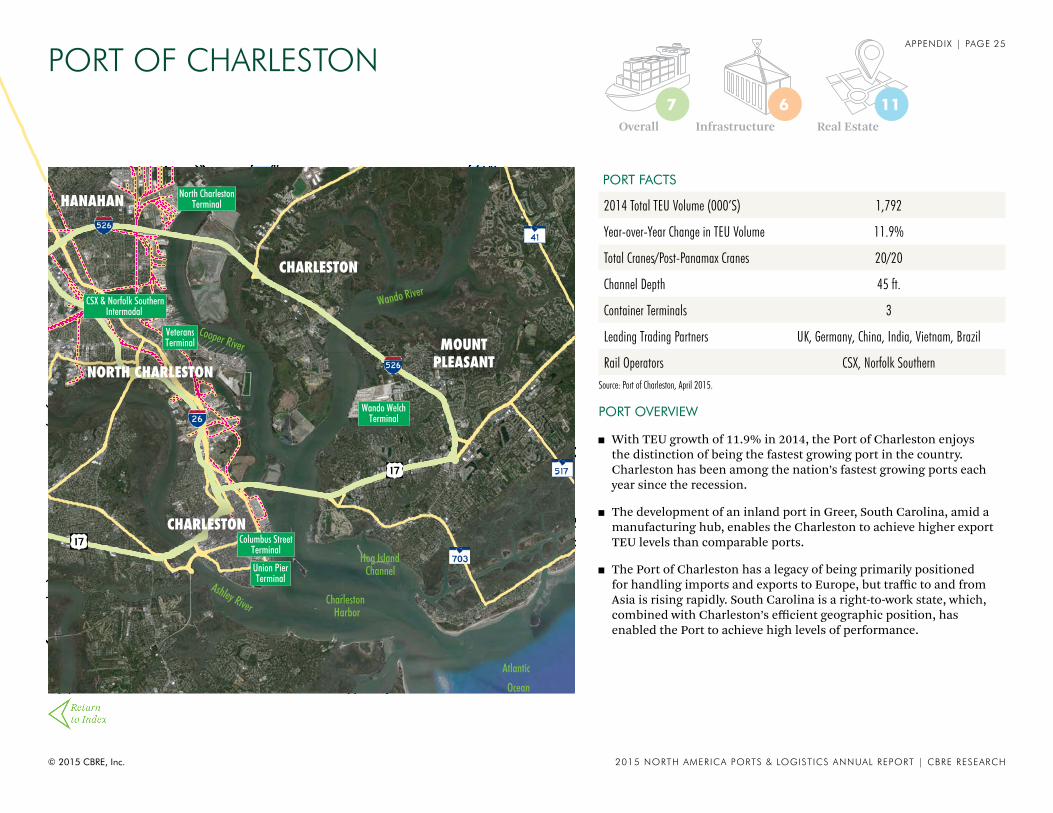
◼ With TEU growth of 11.9% in 2014, the Port of Charleston enjoys the distinction of being the fastest growing port in the country. Charleston has been among the nation’s fastest growing ports each year since the recession.
◼ The development of an inland port in Greer, South Carolina, amid a manufacturing hub, enables the Charleston to achieve higher export TEU levels than comparable ports.
◼ The Port of Charleston has a legacy of being primarily positioned for handling imports and exports to Europe, but traffic to and from Asia is rising rapidly. South Carolina is a right-to-work state, which, combined with Charleston’s efficient geographic position, has enabled the Port to achieve high levels of performance.
PORT FACTS
2014 Total TEU Volume (000’S) 1,792
Year-over-Year Change in TEU Volume 11.9%
Total Cranes/Post-Panamax Cranes 20/20
Channel Depth 45 ft.
Container Terminals 3
Leading Trading Partners UK, Germany, China, India, Vietnam, Brazil
Rail Operators CSX, Norfolk Southern Source: Port of Charleston, April 2015.
Overall Infrastructure Real Estate
1167

© 2015 CBRE, Inc. 2015 NORTH AMERICA PORTS & LOGISTICS ANNUAL REPORT | CBRE RESEARCH
26 APPENDIX | PAGE
INDUSTRIAL MARKET REAL ESTATE OVERVIEW
◼ As for many port cities, significant development constraints arise from being adjacent to a large body of water. Charleston is a small industrial market and does not have the institutional interest that major markets do. It has several industrial parks, but none are immediately adjacent to the port.
◼ Class A distribution product is of limited supply, leading to speculative development in market. In the past few years, the area has experienced growth among manufacturers. Boeing has constructed a major facility in market and Mercedes recently announced a major expansion to their facility there, helping to drive additional activity in market.
PORT INFRASTRUCTURE INVESTMENTS
◼ The South Carolina Ports Authority is midway through a $2 billion capital improvement program involving the deepening of the harbor, highway improvements and the construction of a new terminal, a new intermodal container transfer facility, and an inland port in Greer, South Carolina.
PORT OF CHARLESTON
REAL ESTATE MARKET STATS
Size of Market (Million SF) 29
Q4 2014 Availability Rate 11.8%
Y-o-Y Availability Rate Change (bps) -60
2014 Net Absorption (Million SF) 0.5
2014 Deliveries (Million SF) 0.4
Under Construction (Million SF) 0.3
2014 Rent Index (Per SF) $4.72
Y-o-Y Rent Index Change (% Change) 1.7%
Forecast
Port of Charleston
(30)
(20)
(10)
0
10
20
30
0
500
1000
1500
2000
2500
2005 2006 2007 2008 2009 2010 2011 2012 2013 2014
Y-o-Y Growth (%) TEU Volume (000's)
TEU Volume (000’s) Y-o-Y Growth (%)
0
5
10
15
20
25
0
1
2
3
4
5
6
7
2008 2009 2010 2011 2012 2013 2014 2015F 2016F 2017F
Availability (%) Net Rent Index ($ per SF)
Net Rent Index ($ per SF) Availability (%)
Source: CBRE Econometric Advisors, Q4 2014.
Annual and Forecasted Availability and Rent
Source: American Association of Port Authorities, March 2015.
Annual TEU Volume and Growth Rate
Source: CBRE Econometric Advisors, Q4 2014.

© 2015 CBRE, Inc. 2015 NORTH AMERICA PORTS & LOGISTICS ANNUAL REPORT | CBRE RESEARCH
27 APPENDIX | PAGE
Vancouver Harbour
False Creek
VANCOUVER
Canada PlaceTerminal Centerm
Terminal
Ballyantyne CruiseTerminal
Lantic BulkTerminal
Alliance GrainTerminal
VantermPacific
Elevators
PORT METRO VANCOUVER
PORT OVERVIEW
◼ Port Metro Vancouver is the largest port in Canada and the sixth largest in North America, handling 2.9 million TEUs in 2014. Volume at the port grew by 3.1% in 2014 and has seen an annual growth rate of more than 5% since 2012. The port’s location as the gateway to Asia positions it as the main inbound and outbound point for Canadian cargo.
◼ In 2014, the port handled more than 140 million tons of cargo, with coal, automobiles, perishable items and raw materials representing the majority of the cargo.
◼ In 2012, the BC Maritime Employers Association and the International Longshore and Warehouse Union Locals 514 and 500 ratified an extension of their collective agreements, guaranteeing a full work agreement through March 2018.
PORT FACTS
2014 Total TEU Volume (000’S) 2,913
Year-over-Year Change in TEU Volume 3.1%
Total Cranes/Post-Panamax Cranes 26/20
Channel Depth 52 ft.
Container Terminals 4
Leading Trading Partners China, South Korea, Japan, US, India, Brazil
Rail Operators CN, Canadian Pacific, BNSF Source: Port Metro Vancouver, April 2015.
Overall Infrastructure Real Estate
1278
© 2015 CBRE, Inc. 2015 NORTH AMERICA PORTS & LOGISTICS ANNUAL REPORT | CBRE RESEARCH
28 APPENDIX | PAGE
INDUSTRIAL MARKET REAL ESTATE OVERVIEW
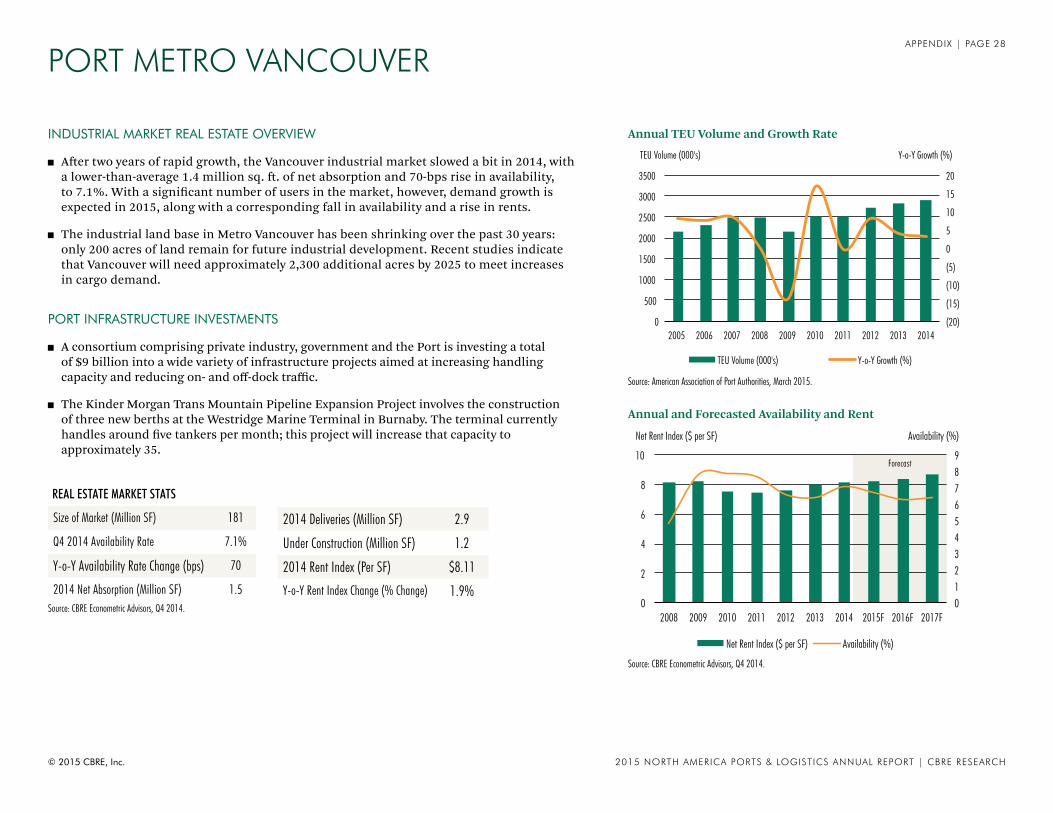
◼ After two years of rapid growth, the Vancouver industrial market slowed a bit in 2014, with a lower-than-average 1.4 million sq. ft. of net absorption and 70-bps rise in availability, to 7.1%. With a significant number of users in the market, however, demand growth is expected in 2015, along with a corresponding fall in availability and a rise in rents.
◼ The industrial land base in Metro Vancouver has been shrinking over the past 30 years: only 200 acres of land remain for future industrial development. Recent studies indicate that Vancouver will need approximately 2,300 additional acres by 2025 to meet increases in cargo demand.
PORT INFRASTRUCTURE INVESTMENTS
◼ A consortium comprising private industry, government and the Port is investing a total of $9 billion into a wide variety of infrastructure projects aimed at increasing handling capacity and reducing on- and off-dock traffic.
◼ The Kinder Morgan Trans Mountain Pipeline Expansion Project involves the construction of three new berths at the Westridge Marine Terminal in Burnaby. The terminal currently handles around five tankers per month; this project will increase that capacity to approximately 35.
PORT METRO VANCOUVER
REAL ESTATE MARKET STATS
Size of Market (Million SF) 181
Q4 2014 Availability Rate 7.1%
Y-o-Y Availability Rate Change (bps) 70
2014 Net Absorption (Million SF) 1.5
2014 Deliveries (Million SF) 2.9
Under Construction (Million SF) 1.2
2014 Rent Index (Per SF) $8.11
Y-o-Y Rent Index Change (% Change) 1.9%
Forecast
Port of Vancouver
(20)
(15)
(10)
(5)
0
5
10
15
20
0
500
1000
1500
2000
2500
3000
3500
2005 2006 2007 2008 2009 2010 2011 2012 2013 2014
Y-o-Y Growth (%) TEU Volume (000's)
TEU Volume (000's) Y-o-Y Growth (%)
0 1 2 3 4 5 6 7 8 9
0
2
4
6
8
10
2008 2009 2010 2011 2012 2013 2014 2015F 2016F 2017F
Availability (%) Net Rent Index ($ per SF)
Net Rent Index ($ per SF) Availability (%)
Source: CBRE Econometric Advisors, Q4 2014.
Annual and Forecasted Availability and Rent
Source: American Association of Port Authorities, March 2015.
Annual TEU Volume and Growth Rate
Source: CBRE Econometric Advisors, Q4 2014.
© 2015 CBRE, Inc. 2015 NORTH AMERICA PORTS & LOGISTICS ANNUAL REPORT | CBRE RESEARCH
29 APPENDIX | PAGE
Chesapeake Bay
Elizabeth River
Hampton Roads Bay
James River
NEWPORT NEWS
NORFOLK
PORTSMOUTH
CHESAPEAKE
SUFFOLK
Monitor MerrimacMemorial Bridge-Tunnel
Newport NewsMarine Terminal
Norfolk InternationalTerminal
Craney IslandExpansion
NorfolkSouthern Rail
APMTerminal
PortsmouthMarine Terminal
CSXRail
PORT OF VIRGINIA (NORFOLK)
PORT OVERVIEW
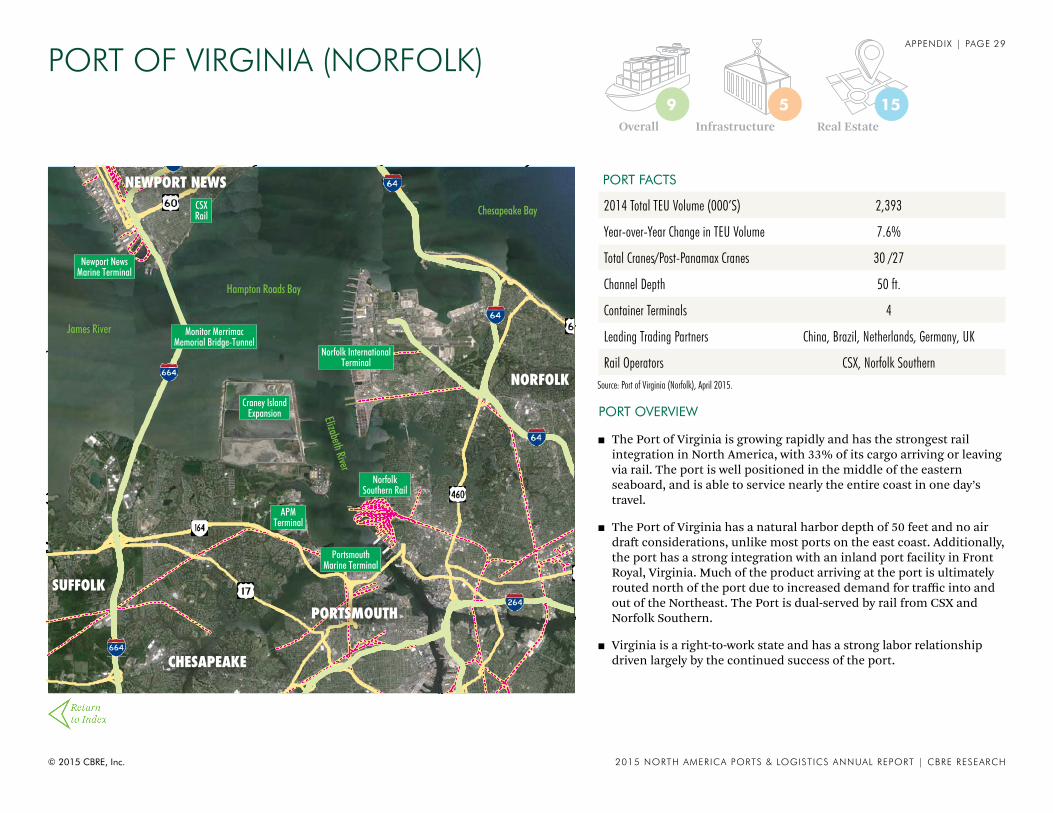
◼ The Port of Virginia is growing rapidly and has the strongest rail integration in North America, with 33% of its cargo arriving or leaving via rail. The port is well positioned in the middle of the eastern seaboard, and is able to service nearly the entire coast in one day’s travel.
◼ The Port of Virginia has a natural harbor depth of 50 feet and no air draft considerations, unlike most ports on the east coast. Additionally, the port has a strong integration with an inland port facility in Front Royal, Virginia. Much of the product arriving at the port is ultimately routed north of the port due to increased demand for traffic into and out of the Northeast. The Port is dual-served by rail from CSX and Norfolk Southern.
◼ Virginia is a right-to-work state and has a strong labor relationship driven largely by the continued success of the port.
PORT FACTS
2014 Total TEU Volume (000’S) 2,393
Year-over-Year Change in TEU Volume 7.6%
Total Cranes/Post-Panamax Cranes 30 /27
Channel Depth 50 ft.
Container Terminals 4
Leading Trading Partners China, Brazil, Netherlands, Germany, UK
Rail Operators CSX, Norfolk Southern Source: Port of Virginia (Norfolk), April 2015.
Overall Infrastructure Real Estate
1559
© 2015 CBRE, Inc. 2015 NORTH AMERICA PORTS & LOGISTICS ANNUAL REPORT | CBRE RESEARCH
30 APPENDIX | PAGE
INDUSTRIAL MARKET REAL ESTATE OVERVIEW
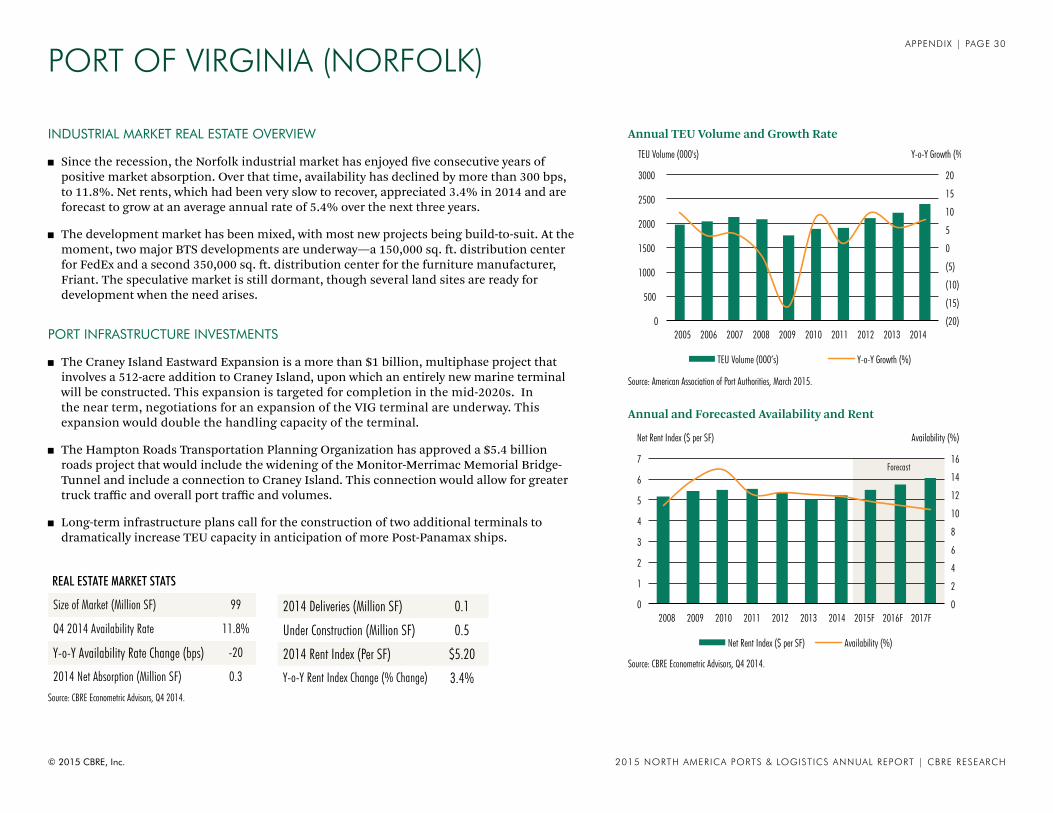
◼ Since the recession, the Norfolk industrial market has enjoyed five consecutive years of positive market absorption. Over that time, availability has declined by more than 300 bps, to 11.8%. Net rents, which had been very slow to recover, appreciated 3.4% in 2014 and are forecast to grow at an average annual rate of 5.4% over the next three years.
◼ The development market has been mixed, with most new projects being build-to-suit. At the moment, two major BTS developments are underway—a 150,000 sq. ft. distribution center for FedEx and a second 350,000 sq. ft. distribution center for the furniture manufacturer, Friant. The speculative market is still dormant, though several land sites are ready for development when the need arises.
PORT INFRASTRUCTURE INVESTMENTS
◼ The Craney Island Eastward Expansion is a more than $1 billion, multiphase project that involves a 512-acre addition to Craney Island, upon which an entirely new marine terminal will be constructed. This expansion is targeted for completion in the mid-2020s. In the near term, negotiations for an expansion of the VIG terminal are underway. This expansion would double the handling capacity of the terminal.
◼ The Hampton Roads Transportation Planning Organization has approved a $5.4 billion roads project that would include the widening of the Monitor-Merrimac Memorial Bridge- Tunnel and include a connection to Craney Island. This connection would allow for greater truck traffic and overall port traffic and volumes.
◼ Long-term infrastructure plans call for the construction of two additional terminals to dramatically increase TEU capacity in anticipation of more Post-Panamax ships.
PORT OF VIRGINIA (NORFOLK)
REAL ESTATE MARKET STATS
Size of Market (Million SF) 99
Q4 2014 Availability Rate 11.8%
Y-o-Y Availability Rate Change (bps) -20
2014 Net Absorption (Million SF) 0.3
2014 Deliveries (Million SF) 0.1
Under Construction (Million SF) 0.5
2014 Rent Index (Per SF) $5.20
Y-o-Y Rent Index Change (% Change) 3.4%
Forecast
Port of Norfolk
(20)
(15)
(10)
(5)
0
5
10
15
20
0
500
1000
1500
2000
2500
3000
2005 2006 2007 2008 2009 2010 2011 2012 2013 2014
Y-o-Y Growth (%) TEU Volume (000's)
TEU Volume (000’s) Y-o-Y Growth (%)
0
2
4
6
8
10
12
14
16
0
1
2
3
4
5
6
7
2008 2009 2010 2011 2012 2013 2014 2015F 2016F 2017F
Availability (%) Net Rent Index ($ per SF)
Net Rent Index ($ per SF) Availability (%)
Source: CBRE Econometric Advisors, Q4 2014.
Annual and Forecasted Availability and Rent
Source: American Association of Port Authorities, March 2015.
Annual TEU Volume and Growth Rate
Source: CBRE Econometric Advisors, Q4 2014.
© 2015 CBRE, Inc. 2015 NORTH AMERICA PORTS & LOGISTICS ANNUAL REPORT | CBRE RESEARCH
31 APPENDIX | PAGE
Tayl
orLa
k e
Galveston Bay
Bayport Ship Channel
SHOREACRES
LA PORTE
PASADENA
SEABROOK
MORGAN'S POINT
EL LAGO
Barbours CutTerminal
Union PacificRail
BayportTerminal
Bayport TurningBasin
PORT OF HOUSTON
PORT OVERVIEW
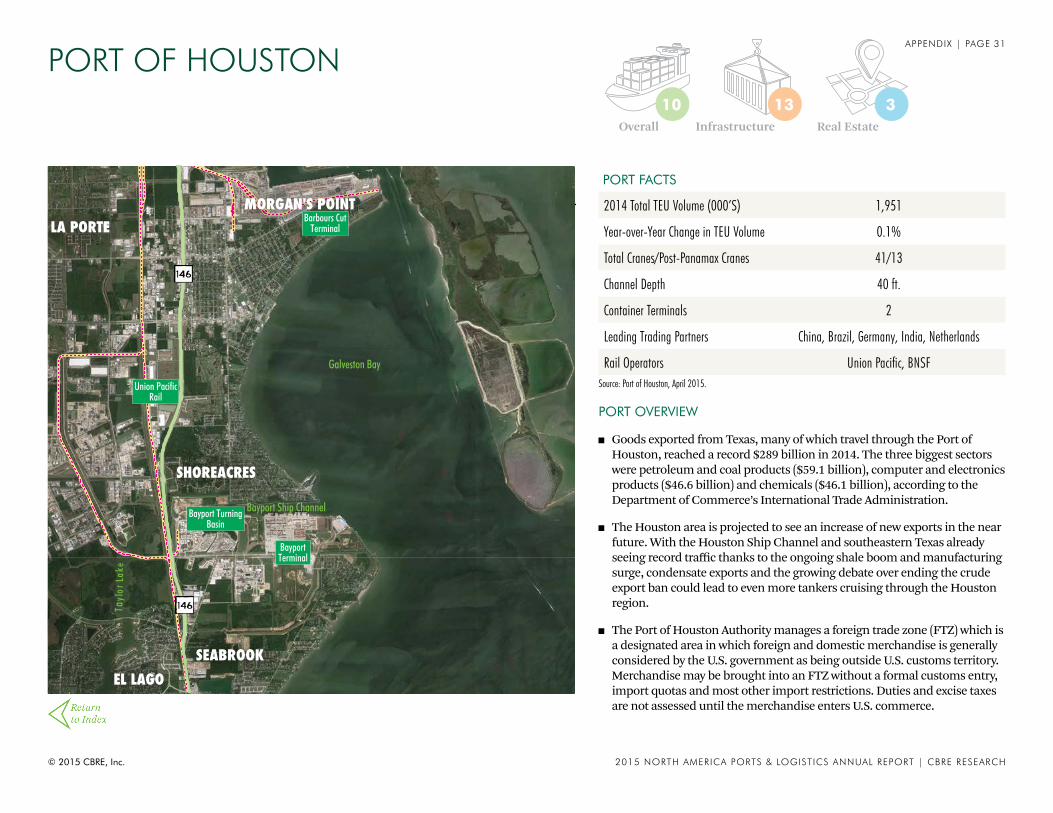
◼ Goods exported from Texas, many of which travel through the Port of Houston, reached a record $289 billion in 2014. The three biggest sectors were petroleum and coal products ($59.1 billion), computer and electronics products ($46.6 billion) and chemicals ($46.1 billion), according to the Department of Commerce’s International Trade Administration.
◼ The Houston area is projected to see an increase of new exports in the near future. With the Houston Ship Channel and southeastern Texas already seeing record traffic thanks to the ongoing shale boom and manufacturing surge, condensate exports and the growing debate over ending the crude export ban could lead to even more tankers cruising through the Houston region.
◼ The Port of Houston Authority manages a foreign trade zone (FTZ) which is a designated area in which foreign and domestic merchandise is generally considered by the U.S. government as being outside U.S. customs territory. Merchandise may be brought into an FTZ without a formal customs entry, import quotas and most other import restrictions. Duties and excise taxes are not assessed until the merchandise enters U.S. commerce.
PORT FACTS
2014 Total TEU Volume (000’S) 1,951
Year-over-Year Change in TEU Volume 0.1%
Total Cranes/Post-Panamax Cranes 41/13
Channel Depth 40 ft.
Container Terminals 2
Leading Trading Partners China, Brazil, Germany, India, Netherlands
Rail Operators Union Pacific, BNSF Source: Port of Houston, April 2015.
Overall Infrastructure Real Estate
31310

© 2015 CBRE, Inc. 2015 NORTH AMERICA PORTS & LOGISTICS ANNUAL REPORT | CBRE RESEARCH
32 APPENDIX | PAGE
INDUSTRIAL MARKET REAL ESTATE OVERVIEW
◼ Houston’s industrial market saw record-setting deliveries of more than 1.7 million sq. ft. of new product in Q4 2014, driving 2014 deliveries to 12 million sq. ft. This much industrial product has not been built in Houston since 2008’s 12.3 million sq. ft. The market has proved more than able to consume these supply increases, with Q4 2014’s 2.2 million sq. ft. absorbed marking the fifteenth consecutive quarter of positive absorption. The Houston-area industrial market’s 2014 absorption of 8.1 million sq. ft. in 2014 was also the most in the current post-recession cycle.
PORT INFRASTRUCTURE INVESTMENTS
◼ The Port Authority plans to undertake significant infrastructure improvements in the next few years to ensure that the Port of Houston is able to accommodate post-Panamax ships and the greater cargo volume that will result from the pending Panama Canal expansion and from the demographic growth that is expected for the region.
◼ In 2015, the Port Authority expects to commit $275 million for various capital projects. Approximately $184 million will be allocated to container terminals for continuing development of Bayport and for modernization at Barbours Cut; another $35 million will be put toward improvements at the general cargo and bulk terminals in the Turning Basin area.
PORT OF HOUSTON
REAL ESTATE MARKET STATS
Size of Market (Million SF) 474
Q4 2014 Availability Rate 7.3%
Y-o-Y Availability Rate Change (bps) -90
2014 Net Absorption (Million SF) 8.1
2014 Deliveries (Million SF) 12.0
Under Construction (Million SF) 8.4
2014 Rent Index (Per SF) $6.27
Y-o-Y Rent Index Change (% Change) 1.6%
Forecast
Port of Houston
(20)
(15)
(10)
(5)
0
5
10
15
20
0
500
1000
1500
2000
2500
2005 2006 2007 2008 2009 2010 2011 2012 2013 2014
Y-o-Y Growth(%) TEU Volume (000's)
TEU Volume (000’s) Y-o-Y Growth(%)
0
2
4
6
8
10
12
0
1
2
3
4
5
6
7
8
2008 2009 2010 2011 2012 2013 2014 2015F 2016F 2017F
Availability (%) Net Rent Index ($ per SF)
Net Rent Index ($ per SF) Availability (%)
Source: CBRE Econometric Advisors, Q4 2014.
Annual and Forecasted Availability and Rent
Source: American Association of Port Authorities, March 2015.
Annual TEU Volume and Growth Rate
Source: CBRE Econometric Advisors, Q4 2014.
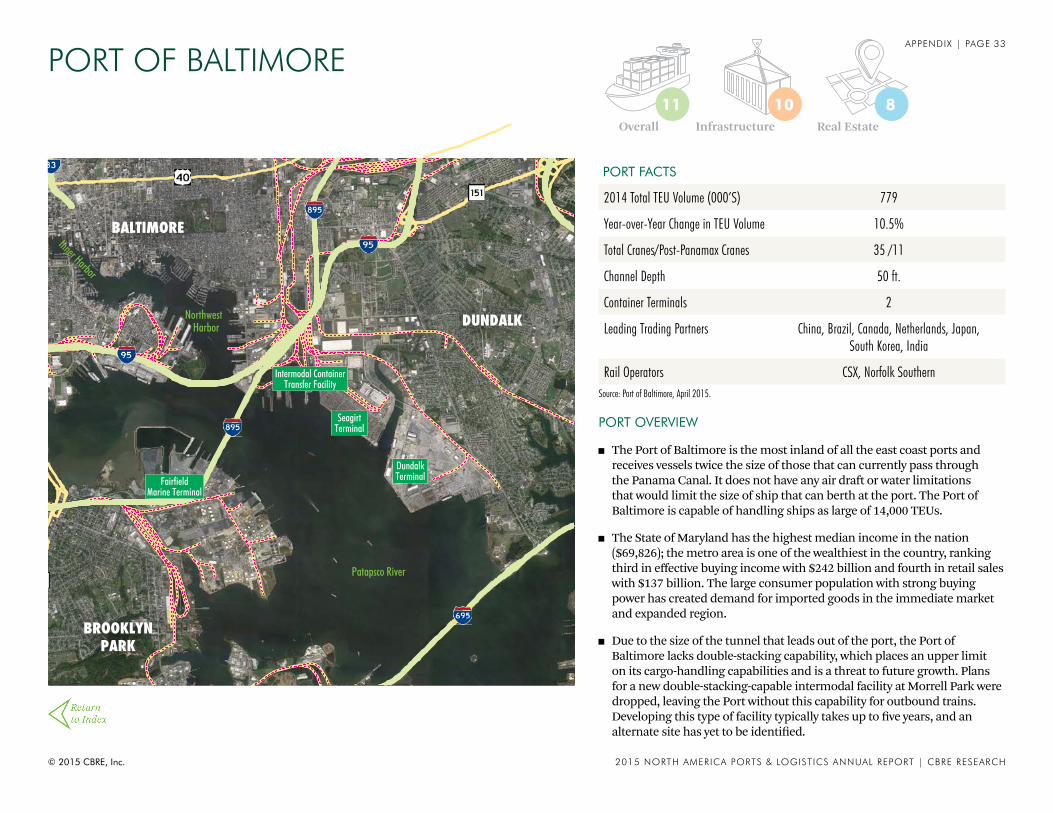
© 2015 CBRE, Inc. 2015 NORTH AMERICA PORTS & LOGISTICS ANNUAL REPORT | CBRE RESEARCH
33 APPENDIX | PAGE
BROOKLYNPARK
EDGEMERE
DUNDALK
BALTIMORE
Bear
Creek
Back River
Patapsco River
Inner Harbor
NorthwestHarbor
Intermodal ContainerTransfer Facility
SeagirtTerminal
DundalkTerminalFairfield
Marine Terminal
PORT OF BALTIMORE
PORT OVERVIEW
◼ The Port of Baltimore is the most inland of all the east coast ports and receives vessels twice the size of those that can currently pass through the Panama Canal. It does not have any air draft or water limitations that would limit the size of ship that can berth at the port. The Port of Baltimore is capable of handling ships as large of 14,000 TEUs.
◼ The State of Maryland has the highest median income in the nation ($69,826); the metro area is one of the wealthiest in the country, ranking third in effective buying income with $242 billion and fourth in retail sales with $137 billion. The large consumer population with strong buying power has created demand for imported goods in the immediate market and expanded region.
◼ Due to the size of the tunnel that leads out of the port, the Port of Baltimore lacks double-stacking capability, which places an upper limit on its cargo-handling capabilities and is a threat to future growth. Plans for a new double-stacking-capable intermodal facility at Morrell Park were dropped, leaving the Port without this capability for outbound trains. Developing this type of facility typically takes up to five years, and an alternate site has yet to be identified.
PORT FACTS
2014 Total TEU Volume (000’S) 779
Year-over-Year Change in TEU Volume 10.5%
Total Cranes/Post-Panamax Cranes 35 /11
Channel Depth 50 ft.
Container Terminals 2
Leading Trading Partners China, Brazil, Canada, Netherlands, Japan, South Korea, India
Rail Operators CSX, Norfolk Southern Source: Port of Baltimore, April 2015.
Overall Infrastructure Real Estate
81011

© 2015 CBRE, Inc. 2015 NORTH AMERICA PORTS & LOGISTICS ANNUAL REPORT | CBRE RESEARCH
34 APPENDIX | PAGE
INDUSTRIAL MARKET REAL ESTATE OVERVIEW
◼ Overall leasing activity was strong in 2014, with 4 million sq. ft. of net absorption. Approximately two thirds of that occurred in the city of Baltimore, a submarket that is closely tied to port activity. Availability fell to 15.1%—down 30 basis points year over year.
◼ New construction was strong in 2014, with 3 million sq. ft. delivered—most of it in the third quarter. The improvement in the market is best reflected by the construction pipeline of 1.8 million sq. ft., most of which is speculative. This is the highest level of spec construction in the current cycle.
PORT INFRASTRUCTURE INVESTMENTS
◼ Ports America, the operator of the Baltimore Port and terminals, has invested more than $100 million in the Seagirt Marine Terminal, which features a new berth with 50 feet of draft and four new super post-Panamax cranes.
◼ Baltimore was awarded a $13 million federal grant to dredge the main channel and to create an 8-acre cargo-staging area that will improve overall cargo-handling capability. In addition, rail access improvements at the Fairfield Terminal will help increase efficiency in handling large cargo such as automobiles and heavy machinery.
PORT OF BALTIMORE
REAL ESTATE MARKET STATS
Size of Market (Million SF) 159
Q4 2014 Availability Rate 15.1%
Y-o-Y Availability Rate Change (bps) -30
2014 Net Absorption (Million SF) 4.0
2014 Deliveries (Million SF) 3.0
Under Construction (Million SF) 1.8
2014 Rent Index (Per SF) $3.57
Y-o-Y Rent Index Change (% Change) 4.1%
Forecast
Port of Baltimore
(20)
(15)
(10)
(5)
0
5
10
15
20
0
100
200
300
400
500
600
700
800
900
2005 2006 2007 2008 2009 2010 2011 2012 2013 2014
Y-o-Y Growth (%) TEU Volume (000's)
TEU Volume (000’s) Y-o-Y Growth (%)
0
2
4
6
8
10
12
14
16
18
0
1
2
3
4
5
2008 2009 2010 2011 2012 2013 2014 2015F 2016F 2017F
Availability (%) Net Rent Index ($ per SF)
Net Rent Index ($ per SF) Availability (%)
Source: CBRE Econometric Advisors, Q4 2014.
Annual and Forecasted Availability and Rent
Source: American Association of Port Authorities, March 2015.
Annual TEU Volume and Growth Rate
Source: CBRE Econometric Advisors, Q4 2014.

© 2015 CBRE, Inc. 2015 NORTH AMERICA PORTS & LOGISTICS ANNUAL REPORT | CBRE RESEARCH
35 APPENDIX | PAGE
St anaha nRi v e r
Int e
rcoa
stal
Wat
e rw
ay
Straits of Florida
HOLLYWOOD
DANIABEACH
FORT LAUDERDALE
H
TurningBasin
FloridaInternational Terminal
Port EvergladesTerminal
Ft. Lauderdale - HollywoodAirport
PORT EVERGLADES (FT. LAUDERDALE)
PORT OVERVIEW
◼ Port Everglades’ trade exceeded $25 billion in 2014, which includes global containerized cargo, petroleum products and bulk cargoes, such as cement. Imports rose 16% and exports decreased 1%. The Port is Florida’s top seaport for import/export trade, handling 17.5% of the state’s total international trade.
◼ Port Everglades generates nearly $26 billion in business activity annually and is a major driver of both local and regional employment, with more than 11,000 direct jobs and 200,000 port-affected jobs statewide. The port is particularly active in the import, storage, and distribution of petroleum products, with more than 20% of all of Florida’s energy requirements served by product that comes through the port.
◼ Port Everglades has been ranked the top exporting Foreign-Trade Zone (FTZ) in the country for warehousing and distribution activity by the Foreign-Trade Zones Board’s 73rd annual report to the U.S. Congress. More than 80% of the port trade volume is with Central and South American countries, representing 15% of all U.S. trade with Latin America.
PORT FACTS
2014 Total TEU Volume (000’S) 1,013
Year-over-Year Change in TEU Volume 8.5%
Total Cranes/Post-Panamax Cranes 16/9
Channel Depth 48 ft.
Container Terminals 2
Leading Trading Partners China, Honduras, Guatemala, Brazil, Taiwan
Rail Operators Florida East Coast Railway Source: Port Everglades (Ft. Lauderdale), April 2015.
Overall Infrastructure Real Estate
101112

© 2015 CBRE, Inc. 2015 NORTH AMERICA PORTS & LOGISTICS ANNUAL REPORT | CBRE RESEARCH
36 APPENDIX | PAGE
INDUSTRIAL MARKET REAL ESTATE OVERVIEW
◼ Demand in the Broward County industrial market has been largely concentrated in the larger, Class A warehouse and distribution segment. Of the 1 million sq. ft. absorbed in 2014, more than 70% was in that segment.
◼ While availability sits at a relatively elevated 10.8%, the Class A warehouse market is extremely tight, with few blocks of space available. Despite the growth of the port and demand pushing north from Miami, developers have found been unable to find sites sufficient to build new product to meet the demand.
PORT INFRASTRUCTURE INVESTMENTS
◼ Port Everglades has received over $190 million in federal and state grants to dredge its entrance channel to 48 feet, which will help accommodate the larger cargo vessels that will pass through the wider Panama Canal.
◼ The Florida East Coast Railway opened a $53 million intermodal container transfer facility in 2014, which is used to transfer cargo from ships to rail. This near-dock facility improved upon the old, smaller intermodal, which was located 2 miles from the port.
◼ The Port has a long-term $1.6 billion master plan to add additional cargo berths, lengthen the Southport Turning Notch, and continue to dredge the channel. These improvements are scheduled to be completed in several phases by 2033.
PORT EVERGLADES (FT. LAUDERDALE)
REAL ESTATE MARKET STATS
Size of Market (Million SF) 92
Q4 2014 Availability Rate 10.8%
Y-o-Y Availability Rate Change (bps) -120
2014 Net Absorption (Million SF) 1.0
2014 Deliveries (Million SF) 0.8
Under Construction (Million SF) 0.5
2014 Rent Index (Per SF) $6.05
Y-o-Y Rent Index Change (% Change) 4.5%
Port of Everglades
(25) (20) (15) (10) (5) 0 5 10 15 20 25
0
200
400
600
800
1000
1200
2005 2006 2007 2008 2009 2010 2011 2012 2013 2014
Y-o-Y Growth (%) TEU Volume (000's)
TEU Volume (000’s) Y-o-Y Growth (%)
Forecast
0
2
4
6
8
10
12
14
16
0
1
2
3
4
5
6
7
8
2008 2009 2010 2011 2012 2013 2014 2015F 2016F 2017F
Availability (%) Net Rent Index ($ per SF)
Net Rent Index ($ per SF) Availability (%)
Source: CBRE Econometric Advisors, Q4 2014.
Annual and Forecasted Availability and Rent
Source: American Association of Port Authorities, March 2015.
Annual TEU Volume and Growth Rate
Source: CBRE Econometric Advisors, Q4 2014.

© 2015 CBRE, Inc. 2015 NORTH AMERICA PORTS & LOGISTICS ANNUAL REPORT | CBRE RESEARCH
37 APPENDIX | PAGE
Straits of Florida
Miami River
Biscayne Bay
MIAMI
MIAMIBEACH
FISHERISLAND
H
Main Turning Basin
SeaboardMarine Terminal
Lummus Turning Basin
POMTOC CargoTerminal
SFCT CargoTerminal Fisher Island
Turning Basin
PORTMIAMI
PORT OVERVIEW
◼ Thanks to PortMiami’s geographic location, the world’s largest shipping lines offer regular service from PortMiami to more than 250 ports in more than 100 countries around the world. In particular, PortMiami is the leading gateway to Central and South America, handling more than half of the 8 million tons of cargo coming from or going to Latin America each year.
◼ With state of the art quarantine and refrigeration systems, PortMiami is ranked one of the busiest ports in the U.S. for refrigerated container traffic, moving nearly four million tons of perishable cargo such as flowers and fruit.
◼ PortMiami has long been plagued by congestion issues resulting from rail and road bottlenecks at the entry/exit point. However, the addition of a new tunnel that runs under Biscayne Bay, linking PortMiami directly to the interstate, has reduced truck congestion significantly. Rail service was suspended after Hurricane Wilma destroyed the tracks leading to the port in 2005, but service was restored during 2014.
PORT FACTS
2014 Total TEU Volume (000’S) 957
Year-over-Year Change in TEU Volume 8.5%
Total Cranes/Post-Panamax Cranes 13/6
Channel Depth 52 ft. (in 2015 after dredging complete)
Container Terminals 3
Leading Trading Partners China, Honduras, Guatemala, Brazil, Netherlands, Dominican Republic
Rail Operators CSX, Norfolk SouthernSource: PortMiami, April 2015.
Overall Infrastructure Real Estate
91213

© 2015 CBRE, Inc. 2015 NORTH AMERICA PORTS & LOGISTICS ANNUAL REPORT | CBRE RESEARCH
38 APPENDIX | PAGE
INDUSTRIAL MARKET REAL ESTATE OVERVIEW
◼ With an availability rate of 6.5% and a relatively low delivery rate for new construction, supply in the Miami market is tight. In 2014, with demand strong—2 million sq. ft. absorbed—net rents responded, growing 2.5%.
◼ User demand has been most prevalent in the high cube distribution space—facilities characterized by 28’ to 36’ clear, wider bays, deep truck courts, and excess parking. This type of property has historically made up a very small percentage of total stock and, due to the high demand, is largely unavailable. The development market has responded with 900,000 sq. ft. currently under construction and another 3.4 million sq. ft. in the pipeline.
PORT INFRASTRUCTURE INVESTMENTS
◼ More than $1 billion in capital improvement projects are currently underway at PortMiami. When PortMiami’s Deep Dredge project is completed in early 2015, PortMiami will be the only port south of Port of Virginia able to accommodate post-Panamax vessels.
◼ Four new super-sized gantry cranes arrived at the port during Q4 2013, giving PortMiami a total of 13 cranes, six of which are Super Post-Panamax. Once post-Panamax vessels begin to call at PortMiami, these cranes will allow quicker offloading of containers.
◼ On-port rail service, which was destroyed by Hurricane Wilma in 2005, was re-introduced during Q4 2013, allowing cargo that arrives at PortMiami to reach 70% of the U.S. population within four days.
PORTMIAMI
REAL ESTATE MARKET STATS
Size of Market (Million SF) 207
Q4 2014 Availability Rate 6.5%
Y-o-Y Availability Rate Change (bps) -130
2014 Net Absorption (Million SF) 2.0
2014 Deliveries (Million SF) 1.9
Under Construction (Million SF) 0.9
2014 Rent Index (Per SF) $7.35
Y-o-Y Rent Index Change (% Change) 2.5%
Port of Miami
(10) (8) (6) (4) (2) 0 2 4 6 8 10
0
200
400
600
800
1000
1200
2005 2006 2007 2008 2009 2010 2011 2012 2013 2014
Y-o-Y Growth (%) TEU Volume (000's)
TEU Volume (000’s) Y-o-Y Growth (%)
Forecast
0
2
4
6
8
10
12
14
16
0
1
2
3
4
5
6
7
8
9
2008 2009 2010 2011 2012 2013 2014 2105F 2016F 2017F
Availability (%) Net Rent Index ($ per SF)
Net Rent Index ($ per SF) Availability (%)
Source: CBRE Econometric Advisors, Q4 2014.
Annual and Forecasted Availability and Rent
Source: American Association of Port Authorities, March 2015.
Annual TEU Volume and Growth Rate
Source: CBRE Econometric Advisors, Q4 2014.
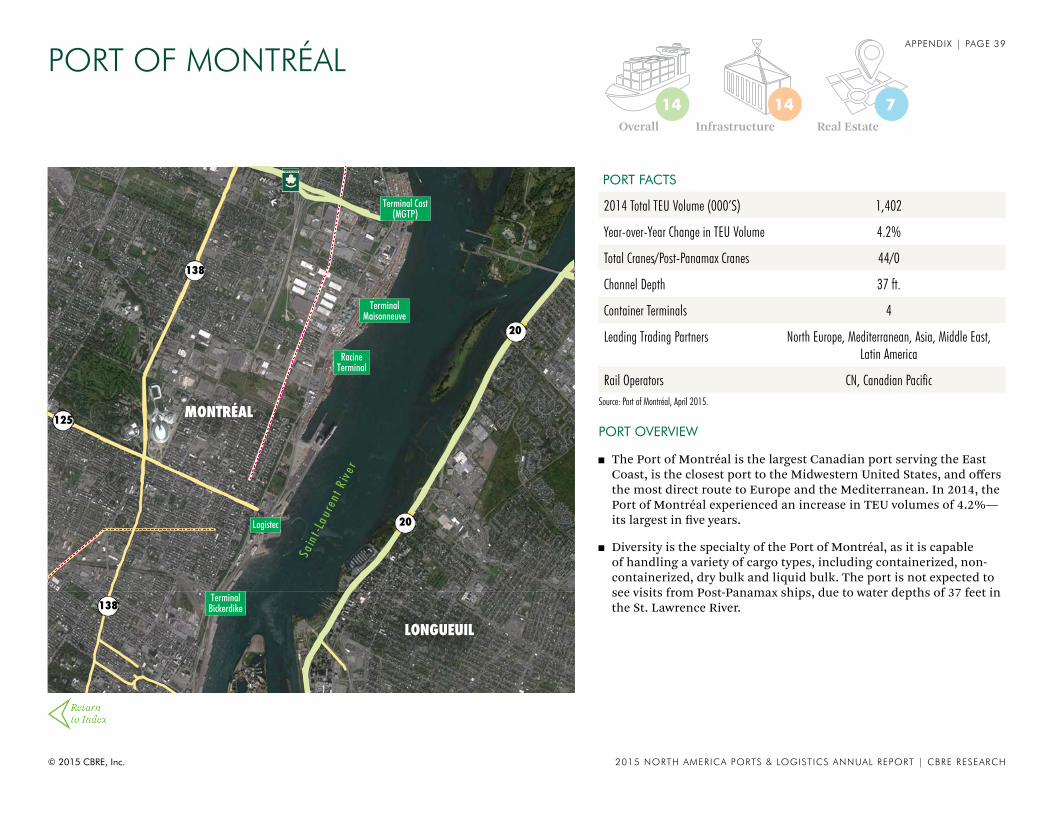
© 2015 CBRE, Inc. 2015 NORTH AMERICA PORTS & LOGISTICS ANNUAL REPORT | CBRE RESEARCH
39 APPENDIX | PAGE
S ain
t -La u
ren t
R iv e
r
MONTRÉAL
LONGUEUIL
BOUCHERVILLE
H
20
20
138
125
138
Terminal Cast(MGTP)
TerminalMaisonneuve
RacineTerminal
Logistec
TerminalBickerdike
PORT OF MONTRÉAL
PORT OVERVIEW
◼ The Port of Montréal is the largest Canadian port serving the East Coast, is the closest port to the Midwestern United States, and offers the most direct route to Europe and the Mediterranean. In 2014, the Port of Montréal experienced an increase in TEU volumes of 4.2%—its largest in five years.
◼ Diversity is the specialty of the Port of Montréal, as it is capable of handling a variety of cargo types, including containerized, non-containerized, dry bulk and liquid bulk. The port is not expected to see visits from Post-Panamax ships, due to water depths of 37 feet in the St. Lawrence River.
PORT FACTS
2014 Total TEU Volume (000’S) 1,402
Year-over-Year Change in TEU Volume 4.2%
Total Cranes/Post-Panamax Cranes 44/0
Channel Depth 37 ft.
Container Terminals 4
Leading Trading Partners North Europe, Mediterranean, Asia, Middle East, Latin America
Rail Operators CN, Canadian Pacific Source: Port of Montréal, April 2015.
Overall Infrastructure Real Estate
71414

© 2015 CBRE, Inc. 2015 NORTH AMERICA PORTS & LOGISTICS ANNUAL REPORT | CBRE RESEARCH
40 APPENDIX | PAGE
INDUSTRIAL MARKET REAL ESTATE OVERVIEW
◼ The strength of the Canadian dollar against the United States dollar from 2010 to 2014 put Montréal in a unique situation. Manufacturers were faced with increased purchase prices for U.S. consumers, but the rising value of Canadian currency also pushed rents lower in the market. Recent declines in the Canadian dollar should add fuel to the manufacturing fire.
◼ The Port of Montréal is located on the St. Lawrence River between Montréal Midtown and East End submarkets. As of Q4 2014, East End exhibited the lowest asking rates and highest availability of all submarkets in the Montréal industrial market. The market, as a whole, accumulated 5.0 million square feet of absorption, with more than 25% of that absorption in the East End submarket.
PORT INFRASTRUCTURE INVESTMENTS
◼ An $83 million project at the Viau container terminal is planned, aimed at increasing TEU capacity. The project is expected to begin this year and to complete in 2018. At the end of this project, the handling capacity of the Port of Montréal will be increased from 600,000 TEUs to more than 2.1 million TEUs.
◼ To support further growth in the container sector, a new terminal is planned. In 2010, the Montréal Port Authority (MPA) developed a master plan that spans more than 10 years and identifies milestones for the realization of this project. The Contrecoeur site, MPA’s land reserve, can accommodate a container terminal with a capacity of 3.5 million TEUs. Full deployment of the terminal is to be realized in phases, the first of which is scheduled to come into operation in 2021, providing capacity for an additional 1.1 million TEUs
PORT OF MONTRÉAL
REAL ESTATE MARKET STATS
Size of Market (Million SF) 296
Q4 2014 Availability Rate 6.6%
Y-o-Y Availability Rate Change (bps) -130
2014 Net Absorption (Million SF) 5.0
2014 Deliveries (Million SF) 1.3
Under Construction (Million SF) 1.9
2014 Rent Index (Per SF) $5.16
Y-o-Y Rent Index Change (% Change) -0.2%
Forecast
Port of Montreal
(20)
(15)
(10)
(5)
0
5
10
15
20
1100
1150
1200
1250
1300
1350
1400
1450
1500
2005 2006 2007 2008 2009 2010 2011 2012 2013 2014
Y-o-Y Growth (%) TEU Volume (000's)
TEU Volume (000’s) Y-o-Y Growth (%)
0
2
4
6
8
10
12
0
1
2
3
4
5
6
2008 2009 2010 2011 2012 2013 2014 2015F 2016F 2017F
Availability (%) Net Rent Index ($ per SF)
Net Rent Index ($ per SF) Availability (%)
Source: CBRE Econometric Advisors, Q4 2014.
Annual and Forecasted Availability and Rent
Source: American Association of Port Authorities, March 2015.
Annual TEU Volume and Growth Rate
Source: CBRE Econometric Advisors, Q4 2014.
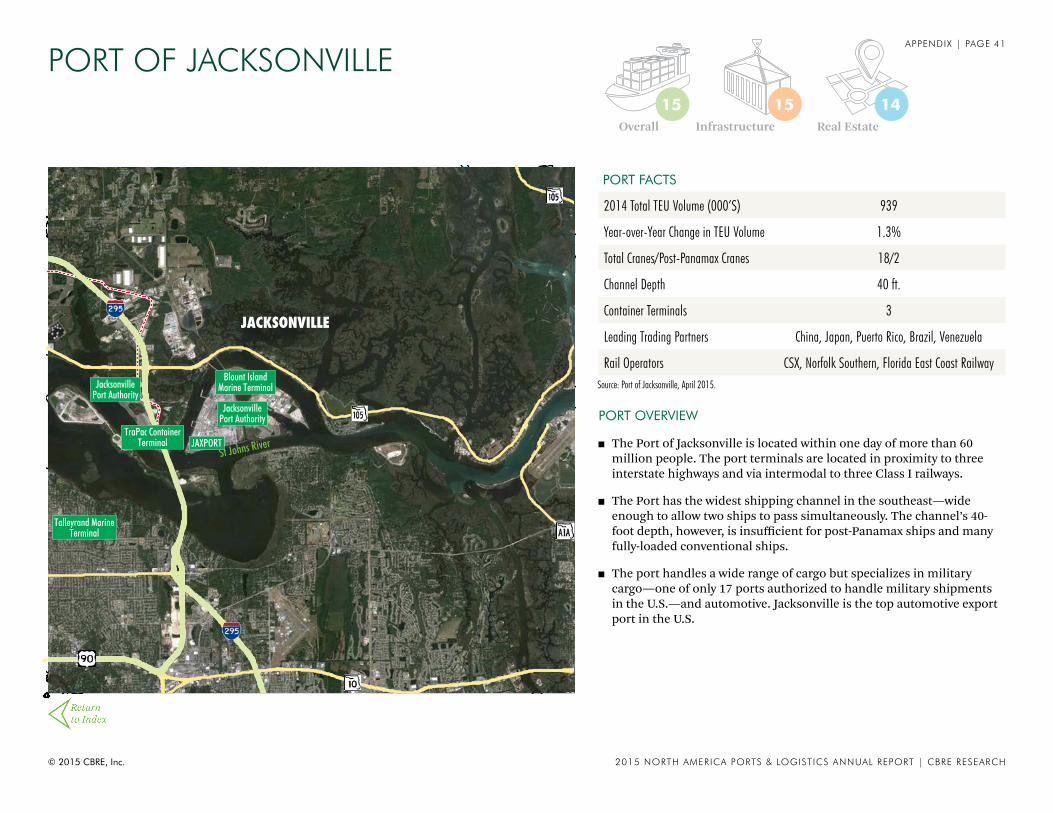
© 2015 CBRE, Inc. 2015 NORTH AMERICA PORTS & LOGISTICS ANNUAL REPORT | CBRE RESEARCH
41 APPENDIX | PAGE
St Johns River
AtlanticOcean
NEPTUNE BEACH
ATLANTICBEACH
JACKSONVILLE
JacksonvillePort Authority
JacksonvillePort Authority
JAXPORTTraPac Container
Terminal
Talleyrand MarineTerminal
Blount IslandMarine Terminal
PORT OF JACKSONVILLE
PORT OVERVIEW
◼ The Port of Jacksonville is located within one day of more than 60 million people. The port terminals are located in proximity to three interstate highways and via intermodal to three Class I railways.
◼ The Port has the widest shipping channel in the southeast—wide enough to allow two ships to pass simultaneously. The channel’s 40-foot depth, however, is insufficient for post-Panamax ships and many fully-loaded conventional ships.
◼ The port handles a wide range of cargo but specializes in military cargo—one of only 17 ports authorized to handle military shipments in the U.S.—and automotive. Jacksonville is the top automotive export port in the U.S.
PORT FACTS
2014 Total TEU Volume (000’S) 939
Year-over-Year Change in TEU Volume 1.3%
Total Cranes/Post-Panamax Cranes 18/2
Channel Depth 40 ft.
Container Terminals 3
Leading Trading Partners China, Japan, Puerto Rico, Brazil, Venezuela
Rail Operators CSX, Norfolk Southern, Florida East Coast RailwaySource: Port of Jacksonville, April 2015.
Overall Infrastructure Real Estate
141515
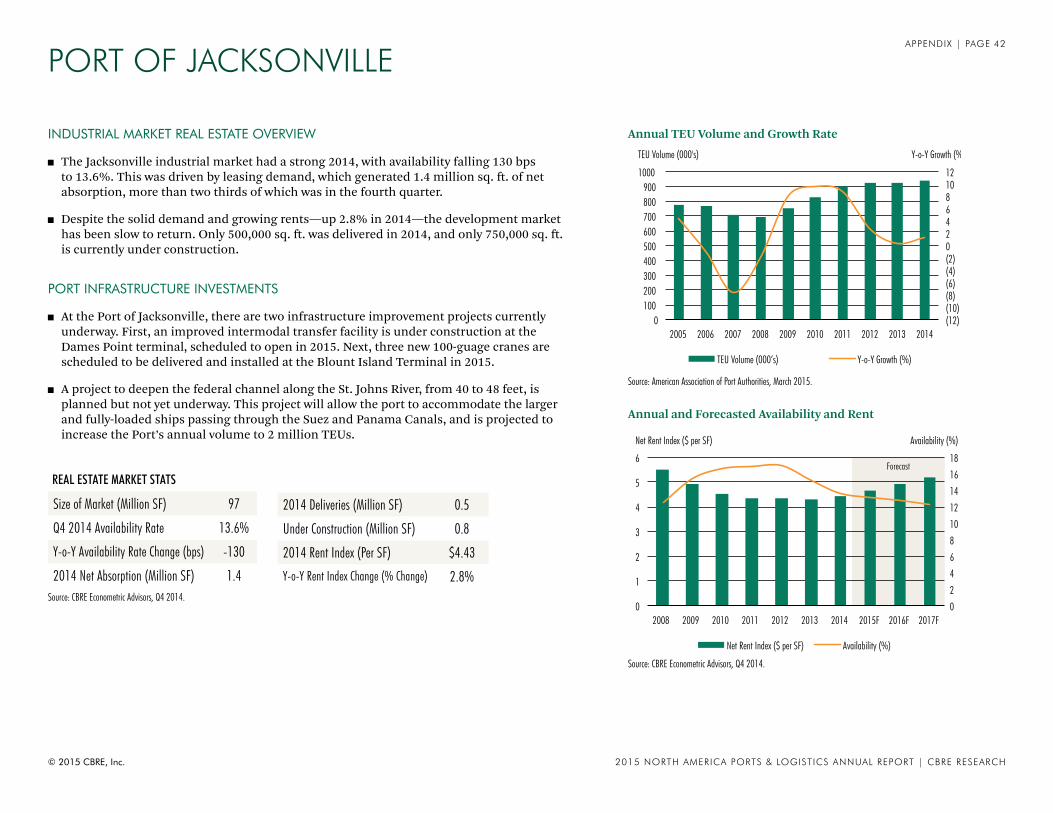
© 2015 CBRE, Inc. 2015 NORTH AMERICA PORTS & LOGISTICS ANNUAL REPORT | CBRE RESEARCH
42 APPENDIX | PAGE
INDUSTRIAL MARKET REAL ESTATE OVERVIEW
◼ The Jacksonville industrial market had a strong 2014, with availability falling 130 bps to 13.6%. This was driven by leasing demand, which generated 1.4 million sq. ft. of net absorption, more than two thirds of which was in the fourth quarter.
◼ Despite the solid demand and growing rents—up 2.8% in 2014—the development market has been slow to return. Only 500,000 sq. ft. was delivered in 2014, and only 750,000 sq. ft. is currently under construction.
PORT INFRASTRUCTURE INVESTMENTS
◼ At the Port of Jacksonville, there are two infrastructure improvement projects currently underway. First, an improved intermodal transfer facility is under construction at the Dames Point terminal, scheduled to open in 2015. Next, three new 100-guage cranes are scheduled to be delivered and installed at the Blount Island Terminal in 2015.
◼ A project to deepen the federal channel along the St. Johns River, from 40 to 48 feet, is planned but not yet underway. This project will allow the port to accommodate the larger and fully-loaded ships passing through the Suez and Panama Canals, and is projected to increase the Port’s annual volume to 2 million TEUs.
PORT OF JACKSONVILLE
REAL ESTATE MARKET STATS
Size of Market (Million SF) 97
Q4 2014 Availability Rate 13.6%
Y-o-Y Availability Rate Change (bps) -130
2014 Net Absorption (Million SF) 1.4
2014 Deliveries (Million SF) 0.5
Under Construction (Million SF) 0.8
2014 Rent Index (Per SF) $4.43
Y-o-Y Rent Index Change (% Change) 2.8%
Forecast
Port of Jacksonville
(12) (10) (8) (6) (4) (2) 0 2 4 6 8 10 12
0 100 200 300 400 500 600 700 800 900
1000
2005 2006 2007 2008 2009 2010 2011 2012 2013 2014
Y-o-Y Growth (%) TEU Volume (000's)
TEU Volume (000’s) Y-o-Y Growth (%)
0
2
4
6
8
10
12
14
16
18
0
1
2
3
4
5
6
2008 2009 2010 2011 2012 2013 2014 2015F 2016F 2017F
Availability (%) Net Rent Index ($ per SF)
Net Rent Index ($ per SF) Availability (%)
Source: CBRE Econometric Advisors, Q4 2014.
Annual and Forecasted Availability and Rent
Source: American Association of Port Authorities, March 2015.
Annual TEU Volume and Growth Rate
Source: CBRE Econometric Advisors, Q4 2014.

© 2015 CBRE, Inc. 2015 NORTH AMERICA PORTS & LOGISTICS ANNUAL REPORT | CBRE RESEARCH
43PAGE
CONTACTS
Disclaimer: Information contained herein, including projections, has been obtained from sources believed to be reliable. While we do not doubt its accuracy, we have not verified it and make no guarantee, warranty or representation about it. It is your responsibility to confirm independently its accuracy and completeness. This information is presented exclusively for use by CBRE clients and professionals and all rights to the material are reserved and cannot be reproduced without prior written permission of CBRE.
To learn more about CBRE Research, or to access additional research reports, please visit the Global Research Gateway at www.cbre.com/researchgateway. Additional U.S. Research from CBRE can be found here.
PORTS LOGISTIC GROUP
CBRE’s Port Logistics group is a specialty practice comprised of industrial specialists with an emphasis toward the knowledge and workings of the nation’s seaports and the critical component that the ports play within the overall supply chain. Additional information can be found at www.cbre.us/services/industrial/port-logistics.
Kurt StrasmannSenior Managing Director Port Logistics Group, U.S.+1 714 371 [email protected]
Gary BaragonaDirector, Research and Analysis+1 213 613 [email protected]
Scott MarshallExecutive Managing Director Industrial Services, Americas+1 630 573 [email protected] Scott on Twitter: @S_R_Marshall
David EganAmericas Head of Industrial Research+1 312 935 [email protected] Follow David on Twitter: @Egan2David
Brian ReedResearch Manager+1 864 527 [email protected]
Spencer G. LevyAmericas Head of Research+1 410 951 [email protected] Spencer on Twitter: @SpencerGLevy
Matt CiampaSenior EconomistCBRE Econometric Advisors+1 617 912 [email protected]
FOR MORE INFORMATION REGARDING CBRE RESEARCH, PLEASE CONTACT: