Embed Size (px)
Citation preview

RESEARCH & FORECAST REPORT
DARWIN COMMERCIAL
H2 2014 | COMMERCIAL
www.colliersnt.com.au
2015: Steady ahead...
MARKET HIGHLIGHTS
• Stable capital values
• Slower volume of sales transactions
• CBD office vacancy rates trend higher
COMMERCIAL MARKET OVERVIEW
By the end of 2014, the Darwin commercial market reflected some cooling conditions
with a lower volume of transactions. Over the six month period from July to December
2014 there were 70 transactions recorded with a total sales value of $97.6 million.
By comparison in the first half of 2014, there were 85 transactions recorded with a
slightly lower total sales value of $95.1 million. The higher sales total was attributed to
several larger industrial sales which helped boost the overall figures.
“ Darwin’s strong construction and resource sector is a
significant contributor to economic activity….”
The majority of sales recorded continued to be of an industrial nature, and comprised
approximately 77% of all sales. This steady flow of industrial sales is clearly reflective of
Darwin’s strong construction and resource sector, which is a significant contributor to
economic activity in the Northern Territory.
Capital values for commercial property in Darwin are expected to remain relatively
unchanged in the first half of 2015. In terms of yields, most transactions have recorded
yields between 7.5% to 10%.
MARKET FORECASTS 6 MONTHS
OVERALL PERFORMANCE
TRANSACTION ACTIVTY
SUPPLY
DEMAND
SENTIMENT
YIELDS
ECONOMIC GROWTH
INFRASTRUCTURE
POPULATION GROWTH
The Darwin CBD and Waterfront Precinct has seen
renewed levels of development activity
SECTOR 6 MONTHS
INDUSTRIAL
DEVELOPMENT
OFFICE
RETAIL
COLLIERS INTERNATIONAL —P. 2
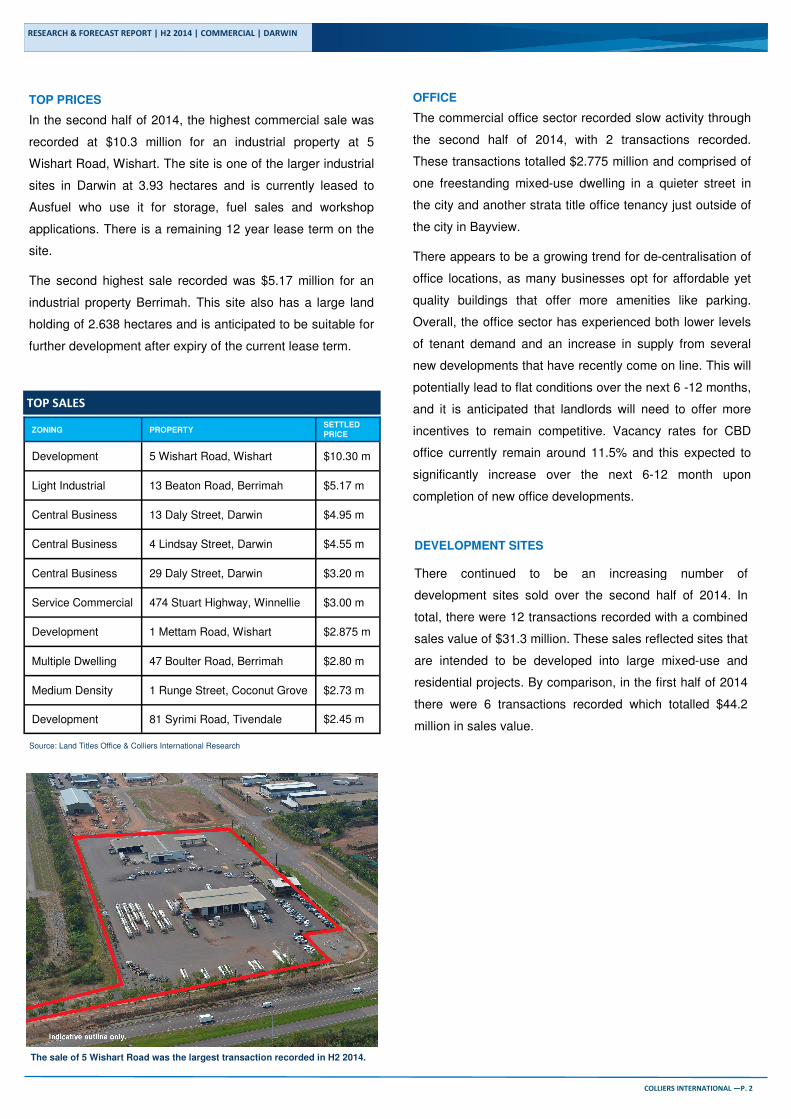
TOP PRICES
In the second half of 2014, the highest commercial sale was
recorded at $10.3 million for an industrial property at 5
Wishart Road, Wishart. The site is one of the larger industrial
sites in Darwin at 3.93 hectares and is currently leased to
Ausfuel who use it for storage, fuel sales and workshop
applications. There is a remaining 12 year lease term on the
site.
The second highest sale recorded was $5.17 million for an
industrial property Berrimah. This site also has a large land
holding of 2.638 hectares and is anticipated to be suitable for
further development after expiry of the current lease term.
ZONING PROPERTY SETTLED
PRICE
Development 5 Wishart Road, Wishart $10.30 m
Light Industrial 13 Beaton Road, Berrimah $5.17 m
Central Business 13 Daly Street, Darwin $4.95 m
Central Business 4 Lindsay Street, Darwin $4.55 m
Central Business 29 Daly Street, Darwin $3.20 m
Service Commercial 474 Stuart Highway, Winnellie $3.00 m
Development 1 Mettam Road, Wishart $2.875 m
Development 81 Syrimi Road, Tivendale $2.45 m
Multiple Dwelling 47 Boulter Road, Berrimah $2.80 m
Medium Density 1 Runge Street, Coconut Grove $2.73 m
TOP SALES
RESEARCH & FORECAST REPORT | H2 2014 | COMMERCIAL | DARWIN
Source: Land Titles Office & Colliers International Research
OFFICE
The commercial office sector recorded slow activity through
the second half of 2014, with 2 transactions recorded.
These transactions totalled $2.775 million and comprised of
one freestanding mixed-use dwelling in a quieter street in
the city and another strata title office tenancy just outside of
the city in Bayview.
There appears to be a growing trend for de-centralisation of
office locations, as many businesses opt for affordable yet
quality buildings that offer more amenities like parking.
Overall, the office sector has experienced both lower levels
of tenant demand and an increase in supply from several
new developments that have recently come on line. This will
potentially lead to flat conditions over the next 6 -12 months,
and it is anticipated that landlords will need to offer more
incentives to remain competitive. Vacancy rates for CBD
office currently remain around 11.5% and this expected to
significantly increase over the next 6-12 month upon
completion of new office developments.
The sale of 5 Wishart Road was the largest transaction recorded in H2 2014.
DEVELOPMENT SITES
There continued to be an increasing number of
development sites sold over the second half of 2014. In
total, there were 12 transactions recorded with a combined
sales value of $31.3 million. These sales reflected sites that
are intended to be developed into large mixed-use and
residential projects. By comparison, in the first half of 2014
there were 6 transactions recorded which totalled $44.2
million in sales value.

COLLIERS INTERNATIONAL — P. 3
STRATA INDUSTRIAL
The sale of strata units typically acts as a strong submarket
within the industrial sector, however in the second half of
2014 strata unit sales showed slower sales activity. In total
there were 21 strata industrial sales which contributed
approximately $6.8 million to the overall value of industrial
sales. By comparison in the first half of 2014, there 54
strata unit sales with a total sales value of approximately
$19 million. It appears that strata units continue to maintain
their popularity with owner-occupiers and investors as an
easy way to break into the market. With abundant supply
and the current low interest rates, purchasing a strata
industrial unit is a feasible option for small businesses.
The majority of strata sales continued to be priced under
$500,000 in the second half of 2014. The highest price
achieved for a strata unit was $805,000 for 2/5 Tivendale
Road Berrimah, which comprised of a larger 728 square
metre holding.
This was followed by a sale of $630,000 for a property at
6/7 Caryota Court, Coconut Grove.
Rates for strata industrial titled property have slowed with
older stock currently achieving between $1500 - $2000 per
square metre and newer stock achieving between $2000 to
$3200 per square metre. Returns are expected to remain
steady over the next 6 months with yields ranging from
7.5% for new stock to 9% for older stock. There is potential
for an oversupply situation to occur in this market as some
larger strata industrial developments are completed in the
first half of 2015.
RESEARCH & FORECAST REPORT | H2 2014| COMMERCIAL | DARWIN
INDUSTRIAL
In what has now become the norm in the commercial
market, the industrial sector achieved the most sales
activity in the second half of 2014. The total sales value of
all industrial property was $62 million and comprised of 54
transactions. By comparison, in the first half of 2014 there
75 industrial transactions with a total sales value of $46.6
million.
As highlighted previously, the two largest industrial sales in
the second half of 2014 were $10.3 million for 5 Wishart
Road and $5.17 million for 13 Beaton Road, Berrimah.
Theses sales are reflective of the on-going steady demand
for well-located industrial properties with strong lease
covenants and large land holdings.
Rental growth for industrial property is anticipated to
remain stable over the next 12 months and yields are
expected to stay in the vicinity of 8% to 10% depending on
the quality, size, lease covenants and location of the
property.
The Gulf Centre on Coonawarra Road offers both corporate and
industrial tenancies
www.colliersnt.com.au
OUTLOOK
The Reserve Bank of Australia has recently lowered the official cash rate to a new
record low of 2.25%, in line with slower economic conditions and in particular as a
result of the winding back of resource projects. The RBA had maintained a long period
of stability, however given the fall of commodity prices along with lower growth in
demand and significant increase in supply, the rate reduction was deemed necessary
to help boost the economy and achieve balanced growth. Several leading economists,
predict that there may be a second interest rate reduction in the coming months.
According to the Territory Economic Review, in 2013-14 the NT recorded the
strongest economic growth rate of all jurisdictions at 6.5%. The Territory also
continues to benefit from a highly engaged workforce, with the unemployment rate the
lowest of all jurisdictions and reported at 3.6 % in December 2014. This compared to
a 6.2 % unemployment rate nationally.
“The Territory continues to benefit from a highly engaged workforce,
with the unemployment rate the lowest of all jurisdictions ….”
Favorable employment conditions along with a strong public administration and
construction sector, have ensured that there is a steady flow of economic activity. In
particular, private capital expenditure was reported to have increased by 8.0 % to
$11.8 billion, which is the highest level on record. This expenditure included $ 8.6
billion which was spent on a large number of major projects such as the INPEX
Ichthys Project, the expansion of the McArthur Rive zinc-lead mine, the Marine Supply
Base and the Darwin Correctional Precinct. In addition to this, private residential
construction also contributed to the Territory’s economic growth with a record number
of houses and apartment complexes coming on line in Darwin and Palmerston.
The resilience of the Darwin market is likely to be tested in 2015; as buyers are more
likely to have more stock to choose from and as rental levels stabilise. We believe
there is reason to remain cautiously optimistic, however mindful that we are in a small
market where even the slightest variations can be misconstrued as a trend when in
effect we have one of the best economic rankings in Australia. As a result modest
transactional activity in the commercial sector is expected over the next 6 months.
Information Sources:
Easy Access, ABS, Land Titles Office, REINT, NT Treasury, Territory Economic Review, RP Data, Colliers International Research Darwin
RESEARCH & FORECAST REPORT | H2 2014 | COMMERCIAL | DARWIN
1430 employees in
43 offices throughout Australia and New Zealand
12,300 employees in
522 offices worldwide in
62 countries
Accelerating success
COLLIERS INTERNATIONAL
396 Stuart Highway
Winnellie, NT, 0820
TEL 08 8997 0888
FAX 08 8997 0899
RESEARCHER
Lianna Georges
Research Analyst
EMAIL [email protected]
Colliers International does not give any warranty in
relation to the accuracy of the information contained
in this report. If you intend to rely upon the
information contained herein, you must take note that
the information, figures and projections have been
provided by various sources and have not been
verified by us. We have no belief one way or the
other in relation to the accuracy of such information,
figures and projections. Colliers International will not
be liable for any loss or damage resulting from any
statement figure, calculation or any other information
that you rely upon that is contained in the material.
COPYRIGHT - 2015