Embed Size (px)
Citation preview
CBRE CAP RATE SURVEY
Click to Enter
A CBRE Publication First Half 2013
In This Issue:
Overview pg 2
Office pg 8
Multi-housing pg 17
Retail pg 26
Industrial pg 36
Hotels pg 41
Appendix pg 44
IN THIS ISSUE:
Overview
Office
Multi-housing
Retail
Industrial
Hotels
Appendix
Cap Rate Survey First Half 2013
2
<< | >>United States | Overview
The 10-year Treasury (UST) was measurably lower than 2% from April 2012 through early May of this year, but this recent period of record-low
interest rates could not last forever. Between May 1 and August 1, 2013, the 10-year UST shot up 110 basis points (bps) due to fears of an early
end to the Federal Reserve Bank’s Quantitative Easing (QE) program. The expectation of many market participants today is that interest rates will
be moving even higher than current levels. The possibility of such further increases weighs heavily on the minds of commercial real estate investors.
Interest rates will certainly be moving higher than they are today—that concept is accepted as a given by most investors. What really matters for
commercial real estate performance is where interest rates will ultimately settle, and what factors are driving these rate increases. There are some
positive forces behind at least a portion of the interest rate increase, and these forces can help offset the impact on asset values.
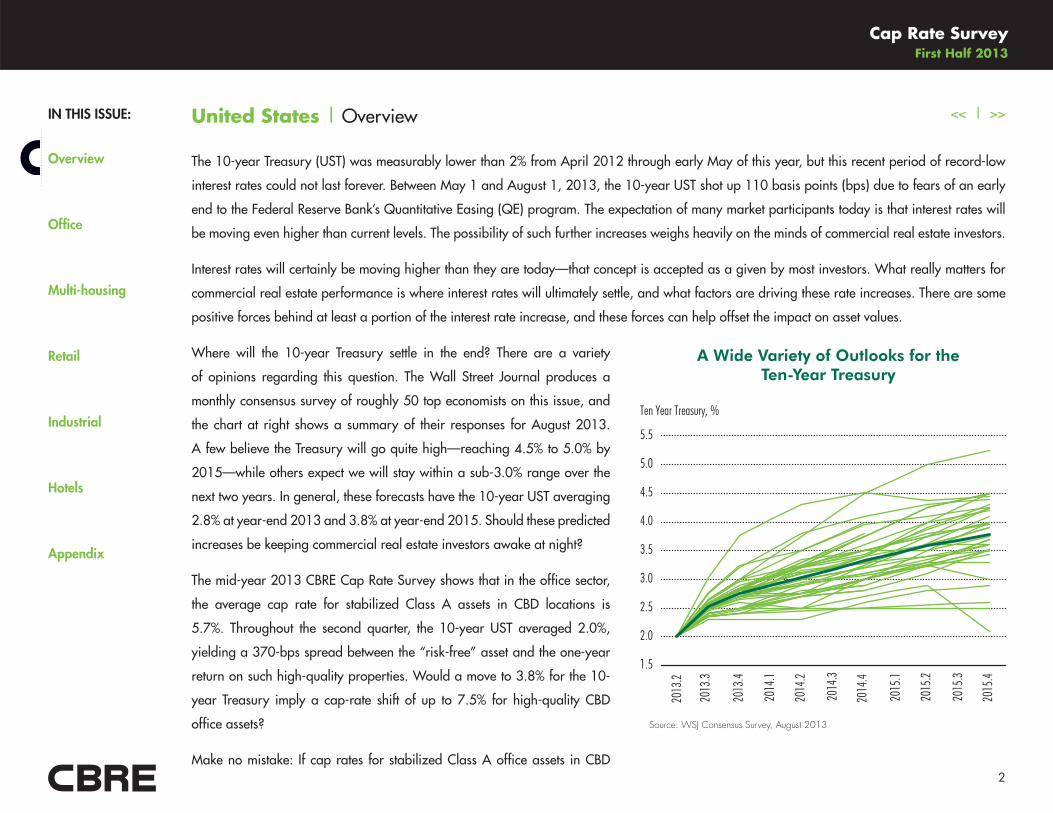
Where will the 10-year Treasury settle in the end? There are a variety
of opinions regarding this question. The Wall Street Journal produces a
monthly consensus survey of roughly 50 top economists on this issue, and
the chart at right shows a summary of their responses for August 2013.
A few believe the Treasury will go quite high—reaching 4.5% to 5.0% by
2015—while others expect we will stay within a sub-3.0% range over the
next two years. In general, these forecasts have the 10-year UST averaging
2.8% at year-end 2013 and 3.8% at year-end 2015. Should these predicted
increases be keeping commercial real estate investors awake at night?
The mid-year 2013 CBRE Cap Rate Survey shows that in the office sector,
the average cap rate for stabilized Class A assets in CBD locations is
5.7%. Throughout the second quarter, the 10-year UST averaged 2.0%,
yielding a 370-bps spread between the “risk-free” asset and the one-year
return on such high-quality properties. Would a move to 3.8% for the 10-
year Treasury imply a cap-rate shift of up to 7.5% for high-quality CBD
office assets?
Make no mistake: If cap rates for stabilized Class A office assets in CBD
1.5
2.0
2.5
3.0
3.5
4.0
4.5
5.0
5.5
2013
.2
2013
.3
2013
.4
2014
.1
2014
.2
2014
.3
2014
.4
2015
.1
2015
.2
2015
.3
2015
.4
Ten Year Treasury, %
A Wide Variety of Outlooks for the Ten-Year Treasury
Source: WSJ Consensus Survey, August 2013
IN THIS ISSUE:
Overview
Office
Multi-housing
Retail
Industrial
Hotels
Appendix
Cap Rate Survey First Half 2013
3
<< | >>United States | Overview (continued)
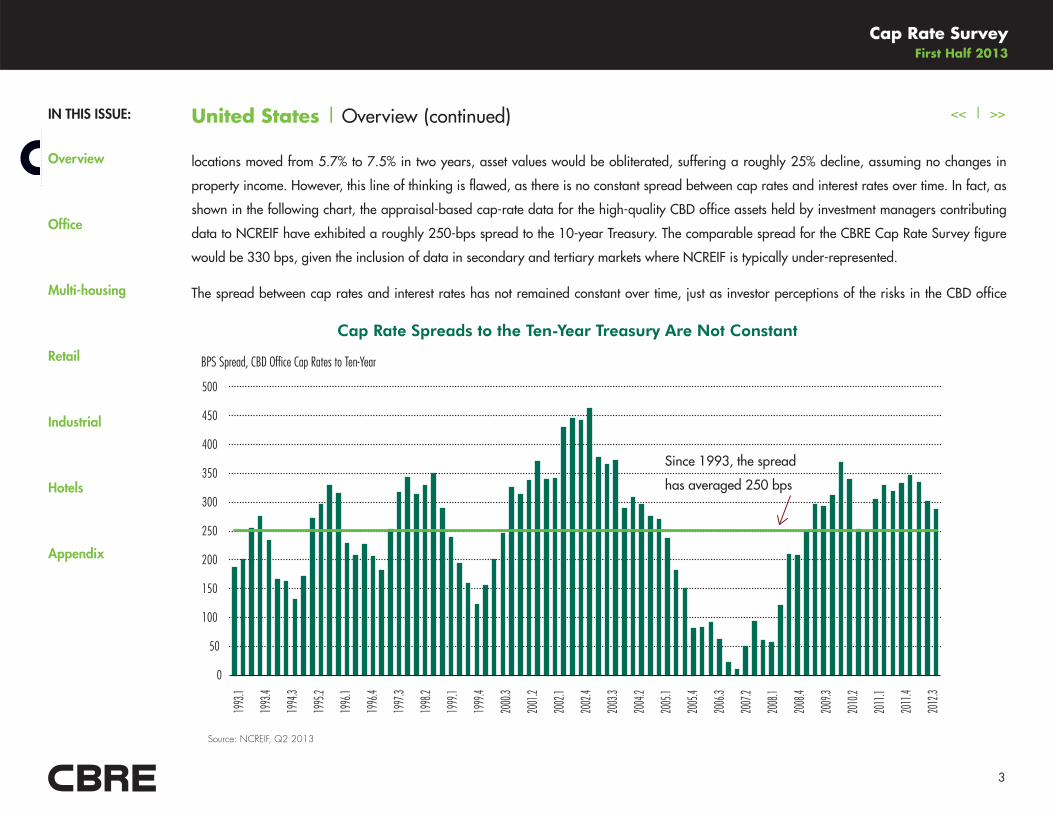
locations moved from 5.7% to 7.5% in two years, asset values would be obliterated, suffering a roughly 25% decline, assuming no changes in
property income. However, this line of thinking is flawed, as there is no constant spread between cap rates and interest rates over time. In fact, as
shown in the following chart, the appraisal-based cap-rate data for the high-quality CBD office assets held by investment managers contributing
data to NCREIF have exhibited a roughly 250-bps spread to the 10-year Treasury. The comparable spread for the CBRE Cap Rate Survey figure
would be 330 bps, given the inclusion of data in secondary and tertiary markets where NCREIF is typically under-represented.
The spread between cap rates and interest rates has not remained constant over time, just as investor perceptions of the risks in the CBD office
Cap Rate Spreads to the Ten-Year Treasury Are Not Constant
0
50
100
150
200
250
300
350
400
450
500
1993
.1
1993
.4
1994
.3
1995
.2
1996
.1
1996
.4
1997
.3
1998
.2
1999
.1
1999
.4
2000
.3
2001
.2
2002
.1
2002
.4
2003
.3
2004
.2
2005
.1
2005
.4
2006
.3
2007
.2
2008
.1
2008
.4
2009
.3
2010
.2
2011
.1
2011
.4
2012
.3
BPS Spread, CBD Office Cap Rates to Ten-Year
Since 1993, the spread
has averaged 250 bps
Source: NCREIF, Q2 2013
IN THIS ISSUE:
Overview
Office
Multi-housing
Retail
Industrial
Hotels
Appendix
Cap Rate Survey First Half 2013
4
<< | >>United States | Overview (continued)
sector have not remained constant. This is true for all major property sectors, with the perception of risk rising and falling. This perception of risk is
still at a high level relative to the long-term trend, as limited job growth creates some hesitancy around future income given the prospects of leasing
space at higher rents.
This hesitancy is where the positive forces behind the interest-rate increases surface. While low interest rates early in 2013 can be partially
attributed to the QE program helping to hold down the long end of the yield curve, the low levels were also due to investors’ expectations for only
moderate job growth and for limited hiring and investment activity on the part of corporate America. The market consensus is that the Fed will start
tapering the QE program in September 2013; however, the tapering may be delayed if economic indicators become less positive.
Beyond 2013, interest rate increases will be more heavily driven by the fact that investors will have more attractive alternatives for their investment
capital than to warehouse it in the safety of government debt. Firms will be deploying capital to grow their businesses with investments such as
taking on new workers. CBRE’s Econometric Advisors business unit (CBRE-EA) is forecasting that U.S. job growth will expand to an average monthly
pace of 175,000 in 2014 and 2015 as the recovery gains momentum. To put this figure in context, in the 2003-to-2006 timeframe, an average of
129,000 jobs were added per month.
Because of this accelerating job growth, moving forward we expect the income side of commercial property investing to accelerate. For instance,
CBRE-EA is forecasting that rent growth in the CBD office market nationally will average 3.6% per year over the next two years, and 4.0% per
year over the next five. This expansion is stemming from a combination of limited construction and a recovery in job growth that is pushing down
vacancy rates and providing asset managers more leverage in negotiating lease renewals.
As income grows and leasing becomes more steady, the spread between cap rates and the “risk-free” rate should continue to compress from the
current high levels. If, for example, the spread between the CBRE Cap Rate Survey Class A CBD office benchmark compressed to just the long-
term 330-bps spread by the end of 2015 (again, assuming no income changes along the way), an investment in the current environment would
experience value deterioration of 20%. While better than a 25% loss, a 20% loss would still be quite painful.
IN THIS ISSUE:
Overview
Office
Multi-housing
Retail
Industrial
Hotels
Appendix
Cap Rate Survey First Half 2013
5
<< | >>
A contrary perspective is that cap rates have much more room to fall over the next two years. In previous periods of recovery to expansion, the
spread did not fall to the long-term average and stop there—and it is not likely to do so this time around either. Because of the unwinding of the
deleveraging process that has hampered the U.S. economy throughout the recession, there is in the current environment an expectation that more
debt will become available in the coming years, providing greater investment capital for real estate.
Factoring in the impact of increased debt availability moving forward, CBRE-EA forecasts that cap rates will fall even further below their long-term
levels by 2015. In the case of the Class A CBD office market, this compression would suggest that cap rates will reach the 6.3% level by the end
of 2014. While such an increase would represent a 10% loss of value if there were no income changes to accompany the cap rate expansion, we
expect the market itself to see 3.6%-per-year rent growth over the next two years. This rent growth will help to cushion the cap-rate induced change
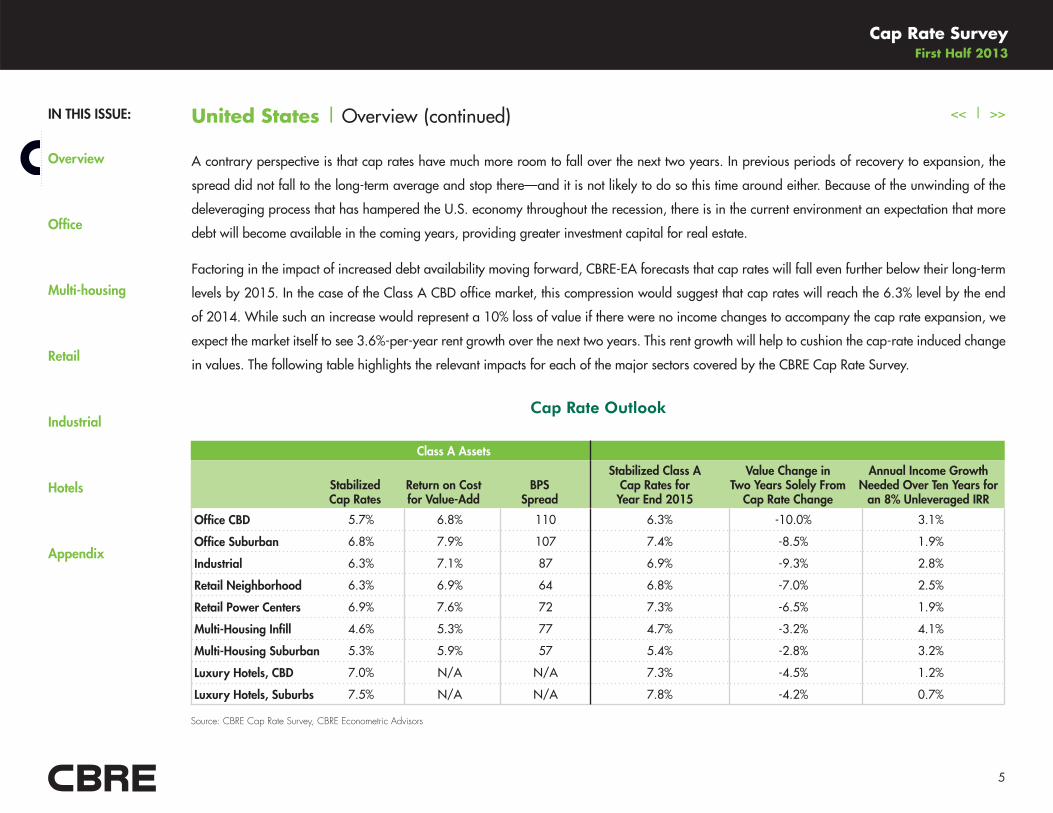
in values. The following table highlights the relevant impacts for each of the major sectors covered by the CBRE Cap Rate Survey.
Class A Assets
Stabilized Cap Rates
Return on Cost for Value-Add
BPS Spread
Stabilized Class A Cap Rates for Year End 2015
Value Change in Two Years Solely From
Cap Rate Change
Annual Income Growth Needed Over Ten Years for
an 8% Unleveraged IRR
Office CBD 5.7% 6.8% 110 6.3% -10.0% 3.1%
Office Suburban 6.8% 7.9% 107 7.4% -8.5% 1.9%
Industrial 6.3% 7.1% 87 6.9% -9.3% 2.8%
Retail Neighborhood 6.3% 6.9% 64 6.8% -7.0% 2.5%
Retail Power Centers 6.9% 7.6% 72 7.3% -6.5% 1.9%
Multi-Housing Infill 4.6% 5.3% 77 4.7% -3.2% 4.1%
Multi-Housing Suburban 5.3% 5.9% 57 5.4% -2.8% 3.2%
Luxury Hotels, CBD 7.0% N/A N/A 7.3% -4.5% 1.2%
Luxury Hotels, Suburbs 7.5% N/A N/A 7.8% -4.2% 0.7%
United States | Overview (continued)
Cap Rate Outlook
Source: CBRE Cap Rate Survey, CBRE Econometric Advisors
IN THIS ISSUE:
Overview
Office
Multi-housing
Retail
Industrial
Hotels
Appendix
Cap Rate Survey First Half 2013
6
<< | >>
The income growth needed to cushion the loss in value that should be seen from cap rate expansion would be somewhat high relative to historical
trends over a two-year period for the core-like stabilized Class A assets. Over an extended holding period however, the short term impact of cap
rate changes can be cushioned more fully with years of income growth. Given the more extended forecast for cap rates from the CBRE-EA team,
over a 10-year period, the income growth needed to achieve an 8% unleveraged IRR is well below the rate of inflation for most of the property
sectors highlighted in the preceding table.
By mid-year 2013, the office vacancy rate was at 15.2% nationally, versus 15.8% for mid-year 2012. This 60-bps decline in the office vacancy rate
came about from declining vacancy in both CBD and suburban submarkets, though the bulk of the decline stemmed from the suburban submarkets.
The vacancy rate for CBD submarkets fell 40 bps from one year earlier to hit 12.3%. The vacancy rate for suburban submarkets fell more quickly,
however, dropping some 70 bps from a year earlier to hit 16.8%. Overall, there is still more slack capacity in the suburban submarkets, for while
the current 16.8% is far better than the 18.7% level seen in 2010, it is still higher than the 16.1% average recorded since 1988. CBD vacancy
rates, by contrast, are now below the long-term average of 12.8%. The increasing pace of suburban vacancy declines and the slack capacity that
still exists provide an opportunity for investors looking to generate additional income by taking on the leasing risks of office assets in suburban
submarkets.
Industrial availability was at 12.0% nationally at mid-year 2013. This level is well above the long-term average availability rate of 10%. While
these figures suggest a fair amount of slack capacity in the industrial markets, average asking rents are actually rising, having posted a 4.4%
increase over the year-earlier period. One of the issues influencing the availability rate is the significant amount of functionally obsolete space built
into the overall availability figure.
Some markets are outperforming on the income side: Key distribution hubs like the Inland Empire and Dallas have seen annual growth in asking
rents of 12.1% and 11.5%, respectively. Meanwhile, metro areas where the industrial market is focused on the high-tech sector such as San
Francisco and San Jose have seen asking-rent growth in excess of 7%.
The retail sector has lagged other property types throughout the recovery period. However, retail leasing is now catching up with other property
sectors, and availability rates are down 60 bps from a year earlier, having fallen to 12.3% by mid-year 2013. This improvement has come about
despite a fairly weak recovery in demand; net absorption in the first half of 2013 averaged roughly 67% of the peak levels seen from 2005 to
2007. Still, while demand remains tepid, the growth in supply has been even weaker—only 8% of the 2005-to-2007 levels.
United States | Overview (continued)
IN THIS ISSUE:
Overview
Office
Multi-housing
Retail
Industrial
Hotels
Appendix
Cap Rate Survey First Half 2013
7
<< | >>
When reviewing the income potential of the retail sector, the results of our Cap Rate Survey suggest two patterns in investor behavior. Surprisingly,
the markets with the largest inventory have the lowest cap rates. Chicago, Houston, Atlanta and Los Angeles have cap rates ranging from 5.8% to
6.1% for stabilized Class A neighborhood centers. Investors always place value on the exit liquidity implied by larger markets. Some markets stand
out from this pattern, however, with a few gateway markets posting lower cap rates, even if they are smaller than other major markets. Boston,
Miami and Seattle have stabilized Class A cap rates for neighborhood centers below 6%, while San Francisco has a 4.9% cap rate.
Multi-housing continues to enjoy the healthiest fundamentals among the main property sectors. Vacancy stood at 5.0% at mid-year 2013, down
from 5.2% a year earlier. The long-term average vacancy rate for the sector is anywhere between 5% and 6%, and as demand continues to
grow, rents are climbing as well, albeit at a slower pace. Effective market rents are up 3.1% from a year earlier, but rents were up nearly 5% in
2011. Renters can absorb only so much of a rent increase. Still, while rents are not growing as quickly as they had in the past, cap rates for the
multi-housing sector are the lowest among the major property sectors. For Class A stabilized assets in urban locations, cap rates came in at 3.5%
for mid-year 2013 in Los Angeles and 3.9% in San Diego. Suburban assets in markets like San Francisco, San Diego, Los Angeles and Orange
County have stabilized Class A cap rates below 4.5%.
In the hotel sector the revenue per available room (RevPAR) continued to grow in the first half of 2013. In the full-service segment, RevPAR was up
5.6% from a year earlier, while the limited-service sector was up 7.0% from mid-year 2012. This pace of RevPAR growth is down somewhat since
the start of the economic recovery in 2010. In the limited-service sector, for instance, the average pace of annual RevPAR growth from the middle
of 2010 through the middle of 2012 was 9.0%. The supply of rooms was fairly constrained during that time frame, however. The CBRE Cap Rate
Survey shows that investors are placing the most value on the RevPAR trends from the luxury segments for assets in CBD locations, with an average
7.3% cap rate across markets. The economy segments have an average cap rate of 9.8%, though the range is fairly wide, with markets falling
anywhere from 8.5% to 11.3% on the spectrum.
United States | Overview (continued)
IN THIS ISSUE:
Overview
Office
Multi-housing
Retail
Industrial
Hotels
Appendix
Cap Rate Survey First Half 2013
8
<< | >>Office | Overview
Investment volume in the office sector in the 12 months ending at mid-year 2013 was up 27% compared to the year-earlier period, with total
volume of $88 billion, according to Real Capital Analytics (RCA). To put this figure into perspective, office transaction volume averaged about
$76 billion per year from 2003 to 2005. Volume is still down from the average pace of $176 billion per year recorded in 2006 and 2007, but
those figures represented an artificial high. Suburban submarkets accounted for about 50% of the volume during the past 12 months. This shift is
significant, as that segment has seen sales grow at a slower pace in the early stages of the economic recovery when investors were mostly focused
on CBD office investments.
The CBRE Cap Rate Survey provides insight into how these trends will evolve over the next six months. CBRE Capital Markets and Valuation
professionals expect that across the 40 suburban markets surveyed, cap rates for stabilized Class A assets will remain flat or increase in 33
markets over the next six months. In CBD submarkets, the same basic pattern is in place, with cap rates expected to be flat or expand over the next
six months in 35 of the 41 markets surveyed.
CLICK TO DOWNLOAD
Select from the list below to access the current CBD office key ratios, forecast and interactive map.
Download a Complete Office CBD Current Key Ratios Chart (PDF)
Download a Complete Office CBD Current Forecast Chart (PDF)
Download the Complete Office CBD Current Key Ratios Map (Interactive PDF)
Select from the list below to access the current suburban office key ratios, forecast and interactive map.
Download a Complete Office Suburban Current Key Ratios Chart (PDF)
Download a Complete Office Suburban Current Forecast Chart (PDF)
Download the Complete Office Suburban Current Key Ratios Map (Interactive PDF)
NEW
NEW
IN THIS ISSUE:
Overview
Office
Multi-housing
Retail
Industrial
Hotels
Appendix
Cap Rate Survey First Half 2013
9
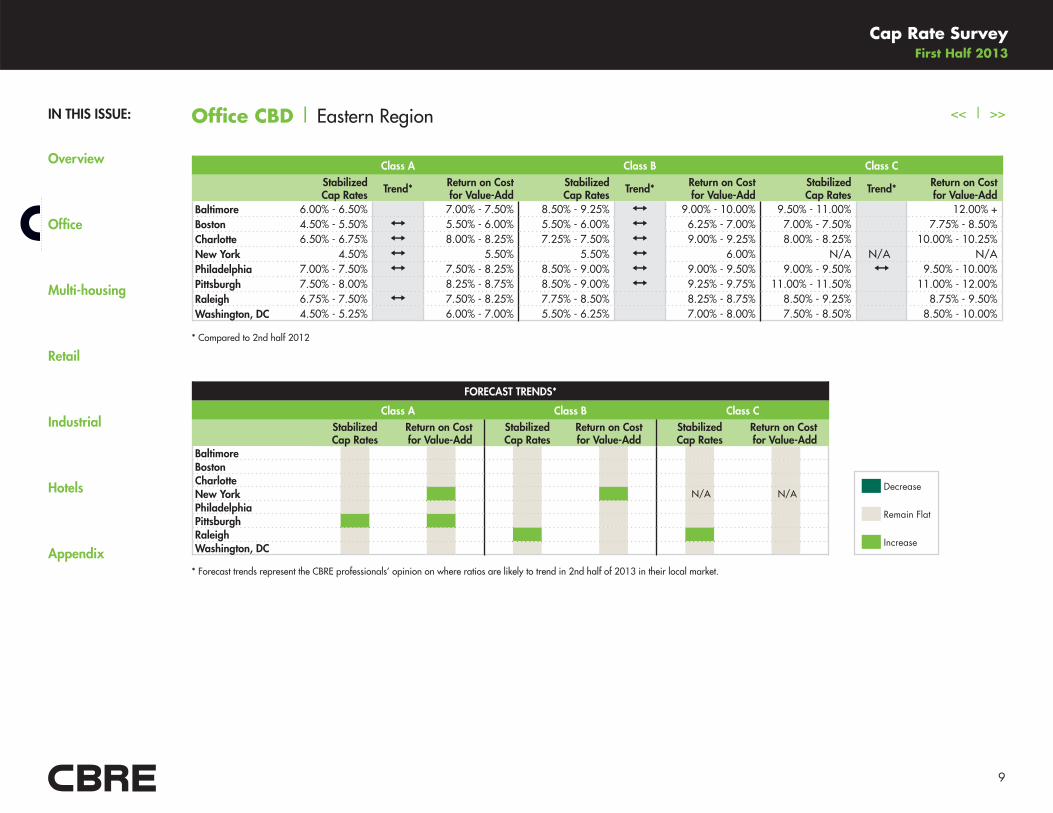
<< | >>Office CBD | Eastern Region
* Compared to 2nd half 2012
Decrease
Remain Flat
Increase
Class A Class B Class CStabilized Cap Rates Trend* Return on Cost
for Value-AddStabilized Cap Rates Trend* Return on Cost
for Value-AddStabilized Cap Rates Trend* Return on Cost
for Value-AddBaltimore 6.00% - 6.50%
�
7.00% - 7.50% 8.50% - 9.25% 9.00% - 10.00% 9.50% - 11.00%
�
12.00% +Boston 4.50% - 5.50% 5.50% - 6.00% 5.50% - 6.00% 6.25% - 7.00% 7.00% - 7.50% � 7.75% - 8.50%Charlotte 6.50% - 6.75% 8.00% - 8.25% 7.25% - 7.50% 9.00% - 9.25% 8.00% - 8.25%
�
10.00% - 10.25%New York 4.50% 5.50% 5.50% 6.00% N/A N/A N/APhiladelphia 7.00% - 7.50% 7.50% - 8.25% 8.50% - 9.00% 9.00% - 9.50% 9.00% - 9.50% 9.50% - 10.00%Pittsburgh 7.50% - 8.00% � 8.25% - 8.75% 8.50% - 9.00% 9.25% - 9.75% 11.00% - 11.50% � 11.00% - 12.00%Raleigh 6.75% - 7.50% 7.50% - 8.25% 7.75% - 8.50%
�
8.25% - 8.75% 8.50% - 9.25%
�
8.75% - 9.50%Washington, DC 4.50% - 5.25%
�
6.00% - 7.00% 5.50% - 6.25%
�
7.00% - 8.00% 7.50% - 8.50% � 8.50% - 10.00%
FORECAST TRENDS*
Class A Class B Class CStabilized Cap Rates
Return on Cost for Value-Add
Stabilized Cap Rates
Return on Cost for Value-Add
Stabilized Cap Rates
Return on Cost for Value-Add
BaltimoreBostonCharlotteNew York N/A N/APhiladelphiaPittsburghRaleighWashington, DC
* Forecast trends represent the CBRE professionals’ opinion on where ratios are likely to trend in 2nd half of 2013 in their local market.
IN THIS ISSUE:
Overview
Office
Multi-housing
Retail
Industrial
Hotels
Appendix
Cap Rate Survey First Half 2013
10
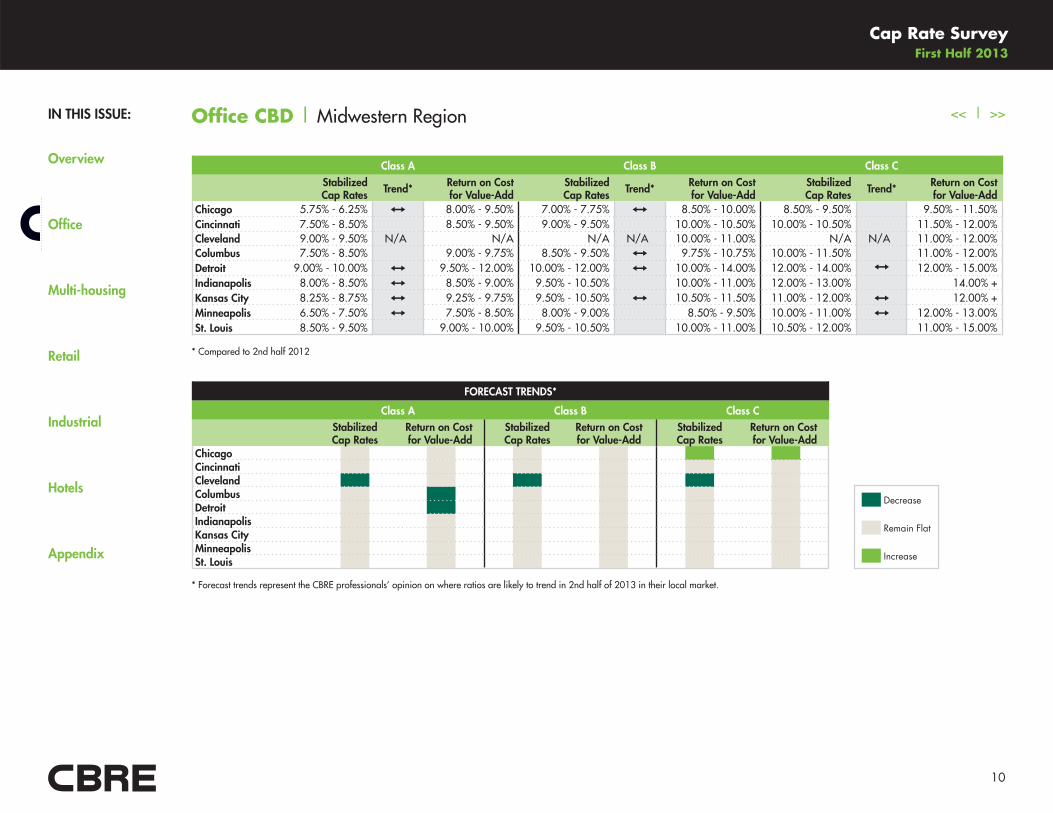
<< | >>Office CBD | Midwestern Region
Decrease
Remain Flat
Increase
* Compared to 2nd half 2012
Class A Class B Class CStabilized Cap Rates Trend* Return on Cost
for Value-AddStabilized Cap Rates Trend* Return on Cost
for Value-AddStabilized Cap Rates Trend* Return on Cost
for Value-Add
FORECAST TRENDS*
Class A Class B Class CStabilized Cap Rates
Return on Cost for Value-Add
Stabilized Cap Rates
Return on Cost for Value-Add
Stabilized Cap Rates
Return on Cost for Value-Add
ChicagoCincinnatiClevelandColumbusDetroitIndianapolisKansas CityMinneapolisSt. Louis
* Forecast trends represent the CBRE professionals’ opinion on where ratios are likely to trend in 2nd half of 2013 in their local market.
Chicago 5.75% - 6.25% 8.00% - 9.50% 7.00% - 7.75% 8.50% - 10.00% 8.50% - 9.50% � 9.50% - 11.50%Cincinnati 7.50% - 8.50%
�
8.50% - 9.50% 9.00% - 9.50%
�
10.00% - 10.50% 10.00% - 10.50%
�
11.50% - 12.00%Cleveland 9.00% - 9.50% N/A N/A N/A N/A 10.00% - 11.00% N/A N/A 11.00% - 12.00%Columbus 7.50% - 8.50% � 9.00% - 9.75% 8.50% - 9.50% 9.75% - 10.75% 10.00% - 11.50%
�
11.00% - 12.00%Detroit 9.00% - 10.00% 9.50% - 12.00% 10.00% - 12.00% 10.00% - 14.00% 12.00% - 14.00% 12.00% - 15.00%Indianapolis 8.00% - 8.50% 8.50% - 9.00% 9.50% - 10.50% � 10.00% - 11.00% 12.00% - 13.00% � 14.00% +Kansas City 8.25% - 8.75% 9.25% - 9.75% 9.50% - 10.50% 10.50% - 11.50% 11.00% - 12.00% 12.00% +Minneapolis 6.50% - 7.50% 7.50% - 8.50% 8.00% - 9.00%
�
8.50% - 9.50% 10.00% - 11.00% 12.00% - 13.00%St. Louis 8.50% - 9.50%
�
9.00% - 10.00% 9.50% - 10.50%
�
10.00% - 11.00% 10.50% - 12.00%
�
11.00% - 15.00%

IN THIS ISSUE:
Overview
Office
Multi-housing
Retail
Industrial
Hotels
Appendix
Cap Rate Survey First Half 2013
11
<< | >>Office CBD | Southern Region
Class A Class B Class CStabilized Cap Rates Trend* Return on Cost
for Value-AddStabilized Cap Rates Trend* Return on Cost
for Value-AddStabilized Cap Rates Trend* Return on Cost
for Value-AddAtlanta 6.50% - 7.50% 7.50% - 8.50% 7.50% - 8.50% 9.00% - 9.50% 8.50% - 10.00% 9.50% - 11.50%Austin 5.50% - 6.25% 6.50% - 7.00% 7.00% - 7.50% 7.50% - 8.00% 7.75% - 8.50%
�
8.25% - 8.75%Dallas 6.00% - 7.50% 6.00% - 8.00% 8.00% - 9.00% 8.00% - 10.00% 9.00% - 11.00%
�
10.00% - 12.00%Houston 5.00% - 6.50% 6.50% - 7.00% 6.50% - 7.50%
�
7.50% - 8.50% 9.00% 10.00%Jacksonville 8.00% - 8.50% 8.50% - 9.00% 9.00% - 9.50%
�
9.50% - 10.50% 10.50% - 11.00% 11.00% - 12.50%Memphis 8.50% - 9.00% 9.00% - 10.00% 9.00% - 10.00% 10.00% - 11.00% 11.00% - 12.00% 12.00% +Miami 5.50% - 6.25% 6.50% - 7.50% 6.25% - 7.00% 6.75% - 7.75% 7.00% - 7.50% 7.50% - 8.50%Nashville 6.50% - 7.00% 7.50% - 8.00% 8.00% - 8.50% 9.00% - 9.50% 9.00% - 9.50% 10.00% - 10.50%Orlando 7.00% - 7.50% � 7.50% - 8.00% 7.50% - 8.50% 8.00% - 9.00% 8.00% - 9.00%
�
9.00% - 10.00%San Antonio 6.50% - 7.00%
�
7.00% - 7.50% 8.00% - 8.75% 8.75% - 9.25% 10.00% - 11.00% 11.00% - 12.00%Tampa 6.50% - 7.50% 7.50% - 8.50% 8.00% - 9.25% 8.75% - 9.75% 9.25% - 10.25% 9.75% - 10.75%
* Compared to 2nd half 2012
Decrease
Remain Flat
Increase
* Forecast trends represent the CBRE professionals’ opinion on where ratios are likely to trend in 2nd half of 2013 in their local market.
FORECAST TRENDS*
Class A Class B Class CStabilized Cap Rates
Return on Cost for Value-Add
Stabilized Cap Rates
Return on Cost for Value-Add
Stabilized Cap Rates
Return on Cost for Value-Add
AtlantaAustinDallasHoustonJacksonvilleMemphisMiamiNashvilleOrlandoSan AntonioTampa
IN THIS ISSUE:
Overview
Office
Multi-housing
Retail
Industrial
Hotels
Appendix
Cap Rate Survey First Half 2013
12
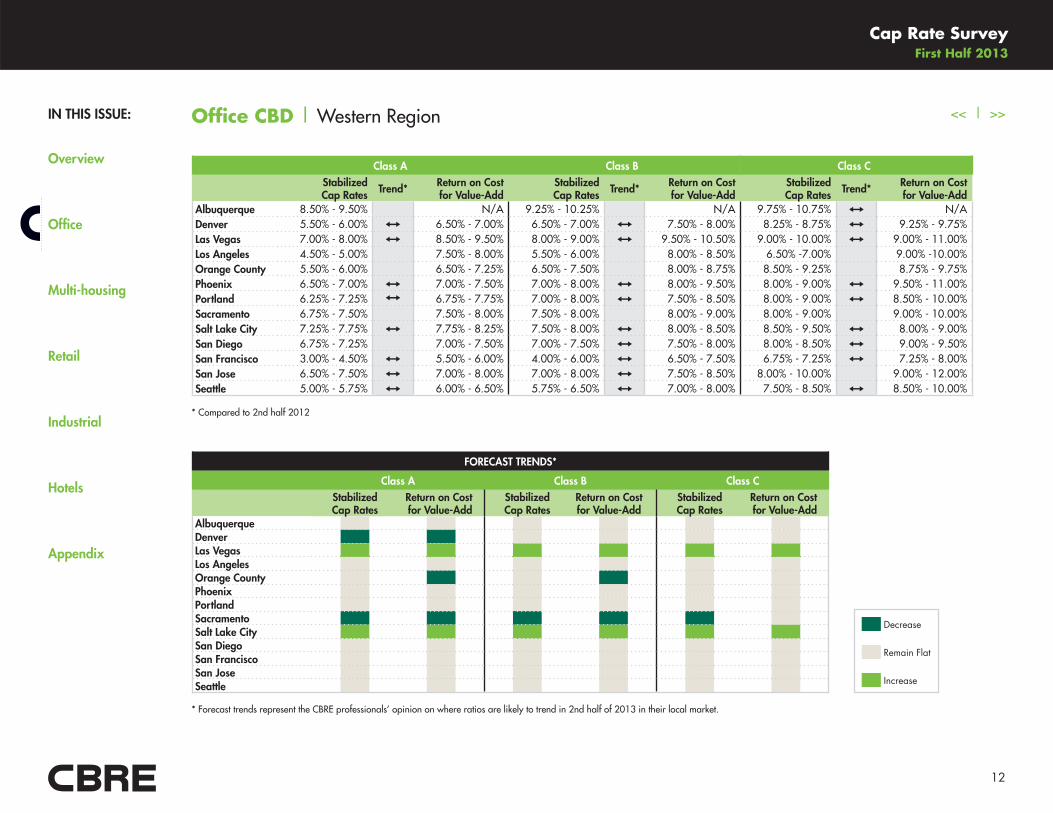
<< | >>Office CBD | Western Region
Decrease
Remain Flat
Increase
Class A Class B Class CStabilized Cap Rates Trend* Return on Cost
for Value-AddStabilized Cap Rates Trend* Return on Cost
for Value-AddStabilized Cap Rates Trend* Return on Cost
for Value-AddAlbuquerque 8.50% - 9.50% � N/A 9.25% - 10.25% � N/A 9.75% - 10.75% N/ADenver 5.50% - 6.00% 6.50% - 7.00% 6.50% - 7.00% 7.50% - 8.00% 8.25% - 8.75% 9.25% - 9.75%Las Vegas 7.00% - 8.00% 8.50% - 9.50% 8.00% - 9.00% 9.50% - 10.50% 9.00% - 10.00% 9.00% - 11.00%Los Angeles 4.50% - 5.00%
�
7.50% - 8.00% 5.50% - 6.00%
�
8.00% - 8.50% 6.50% -7.00%
�
9.00% -10.00%Orange County 5.50% - 6.00%
�
6.50% - 7.25% 6.50% - 7.50%
�
8.00% - 8.75% 8.50% - 9.25%
�
8.75% - 9.75%Phoenix 6.50% - 7.00% 7.00% - 7.50% 7.00% - 8.00% 8.00% - 9.50% 8.00% - 9.00% 9.50% - 11.00%Portland 6.25% - 7.25% 6.75% - 7.75% 7.00% - 8.00% 7.50% - 8.50% 8.00% - 9.00% 8.50% - 10.00%Sacramento 6.75% - 7.50%
�
7.50% - 8.00% 7.50% - 8.00%
�
8.00% - 9.00% 8.00% - 9.00%
�
9.00% - 10.00%Salt Lake City 7.25% - 7.75% 7.75% - 8.25% 7.50% - 8.00% 8.00% - 8.50% 8.50% - 9.50% 8.00% - 9.00%San Diego 6.75% - 7.25% � 7.00% - 7.50% 7.00% - 7.50% 7.50% - 8.00% 8.00% - 8.50% 9.00% - 9.50%San Francisco 3.00% - 4.50% 5.50% - 6.00% 4.00% - 6.00% 6.50% - 7.50% 6.75% - 7.25% 7.25% - 8.00%San Jose 6.50% - 7.50% 7.00% - 8.00% 7.00% - 8.00% 7.50% - 8.50% 8.00% - 10.00% � 9.00% - 12.00%Seattle 5.00% - 5.75% 6.00% - 6.50% 5.75% - 6.50% 7.00% - 8.00% 7.50% - 8.50% 8.50% - 10.00%
* Compared to 2nd half 2012
* Forecast trends represent the CBRE professionals’ opinion on where ratios are likely to trend in 2nd half of 2013 in their local market.
FORECAST TRENDS*
Class A Class B Class CStabilized Cap Rates
Return on Cost for Value-Add
Stabilized Cap Rates
Return on Cost for Value-Add
Stabilized Cap Rates
Return on Cost for Value-Add
AlbuquerqueDenverLas VegasLos AngelesOrange CountyPhoenixPortlandSacramentoSalt Lake CitySan DiegoSan FranciscoSan JoseSeattle
IN THIS ISSUE:
Overview
Office
Multi-housing
Retail
Industrial
Hotels
Appendix
Cap Rate Survey First Half 2013
13
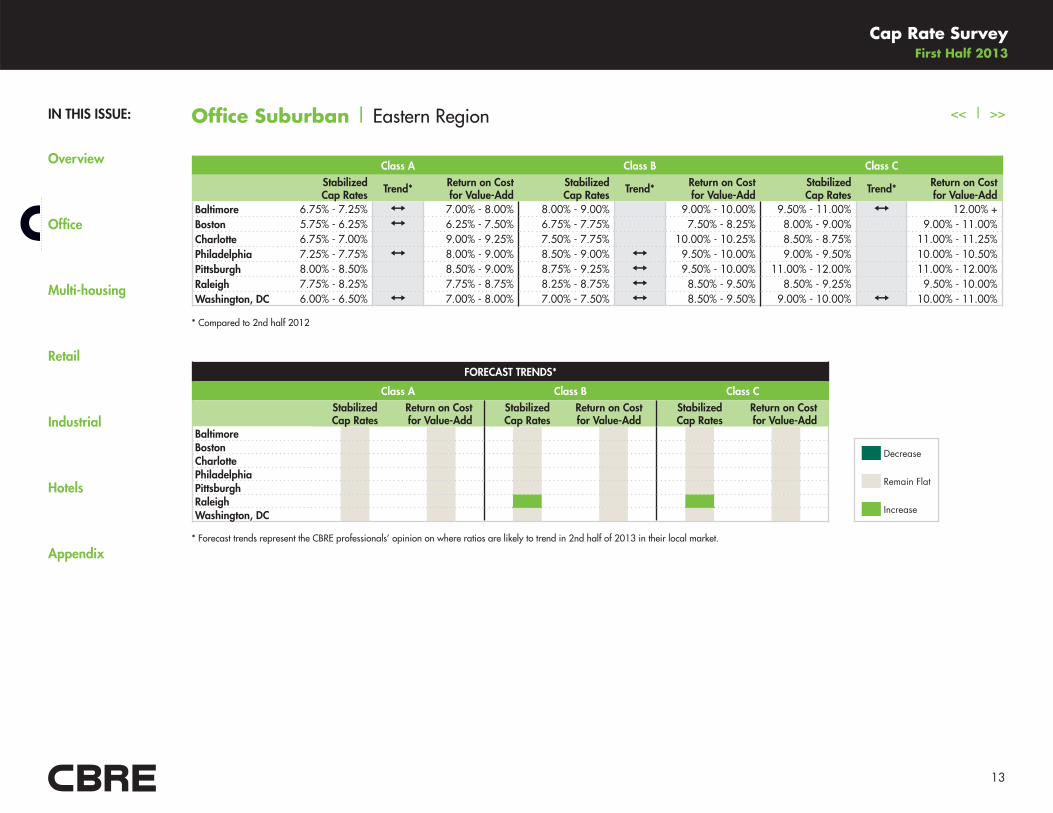
<< | >>Office Suburban | Eastern Region
* Compared to 2nd half 2012
Class A Class B Class CStabilized Cap Rates Trend* Return on Cost
for Value-AddStabilized Cap Rates Trend* Return on Cost
for Value-AddStabilized Cap Rates Trend* Return on Cost
for Value-AddBaltimore 6.75% - 7.25% 7.00% - 8.00% 8.00% - 9.00%
�
9.00% - 10.00% 9.50% - 11.00% 12.00% +Boston 5.75% - 6.25% 6.25% - 7.50% 6.75% - 7.75% � 7.50% - 8.25% 8.00% - 9.00% � 9.00% - 11.00%Charlotte 6.75% - 7.00%
�
9.00% - 9.25% 7.50% - 7.75%
�
10.00% - 10.25% 8.50% - 8.75%
�
11.00% - 11.25%Philadelphia 7.25% - 7.75% 8.00% - 9.00% 8.50% - 9.00% 9.50% - 10.00% 9.00% - 9.50%
�
10.00% - 10.50%Pittsburgh 8.00% - 8.50% � 8.50% - 9.00% 8.75% - 9.25% 9.50% - 10.00% 11.00% - 12.00% � 11.00% - 12.00%Raleigh 7.75% - 8.25% � 7.75% - 8.75% 8.25% - 8.75% 8.50% - 9.50% 8.50% - 9.25%
�
9.50% - 10.00%Washington, DC 6.00% - 6.50% 7.00% - 8.00% 7.00% - 7.50% 8.50% - 9.50% 9.00% - 10.00% 10.00% - 11.00%
Decrease
Remain Flat
Increase
FORECAST TRENDS*
Class A Class B Class CStabilized Cap Rates
Return on Cost for Value-Add
Stabilized Cap Rates
Return on Cost for Value-Add
Stabilized Cap Rates
Return on Cost for Value-Add
BaltimoreBostonCharlottePhiladelphiaPittsburghRaleighWashington, DC
* Forecast trends represent the CBRE professionals’ opinion on where ratios are likely to trend in 2nd half of 2013 in their local market.
IN THIS ISSUE:
Overview
Office
Multi-housing
Retail
Industrial
Hotels
Appendix
Cap Rate Survey First Half 2013
14
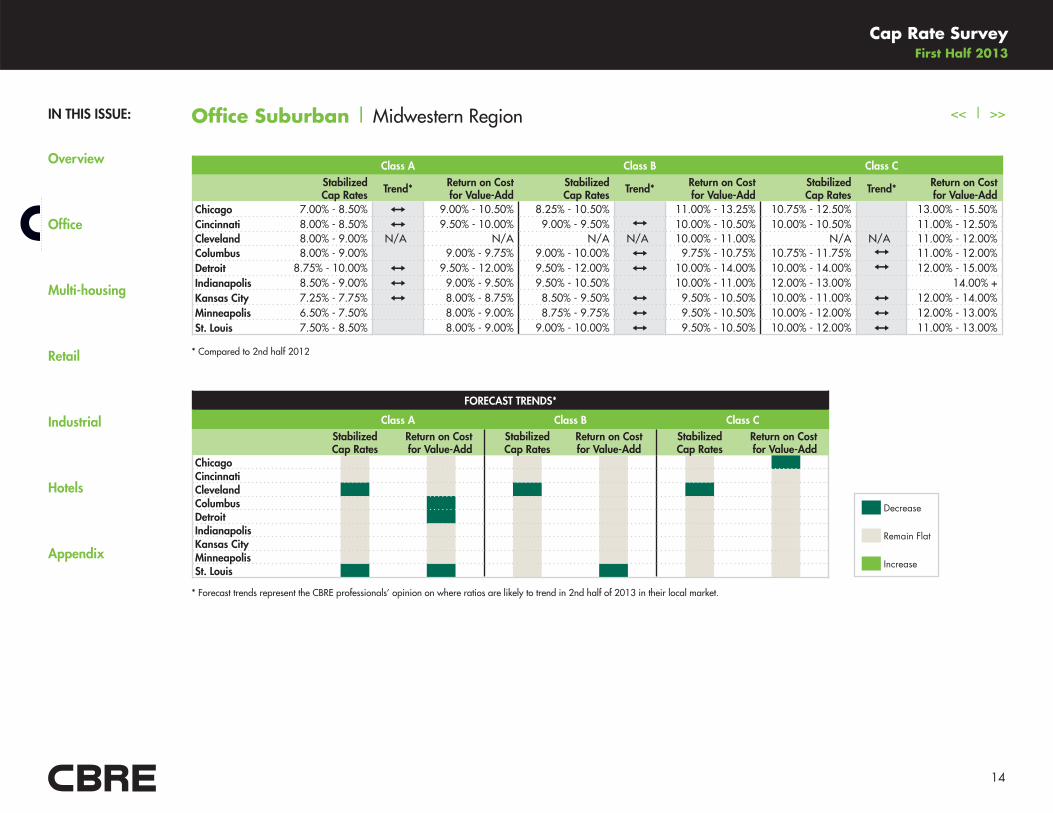
<< | >>Office Suburban | Midwestern Region
Decrease
Remain Flat
Increase
* Compared to 2nd half 2012
Class A Class B Class CStabilized Cap Rates Trend* Return on Cost
for Value-AddStabilized Cap Rates Trend* Return on Cost
for Value-AddStabilized Cap Rates Trend* Return on Cost
for Value-Add
FORECAST TRENDS*
Class A Class B Class CStabilized Cap Rates
Return on Cost for Value-Add
Stabilized Cap Rates
Return on Cost for Value-Add
Stabilized Cap Rates
Return on Cost for Value-Add
ChicagoCincinnatiClevelandColumbusDetroitIndianapolisKansas CityMinneapolisSt. Louis
* Forecast trends represent the CBRE professionals’ opinion on where ratios are likely to trend in 2nd half of 2013 in their local market.
Chicago 7.00% - 8.50% 9.00% - 10.50% 8.25% - 10.50% � 11.00% - 13.25% 10.75% - 12.50%
�
13.00% - 15.50%Cincinnati 8.00% - 8.50% 9.50% - 10.00% 9.00% - 9.50% 10.00% - 10.50% 10.00% - 10.50%
�
11.00% - 12.50%Cleveland 8.00% - 9.00% N/A N/A N/A N/A 10.00% - 11.00% N/A N/A 11.00% - 12.00%Columbus 8.00% - 9.00% � 9.00% - 9.75% 9.00% - 10.00% 9.75% - 10.75% 10.75% - 11.75% 11.00% - 12.00%Detroit 8.75% - 10.00% 9.50% - 12.00% 9.50% - 12.00% 10.00% - 14.00% 10.00% - 14.00% 12.00% - 15.00%Indianapolis 8.50% - 9.00% 9.00% - 9.50% 9.50% - 10.50% � 10.00% - 11.00% 12.00% - 13.00% � 14.00% +Kansas City 7.25% - 7.75% 8.00% - 8.75% 8.50% - 9.50% 9.50% - 10.50% 10.00% - 11.00% 12.00% - 14.00%Minneapolis 6.50% - 7.50%
�
8.00% - 9.00% 8.75% - 9.75% 9.50% - 10.50% 10.00% - 12.00% 12.00% - 13.00%St. Louis 7.50% - 8.50%
�
8.00% - 9.00% 9.00% - 10.00% 9.50% - 10.50% 10.00% - 12.00% 11.00% - 13.00%
IN THIS ISSUE:
Overview
Office
Multi-housing
Retail
Industrial
Hotels
Appendix
Cap Rate Survey First Half 2013
15
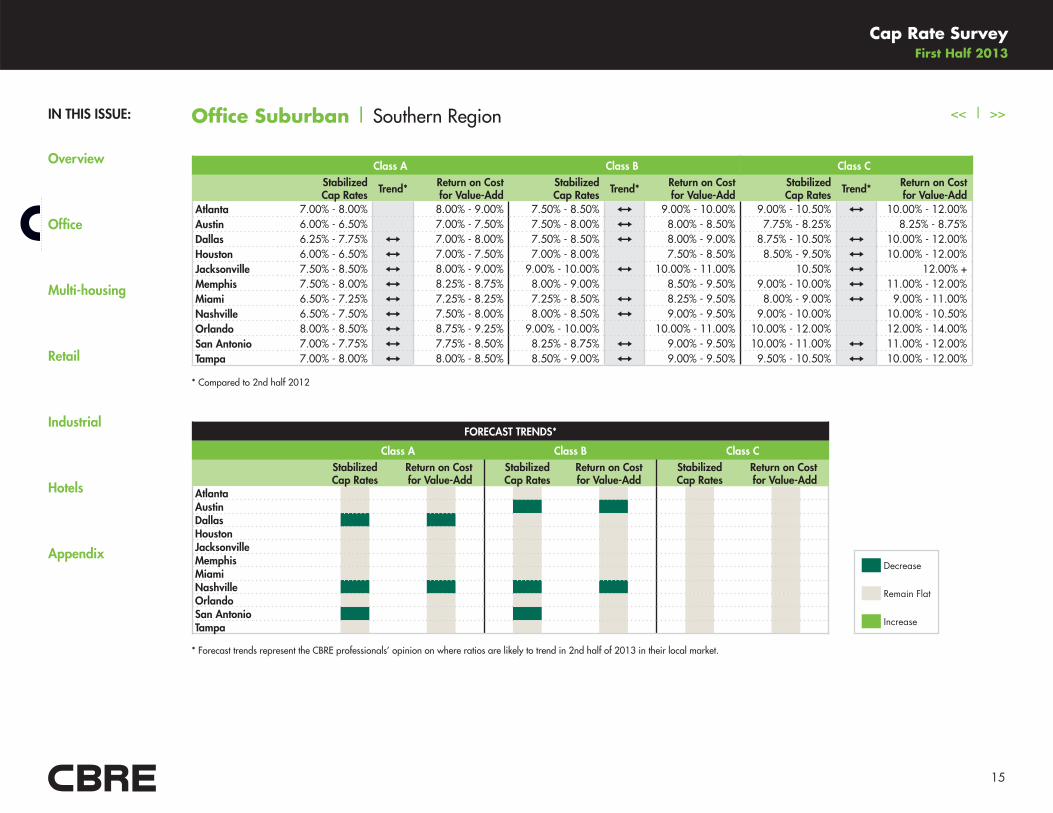
<< | >>Office Suburban | Southern Region
Class A Class B Class CStabilized Cap Rates Trend* Return on Cost
for Value-AddStabilized Cap Rates Trend* Return on Cost
for Value-AddStabilized Cap Rates Trend* Return on Cost
for Value-AddAtlanta 7.00% - 8.00% � 8.00% - 9.00% 7.50% - 8.50% 9.00% - 10.00% 9.00% - 10.50% 10.00% - 12.00%Austin 6.00% - 6.50%
�
7.00% - 7.50% 7.50% - 8.00% 8.00% - 8.50% 7.75% - 8.25%
�
8.25% - 8.75%Dallas 6.25% - 7.75% 7.00% - 8.00% 7.50% - 8.50% 8.00% - 9.00% 8.75% - 10.50% 10.00% - 12.00%Houston 6.00% - 6.50% 7.00% - 7.50% 7.00% - 8.00%
�
7.50% - 8.50% 8.50% - 9.50% 10.00% - 12.00%Jacksonville 7.50% - 8.50% 8.00% - 9.00% 9.00% - 10.00% 10.00% - 11.00% 10.50% 12.00% +Memphis 7.50% - 8.00% 8.25% - 8.75% 8.00% - 9.00%
�
8.50% - 9.50% 9.00% - 10.00% 11.00% - 12.00%Miami 6.50% - 7.25% 7.25% - 8.25% 7.25% - 8.50% 8.25% - 9.50% 8.00% - 9.00% 9.00% - 11.00%Nashville 6.50% - 7.50% 7.50% - 8.00% 8.00% - 8.50% 9.00% - 9.50% 9.00% - 10.00%
�
10.00% - 10.50%Orlando 8.00% - 8.50% 8.75% - 9.25% 9.00% - 10.00% � 10.00% - 11.00% 10.00% - 12.00% � 12.00% - 14.00%San Antonio 7.00% - 7.75% 7.75% - 8.50% 8.25% - 8.75% 9.00% - 9.50% 10.00% - 11.00% 11.00% - 12.00%Tampa 7.00% - 8.00% 8.00% - 8.50% 8.50% - 9.00% 9.00% - 9.50% 9.50% - 10.50% 10.00% - 12.00%
* Compared to 2nd half 2012
Decrease
Remain Flat
Increase
* Forecast trends represent the CBRE professionals’ opinion on where ratios are likely to trend in 2nd half of 2013 in their local market.
FORECAST TRENDS*
Class A Class B Class CStabilized Cap Rates
Return on Cost for Value-Add
Stabilized Cap Rates
Return on Cost for Value-Add
Stabilized Cap Rates
Return on Cost for Value-Add
AtlantaAustinDallasHoustonJacksonvilleMemphisMiamiNashvilleOrlandoSan AntonioTampa
IN THIS ISSUE:
Overview
Office
Multi-housing
Retail
Industrial
Hotels
Appendix
Cap Rate Survey First Half 2013
16
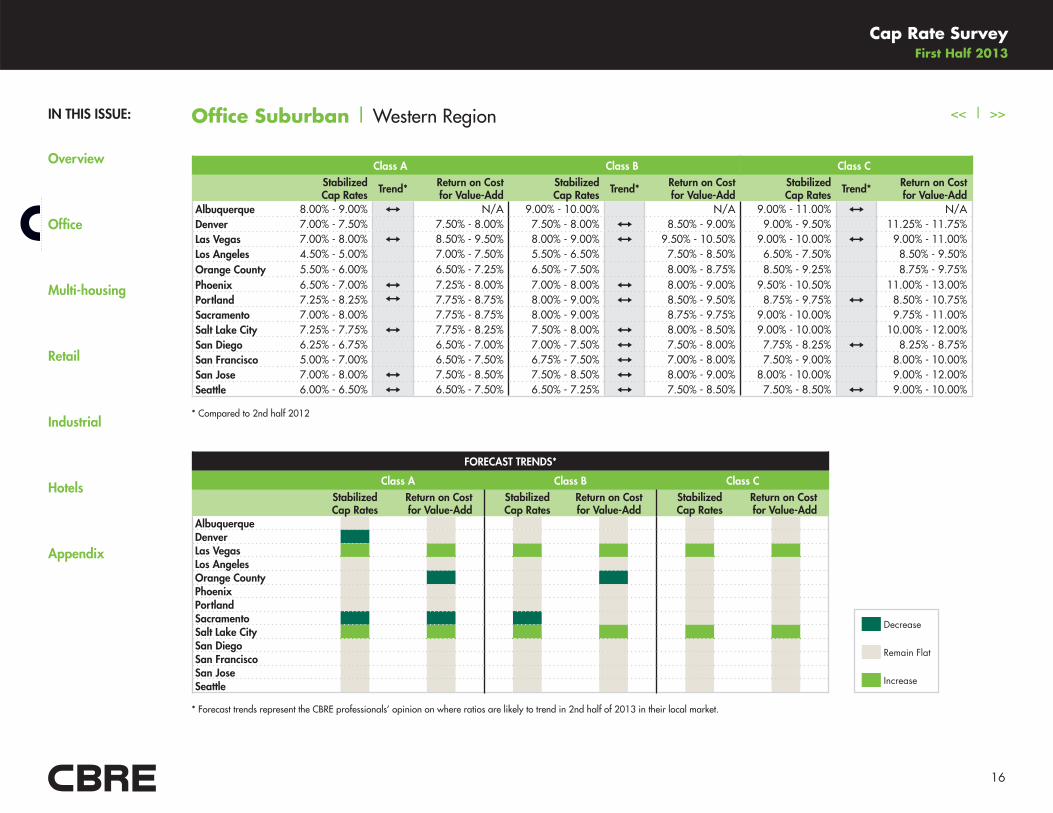
<< | >>Office Suburban | Western Region
Decrease
Remain Flat
Increase
Class A Class B Class CStabilized Cap Rates Trend* Return on Cost
for Value-AddStabilized Cap Rates Trend* Return on Cost
for Value-AddStabilized Cap Rates Trend* Return on Cost
for Value-AddAlbuquerque 8.00% - 9.00% N/A 9.00% - 10.00% � N/A 9.00% - 11.00% N/ADenver 7.00% - 7.50% � 7.50% - 8.00% 7.50% - 8.00% 8.50% - 9.00% 9.00% - 9.50%
�
11.25% - 11.75%Las Vegas 7.00% - 8.00% 8.50% - 9.50% 8.00% - 9.00% 9.50% - 10.50% 9.00% - 10.00% 9.00% - 11.00%Los Angeles 4.50% - 5.00%
�
7.00% - 7.50% 5.50% - 6.50%
�
7.50% - 8.50% 6.50% - 7.50%
�
8.50% - 9.50%Orange County 5.50% - 6.00%
�
6.50% - 7.25% 6.50% - 7.50%
�
8.00% - 8.75% 8.50% - 9.25%
�
8.75% - 9.75%Phoenix 6.50% - 7.00% 7.25% - 8.00% 7.00% - 8.00% 8.00% - 9.00% 9.50% - 10.50%
�
11.00% - 13.00%Portland 7.25% - 8.25% 7.75% - 8.75% 8.00% - 9.00% 8.50% - 9.50% 8.75% - 9.75% 8.50% - 10.75%Sacramento 7.00% - 8.00%
�
7.75% - 8.75% 8.00% - 9.00%
�
8.75% - 9.75% 9.00% - 10.00%
�
9.75% - 11.00%Salt Lake City 7.25% - 7.75% 7.75% - 8.25% 7.50% - 8.00% 8.00% - 8.50% 9.00% - 10.00% � 10.00% - 12.00%San Diego 6.25% - 6.75% � 6.50% - 7.00% 7.00% - 7.50% 7.50% - 8.00% 7.75% - 8.25% 8.25% - 8.75%San Francisco 5.00% - 7.00%
�
6.50% - 7.50% 6.75% - 7.50% 7.00% - 8.00% 7.50% - 9.00% � 8.00% - 10.00%San Jose 7.00% - 8.00% 7.50% - 8.50% 7.50% - 8.50% 8.00% - 9.00% 8.00% - 10.00% � 9.00% - 12.00%Seattle 6.00% - 6.50% 6.50% - 7.50% 6.50% - 7.25% 7.50% - 8.50% 7.50% - 8.50% 9.00% - 10.00%
* Compared to 2nd half 2012
* Forecast trends represent the CBRE professionals’ opinion on where ratios are likely to trend in 2nd half of 2013 in their local market.
FORECAST TRENDS*
Class A Class B Class CStabilized Cap Rates
Return on Cost for Value-Add
Stabilized Cap Rates
Return on Cost for Value-Add
Stabilized Cap Rates
Return on Cost for Value-Add
AlbuquerqueDenverLas VegasLos AngelesOrange CountyPhoenixPortlandSacramentoSalt Lake CitySan DiegoSan FranciscoSan JoseSeattle
IN THIS ISSUE:
Overview
Office
Multi-housing
Retail
Industrial
Hotels
Appendix
Cap Rate Survey First Half 2013
17
<< | >>Multi-housing | Overview
Among all sectors of commercial real estate investment, multi-housing saw the earliest turnaround in investor interest, as the positive trends in income fundamentals seen over the past two years had been widely expected. The stabilizing influence of the debt provided by the government-sponsored enterprises (Freddie Mac and Fannie Mae) was an enormous boost to market liquidity as well. Multi-housing transaction volume for the 12 months ended June 30, 2013 totaled $104 billion, according to RCA. While this figure is still off from the high-water mark of $105.6 billion recorded in 2007, considering the recent pace of growth it is not quite so far from the peak. If transaction velocity continues at the same pace through the second half of the year, the market could see $133 billion in transaction activity for 2013—and set a new high.
CBRE Capital Markets and Valuation professionals expect that, of the 40 markets surveyed, only seven will experience compression in cap rates for Class A stabilized assets in infill locations over the next six months. With the exception of Dallas, the markets where further compression is expected are secondary and tertiary markets. That said, CBRE does not expect further compression in all secondary and tertiary markets. The expectation is that cap rates for Class A stabilized assets will be flat or increase in virtually all suburban submarkets.
CLICK TO DOWNLOAD
Select from the list below to access the current multi-housing infill/urban key ratios, forecast and interactive map.
Download a Complete Multi-housing Infill/Urban Current Key Ratios Chart (PDF)
Download a Complete Multi-housing Infill/Urban Current Forecast Chart (PDF)
Download the Complete Multi-housing Infill/Urban Current Key Ratios Map (Interactive PDF)
Select from the list below to access the current multi-housing suburban key ratios, forecast and interactive map.
Download a Complete Multi-housing Suburban Current Key Ratios Chart (PDF)
Download a Complete Multi-housing Suburban Current Forecast Chart (PDF)
Download the Complete Multi-housing Suburban Current Key Ratios Map (Interactive PDF)
NEW
NEW
IN THIS ISSUE:
Overview
Office
Multi-housing
Retail
Industrial
Hotels
Appendix
Cap Rate Survey First Half 2013
18
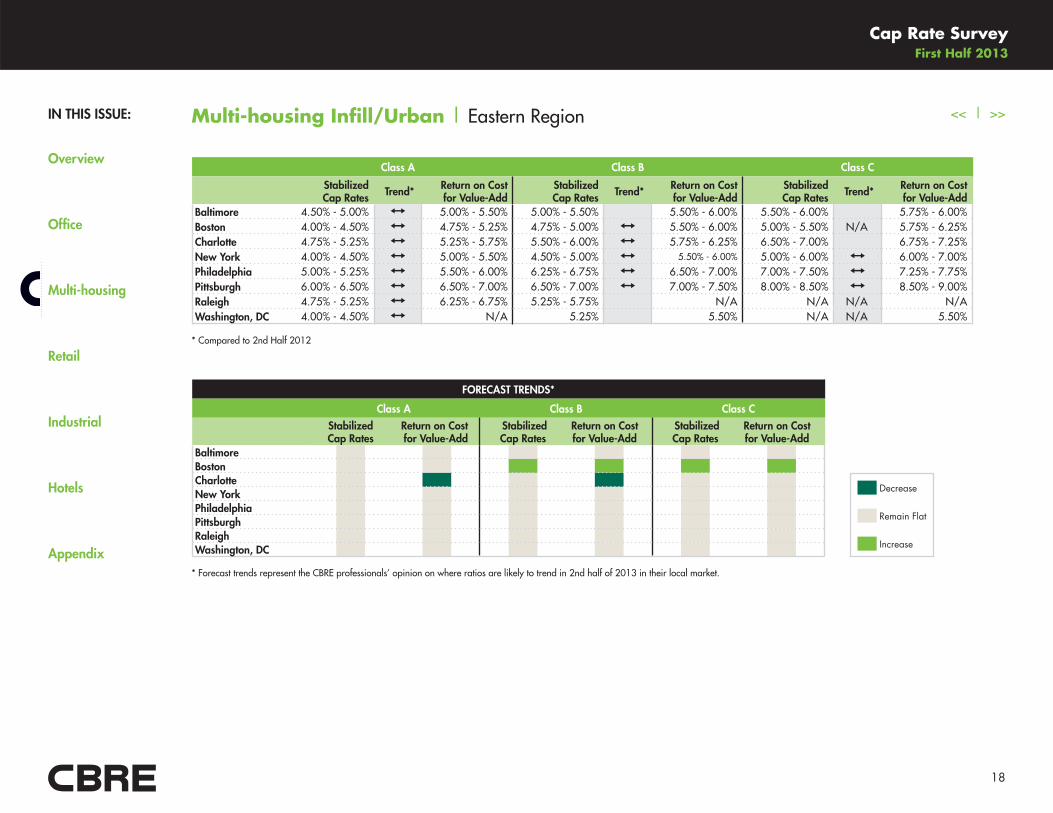
<< | >>Multi-housing Infill/Urban | Eastern Region
Class A Class B Class C
Stabilized Cap Rates Trend* Return on Cost
for Value-AddStabilized Cap Rates Trend* Return on Cost
for Value-AddStabilized Cap Rates Trend* Return on Cost
for Value-AddBaltimore 4.50% - 5.00% 5.00% - 5.50% 5.00% - 5.50%
�
5.50% - 6.00% 5.50% - 6.00%
�
5.75% - 6.00%Boston 4.00% - 4.50% 4.75% - 5.25% 4.75% - 5.00% 5.50% - 6.00% 5.00% - 5.50% N/A 5.75% - 6.25%Charlotte 4.75% - 5.25% 5.25% - 5.75% 5.50% - 6.00% 5.75% - 6.25% 6.50% - 7.00%
�
6.75% - 7.25%New York 4.00% - 4.50% 5.00% - 5.50% 4.50% - 5.00% 5.50% - 6.00% 5.00% - 6.00% 6.00% - 7.00%Philadelphia 5.00% - 5.25% 5.50% - 6.00% 6.25% - 6.75% 6.50% - 7.00% 7.00% - 7.50% 7.25% - 7.75%Pittsburgh 6.00% - 6.50% 6.50% - 7.00% 6.50% - 7.00% 7.00% - 7.50% 8.00% - 8.50% 8.50% - 9.00%Raleigh 4.75% - 5.25% 6.25% - 6.75% 5.25% - 5.75%
�
N/A N/A N/A N/AWashington, DC 4.00% - 4.50% N/A 5.25%
�
5.50% N/A N/A 5.50%
* Compared to 2nd Half 2012
Decrease
Remain Flat
Increase
FORECAST TRENDS*
Class A Class B Class C
Stabilized Cap Rates
Return on Cost for Value-Add
Stabilized Cap Rates
Return on Cost for Value-Add
Stabilized Cap Rates
Return on Cost for Value-Add
BaltimoreBostonCharlotteNew YorkPhiladelphiaPittsburghRaleighWashington, DC
* Forecast trends represent the CBRE professionals’ opinion on where ratios are likely to trend in 2nd half of 2013 in their local market.
IN THIS ISSUE:
Overview
Office
Multi-housing
Retail
Industrial
Hotels
Appendix
Cap Rate Survey First Half 2013
19
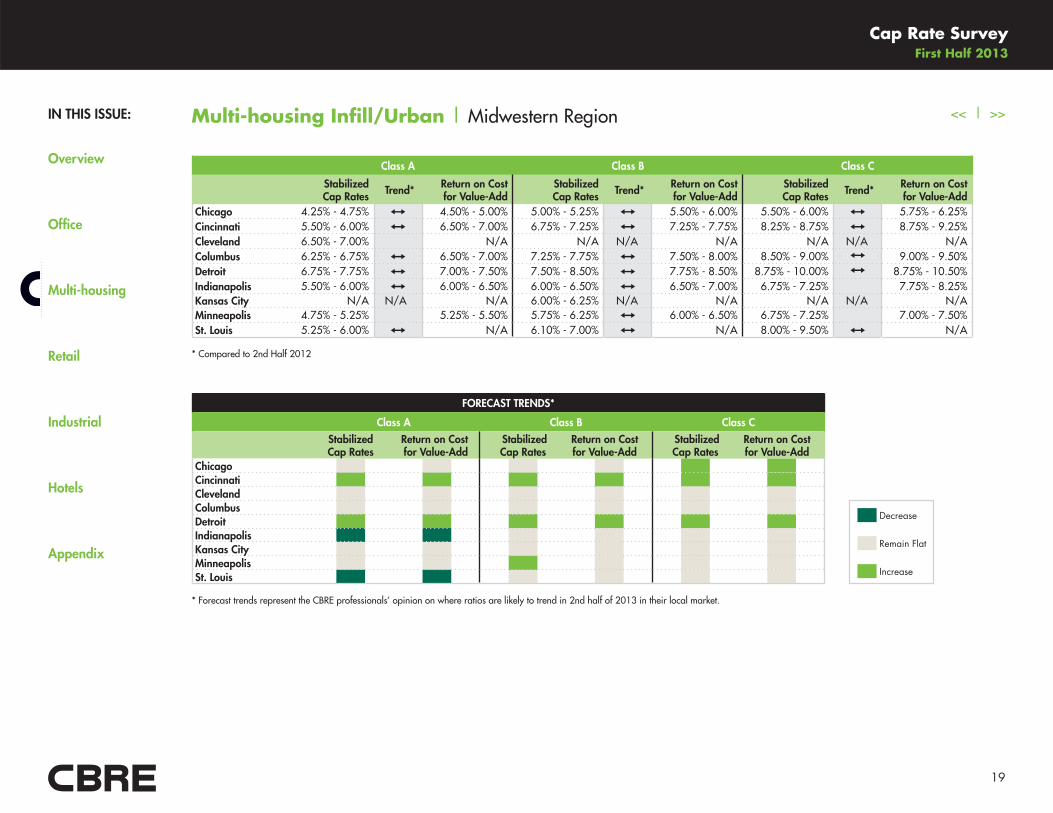
<< | >>Multi-housing Infill/Urban | Midwestern Region
Chicago 4.25% - 4.75% 4.50% - 5.00% 5.00% - 5.25% 5.50% - 6.00% 5.50% - 6.00% 5.75% - 6.25%Cincinnati 5.50% - 6.00% 6.50% - 7.00% 6.75% - 7.25% 7.25% - 7.75% 8.25% - 8.75% 8.75% - 9.25%Cleveland 6.50% - 7.00%
�
N/A N/A N/A N/A N/A N/A N/AColumbus 6.25% - 6.75% 6.50% - 7.00% 7.25% - 7.75% 7.50% - 8.00% 8.50% - 9.00% 9.00% - 9.50%Detroit 6.75% - 7.75% 7.00% - 7.50% 7.50% - 8.50% 7.75% - 8.50% 8.75% - 10.00% 8.75% - 10.50%Indianapolis 5.50% - 6.00% 6.00% - 6.50% 6.00% - 6.50% 6.50% - 7.00% 6.75% - 7.25%
�
7.75% - 8.25%Kansas City N/A N/A N/A 6.00% - 6.25% N/A N/A N/A N/A N/AMinneapolis 4.75% - 5.25%
�
5.25% - 5.50% 5.75% - 6.25% 6.00% - 6.50% 6.75% - 7.25%
�
7.00% - 7.50%St. Louis 5.25% - 6.00% N/A 6.10% - 7.00% N/A 8.00% - 9.50% N/A
Class A Class B Class C
Stabilized Cap Rates Trend* Return on Cost
for Value-AddStabilized Cap Rates Trend* Return on Cost
for Value-AddStabilized Cap Rates Trend* Return on Cost
for Value-Add
* Compared to 2nd Half 2012
FORECAST TRENDS*
Class A Class B Class C
Stabilized Cap Rates
Return on Cost for Value-Add
Stabilized Cap Rates
Return on Cost for Value-Add
Stabilized Cap Rates
Return on Cost for Value-Add
Decrease
Remain Flat
Increase
ChicagoCincinnatiClevelandColumbusDetroitIndianapolisKansas CityMinneapolisSt. Louis
* Forecast trends represent the CBRE professionals’ opinion on where ratios are likely to trend in 2nd half of 2013 in their local market.
IN THIS ISSUE:
Overview
Office
Multi-housing
Retail
Industrial
Hotels
Appendix
Cap Rate Survey First Half 2013
20
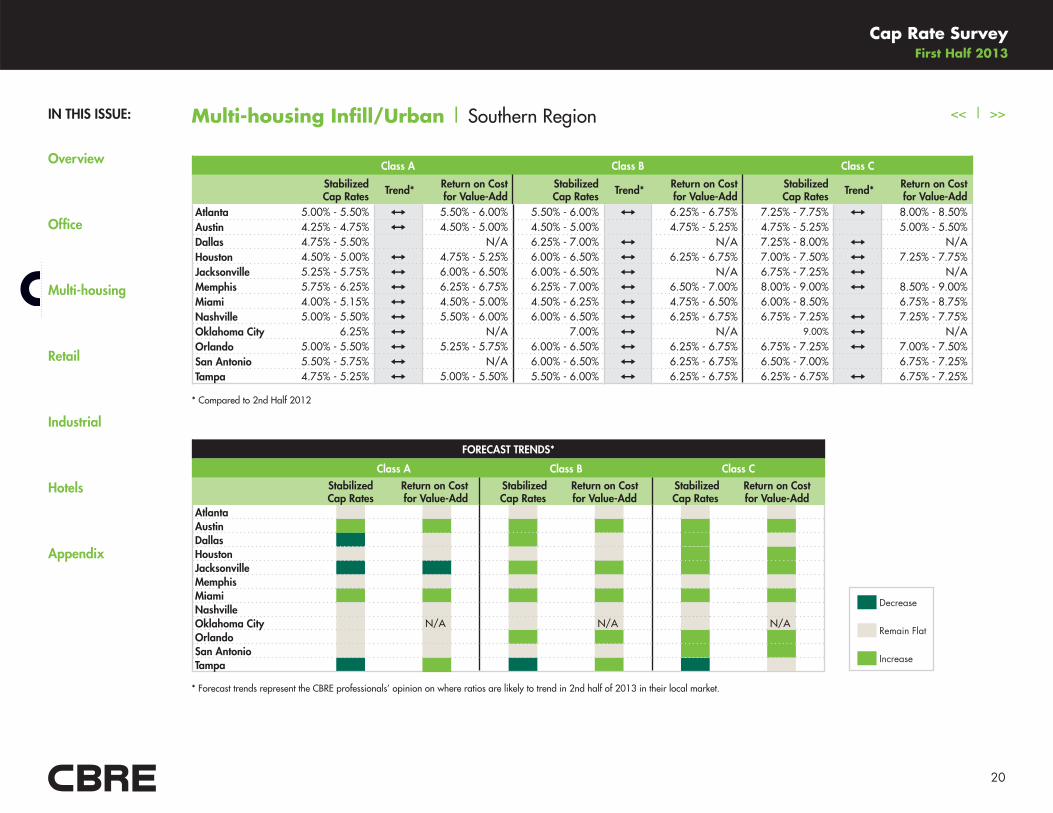
<< | >>Multi-housing Infill/Urban | Southern Region
Class A Class B Class C
Stabilized Cap Rates Trend* Return on Cost
for Value-AddStabilized Cap Rates Trend* Return on Cost
for Value-AddStabilized Cap Rates Trend* Return on Cost
for Value-AddAtlanta 5.00% - 5.50% 5.50% - 6.00% 5.50% - 6.00% 6.25% - 6.75% 7.25% - 7.75% 8.00% - 8.50%Austin 4.25% - 4.75% 4.50% - 5.00% 4.50% - 5.00%
�
4.75% - 5.25% 4.75% - 5.25%
�
5.00% - 5.50%Dallas 4.75% - 5.50% � N/A 6.25% - 7.00% N/A 7.25% - 8.00% N/AHouston 4.50% - 5.00% 4.75% - 5.25% 6.00% - 6.50% 6.25% - 6.75% 7.00% - 7.50% 7.25% - 7.75%Jacksonville 5.25% - 5.75% 6.00% - 6.50% 6.00% - 6.50% N/A 6.75% - 7.25% N/AMemphis 5.75% - 6.25% 6.25% - 6.75% 6.25% - 7.00% 6.50% - 7.00% 8.00% - 9.00% 8.50% - 9.00%Miami 4.00% - 5.15% 4.50% - 5.00% 4.50% - 6.25% 4.75% - 6.50% 6.00% - 8.50% � 6.75% - 8.75%Nashville 5.00% - 5.50% 5.50% - 6.00% 6.00% - 6.50% 6.25% - 6.75% 6.75% - 7.25% 7.25% - 7.75%Oklahoma City 6.25% N/A 7.00% N/A 9.00% N/AOrlando 5.00% - 5.50% 5.25% - 5.75% 6.00% - 6.50% 6.25% - 6.75% 6.75% - 7.25% 7.00% - 7.50%San Antonio 5.50% - 5.75% N/A 6.00% - 6.50% 6.25% - 6.75% 6.50% - 7.00%
�
6.75% - 7.25%Tampa 4.75% - 5.25% 5.00% - 5.50% 5.50% - 6.00% 6.25% - 6.75% 6.25% - 6.75% 6.75% - 7.25%
Decrease
Remain Flat
Increase
FORECAST TRENDS*
Class A Class B Class C
Stabilized Cap Rates
Return on Cost for Value-Add
Stabilized Cap Rates
Return on Cost for Value-Add
Stabilized Cap Rates
Return on Cost for Value-Add
* Forecast trends represent the CBRE professionals’ opinion on where ratios are likely to trend in 2nd half of 2013 in their local market.
AtlantaAustinDallasHoustonJacksonvilleMemphisMiamiNashvilleOklahoma City N/A N/A N/AOrlandoSan AntonioTampa
* Compared to 2nd Half 2012
IN THIS ISSUE:
Overview
Office
Multi-housing
Retail
Industrial
Hotels
Appendix
Cap Rate Survey First Half 2013
21
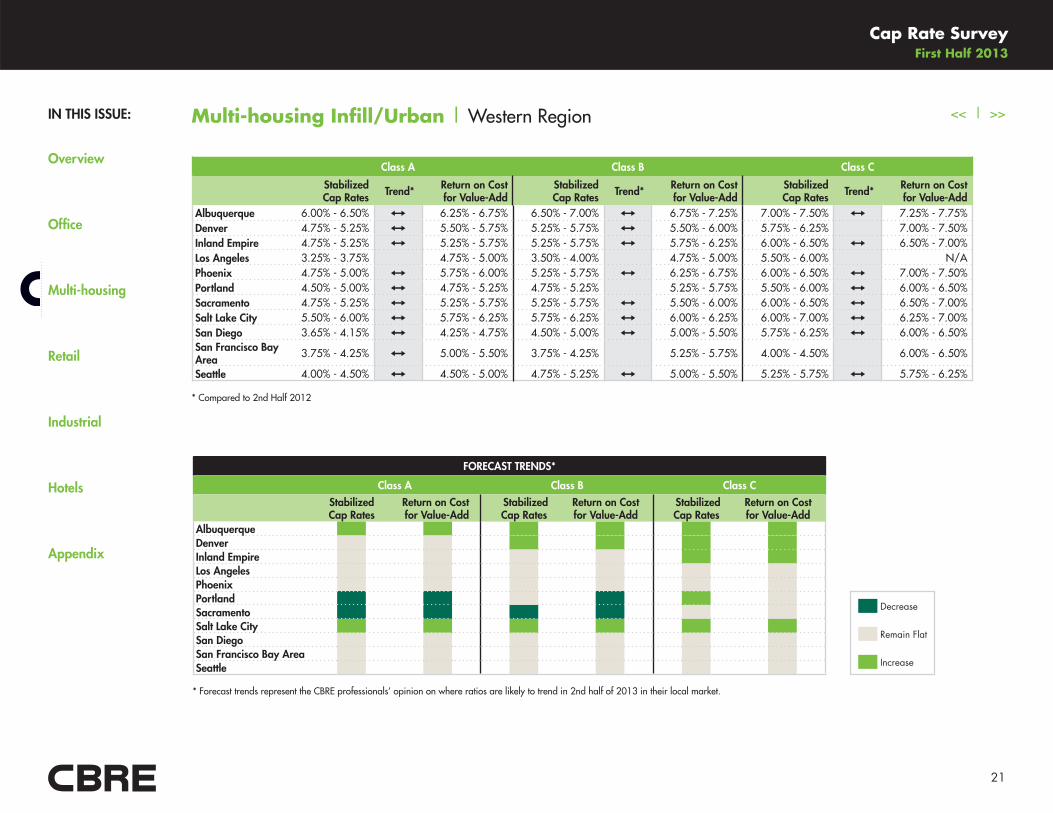
<< | >>Multi-housing Infill/Urban | Western Region
Decrease
Remain Flat
Increase
Albuquerque 6.00% - 6.50% 6.25% - 6.75% 6.50% - 7.00% 6.75% - 7.25% 7.00% - 7.50% 7.25% - 7.75%Denver 4.75% - 5.25% 5.50% - 5.75% 5.25% - 5.75% 5.50% - 6.00% 5.75% - 6.25%
�
7.00% - 7.50%Inland Empire 4.75% - 5.25% 5.25% - 5.75% 5.25% - 5.75% 5.75% - 6.25% 6.00% - 6.50% 6.50% - 7.00%Los Angeles 3.25% - 3.75%
�
4.75% - 5.00% 3.50% - 4.00%
�
4.75% - 5.00% 5.50% - 6.00% � N/APhoenix 4.75% - 5.00% 5.75% - 6.00% 5.25% - 5.75% 6.25% - 6.75% 6.00% - 6.50% 7.00% - 7.50%Portland 4.50% - 5.00% 4.75% - 5.25% 4.75% - 5.25%
�
5.25% - 5.75% 5.50% - 6.00% 6.00% - 6.50%Sacramento 4.75% - 5.25% 5.25% - 5.75% 5.25% - 5.75% 5.50% - 6.00% 6.00% - 6.50% 6.50% - 7.00%Salt Lake City 5.50% - 6.00% 5.75% - 6.25% 5.75% - 6.25% 6.00% - 6.25% 6.00% - 7.00% 6.25% - 7.00%San Diego 3.65% - 4.15% 4.25% - 4.75% 4.50% - 5.00% 5.00% - 5.50% 5.75% - 6.25% 6.00% - 6.50%San Francisco Bay Area 3.75% - 4.25% 5.00% - 5.50% 3.75% - 4.25%
�
5.25% - 5.75% 4.00% - 4.50%
�
6.00% - 6.50%
Seattle 4.00% - 4.50% 4.50% - 5.00% 4.75% - 5.25% 5.00% - 5.50% 5.25% - 5.75% 5.75% - 6.25%
Class A Class B Class C
Stabilized Cap Rates Trend* Return on Cost
for Value-AddStabilized Cap Rates Trend* Return on Cost
for Value-AddStabilized Cap Rates Trend* Return on Cost
for Value-Add
FORECAST TRENDS*
Class A Class B Class C
Stabilized Cap Rates
Return on Cost for Value-Add
Stabilized Cap Rates
Return on Cost for Value-Add
Stabilized Cap Rates
Return on Cost for Value-Add
AlbuquerqueDenverInland EmpireLos AngelesPhoenixPortlandSacramentoSalt Lake CitySan DiegoSan Francisco Bay AreaSeattle
* Forecast trends represent the CBRE professionals’ opinion on where ratios are likely to trend in 2nd half of 2013 in their local market.
* Compared to 2nd Half 2012
IN THIS ISSUE:
Overview
Office
Multi-housing
Retail
Industrial
Hotels
Appendix
Cap Rate Survey First Half 2013
22
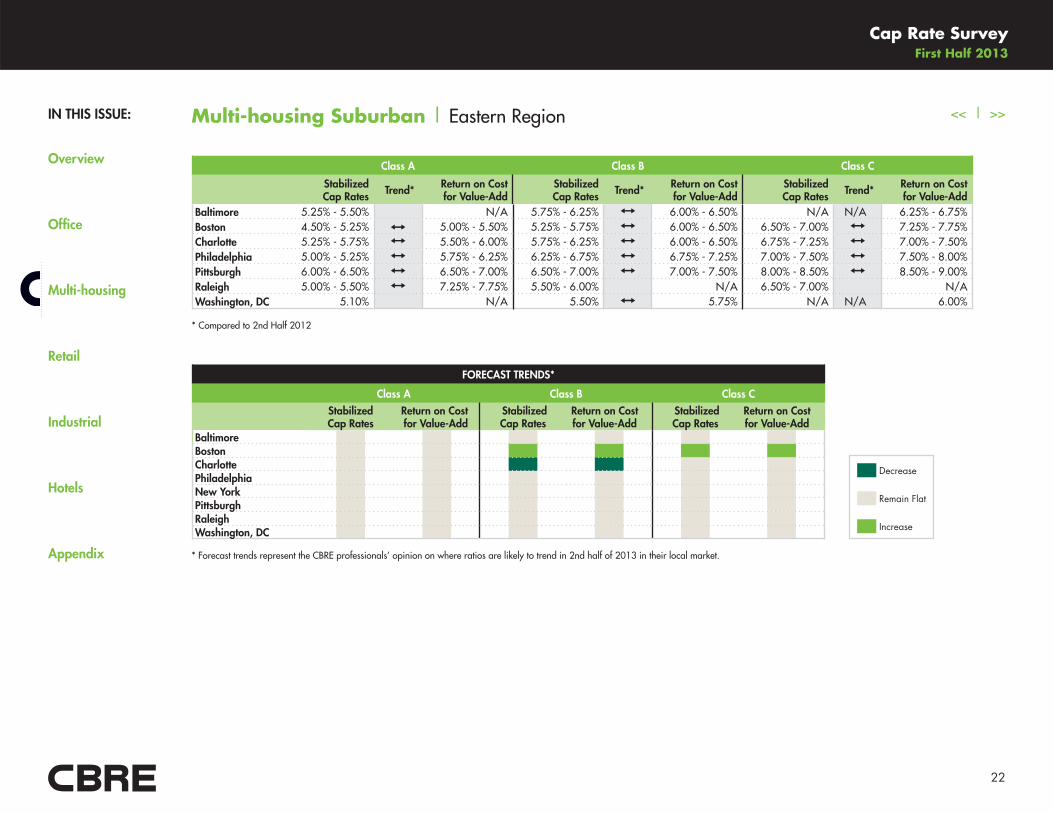
<< | >>Multi-housing Suburban | Eastern Region
Class A Class B Class C
Stabilized Cap Rates Trend* Return on Cost
for Value-AddStabilized Cap Rates Trend* Return on Cost
for Value-AddStabilized Cap Rates Trend* Return on Cost
for Value-AddBaltimore 5.25% - 5.50% � N/A 5.75% - 6.25% 6.00% - 6.50% N/A N/A 6.25% - 6.75%Boston 4.50% - 5.25% 5.00% - 5.50% 5.25% - 5.75% 6.00% - 6.50% 6.50% - 7.00% 7.25% - 7.75%Charlotte 5.25% - 5.75% 5.50% - 6.00% 5.75% - 6.25% 6.00% - 6.50% 6.75% - 7.25% 7.00% - 7.50%Philadelphia 5.00% - 5.25% 5.75% - 6.25% 6.25% - 6.75% 6.75% - 7.25% 7.00% - 7.50% 7.50% - 8.00%Pittsburgh 6.00% - 6.50% 6.50% - 7.00% 6.50% - 7.00% 7.00% - 7.50% 8.00% - 8.50% 8.50% - 9.00%Raleigh 5.00% - 5.50% 7.25% - 7.75% 5.50% - 6.00%
�
N/A 6.50% - 7.00%
�
N/AWashington, DC 5.10% � N/A 5.50% 5.75% N/A N/A 6.00%
Decrease
Remain Flat
Increase
FORECAST TRENDS*
Class A Class B Class C
Stabilized Cap Rates
Return on Cost for Value-Add
Stabilized Cap Rates
Return on Cost for Value-Add
Stabilized Cap Rates
Return on Cost for Value-Add
BaltimoreBostonCharlottePhiladelphiaNew YorkPittsburghRaleighWashington, DC
* Forecast trends represent the CBRE professionals’ opinion on where ratios are likely to trend in 2nd half of 2013 in their local market.
* Compared to 2nd Half 2012
IN THIS ISSUE:
Overview
Office
Multi-housing
Retail
Industrial
Hotels
Appendix
Cap Rate Survey First Half 2013
23
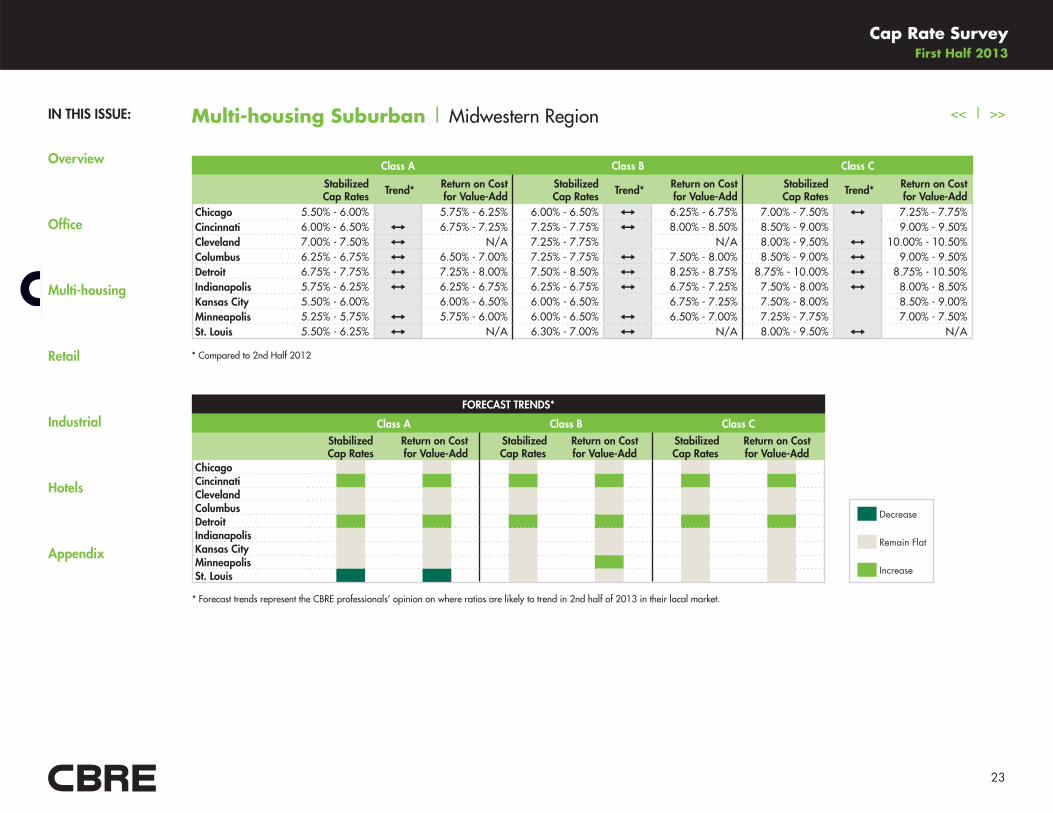
<< | >>Multi-housing Suburban | Midwestern Region
Chicago 5.50% - 6.00% � 5.75% - 6.25% 6.00% - 6.50% 6.25% - 6.75% 7.00% - 7.50% 7.25% - 7.75%Cincinnati 6.00% - 6.50% 6.75% - 7.25% 7.25% - 7.75% 8.00% - 8.50% 8.50% - 9.00% � 9.00% - 9.50%Cleveland 7.00% - 7.50% N/A 7.25% - 7.75%
�
N/A 8.00% - 9.50% 10.00% - 10.50%Columbus 6.25% - 6.75% 6.50% - 7.00% 7.25% - 7.75% 7.50% - 8.00% 8.50% - 9.00% 9.00% - 9.50%Detroit 6.75% - 7.75% 7.25% - 8.00% 7.50% - 8.50% 8.25% - 8.75% 8.75% - 10.00% 8.75% - 10.50%Indianapolis 5.75% - 6.25% 6.25% - 6.75% 6.25% - 6.75% 6.75% - 7.25% 7.50% - 8.00% 8.00% - 8.50%Kansas City 5.50% - 6.00%
�
6.00% - 6.50% 6.00% - 6.50%
�
6.75% - 7.25% 7.50% - 8.00%
�
8.50% - 9.00%Minneapolis 5.25% - 5.75% 5.75% - 6.00% 6.00% - 6.50% 6.50% - 7.00% 7.25% - 7.75%
�
7.00% - 7.50%St. Louis 5.50% - 6.25% N/A 6.30% - 7.00% N/A 8.00% - 9.50% N/A
Class A Class B Class C
Stabilized Cap Rates Trend* Return on Cost
for Value-AddStabilized Cap Rates Trend* Return on Cost
for Value-AddStabilized Cap Rates Trend* Return on Cost
for Value-Add
Decrease
Remain Flat
Increase
ChicagoCincinnatiClevelandColumbusDetroitIndianapolisKansas CityMinneapolisSt. Louis
FORECAST TRENDS*
Class A Class B Class C
Stabilized Cap Rates
Return on Cost for Value-Add
Stabilized Cap Rates
Return on Cost for Value-Add
Stabilized Cap Rates
Return on Cost for Value-Add
* Forecast trends represent the CBRE professionals’ opinion on where ratios are likely to trend in 2nd half of 2013 in their local market.
* Compared to 2nd Half 2012
IN THIS ISSUE:
Overview
Office
Multi-housing
Retail
Industrial
Hotels
Appendix
Cap Rate Survey First Half 2013
24
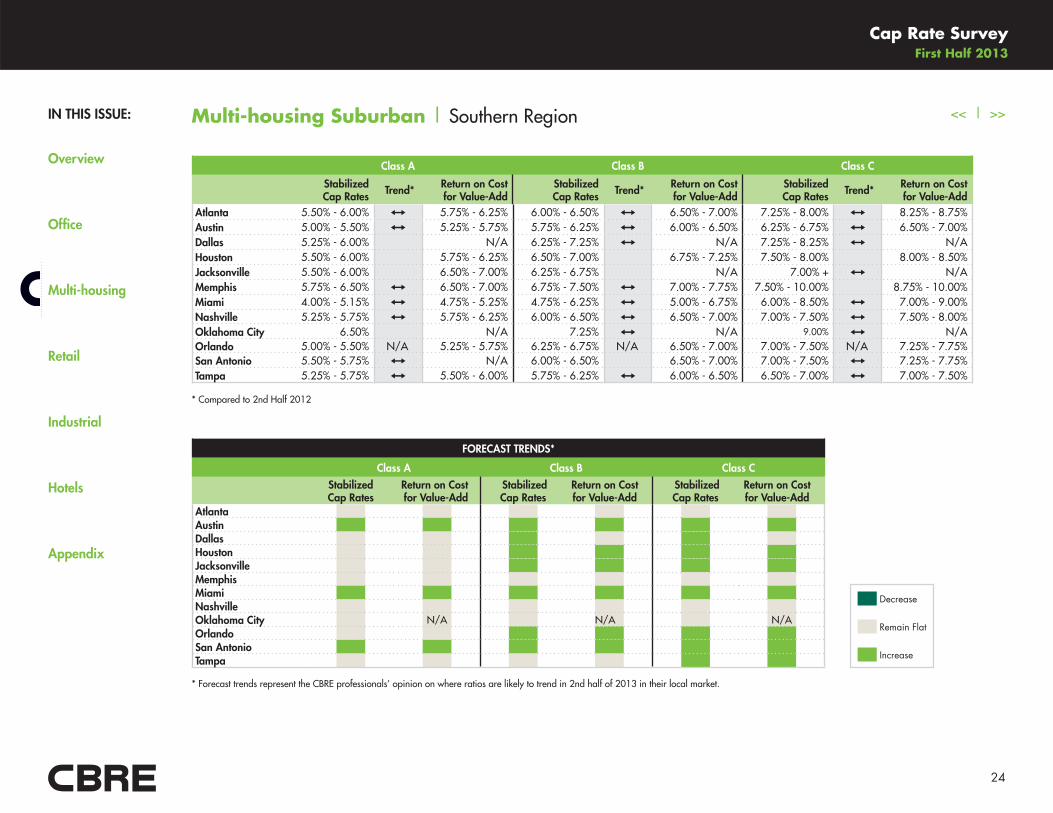
<< | >>Multi-housing Suburban | Southern Region
Class A Class B Class C
Stabilized Cap Rates Trend* Return on Cost
for Value-AddStabilized Cap Rates Trend* Return on Cost
for Value-AddStabilized Cap Rates Trend* Return on Cost
for Value-AddAtlanta 5.50% - 6.00% 5.75% - 6.25% 6.00% - 6.50% 6.50% - 7.00% 7.25% - 8.00% 8.25% - 8.75%Austin 5.00% - 5.50% 5.25% - 5.75% 5.75% - 6.25% 6.00% - 6.50% 6.25% - 6.75% 6.50% - 7.00%Dallas 5.25% - 6.00%
�
N/A 6.25% - 7.25% N/A 7.25% - 8.25% N/AHouston 5.50% - 6.00%
�
5.75% - 6.25% 6.50% - 7.00%
�
6.75% - 7.25% 7.50% - 8.00%
�
8.00% - 8.50%Jacksonville 5.50% - 6.00% � 6.50% - 7.00% 6.25% - 6.75% � N/A 7.00% + N/AMemphis 5.75% - 6.50% 6.50% - 7.00% 6.75% - 7.50% 7.00% - 7.75% 7.50% - 10.00%
�
8.75% - 10.00%Miami 4.00% - 5.15% 4.75% - 5.25% 4.75% - 6.25% 5.00% - 6.75% 6.00% - 8.50% 7.00% - 9.00%Nashville 5.25% - 5.75% 5.75% - 6.25% 6.00% - 6.50% 6.50% - 7.00% 7.00% - 7.50% 7.50% - 8.00%Oklahoma City 6.50% � N/A 7.25% N/A 9.00% N/AOrlando 5.00% - 5.50% N/A 5.25% - 5.75% 6.25% - 6.75% N/A 6.50% - 7.00% 7.00% - 7.50% N/A 7.25% - 7.75%San Antonio 5.50% - 5.75% N/A 6.00% - 6.50%
�
6.50% - 7.00% 7.00% - 7.50% 7.25% - 7.75%Tampa 5.25% - 5.75% 5.50% - 6.00% 5.75% - 6.25% 6.00% - 6.50% 6.50% - 7.00% 7.00% - 7.50%
Decrease
Remain Flat
Increase
FORECAST TRENDS*
Class A Class B Class C
Stabilized Cap Rates
Return on Cost for Value-Add
Stabilized Cap Rates
Return on Cost for Value-Add
Stabilized Cap Rates
Return on Cost for Value-Add
AtlantaAustinDallasHoustonJacksonvilleMemphisMiamiNashvilleOklahoma City N/A N/A N/AOrlandoSan AntonioTampa
* Forecast trends represent the CBRE professionals’ opinion on where ratios are likely to trend in 2nd half of 2013 in their local market.
* Compared to 2nd Half 2012
IN THIS ISSUE:
Overview
Office
Multi-housing
Retail
Industrial
Hotels
Appendix
Cap Rate Survey First Half 2013
25
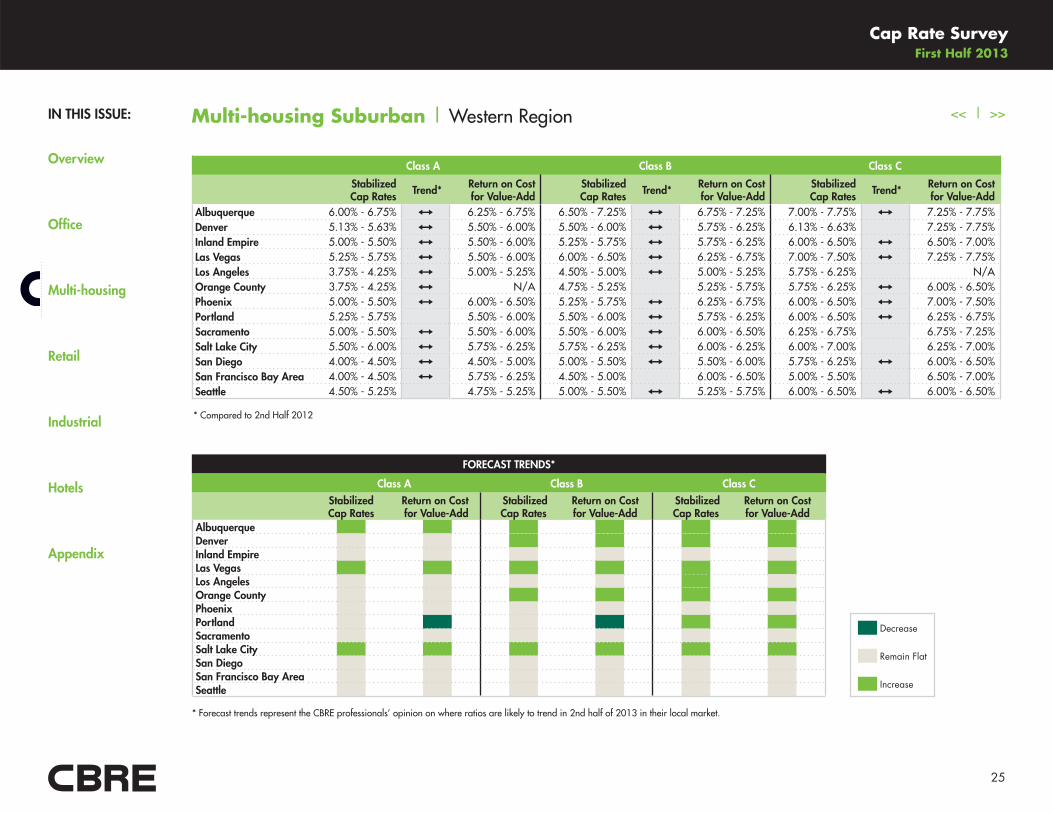
<< | >>Multi-housing Suburban | Western Region
Class A Class B Class C
Stabilized Cap Rates Trend* Return on Cost
for Value-AddStabilized Cap Rates Trend* Return on Cost
for Value-AddStabilized Cap Rates Trend* Return on Cost
for Value-AddAlbuquerque 6.00% - 6.75% 6.25% - 6.75% 6.50% - 7.25% 6.75% - 7.25% 7.00% - 7.75% 7.25% - 7.75%Denver 5.13% - 5.63% 5.50% - 6.00% 5.50% - 6.00% 5.75% - 6.25% 6.13% - 6.63%
�
7.25% - 7.75%Inland Empire 5.00% - 5.50% 5.50% - 6.00% 5.25% - 5.75% 5.75% - 6.25% 6.00% - 6.50% 6.50% - 7.00%Las Vegas 5.25% - 5.75% 5.50% - 6.00% 6.00% - 6.50% 6.25% - 6.75% 7.00% - 7.50% 7.25% - 7.75%Los Angeles 3.75% - 4.25% 5.00% - 5.25% 4.50% - 5.00% 5.00% - 5.25% 5.75% - 6.25% � N/AOrange County 3.75% - 4.25% N/A 4.75% - 5.25% � 5.25% - 5.75% 5.75% - 6.25% 6.00% - 6.50%Phoenix 5.00% - 5.50% 6.00% - 6.50% 5.25% - 5.75% 6.25% - 6.75% 6.00% - 6.50% 7.00% - 7.50%Portland 5.25% - 5.75% � 5.50% - 6.00% 5.50% - 6.00% 5.75% - 6.25% 6.00% - 6.50% 6.25% - 6.75%Sacramento 5.00% - 5.50% 5.50% - 6.00% 5.50% - 6.00% 6.00% - 6.50% 6.25% - 6.75%
�
6.75% - 7.25%Salt Lake City 5.50% - 6.00% 5.75% - 6.25% 5.75% - 6.25% 6.00% - 6.25% 6.00% - 7.00% � 6.25% - 7.00%San Diego 4.00% - 4.50% 4.50% - 5.00% 5.00% - 5.50% 5.50% - 6.00% 5.75% - 6.25% 6.00% - 6.50%San Francisco Bay Area 4.00% - 4.50% 5.75% - 6.25% 4.50% - 5.00%
�
6.00% - 6.50% 5.00% - 5.50%
�
6.50% - 7.00%Seattle 4.50% - 5.25% � 4.75% - 5.25% 5.00% - 5.50% 5.25% - 5.75% 6.00% - 6.50% 6.00% - 6.50%
Decrease
Remain Flat
Increase
* Forecast trends represent the CBRE professionals’ opinion on where ratios are likely to trend in 2nd half of 2013 in their local market.
FORECAST TRENDS*
Class A Class B Class C
Stabilized Cap Rates
Return on Cost for Value-Add
Stabilized Cap Rates
Return on Cost for Value-Add
Stabilized Cap Rates
Return on Cost for Value-Add
AlbuquerqueDenverInland EmpireLas VegasLos AngelesOrange CountyPhoenixPortlandSacramentoSalt Lake CitySan DiegoSan Francisco Bay AreaSeattle
* Compared to 2nd Half 2012
IN THIS ISSUE:
Overview
Office
Multi-housing
Retail
Industrial
Hotels
Appendix
Cap Rate Survey First Half 2013
26
<< | >>
The retail sector continues to see increases in sales volume, despite lagging other property sectors into the early stages of the recovery. For the
12 months through mid-year 2013, sales volume reached $52.9 billion, up from the $46.2 billion pace set during the previous 12 months.
This 14.6% increase for retail overall is generally reflected in the trends seen among retail subtypes: Sales volume for strip-center retail was
up 16.5% from a year earlier, hitting $22.4 billion in the 12 months through mid-year 2013. The mall segment saw volume of $30.6 billion
during the same period, up 13.3% from a year earlier.
Our survey results suggest that the cap rate compression that began in mid-2010 in the retail sector is now largely over. For Class A stabilized
neighborhood center assets, CBRE professionals expect that in the next six months cap rates will remain flat or increase in 34 of the 39
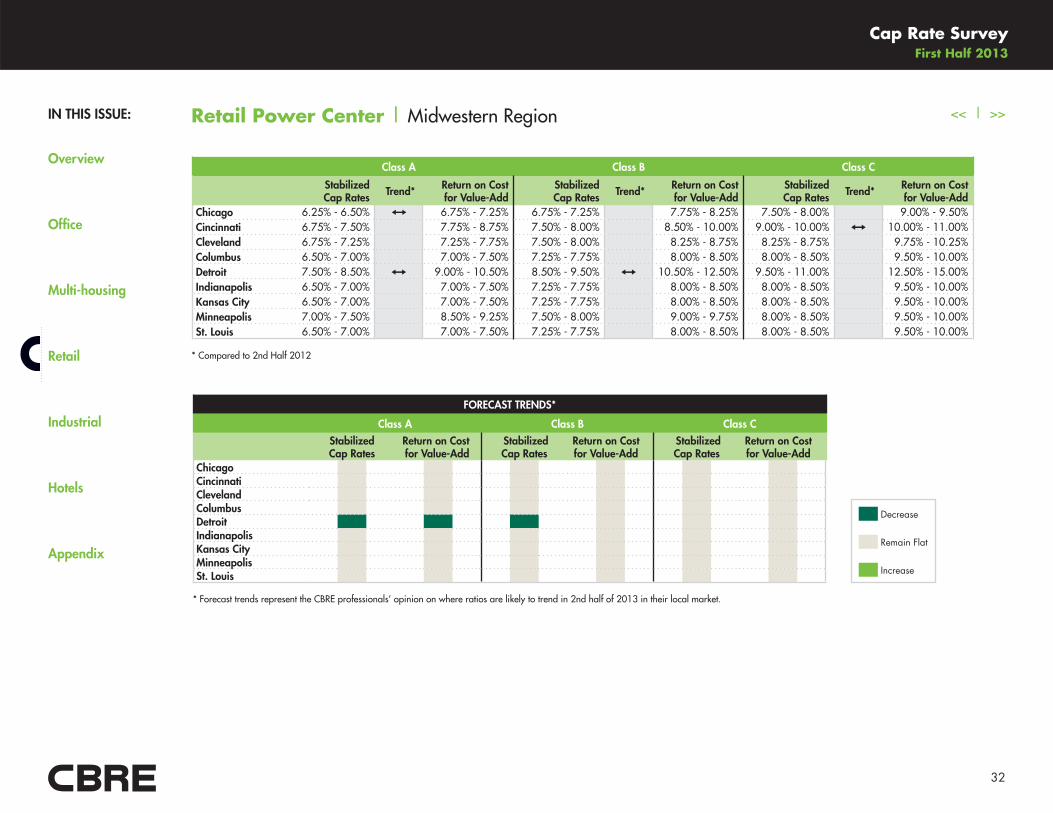
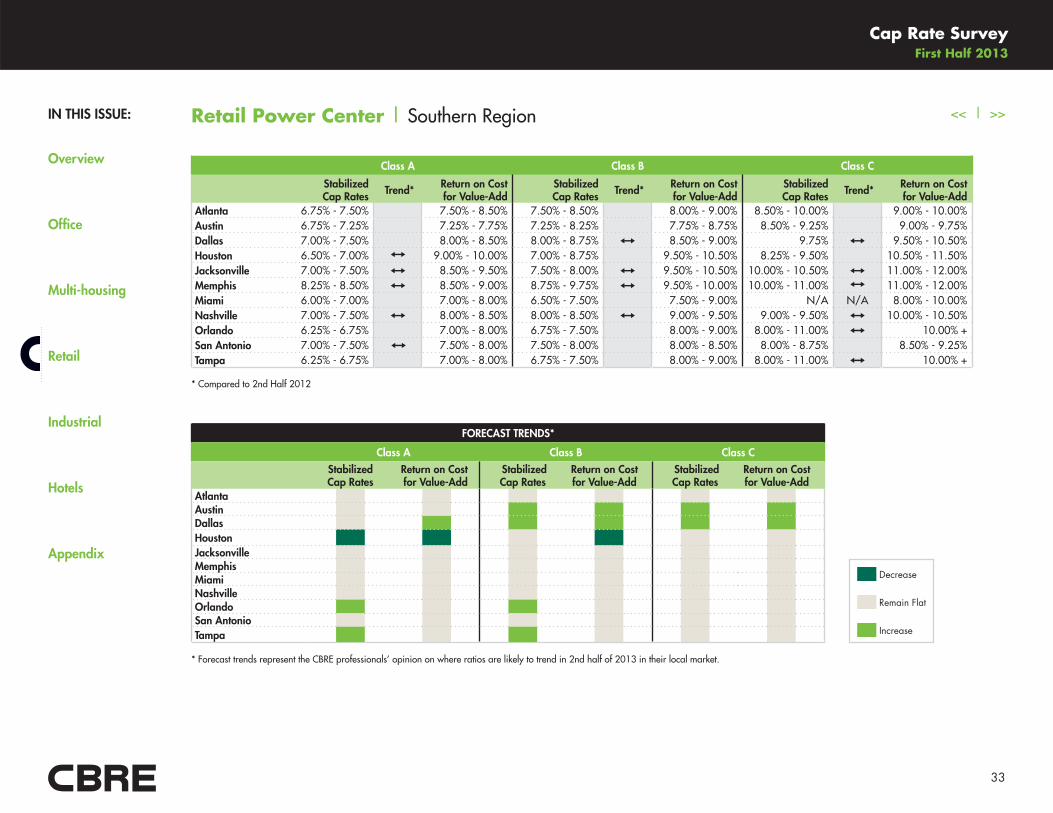
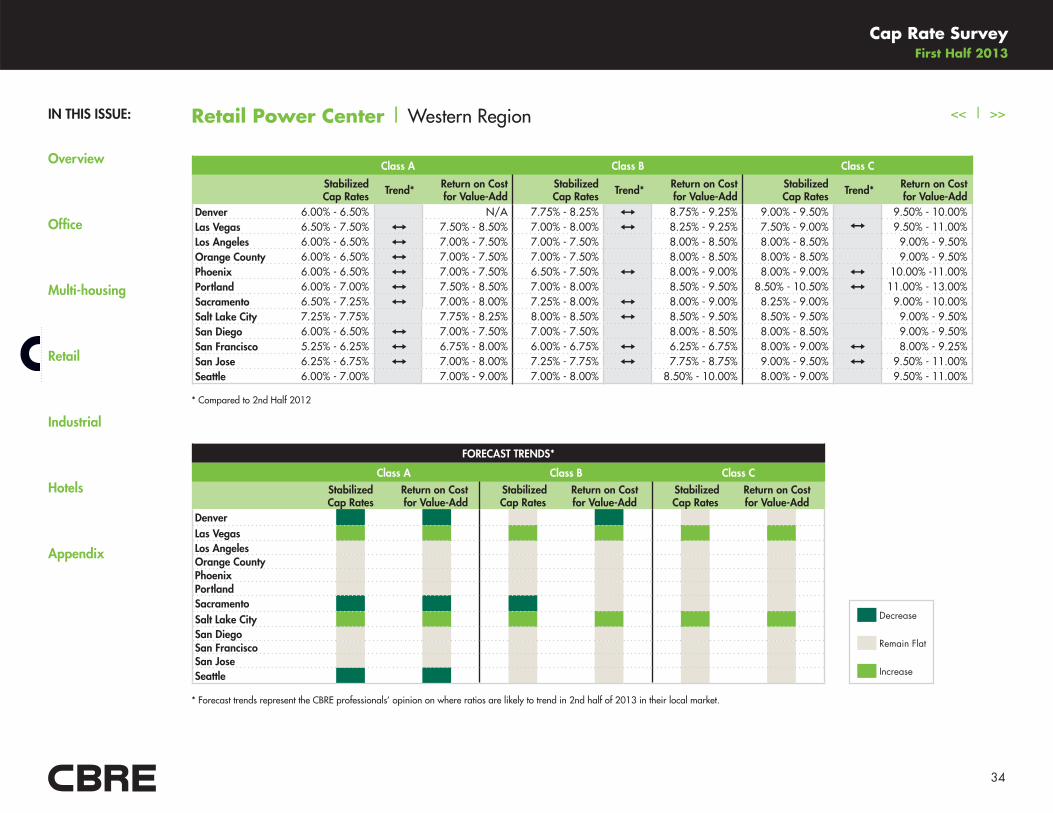
markets surveyed. The same patterns are seen in the power center subtypes. As one moves up the risk spectrum to lower-grade assets, cap rate
compression is expected to dwindle in virtually all markets.
CLICK TO DOWNLOAD
Select from the list below to access the current neighborhood/community center (grocery anchored) retail key ratios, forecast and interactive map.
Download a Complete Retail Neighborhood/Community Center (Grocery Anchored) Current Key Ratios Chart (PDF)
Download a Complete Retail Neighborhood/Community Center (Grocery Anchored) Current Forecast Chart (PDF)
Download the Complete Retail Neighborhood/Community Center (Grocery Anchored) Current Key Ratios Map (Interactive PDF)
Select from the list below to access the current power center retail key ratios, forecast and interactive map.
Download a Complete Retail Power Center Current Key Ratios Chart (PDF)
Download a Complete Retail Power Center Current Forecast Chart (PDF)
Download the Complete Retail Power Center Current Key Ratios Map (Interactive PDF)
Select from the list below to access the current high street retail key ratios, forecast and interactive map.
Download the Complete High Street Retail Current Key Ratios and Forecast Charts (PDF)
Download the Complete High Street Retail Current Key Ratios Map (Interactive PDF)
NEW
NEW
NEW
Retail | Overview
IN THIS ISSUE:
Overview
Office
Multi-housing
Retail
Industrial
Hotels
Appendix
Cap Rate Survey First Half 2013
27
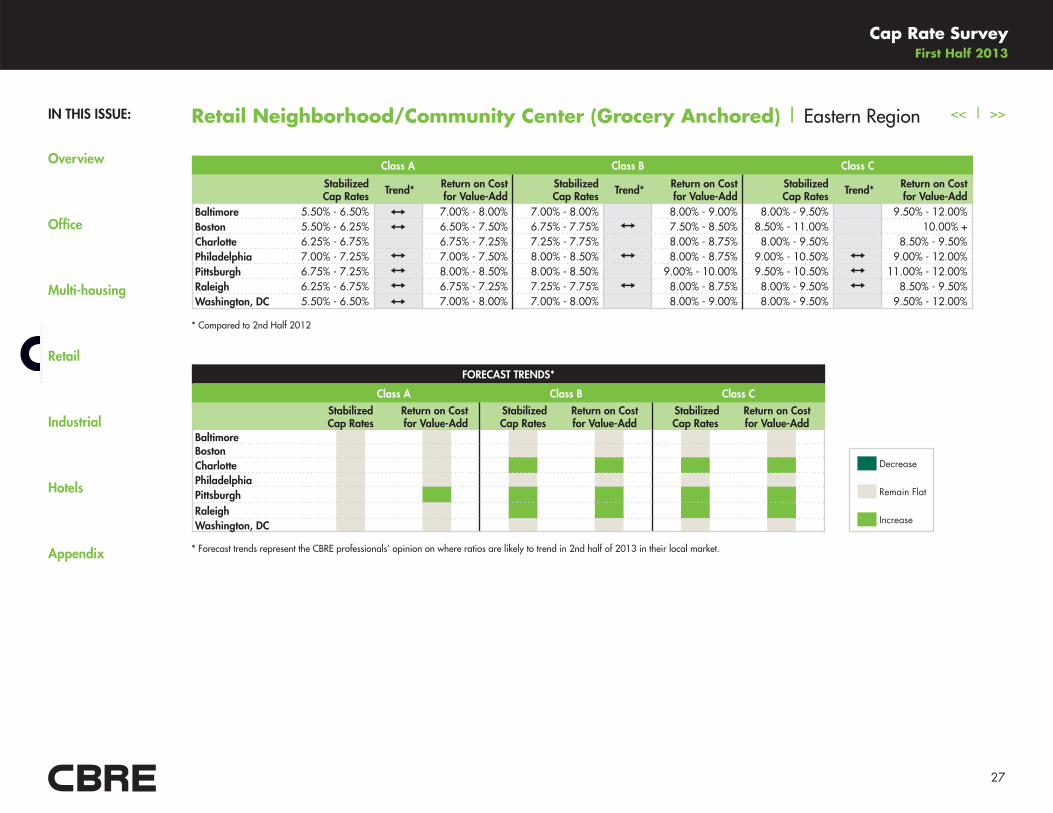
<< | >>Retail Neighborhood/Community Center (Grocery Anchored) | Eastern Region
Class A Class B Class C
Stabilized Cap Rates Trend* Return on Cost
for Value-AddStabilized Cap Rates Trend* Return on Cost
for Value-AddStabilized Cap Rates Trend* Return on Cost
for Value-AddBaltimore 5.50% - 6.50% 7.00% - 8.00% 7.00% - 8.00% � 8.00% - 9.00% 8.00% - 9.50% � 9.50% - 12.00%Boston 5.50% - 6.25% 6.50% - 7.50% 6.75% - 7.75% 7.50% - 8.50% 8.50% - 11.00% � 10.00% +Charlotte 6.25% - 6.75%
�
6.75% - 7.25% 7.25% - 7.75%
�
8.00% - 8.75% 8.00% - 9.50%
�
8.50% - 9.50%Philadelphia 7.00% - 7.25% 7.00% - 7.50% 8.00% - 8.50% 8.00% - 8.75% 9.00% - 10.50% 9.00% - 12.00%Pittsburgh 6.75% - 7.25% 8.00% - 8.50% 8.00% - 8.50%
�
9.00% - 10.00% 9.50% - 10.50% 11.00% - 12.00%Raleigh 6.25% - 6.75% 6.75% - 7.25% 7.25% - 7.75% 8.00% - 8.75% 8.00% - 9.50% 8.50% - 9.50%Washington, DC 5.50% - 6.50% 7.00% - 8.00% 7.00% - 8.00% � 8.00% - 9.00% 8.00% - 9.50% � 9.50% - 12.00%
Decrease
Remain Flat
Increase
FORECAST TRENDS*
Class A Class B Class C
Stabilized Cap Rates
Return on Cost for Value-Add
Stabilized Cap Rates
Return on Cost for Value-Add
Stabilized Cap Rates
Return on Cost for Value-Add
BaltimoreBostonCharlottePhiladelphiaPittsburghRaleighWashington, DC
* Forecast trends represent the CBRE professionals’ opinion on where ratios are likely to trend in 2nd half of 2013 in their local market.
* Compared to 2nd Half 2012
IN THIS ISSUE:
Overview
Office
Multi-housing
Retail
Industrial
Hotels
Appendix
Cap Rate Survey First Half 2013
28
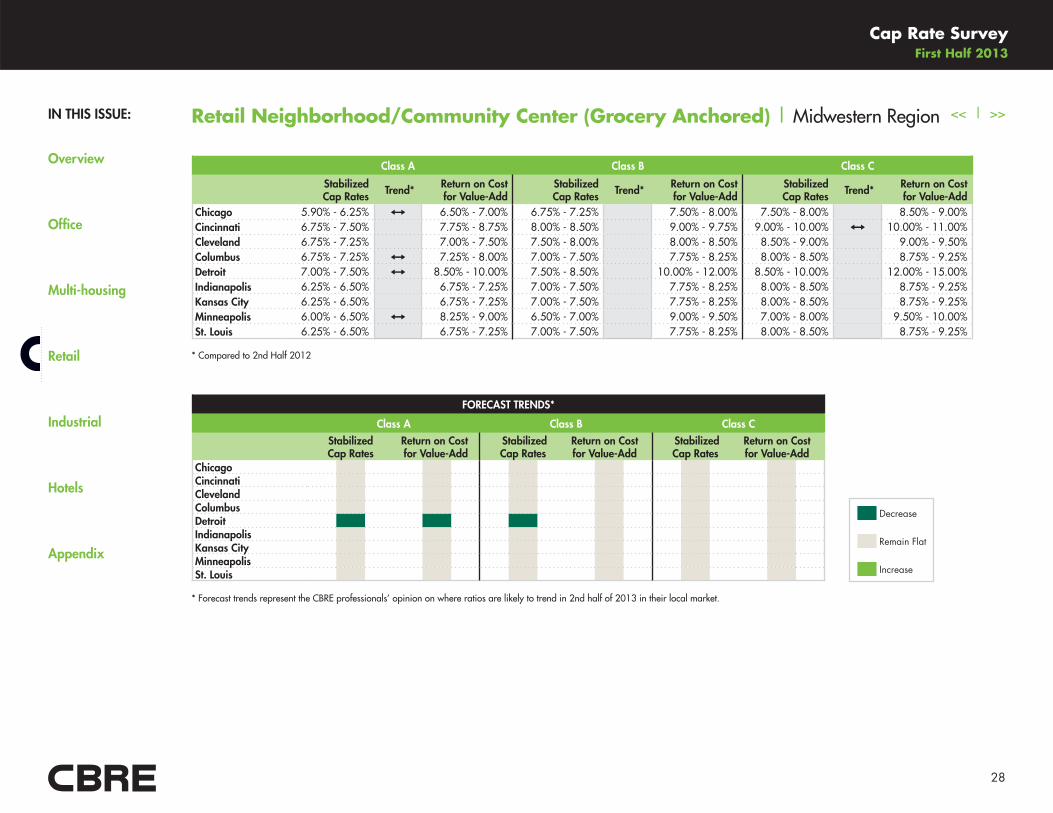
<< | >>Retail Neighborhood/Community Center (Grocery Anchored) | Midwestern Region
Chicago 5.90% - 6.25% 6.50% - 7.00% 6.75% - 7.25%
�
7.50% - 8.00% 7.50% - 8.00%
�
8.50% - 9.00%Cincinnati 6.75% - 7.50%
�
7.75% - 8.75% 8.00% - 8.50%
�
9.00% - 9.75% 9.00% - 10.00% 10.00% - 11.00%Cleveland 6.75% - 7.25%
�
7.00% - 7.50% 7.50% - 8.00%
�
8.00% - 8.50% 8.50% - 9.00%
�
9.00% - 9.50%Columbus 6.75% - 7.25% 7.25% - 8.00% 7.00% - 7.50%
�
7.75% - 8.25% 8.00% - 8.50%
�
8.75% - 9.25%Detroit 7.00% - 7.50% 8.50% - 10.00% 7.50% - 8.50%
�
10.00% - 12.00% 8.50% - 10.00%
�
12.00% - 15.00%Indianapolis 6.25% - 6.50%
�
6.75% - 7.25% 7.00% - 7.50%
�
7.75% - 8.25% 8.00% - 8.50%
�
8.75% - 9.25%Kansas City 6.25% - 6.50%
�
6.75% - 7.25% 7.00% - 7.50%
�
7.75% - 8.25% 8.00% - 8.50%
�
8.75% - 9.25%Minneapolis 6.00% - 6.50% 8.25% - 9.00% 6.50% - 7.00%
�
9.00% - 9.50% 7.00% - 8.00%
�
9.50% - 10.00%St. Louis 6.25% - 6.50%
�
6.75% - 7.25% 7.00% - 7.50%
�
7.75% - 8.25% 8.00% - 8.50%
�
8.75% - 9.25%
Class A Class B Class C
Stabilized Cap Rates Trend* Return on Cost
for Value-AddStabilized Cap Rates Trend* Return on Cost
for Value-AddStabilized Cap Rates Trend* Return on Cost
for Value-Add
Decrease
Remain Flat
Increase
ChicagoCincinnatiClevelandColumbusDetroitIndianapolisKansas CityMinneapolisSt. Louis
FORECAST TRENDS*
Class A Class B Class C
Stabilized Cap Rates
Return on Cost for Value-Add
Stabilized Cap Rates
Return on Cost for Value-Add
Stabilized Cap Rates
Return on Cost for Value-Add
* Forecast trends represent the CBRE professionals’ opinion on where ratios are likely to trend in 2nd half of 2013 in their local market.
* Compared to 2nd Half 2012
IN THIS ISSUE:
Overview
Office
Multi-housing
Retail
Industrial
Hotels
Appendix
Cap Rate Survey First Half 2013
29
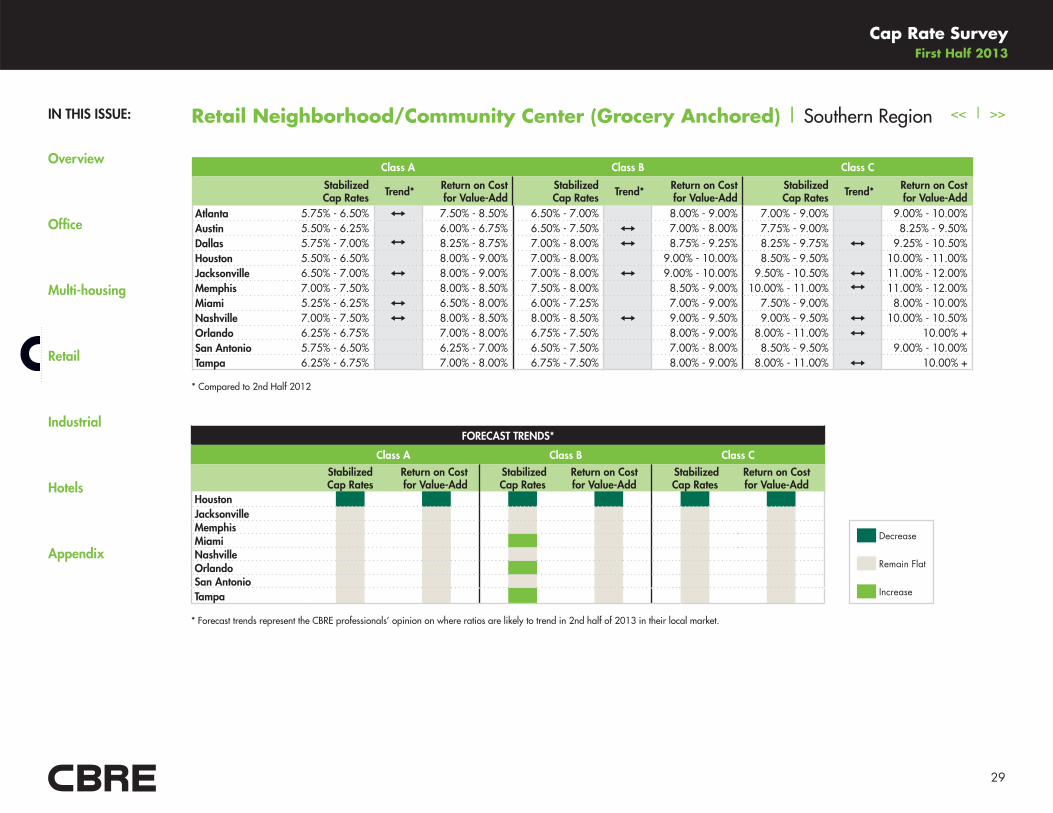
<< | >>Retail Neighborhood/Community Center (Grocery Anchored) | Southern Region
Atlanta 5.75% - 6.50% 7.50% - 8.50% 6.50% - 7.00%
�
8.00% - 9.00% 7.00% - 9.00%
�
9.00% - 10.00%Austin 5.50% - 6.25%
�
6.00% - 6.75% 6.50% - 7.50% 7.00% - 8.00% 7.75% - 9.00%
�
8.25% - 9.50%Dallas 5.75% - 7.00% 8.25% - 8.75% 7.00% - 8.00% 8.75% - 9.25% 8.25% - 9.75% 9.25% - 10.50%Houston 5.50% - 6.50%
�
8.00% - 9.00% 7.00% - 8.00%
�
9.00% - 10.00% 8.50% - 9.50%
�
10.00% - 11.00%Jacksonville 6.50% - 7.00% 8.00% - 9.00% 7.00% - 8.00% 9.00% - 10.00% 9.50% - 10.50% 11.00% - 12.00%Memphis 7.00% - 7.50%
�
8.00% - 8.50% 7.50% - 8.00%
�
8.50% - 9.00% 10.00% - 11.00% 11.00% - 12.00%Miami 5.25% - 6.25% 6.50% - 8.00% 6.00% - 7.25%
�
7.00% - 9.00% 7.50% - 9.00%
�
8.00% - 10.00%Nashville 7.00% - 7.50% 8.00% - 8.50% 8.00% - 8.50% 9.00% - 9.50% 9.00% - 9.50% 10.00% - 10.50%Orlando 6.25% - 6.75%
�
7.00% - 8.00% 6.75% - 7.50%
�
8.00% - 9.00% 8.00% - 11.00% 10.00% +San Antonio 5.75% - 6.50%
�
6.25% - 7.00% 6.50% - 7.50%
�
7.00% - 8.00% 8.50% - 9.50%
�
9.00% - 10.00%Tampa 6.25% - 6.75%
�
7.00% - 8.00% 6.75% - 7.50%
�
8.00% - 9.00% 8.00% - 11.00% 10.00% +
Class A Class B Class C
Stabilized Cap Rates Trend* Return on Cost
for Value-AddStabilized Cap Rates Trend* Return on Cost
for Value-AddStabilized Cap Rates Trend* Return on Cost
for Value-Add
Decrease
Remain Flat
Increase
AtlantaAustinDallasHoustonJacksonvilleMemphisMiamiNashvilleOrlandoSan AntonioTampa
FORECAST TRENDS*
Class A Class B Class C
Stabilized Cap Rates
Return on Cost for Value-Add
Stabilized Cap Rates
Return on Cost for Value-Add
Stabilized Cap Rates
Return on Cost for Value-Add
* Forecast trends represent the CBRE professionals’ opinion on where ratios are likely to trend in 2nd half of 2013 in their local market.
* Compared to 2nd Half 2012
IN THIS ISSUE:
Overview
Office
Multi-housing
Retail
Industrial
Hotels
Appendix
Cap Rate Survey First Half 2013
30
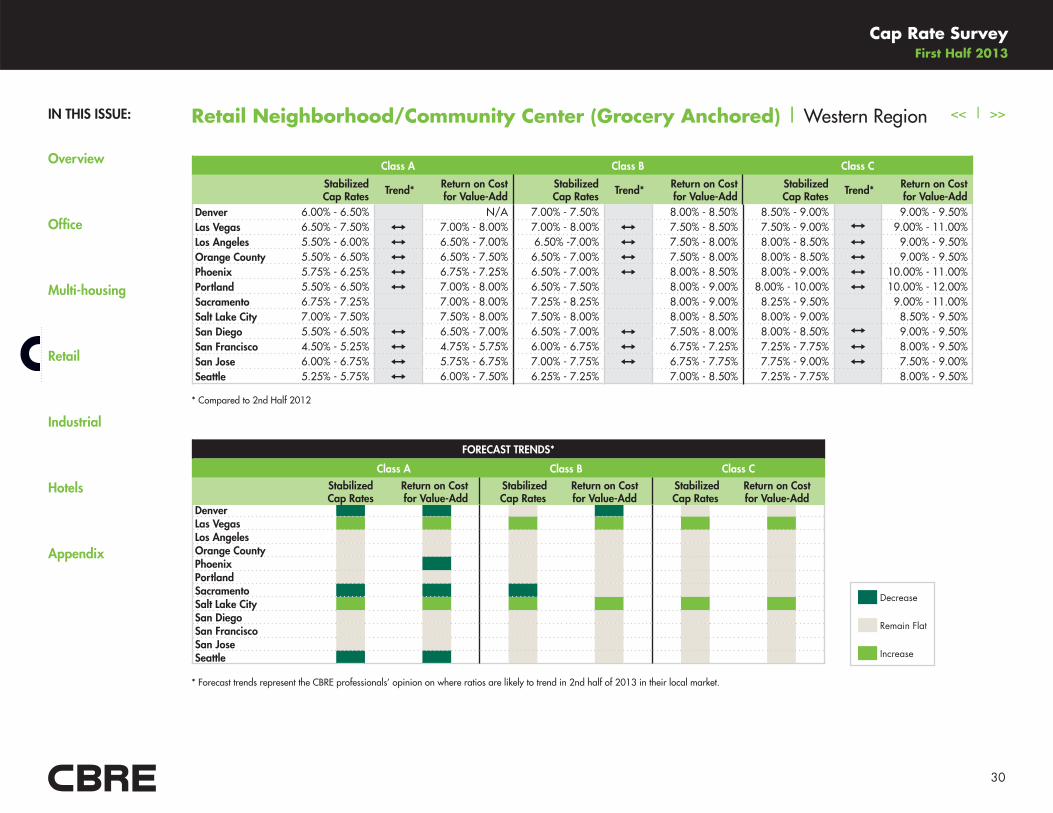
<< | >>Retail Neighborhood/Community Center (Grocery Anchored) | Western Region
Denver 6.00% - 6.50%
�
N/A 7.00% - 7.50%
�
8.00% - 8.50% 8.50% - 9.00%
�
9.00% - 9.50%Las Vegas 6.50% - 7.50% 7.00% - 8.00% 7.00% - 8.00% 7.50% - 8.50% 7.50% - 9.00% 9.00% - 11.00%Los Angeles 5.50% - 6.00% 6.50% - 7.00% 6.50% -7.00% 7.50% - 8.00% 8.00% - 8.50% 9.00% - 9.50%Orange County 5.50% - 6.50% 6.50% - 7.50% 6.50% - 7.00% 7.50% - 8.00% 8.00% - 8.50% 9.00% - 9.50%Phoenix 5.75% - 6.25% 6.75% - 7.25% 6.50% - 7.00% 8.00% - 8.50% 8.00% - 9.00% 10.00% - 11.00%Portland 5.50% - 6.50% 7.00% - 8.00% 6.50% - 7.50%
�
8.00% - 9.00% 8.00% - 10.00% 10.00% - 12.00% Sacramento 6.75% - 7.25%
�
7.00% - 8.00% 7.25% - 8.25%
�
8.00% - 9.00% 8.25% - 9.50%
�
9.00% - 11.00%Salt Lake City 7.00% - 7.50%
�
7.50% - 8.00% 7.50% - 8.00%
�
8.00% - 8.50% 8.00% - 9.00%
�
8.50% - 9.50%San Diego 5.50% - 6.50% 6.50% - 7.00% 6.50% - 7.00% 7.50% - 8.00% 8.00% - 8.50% 9.00% - 9.50%San Francisco 4.50% - 5.25% 4.75% - 5.75% 6.00% - 6.75% 6.75% - 7.25% 7.25% - 7.75% 8.00% - 9.50%San Jose 6.00% - 6.75% 5.75% - 6.75% 7.00% - 7.75% 6.75% - 7.75% 7.75% - 9.00% 7.50% - 9.00%Seattle 5.25% - 5.75% 6.00% - 7.50% 6.25% - 7.25%
�
7.00% - 8.50% 7.25% - 7.75%
�
8.00% - 9.50%
Class A Class B Class C
Stabilized Cap Rates Trend* Return on Cost
for Value-AddStabilized Cap Rates Trend* Return on Cost
for Value-AddStabilized Cap Rates Trend* Return on Cost
for Value-Add
Decrease
Remain Flat
Increase
DenverLas VegasLos AngelesOrange CountyPhoenixPortlandSacramentoSalt Lake CitySan DiegoSan FranciscoSan JoseSeattle
FORECAST TRENDS*
Class A Class B Class C
Stabilized Cap Rates
Return on Cost for Value-Add
Stabilized Cap Rates
Return on Cost for Value-Add
Stabilized Cap Rates
Return on Cost for Value-Add
* Forecast trends represent the CBRE professionals’ opinion on where ratios are likely to trend in 2nd half of 2013 in their local market.
* Compared to 2nd Half 2012
IN THIS ISSUE:
Overview
Office
Multi-housing
Retail
Industrial
Hotels
Appendix
Cap Rate Survey First Half 2013
31
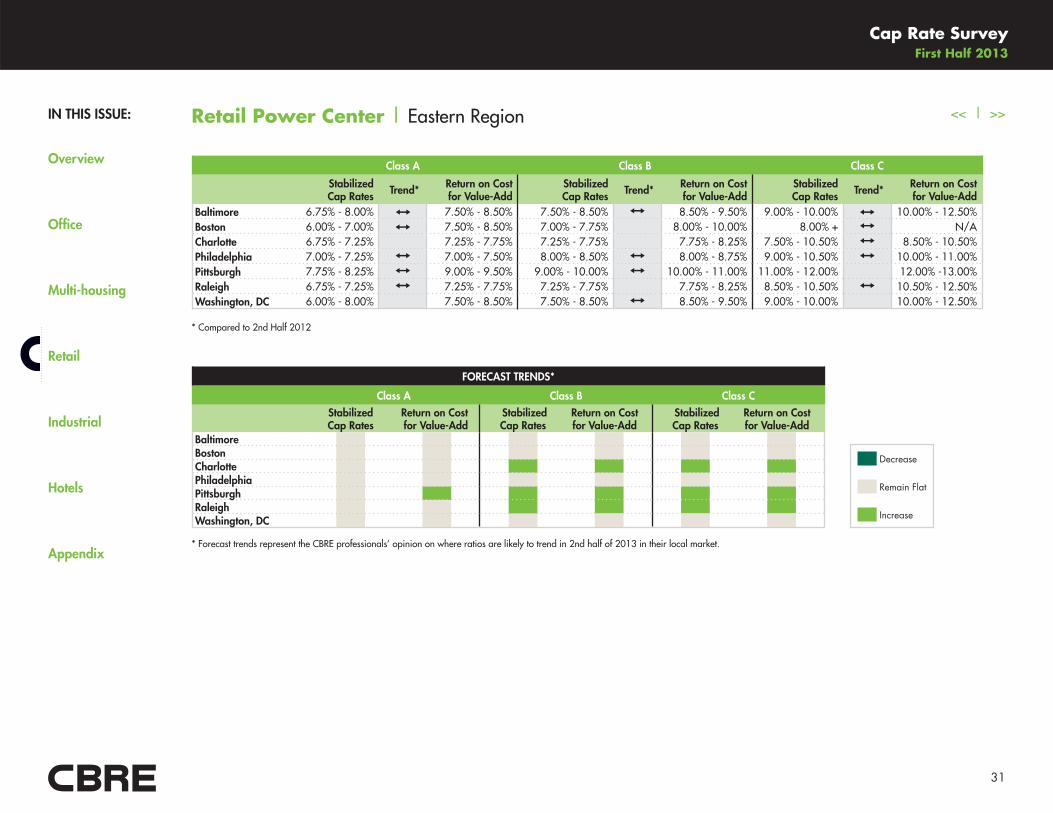
<< | >>Retail Power Center | Eastern Region
Class A Class B Class C
Stabilized Cap Rates Trend* Return on Cost
for Value-AddStabilized Cap Rates Trend* Return on Cost
for Value-AddStabilized Cap Rates Trend* Return on Cost
for Value-AddBaltimore 6.75% - 8.00% 7.50% - 8.50% 7.50% - 8.50% 8.50% - 9.50% 9.00% - 10.00% 10.00% - 12.50%Boston 6.00% - 7.00% 7.50% - 8.50% 7.00% - 7.75%
�
8.00% - 10.00% 8.00% + N/ACharlotte 6.75% - 7.25%
�
7.25% - 7.75% 7.25% - 7.75%
�
7.75% - 8.25% 7.50% - 10.50% 8.50% - 10.50%Philadelphia 7.00% - 7.25% 7.00% - 7.50% 8.00% - 8.50% 8.00% - 8.75% 9.00% - 10.50% 10.00% - 11.00%Pittsburgh 7.75% - 8.25% 9.00% - 9.50% 9.00% - 10.00% 10.00% - 11.00% 11.00% - 12.00% � 12.00% -13.00%Raleigh 6.75% - 7.25% 7.25% - 7.75% 7.25% - 7.75%
�
7.75% - 8.25% 8.50% - 10.50% 10.50% - 12.50%Washington, DC 6.00% - 8.00%
�
7.50% - 8.50% 7.50% - 8.50% 8.50% - 9.50% 9.00% - 10.00% � 10.00% - 12.50%
Decrease
Remain Flat
Increase
* Forecast trends represent the CBRE professionals’ opinion on where ratios are likely to trend in 2nd half of 2013 in their local market.
FORECAST TRENDS*
Class A Class B Class C
Stabilized Cap Rates
Return on Cost for Value-Add
Stabilized Cap Rates
Return on Cost for Value-Add
Stabilized Cap Rates
Return on Cost for Value-Add
BaltimoreBostonCharlottePhiladelphiaPittsburghRaleighWashington, DC
* Compared to 2nd Half 2012
IN THIS ISSUE:
Overview
Office
Multi-housing
Retail
Industrial
Hotels
Appendix
Cap Rate Survey First Half 2013
32
<< | >>Retail Power Center | Midwestern Region
Chicago 6.25% - 6.50% 6.75% - 7.25% 6.75% - 7.25%
�
7.75% - 8.25% 7.50% - 8.00%
�
9.00% - 9.50%Cincinnati 6.75% - 7.50%
�
7.75% - 8.75% 7.50% - 8.00%
�
8.50% - 10.00% 9.00% - 10.00% 10.00% - 11.00%Cleveland 6.75% - 7.25%
�
7.25% - 7.75% 7.50% - 8.00%
�
8.25% - 8.75% 8.25% - 8.75%
�
9.75% - 10.25%Columbus 6.50% - 7.00%
�
7.00% - 7.50% 7.25% - 7.75%
�
8.00% - 8.50% 8.00% - 8.50%
�
9.50% - 10.00%Detroit 7.50% - 8.50% 9.00% - 10.50% 8.50% - 9.50% 10.50% - 12.50% 9.50% - 11.00%
�
12.50% - 15.00%Indianapolis 6.50% - 7.00%
�
7.00% - 7.50% 7.25% - 7.75%
�
8.00% - 8.50% 8.00% - 8.50%
�
9.50% - 10.00%Kansas City 6.50% - 7.00%
�
7.00% - 7.50% 7.25% - 7.75%
�
8.00% - 8.50% 8.00% - 8.50%
�
9.50% - 10.00%Minneapolis 7.00% - 7.50% � 8.50% - 9.25% 7.50% - 8.00%
�
9.00% - 9.75% 8.00% - 8.50%
�
9.50% - 10.00%St. Louis 6.50% - 7.00%
�
7.00% - 7.50% 7.25% - 7.75%
�
8.00% - 8.50% 8.00% - 8.50%
�
9.50% - 10.00%
Class A Class B Class C
Stabilized Cap Rates Trend* Return on Cost
for Value-AddStabilized Cap Rates Trend* Return on Cost
for Value-AddStabilized Cap Rates Trend* Return on Cost
for Value-Add
Decrease
Remain Flat
Increase
ChicagoCincinnatiClevelandColumbusDetroitIndianapolisKansas CityMinneapolisSt. Louis
FORECAST TRENDS*
Class A Class B Class C
Stabilized Cap Rates
Return on Cost for Value-Add
Stabilized Cap Rates
Return on Cost for Value-Add
Stabilized Cap Rates
Return on Cost for Value-Add
* Forecast trends represent the CBRE professionals’ opinion on where ratios are likely to trend in 2nd half of 2013 in their local market.
* Compared to 2nd Half 2012
IN THIS ISSUE:
Overview
Office
Multi-housing
Retail
Industrial
Hotels
Appendix
Cap Rate Survey First Half 2013
33
<< | >>Retail Power Center | Southern Region
Decrease
Remain Flat
Increase
Class A Class B Class C
Stabilized Cap Rates Trend* Return on Cost
for Value-AddStabilized Cap Rates Trend* Return on Cost
for Value-AddStabilized Cap Rates Trend* Return on Cost
for Value-AddAtlanta 6.75% - 7.50%
�
7.50% - 8.50% 7.50% - 8.50%
�
8.00% - 9.00% 8.50% - 10.00%
�
9.00% - 10.00%Austin 6.75% - 7.25% � 7.25% - 7.75% 7.25% - 8.25%
�
7.75% - 8.75% 8.50% - 9.25%
�
9.00% - 9.75%Dallas 7.00% - 7.50% � 8.00% - 8.50% 8.00% - 8.75% 8.50% - 9.00% 9.75% 9.50% - 10.50%Houston 6.50% - 7.00% 9.00% - 10.00% 7.00% - 8.75%
�
9.50% - 10.50% 8.25% - 9.50%
�
10.50% - 11.50%Jacksonville 7.00% - 7.50% 8.50% - 9.50% 7.50% - 8.00% 9.50% - 10.50% 10.00% - 10.50% 11.00% - 12.00%Memphis 8.25% - 8.50% 8.50% - 9.00% 8.75% - 9.75% 9.50% - 10.00% 10.00% - 11.00% 11.00% - 12.00%Miami 6.00% - 7.00%
�
7.00% - 8.00% 6.50% - 7.50%
�
7.50% - 9.00% N/A N/A 8.00% - 10.00%Nashville 7.00% - 7.50% 8.00% - 8.50% 8.00% - 8.50% 9.00% - 9.50% 9.00% - 9.50% 10.00% - 10.50%Orlando 6.25% - 6.75%
�
7.00% - 8.00% 6.75% - 7.50%
�
8.00% - 9.00% 8.00% - 11.00% 10.00% +San Antonio 7.00% - 7.50% 7.50% - 8.00% 7.50% - 8.00%
�
8.00% - 8.50% 8.00% - 8.75%
�
8.50% - 9.25%Tampa 6.25% - 6.75%
�
7.00% - 8.00% 6.75% - 7.50%
�
8.00% - 9.00% 8.00% - 11.00% 10.00% +
AtlantaAustinDallasHoustonJacksonvilleMemphisMiamiNashvilleOrlandoSan AntonioTampa
FORECAST TRENDS*
Class A Class B Class C
Stabilized Cap Rates
Return on Cost for Value-Add
Stabilized Cap Rates
Return on Cost for Value-Add
Stabilized Cap Rates
Return on Cost for Value-Add
* Forecast trends represent the CBRE professionals’ opinion on where ratios are likely to trend in 2nd half of 2013 in their local market.
* Compared to 2nd Half 2012
IN THIS ISSUE:
Overview
Office
Multi-housing
Retail
Industrial
Hotels
Appendix
Cap Rate Survey First Half 2013
34
<< | >>Retail Power Center | Western Region
Decrease
Remain Flat
Increase
Denver 6.00% - 6.50%
�
N/A 7.75% - 8.25% 8.75% - 9.25% 9.00% - 9.50%
�
9.50% - 10.00%Las Vegas 6.50% - 7.50% 7.50% - 8.50% 7.00% - 8.00% 8.25% - 9.25% 7.50% - 9.00% 9.50% - 11.00%Los Angeles 6.00% - 6.50% 7.00% - 7.50% 7.00% - 7.50%
�
8.00% - 8.50% 8.00% - 8.50%
�
9.00% - 9.50%Orange County 6.00% - 6.50% 7.00% - 7.50% 7.00% - 7.50%
�
8.00% - 8.50% 8.00% - 8.50%
�
9.00% - 9.50%Phoenix 6.00% - 6.50% 7.00% - 7.50% 6.50% - 7.50% 8.00% - 9.00% 8.00% - 9.00% 10.00% -11.00%Portland 6.00% - 7.00% 7.50% - 8.50% 7.00% - 8.00%
�
8.50% - 9.50% 8.50% - 10.50% 11.00% - 13.00%Sacramento 6.50% - 7.25% 7.00% - 8.00% 7.25% - 8.00% 8.00% - 9.00% 8.25% - 9.00%
�
9.00% - 10.00%Salt Lake City 7.25% - 7.75%
�
7.75% - 8.25% 8.00% - 8.50% 8.50% - 9.50% 8.50% - 9.50%
�
9.00% - 9.50%San Diego 6.00% - 6.50% 7.00% - 7.50% 7.00% - 7.50%
�
8.00% - 8.50% 8.00% - 8.50%
�
9.00% - 9.50%San Francisco 5.25% - 6.25% 6.75% - 8.00% 6.00% - 6.75% 6.25% - 6.75% 8.00% - 9.00% 8.00% - 9.25%San Jose 6.25% - 6.75% 7.00% - 8.00% 7.25% - 7.75% 7.75% - 8.75% 9.00% - 9.50% 9.50% - 11.00%Seattle 6.00% - 7.00%
�
7.00% - 9.00% 7.00% - 8.00%
�
8.50% - 10.00% 8.00% - 9.00%
�
9.50% - 11.00%
Class A Class B Class C
Stabilized Cap Rates Trend* Return on Cost
for Value-AddStabilized Cap Rates Trend* Return on Cost
for Value-AddStabilized Cap Rates Trend* Return on Cost
for Value-Add
FORECAST TRENDS*
Class A Class B Class C
Stabilized Cap Rates
Return on Cost for Value-Add
Stabilized Cap Rates
Return on Cost for Value-Add
Stabilized Cap Rates
Return on Cost for Value-Add
DenverLas VegasLos AngelesOrange CountyPhoenixPortlandSacramentoSalt Lake CitySan DiegoSan FranciscoSan JoseSeattle
* Forecast trends represent the CBRE professionals’ opinion on where ratios are likely to trend in 2nd half of 2013 in their local market.
* Compared to 2nd Half 2012
IN THIS ISSUE:
Overview
Office
Multi-housing
Retail
Industrial
Hotels
Appendix
Cap Rate Survey First Half 2013
35
<< | >>High Street Retail | National
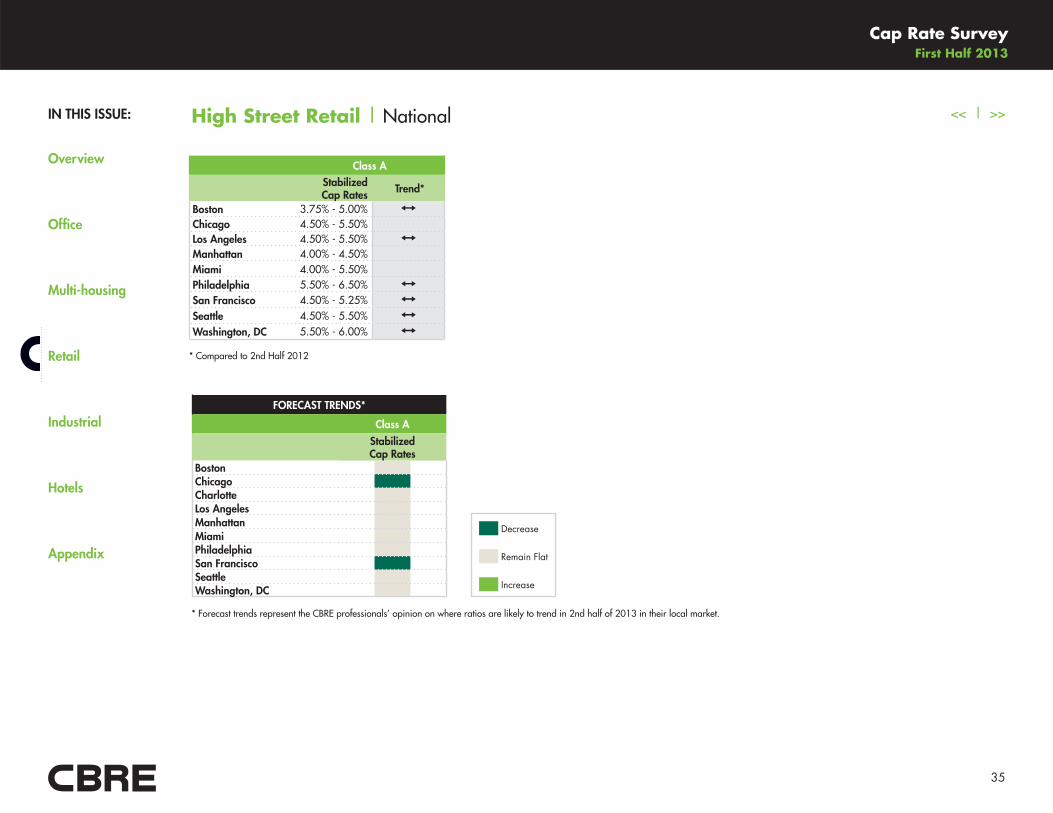
Class AStabilized Cap Rates Trend*
Boston 3.75% - 5.00%Chicago 4.50% - 5.50%
�
Los Angeles 4.50% - 5.50%Manhattan 4.00% - 4.50%
�
Miami 4.00% - 5.50%
�
Philadelphia 5.50% - 6.50%San Francisco 4.50% - 5.25%Seattle 4.50% - 5.50%Washington, DC 5.50% - 6.00%
Decrease
Remain Flat
Increase
FORECAST TRENDS*
Class A
Stabilized Cap Rates
BostonChicagoCharlotteLos AngelesManhattanMiamiPhiladelphiaSan FranciscoSeattleWashington, DC
* Compared to 2nd Half 2012
* Forecast trends represent the CBRE professionals’ opinion on where ratios are likely to trend in 2nd half of 2013 in their local market.
IN THIS ISSUE:
Overview
Office
Multi-housing
Retail
Industrial
Hotels
Appendix
Cap Rate Survey First Half 2013
36
<< | >>
For the 12 months through mid-year 2013, transaction activity in the industrial sector was $42.1 billion, up 33.7% over the year-earlier period.
Most of this growth came in the warehouse segments, which saw volume of $28.6 billion through mid-year 2013, up $9.2 billion from a year
earlier. The flex segment, by contrast, experienced an only $1.4 billion improvement to hit $13.6 billion in volume. Scaling for size, these figures
imply growth rates of 47.5% and 11.8% for the warehouse and flex segments, respectively. If total volume for the remainder of 2013 continues on
the pace set in the first half of the year, volume could reach $44.8 billion by year-end. By comparison, the average annual pace set from 2003
to 2007 was roughly $41.0 billion.
CBRE Capital Markets and Valuation professionals expect that cap rates for stabilized Class A industrial assets have largely reached the end of the
compression that began in early 2010. In 35 of the 41 markets surveyed, such cap rates are expected to be flat or increase over the next six months.
The same pattern is seen across different grades of industrial assets across the class spectrum.
CLICK TO DOWNLOAD
Select from the list below to access the current industrial key ratios, forecast and interactive map.
Download a Complete Industrial Current Key Ratios Chart (PDF)
Download a Complete Industrial Current Forecast Chart (PDF)
Download the Complete Industrial Current Key Ratios Map (Interactive PDF)NEW
Industrial | Overview
IN THIS ISSUE:
Overview
Office
Multi-housing
Retail
Industrial
Hotels
Appendix
Cap Rate Survey First Half 2013
37
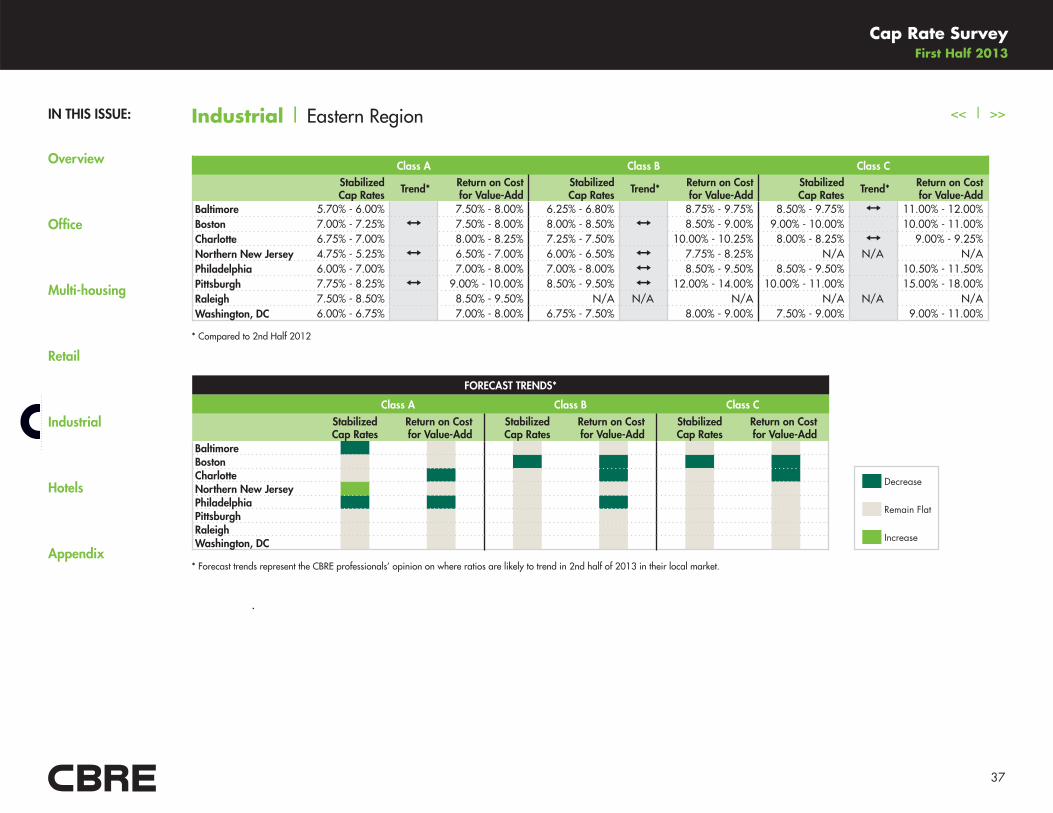
<< | >>Industrial | Eastern Region
Class A Class B Class CStabilized Cap Rates Trend* Return on Cost
for Value-AddStabilized Cap Rates Trend* Return on Cost
for Value-AddStabilized Cap Rates Trend* Return on Cost
for Value-AddBaltimore 5.70% - 6.00%
�
7.50% - 8.00% 6.25% - 6.80%
�
8.75% - 9.75% 8.50% - 9.75% 11.00% - 12.00%Boston 7.00% - 7.25% 7.50% - 8.00% 8.00% - 8.50% 8.50% - 9.00% 9.00% - 10.00%
�
10.00% - 11.00%Charlotte 6.75% - 7.00%
�
8.00% - 8.25% 7.25% - 7.50%
�
10.00% - 10.25% 8.00% - 8.25% 9.00% - 9.25%Northern New Jersey 4.75% - 5.25% 6.50% - 7.00% 6.00% - 6.50% 7.75% - 8.25% N/A N/A N/APhiladelphia 6.00% - 7.00% � 7.00% - 8.00% 7.00% - 8.00% 8.50% - 9.50% 8.50% - 9.50% � 10.50% - 11.50%Pittsburgh 7.75% - 8.25% 9.00% - 10.00% 8.50% - 9.50% 12.00% - 14.00% 10.00% - 11.00% � 15.00% - 18.00%Raleigh 7.50% - 8.50% � 8.50% - 9.50% N/A N/A N/A N/A N/A N/AWashington, DC 6.00% - 6.75%
�
7.00% - 8.00% 6.75% - 7.50%
�
8.00% - 9.00% 7.50% - 9.00%
�
9.00% - 11.00%
FORECAST TRENDS*
Class A Class B Class C
Stabilized Cap Rates
Return on Cost for Value-Add
Stabilized Cap Rates
Return on Cost for Value-Add
Stabilized Cap Rates
Return on Cost for Value-Add
BaltimoreBostonCharlotteNorthern New JerseyPhiladelphiaPittsburghRaleighWashington, DC
Decrease
Remain Flat
Increase
* Forecast trends represent the CBRE professionals’ opinion on where ratios are likely to trend in 2nd half of 2013 in their local market.
* Compared to 2nd Half 2012
IN THIS ISSUE:
Overview
Office
Multi-housing
Retail
Industrial
Hotels
Appendix
Cap Rate Survey First Half 2013
38
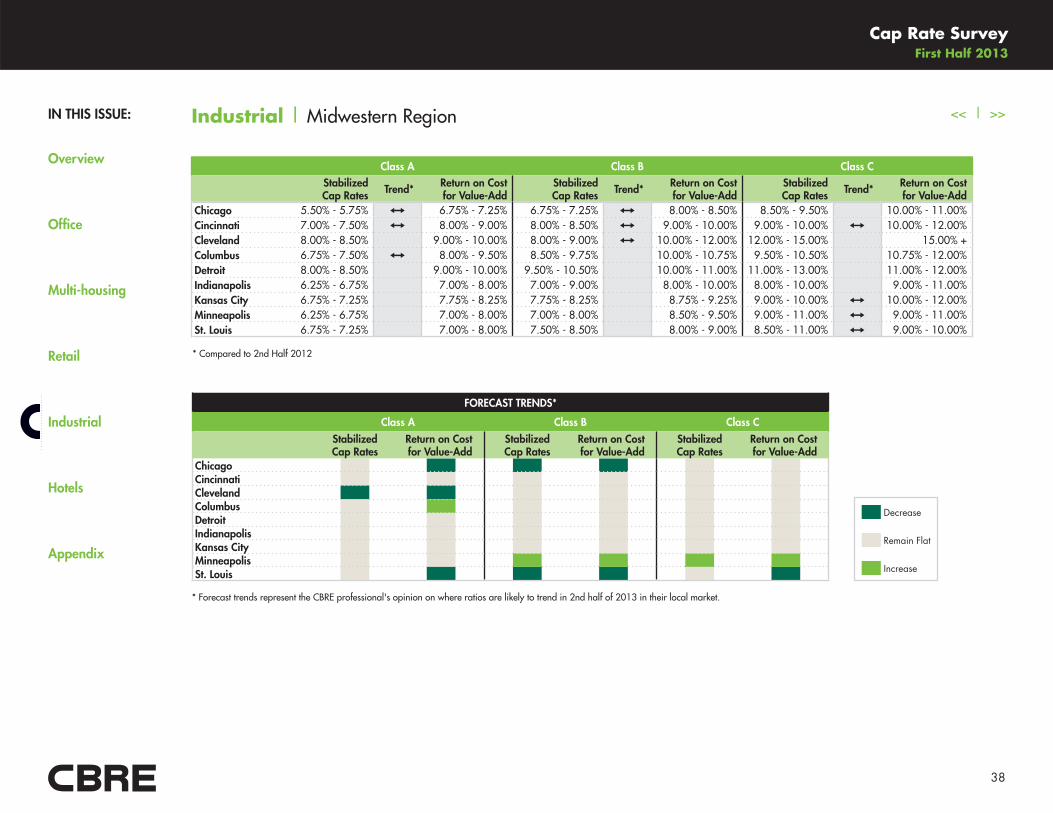
<< | >>Industrial | Midwestern Region
Chicago 5.50% - 5.75% 6.75% - 7.25% 6.75% - 7.25% 8.00% - 8.50% 8.50% - 9.50% � 10.00% - 11.00%Cincinnati 7.00% - 7.50% 8.00% - 9.00% 8.00% - 8.50% 9.00% - 10.00% 9.00% - 10.00% 10.00% - 12.00%Cleveland 8.00% - 8.50% � 9.00% - 10.00% 8.00% - 9.00% 10.00% - 12.00% 12.00% - 15.00% � 15.00% +Columbus 6.75% - 7.50% 8.00% - 9.50% 8.50% - 9.75% � 10.00% - 10.75% 9.50% - 10.50%
�
10.75% - 12.00%Detroit 8.00% - 8.50% � 9.00% - 10.00% 9.50% - 10.50% � 10.00% - 11.00% 11.00% - 13.00% � 11.00% - 12.00%Indianapolis 6.25% - 6.75%
�
7.00% - 8.00% 7.00% - 9.00%
�
8.00% - 10.00% 8.00% - 10.00%
�
9.00% - 11.00%Kansas City 6.75% - 7.25%
�
7.75% - 8.25% 7.75% - 8.25%
�
8.75% - 9.25% 9.00% - 10.00% 10.00% - 12.00%Minneapolis 6.25% - 6.75%
�
7.00% - 8.00% 7.00% - 8.00%
�
8.50% - 9.50% 9.00% - 11.00% 9.00% - 11.00%St. Louis 6.75% - 7.25%
�
7.00% - 8.00% 7.50% - 8.50%
�
8.00% - 9.00% 8.50% - 11.00% 9.00% - 10.00%
Class A Class B Class CStabilized Cap Rates Trend* Return on Cost
for Value-AddStabilized Cap Rates Trend* Return on Cost
for Value-AddStabilized Cap Rates Trend* Return on Cost
for Value-Add
* Compared to 2nd Half 2012
Decrease
Remain Flat
Increase
ChicagoCincinnatiClevelandColumbusDetroitIndianapolisKansas CityMinneapolisSt. Louis
* Forecast trends represent the CBRE professional's opinion on where ratios are likely to trend in 2nd half of 2013 in their local market.
FORECAST TRENDS*
Class A Class B Class C
Stabilized Cap Rates
Return on Cost for Value-Add
Stabilized Cap Rates
Return on Cost for Value-Add
Stabilized Cap Rates
Return on Cost for Value-Add
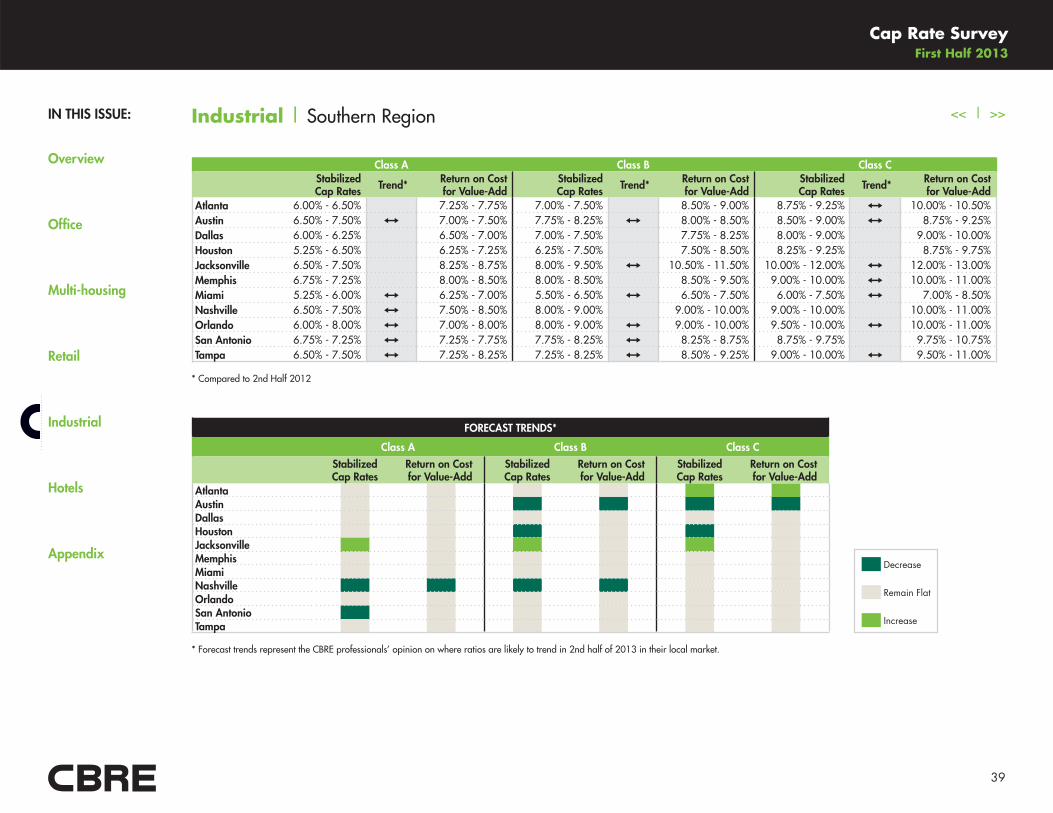
IN THIS ISSUE:
Overview
Office
Multi-housing
Retail
Industrial
Hotels
Appendix
Cap Rate Survey First Half 2013
39
<< | >>Industrial | Southern Region
Class A Class B Class CStabilized Cap Rates Trend* Return on Cost
for Value-AddStabilized Cap Rates Trend* Return on Cost
for Value-AddStabilized Cap Rates Trend* Return on Cost
for Value-AddAtlanta 6.00% - 6.50%
�
7.25% - 7.75% 7.00% - 7.50%
�
8.50% - 9.00% 8.75% - 9.25% 10.00% - 10.50%Austin 6.50% - 7.50% 7.00% - 7.50% 7.75% - 8.25% 8.00% - 8.50% 8.50% - 9.00% 8.75% - 9.25%Dallas 6.00% - 6.25%
�
6.50% - 7.00% 7.00% - 7.50%
�
7.75% - 8.25% 8.00% - 9.00%
�
9.00% - 10.00%Houston 5.25% - 6.50%
�
6.25% - 7.25% 6.25% - 7.50%
�
7.50% - 8.50% 8.25% - 9.25%
�
8.75% - 9.75%Jacksonville 6.50% - 7.50%
�
8.25% - 8.75% 8.00% - 9.50% 10.50% - 11.50% 10.00% - 12.00% 12.00% - 13.00%Memphis 6.75% - 7.25%
�
8.00% - 8.50% 8.00% - 8.50%
�
8.50% - 9.50% 9.00% - 10.00% 10.00% - 11.00%Miami 5.25% - 6.00% 6.25% - 7.00% 5.50% - 6.50% 6.50% - 7.50% 6.00% - 7.50% 7.00% - 8.50%Nashville 6.50% - 7.50% 7.50% - 8.50% 8.00% - 9.00%
�
9.00% - 10.00% 9.00% - 10.00%
�
10.00% - 11.00%Orlando 6.00% - 8.00% 7.00% - 8.00% 8.00% - 9.00% 9.00% - 10.00% 9.50% - 10.00% 10.00% - 11.00%San Antonio 6.75% - 7.25% 7.25% - 7.75% 7.75% - 8.25% 8.25% - 8.75% 8.75% - 9.75%
�
9.75% - 10.75%Tampa 6.50% - 7.50% 7.25% - 8.25% 7.25% - 8.25% 8.50% - 9.25% 9.00% - 10.00% 9.50% - 11.00%
* Forecast trends represent the CBRE professionals’ opinion on where ratios are likely to trend in 2nd half of 2013 in their local market.
* Compared to 2nd Half 2012
* Compared to 2nd Half 2012
AtlantaAustinDallasHoustonJacksonvilleMemphisMiamiNashvilleOrlandoSan AntonioTampa
FORECAST TRENDS*
Class A Class B Class C
Stabilized Cap Rates
Return on Cost for Value-Add
Stabilized Cap Rates
Return on Cost for Value-Add
Stabilized Cap Rates
Return on Cost for Value-Add
Decrease
Remain Flat
Increase
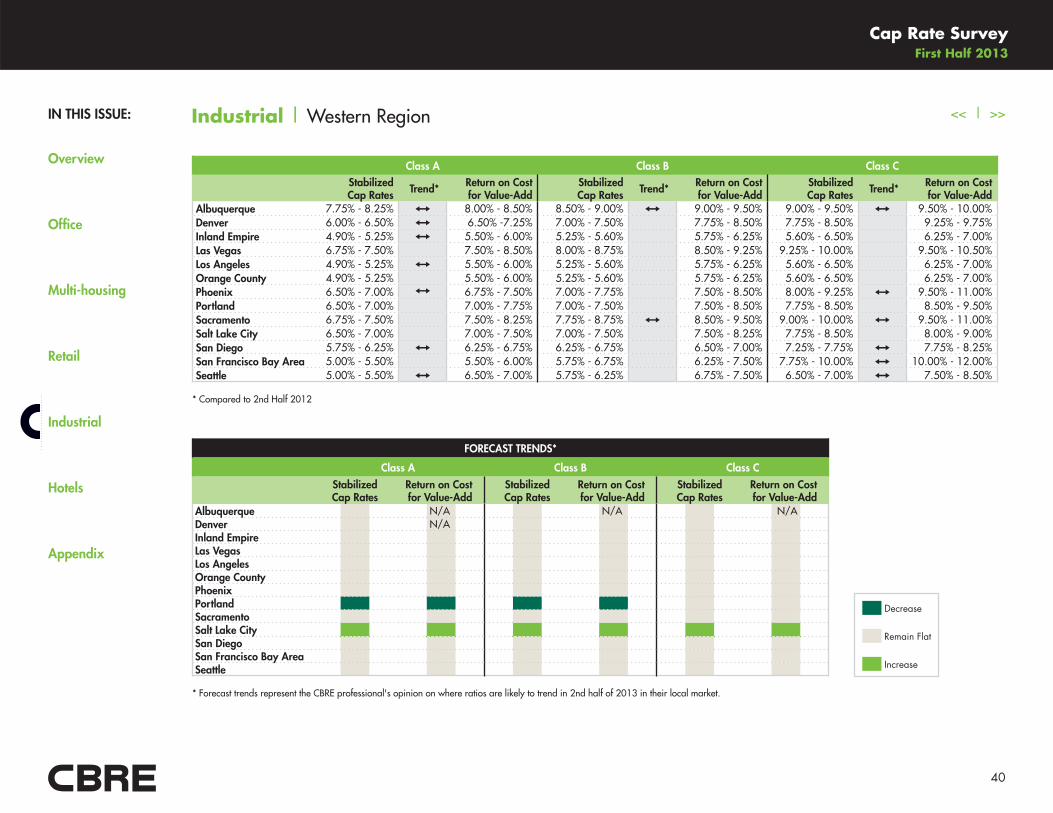
IN THIS ISSUE:
Overview
Office
Multi-housing
Retail
Industrial
Hotels
Appendix
Cap Rate Survey First Half 2013
40
<< | >>Industrial | Western Region
Albuquerque 7.75% - 8.25% 8.00% - 8.50% 8.50% - 9.00% 9.00% - 9.50% 9.00% - 9.50% 9.50% - 10.00%Denver 6.00% - 6.50% 6.50% -7.25% 7.00% - 7.50% � 7.75% - 8.50% 7.75% - 8.50%
�
9.25% - 9.75%Inland Empire 4.90% - 5.25% 5.50% - 6.00% 5.25% - 5.60%
�
5.75% - 6.25% 5.60% - 6.50%
�
6.25% - 7.00%Las Vegas 6.75% - 7.50%
�
7.50% - 8.50% 8.00% - 8.75%
�
8.50% - 9.25% 9.25% - 10.00%
�
9.50% - 10.50%Los Angeles 4.90% - 5.25% 5.50% - 6.00% 5.25% - 5.60%
�
5.75% - 6.25% 5.60% - 6.50%
�
6.25% - 7.00%Orange County 4.90% - 5.25%
�
5.50% - 6.00% 5.25% - 5.60%
�
5.75% - 6.25% 5.60% - 6.50%
�
6.25% - 7.00%Phoenix 6.50% - 7.00% 6.75% - 7.50% 7.00% - 7.75%
�
7.50% - 8.50% 8.00% - 9.25% 9.50% - 11.00%Portland 6.50% - 7.00%
�
7.00% - 7.75% 7.00% - 7.50%
�
7.50% - 8.50% 7.75% - 8.50%
�
8.50% - 9.50%Sacramento 6.75% - 7.50%
�
7.50% - 8.25% 7.75% - 8.75% 8.50% - 9.50% 9.00% - 10.00% 9.50% - 11.00%Salt Lake City 6.50% - 7.00%
�
7.00% - 7.50% 7.00% - 7.50%
�
7.50% - 8.25% 7.75% - 8.50%
�
8.00% - 9.00%San Diego 5.75% - 6.25% 6.25% - 6.75% 6.25% - 6.75%
�
6.50% - 7.00% 7.25% - 7.75% 7.75% - 8.25%San Francisco Bay Area 5.00% - 5.50%
�
5.50% - 6.00% 5.75% - 6.75%
�
6.25% - 7.50% 7.75% - 10.00% 10.00% - 12.00%Seattle 5.00% - 5.50% 6.50% - 7.00% 5.75% - 6.25%
�
6.75% - 7.50% 6.50% - 7.00% 7.50% - 8.50%
Class A Class B Class CStabilized Cap Rates Trend* Return on Cost
for Value-AddStabilized Cap Rates Trend* Return on Cost
for Value-AddStabilized Cap Rates Trend* Return on Cost
for Value-Add
* Compared to 2nd Half 2012
Decrease
Remain Flat
Increase
* Forecast trends represent the CBRE professional's opinion on where ratios are likely to trend in 2nd half of 2013 in their local market.
Albuquerque N/A N/A N/ADenver N/AInland EmpireLas VegasLos AngelesOrange CountyPhoenixPortlandSacramentoSalt Lake CitySan DiegoSan Francisco Bay AreaSeattle
FORECAST TRENDS*
Class A Class B Class C
Stabilized Cap Rates
Return on Cost for Value-Add
Stabilized Cap Rates
Return on Cost for Value-Add
Stabilized Cap Rates
Return on Cost for Value-Add
IN THIS ISSUE:
Overview
Office
Multi-housing
Retail
Industrial
Hotels
Appendix
Cap Rate Survey First Half 2013
41
<< | >>
The CBRE Cap Rate Survey provides information on the hotels sector that is unavailable elsewhere. With transaction volume representing
roughly 10% of total activity across all commercial property types, the hotels sector often does not offer a sufficient number of transactions to
develop reliable sales comparables. For markets in which comparable sales are thin, we combine the insights of CBRE Capital Markets and
Valuation professionals to gauge the levels at which assets will trade.
Hotel transaction activity through mid-year 2013 was up 37.9% from the year-earlier period. According to RCA, investment volume in the past
12 months stood at $25.5 billion. This increased activity was heavily weighted in the limited-service sector, which saw volume growth of 87.2%
during first-half 2013, with total volume in the last 12 months of $8.1 billion. While investors are venturing into the limited-service sector once
again, the full-service segment is seeing increased volume as well. In the 12 months through mid-year 2013, volume in that sector totaled $17.4
billion, up 22.9% from the period one year earlier.
Data from the CBRE Cap Rate Survey suggest that the cap rate compression seen in the hotel sector starting in 2009 is now at an end. In only
one of the 38 markets surveyed did the Capital Markets and Valuation teams expect the luxury segment to see ongoing decreases in cap rates
over the next six months. Even in the economy segments, to which investors have only recently returned, there is little expectation of ongoing
cap rate compression, with only four of the 38 surveyed markets expected to see declines.
CLICK TO DOWNLOAD
Select from the list below to access the current hotels key ratios, forecast and interactive map.
Download a Complete Hotels Current Key Ratios Chart (PDF)
Download a Complete Hotels Current Forecast Chart (PDF)
Download the Complete Hotels Current Key Ratios Map (Interactive PDF)NEW
Hotels | Overview
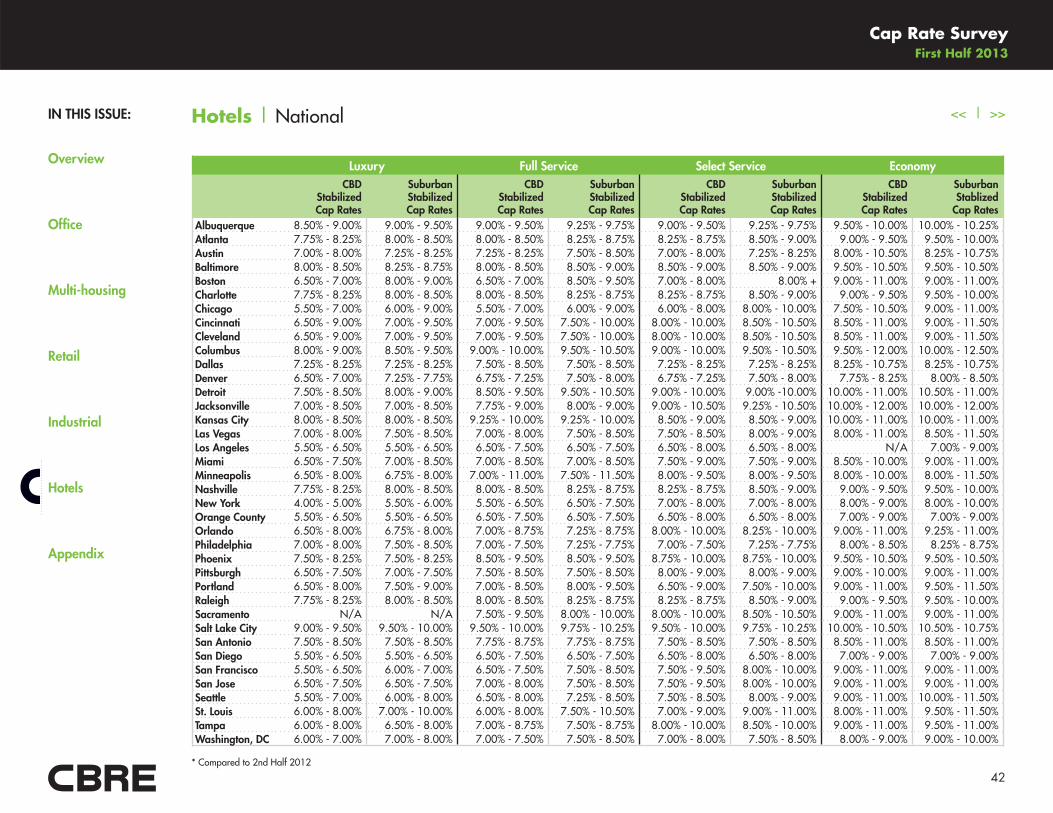
IN THIS ISSUE:
Overview
Office
Multi-housing
Retail
Industrial
Hotels
Appendix
Cap Rate Survey First Half 2013
42
<< | >>Hotels | National
Luxury Full Service Select Service Economy CBD
Stabilized Cap Rates
Suburban StabilizedCap Rates
CBD StabilizedCap Rates
Suburban StabilizedCap Rates
CBD StabilizedCap Rates
Suburban StabilizedCap Rates
CBD StabilizedCap Rates
Suburban Stablized
Cap RatesAlbuquerque 8.50% - 9.00% 9.00% - 9.50% 9.00% - 9.50% 9.25% - 9.75% 9.00% - 9.50% 9.25% - 9.75% 9.50% - 10.00% 10.00% - 10.25%Atlanta 7.75% - 8.25% 8.00% - 8.50% 8.00% - 8.50% 8.25% - 8.75% 8.25% - 8.75% 8.50% - 9.00% 9.00% - 9.50% 9.50% - 10.00%Austin 7.00% - 8.00% 7.25% - 8.25% 7.25% - 8.25% 7.50% - 8.50% 7.00% - 8.00% 7.25% - 8.25% 8.00% - 10.50% 8.25% - 10.75%Baltimore 8.00% - 8.50% 8.25% - 8.75% 8.00% - 8.50% 8.50% - 9.00% 8.50% - 9.00% 8.50% - 9.00% 9.50% - 10.50% 9.50% - 10.50%Boston 6.50% - 7.00% 8.00% - 9.00% 6.50% - 7.00% 8.50% - 9.50% 7.00% - 8.00% 8.00% + 9.00% - 11.00% 9.00% - 11.00%Charlotte 7.75% - 8.25% 8.00% - 8.50% 8.00% - 8.50% 8.25% - 8.75% 8.25% - 8.75% 8.50% - 9.00% 9.00% - 9.50% 9.50% - 10.00%Chicago 5.50% - 7.00% 6.00% - 9.00% 5.50% - 7.00% 6.00% - 9.00% 6.00% - 8.00% 8.00% - 10.00% 7.50% - 10.50% 9.00% - 11.00%Cincinnati 6.50% - 9.00% 7.00% - 9.50% 7.00% - 9.50% 7.50% - 10.00% 8.00% - 10.00% 8.50% - 10.50% 8.50% - 11.00% 9.00% - 11.50%Cleveland 6.50% - 9.00% 7.00% - 9.50% 7.00% - 9.50% 7.50% - 10.00% 8.00% - 10.00% 8.50% - 10.50% 8.50% - 11.00% 9.00% - 11.50%Columbus 8.00% - 9.00% 8.50% - 9.50% 9.00% - 10.00% 9.50% - 10.50% 9.00% - 10.00% 9.50% - 10.50% 9.50% - 12.00% 10.00% - 12.50%Dallas 7.25% - 8.25% 7.25% - 8.25% 7.50% - 8.50% 7.50% - 8.50% 7.25% - 8.25% 7.25% - 8.25% 8.25% - 10.75% 8.25% - 10.75%Denver 6.50% - 7.00% 7.25% - 7.75% 6.75% - 7.25% 7.50% - 8.00% 6.75% - 7.25% 7.50% - 8.00% 7.75% - 8.25% 8.00% - 8.50%Detroit 7.50% - 8.50% 8.00% - 9.00% 8.50% - 9.50% 9.50% - 10.50% 9.00% - 10.00% 9.00% -10.00% 10.00% - 11.00% 10.50% - 11.00%Jacksonville 7.00% - 8.50% 7.00% - 8.50% 7.75% - 9.00% 8.00% - 9.00% 9.00% - 10.50% 9.25% - 10.50% 10.00% - 12.00% 10.00% - 12.00%Kansas City 8.00% - 8.50% 8.00% - 8.50% 9.25% - 10.00% 9.25% - 10.00% 8.50% - 9.00% 8.50% - 9.00% 10.00% - 11.00% 10.00% - 11.00%Las Vegas 7.00% - 8.00% 7.50% - 8.50% 7.00% - 8.00% 7.50% - 8.50% 7.50% - 8.50% 8.00% - 9.00% 8.00% - 11.00% 8.50% - 11.50%Los Angeles 5.50% - 6.50% 5.50% - 6.50% 6.50% - 7.50% 6.50% - 7.50% 6.50% - 8.00% 6.50% - 8.00% N/A 7.00% - 9.00%Miami 6.50% - 7.50% 7.00% - 8.50% 7.00% - 8.50% 7.00% - 8.50% 7.50% - 9.00% 7.50% - 9.00% 8.50% - 10.00% 9.00% - 11.00%Minneapolis 6.50% - 8.00% 6.75% - 8.00% 7.00% - 11.00% 7.50% - 11.50% 8.00% - 9.50% 8.00% - 9.50% 8.00% - 10.00% 8.00% - 11.50%Nashville 7.75% - 8.25% 8.00% - 8.50% 8.00% - 8.50% 8.25% - 8.75% 8.25% - 8.75% 8.50% - 9.00% 9.00% - 9.50% 9.50% - 10.00%New York 4.00% - 5.00% 5.50% - 6.00% 5.50% - 6.50% 6.50% - 7.50% 7.00% - 8.00% 7.00% - 8.00% 8.00% - 9.00% 8.00% - 10.00%Orange County 5.50% - 6.50% 5.50% - 6.50% 6.50% - 7.50% 6.50% - 7.50% 6.50% - 8.00% 6.50% - 8.00% 7.00% - 9.00% 7.00% - 9.00%Orlando 6.50% - 8.00% 6.75% - 8.00% 7.00% - 8.75% 7.25% - 8.75% 8.00% - 10.00% 8.25% - 10.00% 9.00% - 11.00% 9.25% - 11.00%Philadelphia 7.00% - 8.00% 7.50% - 8.50% 7.00% - 7.50% 7.25% - 7.75% 7.00% - 7.50% 7.25% - 7.75% 8.00% - 8.50% 8.25% - 8.75%Phoenix 7.50% - 8.25% 7.50% - 8.25% 8.50% - 9.50% 8.50% - 9.50% 8.75% - 10.00% 8.75% - 10.00% 9.50% - 10.50% 9.50% - 10.50%Pittsburgh 6.50% - 7.50% 7.00% - 7.50% 7.50% - 8.50% 7.50% - 8.50% 8.00% - 9.00% 8.00% - 9.00% 9.00% - 10.00% 9.00% - 11.00%Portland 6.50% - 8.00% 7.50% - 9.00% 7.00% - 8.50% 8.00% - 9.50% 6.50% - 9.00% 7.50% - 10.00% 9.00% - 11.00% 9.50% - 11.50%Raleigh 7.75% - 8.25% 8.00% - 8.50% 8.00% - 8.50% 8.25% - 8.75% 8.25% - 8.75% 8.50% - 9.00% 9.00% - 9.50% 9.50% - 10.00%Sacramento N/A N/A 7.50% - 9.50% 8.00% - 10.00% 8.00% - 10.00% 8.50% - 10.50% 9.00% - 11.00% 9.00% - 11.00%Salt Lake City 9.00% - 9.50% 9.50% - 10.00% 9.50% - 10.00% 9.75% - 10.25% 9.50% - 10.00% 9.75% - 10.25% 10.00% - 10.50% 10.50% - 10.75%San Antonio 7.50% - 8.50% 7.50% - 8.50% 7.75% - 8.75% 7.75% - 8.75% 7.50% - 8.50% 7.50% - 8.50% 8.50% - 11.00% 8.50% - 11.00%San Diego 5.50% - 6.50% 5.50% - 6.50% 6.50% - 7.50% 6.50% - 7.50% 6.50% - 8.00% 6.50% - 8.00% 7.00% - 9.00% 7.00% - 9.00%San Francisco 5.50% - 6.50% 6.00% - 7.00% 6.50% - 7.50% 7.50% - 8.50% 7.50% - 9.50% 8.00% - 10.00% 9.00% - 11.00% 9.00% - 11.00%San Jose 6.50% - 7.50% 6.50% - 7.50% 7.00% - 8.00% 7.50% - 8.50% 7.50% - 9.50% 8.00% - 10.00% 9.00% - 11.00% 9.00% - 11.00%Seattle 5.50% - 7.00% 6.00% - 8.00% 6.50% - 8.00% 7.25% - 8.50% 7.50% - 8.50% 8.00% - 9.00% 9.00% - 11.00% 10.00% - 11.50%St. Louis 6.00% - 8.00% 7.00% - 10.00% 6.00% - 8.00% 7.50% - 10.50% 7.00% - 9.00% 9.00% - 11.00% 8.00% - 11.00% 9.50% - 11.50%Tampa 6.00% - 8.00% 6.50% - 8.00% 7.00% - 8.75% 7.50% - 8.75% 8.00% - 10.00% 8.50% - 10.00% 9.00% - 11.00% 9.50% - 11.00%Washington, DC 6.00% - 7.00% 7.00% - 8.00% 7.00% - 7.50% 7.50% - 8.50% 7.00% - 8.00% 7.50% - 8.50% 8.00% - 9.00% 9.00% - 10.00%
* Compared to 2nd Half 2012
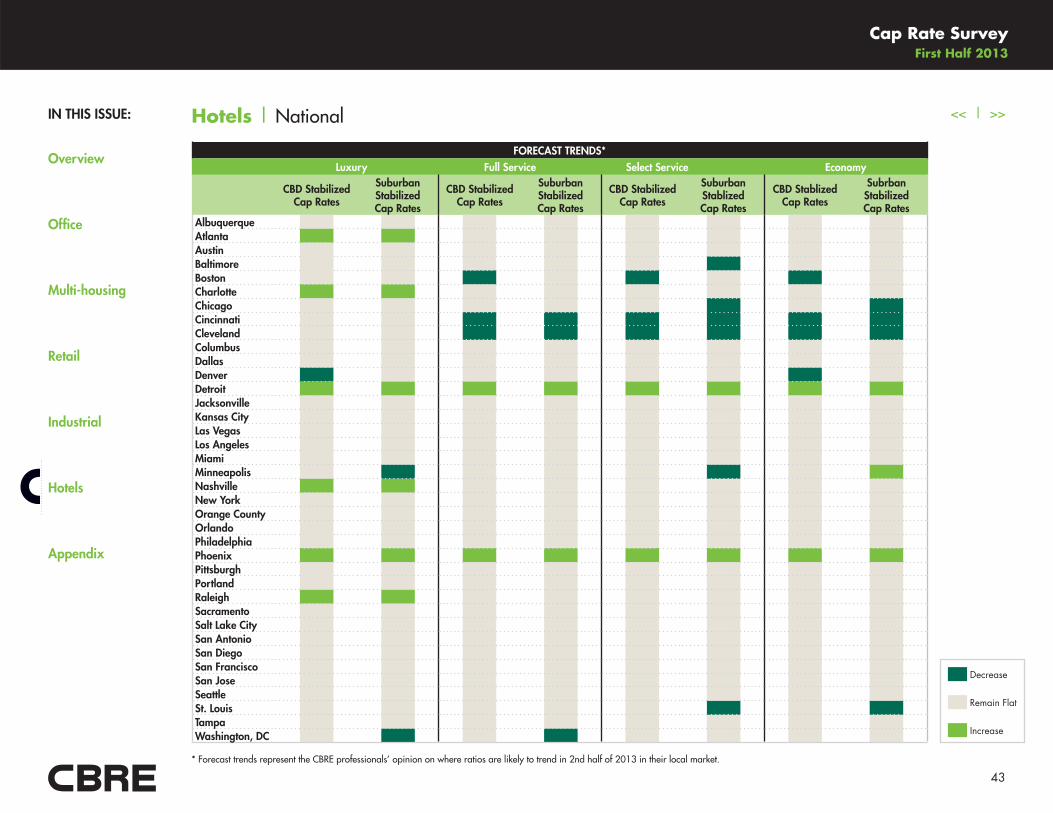
IN THIS ISSUE:
Overview
Office
Multi-housing
Retail
Industrial
Hotels
Appendix
Cap Rate Survey First Half 2013
43
<< | >>Hotels | National
FORECAST TRENDS* Luxury Full Service Select Service Economy
CBD Stabilized Cap Rates
Suburban Stabilized Cap Rates
CBD Stabilized Cap Rates
Suburban Stabilized Cap Rates
CBD Stabilized Cap Rates
Suburban Stablized Cap Rates
CBD Stablized Cap Rates
Subrban StabilizedCap Rates
AlbuquerqueAtlantaAustinBaltimoreBostonCharlotteChicagoCincinnatiClevelandColumbusDallasDenverDetroitJacksonvilleKansas CityLas VegasLos AngelesMiamiMinneapolisNashvilleNew York Orange CountyOrlandoPhiladelphiaPhoenixPittsburghPortlandRaleighSacramentoSalt Lake CitySan AntonioSan DiegoSan FranciscoSan JoseSeattleSt. LouisTampaWashington, DC
* Forecast trends represent the CBRE professionals’ opinion on where ratios are likely to trend in 2nd half of 2013 in their local market.
Decrease
Remain Flat
Increase
IN THIS ISSUE:
Overview
Office
Multi-housing
Retail
Industrial
Hotels
Appendix
Cap Rate Survey First Half 2013
44
<< | >>Appendix | Definitions
Stabilized Cap Rates (Office, Industrial, Retail, and Hotel)
Cap rate ranges are best estimates provided by CBRE professionals based on recent trades in their respective markets as well as recent
communication with investors. The ranges represent those cap rates that a given property will trade at in the current market assuming that the asset
is leased at current market rents with typical market lease terms.
Use this assumption of leasing to current market rents to calculate gross rent potential, then subtract the standard economic loss factors, including
vacancy, that would be considered representative of a stable property in your market to achieve the effective gross income estimate. Reduce
the effective gross income by the projected stabilized expenses to derive the NOI. The cap rate is then calculated as the NOI divided by the
purchase price.
The going-in cap rate refers to the initial yield and is calculated as the ratio of the projected net income in the first year of the holding period over
the acquisition price of the property. This measure also represents the investor’s income return in the first year. Cap rates within each subtype will
vary, occasionally falling outside of the stated ranges, based on asset location/quality and property-specific opportunities for NOI enhancement.
Equation - 1st year proforma NOI divided by purchase price.
Stabilized Cap Rates (Multi-housing only)
Cap rate ranges are based on an estimated NOI derived by annualizing the last 90 days of revenue and subtracting buyer’s estimated stabilized
year-one expenses after adjustments for real estate taxes and reserves. Cap rates within each subtype will vary, occasionally falling outside of the
stated ranges, based on asset location/quality and property-specific opportunities for NOI enhancement.
Equation - NOI includes the 90-day trailing gross revenue annualized less stabilized first-year expenses divided by the purchase price.
IN THIS ISSUE:
Overview
Office
Multi-housing
Retail
Industrial
Hotels
Appendix
Cap Rate Survey First Half 2013
45
<< | >>Appendix | Definitions (continued)
Return-on-Costs for Value-Add Properties – Return-on-Cost Calculation
The return-on-cost calculation is based upon the investor’s projected gross revenue assumption at stabilization, less the standard economic loss
factors, including vacancy, to achieve the effective gross income estimate. Reduce the effective gross income by the projected stabilized expenses
to derive the NOI. The NOI becomes the numerator for the Return-on-Cost calculation. The denominator is the investor’s purchase price plus all
capital improvements incurred to reach the stabilized NOI (tenant improvement cash outlay, commissions and property upgrades). Typically, for a
value-add investment, capital expenditures will be approximately 10% to 20% of the purchase price of the asset.
The return on these costs once leased at market rents is a measure investors can use to estimate the arbitrage opportunity that exists in stabilizing
a value-add property. The measure is directly comparable to the market cap rate of comparable stabilized assets with the spread between the two
indicating the arbitrage opportunity.
Equation - Projected NOI at stabilization divided by the sum of the purchase price plus all capital costs incurred to achieve the stabilized NOI.
Stabilized Property
A property that has an occupancy level at or above the local average and is leased at market rents.
CBD
The Central Business District of a major city.
Suburban
Mainly residential area proximate to a major city.
Class A
The most prestigious buildings competing for higher-quality tenants with above-average rental rates for the area, along with high-quality finishes,
state-of-the-art systems, exceptional accessibility and a definite market presence.
IN THIS ISSUE:
Overview
Office
Multi-housing
Retail
Industrial
Hotels
Appendix
Cap Rate Survey First Half 2013
46
<< | >>Appendix | Definitions (continued)
Class B
Buildings competing for a wide range of tenants with rents in the average range for the area. Building finishes are fair to good for the area and the
systems are adequate, but the building does not compete with Class A at the same price point.
Class C
Buildings competing for tenants requiring functional space at rents below the average for the area.
Hotel-Specific Definitions
Full Service
A hotel property with more than 150 rooms, room service, an on-site restaurant and a concierge service.
Luxury
Hotel chains that are priced in the top 15.0% in terms of average annual room rates, according to Smith Travel Research.
Select Service
A hotel property with less than 150 rooms, no room service and no on-site restaurant or concierge service.
Economy
Hotel chains that are priced within the 20.0% to 40.0% range in terms of average annual room rates, according to Smith Travel Research.
Retail-Specific Definitions
Neighborhood/Community Center (Grocery Anchored)
Open-air retail center that is anchored by a grocery store and, in the case of community centers, a second major retail anchor. Can range from
75,000 to 350,000 square feet.
IN THIS ISSUE:
Overview
Office
Multi-housing
Retail
Industrial
Hotels
Appendix
Cap Rate Survey First Half 2013
47
<< | >>Appendix | Definitions (continued)
Power Center
Open-air retail center typically occupied by large-format, big-box and value-oriented retailers, with very limited small-shop tenant space.
Can range in size from 100,000 square feet to over 600,000 square feet.
High Street
The primary retail shopping thoroughfare in the premiere location of an urban submarket, serving as a focal point for high-end shops and
luxury retailers.
Multi-housing-Specific Definitions
Infill/Urban
Area considered inner-city plus built up environs, characterized by high population density and vast human features in comparison to
surrounding areas.
Suburban
Surrounding residential areas of a larger city. Outer edge of a large city, or several aggregates of distant residential area.
© Copyright 2013 CBRE Information contained herein, including projections, has been obtained from sources believed to be reliable. While we do not doubt its accuracy, we have not verified it and make no guarantee, warranty or representation about it. It is your responsibility to confirm independently its accuracy and completeness. This information is presented exclusively for use by CBRE clients and professionals and all rights to the material are reserved and cannot be reproduced without prior written permission of the CBRE Global Chief Economist.
+1 888 707 3908
www.cbre.com/capitalmarketswww.cbre.com/researchwww.cbre.com/valuation
CHRIS LUDEMANPresident
CBRE Capital Markets
JIM COSTELLOManaging Director, Americas Research
CBRE Global Research & Consulting
BRIAN STOFFERSChief Operating Officer, Capital Markets
President, Debt & Equity Finance
CBRE Capital Markets
RAY WONGExecutive Director, Americas Research
CBRE Global Research & Consulting
BROOK SCOTTInterim Head of Research, Americas
CBRE Global Research & Consulting
THOMAS MCDONNELLPresident
CBRE Valuation and Advisory Services