Embed Size (px)
Citation preview

Review of the 2015 LADWP Power Rate Proposal for
the DWP Board of
Commissioners
Office of Public Accountability /
Ratepayer Advocate, City of Los Angeles
[email protected] tel. 213-978-0220
January 19, 2016
1
Summary of OPA’s Rate Opinion
Timeline on Power Rates and Reviews
OPA’s Review and Opinion
Power Rates – Continuing Challenge to Perform
Performance Targets and Rate Adjustments: “Use ‘em or lose ’em”
Increasing Transparency: Public Trust
Recommendations
2
Timeline on Power Rates & Reviews
Last Increase to Base Rate: 2013
OPA/DWP regular meetings: Mid-2013 to now
Rate proposal put on hold: Early 2014
Rate proposal reinitiated: July 2015
Draft report: August 2015
Draft ordinance: September 2015
Updated financial plan, rates & ordinance: Published late Nov 2015
Modified financial plan, rates & ordinance: December 29
OPA Review of Navigant report: January 15
3
OPA’s Review and Opinion
What is “Reasonableness?” Are rates equitable to the many competing interests? Are customer costs connected to the provision of reliable service? Are the allocation of the costs non-discriminatory?
OPA’s Review Assisted by specialized national expert, Navigant Coordinated with many LADWP staff & management meetings Included rate report, ordinance and financial plans Improving transparency: labor, other issues
Opinion: LADWP’s power rate proposal, as modified in December 2015, is just and reasonable. January 12 board letter, released January 15, commercial rates
differ slightly. OPA will work with DWP to report on reconciliation.
4
Power Rates -- Less Than is Needed, but a Challenge to Perform 3.86% annual rate increases
Annual revenue growth: $3.45 to $4.22 billion over five years (Fiscal Years 2014/15 to 2019/20) Slight 1.6% growth in demands from current drought conditions Capital project spending for aging infrastructure, upgrade LA
coastal plants, energy efficiency, and renewables Operating & maintenance costs including labor Reductions to unfunded employee pension liability
More infrastructure replacements and energy efficiency planned every year But less than is needed to keep up with aging system Key staffing and processes may continue to be inadequate for
more project spending
5
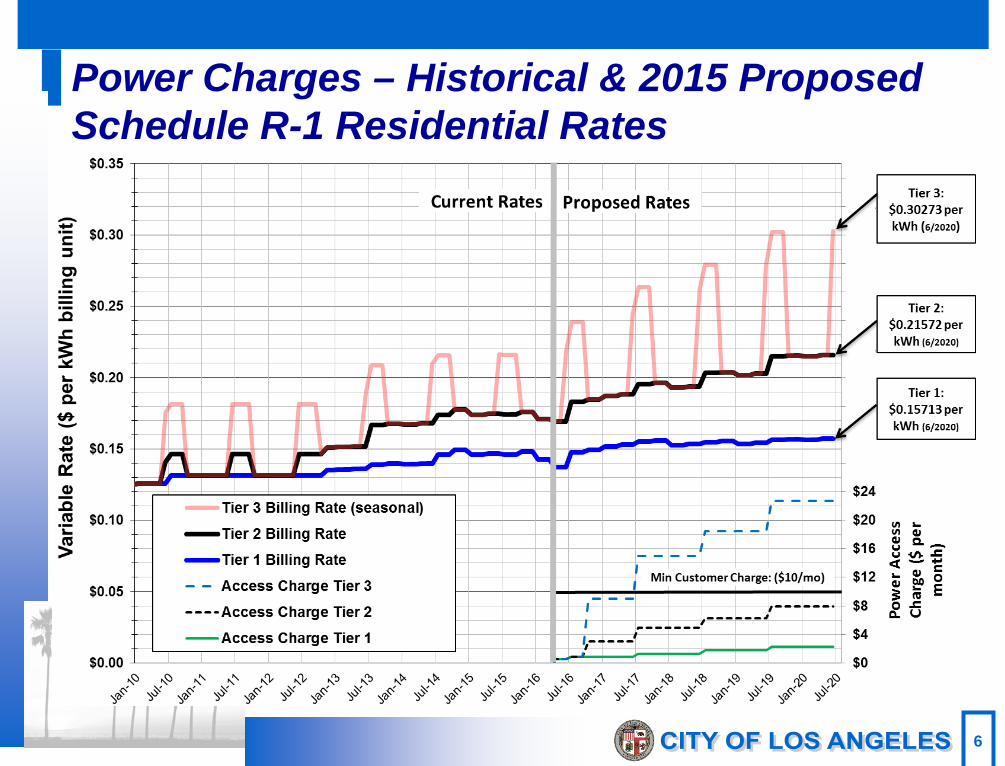
Projected Power Billing Increases are Just and Reasonable OPA supports DWP’s continued three rate tiers
and the re-start of de-coupling
Increases over five years: $6 per month cumulative increase for low use 350 kWh/ month
single family residence (SFR) in cooler Zone 1 over 5 years
$8 per month cumulative increase for 500 kWh/ month single family residence (SFR) in hotter Zone 2 over 5 years
$12 per month cumulative increase for higher use 500 kWh/ month single family residence (SFR) in cooler Zone 1 over 5 years
6
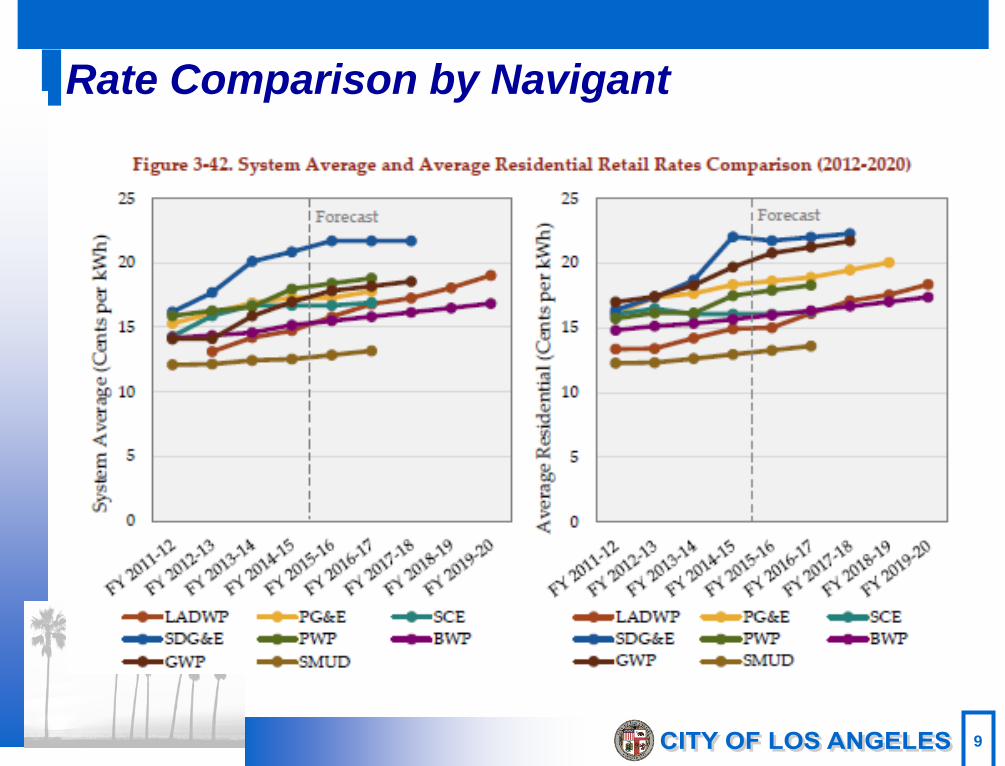
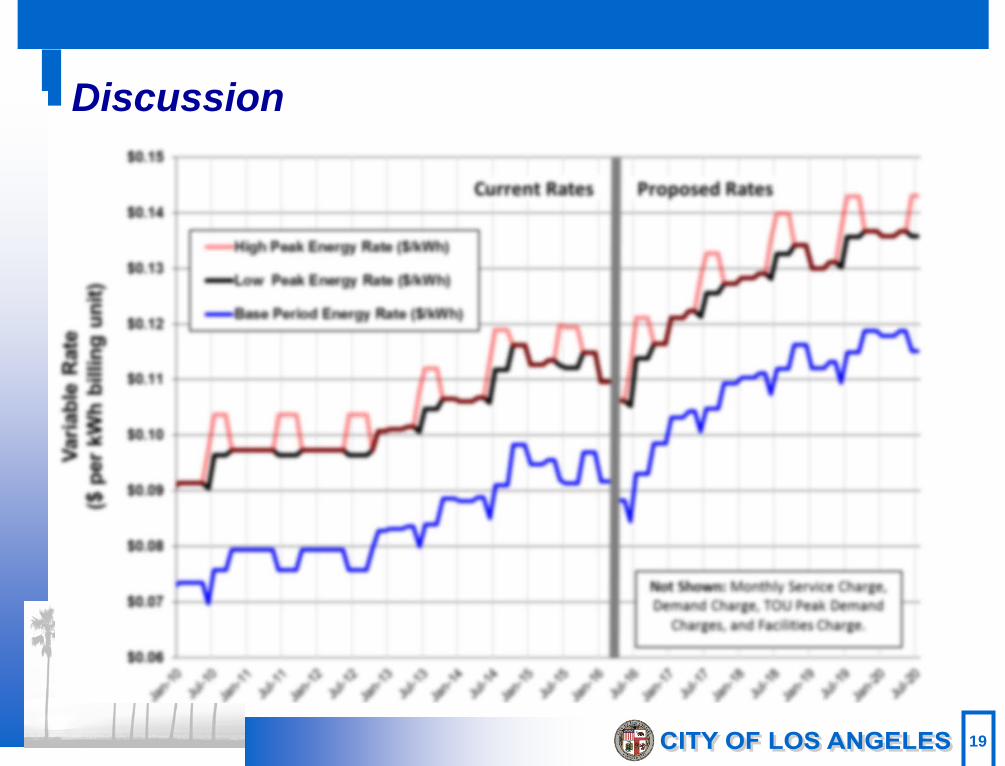
Power Charges – Historical & 2015 Proposed Schedule R-1 Residential Rates
7
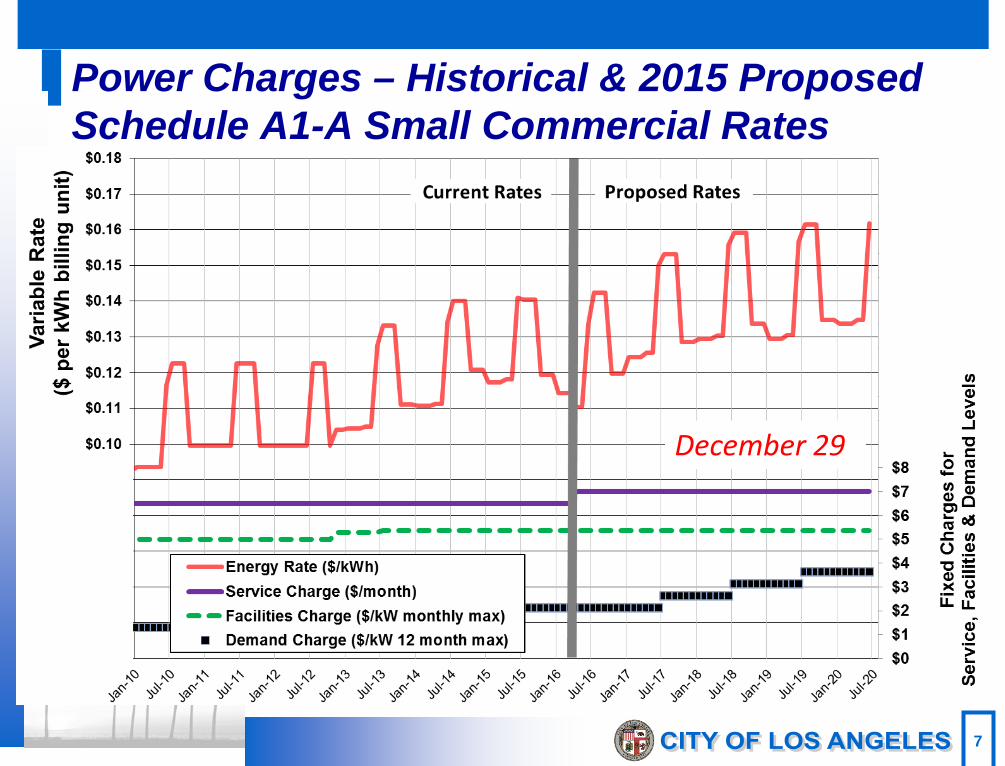
Power Charges – Historical & 2015 Proposed Schedule A1-A Small Commercial Rates
December 29
8
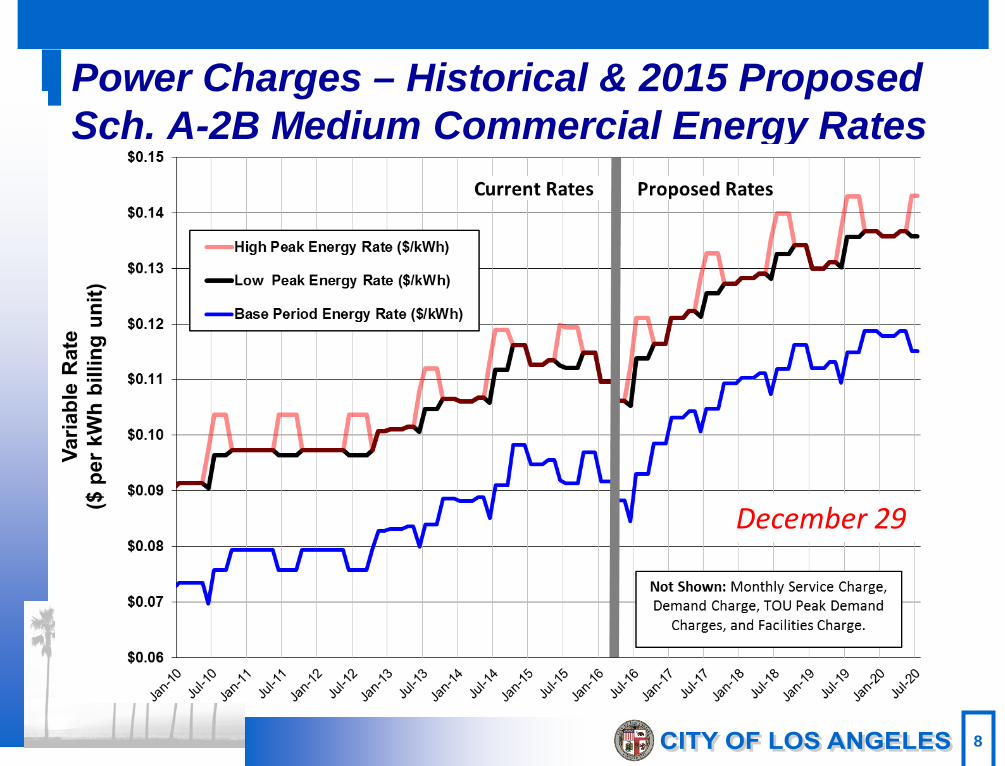
Power Charges – Historical & 2015 Proposed Sch. A-2B Medium Commercial Energy Rates
December 29
10
Revenues from Water & Power Rate Adjustments: “Use ‘em or lose ’em” Reductions to planned rate increases for unattained
or unattainable spending levels
Mechanisms for rate revisions when capital, operating costs, or demands vary from forecast Metrics can be refined in 6 month review process
Key performance targets and metrics reported to OPA, DWP Board, Council and Public to: Better aligns forecasts and activities for more
transparency
Hold DWP accountable

11
But where does the money go? More transparency Labor costs, total compensation: stabilization,
improvement, overtime
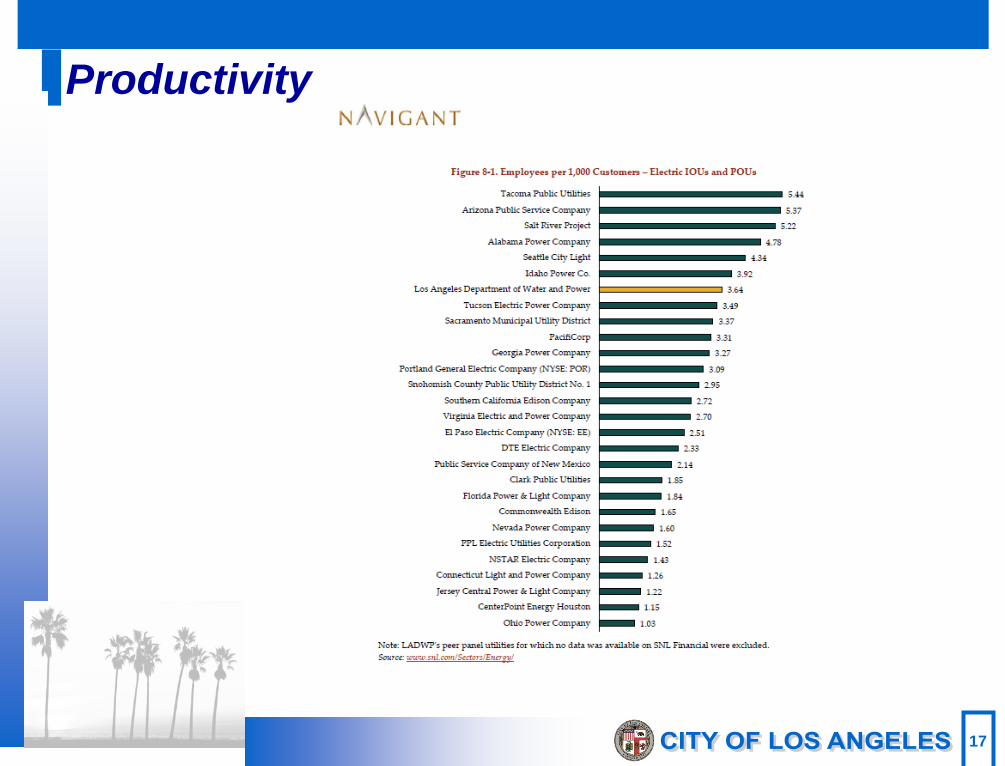
Productivity
Improving transparency, regular reporting External relationships: $10 million City services: $54-$65 million City Departments bill payments to DWP Labor relations and outsourcing: Appendix B reports Solar: Utility Built Solar and Community Solar Training: $130 million/year, nearly all inside
12 © 2016 Oliver Wyman
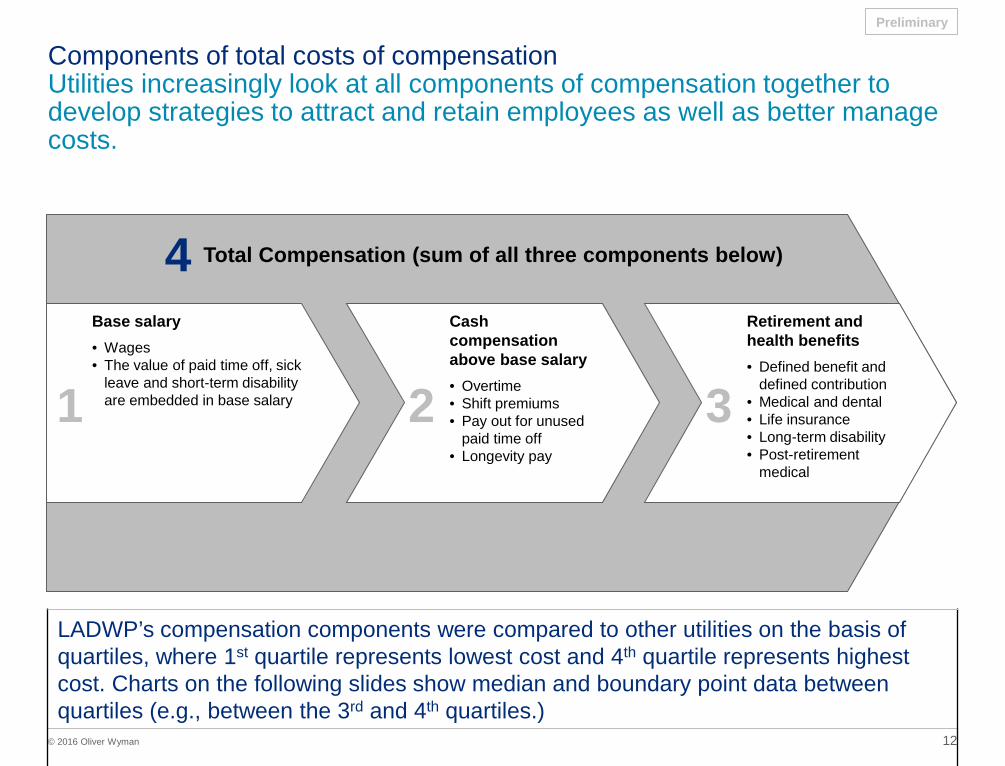
Total Compensation (sum of all three components below)
Components of total costs of compensation Utilities increasingly look at all components of compensation together to develop strategies to attract and retain employees as well as better manage costs.
Retirement and health benefits • Defined benefit and
defined contribution • Medical and dental • Life insurance • Long-term disability • Post-retirement
medical
Cash compensation above base salary • Overtime • Shift premiums • Pay out for unused
paid time off • Longevity pay
Base salary • Wages • The value of paid time off, sick
leave and short-term disability are embedded in base salary 1 2 3
4
Preliminary
LADWP’s compensation components were compared to other utilities on the basis of quartiles, where 1st quartile represents lowest cost and 4th quartile represents highest cost. Charts on the following slides show median and boundary point data between quartiles (e.g., between the 3rd and 4th quartiles.)
13 © 2016 Oliver Wyman
$90
$81
$96
0
10
20
30
40
50
60
70
80
90
100
Base Salary
LADWP IOU/POU Median IOU/POU Q3/Q4 Boundary
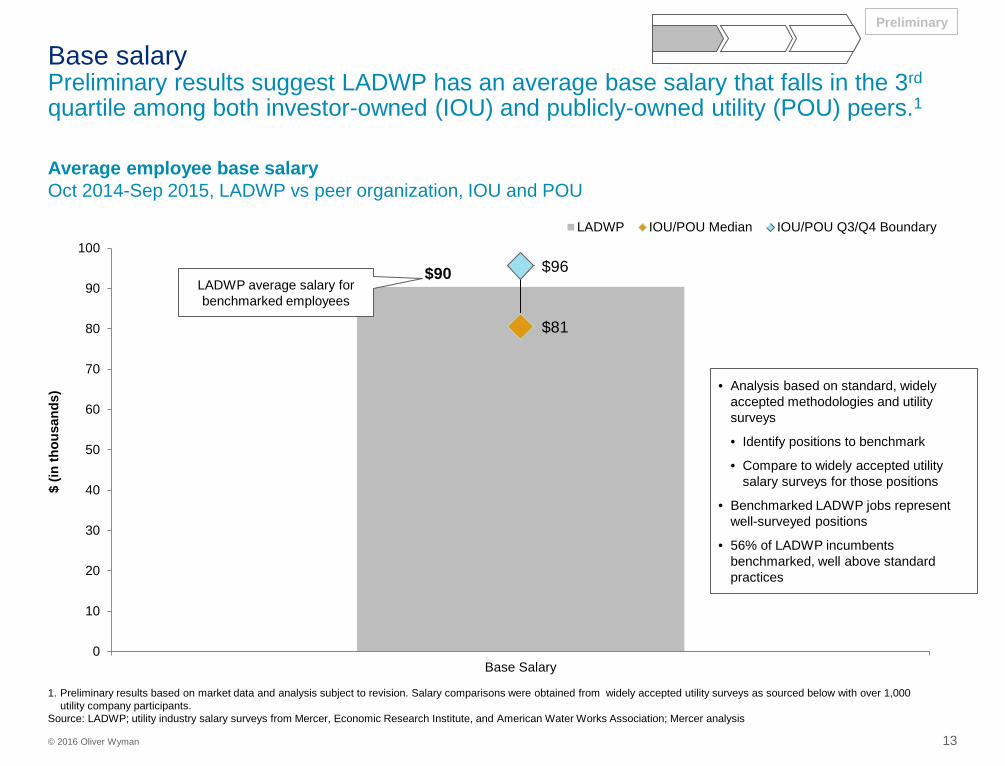
Average employee base salary Oct 2014-Sep 2015, LADWP vs peer organization, IOU and POU
Base salary Preliminary results suggest LADWP has an average base salary that falls in the 3rd quartile among both investor-owned (IOU) and publicly-owned utility (POU) peers.1
1. Preliminary results based on market data and analysis subject to revision. Salary comparisons were obtained from widely accepted utility surveys as sourced below with over 1,000 utility company participants.
Source: LADWP; utility industry salary surveys from Mercer, Economic Research Institute, and American Water Works Association; Mercer analysis
$ (in
thou
sand
s)
Preliminary
LADWP average salary for benchmarked employees
• Analysis based on standard, widely accepted methodologies and utility surveys
• Identify positions to benchmark
• Compare to widely accepted utility salary surveys for those positions
• Benchmarked LADWP jobs represent well-surveyed positions
• 56% of LADWP incumbents benchmarked, well above standard practices
14 © 2016 Oliver Wyman
$18
$7
$10
0
2
4
6
8
10
12
14
16
18
20
Cash compensation above base salary
LADWP IOU/POU Median IOU/POU Q3/Q4 Boundary
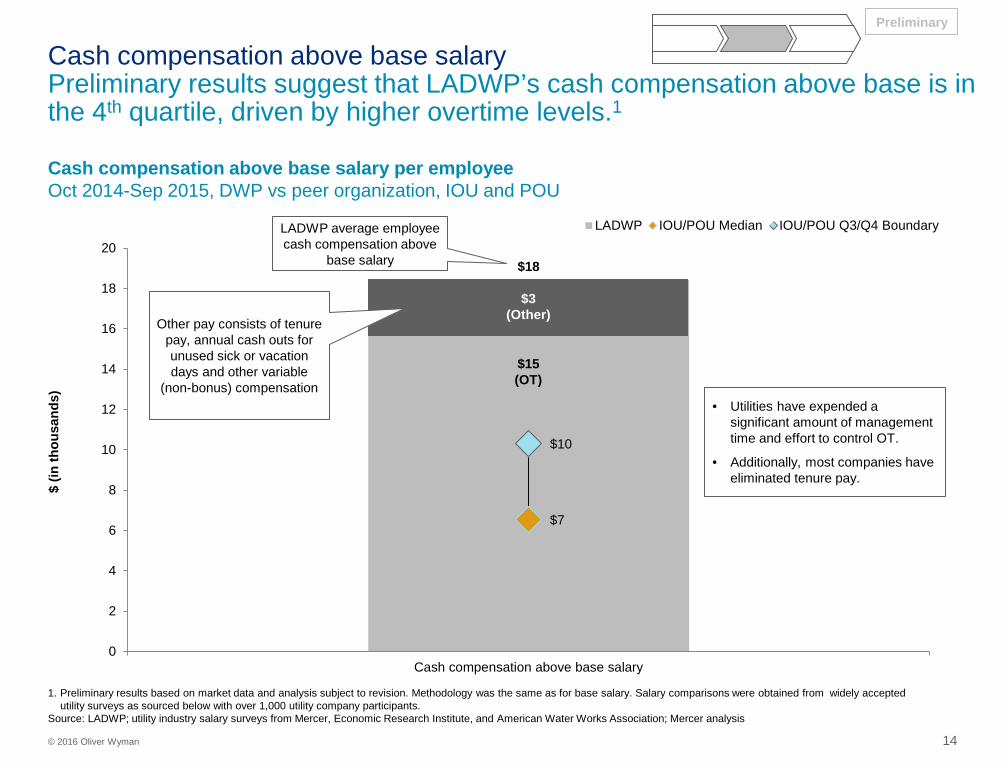
Cash compensation above base salary per employee Oct 2014-Sep 2015, DWP vs peer organization, IOU and POU
Cash compensation above base salary Preliminary results suggest that LADWP’s cash compensation above base is in the 4th quartile, driven by higher overtime levels.1
Preliminary
$ (in
thou
sand
s)
(Other)
1. Preliminary results based on market data and analysis subject to revision. Methodology was the same as for base salary. Salary comparisons were obtained from widely accepted utility surveys as sourced below with over 1,000 utility company participants.
Source: LADWP; utility industry salary surveys from Mercer, Economic Research Institute, and American Water Works Association; Mercer analysis
$3 (Other)
$15 (OT)
Other pay consists of tenure pay, annual cash outs for unused sick or vacation days and other variable
(non-bonus) compensation
LADWP average employee cash compensation above
base salary
• Utilities have expended a significant amount of management time and effort to control OT.
• Additionally, most companies have eliminated tenure pay.
15 © 2016 Oliver Wyman
$23 $20 $18 $19 $18
$13 $18
$16 $19
$15
$37 $38
$34
$37
$32
0
5
10
15
20
25
30
35
40
LADWP IOU Q3/Q4 Boundary IOU Median POU Q3/Q4 Boundary POU Median
Retirement Health
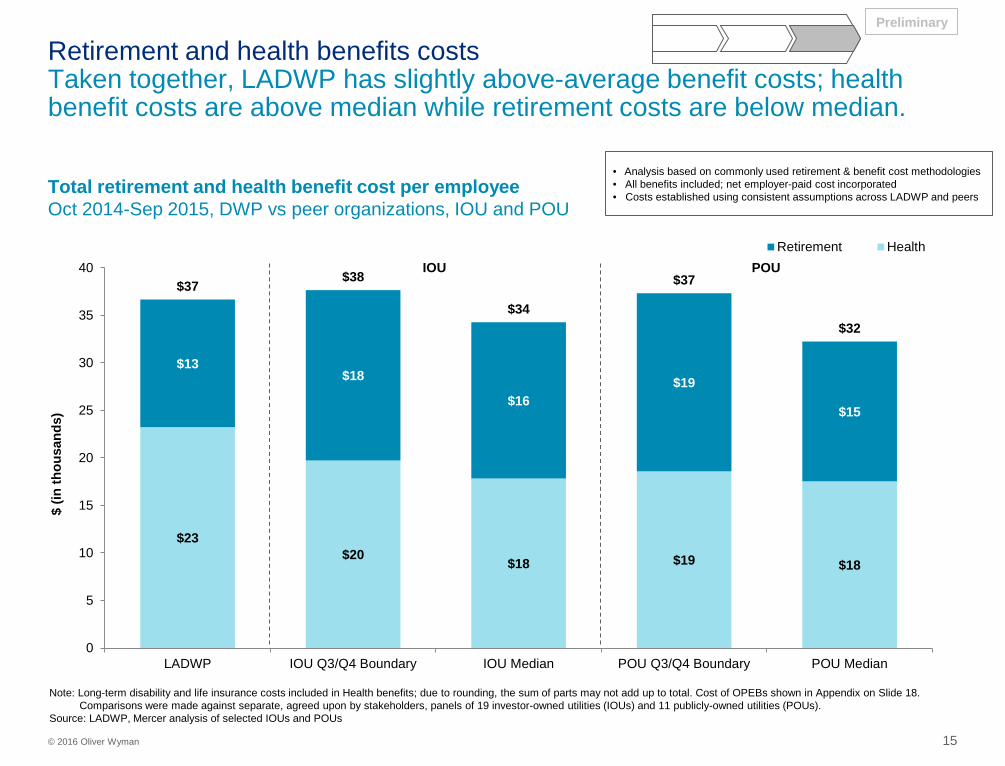
Total retirement and health benefit cost per employee Oct 2014-Sep 2015, DWP vs peer organizations, IOU and POU
Retirement and health benefits costs Taken together, LADWP has slightly above-average benefit costs; health benefit costs are above median while retirement costs are below median.
$ (in
thou
sand
s)
Note: Long-term disability and life insurance costs included in Health benefits; due to rounding, the sum of parts may not add up to total. Cost of OPEBs shown in Appendix on Slide 18. Comparisons were made against separate, agreed upon by stakeholders, panels of 19 investor-owned utilities (IOUs) and 11 publicly-owned utilities (POUs).
Source: LADWP, Mercer analysis of selected IOUs and POUs
Preliminary
IOU POU
• Analysis based on commonly used retirement & benefit cost methodologies • All benefits included; net employer-paid cost incorporated • Costs established using consistent assumptions across LADWP and peers
16 © 2016 Oliver Wyman
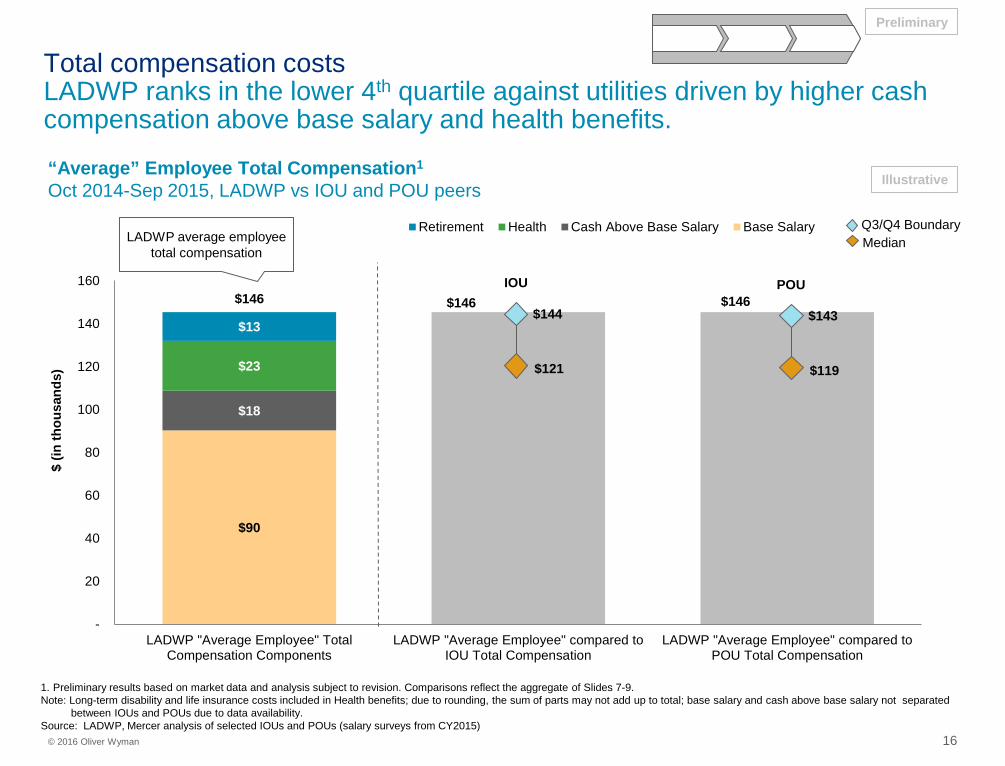
“Average” Employee Total Compensation1 Oct 2014-Sep 2015, LADWP vs IOU and POU peers
Total compensation costs LADWP ranks in the lower 4th quartile against utilities driven by higher cash compensation above base salary and health benefits.
$90
$18
$23
$13
$146 $146 $146
-
20
40
60
80
100
120
140
160
LADWP "Average Employee" TotalCompensation Components
LADWP "Average Employee" compared toIOU Total Compensation
LADWP "Average Employee" compared toPOU Total Compensation
Retirement Health Cash Above Base Salary Base Salary
$ (in
thou
sand
s)
1. Preliminary results based on market data and analysis subject to revision. Comparisons reflect the aggregate of Slides 7-9. Note: Long-term disability and life insurance costs included in Health benefits; due to rounding, the sum of parts may not add up to total; base salary and cash above base salary not separated
between IOUs and POUs due to data availability. Source: LADWP, Mercer analysis of selected IOUs and POUs (salary surveys from CY2015)
Preliminary
Illustrative
$121
$144
$119
$143
Median Q3/Q4 Boundary
LADWP average employee total compensation
IOU POU

18
Recommendations OPA encourages the Board to approve the proposed rates and
Ordinance.
OPA seeks to propose labor metrics, in conjunction with DWP, to the Board by June 1, 2016.
The Board should request the Department propose methods to provide the Joint Division budget control over its funded activities, to include potentially a transfer at the beginning and end of each budget year.
DWP should immediately proceed with its planned second stage of benchmarking, and include to the extent practical the recommendations in Oliver Wyman's preliminary labor findings report and the Navigant report.
DWP should at the earliest practicable time seek to increment its credit for low income and Lifeline customers with an inflation adjustment.