Embed Size (px)
Citation preview

CITY OF LOS ANGELES
CALIFORNIA
ERIC GARCETTI MAYOR
AN EQUAL EMPLOYMENT OPPORTUNITY – AFFIRMATIVE ACTION EMPLOYER
OFFICE OF PUBLIC ACCOUNTABILITY 200 N. SPRING STREET, ROOM 1736
CITY HALL, MAIL STOP 130-20 LOS ANGELES, CA 90012
FREDERICK H. PICKEL, Ph.D. EXECUTIVE DIRECTOR/RATEPAYER ADVOCATE
(213) 978-0220 [email protected]
February 3, 2017 The Board of Water & Power Commissioners The Honorable Mayor Eric Garcetti The Honorable Members of the City Council The Honorable City Attorney Michael Feuer The Honorable Controller Ron Galperin Sharon M. Tso, Chief Legislative Analyst Richard Llewellyn, Interim City Administrative Officer David Wright, General Manager, Department of Water and Power* Wendy Macy, General Manager, Personnel Department Subject: Joint Study of LADWP Total Compensation As a part of the power and water rate reviews completed at this time last year, as a follow-on effort, DWP and OPA planned to do two joint, in-depth analyses of DWP costs.
• First, we planned to extend the OPA’s 2015 preliminary salary and benefits analysis to included matching of DWP positions with industry standard surveys in a comprehensive “Joint Study of LADWP Total Compensation.” A Total Compensation Study typically looks at wages, incentive pay, and benefits for common components across the industry. This study involved the detailed cooperation of every DWP division.
• The next step will review the cost structure of DWP’s business functions. This
will analyze and compare costs of each business function and sub-function, and include comprehensive staffing, overtime, and contracting considerations not included in the prior benchmarking studies. We expect to initiate this in 2017, and it will build on the 2015 and 2016 work.
Page 2 February 3, 2017 The bound book attached includes:
1. the Summary of the Joint Study of LADWP Total Compensation by Oliver Wyman,
2. OPA’s Supplementary Information, and 3. the DWP Board presentation of January 3, 2017.
If you have any questions, please call or email me. My email is [email protected] and my phone number is 213-978-0220. The report is also available on the OPA web site at http://opa.lacity.org. Regards, Executive Director / Ratepayer Advocate Office of Public Accountability Attachments: Summary of the DWP-OPA Joint Total Compensation Study by Oliver Wyman, OPA’s Supplementary Information: Joint Compensation Study, and DWP Board presentation of January 3, 2017 cc: Barbara Moschos,Secretary, Board of Water and Power Commissioners
Marty Adams, CAO DWP * Jeff Peltola, CFO DWP* Louis Ting, DWP Andy Kendall, DWP Richard Harasick, DWP Shannon Pascual, DWP* Neil Guglielmo, Acting CFO DWP* IBEW 18 DWP Management Employees Association Neighborhood Council DWP Oversight Committee Neighborhood Council DWP MOU Committee
* Copy provided under separate cover


0
Joint Study of LADWP Total Compensation LADWP Board Presentation Oliver Wyman, OPA/RPA, and LADWP January 3, 2017
1
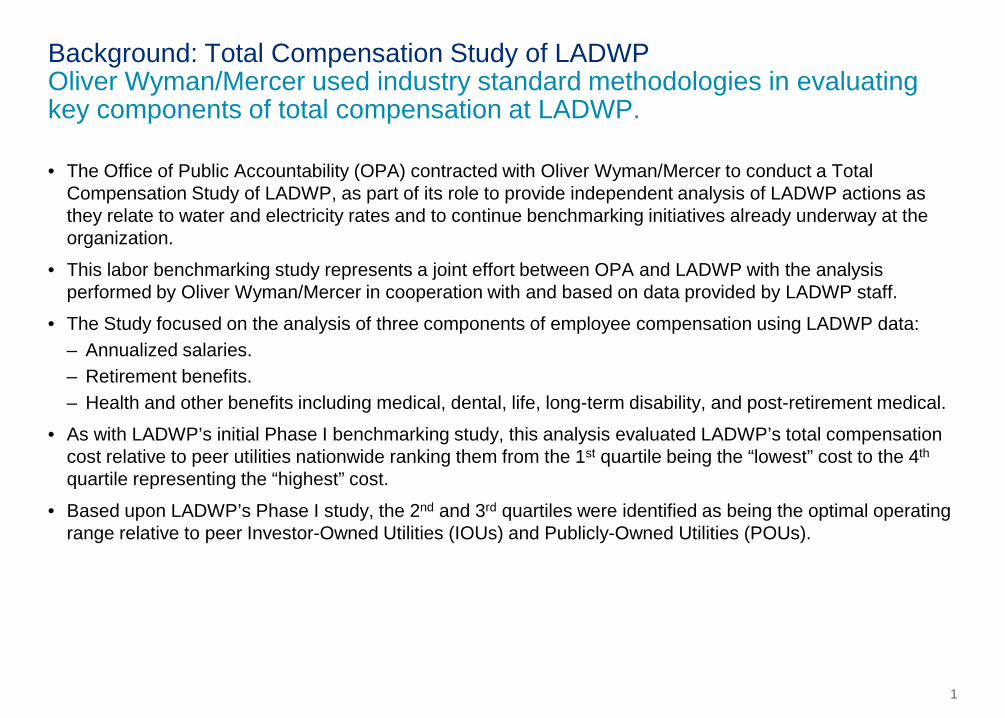
Background: Total Compensation Study of LADWP Oliver Wyman/Mercer used industry standard methodologies in evaluating key components of total compensation at LADWP. • The Office of Public Accountability (OPA) contracted with Oliver Wyman/Mercer to conduct a Total
Compensation Study of LADWP, as part of its role to provide independent analysis of LADWP actions as they relate to water and electricity rates and to continue benchmarking initiatives already underway at the organization.
• This labor benchmarking study represents a joint effort between OPA and LADWP with the analysis performed by Oliver Wyman/Mercer in cooperation with and based on data provided by LADWP staff.
• The Study focused on the analysis of three components of employee compensation using LADWP data: – Annualized salaries. – Retirement benefits. – Health and other benefits including medical, dental, life, long-term disability, and post-retirement medical.
• As with LADWP’s initial Phase I benchmarking study, this analysis evaluated LADWP’s total compensation cost relative to peer utilities nationwide ranking them from the 1st quartile being the “lowest” cost to the 4th quartile representing the “highest” cost.
• Based upon LADWP’s Phase I study, the 2nd and 3rd quartiles were identified as being the optimal operating range relative to peer Investor-Owned Utilities (IOUs) and Publicly-Owned Utilities (POUs).

2
Total employee-related costs1 Power and Water
Historical and forecast employee-related costs Total LADWP employee costs for both power and water have trended upward reaching $1.85B in 2015.
$597 $606 $643 $690 $779 $856 $845 $863 $872 $884 $913 $934 $1,051 $975 $1,004 $1,033
$115 $113 $117 $134
$157 $150 $146 $115 $143 $168 $198 $118
$126 $135 $137 $143
$91 $118 $150
$170 $175
$237 $357 $396 $440 $458
$489 $445
$479 $403 $386 $367
$223 $233 $240
$250
$264 $215
$266 $221 $188
$207 $247
$254
$278
$287 $313 $335
$1,027 $1,070 $1,150
$1,244
$1,375 $1,458
$1,614 $1,595 $1,643
$1,717
$1,847 $1,751
$1,934
$1,801 $1,840 $1,878
0
500
1,000
1,500
2,000
2005 2006 2007 2008 2009 2010 2011 2012 2013 2014 2015 2016 2017 2018 2019 2020
$M (n
omin
al)
CAGR2
7.83% CAGR 3.43%
CAGR 2.33%
Actual
Health
Retirement
1. Excludes the cost of daily exempts. 2. CAGR = Compound Annual Growth Rate Note: Years denote fiscal year end (e.g., 2009 ends June 2009) Source: LADWP; Oliver Wyman analysis
Cash compensation (excl. OT)
OT
Forecast during 2016 rate action
Approved budget (employee costs only
--other cost reductions are planned to offset 2017
increase to rate forecasts)

3
Number of LADWP Job Classes Benchmarked
89
818
28
71
20
10
0
70
50
60
40
30
80
90
100
Job Classes Added during
Process
Job Classes with No Match
Initial Job Class List
Job Classes Added by LADWP
Final Benchmarked
Jobs
# of Job
Classes
Class codes for salary benchmarking The Study used a comprehensive and highly collaborative process involving multiple staff from both LADWP and OPA to select job classes for benchmarking against the market.
• 89 LADWP job classes were selected for benchmarking: – A sample of 71 common utility job classes was
initially proposed by Oliver Wyman/Mercer. – LADWP added 28 additional job classes – 18 job classes were dropped where no
reasonable match could be made. – 8 job additional job classes were added during
the matching process.
• 3 months of meetings were held with subject matter experts from Water, Power, and Joint divisions to match benchmark job positions and ensure “apples-to-apples” comparison.
• Position matching was completed before salary benchmarking to ensure independent and unbiased results.
Commentary
The 89 benchmarked classes cover 5,926 LADWP employees (representing 60% of all LADWP employees). Industry standards suggest a study covering between 40-50% of employees provides a very good overall representative sample for benchmarking purposes.

4
31 LADWP job classes fell in the 4th quartile By % difference from 3rd quartile compensation levels
Salary distribution for 89 benchmarked job classes By quartile, LADWP relative to market salary plus bonus/incentive pay
1st Quartile 22%
2nd Quartile 25%
3rd Quartile 18%
4th Quartile 35% 7
10
14
4
3
1
0
10
11
9
8
6
7
5
13
2
12
14
>20% above 3rd quartile
10-20% above 3rd quartile
<10% above 3rd quartile
% above 3rd quartile market compensation
# of LADWP job
classes
Job classes by quartile: LADWP versus market salary plus bonus/incentive pay 58 of LADWP’s 89 benchmarked job classes (roughly 65%) had compensation that fell in the 1st, 2nd, or 3rd quartiles.
Only 7 LADWP job classes have median
compensation well above 3rd quartile
levels
Data shown by job classes/positions, not by numbers of employees . Job classes in the 1st quartile (green) reflect job classes that have the lowest cost relative to the same positions among peer utilities. Job classes in the 4th quartile (red) reflect job classes with the highest cost relative to the same position among peer utilities.
Source: LADWP; utility industry salary surveys from Mercer; Mercer analysis

5
Q4
Q3
Q2
Q1
Base/annualized salaries by market salary band Oct 2014-Sep 2015
Source: LADWP; utility industry salary surveys from Mercer; Mercer analysis
• For those job classes with market salaries less than $100,000, LADWP employees are positioned in the 4th
quartile.
• LADWP employees are between the median and the 75th percentile for job classes with base market salaries between $100,000 and $175,000.
• For those job classes with market salaries greater than $175,000, LADWP is positioned below the market median.
Q4
Q3
Q2
Q1 $63.2K
$76.2K
$83.6K
Lowest
Highest
LADWP = $87.3K
$113.4K
$122.2K
$146.2K
Lowest
Highest
LADWP = $129.8K
Q4
Q3
Q2
Q1 $198.9K
$253.4K
$315.0K
Lowest
Highest
LADWP = $220.8K
Commentary
51 LADWP Class Codes 4,453 LADWP benchmarked employees 75% of benchmarked employees
31 LADWP Class Codes 1,418 LADWP benchmarked employees 24% of benchmarked employees
7 LADWP Class Codes 55 LADWP benchmarked employees 1% of benchmarked employees
Base salaries: By salary band LADWP’s salaries are relatively lower versus the market as pay increases. Pay is relatively higher at LADWP for lower compensated positions.
<$100,000 $100,001- $175,000 >$175,000

6
Q4
Q3
Q2
Q1
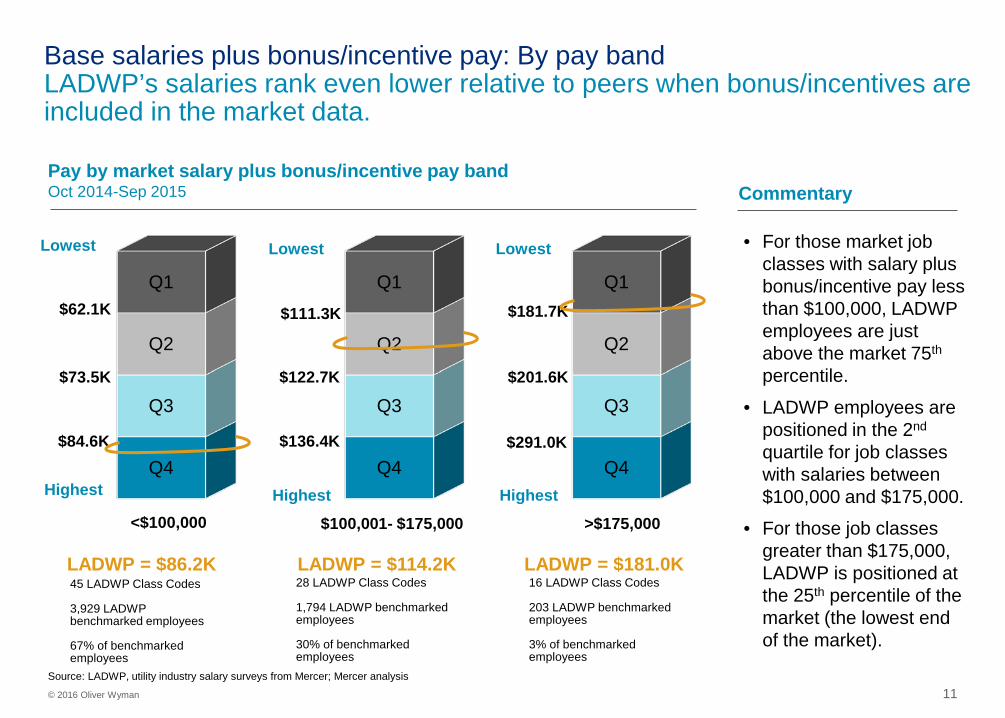
Pay by market salary plus bonus/incentive pay band Oct 2014-Sep 2015
Source: LADWP, utility industry salary surveys from Mercer; Mercer analysis
• For those market job classes with salary plus bonus/incentive pay less than $100,000, LADWP employees are just above the market 75th percentile.
• LADWP employees are positioned in the 2nd quartile for job classes with salaries between $100,000 and $175,000.
• For those job classes greater than $175,000, LADWP is positioned at the 25th percentile of the market (the lowest end of the market).
Q4
Q3
Q2
Q1 $62.1K
$73.5K
$84.6K
Lowest
Highest
LADWP = $86.2K
$111.3K
$122.7K
$136.4K
Lowest
Highest
LADWP = $114.2K
Q4
Q3
Q2
Q1 $181.7K
$201.6K
$291.0K
Lowest
Highest
LADWP = $181.0K
Commentary
45 LADWP Class Codes 3,929 LADWP benchmarked employees 67% of benchmarked employees
28 LADWP Class Codes 1,794 LADWP benchmarked employees 30% of benchmarked employees
16 LADWP Class Codes 203 LADWP benchmarked employees 3% of benchmarked employees
Base salaries plus bonus/incentive pay: By pay band LADWP’s salaries rank even lower relative to peers when bonus/incentives are included in the market data.
<$100,000 $100,001- $175,000 >$175,000

7
• LADWP’s pay structure does not have a bonus/incentive component while many utilities offer such programs.
• Industry surveys suggest that roughly 60% of all utilities offer bonus/incentive programs.
• Overall, LADWP’s position-weighted median is essentially at the median of the utility peers.
• The median bonus/incentive paid by peers is about $5,800, which includes both job classes that both pay and do not pay bonuses/incentives.
• Based on industry standards, LADWP has reasonable relative cash compensation since it falls at the median.
Q4
Q3
Q2
Q1
$73.5K
$99.8K
$140.7K
89 Matched Job Classes from IOU and POU Surveys
Lowest
Highest
Base salaries plus bonus/incentive pay: Overall findings After including bonus/incentive pay in the market data, LADWP has position-weighted compensation that falls in the 2nd quartile, just below median among utility peers.
Position-weighted median annual employee base salary plus bonus/incentive pay
Oct 2014-Sep 2015, LADWP vs peer organizations, IOU and POU
LADWP = $99.5K
Commentary
Source: LADWP; Mercer analysis of compensation for matched job classes from IOU and POU salary surveys

8
Average retirement benefit cost per employee LADWP vs peer organizations, IOU and POU
Note: Comparisons were made against separate, agreed upon by stakeholders, panels of 20 investor-owned utilities (IOUs) and 11 publicly-owned utilities (POUs). Source: LADWP, Mercer analysis.
• Overall, LADWP’s average retirement benefits cost is in the 2nd quartile relative to IOU peers, and about median relative to POU peers.
• Tier 2 costs are much lower relative to Tier 1 given Tier 2’s higher required employee contribution and lower benefit formula: – Over time, LADWP’s weighted
average retirement cost will decrease as a greater portion of the workforce will be covered by the Tier 2 pension.
• Unlike many peers, LADWP does not offer an employer funded defined contribution plan.
Q4
Q3
Q2
Q1 $14K
$16K
$18K
LADWP: $14.5K (Tier 1: $15.9K, Tier 2: $86)
IOU Panel Lowest
Highest Q4
Q3
Q2
Q1 $13K
$14K
$18K
POU Panel Lowest
Highest
Retirement benefits costs: Key findings LADWP’s retirement benefits costs are in the 2nd quartile relative to IOU peers, and about median relative to POU peers.
Commentary
Tier 2
Tier 1
Tier 1
Tier 2

9
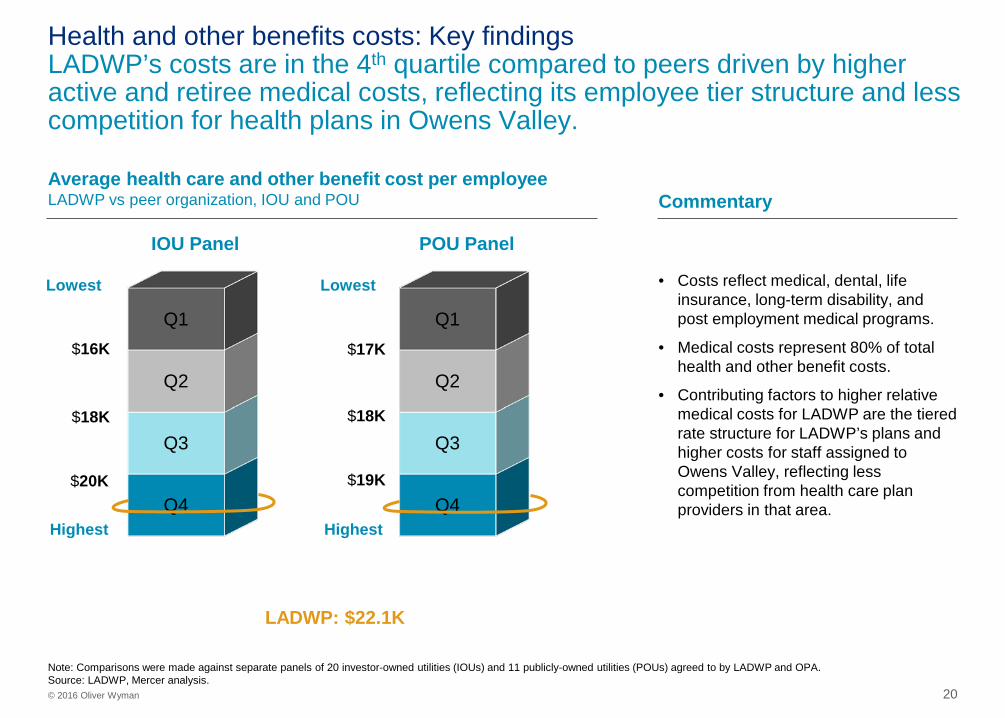
Average health care and other benefit cost per employee LADWP vs peer organization, IOU and POU
Note: Comparisons were made against separate panels of 20 investor-owned utilities (IOUs) and 11 publicly-owned utilities (POUs) agreed to by LADWP and OPA. Source: LADWP, Mercer analysis.
• Costs reflect medical, dental, life insurance, long-term disability, and post employment medical programs.
• Medical costs represent 80% of total health and other benefit costs.
• Contributing factors to higher relative medical costs for LADWP are the tiered rate structure for LADWP’s plans and higher costs for staff assigned to Owens Valley, reflecting less competition from health care plan providers in that area.
Q4
Q3
Q2
Q1 $16K
$18K
$20K
LADWP: $22.1K
IOU Panel
Lowest
Highest Q4
Q3
Q2
Q1 $17K
$18K
$19K
POU Panel
Lowest
Highest
Health and other benefits costs: Key findings LADWP’s costs are in the 4th quartile compared to peers driven by higher active and retiree medical costs, reflecting its employee tier structure and less competition for health plans in Owens Valley.
Commentary

10
Q4
Q3
Q2
Q1
Q4
Q3
Q2
Q1
Q4
Q3
Q2
Q1
Benchmarking results LADWP vs peer organizations
$74K
$100K
$141K
LADWP: $22.1K
Base salary plus bonus/incentive pay
Lowest
Highest
$14K
$16K
$18K
Retirement benefits
Sum of compensation: IOU-related Base salaries plus bonus/incentive pay, retirement benefits, and health & other benefits Many organizations have embraced managing broadly across all forms of compensation. For illustration, LADWP falls around the median when all forms benchmarked for this project are considered together.
$16K
$18K
$20
Health and other benefits
Q4
Q3
Q2
Q1
$108K
$134K
$175K
Total Compensation
LADWP: $99.5K LADWP: $14.5K LADWP: $136.1K 20 peer
investor-owned utilities 89 matched Job Classes
using data from 4 compensation surveys having over 1,400 utility participants
Illustrative
and Directional
Source: Joint Study of LADWP Total Compensation; Mercer analysis Note: median retirement and health/other benefit costs added to compensation quartiles

11
Q4
Q3
Q2
Q1
Q4
Q3
Q2
Q1
Q4
Q3
Q2
Q1
Benchmarking results LADWP vs peer organizations
$74K
$100K
$141K
LADWP: $22.1K
Base salary plus bonus/incentive pay
Lowest
Highest
$13K
$14K
$18K
Retirement benefits
Sum of compensation: POU-related Base salaries plus bonus/incentive pay, retirement benefits, and health & other benefits Likewise, for illustration, LADWP also falls around the median when all forms benchmarked for this project are considered together for POUs.
$17K
$18K
$19K
Health and other benefits
Q4
Q3
Q2
Q1 $106K
$132K
$173K
Total Compensation
LADWP: $99.5K LADWP: $14.5K LADWP: $136.1K 11 peer
publicly-owned utilities 89 matched Job Classes
using data from 4 compensation surveys having over 1,400 utility participants
Illustrative
and Directional
Source: Joint Study of LADWP Total Compensation; Mercer analysis Note: median retirement and health/other benefit costs added to compensation quartiles

12
• Cash overtime is not consistently collected in standard industry salary compensation surveys nor is it typically disclosed by IOUs for strategic and competitive reasons.
• While LADWP appears to have a higher percentage of its employees receiving overtime than its POU peers, further analysis is required to understand the business context of the costs of overtime at LADWP, including operational and infrastructure work, overtime eligibility, staffing levels, contracting practices, civil service rules, and accumulated earned overtime practices. This more detailed and comprehensive analysis of overtime is planned for the next phase of joint benchmarking between the OPA and LADWP.
• Preliminary information reviewed suggests that LADWP has higher levels of overtime cost than its peers. – Overtime appears to range between 5%-15% of base salary at POU utility peers, approximating the
middle 50% of overtime cost percentages (the range between 2nd and 3rd quartiles). – The budgeted LADWP overtime levels for the Fiscal Year ending June 30, 2015 was 9.8% of base salary. – The actual overtime level at LADWP for the same period was 21.7% of base salary. – For the four quarters ending September 2015, LADWP paid $157.3 million to its employees or about
$15,900 per employee. – IOU peers often offer bonus and incentive programs to many employees, which may impact overtime
policies. Typically, bonus/incentive eligible employees do not earn overtime.
Cash overtime Definitive findings on LADWP’s overtime costs require further analysis.

13
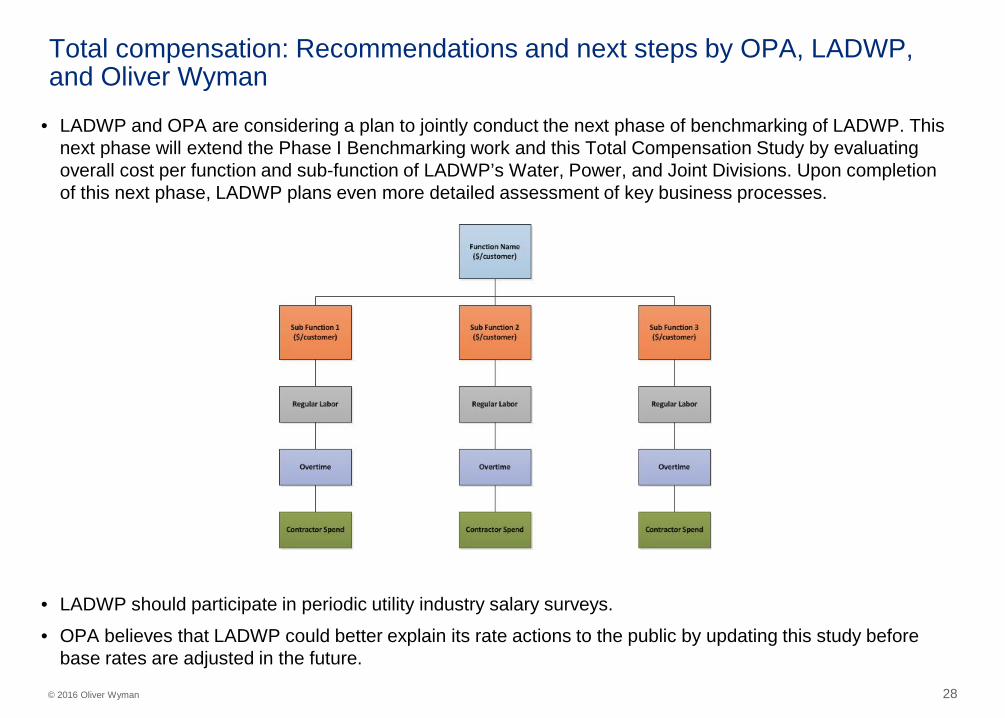
Total compensation: Recommendations and next steps by OPA, LADWP, and Oliver Wyman
• LADWP and OPA are considering a plan to jointly conduct the next phase of benchmarking of LADWP. This next phase will extend the Phase I Benchmarking work and this Total Compensation Study by evaluating overall cost per function and sub-function of LADWP’s Water, Power, and Joint Divisions. Upon completion of this next phase, LADWP plans even more detailed assessment of key business processes.
• LADWP should participate in periodic utility industry salary surveys.
• OPA believes that LADWP could better explain its rate actions to the public by updating this study before base rates are adjusted in the future.

© 2016 Oliver Wyman
JOINT STUDY OF LADWP TOTAL COMPENSATION: SUMMARY REPORT
DECEMBER 30, 2016
Prepared for: Office of Public Accountability/Ratepayer Advocate with the support of Los Angeles Department of Water and Power

Contents
1. Background and Executive Summary 2
2. Cash Compensation: Salary and Salary plus Bonus/Incentive Pay 5
3. Retirement Benefits 15
4. Health and Other Benefits 18
5. Sum of Compensation 22
6. Preliminary Overtime Information 25
7. Recommendations and Next Steps 27
8. Appendix 1: Cash Compensation; Salary and Salary plus Bonus/Incentive Pay 29
9. Appendix 2: Retirement Benefits 39
10. Appendix 3: Health and Other Benefits 42

Background and Executive Summary 1

3 © 2016 Oliver Wyman
Background: Total Compensation Study of LADWP Oliver Wyman/Mercer used industry standard methodologies in evaluating key components of total compensation at LADWP. • The Office of Public Accountability (OPA) contracted with Oliver Wyman/Mercer to conduct a Total
Compensation Study of LADWP, as part of its role to provide independent analysis of LADWP actions as they relate to water and electricity rates and to continue benchmarking initiatives already underway at the organization.
• This labor benchmarking study represents a joint effort between OPA and LADWP with the analysis performed by Oliver Wyman/Mercer in cooperation with and based on data provided by LADWP staff.
• The Study focused on the analysis of three components of employee compensation using LADWP data: – Annualized salaries. – Retirement benefits. – Health and other benefits including medical, dental, life, long-term disability, and post-retirement medical.
• As with LADWP’s initial Phase I benchmarking study, this analysis evaluated LADWP’s total compensation cost relative to peer utilities nationwide ranking them from the 1st quartile being the “lowest” cost to the 4th quartile representing the “highest” cost.
• Based upon LADWP’s Phase I study, the 2nd and 3rd quartiles were identified as being the optimal operating range relative to peer Investor-Owned Utilities (IOUs) and Publicly-Owned Utilities (POUs).
4 © 2016 Oliver Wyman
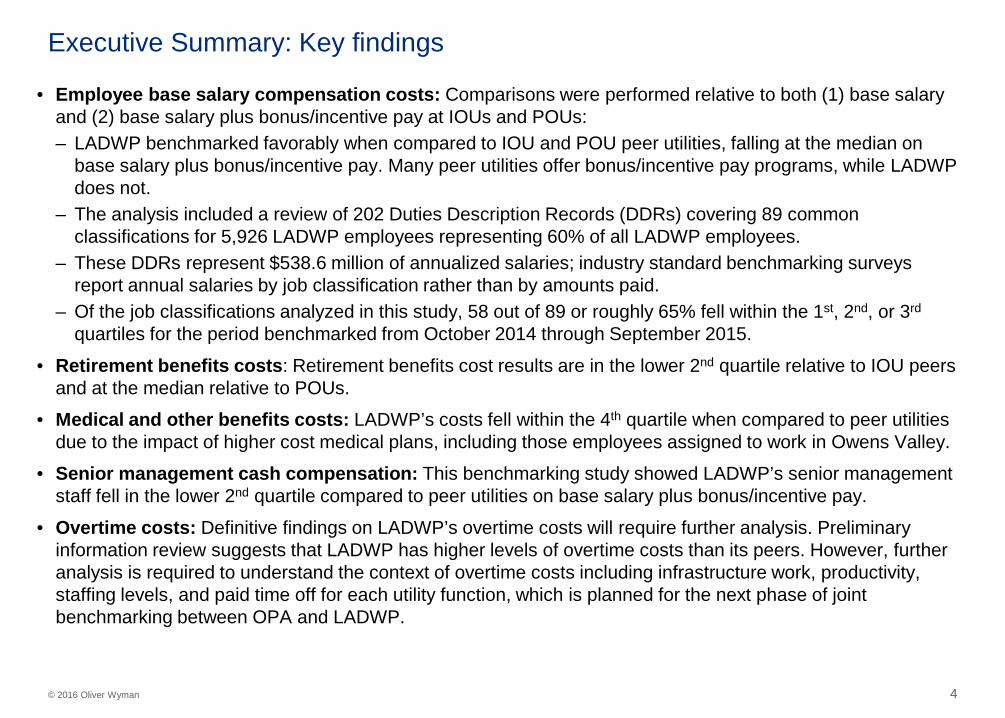
• Employee base salary compensation costs: Comparisons were performed relative to both (1) base salary
and (2) base salary plus bonus/incentive pay at IOUs and POUs: – LADWP benchmarked favorably when compared to IOU and POU peer utilities, falling at the median on
base salary plus bonus/incentive pay. Many peer utilities offer bonus/incentive pay programs, while LADWP does not.
– The analysis included a review of 202 Duties Description Records (DDRs) covering 89 common classifications for 5,926 LADWP employees representing 60% of all LADWP employees.
– These DDRs represent $538.6 million of annualized salaries; industry standard benchmarking surveys report annual salaries by job classification rather than by amounts paid.
– Of the job classifications analyzed in this study, 58 out of 89 or roughly 65% fell within the 1st, 2nd, or 3rd quartiles for the period benchmarked from October 2014 through September 2015.
• Retirement benefits costs: Retirement benefits cost results are in the lower 2nd quartile relative to IOU peers and at the median relative to POUs.
• Medical and other benefits costs: LADWP’s costs fell within the 4th quartile when compared to peer utilities due to the impact of higher cost medical plans, including those employees assigned to work in Owens Valley.
• Senior management cash compensation: This benchmarking study showed LADWP’s senior management staff fell in the lower 2nd quartile compared to peer utilities on base salary plus bonus/incentive pay.
• Overtime costs: Definitive findings on LADWP’s overtime costs will require further analysis. Preliminary information review suggests that LADWP has higher levels of overtime costs than its peers. However, further analysis is required to understand the context of overtime costs including infrastructure work, productivity, staffing levels, and paid time off for each utility function, which is planned for the next phase of joint benchmarking between OPA and LADWP.
Executive Summary: Key findings
Cash Compensation: Salary and Salary plus Bonus/Incentive Pay
2

6 © 2016 Oliver Wyman
Number of LADWP Job Classes Benchmarked
89
818
28
71
20
10
0
70
50
60
40
30
80
90
100
Job Classes Added during
Process
Job Classes with No Match
Initial Job Class List
Job Classes Added by LADWP
Final Benchmarked
Jobs
# of Job
Classes
Class codes for salary benchmarking The Study used a comprehensive and highly collaborative process involving multiple staff from both LADWP and OPA to select job classes for benchmarking against the market.
• 89 LADWP job classes were selected for benchmarking: – A sample of 71 common utility job classes was
initially proposed by Oliver Wyman/Mercer. – LADWP added 28 additional job classes – 18 job classes were dropped where no
reasonable match could be made. – 8 job additional job classes were added during
the matching process.
• 3 months of meetings were held with subject matter experts from Water, Power, and Joint divisions to match benchmark job positions and ensure “apples-to-apples” comparison.
• Position matching was completed before salary benchmarking to ensure independent and unbiased results.
Commentary
The 89 benchmarked classes cover 5,926 LADWP employees (representing 60% of all LADWP employees). Industry standards suggest a study covering between 40-50% of employees provides a very good overall representative sample for benchmarking purposes.

7 © 2016 Oliver Wyman
• Four commonly used utility-industry related surveys were used to benchmark cash compensation for the 89 LADWP job class codes.
• Comparisons of LADWP to market data were made considering the following measures for cash compensation: – “Base Salary”: Annualized base salary. – “Base Salary Plus Bonus/Incentive Pay”: For those positions which are typically bonus-eligible (i.e.,
50% or more of the incumbents are bonus eligible within the market), market data provided include actual cash bonuses awarded in 2014 and paid in 2015, but excludes any stock-related compensation.
– For attracting and retaining staff, comparison of LADWP salaries to the market including bonuses/incentives is critically important since LADWP does not pay bonuses or other forms of incentive pay and thus may be at a competitive disadvantage.
• Compensation comparisons were made using median not average data since median represents the industry standard and limits the impact of outliers. Market data were collected for the 25th percentile, median, and 75th percentile and compared to median annualized salaries for the applicable LADWP DDRs for each class code.
• The data in each of the four surveys is based on utilities located throughout the country and is not specific to Los Angeles. Thus, a labor market adjustment of +15% based on data from Economic Research Institute’s Geographic Assessor and the US Bureau of Labor Statistics was applied to account for the relatively higher cost of labor in Los Angeles.
Salary benchmarking methodology The Study used industry standard sources and adjustments to benchmark salaries at LADWP with the utility industry.
Additional information on the benchmarking methodology appears in Appendix 1.

8 © 2016 Oliver Wyman
31 LADWP job classes fell in the 4th quartile By % difference from 3rd quartile compensation levels
Salary distribution for 89 benchmarked job classes By quartile, LADWP relative to market salary plus bonus/incentive pay
1st Quartile 22%
2nd Quartile 25%
3rd Quartile 18%
4th Quartile 35% 7
10
14
4
3
1
0
10
11
9
8
6
7
5
13
2
12
14
>20% above 3rd quartile
10-20% above 3rd quartile
<10% above 3rd quartile
% above 3rd quartile market compensation
# of LADWP job
classes
Job classes by quartile: LADWP versus market salary plus bonus/incentive pay 58 of LADWP’s 89 benchmarked job classes (roughly 65%) had compensation that fell in the 1st, 2nd, or 3rd quartiles.
Only 7 LADWP job classes have median
compensation well above 3rd quartile
levels
Data shown by job classes/positions, not by numbers of employees . Job classes in the 1st quartile (green) reflect job classes that have the lowest cost relative to the same positions among peer utilities. Job classes in the 4th quartile (red) reflect job classes with the highest cost relative to the same position among peer utilities.
Source: LADWP; utility industry salary surveys from Mercer; Mercer analysis

9 © 2016 Oliver Wyman
Q4
Q3
Q2
Q1
Base/annualized salaries by market salary band Oct 2014-Sep 2015
Source: LADWP; utility industry salary surveys from Mercer; Mercer analysis
• For those job classes with market salaries less than $100,000, LADWP employees are positioned in the 4th
quartile.
• LADWP employees are between the median and the 75th percentile for job classes with base market salaries between $100,000 and $175,000.
• For those job classes with market salaries greater than $175,000, LADWP is positioned below the market median.
Q4
Q3
Q2
Q1 $63.2K
$76.2K
$83.6K
Lowest
Highest
LADWP = $87.3K
$113.4K
$122.2K
$146.2K
Lowest
Highest
LADWP = $129.8K
Q4
Q3
Q2
Q1 $198.9K
$253.4K
$315.0K
Lowest
Highest
LADWP = $220.8K
Commentary
51 LADWP Class Codes 4,453 LADWP benchmarked employees 75% of benchmarked employees
31 LADWP Class Codes 1,418 LADWP benchmarked employees 24% of benchmarked employees
7 LADWP Class Codes 55 LADWP benchmarked employees 1% of benchmarked employees
Base salaries: By salary band LADWP’s salaries are relatively lower versus the market as pay increases. Pay is relatively higher at LADWP for lower compensated positions.
<$100,000 $100,001- $175,000 >$175,000

10 © 2016 Oliver Wyman
• Overall, LADWP’s position-weighted median base salary is in the 3rd quartile.
• Position-weighted median annual salaries at the LADWP are 10% above median.
• Generally, compensation levels within 10% of the targeted positioning are considered within a reasonable range.
Q4
Q3
Q2
Q1
$70.7K
$90.4K
$122.2K
89 Matched Job Classes from IOU and POU Surveys
Lowest
Highest
Base salaries: Overall findings LADWP has a position-weighted median base salary that falls in the 3rd quartile among peers.
Position-weighted median annual employee base salary
Oct 2014-Sep 2015, LADWP vs peer organizations, IOU and POU
LADWP = $99.5K
Commentary
Source: LADWP; Mercer analysis of compensation for matched job classes from IOU and POU salary surveys
11 © 2016 Oliver Wyman
Q4
Q3
Q2
Q1
Pay by market salary plus bonus/incentive pay band Oct 2014-Sep 2015
Source: LADWP, utility industry salary surveys from Mercer; Mercer analysis
• For those market job classes with salary plus bonus/incentive pay less than $100,000, LADWP employees are just above the market 75th percentile.
• LADWP employees are positioned in the 2nd quartile for job classes with salaries between $100,000 and $175,000.
• For those job classes greater than $175,000, LADWP is positioned at the 25th percentile of the market (the lowest end of the market).
Q4
Q3
Q2
Q1 $62.1K
$73.5K
$84.6K
Lowest
Highest
LADWP = $86.2K
$111.3K
$122.7K
$136.4K
Lowest
Highest
LADWP = $114.2K
Q4
Q3
Q2
Q1 $181.7K
$201.6K
$291.0K
Lowest
Highest
LADWP = $181.0K
Commentary
45 LADWP Class Codes 3,929 LADWP benchmarked employees 67% of benchmarked employees
28 LADWP Class Codes 1,794 LADWP benchmarked employees 30% of benchmarked employees
16 LADWP Class Codes 203 LADWP benchmarked employees 3% of benchmarked employees
Base salaries plus bonus/incentive pay: By pay band LADWP’s salaries rank even lower relative to peers when bonus/incentives are included in the market data.
<$100,000 $100,001- $175,000 >$175,000

12 © 2016 Oliver Wyman
• LADWP’s pay structure does not have a bonus/incentive component while many utilities offer such programs.
• Industry surveys suggest that roughly 60% of all utilities offer bonus/incentive programs.
• Overall, LADWP’s position-weighted median is essentially at the median of the utility peers.
• The median bonus/incentive paid by peers is about $5,800, which includes both job classes that both pay and do not pay bonuses/incentives.
• Based on industry standards, LADWP has reasonable relative cash compensation since it falls at the median.
Q4
Q3
Q2
Q1
$73.5K
$99.8K
$140.7K
89 Matched Job Classes from IOU and POU Surveys
Lowest
Highest
Base salaries plus bonus/incentive pay: Overall findings After including bonus/incentive pay in the market data, LADWP has position-weighted compensation that falls in the 2nd quartile, just below median among utility peers.
Position-weighted median annual employee base salary plus bonus/incentive pay
Oct 2014-Sep 2015, LADWP vs peer organizations, IOU and POU
LADWP = $99.5K
Commentary
Source: LADWP; Mercer analysis of compensation for matched job classes from IOU and POU salary surveys

13 © 2016 Oliver Wyman
LADWP Utility Peers Utility Peers
Compensation level Median Median Median
Compensation measure Base Plus Bonus/Incentive
Base Salary
Base Plus Bonus/Incentive
Highest LADWP job classification: GNL MRG & CHF ENGR WP
$350,011 $433,556 $766,422
Lowest LADWP job classification: CUSTODIAN $54,497 $38,519 $38,519
Ratio of compensation: highest to lowest job classification
6.4x 11.3x 19.9x
Salary structure: Highest and lowest paid job classifications Overall, LADWP has a flatter salary structure than its peers: LADWP has a much lower ratio of highest to lowest median compensation (by job classification) than its utility peers.
Source: LADWP, utility industry salary surveys from Mercer; Mercer analysis

14 © 2016 Oliver Wyman
Q4
Q3
Q2
Q1
Q4
Q3
Q2
Q1
Senior Management compensation against IOU peers 11 Senior Management job classes including the GM, Oct 2014-Sep 2015
Total cash compensation for Senior Management LADWP’s Senior Management team ranks at just above the 25th percentile after considering bonus/incentives offered by peers.
Note: Senior Management position-weighted median based on 11 senior management job classes covering 98 employees at LADWP including the GM Source: LADWP, utility industry salary surveys from Mercer; Mercer analysis
• Base salaries for LADWP’s Senior Management job classes rank just above the market median.
• LADWP’s competitive position in terms of salaries declines (to 24% below the market median) as incentives are considered (e.g., bonus incentives are often used by peers).
• The median bonus at peers was $66.3K or about 33% of base salary.
Commentary
$159.6K
$198.8K
$276.4K
Base salary
Lowest
Highest
LADWP = $200.9K
$199.2K
$265.1K
$413.8K
Base plus bonus/incentive pay
Lowest
Highest
LADWP = $200.9K

Retirement Benefits 3
16 © 2016 Oliver Wyman
• Mercer used the following methodology to generate the benefits cost for LADWP: – Calculated the “normal” retirement benefit cost of the 89 benchmarked job classifications
using LADWP’s retirement programs. – Weighted, based on the number of employee participants in either Tier 1 or Tier 2, to
determine a weighted average total normal cost (~$14,500 per employee). • Mercer used benchmark salary data to calculate the “normal” cost from retirement programs
for 31 peer utilities selected jointly by LADWP and OPA to provide market benchmarks. • Mercer used consistent actuarial assumptions for LADWP and all peers, rather than using
LADWP’s specific actuarial assumptions. • This analysis is based on a “normal cost” for LADWP and each of the peers. This differs from
the annual actuarial valuation of pension cost which takes into account the 88.5% funding level of LADWP (based on market value of assets). The comparison of annual actuarial pension costs is not appropriate and/or available for the peers due to funding level differences and other factors.
Retirement benefits benchmarking methodology Mercer used an industry standard methodology to analyze the “normal” cost of retirement benefits for LADWP versus its peers.
Further details on the methodology and peer utility comparison panel for retirement benefits is shown in Appendix 2.

17 © 2016 Oliver Wyman
Average retirement benefit cost per employee LADWP vs peer organizations, IOU and POU
Note: Comparisons were made against separate, agreed upon by stakeholders, panels of 20 investor-owned utilities (IOUs) and 11 publicly-owned utilities (POUs). Source: LADWP, Mercer analysis.
• Overall, LADWP’s average retirement benefits cost is in the 2nd quartile relative to IOU peers, and about median relative to POU peers.
• Tier 2 costs are much lower relative to Tier 1 given Tier 2’s higher required employee contribution and lower benefit formula: – Over time, LADWP’s weighted
average retirement cost will decrease as a greater portion of the workforce will be covered by the Tier 2 pension.
• Unlike many peers, LADWP does not offer an employer funded defined contribution plan.
Q4
Q3
Q2
Q1 $14K
$16K
$18K
LADWP: $14.5K (Tier 1: $15.9K, Tier 2: $86)
IOU Panel Lowest
Highest Q4
Q3
Q2
Q1 $13K
$14K
$18K
POU Panel Lowest
Highest
Retirement benefits costs: Key findings LADWP’s retirement benefits costs are in the 2nd quartile relative to IOU peers, and about median relative to POU peers.
Commentary
Tier 2
Tier 1
Tier 1
Tier 2

Health and Other Benefits 4

19 © 2016 Oliver Wyman
• Mercer took the following steps to generate the benefits cost of LADWP (~$22,000 per employee): − Each health and ancillary benefit option (including retiree health benefits) was evaluated
separately, net of applicable employee contributions, with the results then added to get a total active health net benefits cost.
− Time-off benefits (vacation, personal days, sick days and short-term disability) are assumed to be included in base salary compensation.
• LADWP’s costs were compared against similar programs for 31 peer utilities selected jointly by LADWP and OPA to provide market benchmarks.
Health and other benefits benchmarking methodology Mercer used an industry standard methodology to benchmark health and other benefits costs for LADWP versus its peers.
Further details on the methodology and peer utility comparison panel for retirement benefits is shown in Appendix 3.
20 © 2016 Oliver Wyman
Average health care and other benefit cost per employee LADWP vs peer organization, IOU and POU
Note: Comparisons were made against separate panels of 20 investor-owned utilities (IOUs) and 11 publicly-owned utilities (POUs) agreed to by LADWP and OPA. Source: LADWP, Mercer analysis.
• Costs reflect medical, dental, life insurance, long-term disability, and post employment medical programs.
• Medical costs represent 80% of total health and other benefit costs.
• Contributing factors to higher relative medical costs for LADWP are the tiered rate structure for LADWP’s plans and higher costs for staff assigned to Owens Valley, reflecting less competition from health care plan providers in that area.
Q4
Q3
Q2
Q1 $16K
$18K
$20K
LADWP: $22.1K
IOU Panel
Lowest
Highest Q4
Q3
Q2
Q1 $17K
$18K
$19K
POU Panel
Lowest
Highest
Health and other benefits costs: Key findings LADWP’s costs are in the 4th quartile compared to peers driven by higher active and retiree medical costs, reflecting its employee tier structure and less competition for health plans in Owens Valley.
Commentary

21 © 2016 Oliver Wyman
LADWP net medical cost summary The Anthem Blue Cross HMO and Owens Valley plans have above-average costs.
Medical Plan # of
Employees Gross Annual
Premium Employee
Contributions Net Employer
Cost Annual Net Cost
per Employee
Kaiser HMO 4,032 $63,468,000 $177,000 $63,291,000 $15,700
United Healthcare HMO 519 $8,652,000 $236,000 $8,416,000 $16,200
United Healthcare PPO 137 $2,569,000 $230,000 $2,339,000 $17,100
Anthem Blue Cross HMO 3,790 $69,872,000 $0 $69,872,000 $18,400
Anthem Blue Cross PPO 437 $6,876,000 $408,000 $6,468,000 $14,800
Subtotal – greater LA 8,915 $151,437,000 $1,051,000 $150,386,000 $17,000
United Healthcare (Owens Valley) 14 $417,000 $0 $417,000 $29,800
Anthem Blue Cross Indemnity (Owens Valley) 329 $11,911,000 $0 $11,911,000 $36,200
Total 9,258 $163,764,000 $1,051,000 $162,713,000 $17,600
Net Medical Plan Costs for All Plans Annual Premium
Notes: Health Plan of Nevada was not valued due to differing geography and minimal enrollment. There are the only two plans available for the employees working in the Owens Valley. Its remote location drives higher premiums for the Owens Valley plans. Unlike Los Angeles, the limited population that exists in this area translates into a smaller number of healthcare facilities and as a consequence, there is less competition among providers to help keep costs under control. In addition, the two plans offered for LADWP Owens Valley employees are PPO plans. LADWP does not have an HMO option for the Owens Valley and Kaiser does not service this area. Accordingly, LADWP covers the total premium costs for Owens Valley employees.
LADWP weighted annual per employee average cost (annual premium / # of employees) is $17,600

Sum of Compensation 5

23 © 2016 Oliver Wyman
Q4
Q3
Q2
Q1
Q4
Q3
Q2
Q1
Q4
Q3
Q2
Q1
Benchmarking results LADWP vs peer organizations
$74K
$100K
$141K
LADWP: $22.1K
Base salary plus bonus/incentive pay
Lowest
Highest
$14K
$16K
$18K
Retirement benefits
Sum of compensation: IOU-related Base salaries plus bonus/incentive pay, retirement benefits, and health & other benefits Many organizations have embraced managing broadly across all forms of compensation. For illustration, LADWP falls around the median when all forms benchmarked for this project are considered together.
$16K
$18K
$20
Health and other benefits
Q4
Q3
Q2
Q1
$108K
$134K
$175K
Total Compensation
LADWP: $99.5K LADWP: $14.5K LADWP: $136.1K 20 peer
investor-owned utilities 89 matched Job Classes
using data from 4 compensation surveys having over 1,400 utility participants
Illustrative
and Directional
Source: Joint Study of LADWP Total Compensation; Mercer analysis Note: median retirement and health/other benefit costs added to compensation quartiles

24 © 2016 Oliver Wyman
Q4
Q3
Q2
Q1
Q4
Q3
Q2
Q1
Q4
Q3
Q2
Q1
Benchmarking results LADWP vs peer organizations
$74K
$100K
$141K
LADWP: $22.1K
Base salary plus bonus/incentive pay
Lowest
Highest
$13K
$14K
$18K
Retirement benefits
Sum of compensation: POU-related Base salaries plus bonus/incentive pay, retirement benefits, and health & other benefits Likewise, for illustration, LADWP also falls around the median when all forms benchmarked for this project are considered together for POUs.
$17K
$18K
$19K
Health and other benefits
Q4
Q3
Q2
Q1 $106K
$132K
$173K
Total Compensation
LADWP: $99.5K LADWP: $14.5K LADWP: $136.1K 11 peer
publicly-owned utilities 89 matched Job Classes
using data from 4 compensation surveys having over 1,400 utility participants
Illustrative
and Directional
Source: Joint Study of LADWP Total Compensation; Mercer analysis Note: median retirement and health/other benefit costs added to compensation quartiles

Preliminary Overtime Information 6

26 © 2016 Oliver Wyman
• Cash overtime is not consistently collected in standard industry salary compensation surveys nor is it typically disclosed by IOUs for strategic and competitive reasons.
• While LADWP appears to have a higher percentage of its employees receiving overtime than its POU peers, further analysis is required to understand the business context of the costs of overtime at LADWP, including operational and infrastructure work, overtime eligibility, staffing levels, contracting practices, civil service rules, and accumulated earned overtime practices. This more detailed and comprehensive analysis of overtime is planned for the next phase of joint benchmarking between the OPA and LADWP.
• Preliminary information reviewed suggests that LADWP has higher levels of overtime cost than its peers. – Overtime appears to range between 5%-15% of base salary at POU utility peers, approximating the
middle 50% of overtime cost percentages (the range between 2nd and 3rd quartiles). – The budgeted LADWP overtime levels for the Fiscal Year ending June 30, 2015 was 9.8% of base salary. – The actual overtime level at LADWP for the same period was 21.7% of base salary. – For the four quarters ending September 2015, LADWP paid $157.3 million to its employees or about
$15,900 per employee. – IOU peers often offer bonus and incentive programs to many employees, which may impact overtime
policies. Typically, bonus/incentive eligible employees do not earn overtime.
Cash overtime Definitive findings on LADWP’s overtime costs require further analysis.

Recommendations and Next Steps 7
28 © 2016 Oliver Wyman
Total compensation: Recommendations and next steps by OPA, LADWP, and Oliver Wyman
• LADWP and OPA are considering a plan to jointly conduct the next phase of benchmarking of LADWP. This next phase will extend the Phase I Benchmarking work and this Total Compensation Study by evaluating overall cost per function and sub-function of LADWP’s Water, Power, and Joint Divisions. Upon completion of this next phase, LADWP plans even more detailed assessment of key business processes.
• LADWP should participate in periodic utility industry salary surveys.
• OPA believes that LADWP could better explain its rate actions to the public by updating this study before base rates are adjusted in the future.

Appendix 1: Cash Compensation; Salary and Salary plus Bonus/Incentive Pay
8

30 © 2016 Oliver Wyman
In order to properly match each of LADWP’s class codes with appropriate market data contained in the survey, Mercer worked closely with LADWP: • The LADWP provided a census file encompassing annualized salary data for all of LADWP’s employees. • Mercer conducted a thorough review of the elements of compensation included in the survey data to ensure
a consistent comparison with LADWP data: - Based on data obtained from each of the four survey sources (see next page), median annualized base
salaries (excluding overtime, tenure pay, shift differentials, parking subsidies, etc.) for the applicable DDRs for each class code at LADWP were compared to median annualized salary data from the selected position matches from each of the applicable surveys.
• LADWP provided Mercer with all DDR descriptions for each of the 99 job classes initially requested. • Mercer provided preliminary position matches to be used for the analysis based on review of LADWP DDR
descriptions. • Mercer conducted in-person work sessions with Subject Matter Experts (SMEs) from Water and Power
operating divisions to discuss and review the preliminary position matches for each of the benchmark class codes.
• LADWP provided additional feedback in writing from Water, Power, and Joint Divisions regarding preliminary position matches and applicable DDRs in each class code.
• Mercer modified/refined the preliminary position matches as necessary. • LADWP provided feedback from Water, Power, and Joint Divisions regarding the revised position matches. • Mercer used the approved position matches and applicable DDRs to conduct a market review of base salary
and total cash compensation for each class code.
Cash compensation methodology (1 of 5) Benchmarking Process

31 © 2016 Oliver Wyman
• Survey data were evaluated based on the following dimensions: – Electric and water utilities industries. – Size of organization and relative customer base. – Ownership type: public-owned utility (POU) and investor-owned utility (IOU).
• For each of the 89 class codes included in the review, comparable roles among existing compensation surveys were compared to four published survey sources with a focus on the utility industry where applicable: – 2015 Economic Research Institute Electric Utilities & Renewable Energy Salary Survey (796 participants). – 2015 American Water Works Association Compensation Survey (497 participants). – 2015 Mercer Energy Sector Compensation Survey (60 utility participants). – 2015 Mercer Benchmark Database (61 utility participants).
• Where available, position matches were selected from each survey based on similar title, responsibilities, and minimum candidate requirements/qualifications and were thoroughly vetted by LADWP SMEs from the Water, Power, and Joint Divisions.
Cash compensation methodology (2 of 5) Data Sources

32 © 2016 Oliver Wyman
• Market data were collected for the 25th percentile, median, and 75th percentile and compared to median annualized salaries for the applicable DDRs for each class code. Note that compensation data is presented on a summary basis only (i.e., only aggregate 25th percentile, median, and 75th percentile are shown) due to confidentiality clauses contained in each of the four surveys.
• Median data were selected for several reasons: – Market median is a “standard” comparison point when benchmarking pay. As such, median data is
available for all four surveys whereas not all provide average pay data. Thus, average market data cannot be provided.
– Market median provides a more stable statistical reference point so as not to skew the analysis - - use of averages tends to bias compensation data when outliers exist (high or low data points at either extremity).
• Equal weight was awarded to each individual survey source selected. • In cases where LADWP selected different position matches for different DDRs within the same class code,
the median survey data for all matches were weighted evenly and compared to the median annualized salary data for LADWP for all applicable DDRs for the relevant class code.
• Note that “position-weighted median” data is used throughout this analysis to compare market job class data with LADWP data. “Position-weighted median” data is derived by taking a simple median of the relevant data (i.e., each class code is only included once in the calculation, regardless of the number of incumbents covered under the respective class code). This methodology is a “standard” practice used throughout the industry.
• The job classes included under the Senior Management group are typically also considered senior management by the utility companies represented in the surveys.
Cash compensation methodology (3 of 5) Market Data Comparison

33 © 2016 Oliver Wyman
• The analysis indicated that like LADWP, most POU employees are not bonus-eligible (i.e., 50% or more of the incumbents are not bonus-eligible). – Market levels of total cash compensation for those positions which are typically not bonus-eligible within
the market are therefore equivalent to the market levels of salary for those roles. – For those positions which are typically bonus-eligible (i.e., 50% or more of the incumbents are bonus-
eligible), market data provided include actual bonuses awarded in 2014 and paid in 2015.
Cash compensation methodology (4 of 5) Market Data Comparison
34 © 2016 Oliver Wyman
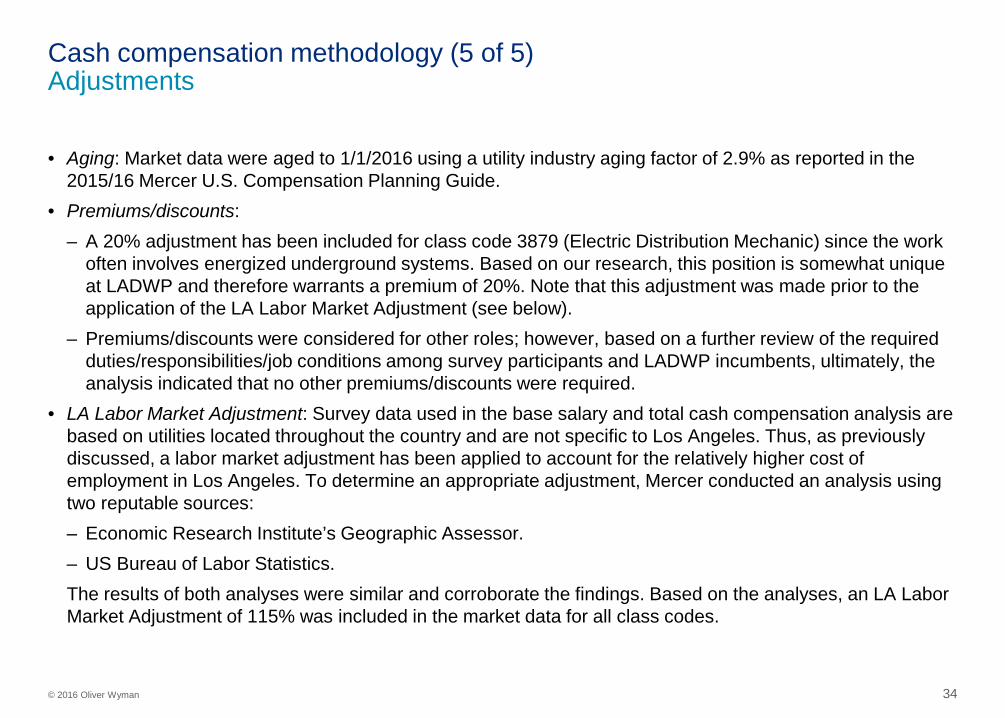
• Aging: Market data were aged to 1/1/2016 using a utility industry aging factor of 2.9% as reported in the 2015/16 Mercer U.S. Compensation Planning Guide.
• Premiums/discounts: – A 20% adjustment has been included for class code 3879 (Electric Distribution Mechanic) since the work
often involves energized underground systems. Based on our research, this position is somewhat unique at LADWP and therefore warrants a premium of 20%. Note that this adjustment was made prior to the application of the LA Labor Market Adjustment (see below).
– Premiums/discounts were considered for other roles; however, based on a further review of the required duties/responsibilities/job conditions among survey participants and LADWP incumbents, ultimately, the analysis indicated that no other premiums/discounts were required.
• LA Labor Market Adjustment: Survey data used in the base salary and total cash compensation analysis are based on utilities located throughout the country and are not specific to Los Angeles. Thus, as previously discussed, a labor market adjustment has been applied to account for the relatively higher cost of employment in Los Angeles. To determine an appropriate adjustment, Mercer conducted an analysis using two reputable sources: – Economic Research Institute’s Geographic Assessor. – US Bureau of Labor Statistics. The results of both analyses were similar and corroborate the findings. Based on the analyses, an LA Labor Market Adjustment of 115% was included in the market data for all class codes.
Cash compensation methodology (5 of 5) Adjustments

35 © 2016 Oliver Wyman
2015 Economic Research Institute Participant Profile
31%
69%
Type of Utility
IOU POU
796 participating organizations
Names of participating organizations cannot be released publically due to confidentiality restrictions

36 © 2016 Oliver Wyman
2015 American Water Works Association Participant Profile
0%
100%
Type of Utility
IOU POU
497 participating organizations
Names of participating organizations cannot be released publically due to confidentiality restrictions

37 © 2016 Oliver Wyman
2015 Mercer Energy Sector Utility Industry Participant Profile
74%
26%
Type of Utility
IOU POU
60 participating organizations
Names of participating organizations cannot be released publically due to confidentiality restrictions

38 © 2016 Oliver Wyman
2015 Mercer Benchmark Database Utility Industry Participant Profile
65%
35%
Type of Utility
IOU POU
61 participating organizations
Names of participating organizations cannot be released publically due to confidentiality restrictions

Appendix 2: Retirement Benefits 9

40 © 2016 Oliver Wyman
• In generating the “normalized” workforce retirement benefit cost for LADWP of ~$14,500 (see next page), Mercer used the following methodology: – Calculated the “normal” retirement benefit cost of the benchmarked job classifications. – Weighted, based on the number of employee participants in either Tier 1 or Tier 2, to
determine a weighted average total cost • This analysis is based on a “normal cost” for LADWP and each of the peers. This differs from
the annual actuarial valuation of pension cost which takes into account the 88.5% funding level of LADWP (based on market value of assets). The comparison of annual actuarial pension costs is not appropriate and/or available for the peers due to funding level differences and other factors: – Mercer’s calculation of average normal cost is ~$14,500 for LADWP. – LADWP’s normal cost ($149M in the July 1, 2015 actuarial valuation) divided by LADWP’s
~9,000 employees results in an average normal cost of ~$16,000. • Mercer used benchmark salary data to calculate the “normal” cost from retirement programs
for 31 peer utilities selected jointly by LADWP and OPA to provide market benchmarks. • The difference between LADWP’s and Mercer’s normal cost numbers is largely due to
assumption differences, as Mercer used consistent assumptions for LADWP and all peers, rather than using LADWP’s specific actuarial assumptions.
Retirement benefits benchmarking methodology Mercer used an industry standard methodology to analyze the “normal” cost of retirement benefits for LADWP versus its peers.

41 © 2016 Oliver Wyman
Peer panels for Retirement Benefits benchmarking
Austin EnergyCity of BakersfieldBurbank Water & PowerCitizens EnergyCity of AnaheimCPS Energy (San Antonio)Orlando Utilities CommissionRiverside Public UtilitiesSalt River ProjectSMUDCity of Stockton
Arizona Public Service CompanyCalifornia WaterConsolidated Edison CompanyFlorida Power & Light CompanyOncor Electric Delivery Company LLCGolden State WaterGreat Plains EnergyIdaho PowerEversourceNV EnergyOGE Energy PepcoPacific Gas and Electric CompanyPPL Electric Utilities CorporationSan Jose WaterSempraSouthern California Edison CompanySouthern CompanyTECO EnergyXcel
Investor-Owned Utilities Public Utilities
LADWP and OPA selected the most relevant comparators from Mercer’s database.

Appendix 3: Health and Other Benefits 10

43 © 2016 Oliver Wyman
• In generating the workforce health benefit cost for LADWP of ~$22,000 per employee per year, Mercer took the following steps: − Each health and ancillary benefit option (including retiree health benefits) was evaluated separately, net of
applicable employee contributions, with the results then added to get a total active health net benefits cost.
− Baseline gross costs for each LADWP medical and dental plan were developed using 2014/15 fiscal year budget rates, from the final renewal worksheet, applied to actual enrollment from the LADWP census data as of October 22, 2015.
− Applicable employee contributions, calculated using the final 2014/15 contribution rates from the final renewal worksheet, were deducted from the gross cost to get net company cost.
− Medical and dental plan cost is a weighted average total net cost based on LADWP enrollment in each plan as of the census date.
− For life and disability coverage, rates were applied to average employee earnings calculated from the census data file as of October 22, 2015. Required employee contributions were deducted to get net cost.
− Time-off benefits (vacation, personal days, sick days and short-term disability) are assumed to be included in base salary compensation.
• LADWP’s costs were compared against similar programs for 31 peer utilities selected jointly by LADWP and OPA to provide market benchmarks.
Health and other benefits benchmarking methodology Mercer used an industry standard methodology to benchmark health and other benefits costs for LADWP versus its peers.

44 © 2016 Oliver Wyman
Peer panels for Health and Other Benefits benchmarking
Austin EnergyCity of BakersfieldBurbank Water & PowerCitizens EnergyCity of AnaheimCPS Energy (San Antonio)Orlando Utilities CommissionRiverside Public UtilitiesSalt River ProjectSMUDCity of Stockton
Arizona Public Service CompanyCalifornia WaterConsolidated Edison CompanyFlorida Power & Light CompanyOncor Electric Delivery Company LLCGolden State WaterGreat Plains EnergyIdaho PowerEversourceNV EnergyOGE Energy PepcoPacific Gas and Electric CompanyPPL Electric Utilities CorporationSan Jose WaterSempraSouthern California Edison CompanySouthern CompanyTECO EnergyXcel
Investor-Owned Utilities Public Utilities
The same peer panels were used for both the health and benefits and retirement analyses, selected jointly by LADWP and OPA from Mercer’s database.

45 © 2016 Oliver Wyman
Medical benefit cost per employee LADWP vs peer organization, IOU and POU
Note: Comparisons were made against separate panels of 20 investor-owned utilities (IOUs) and 11 publicly-owned utilities (POUs) agreed to by LADWP and OPA. Source: LADWP, Mercer analysis.
• LADWP is in the 4th quartile for medical benefit costs.
• Employee cost share for benefits is relatively low.
• Employee contributions toward HMO plans are low.
• High family-tier enrollment in LADWP’s plans contributes to the higher overall medical costs.
• LADWP employees have higher costs in areas like Owens Valley where provider competition is limited.
Q4
Q3
Q2
Q1 $14.0
$15.0
$16.5
LADWP: $17.6K
IOU Panel
Lowest
Highest Q4
Q3
Q2
Q1 $14.0
$14.1
$16.1
POU Panel
Lowest
Highest
Medical benefits (active employees) LADWP ranks in the 4th quartile against IOU and POU peers.
Commentary
46 © 2016 Oliver Wyman
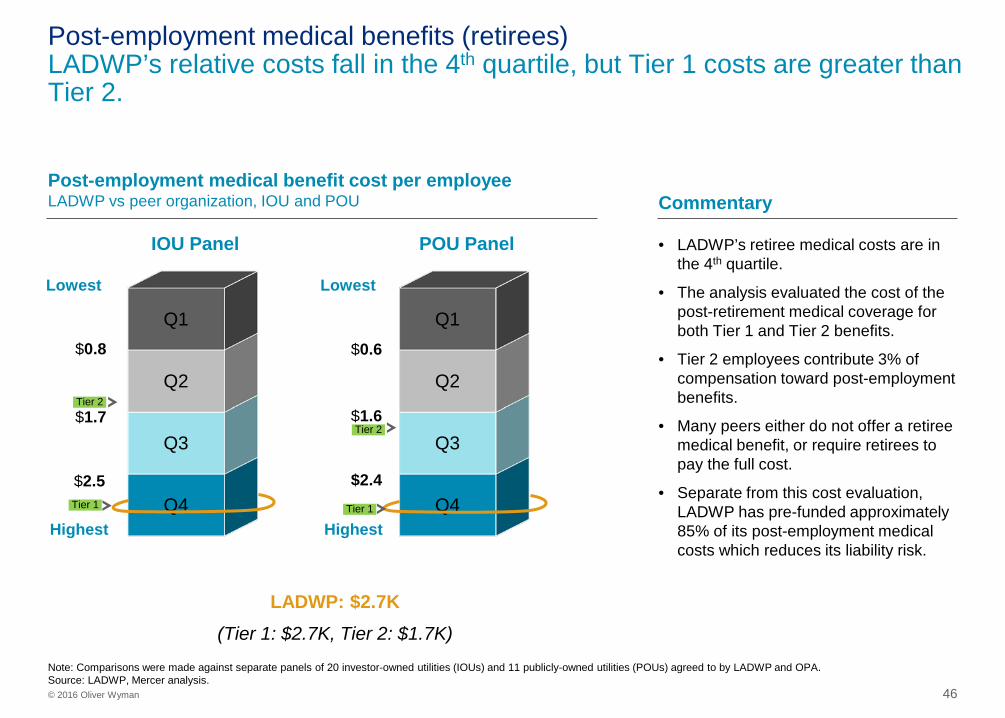
Post-employment medical benefit cost per employee LADWP vs peer organization, IOU and POU
Note: Comparisons were made against separate panels of 20 investor-owned utilities (IOUs) and 11 publicly-owned utilities (POUs) agreed to by LADWP and OPA. Source: LADWP, Mercer analysis.
• LADWP’s retiree medical costs are in the 4th quartile.
• The analysis evaluated the cost of the post-retirement medical coverage for both Tier 1 and Tier 2 benefits.
• Tier 2 employees contribute 3% of compensation toward post-employment benefits.
• Many peers either do not offer a retiree medical benefit, or require retirees to pay the full cost.
• Separate from this cost evaluation, LADWP has pre-funded approximately 85% of its post-employment medical costs which reduces its liability risk.
Q4
Q3
Q2
Q1 $0.8
$1.7
$2.5
LADWP: $2.7K (Tier 1: $2.7K, Tier 2: $1.7K)
IOU Panel
Lowest
Highest Q4
Q3
Q2
Q1 $0.6
$1.6
$2.4
POU Panel
Lowest
Highest
Post-employment medical benefits (retirees) LADWP’s relative costs fall in the 4th quartile, but Tier 1 costs are greater than Tier 2.
Commentary
Tier 1
Tier 2
Tier 1
Tier 2
47 © 2016 Oliver Wyman
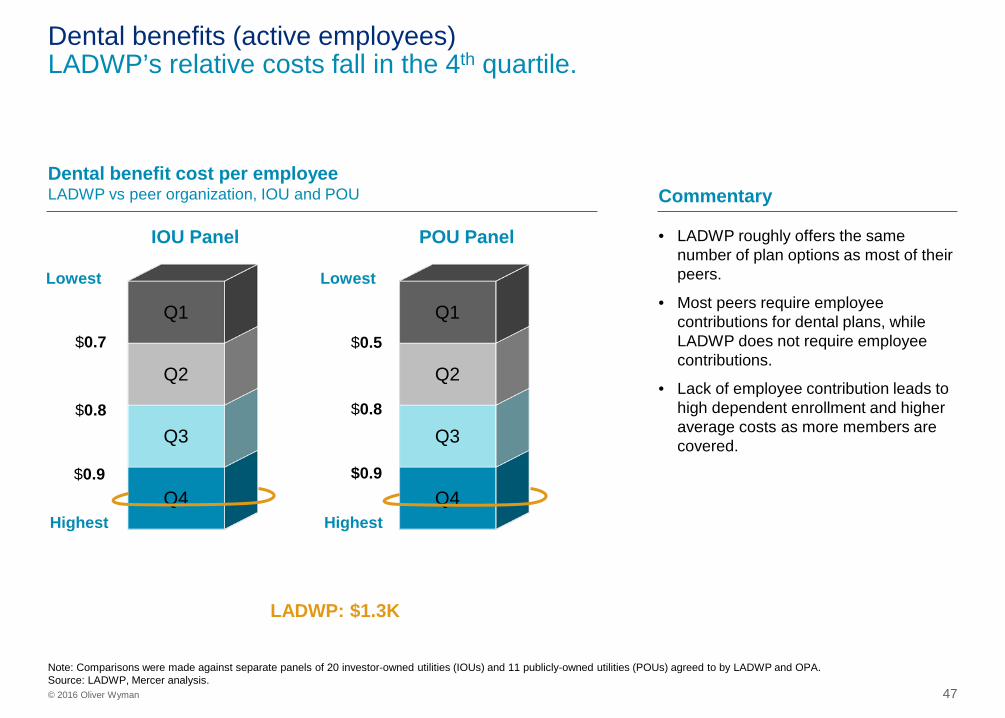
Dental benefit cost per employee LADWP vs peer organization, IOU and POU
Note: Comparisons were made against separate panels of 20 investor-owned utilities (IOUs) and 11 publicly-owned utilities (POUs) agreed to by LADWP and OPA. Source: LADWP, Mercer analysis.
• LADWP roughly offers the same number of plan options as most of their peers.
• Most peers require employee contributions for dental plans, while LADWP does not require employee contributions.
• Lack of employee contribution leads to high dependent enrollment and higher average costs as more members are covered.
Q4
Q3
Q2
Q1 $0.7
$0.8
$0.9
LADWP: $1.3K
IOU Panel
Lowest
Highest Q4
Q3
Q2
Q1 $0.5
$0.8
$0.9
POU Panel
Lowest
Highest
Dental benefits (active employees) LADWP’s relative costs fall in the 4th quartile.
Commentary

48 © 2016 Oliver Wyman
Life benefit cost per employee LADWP vs peer organization, IOU and POU
Note: Comparisons were made against separate panels of 20 investor-owned utilities (IOUs) and 11 publicly-owned utilities (POUs) agreed to by LADWP and OPA. Source: LADWP, Mercer analysis.
• LADWP’s life insurance costs are at median.
• Benefits fall between the 50th and 75th percentile of peers.
• LADWP and employees share in the cost of the Life benefits.
Q4
Q3
Q2
Q1 $0.2
$0.3
$0.4
LADWP: $0.3K
IOU Panel
Lowest
Highest Q4
Q3
Q2
Q1 $0.2
$0.3
$0.5
POU Panel
Lowest
Highest
Life insurance benefits (active employees) LADWP is at the median cost level.
Commentary

49 © 2016 Oliver Wyman
Long-term disability benefit cost per employee LADWP vs peer organization, IOU and POU
Note: Comparisons were made against separate panels of 20 investor-owned utilities (IOUs) and 11 publicly-owned utilities (POUs) agreed to by LADWP and OPA. Source: LADWP, Mercer analysis.
• LADWP shares in the cost of the LTD benefits.
• The most common approach for peers is to have employees pay the entire cost of the benefit.
• However, some peers do cover the full cost.
• LTD benefits begin later than most peer plans due to the short-term disability benefit having a longer duration.
• The LTD benefit percentage is below peers but the maximum benefit allowed is above peers.
Q4
Q3
Q2
Q1 $0.5
$0.7
$0.8
LADWP: $0.2K
IOU Panel
Lowest
Highest Q4
Q3
Q2
Q1 $0.6
$0.7
$0.7
POU Panel
Lowest
Highest
Long-term disability (LTD) benefits (active employees) LADWP cost ranks in the 1st quartile. Plan design is less generous and employees pick-up a large share of the cost.
Commentary

50 © 2016 Oliver Wyman
• Oliver Wyman is a global leader in management consulting. With offices in 50+ cities across 26 countries, Oliver Wyman combines deep industry knowledge with specialized expertise in strategy, operations, risk management, and organization transformation. The firm's 4,000 professionals help clients optimize their business, improve their operations and risk profile, and accelerate their organizational performance to seize the most attractive opportunities. Oliver Wyman is a wholly-owned subsidiary of Marsh & McLennan Companies [NYSE: MMC], a global professional services firm offering clients advice and solutions in the areas of risk, strategy and people. Marsh is a leader in insurance broking and risk management; Guy Carpenter is a leader in providing risk and reinsurance intermediary services; Mercer is a leader in talent, health, retirement and investment consulting; and Oliver Wyman is a leader in management consulting. With annual revenue of $13 billion and approximately 60,000 colleagues worldwide, Marsh & McLennan Companies provides analysis, advice and transactional capabilities to clients in more than 130 countries. The Company is committed to being a responsible corporate citizen and making a positive impact in the communities in which it operates. Visit www.mmc.com for more information and follow us on LinkedIn and Twitter @MMC_Global.
• Oliver Wyman’s energy practice helps companies address strategic and operational challenges through proven, results-oriented approaches across all sectors of the market, including utilities. The energy team has worked with leading energy and utility companies operating in the Americas, Europe, Asia, Africa, and the Middle East.
• Mercer is a global consulting leader in talent, health, retirement and investments. Mercer helps clients around the world advance the health, wealth and performance of their most vital asset – their people. Mercer’s more than 20,000 employees are based in 43 countries and the firm operates in over 140 countries.
• This report was prepared by a joint team from Oliver Wyman and Mercer, including senior specialists in utilities, compensation, retirement, and health and non-health benefits.
• Oliver Wyman contact information: 200 Clarendon Street, 12th Floor Boston, MA 02116-5026 (617) 424-3200
About Oliver Wyman and Mercer

QUALIFICATIONS, ASSUMPTIONS AND LIMITING
CONDITIONS
Oliver Wyman was engaged by the City of Los Angeles Office of Public Accountability / Ratepayer Advocate (OPA) to provide support to the OPA in its ongoing independent analysis efforts of LADWP.
Oliver Wyman shall not have any liability to any third party in respect of this report or any actions taken or decisions made as a consequence of the results, advice or recommendations set forth herein.
The opinions expressed herein are valid only for the purpose stated herein and as of the date hereof. Information furnished by others, upon which all or portions of this report are based, is believed to be reliable but has not been verified. No warranty is given as to the accuracy of such information. Public information and industry and statistical data are from sources Oliver Wyman deems to be reliable; however, Oliver Wyman makes no representation as to the accuracy or completeness of such information and has accepted the information without further verification. No responsibility is taken for changes in market conditions or laws or regulations and no obligation is assumed to revise this report to reflect changes, events or conditions, which occur subsequent to the date hereof.


Supplemental Information:
Joint Compensation
Study
Office of Public Accountability /
Ratepayer Advocate, City of Los Angeles
[email protected] tel. 213-978-0220
opa.lacity.org
December 30, 2016

Contents
To provide context for the Total Compensation Study, OPA provides this supplemental information useful in showing a historic, financial, and comprehensive view of labor compensation at LADWP.
1. Managing Total Compensation 2
2. Context of LADWP’s Labor Costs 4
3. Total Cash Compensation at LADWP 8
4. LADWP Total Compensation Comparisons 12

Managing Total Compensation 1

3
Total Compensation (sum of all components below)
Components of total costs of compensation Utilities increasingly look at all components of compensation together to develop strategies to attract and retain employees as well as better manage total labor costs.
Retirement and health benefits • Defined benefit and
defined contribution • Medical and dental • Life insurance • Long-term disability • Post-retirement medical
Cash comp above annual salary • Bonuses and incentive
pay • Pay for longevity &
unused time; meals • Other forms
Annual cash salary • Base salaries & wages • The value of paid time off,
sick leave and short-term disability are embedded in annual salary
1 2
4
5
Cash overtime • Cash payments 3
LADWP’s total labor costs include all the categories shown above. In fiscal year 2015, LADWP’s labor costs totaled $1.85 billion. As shown in the next section, LADWP’s labor costs are growing and represent significant portions of LADWP’s revenues and cash outlays.

Context of LADWP’s Labor Costs 2

5
Total employee-related costs1 Power and Water
Historical and forecast employee-related costs Total LADWP employee costs for both power and water have trended upward reaching $1.85B in 2015.
$597 $606 $643 $690 $779 $856 $845 $863 $872 $884 $913 $934 $1,051 $975 $1,004 $1,033
$115 $113 $117 $134
$157 $150 $146 $115 $143 $168 $198 $118
$126 $135 $137 $143
$91 $118 $150
$170 $175
$237 $357 $396 $440 $458
$489 $445
$479 $403 $386 $367
$223 $233 $240
$250
$264 $215
$266 $221 $188
$207 $247
$254
$278
$287 $313 $335
$1,027 $1,070 $1,150
$1,244
$1,375 $1,458
$1,614 $1,595 $1,643
$1,717
$1,847 $1,751
$1,934
$1,801 $1,840 $1,878
0
500
1,000
1,500
2,000
2005 2006 2007 2008 2009 2010 2011 2012 2013 2014 2015 2016 2017 2018 2019 2020
$M (n
omin
al)
CAGR2
7.83% CAGR 3.43%
CAGR 2.33%
Actual
Health
Retirement
1. Excludes the cost of daily exempts. 2. CAGR = Compound Annual Growth Rate Note: Years denote fiscal year end (e.g., 2009 ends June 2009) Source: LADWP; Oliver Wyman analysis
Cash compensation (excl. OT)
OT
Forecast during 2016 rate action
Approved budget (employee costs only
--other cost reductions are planned to offset 2017
increase to rate forecasts)

6
$0
$1,000
$2,000
$3,000
$4,000
$5,000
$6,000
Power Revenue Power Labor-Related Power Cash Outlays Controllable CashOutlays
Power Labor-Related
City transferDebt serviceFuel & purchased powerNon-labor O&M/capitalLabor-related appropriations (O&M)Labor-related appropriations (capital)Revenue
Labor-related cost: relative to revenue Fiscal year ending June 30, 2015, Power
Importance of labor cost: Power Managing power-related labor costs is important to LADWP. In 2015, power labor costs represented 39% of revenue and 58% of controllable cash outlays.
$ (in
mill
ions
)
Labor Cost is 58%
of Controllable Cash Outlays
Note: labor-related costs include expenditures/appropriations for salaries and wages ($804), health care plans ($164), and retirement and death benefit insurance plan ($333) Source: Power System Financial Statements; Actual expenditures included in City Budget; Oliver Wyman analysis
1
Labor-related cost: relative to cash outlays Fiscal year ending June 30, 2015, Power
$1,301 $3,337
$952 $952
$1,400
$443 $266
$4,362
$2,253 Labor Cost
is 39% of Revenue
$848
$453
$848 $848 $848
$1,301
$453 $453 $453

7
$0
$500
$1,000
$1,500
$2,000
$2,500
Water Revenue Water Labor-Related Water Cash Outlays Controllable CashOutlays
Water Labor-Related
Debt service
Purchased water
Non-labor O&M/capital
Labor-related appropriations (O&M)
Labor-related appropriations (capital)
Revenue
Importance of labor cost: Water Managing water-related labor costs is important to LADWP. In 2015, water labor costs represented 55% of revenue and 52% of controllable cash outlays.
Labor-related cost: relative to revenue Fiscal year ending June 30, 2015, Water
$ (in
mill
ions
)
Labor Cost is 52%
of Controllable Cash Outlays
Note: labor-related costs include expenditures/appropriations for salaries and wages ($353), health care plans ($83), and retirement and death benefit insurance plan ($157) Source: Water System Financial Statements; Actual expenditures included in City Budget; Oliver Wyman analysis
1
$593
Labor-related cost: relative to cash outlays Fiscal year ending June 30, 2015, Water
$1,082
$593
$555 $555
$273
$210
$1,631
$1,148
Labor Cost is 55%
of Revenue
$325 $325 $325 $325
$268 $268 $268 $268
Total Cash Compensation at LADWP 3

9
Total cash compensation at LADWP This total compensation study used employee census information totaling $1,153.3 million which was paid to 9,876 regular LADWP employees, daily exempt construction workers, and part-time staff.
Source: LADWP

10
LADWP Census Data Detail
Source: LADWP
Census File Component # of LADWP Employees
Amount Paid to Employees
($M)
Annual Salary *for Benchmarking
($M)
Base Salaries Base Salaries for 202 Benchmarked DDRs 5,926 $480.0 $538.6Base Salaries for non-benchmarked DDRs 3,950 $345.8 $384.3
Subtotal: Base Salaries 9,876 $825.8 $922.9
Cash Overtime $157.4
Other Cash Compensation Add-ons (MOU Required)Hazardous Pay $0.0Stand-by Pay $0.5Longevity Add-on $11.3Other Add-on $6.6
Other Cash Compensation Add-ons $18.4
Other AdjustmentsEmployee Other Pay Adj (MOU Required)
UNUSED 5.7B $11.6UNUSED SK PAY $10.9PREMIUM TIME, HOLIDAY $3.11 OVERTIME MEAL $4.8MEALS, BREAKFAST, LUNCH AND DINNER $2.5SUPPL UNUSED SK $1.3P.M. SHIFT DIFFERENTIAL, REGULAR TIME $1.2PREMIUM TIME, HOLIDAY EQUIVALENT $1.1TRANSPORTATION SUBSIDY $1.1MISCELLANEOUS EMPLOYEE OTHER PAY $7.6
Employees Other Pay Adj $45.1Non-discretionary, Post-retirement and Other One-time PaymentsDISABILITY WORK DAY (Reimbursed by Disability Fund ) $13.4RETRO PAY TX (MEA Prior Years COLA Retro Pay ) $5.1WORKERS COMPENSATION WORK DAY EXTENDED $3.9VACATION 10A (Post Retirement ) $2.6RET OPTION D (Post Retirement ) $2.3MOU % ADJ (Post Retirement ) $1.3VAC DEF COMP (Post Retirement ) $1.3MISCELLANEOUS NON-DISCRETIONARY AND ONE-TIME PAYMENTS $5.2
$35.1
Total Other Adjustments $80.2
$1,081.7
Base Salaries 884 $37.6
Overtime $5.6
Health and Pension Payments $28.3
$71.5
Grand Total 10,760 $1,153.3
Note:* Per Mercer provided benchmarking definition: Annual Salary for benchmarking = Annual Salary - Add-on Premium - Longevity Premium + Hazardous Pay + Standby Pay * Census Data file contains 360 rolls with zero annual salaries
Total for Daily Exempt Construction workers & Part-times
LADWP Census Data File(For the Period from October 2014 thru September 2015)
Regular Employees
Daily Exempt Construction Workers & Part-time Employees
Total for Regular Employees
Non-discretionary, Post-retirement and Other One-time Payments

11
• Both POUs and IOUs use various forms of cash compensation besides wages and salaries to attract and retain employees.
• IOUs often use cash bonuses and incentive compensation systems, as well as non-cash programs such as stock options, to reward and incentivize employees.
• As shown on the previous pages, for the 4 quarters ending September 30, 2015, LADWP paid $18.4 million in other compensation add-ons, $45.1 million in pay adjustments, and $35.1 million in non-discretionary, post-retirement, and other one-time payments to regular employees.
• Other forms of cash compensations totaled $98.6 million over the period used for the study.
• These other forms of cash compensation averaged about $10,000 per employee at LADWP for this period.
Other cash compensation: Methodology overview and findings During this Study, data on other forms of cash compensation were collected and analyzed but not benchmarked against peers.
Other forms of cash compensation above annual salaries are generally not captured in standard utility industry salary surveys. Thus, analysis and findings on LADWP’s costs of this type of compensation relative of peers are not readily available.

LADWP Total Compensation Comparisons
4

13
LADWP Total Compensation Comparisons
Source: OPA