Embed Size (px)
Citation preview
Ingenia Communities Group
2015 Interim Results Presentation 24 February 2015
Stoney Creek Estate, Marsden Park (Sydney)
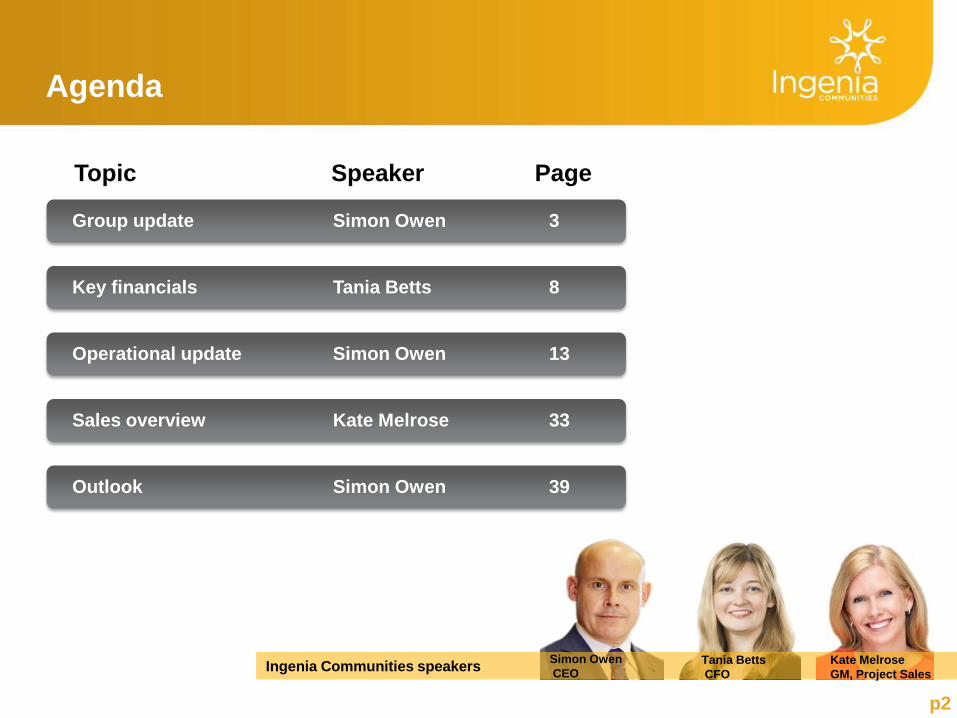
Agenda
Group update Simon Owen 3
Key financials Tania Betts 8
Operational update Simon Owen 13
Sales overview Kate Melrose 33
Outlook Simon Owen 39
Topic Speaker Page
Ingenia Communities speakers Simon Owen
CEO Tania Betts
CFO
Kate Melrose
GM, Project Sales
p2
p3
Ingenia Communities Group
Overview
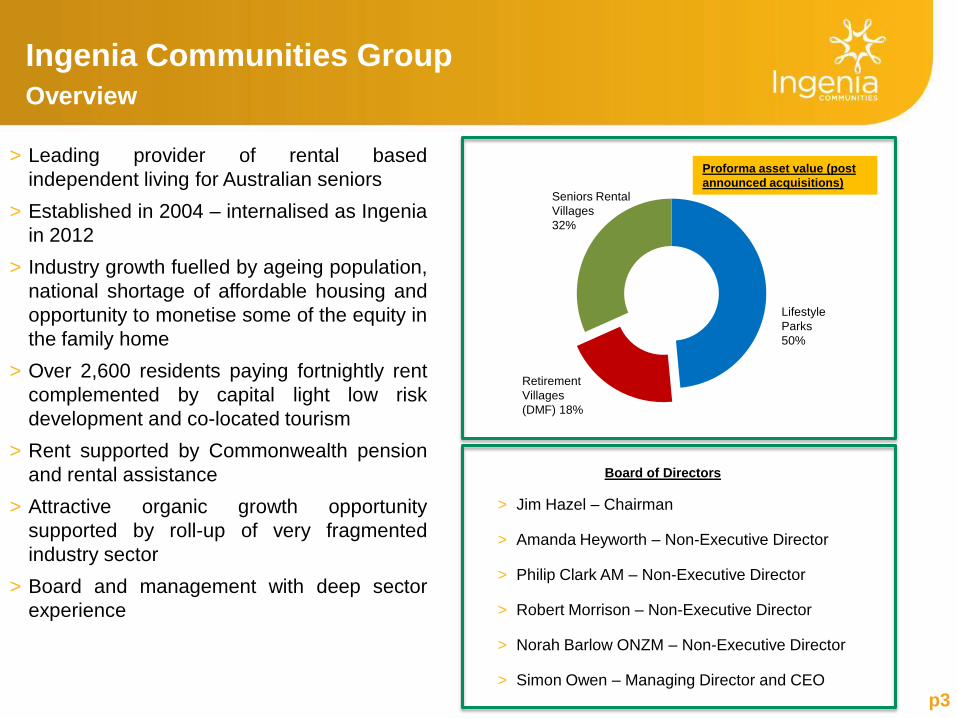
Board of Directors
> Jim Hazel – Chairman
> Amanda Heyworth – Non-Executive Director
> Philip Clark AM – Non-Executive Director
> Robert Morrison – Non-Executive Director
> Norah Barlow ONZM – Non-Executive Director
> Simon Owen – Managing Director and CEO
Proforma asset value (post
announced acquisitions)
Seniors Rental
Villages
32%
Retirement
Villages
(DMF) 18%
Lifestyle
Parks
50%
> Leading provider of rental based
independent living for Australian seniors
> Established in 2004 – internalised as Ingenia
in 2012
> Industry growth fuelled by ageing population,
national shortage of affordable housing and
opportunity to monetise some of the equity in
the family home
> Over 2,600 residents paying fortnightly rent
complemented by capital light low risk
development and co-located tourism
> Rent supported by Commonwealth pension
and rental assistance
> Attractive organic growth opportunity
supported by roll-up of very fragmented
industry sector
> Board and management with deep sector
experience
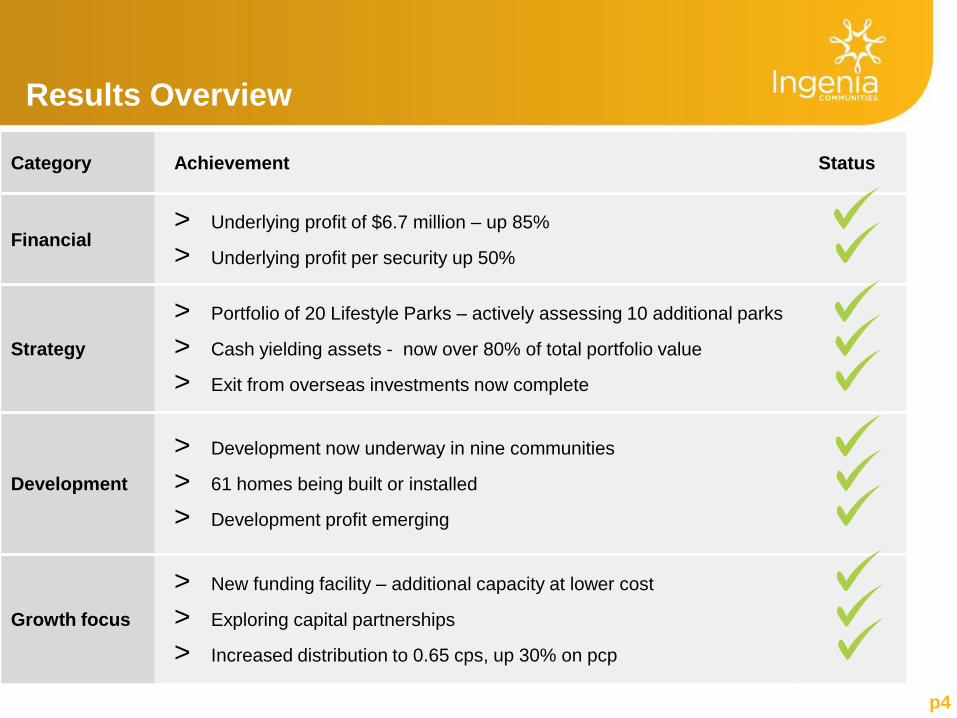
Results Overview
Category Achievement Status
Financial > Underlying profit of $6.7 million – up 85%
> Underlying profit per security up 50%
Strategy
> Portfolio of 20 Lifestyle Parks – actively assessing 10 additional parks
> Cash yielding assets - now over 80% of total portfolio value
> Exit from overseas investments now complete
Development
> Development now underway in nine communities
> 61 homes being built or installed
> Development profit emerging
Growth focus
> New funding facility – additional capacity at lower cost
> Exploring capital partnerships
> Increased distribution to 0.65 cps, up 30% on pcp
p4
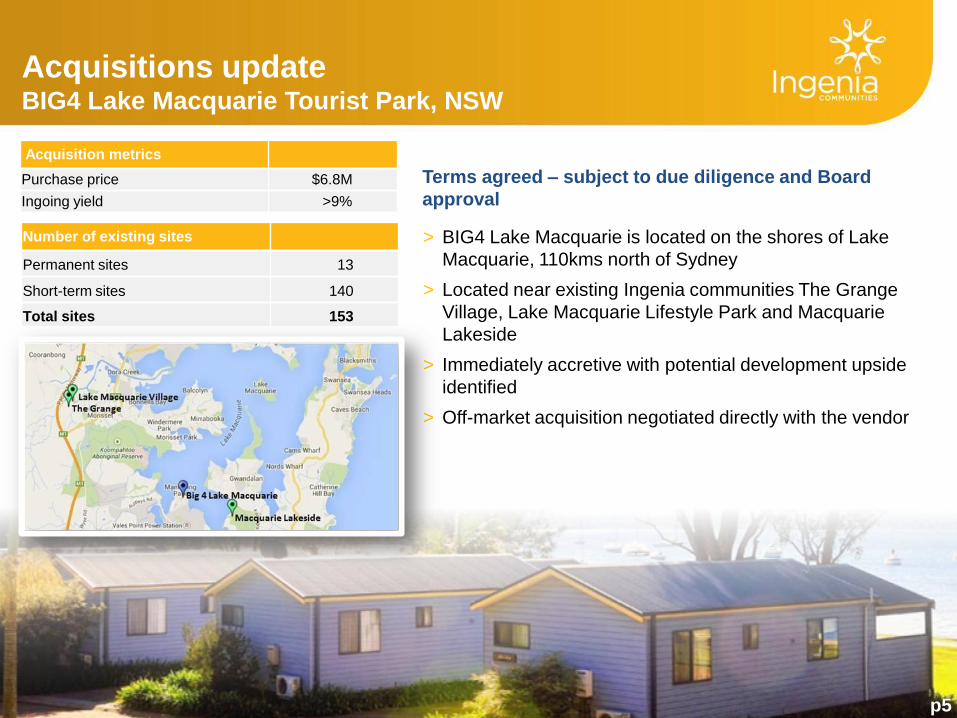
Acquisitions update BIG4 Lake Macquarie Tourist Park, NSW
p5
Acquisition metrics
Purchase price $6.8M
Ingoing yield >9%
Number of existing sites
Permanent sites 13
Short-term sites 140
Total sites 153
> BIG4 Lake Macquarie is located on the shores of Lake
Macquarie, 110kms north of Sydney
> Located near existing Ingenia communities The Grange
Village, Lake Macquarie Lifestyle Park and Macquarie
Lakeside
> Immediately accretive with potential development upside
identified
> Off-market acquisition negotiated directly with the vendor
Terms agreed – subject to due diligence and Board
approval
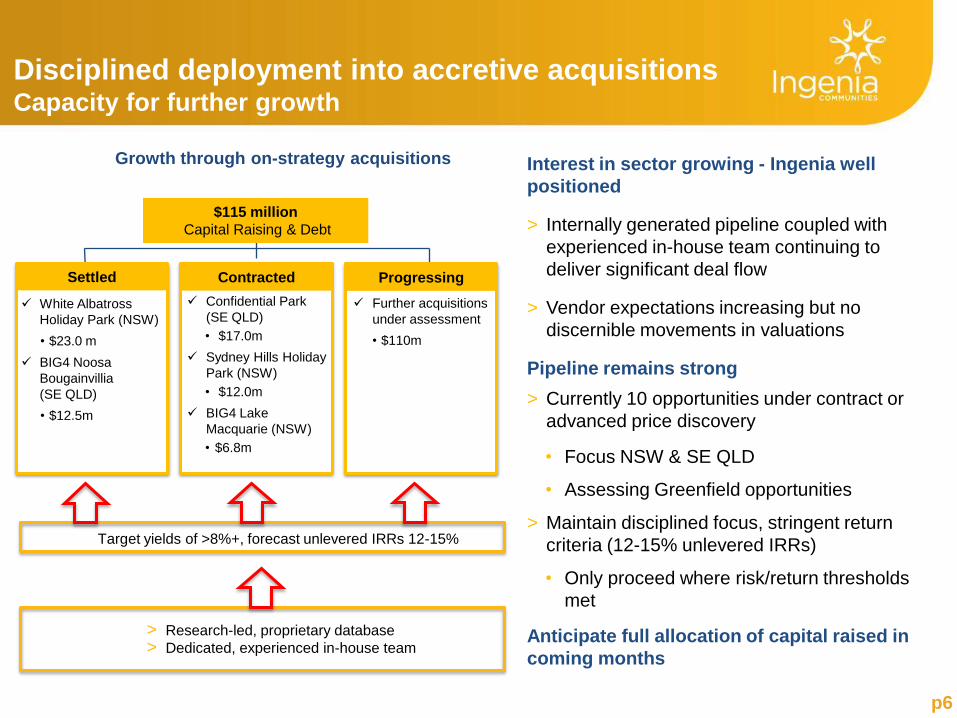
Target yields of >8%+, forecast unlevered IRRs 12-15%
Disciplined deployment into accretive acquisitions Capacity for further growth
p6
Growth through on-strategy acquisitions Interest in sector growing - Ingenia well
positioned
> Internally generated pipeline coupled with
experienced in-house team continuing to
deliver significant deal flow
> Vendor expectations increasing but no
discernible movements in valuations
Pipeline remains strong
> Currently 10 opportunities under contract or
advanced price discovery
• Focus NSW & SE QLD
• Assessing Greenfield opportunities
> Maintain disciplined focus, stringent return
criteria (12-15% unlevered IRRs)
• Only proceed where risk/return thresholds
met
Anticipate full allocation of capital raised in
coming months
White Albatross
Holiday Park (NSW)
• $23.0 m
BIG4 Noosa
Bougainvillia
(SE QLD)
• $12.5m
Settled
Further acquisitions
under assessment
• $110m
Progressing
Confidential Park
(SE QLD)
• $17.0m
Sydney Hills Holiday
Park (NSW)
• $12.0m
BIG4 Lake
Macquarie (NSW)
• $6.8m
Contracted
$115 million
Capital Raising & Debt
> Research-led, proprietary database
> Dedicated, experienced in-house team
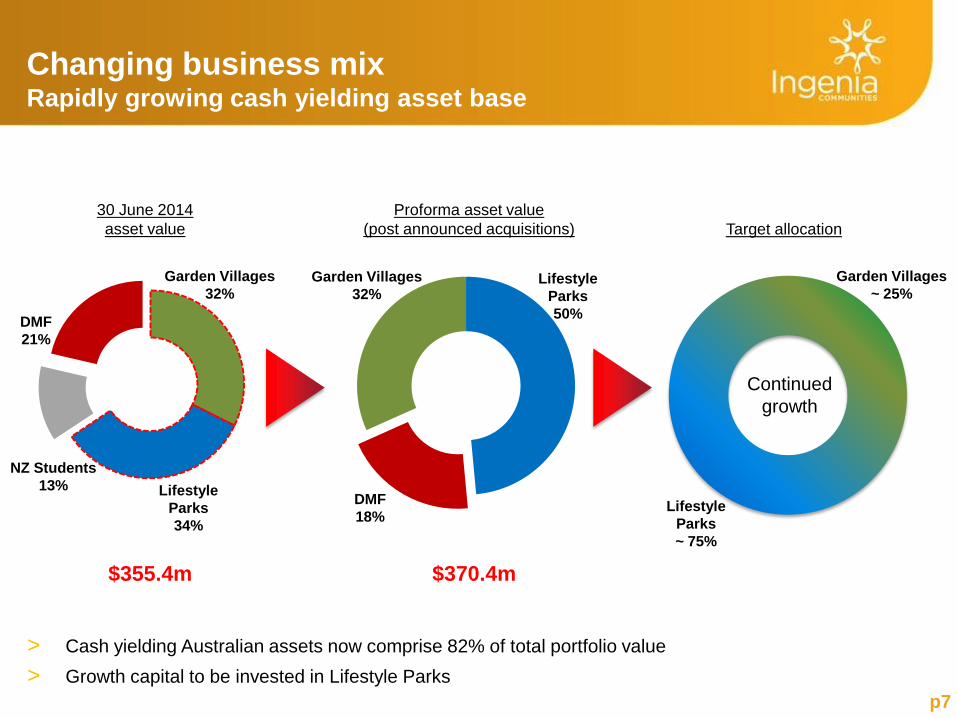
Changing business mix Rapidly growing cash yielding asset base
p7
30 June 2014
asset value
Proforma asset value
(post announced acquisitions)
Lifestyle
Parks
34%
Target allocation
Lifestyle
Parks
~ 75%
Continued
growth
Garden Villages
32%
DMF
18%
Lifestyle
Parks
50%
> Cash yielding Australian assets now comprise 82% of total portfolio value
> Growth capital to be invested in Lifestyle Parks
$355.4m $370.4m
Garden Villages
32%
DMF
21%
NZ Students
13%
Garden Villages
~ 25%
p8
Key financials
Stoney Creek Estate, Marsden Park (Sydney)
Key financials
p9
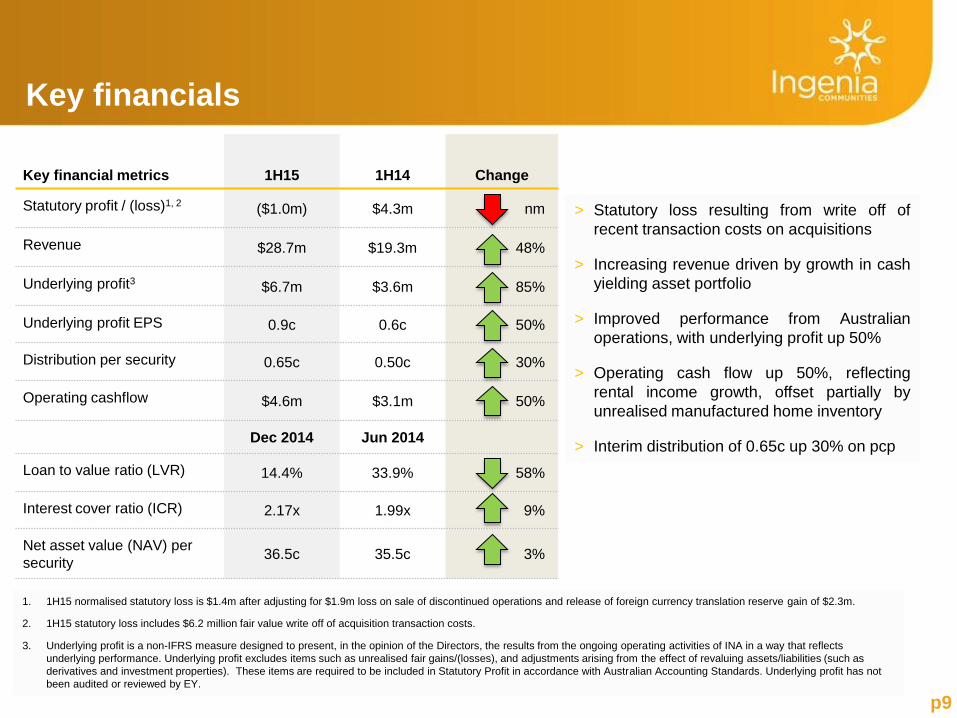
Key financial metrics 1H15
1H14 Change
Statutory profit / (loss)1, 2 ($1.0m) $4.3m nm
Revenue $28.7m $19.3m 48%
Underlying profit3 $6.7m $3.6m 85%
Underlying profit EPS
0.9c 0.6c 50%
Distribution per security
0.65c 0.50c 30%
Operating cashflow $4.6m $3.1m 50%
Dec 2014 Jun 2014
Loan to value ratio (LVR) 14.4% 33.9% 58%
Interest cover ratio (ICR) 2.17x 1.99x 9%
Net asset value (NAV) per
security 36.5c 35.5c 3%
1. 1H15 normalised statutory loss is $1.4m after adjusting for $1.9m loss on sale of discontinued operations and release of foreign currency translation reserve gain of $2.3m.
2. 1H15 statutory loss includes $6.2 million fair value write off of acquisition transaction costs.
3. Underlying profit is a non-IFRS measure designed to present, in the opinion of the Directors, the results from the ongoing operating activities of INA in a way that reflects
underlying performance. Underlying profit excludes items such as unrealised fair gains/(losses), and adjustments arising from the effect of revaluing assets/liabilities (such as
derivatives and investment properties). These items are required to be included in Statutory Profit in accordance with Australian Accounting Standards. Underlying profit has not
been audited or reviewed by EY.
> Statutory loss resulting from write off of
recent transaction costs on acquisitions
> Increasing revenue driven by growth in cash
yielding asset portfolio
> Improved performance from Australian
operations, with underlying profit up 50%
> Operating cash flow up 50%, reflecting
rental income growth, offset partially by
unrealised manufactured home inventory
> Interim distribution of 0.65c up 30% on pcp
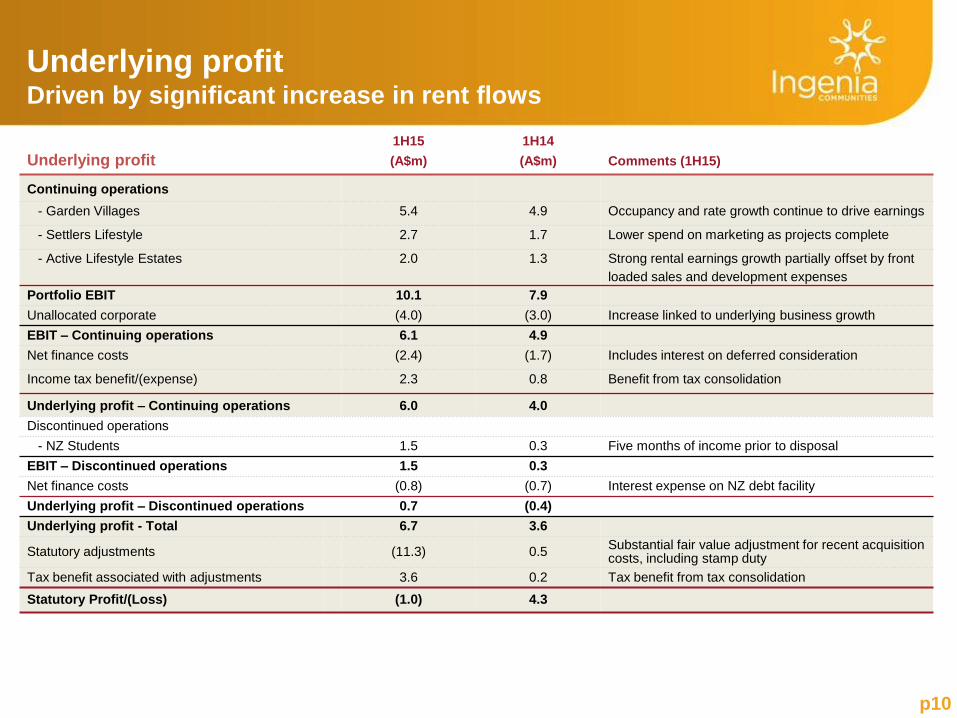
Underlying profit
1H15
(A$m)
1H14
(A$m) Comments (1H15)
Continuing operations
- Garden Villages 5.4 4.9 Occupancy and rate growth continue to drive earnings
- Settlers Lifestyle 2.7 1.7 Lower spend on marketing as projects complete
- Active Lifestyle Estates 2.0 1.3 Strong rental earnings growth partially offset by front
loaded sales and development expenses
Portfolio EBIT 10.1 7.9
Unallocated corporate (4.0) (3.0) Increase linked to underlying business growth
EBIT – Continuing operations 6.1 4.9
Net finance costs (2.4) (1.7) Includes interest on deferred consideration
Income tax benefit/(expense) 2.3 0.8 Benefit from tax consolidation
Underlying profit – Continuing operations 6.0 4.0
Discontinued operations
- NZ Students 1.5 0.3 Five months of income prior to disposal
EBIT – Discontinued operations 1.5 0.3
Net finance costs (0.8) (0.7) Interest expense on NZ debt facility
Underlying profit – Discontinued operations 0.7 (0.4)
Underlying profit - Total 6.7 3.6
Statutory adjustments (11.3) 0.5 Substantial fair value adjustment for recent acquisition costs, including stamp duty
Tax benefit associated with adjustments 3.6 0.2 Tax benefit from tax consolidation
Statutory Profit/(Loss) (1.0) 4.3
Underlying profit Driven by significant increase in rent flows
p10
p11
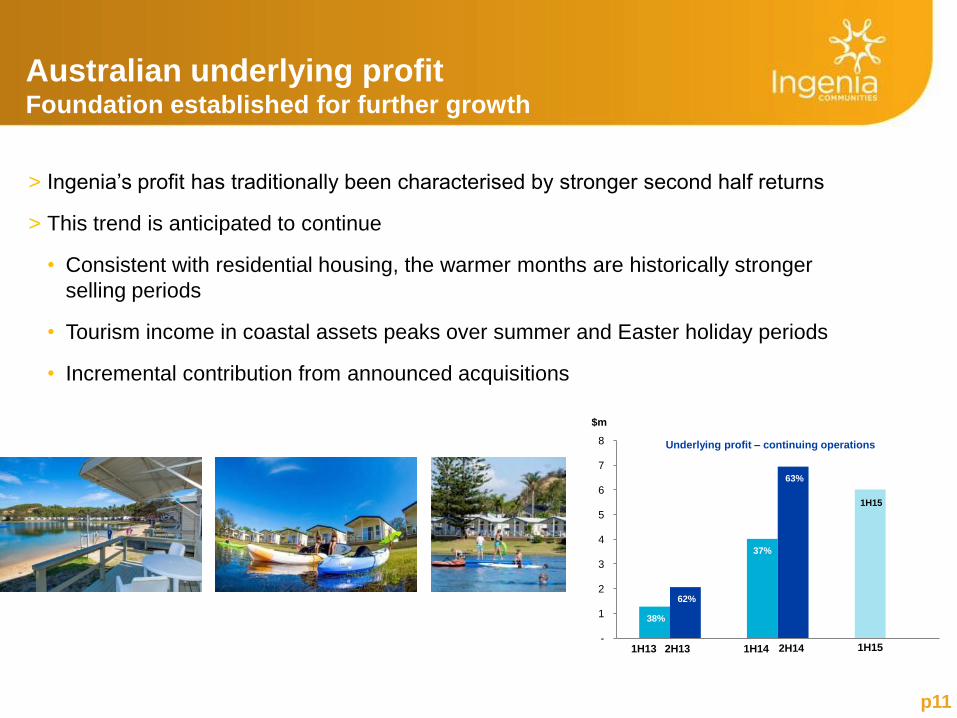
Australian underlying profit Foundation established for further growth
> Ingenia’s profit has traditionally been characterised by stronger second half returns
> This trend is anticipated to continue
• Consistent with residential housing, the warmer months are historically stronger
selling periods
• Tourism income in coastal assets peaks over summer and Easter holiday periods
• Incremental contribution from announced acquisitions
$m
Underlying profit – continuing operations
1H13 2H13 1H14 2H14 1H15
38%
37%
1H15
62%
63%
-
1
2
3
4
5
6
7
8
p12
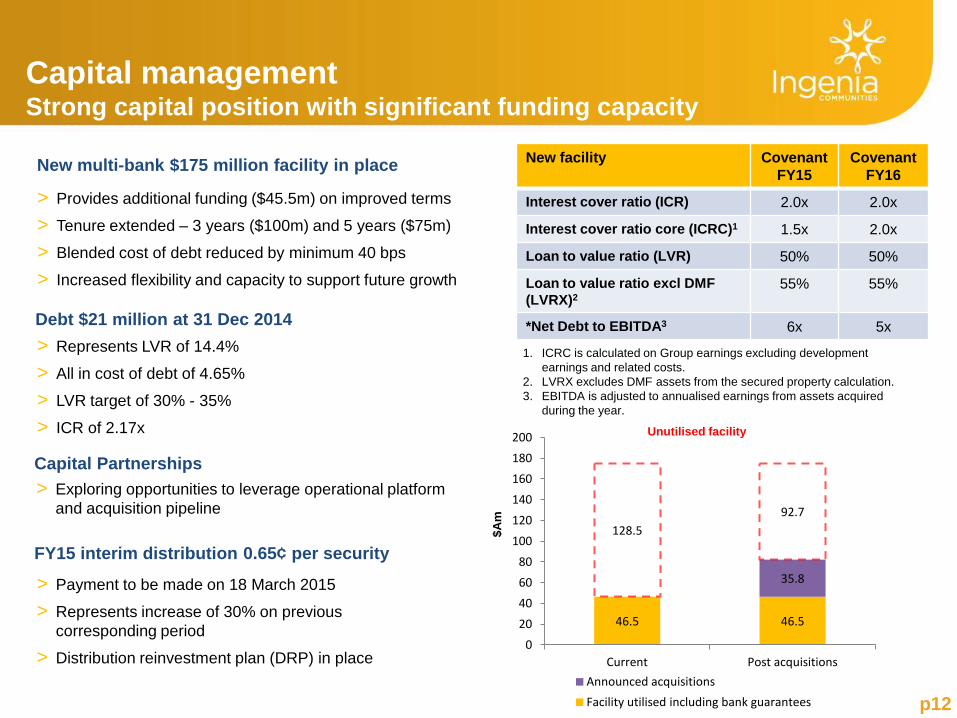
> Provides additional funding ($45.5m) on improved terms
> Tenure extended – 3 years ($100m) and 5 years ($75m)
> Blended cost of debt reduced by minimum 40 bps
> Increased flexibility and capacity to support future growth
Debt $21 million at 31 Dec 2014
FY15 interim distribution 0.65¢ per security
> Payment to be made on 18 March 2015
> Represents increase of 30% on previous
corresponding period
> Distribution reinvestment plan (DRP) in place
Capital management Strong capital position with significant funding capacity
New facility Covenant
FY15
Covenant
FY16
Interest cover ratio (ICR) 2.0x 2.0x
Interest cover ratio core (ICRC)1 1.5x 2.0x
Loan to value ratio (LVR) 50% 50%
Loan to value ratio excl DMF
(LVRX)2
55% 55%
*Net Debt to EBITDA3 6x 5x
Capital Partnerships
> Exploring opportunities to leverage operational platform
and acquisition pipeline
> Represents LVR of 14.4%
> All in cost of debt of 4.65%
> LVR target of 30% - 35%
> ICR of 2.17x
New multi-bank $175 million facility in place
1. ICRC is calculated on Group earnings excluding development
earnings and related costs.
2. LVRX excludes DMF assets from the secured property calculation.
3. EBITDA is adjusted to annualised earnings from assets acquired
during the year.
46.5 46.5
35.8
128.5
92.7
0
20
40
60
80
100
120
140
160
180
200
Current Post acquisitions
Announced acquisitions
Facility utilised including bank guarantees
$A
m
Unutilised facility
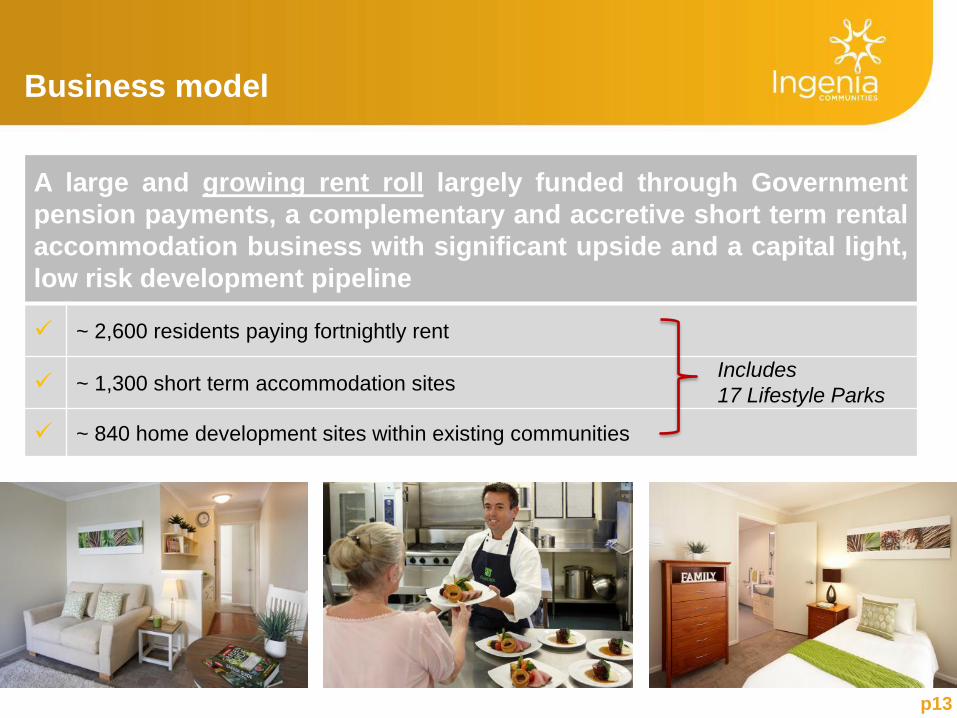
Business model
A large and growing rent roll largely funded through Government
pension payments, a complementary and accretive short term rental
accommodation business with significant upside and a capital light,
low risk development pipeline
~ 2,600 residents paying fortnightly rent
~ 1,300 short term accommodation sites
~ 840 home development sites within existing communities
p13
Includes
17 Lifestyle Parks
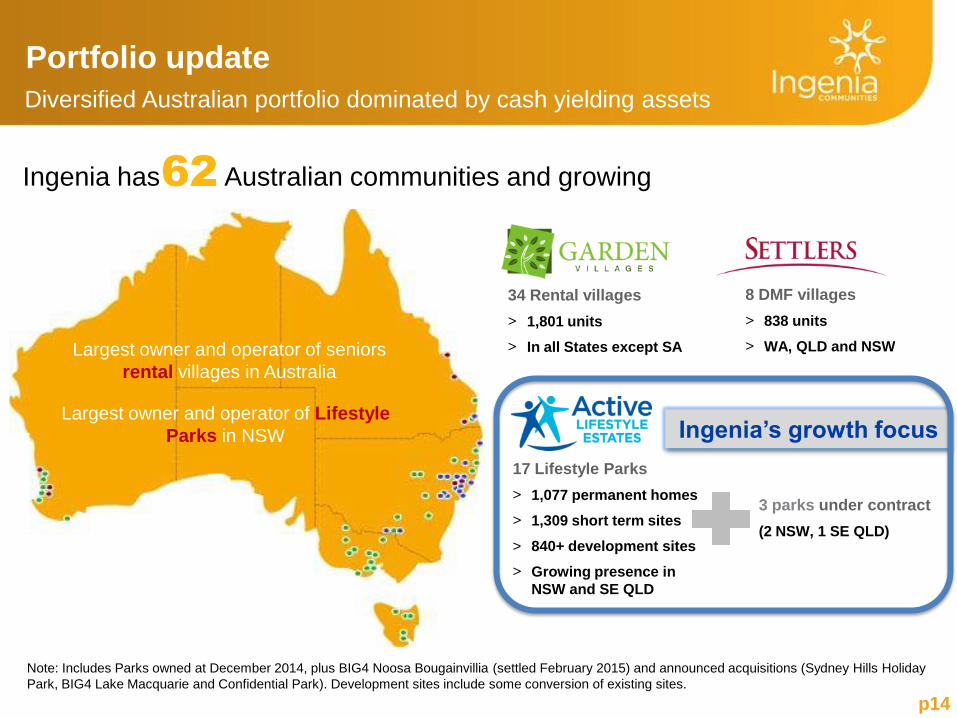
Portfolio update
Diversified Australian portfolio dominated by cash yielding assets
34 Rental villages
> 1,801 units
> In all States except SA
8 DMF villages
> 838 units
> WA, QLD and NSW
Ingenia has Australian communities and growing
Note: Includes Parks owned at December 2014, plus BIG4 Noosa Bougainvillia (settled February 2015) and announced acquisitions (Sydney Hills Holiday
Park, BIG4 Lake Macquarie and Confidential Park). Development sites include some conversion of existing sites.
Largest owner and operator of Lifestyle
Parks in NSW
17 Lifestyle Parks
> 1,077 permanent homes
> 1,309 short term sites
> 840+ development sites
> Growing presence in
NSW and SE QLD
3 parks under contract
(2 NSW, 1 SE QLD)
p14
Largest owner and operator of seniors
rental villages in Australia
62
Ingenia’s growth focus
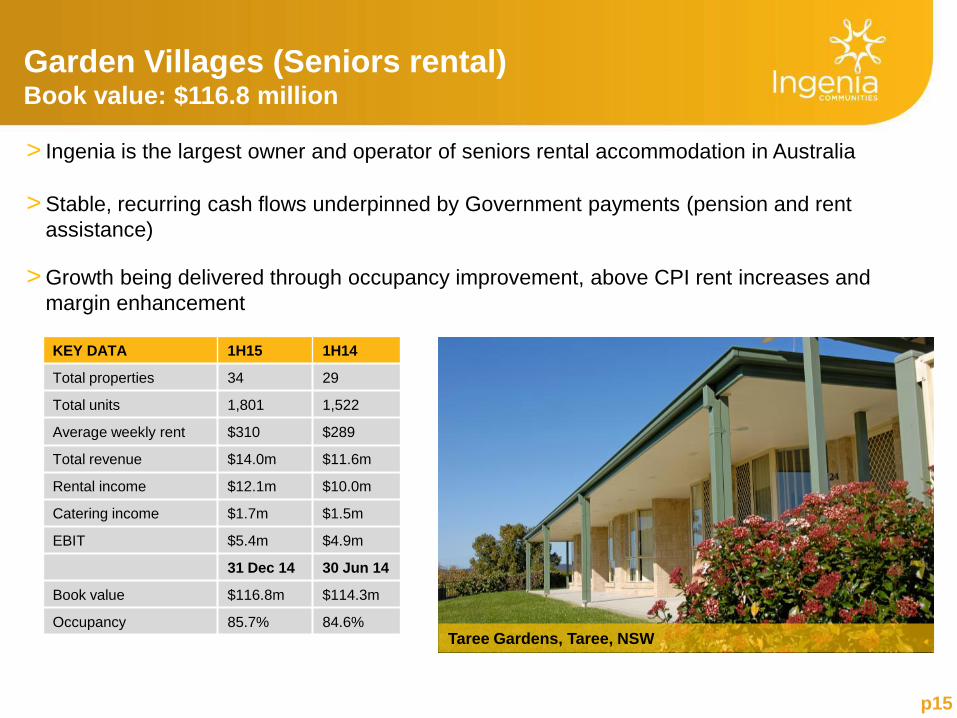
Garden Villages (Seniors rental) Book value: $116.8 million
> Ingenia is the largest owner and operator of seniors rental accommodation in Australia
> Stable, recurring cash flows underpinned by Government payments (pension and rent
assistance)
> Growth being delivered through occupancy improvement, above CPI rent increases and
margin enhancement
p15 p15
KEY DATA 1H15 1H14
Total properties 34 29
Total units 1,801 1,522
Average weekly rent $310 $289
Total revenue $14.0m $11.6m
Rental income $12.1m $10.0m
Catering income $1.7m $1.5m
EBIT $5.4m $4.9m
31 Dec 14 30 Jun 14
Book value $116.8m $114.3m
Occupancy 85.7% 84.6% Taree Gardens, Taree, NSW
-10% 0% 10% 20% 30% 40% 50% 60% 70% 80%
Occ
up
ancy
31
De
c 1
4
Operating Margins Year to Dec 14
Margin Analysis
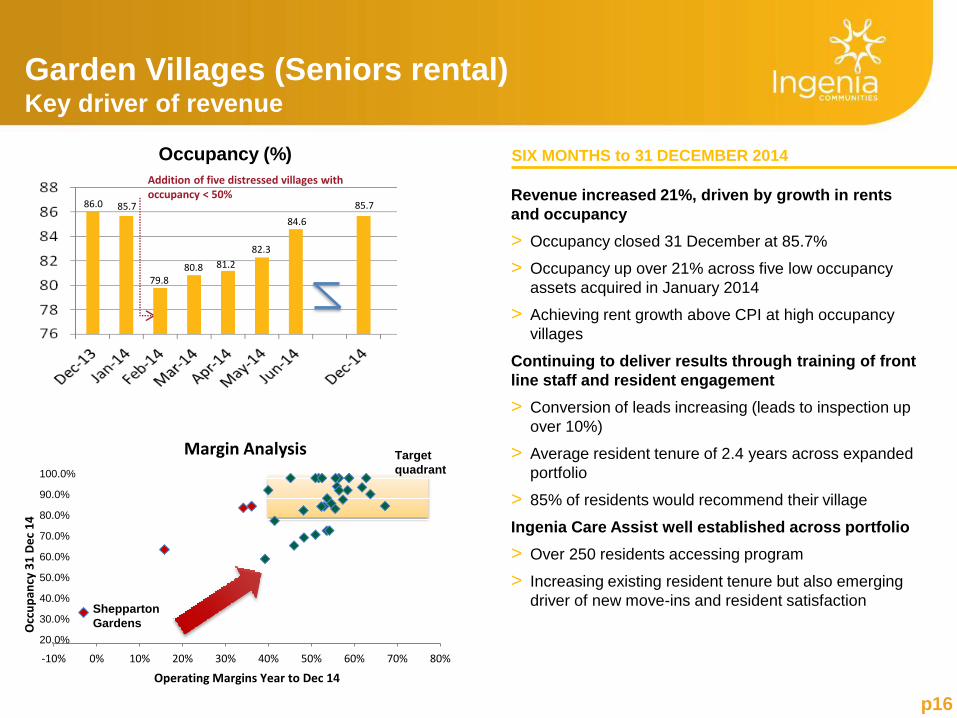
Revenue increased 21%, driven by growth in rents
and occupancy
> Occupancy closed 31 December at 85.7%
> Occupancy up over 21% across five low occupancy
assets acquired in January 2014
> Achieving rent growth above CPI at high occupancy
villages
Continuing to deliver results through training of front
line staff and resident engagement
> Conversion of leads increasing (leads to inspection up
over 10%)
> Average resident tenure of 2.4 years across expanded
portfolio
> 85% of residents would recommend their village
Ingenia Care Assist well established across portfolio
> Over 250 residents accessing program
> Increasing existing resident tenure but also emerging
driver of new move-ins and resident satisfaction
Garden Villages (Seniors rental) Key driver of revenue
p16
SIX MONTHS to 31 DECEMBER 2014
Addition of five distressed villages with occupancy < 50%
86.0 85.7
79.8 80.8 81.2
82.3
84.6
85.7
Occupancy (%)
Shepparton
Gardens
Target
quadrant 100.0%
90.0%
80.0%
70.0%
60.0%
50.0%
40.0%
30.0%
20.0%
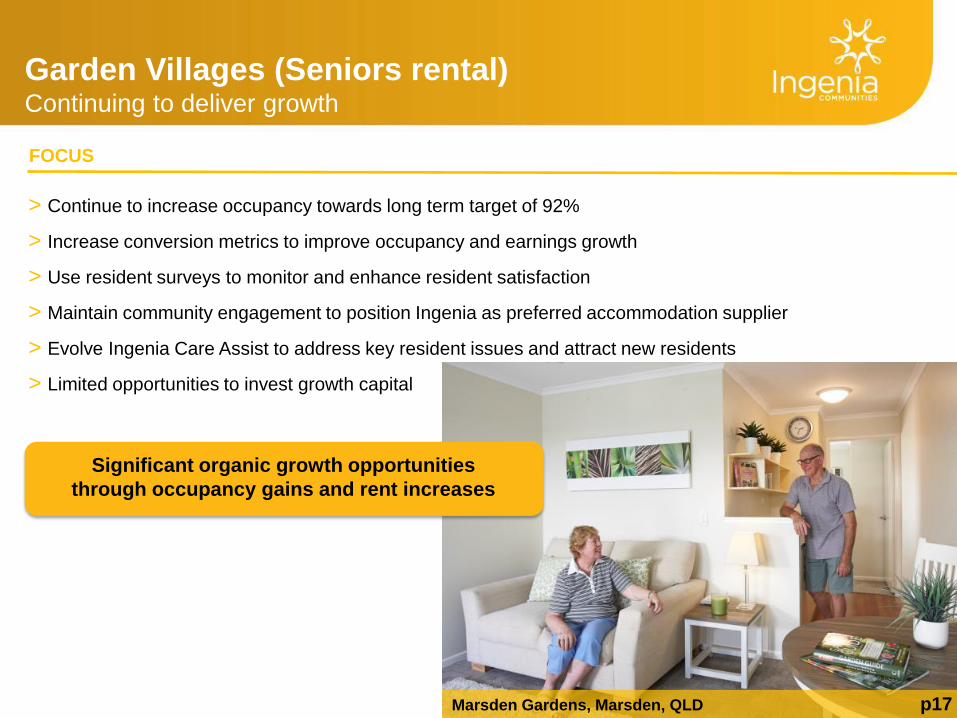
FOCUS
> Continue to increase occupancy towards long term target of 92%
> Increase conversion metrics to improve occupancy and earnings growth
> Use resident surveys to monitor and enhance resident satisfaction
> Maintain community engagement to position Ingenia as preferred accommodation supplier
> Evolve Ingenia Care Assist to address key resident issues and attract new residents
> Limited opportunities to invest growth capital
Garden Villages (Seniors rental) Continuing to deliver growth
Marsden Gardens, Marsden, QLD p17
Significant organic growth opportunities
through occupancy gains and rent increases
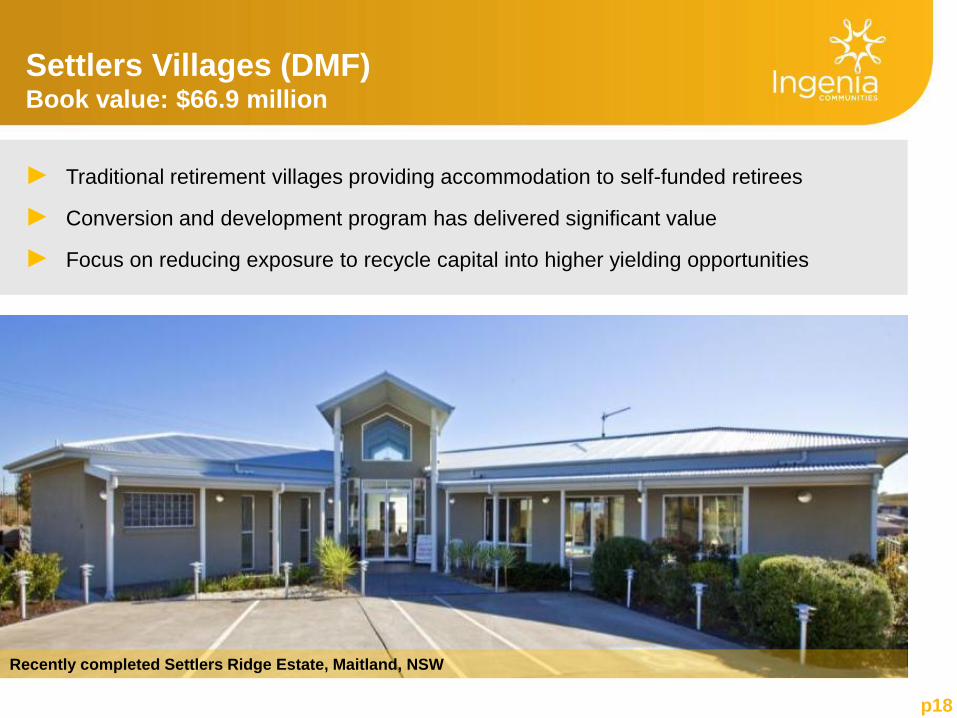
► Traditional retirement villages providing accommodation to self-funded retirees
► Conversion and development program has delivered significant value
► Focus on reducing exposure to recycle capital into higher yielding opportunities
Settlers Villages (DMF) Book value: $66.9 million
Recently completed Settlers Ridge Estate, Maitland, NSW
pp18
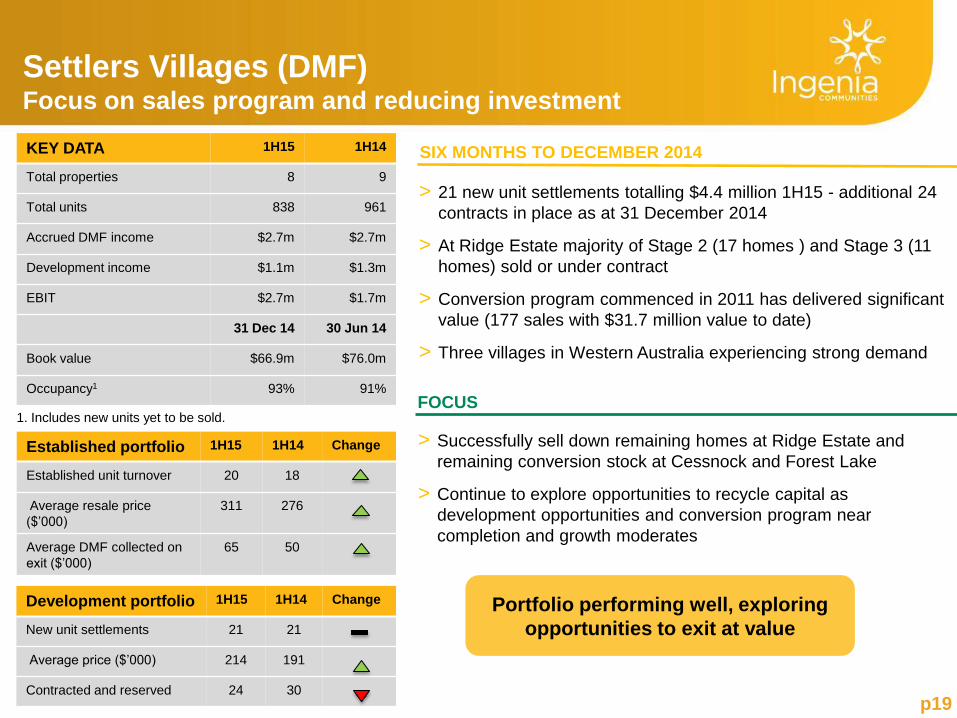
> 21 new unit settlements totalling $4.4 million 1H15 - additional 24
contracts in place as at 31 December 2014
> At Ridge Estate majority of Stage 2 (17 homes ) and Stage 3 (11
homes) sold or under contract
> Conversion program commenced in 2011 has delivered significant
value (177 sales with $31.7 million value to date)
> Three villages in Western Australia experiencing strong demand
p19
KEY DATA 1H15 1H14
Total properties 8 9
Total units 838 961
Accrued DMF income $2.7m $2.7m
Development income $1.1m $1.3m
EBIT $2.7m $1.7m
31 Dec 14 30 Jun 14
Book value $66.9m $76.0m
Occupancy1 93% 91%
Settlers Villages (DMF) Focus on sales program and reducing investment
Established portfolio 1H15 1H14 Change
Established unit turnover 20 18
Average resale price
($’000)
311 276
Average DMF collected on
exit ($’000)
65 50
Development portfolio 1H15 1H14 Change
New unit settlements 21 21
Average price ($’000) 214 191
Contracted and reserved 24 30
SIX MONTHS TO DECEMBER 2014
> Successfully sell down remaining homes at Ridge Estate and
remaining conversion stock at Cessnock and Forest Lake
> Continue to explore opportunities to recycle capital as
development opportunities and conversion program near
completion and growth moderates
FOCUS
Portfolio performing well, exploring
opportunities to exit at value
1. Includes new units yet to be sold.
Lifestyle Parks strategy Opportunity driven by ageing population and housing affordability
p20 Source: ABS, Catalogue Number 6416.0 - Established House Price Index (Eight Capital Cities)
Source: ABS, Catalogue Number 3222.0 - Population Projections, Australia, 2012 (base) to 2101
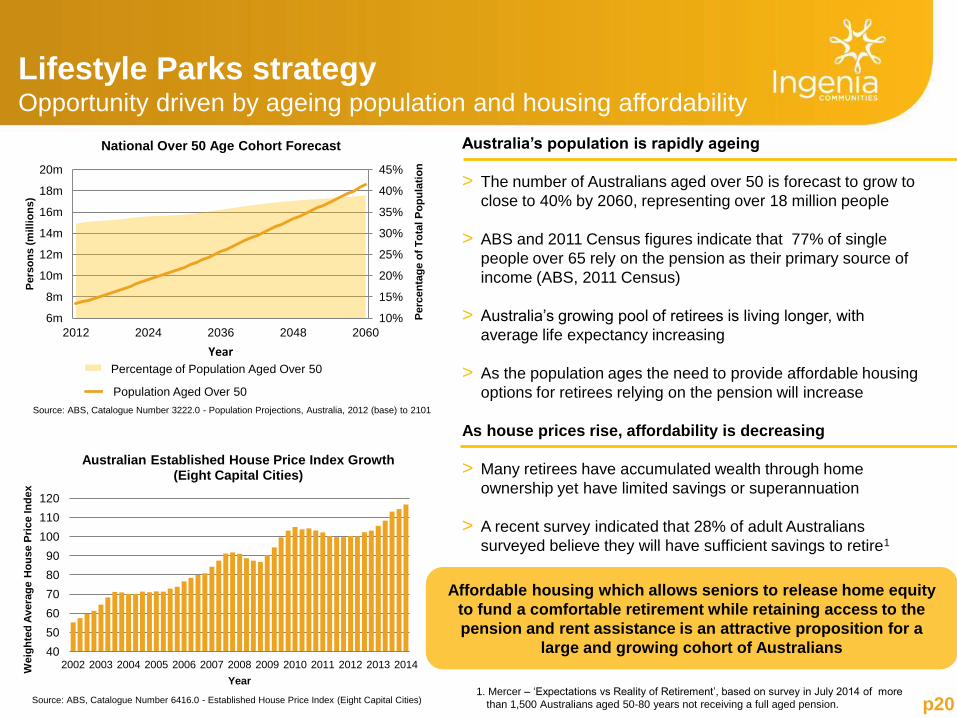
Australia’s population is rapidly ageing
> The number of Australians aged over 50 is forecast to grow to
close to 40% by 2060, representing over 18 million people
> ABS and 2011 Census figures indicate that 77% of single
people over 65 rely on the pension as their primary source of
income (ABS, 2011 Census)
> Australia’s growing pool of retirees is living longer, with
average life expectancy increasing
> As the population ages the need to provide affordable housing
options for retirees relying on the pension will increase
As house prices rise, affordability is decreasing
> Many retirees have accumulated wealth through home
ownership yet have limited savings or superannuation
> A recent survey indicated that 28% of adult Australians
surveyed believe they will have sufficient savings to retire1
1. Mercer – ‘Expectations vs Reality of Retirement’, based on survey in July 2014 of more
than 1,500 Australians aged 50-80 years not receiving a full aged pension.
Affordable housing which allows seniors to release home equity
to fund a comfortable retirement while retaining access to the
pension and rent assistance is an attractive proposition for a
large and growing cohort of Australians
10%
15%
20%
25%
30%
35%
40%
45%
6m
8m
10m
12m
14m
16m
18m
20m
2012 2024 2036 2048 2060
Perc
en
tag
e o
f T
ota
l P
op
ula
tio
n
Pers
on
s (
mil
lio
ns
)
Year
National Over 50 Age Cohort Forecast
Percentage of Population Chart Aged Over 50
Population Aged Over 50
Percentage of Population Aged Over 50
40
50
60
70
80
90
100
110
120
2002 2003 2004 2005 2006 2007 2008 2009 2010 2011 2012 2013 2014
Weig
hte
d A
vera
ge
Ho
us
e P
rice In
de
x
Year
Australian Established House Price Index Growth (Eight Capital Cities)
Lifestyle Parks strategy Sector in early stages of consolidation
p21
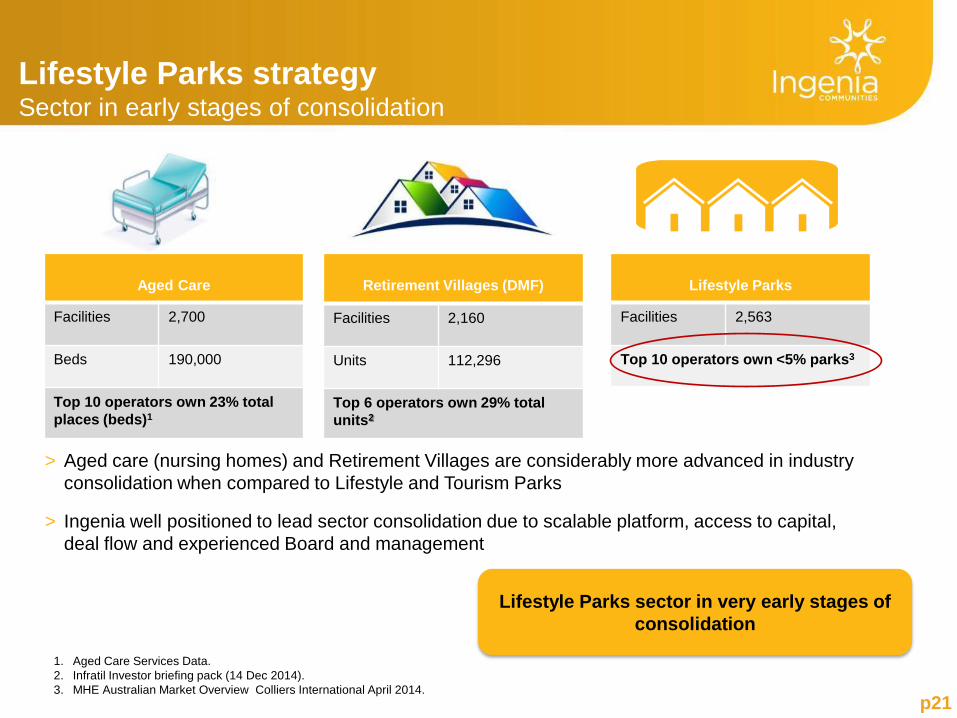
Aged Care
Facilities 2,700
Beds 190,000
Top 10 operators own 23% total
places (beds)1
Retirement Villages (DMF)
Facilities 2,160
Units 112,296
Top 6 operators own 29% total
units2
Lifestyle Parks
Facilities 2,563
Top 10 operators own <5% parks3
> Aged care (nursing homes) and Retirement Villages are considerably more advanced in industry
consolidation when compared to Lifestyle and Tourism Parks
> Ingenia well positioned to lead sector consolidation due to scalable platform, access to capital,
deal flow and experienced Board and management
1. Aged Care Services Data.
2. Infratil Investor briefing pack (14 Dec 2014).
3. MHE Australian Market Overview Colliers International April 2014.
Lifestyle Parks sector in very early stages of
consolidation
p22
0
500
1,000
1,500
2,000
2,500
3,000
3,500
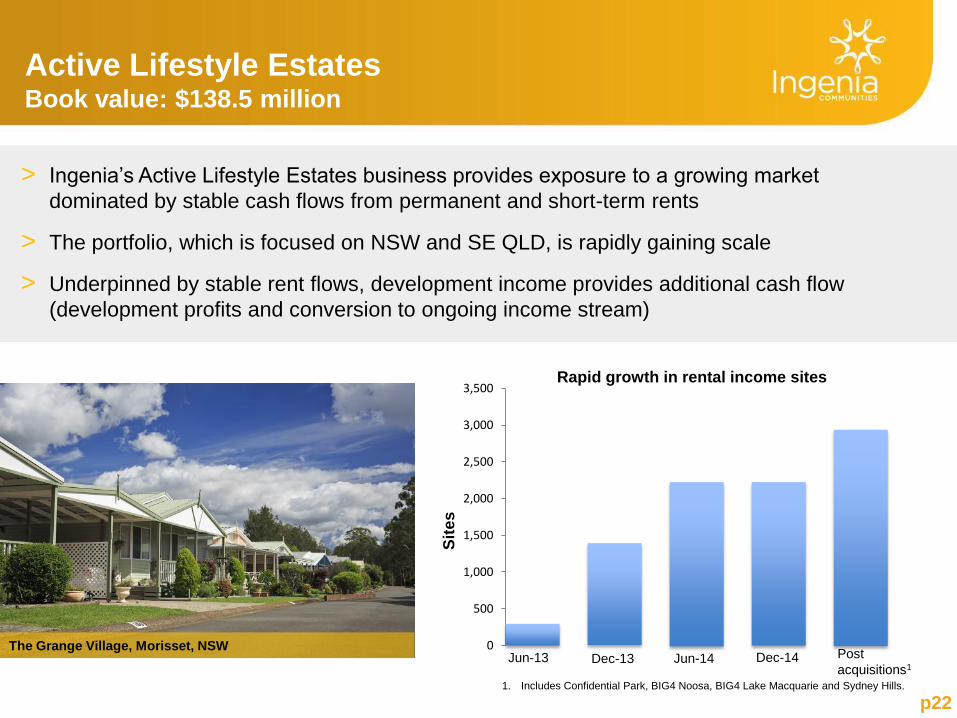
Active Lifestyle Estates Book value: $138.5 million
> Ingenia’s Active Lifestyle Estates business provides exposure to a growing market
dominated by stable cash flows from permanent and short-term rents
> The portfolio, which is focused on NSW and SE QLD, is rapidly gaining scale
> Underpinned by stable rent flows, development income provides additional cash flow
(development profits and conversion to ongoing income stream)
The Grange Village, Morisset, NSW
Sit
es
Post
acquisitions1 Jun-13 Dec-13 Jun-14 Dec-14
Rapid growth in rental income sites
1. Includes Confidential Park, BIG4 Noosa, BIG4 Lake Macquarie and Sydney Hills.
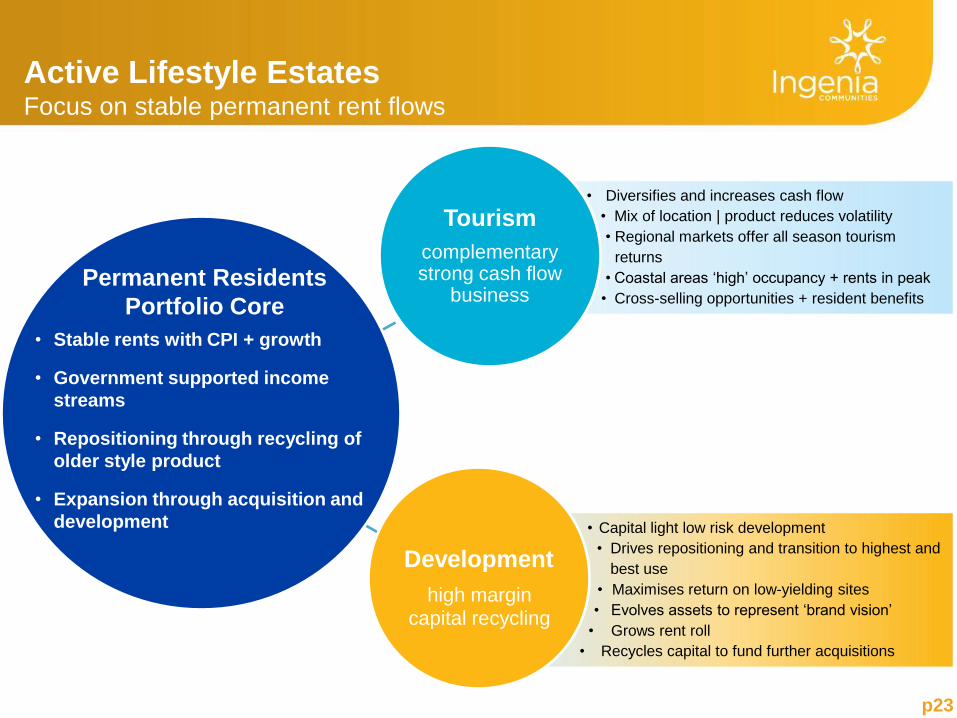
Active Lifestyle Estates Focus on stable permanent rent flows
p23
• Capital light low risk development
• Drives repositioning and transition to highest and
best use
• Maximises return on low-yielding sites
• Evolves assets to represent ‘brand vision’
• Grows rent roll
• Recycles capital to fund further acquisitions
• Diversifies and increases cash flow
• Mix of location | product reduces volatility
• Regional markets offer all season tourism
returns
• Coastal areas ‘high’ occupancy + rents in peak
• Cross-selling opportunities + resident benefits
Tourism
complementary strong cash flow
business
Development
Permanent Residents
Portfolio Core
• Stable rents with CPI + growth
• Government supported income
streams
• Repositioning through recycling of
older style product
• Expansion through acquisition and
development
high margin capital recycling
p24
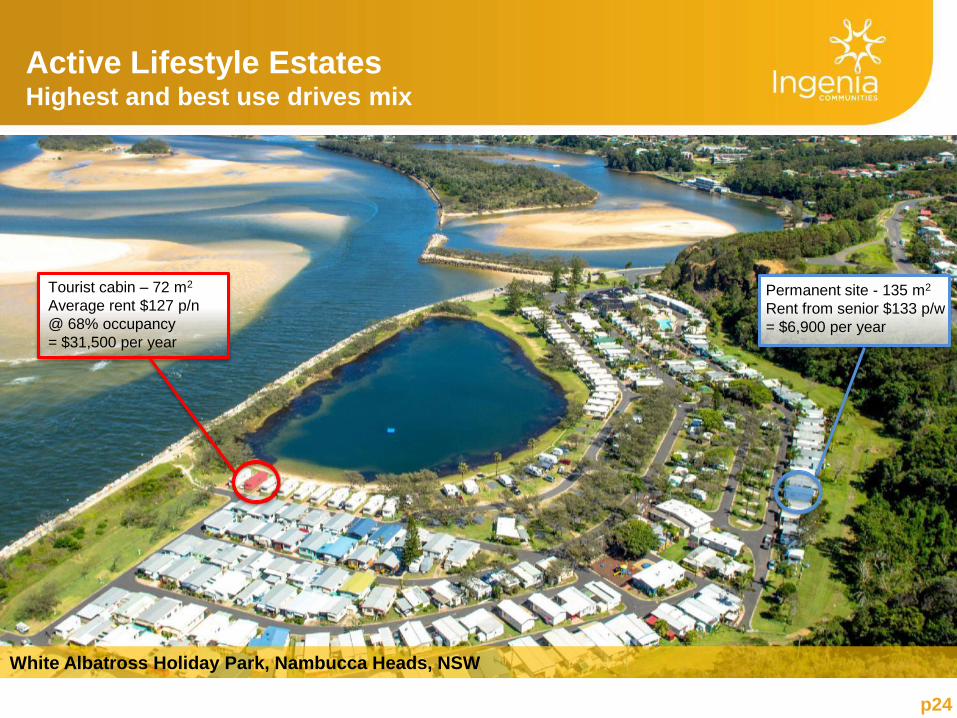
Active Lifestyle Estates Highest and best use drives mix
White Albatross Holiday Park, Nambucca Heads, NSW
Tourist cabin – 72 m2
Average rent $127 p/n
@ 68% occupancy
= $31,500 per year
Permanent site - 135 m2
Rent from senior $133 p/w
= $6,900 per year
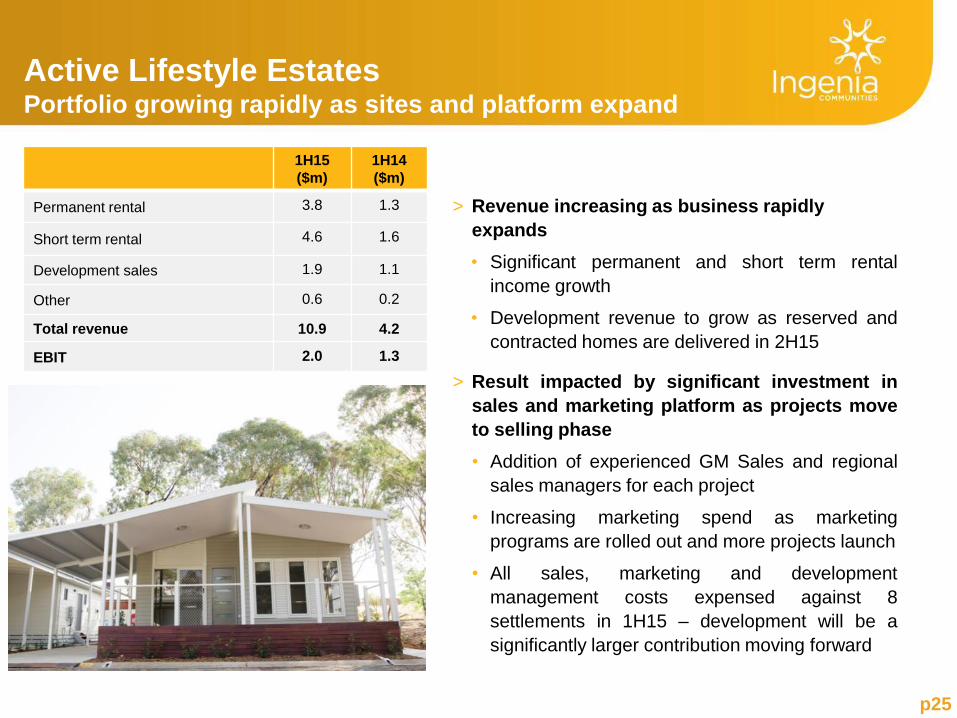
1H15
($m)
1H14
($m)
Permanent rental 3.8 1.3
Short term rental 4.6 1.6
Development sales 1.9 1.1
Other 0.6 0.2
Total revenue 10.9 4.2
EBIT 2.0 1.3
Active Lifestyle Estates Portfolio growing rapidly as sites and platform expand
p25
> Revenue increasing as business rapidly
expands
• Significant permanent and short term rental
income growth
• Development revenue to grow as reserved and
contracted homes are delivered in 2H15
> Result impacted by significant investment in
sales and marketing platform as projects move
to selling phase
• Addition of experienced GM Sales and regional
sales managers for each project
• Increasing marketing spend as marketing
programs are rolled out and more projects launch
• All sales, marketing and development
management costs expensed against 8
settlements in 1H15 – development will be a
significantly larger contribution moving forward
p26
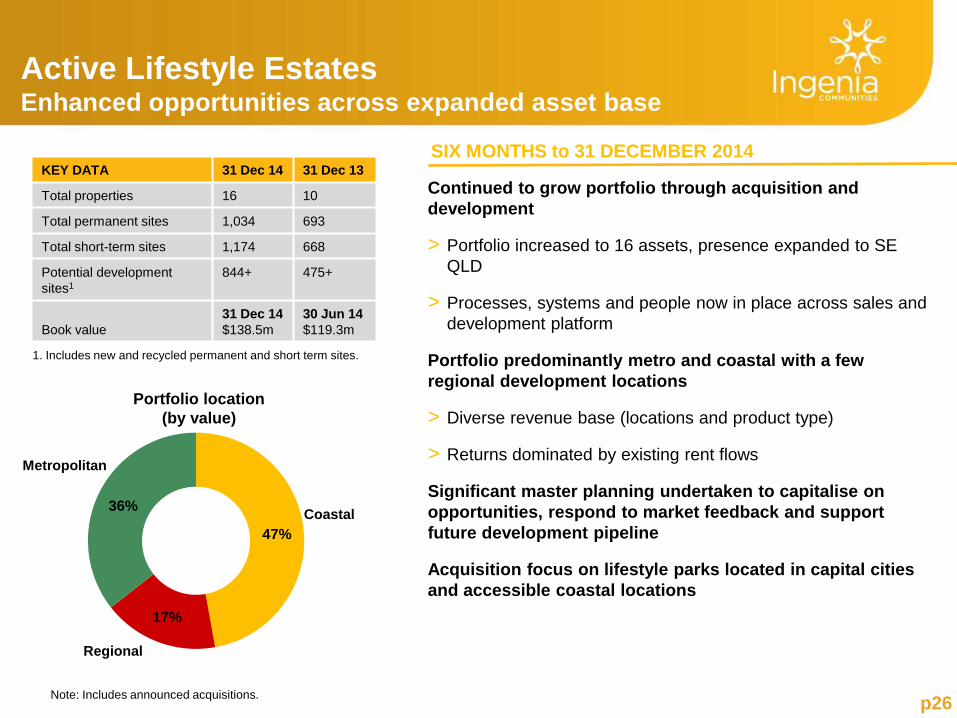
Active Lifestyle Estates Enhanced opportunities across expanded asset base
SIX MONTHS to 31 DECEMBER 2014
Continued to grow portfolio through acquisition and
development
> Portfolio increased to 16 assets, presence expanded to SE
QLD
> Processes, systems and people now in place across sales and
development platform
Portfolio predominantly metro and coastal with a few
regional development locations
> Diverse revenue base (locations and product type)
> Returns dominated by existing rent flows
Significant master planning undertaken to capitalise on
opportunities, respond to market feedback and support
future development pipeline
Acquisition focus on lifestyle parks located in capital cities
and accessible coastal locations
KEY DATA 31 Dec 14 31 Dec 13
Total properties 16 10
Total permanent sites 1,034 693
Total short-term sites 1,174 668
Potential development
sites1
844+ 475+
Book value
31 Dec 14
$138.5m
30 Jun 14
$119.3m
1. Includes new and recycled permanent and short term sites.
47%
17%
36%
Portfolio location
(by value)
Note: Includes announced acquisitions.
Coastal
Metropolitan
Regional
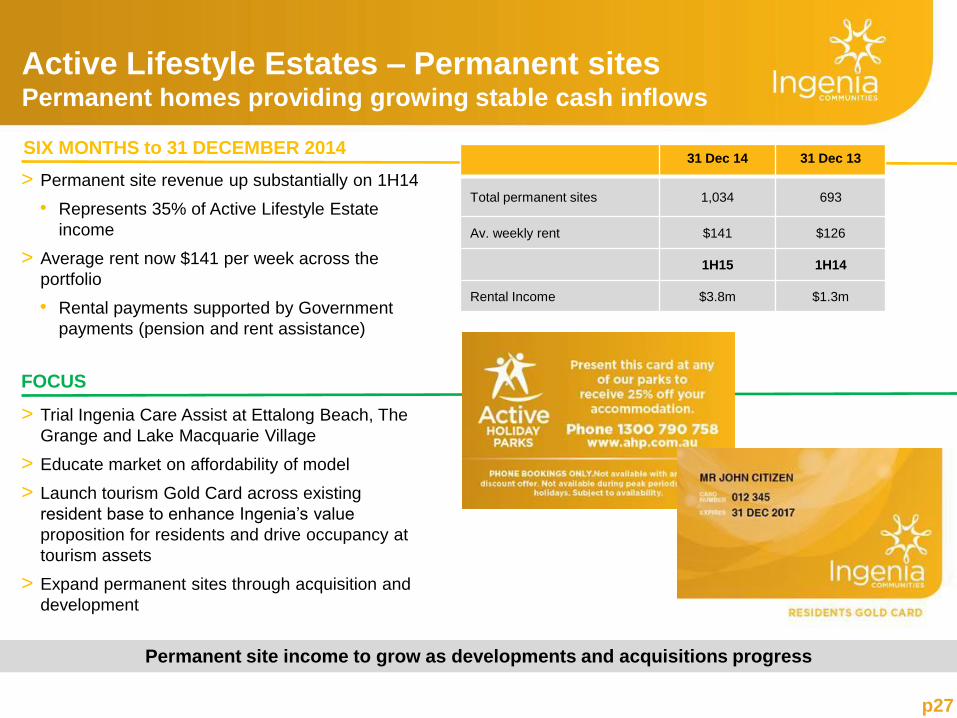
Active Lifestyle Estates – Permanent sites Permanent homes providing growing stable cash inflows
> Permanent site revenue up substantially on 1H14
• Represents 35% of Active Lifestyle Estate
income
> Average rent now $141 per week across the
portfolio
• Rental payments supported by Government
payments (pension and rent assistance)
FOCUS
> Trial Ingenia Care Assist at Ettalong Beach, The
Grange and Lake Macquarie Village
> Educate market on affordability of model
> Launch tourism Gold Card across existing
resident base to enhance Ingenia’s value
proposition for residents and drive occupancy at
tourism assets
> Expand permanent sites through acquisition and
development
p27
SIX MONTHS to 31 DECEMBER 2014 31 Dec 14 31 Dec 13
Total permanent sites 1,034 693
Av. weekly rent $141 $126
1H15 1H14
Rental Income $3.8m $1.3m
Permanent site income to grow as developments and acquisitions progress
p27
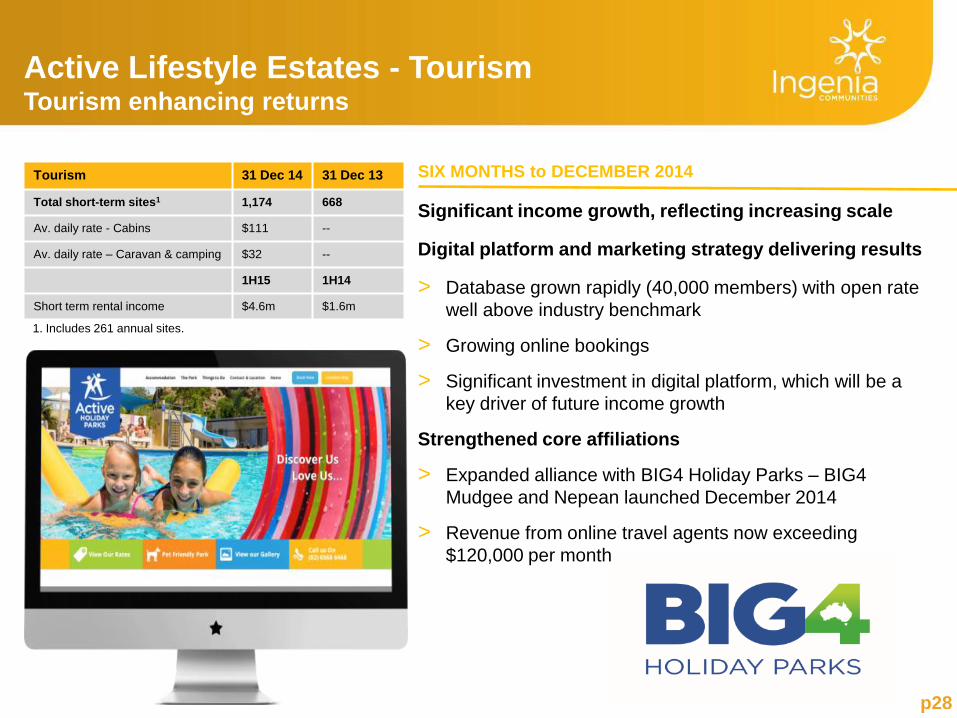
Active Lifestyle Estates - Tourism Tourism enhancing returns
Significant income growth, reflecting increasing scale
Digital platform and marketing strategy delivering results
> Database grown rapidly (40,000 members) with open rate
well above industry benchmark
> Growing online bookings
> Significant investment in digital platform, which will be a
key driver of future income growth
Strengthened core affiliations
> Expanded alliance with BIG4 Holiday Parks – BIG4
Mudgee and Nepean launched December 2014
> Revenue from online travel agents now exceeding
$120,000 per month
p28
SIX MONTHS to DECEMBER 2014 Tourism 31 Dec 14 31 Dec 13
Total short-term sites1 1,174 668
Av. daily rate - Cabins $111 --
Av. daily rate – Caravan & camping $32 --
1H15 1H14
Short term rental income $4.6m $1.6m
1. Includes 261 annual sites.
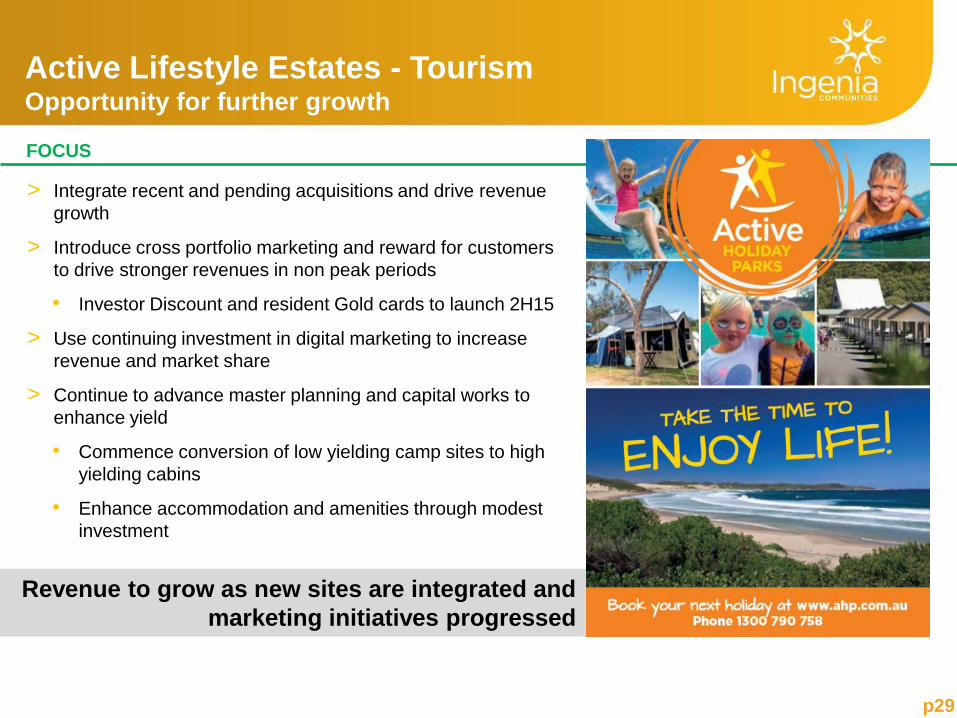
Active Lifestyle Estates - Tourism Opportunity for further growth
p29
> Integrate recent and pending acquisitions and drive revenue
growth
> Introduce cross portfolio marketing and reward for customers
to drive stronger revenues in non peak periods
• Investor Discount and resident Gold cards to launch 2H15
> Use continuing investment in digital marketing to increase
revenue and market share
> Continue to advance master planning and capital works to
enhance yield
• Commence conversion of low yielding camp sites to high
yielding cabins
• Enhance accommodation and amenities through modest
investment
FOCUS
Revenue to grow as new sites are integrated and
marketing initiatives progressed
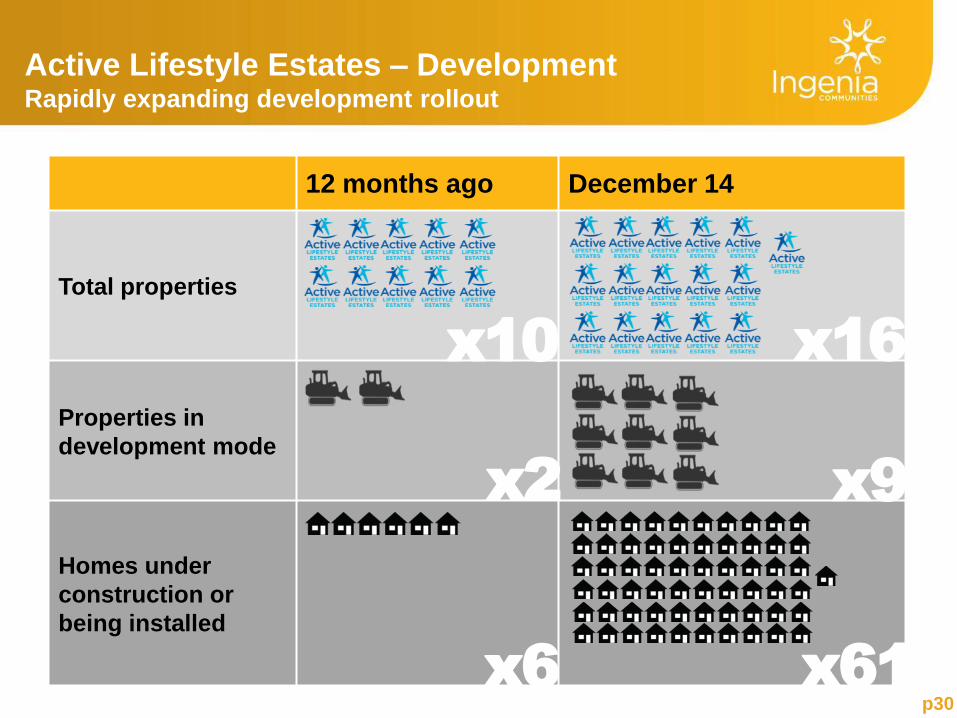
Active Lifestyle Estates – Development Rapidly expanding development rollout
12 months ago December 14
Total properties
Properties in
development mode
Homes under
construction or
being installed
x2
x6
x9
x61 p30
x10 x16
p31
Active Lifestyle Estates – Development Process, people and product in place for growth
Product – over 78 homes delivered, installed or under
construction (of 104 to date)
> Construction timeframes (order to delivery) tracking at ~12
weeks
> Standard home product now established in conjunction with
sales
• Detailed ‘Ingenia’ specifications and design brief in place
• Streamlines planning, building and sales process
• Facilitates efficient master planning and maximises site
yields
Civil works and planning
> Civil works underway or complete at eight sites including
• Roadworks, service connections and community facilities
• Site works for new homes
• Landscaping
> Approvals and consents for over 100 sites (new and
recycled) received in past two months
SIX MONTHS to DECEMBER 2014 Development portfolio 1H15 1H14 Change
Total active development
projects 9 2
Sales projects ‘in market’ 7 2
Homes under construction 61 6
Contracted and reserved 33 4
Gross development profit $0.8m $0.5m
No. settlements 8 5
Average price ($’000) $265 $243
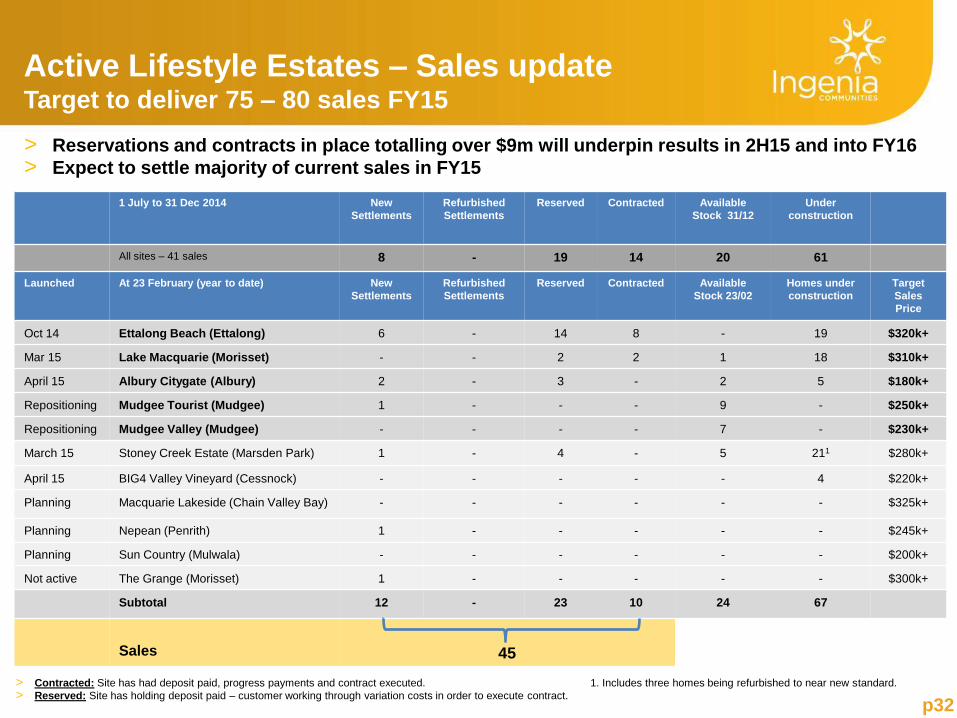
1 July to 31 Dec 2014 New
Settlements
Refurbished
Settlements
Reserved Contracted Available
Stock 31/12
Under
construction
All sites – 41 sales 8 - 19 14 20 61
Launched At 23 February (year to date) New
Settlements
Refurbished
Settlements
Reserved Contracted Available
Stock 23/02
Homes under
construction
Target
Sales
Price
Oct 14 Ettalong Beach (Ettalong) 6 - 14 8 - 19 $320k+
Mar 15 Lake Macquarie (Morisset) - - 2 2 1 18 $310k+
April 15 Albury Citygate (Albury) 2 - 3 - 2 5 $180k+
Repositioning Mudgee Tourist (Mudgee) 1 - - - 9 - $250k+
Repositioning Mudgee Valley (Mudgee) - - - - 7 - $230k+
March 15 Stoney Creek Estate (Marsden Park) 1 - 4 - 5 211 $280k+
April 15 BIG4 Valley Vineyard (Cessnock) - - - - - 4 $220k+
Planning Macquarie Lakeside (Chain Valley Bay) - - - - - - $325k+
Planning Nepean (Penrith) 1 - - - - - $245k+
Planning Sun Country (Mulwala) - - - - - - $200k+
Not active The Grange (Morisset) 1 - - - - - $300k+
Subtotal 12 - 23 10 24 67
Sales
45
p32
Active Lifestyle Estates – Sales update Target to deliver 75 – 80 sales FY15
> Reservations and contracts in place totalling over $9m will underpin results in 2H15 and into FY16
> Expect to settle majority of current sales in FY15
> Contracted: Site has had deposit paid, progress payments and contract executed. 1. Includes three homes being refurbished to near new standard.
> Reserved: Site has holding deposit paid – customer working through variation costs in order to execute contract.
p33
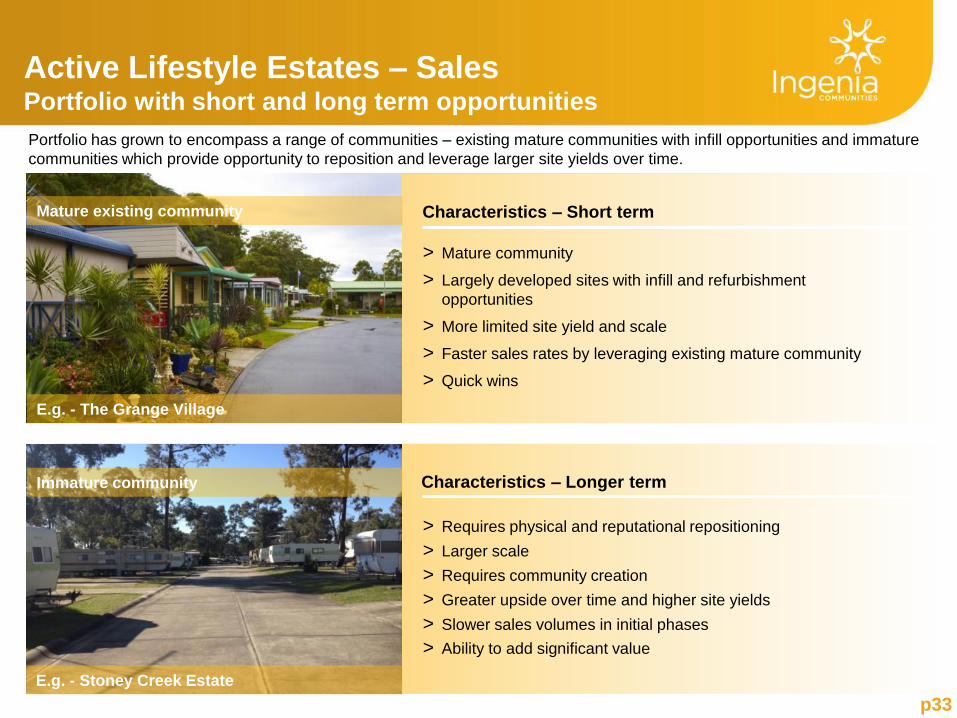
Active Lifestyle Estates – Sales Portfolio with short and long term opportunities
Portfolio has grown to encompass a range of communities – existing mature communities with infill opportunities and immature
communities which provide opportunity to reposition and leverage larger site yields over time.
Immature community
Characteristics – Short term
> Mature community
> Largely developed sites with infill and refurbishment
opportunities
> More limited site yield and scale
> Faster sales rates by leveraging existing mature community
> Quick wins
Characteristics – Longer term
> Requires physical and reputational repositioning
> Larger scale
> Requires community creation
> Greater upside over time and higher site yields
> Slower sales volumes in initial phases
> Ability to add significant value
E.g. - The Grange Village
E.g. - Stoney Creek Estate
Mature existing community
Immature community
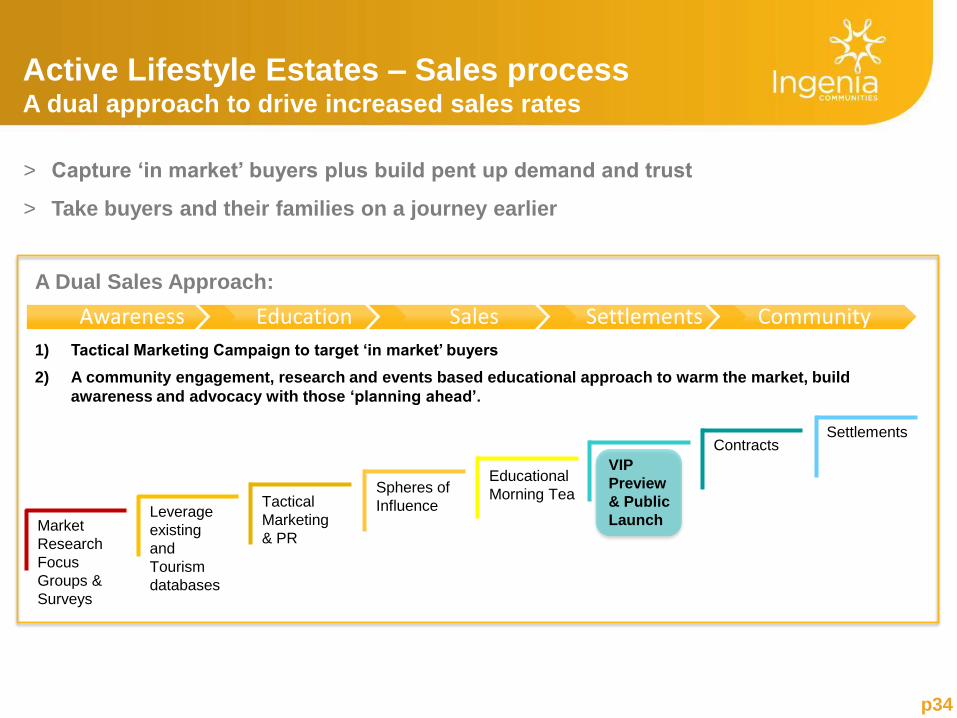
Active Lifestyle Estates – Sales process A dual approach to drive increased sales rates
> Capture ‘in market’ buyers plus build pent up demand and trust
> Take buyers and their families on a journey earlier
p34
A Dual Sales Approach:
1) Tactical Marketing Campaign to target ‘in market’ buyers
2) A community engagement, research and events based educational approach to warm the market, build
awareness and advocacy with those ‘planning ahead’.
Awareness Education Sales Settlements Community
Market
Research
Focus
Groups &
Surveys
Educational
Morning Tea Spheres of
Influence Tactical
Marketing
& PR
Leverage
existing
and
Tourism
databases
Contracts
Settlements
VIP
Preview
& Public
Launch
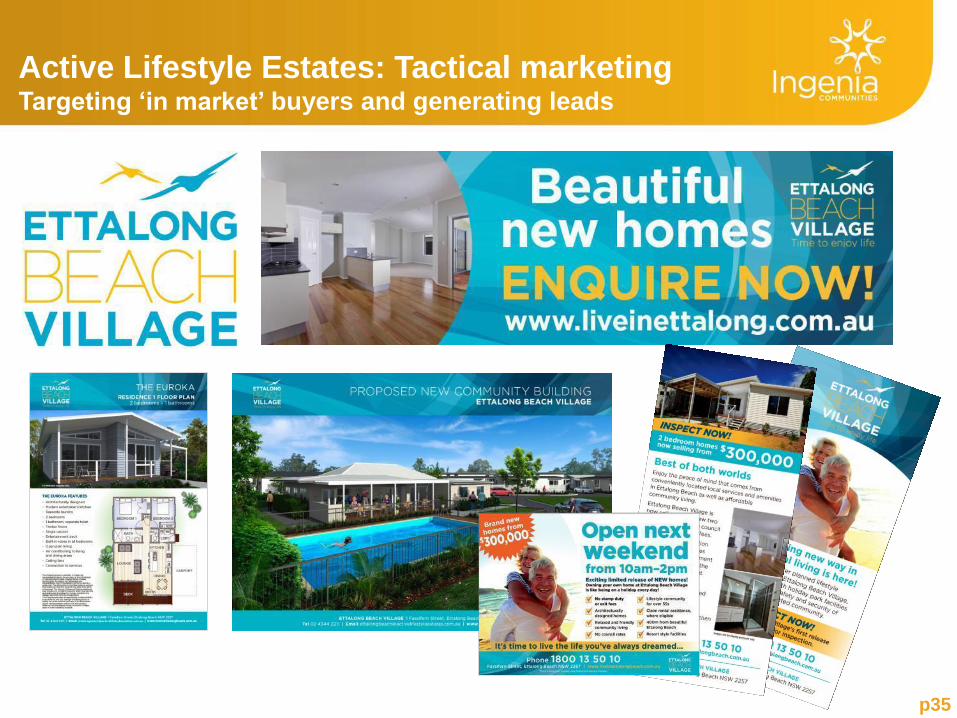
Active Lifestyle Estates: Tactical marketing Targeting ‘in market’ buyers and generating leads
p35
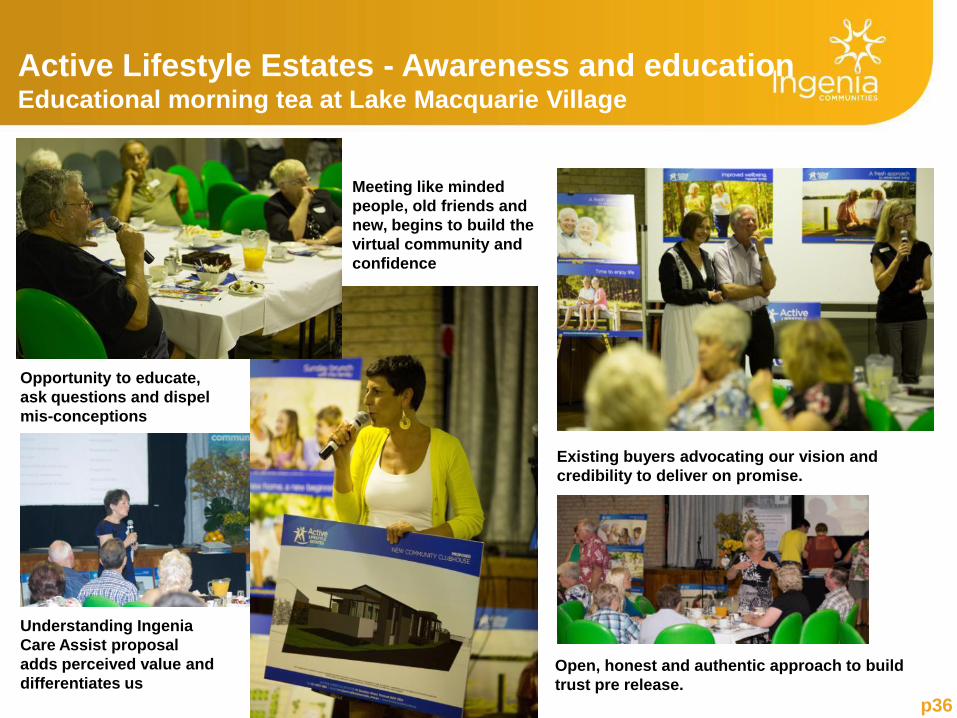
Active Lifestyle Estates - Awareness and education Educational morning tea at Lake Macquarie Village
p36
Opportunity to educate,
ask questions and dispel
mis-conceptions
Existing buyers advocating our vision and
credibility to deliver on promise.
Open, honest and authentic approach to build
trust pre release.
Understanding Ingenia
Care Assist proposal
adds perceived value and
differentiates us
Meeting like minded
people, old friends and
new, begins to build the
virtual community and
confidence
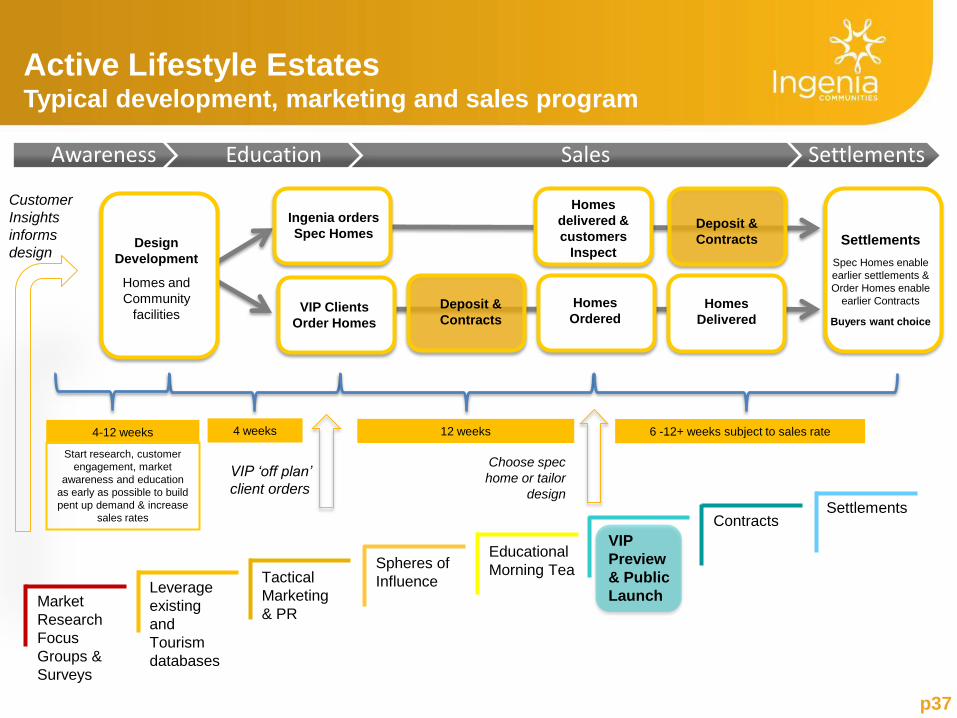
Active Lifestyle Estates Typical development, marketing and sales program
p37
Design
Development
Homes and
Community
facilities Deposit &
Contracts
Settlements
Spec Homes enable
earlier settlements &
Order Homes enable
earlier Contracts
Buyers want choice
VIP Clients
Order Homes
Homes
Ordered
4 weeks 12 weeks 6 -12+ weeks subject to sales rate
Customer
Insights
informs
design
VIP ‘off plan’
client orders
Choose spec
home or tailor
design
Homes
delivered &
customers
Inspect
Ingenia orders
Spec Homes
4-12 weeks
Deposit &
Contracts
Homes
Delivered
Start research, customer
engagement, market
awareness and education
as early as possible to build
pent up demand & increase
sales rates
Awareness Education Sales Settlements
Market
Research
Focus
Groups &
Surveys
Educational
Morning Tea Spheres of
Influence Tactical
Marketing
& PR
Leverage
existing
and
Tourism
databases
Contracts
Settlements
VIP
Preview
& Public
Launch
p38
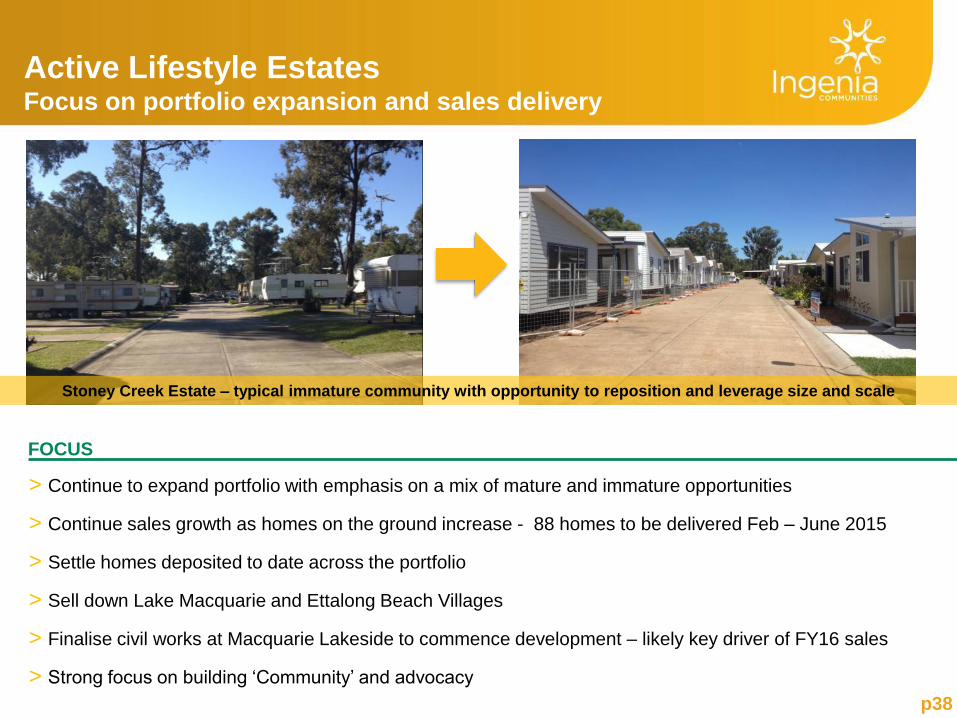
Active Lifestyle Estates Focus on portfolio expansion and sales delivery
FOCUS
> Continue to expand portfolio with emphasis on a mix of mature and immature opportunities
> Continue sales growth as homes on the ground increase - 88 homes to be delivered Feb – June 2015
> Settle homes deposited to date across the portfolio
> Sell down Lake Macquarie and Ettalong Beach Villages
> Finalise civil works at Macquarie Lakeside to commence development – likely key driver of FY16 sales
> Strong focus on building ‘Community’ and advocacy
Stoney Creek Estate – typical immature community with opportunity to reposition and leverage size and scale
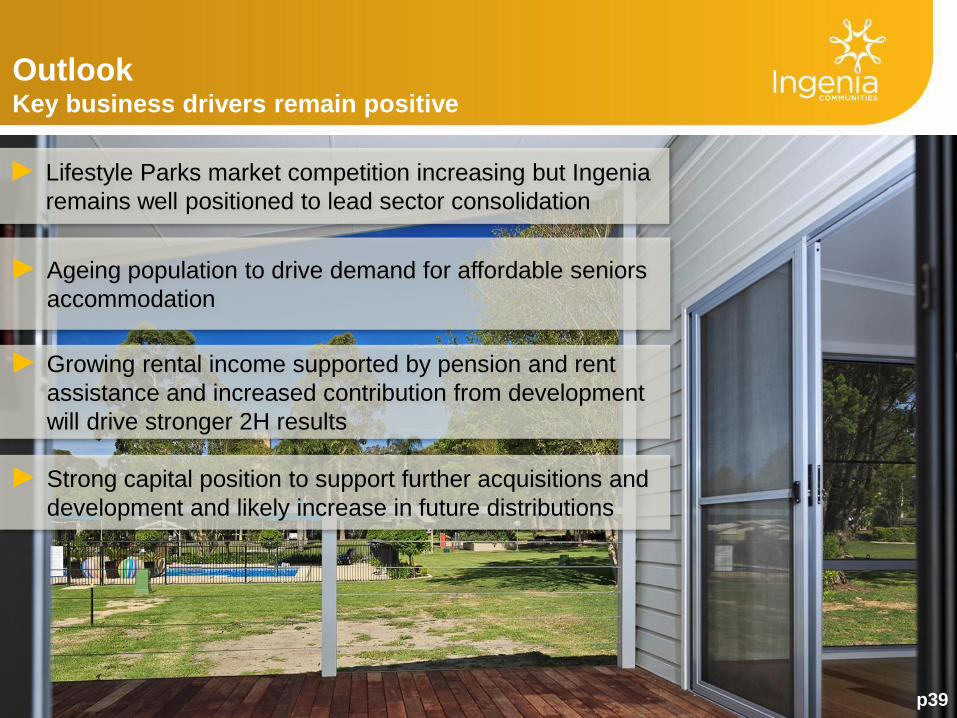
Outlook Key business drivers remain positive
p39 p39
► Lifestyle Parks market competition increasing but Ingenia
remains well positioned to lead sector consolidation
► Growing rental income supported by pension and rent
assistance and increased contribution from development
will drive stronger 2H results
► Strong capital position to support further acquisitions and
development and likely increase in future distributions
► Ageing population to drive demand for affordable seniors
accommodation
p40
Appendices
Ingenia homes under construction at Glendale Homes, Qld
p41
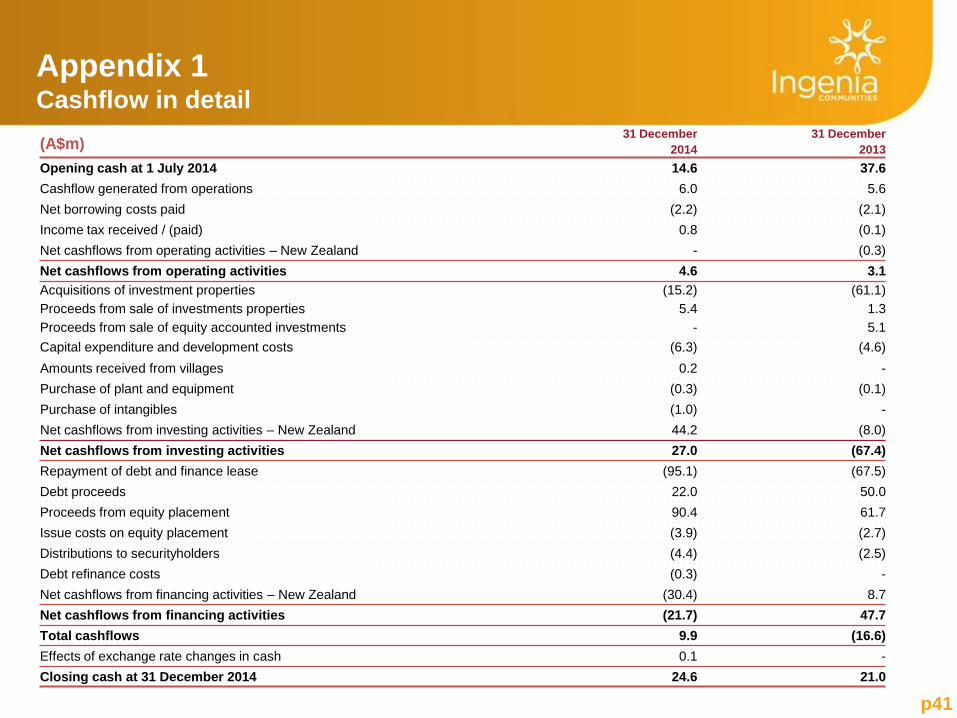
(A$m) 31 December
2014
31 December
2013
Opening cash at 1 July 2014 14.6 37.6
Cashflow generated from operations 6.0 5.6
Net borrowing costs paid (2.2) (2.1)
Income tax received / (paid) 0.8 (0.1)
Net cashflows from operating activities – New Zealand - (0.3)
Net cashflows from operating activities 4.6 3.1
Acquisitions of investment properties (15.2) (61.1)
Proceeds from sale of investments properties 5.4 1.3
Proceeds from sale of equity accounted investments - 5.1
Capital expenditure and development costs (6.3) (4.6)
Amounts received from villages 0.2 -
Purchase of plant and equipment (0.3) (0.1)
Purchase of intangibles (1.0) -
Net cashflows from investing activities – New Zealand 44.2 (8.0)
Net cashflows from investing activities 27.0 (67.4)
Repayment of debt and finance lease (95.1) (67.5)
Debt proceeds 22.0 50.0
Proceeds from equity placement 90.4 61.7
Issue costs on equity placement (3.9) (2.7)
Distributions to securityholders (4.4) (2.5)
Debt refinance costs (0.3) -
Net cashflows from financing activities – New Zealand (30.4) 8.7
Net cashflows from financing activities (21.7) 47.7
Total cashflows 9.9 (16.6)
Effects of exchange rate changes in cash 0.1 -
Closing cash at 31 December 2014 24.6 21.0
Appendix 1 Cashflow in detail
p42
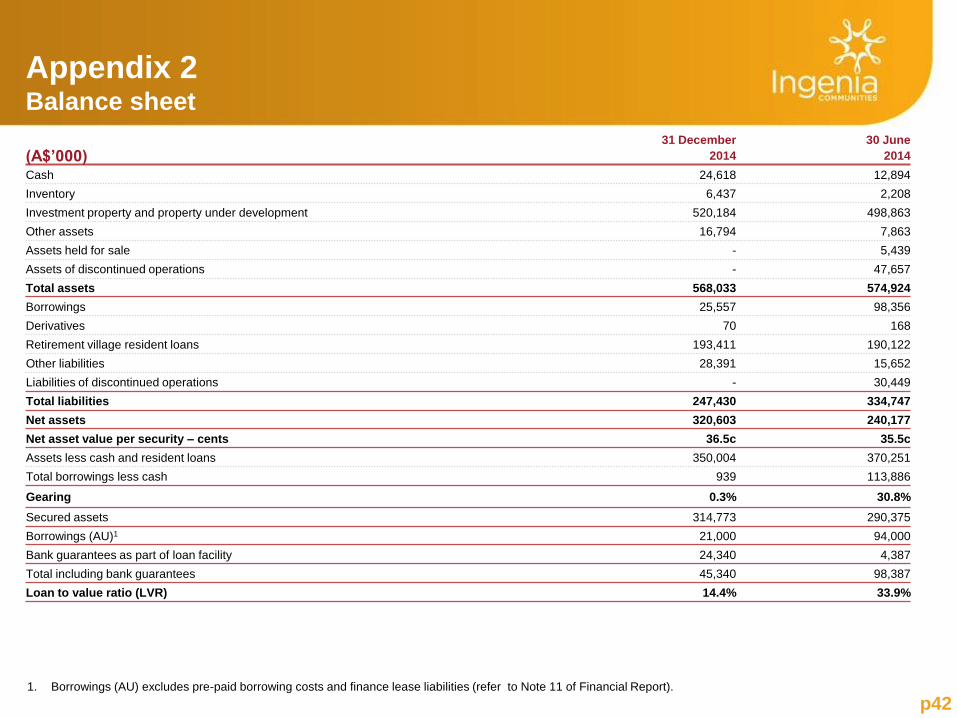
(A$’000) 31 December
2014
30 June
2014
Cash 24,618 12,894
Inventory 6,437 2,208
Investment property and property under development 520,184 498,863
Other assets 16,794 7,863
Assets held for sale - 5,439
Assets of discontinued operations - 47,657
Total assets 568,033 574,924
Borrowings 25,557 98,356
Derivatives 70 168
Retirement village resident loans 193,411 190,122
Other liabilities 28,391 15,652
Liabilities of discontinued operations - 30,449
Total liabilities 247,430 334,747
Net assets 320,603 240,177
Net asset value per security – cents 36.5c 35.5c
Assets less cash and resident loans 350,004 370,251
Total borrowings less cash 939 113,886
Gearing 0.3% 30.8%
Secured assets 314,773 290,375
Borrowings (AU)1 21,000 94,000
Bank guarantees as part of loan facility 24,340 4,387
Total including bank guarantees 45,340 98,387
Loan to value ratio (LVR) 14.4% 33.9%
1. Borrowings (AU) excludes pre-paid borrowing costs and finance lease liabilities (refer to Note 11 of Financial Report).
Appendix 2 Balance sheet
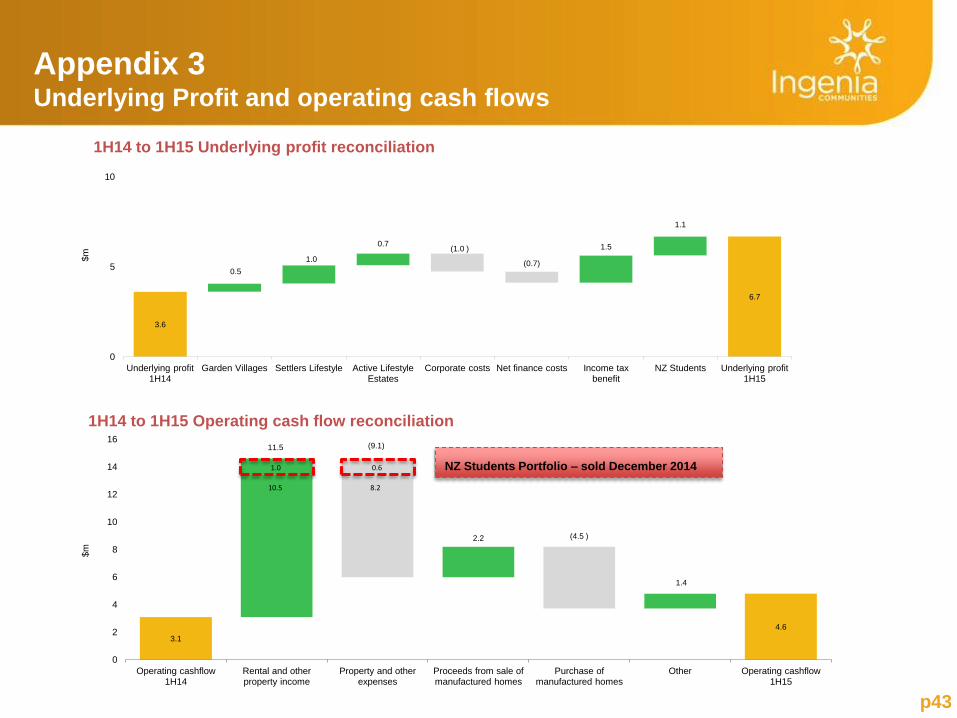
Appendix 3 Underlying Profit and operating cash flows
p43
3.1
4.6
11.5 (9.1)
2.2 (4.5 )
1.4
0
2
4
6
8
10
12
14
16
Operating cashflow 1H14
Rental and other property income
Property and other expenses
Proceeds from sale of manufactured homes
Purchase of manufactured homes
Other Operating cashflow 1H15
$m
1H14 to 1H15 Operating cash flow reconciliation
1.0
10.5
0.6
8.2
NZ Students Portfolio – sold December 2014
3.6
6.7
0.5
1.0
0.7 (1.0 )
(0.7)
1.5
1.1
0
5
10
Underlying profit 1H14
Garden Villages Settlers Lifestyle Active Lifestyle Estates
Corporate costs Net finance costs Income tax benefit
NZ Students Underlying profit 1H15
$m
1H14 to 1H15 Underlying profit reconciliation
p44
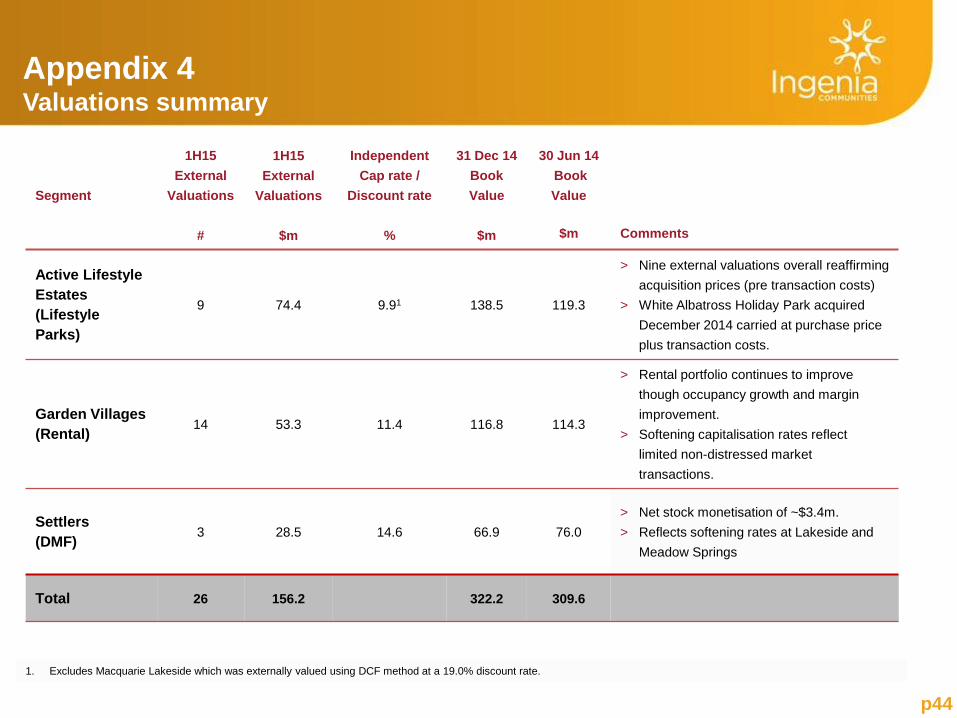
Appendix 4 Valuations summary
Segment
1H15
External
Valuations
#
1H15
External
Valuations
$m
Independent
Cap rate /
Discount rate
%
31 Dec 14
Book
Value
$m
30 Jun 14
Book
Value
$m
Comments
Active Lifestyle
Estates
(Lifestyle
Parks)
9 74.4 9.91 138.5 119.3
> Nine external valuations overall reaffirming
acquisition prices (pre transaction costs)
> White Albatross Holiday Park acquired
December 2014 carried at purchase price
plus transaction costs.
Garden Villages
(Rental) 14 53.3 11.4 116.8 114.3
> Rental portfolio continues to improve
though occupancy growth and margin
improvement.
> Softening capitalisation rates reflect
limited non-distressed market
transactions.
Settlers
(DMF) 3 28.5 14.6 66.9 76.0
> Net stock monetisation of ~$3.4m.
> Reflects softening rates at Lakeside and
Meadow Springs
Total 26 156.2 322.2 309.6
1. Excludes Macquarie Lakeside which was externally valued using DCF method at a 19.0% discount rate.
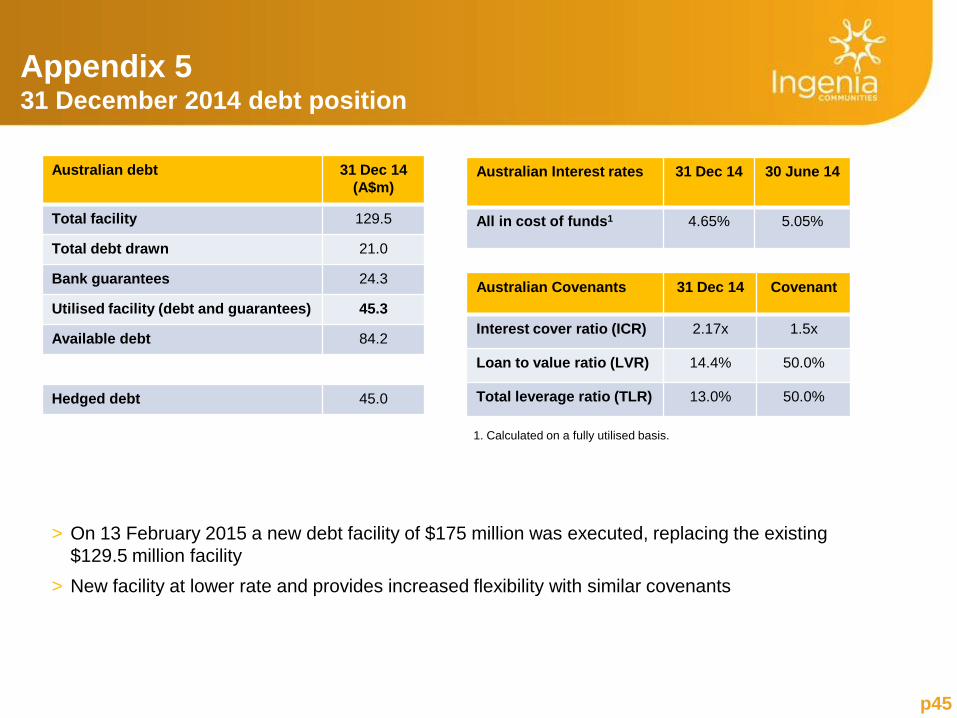
Appendix 5 31 December 2014 debt position
Australian debt 31 Dec 14
(A$m)
Total facility 129.5
Total debt drawn 21.0
Bank guarantees 24.3
Utilised facility (debt and guarantees) 45.3
Available debt 84.2
Hedged debt 45.0
Australian Interest rates 31 Dec 14 30 June 14
All in cost of funds1 4.65% 5.05%
Australian Covenants 31 Dec 14 Covenant
Interest cover ratio (ICR) 2.17x 1.5x
Loan to value ratio (LVR) 14.4% 50.0%
Total leverage ratio (TLR) 13.0% 50.0%
> On 13 February 2015 a new debt facility of $175 million was executed, replacing the existing
$129.5 million facility
> New facility at lower rate and provides increased flexibility with similar covenants
p45
1. Calculated on a fully utilised basis.
p46
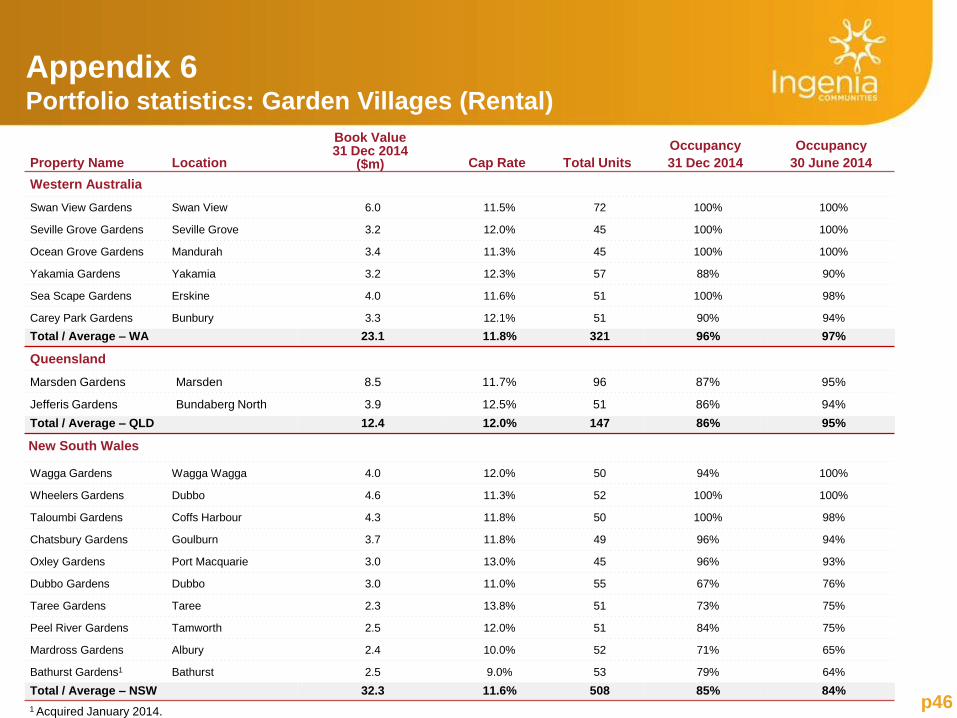
Property Name Location
Book Value 31 Dec 2014
($m) Cap Rate Total Units
Occupancy
31 Dec 2014
Occupancy
30 June 2014
Western Australia
Swan View Gardens Swan View 6.0 11.5% 72 100% 100%
Seville Grove Gardens Seville Grove 3.2 12.0% 45 100% 100%
Ocean Grove Gardens Mandurah 3.4 11.3% 45 100% 100%
Yakamia Gardens Yakamia 3.2 12.3% 57 88% 90%
Sea Scape Gardens Erskine 4.0 11.6% 51 100% 98%
Carey Park Gardens Bunbury 3.3 12.1% 51 90% 94%
Total / Average – WA 23.1 11.8% 321 96% 97%
Queensland
Marsden Gardens Marsden 8.5 11.7% 96 87% 95%
Jefferis Gardens Bundaberg North 3.9 12.5% 51 86% 94%
Total / Average – QLD 12.4 12.0% 147 86% 95%
New South Wales
Wagga Gardens Wagga Wagga 4.0 12.0% 50 94% 100%
Wheelers Gardens Dubbo 4.6 11.3% 52 100% 100%
Taloumbi Gardens Coffs Harbour 4.3 11.8% 50 100% 98%
Chatsbury Gardens Goulburn 3.7 11.8% 49 96% 94%
Oxley Gardens Port Macquarie 3.0 13.0% 45 96% 93%
Dubbo Gardens Dubbo 3.0 11.0% 55 67% 76%
Taree Gardens Taree 2.3 13.8% 51 73% 75%
Peel River Gardens Tamworth 2.5 12.0% 51 84% 75%
Mardross Gardens Albury 2.4 10.0% 52 71% 65%
Bathurst Gardens1 Bathurst 2.5 9.0% 53 79% 64%
Total / Average – NSW 32.3 11.6% 508 85% 84%
Appendix 6 Portfolio statistics: Garden Villages (Rental)
1 Acquired January 2014.
p47
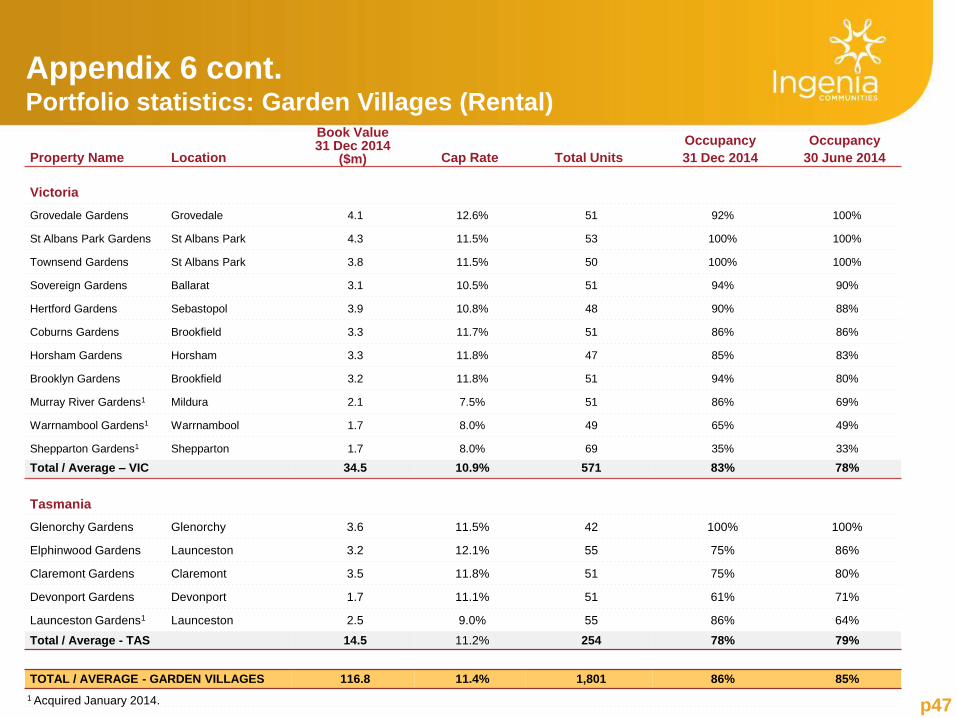
Appendix 6 cont. Portfolio statistics: Garden Villages (Rental)
Property Name Location
Book Value 31 Dec 2014
($m) Cap Rate Total Units
Occupancy
31 Dec 2014
Occupancy
30 June 2014
Victoria
Grovedale Gardens Grovedale 4.1 12.6% 51 92% 100%
St Albans Park Gardens St Albans Park 4.3 11.5% 53 100% 100%
Townsend Gardens St Albans Park 3.8 11.5% 50 100% 100%
Sovereign Gardens Ballarat 3.1 10.5% 51 94% 90%
Hertford Gardens Sebastopol 3.9 10.8% 48 90% 88%
Coburns Gardens Brookfield 3.3 11.7% 51 86% 86%
Horsham Gardens Horsham 3.3 11.8% 47 85% 83%
Brooklyn Gardens Brookfield 3.2 11.8% 51 94% 80%
Murray River Gardens1 Mildura 2.1 7.5% 51 86% 69%
Warrnambool Gardens1 Warrnambool 1.7 8.0% 49 65% 49%
Shepparton Gardens1 Shepparton 1.7 8.0% 69 35% 33%
Total / Average – VIC 34.5 10.9% 571 83% 78%
Tasmania
Glenorchy Gardens Glenorchy 3.6 11.5% 42 100% 100%
Elphinwood Gardens Launceston 3.2 12.1% 55 75% 86%
Claremont Gardens Claremont 3.5 11.8% 51 75% 80%
Devonport Gardens Devonport 1.7 11.1% 51 61% 71%
Launceston Gardens1 Launceston 2.5 9.0% 55 86% 64%
Total / Average - TAS 14.5 11.2% 254 78% 79%
TOTAL / AVERAGE - GARDEN VILLAGES 116.8 11.4% 1,801 86% 85%
1 Acquired January 2014.
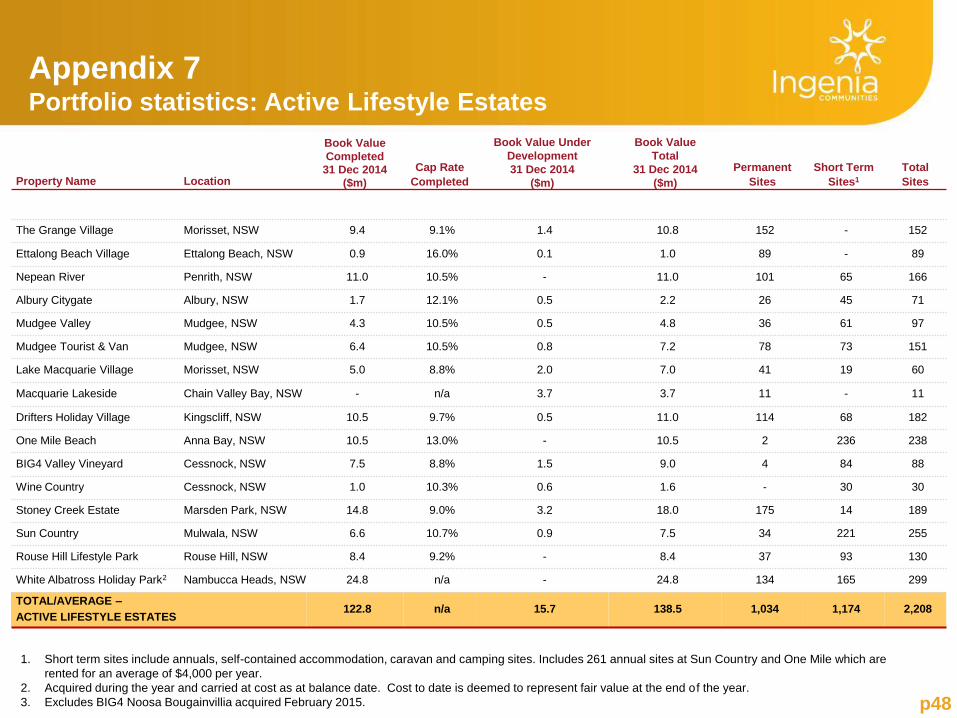
Appendix 7 Portfolio statistics: Active Lifestyle Estates
p48
Property Name Location
Book Value
Completed 31 Dec 2014
($m)
Cap Rate
Completed
Book Value Under
Development
31 Dec 2014
($m)
Book Value
Total
31 Dec 2014
($m)
Permanent
Sites
Short Term
Sites1
Total
Sites
The Grange Village Morisset, NSW 9.4 9.1% 1.4 10.8 152 - 152
Ettalong Beach Village Ettalong Beach, NSW 0.9 16.0% 0.1 1.0 89 - 89
Nepean River Penrith, NSW 11.0 10.5% - 11.0 101 65 166
Albury Citygate Albury, NSW 1.7 12.1% 0.5 2.2 26 45 71
Mudgee Valley Mudgee, NSW 4.3 10.5% 0.5 4.8 36 61 97
Mudgee Tourist & Van Mudgee, NSW 6.4 10.5% 0.8 7.2 78 73 151
Lake Macquarie Village Morisset, NSW 5.0 8.8% 2.0 7.0 41 19 60
Macquarie Lakeside Chain Valley Bay, NSW - n/a 3.7 3.7 11 - 11
Drifters Holiday Village Kingscliff, NSW 10.5 9.7% 0.5 11.0 114 68 182
One Mile Beach Anna Bay, NSW 10.5 13.0% - 10.5 2 236 238
BIG4 Valley Vineyard Cessnock, NSW 7.5 8.8% 1.5 9.0 4 84 88
Wine Country Cessnock, NSW 1.0 10.3% 0.6 1.6 - 30 30
Stoney Creek Estate Marsden Park, NSW 14.8 9.0% 3.2 18.0 175 14 189
Sun Country Mulwala, NSW 6.6 10.7% 0.9 7.5 34 221 255
Rouse Hill Lifestyle Park Rouse Hill, NSW 8.4 9.2% - 8.4 37 93 130
White Albatross Holiday Park2 Nambucca Heads, NSW 24.8 n/a - 24.8 134 165 299
TOTAL/AVERAGE –
ACTIVE LIFESTYLE ESTATES 122.8 n/a 15.7 138.5 1,034 1,174 2,208
1. Short term sites include annuals, self-contained accommodation, caravan and camping sites. Includes 261 annual sites at Sun Country and One Mile which are
rented for an average of $4,000 per year.
2. Acquired during the year and carried at cost as at balance date. Cost to date is deemed to represent fair value at the end of the year.
3. Excludes BIG4 Noosa Bougainvillia acquired February 2015.
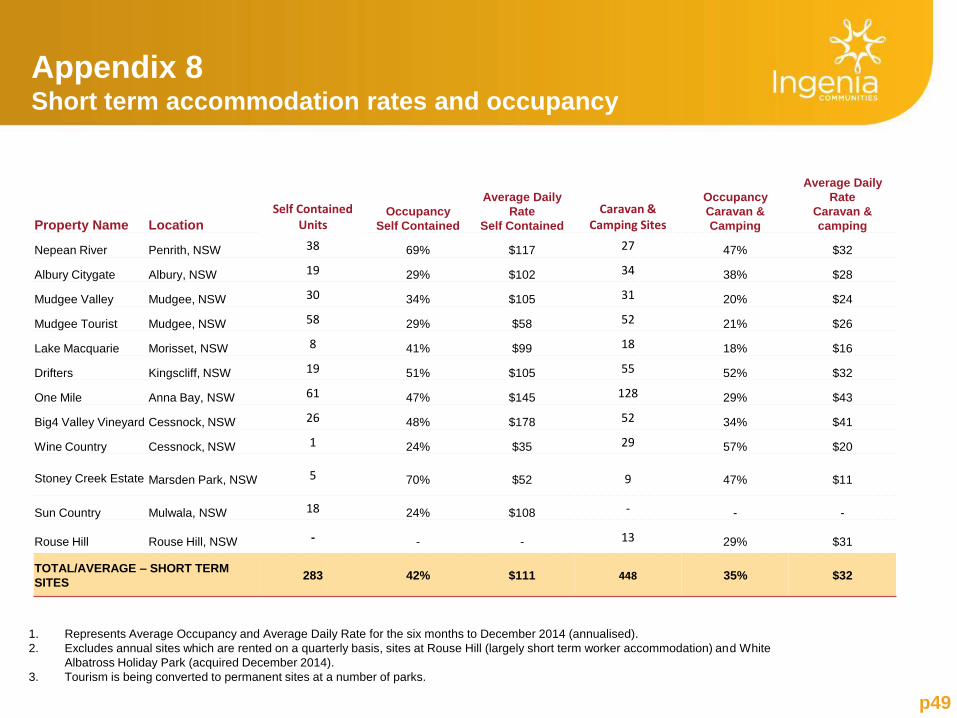
Appendix 8 Short term accommodation rates and occupancy
p49
Property Name Location Occupancy
Self Contained
Caravan & Camping Sites
Occupancy
Caravan &
Camping
Average Daily
Rate
Caravan &
camping
Self Contained Units
Average Daily
Rate
Self Contained
Nepean River Penrith, NSW 38 69% $117 27 47% $32
Albury Citygate Albury, NSW 19 29% $102 34 38% $28
Mudgee Valley Mudgee, NSW 30 34% $105 31 20% $24
Mudgee Tourist Mudgee, NSW 58 29% $58 52 21% $26
Lake Macquarie Morisset, NSW 8 41% $99 18 18% $16
Drifters Kingscliff, NSW 19 51% $105 55 52% $32
One Mile Anna Bay, NSW 61 47% $145 128 29% $43
Big4 Valley Vineyard Cessnock, NSW 26 48% $178 52 34% $41
Wine Country Cessnock, NSW 1 24% $35 29 57% $20
Stoney Creek Estate Marsden Park, NSW 5 70% $52
9 47% $11
Sun Country Mulwala, NSW 18 24% $108 - - -
Rouse Hill Rouse Hill, NSW - - - 13 29% $31
TOTAL/AVERAGE – SHORT TERM
SITES
283
42% $111 448 35% $32
1. Represents Average Occupancy and Average Daily Rate for the six months to December 2014 (annualised).
2. Excludes annual sites which are rented on a quarterly basis, sites at Rouse Hill (largely short term worker accommodation) and White
Albatross Holiday Park (acquired December 2014).
3. Tourism is being converted to permanent sites at a number of parks.
p50
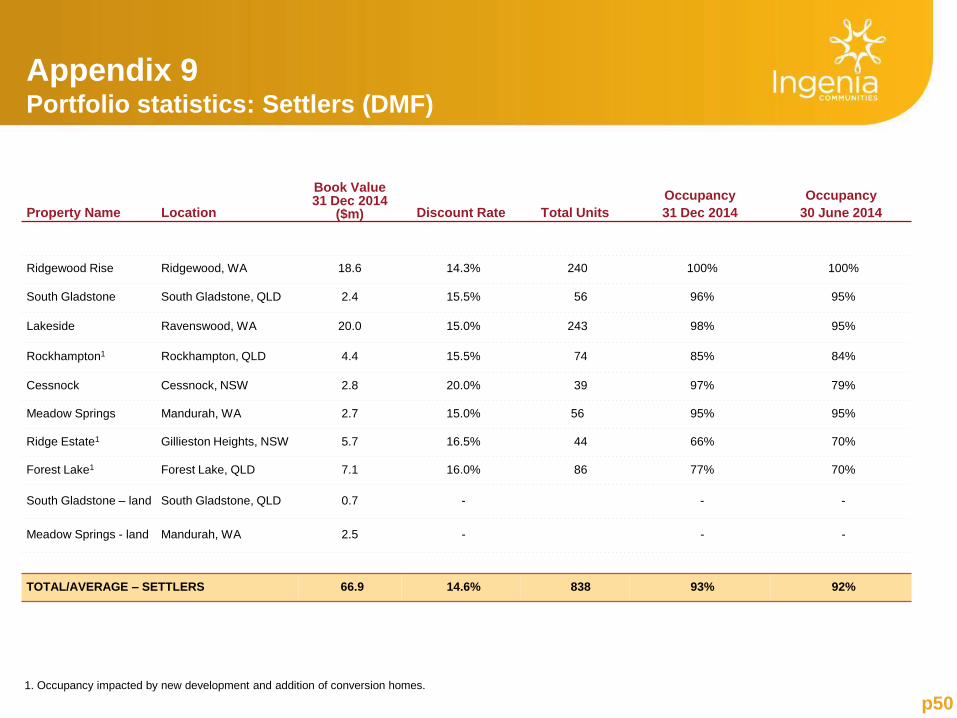
Property Name Location
Book Value 31 Dec 2014
($m) Discount Rate Total Units
Occupancy
31 Dec 2014
Occupancy
30 June 2014
Ridgewood Rise Ridgewood, WA 18.6 14.3% 240 100% 100%
South Gladstone South Gladstone, QLD 2.4 15.5% 56 96% 95%
Lakeside Ravenswood, WA 20.0 15.0% 243 98% 95%
Rockhampton1 Rockhampton, QLD 4.4 15.5% 74 85% 84%
Cessnock Cessnock, NSW 2.8 20.0% 39 97% 79%
Meadow Springs Mandurah, WA 2.7 15.0% 56 95% 95%
Ridge Estate1 Gillieston Heights, NSW 5.7 16.5% 44 66% 70%
Forest Lake1 Forest Lake, QLD 7.1 16.0% 86 77% 70%
South Gladstone – land South Gladstone, QLD 0.7 - - -
Meadow Springs - land Mandurah, WA 2.5 - - -
TOTAL/AVERAGE – SETTLERS 66.9 14.6% 838 93% 92%
Appendix 9 Portfolio statistics: Settlers (DMF)
1. Occupancy impacted by new development and addition of conversion homes.
p51
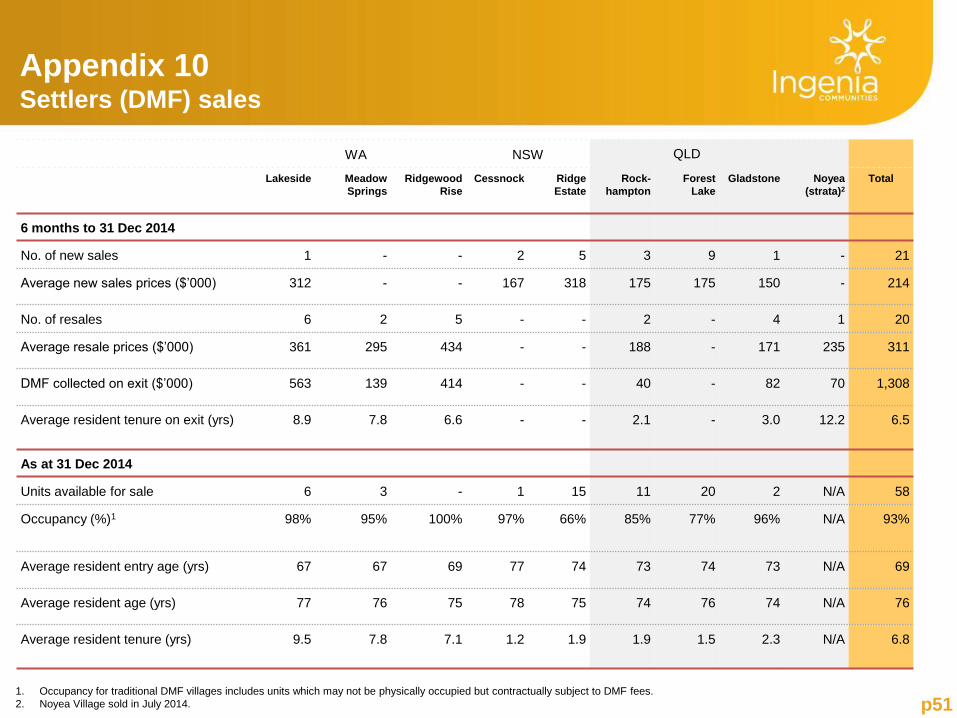
WA NSW QLD
Lakeside Meadow
Springs
Ridgewood
Rise
Cessnock Ridge
Estate
Rock-
hampton
Forest
Lake
Gladstone Noyea
(strata)2
Total
6 months to 31 Dec 2014
No. of new sales 1 - - 2 5 3 9 1 - 21
Average new sales prices ($’000) 312 - - 167 318 175 175 150 - 214
No. of resales 6 2 5 - - 2 - 4 1 20
Average resale prices ($’000) 361 295 434 - - 188 - 171 235 311
DMF collected on exit ($’000) 563 139 414 - - 40 - 82 70 1,308
Average resident tenure on exit (yrs) 8.9 7.8 6.6 - - 2.1 - 3.0 12.2 6.5
As at 31 Dec 2014
Units available for sale 6 3 - 1 15 11 20 2 N/A 58
Occupancy (%)1 98% 95% 100% 97% 66% 85% 77% 96% N/A 93%
Average resident entry age (yrs) 67 67 69 77 74 73 74 73 N/A 69
Average resident age (yrs) 77 76 75 78 75 74 76 74 N/A 76
Average resident tenure (yrs) 9.5 7.8 7.1 1.2 1.9 1.9 1.5 2.3 N/A 6.8
1. Occupancy for traditional DMF villages includes units which may not be physically occupied but contractually subject to DMF fees.
2. Noyea Village sold in July 2014.
Appendix 10 Settlers (DMF) sales
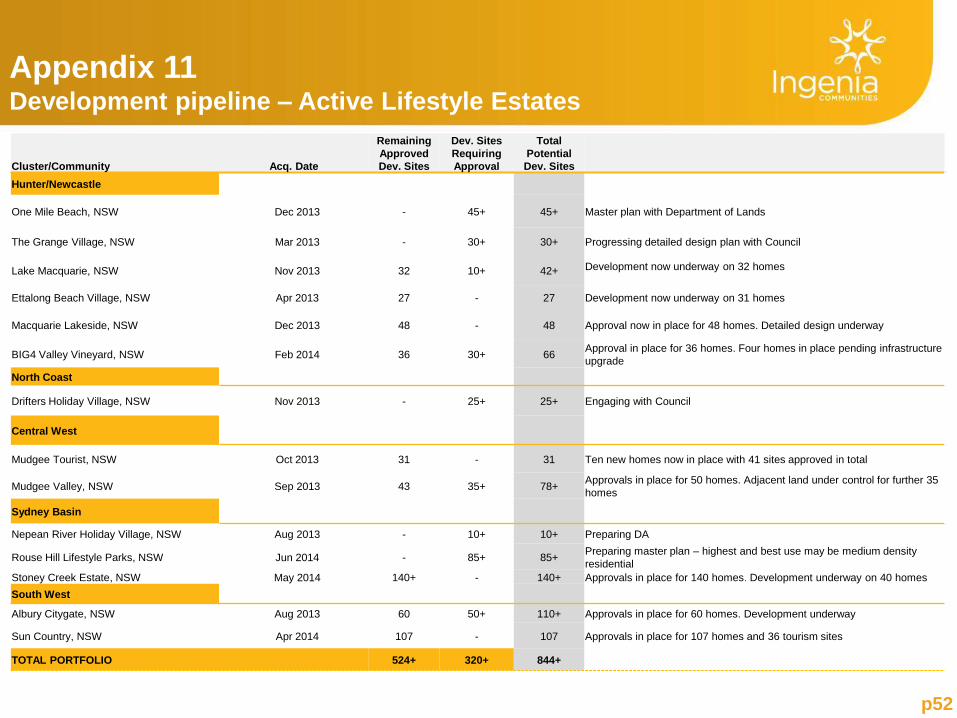
Appendix 11 Development pipeline – Active Lifestyle Estates
Cluster/Community Acq. Date
Remaining
Approved
Dev. Sites
Dev. Sites
Requiring
Approval
Total
Potential
Dev. Sites
Hunter/Newcastle
One Mile Beach, NSW Dec 2013 - 45+ 45+ Master plan with Department of Lands
The Grange Village, NSW Mar 2013 - 30+ 30+ Progressing detailed design plan with Council
Lake Macquarie, NSW Nov 2013 32 10+ 42+ Development now underway on 32 homes
Ettalong Beach Village, NSW Apr 2013 27 - 27 Development now underway on 31 homes
Macquarie Lakeside, NSW Dec 2013 48 - 48 Approval now in place for 48 homes. Detailed design underway
BIG4 Valley Vineyard, NSW Feb 2014 36 30+ 66 Approval in place for 36 homes. Four homes in place pending infrastructure
upgrade
North Coast
Drifters Holiday Village, NSW Nov 2013 - 25+ 25+ Engaging with Council
Central West
Mudgee Tourist, NSW Oct 2013 31 - 31 Ten new homes now in place with 41 sites approved in total
Mudgee Valley, NSW Sep 2013 43 35+ 78+ Approvals in place for 50 homes. Adjacent land under control for further 35
homes
Sydney Basin
Nepean River Holiday Village, NSW Aug 2013 - 10+ 10+ Preparing DA
Rouse Hill Lifestyle Parks, NSW Jun 2014 - 85+ 85+ Preparing master plan – highest and best use may be medium density
residential
Stoney Creek Estate, NSW May 2014 140+ - 140+ Approvals in place for 140 homes. Development underway on 40 homes
South West
Albury Citygate, NSW Aug 2013 60 50+ 110+ Approvals in place for 60 homes. Development underway
Sun Country, NSW Apr 2014 107 - 107 Approvals in place for 107 homes and 36 tourism sites
TOTAL PORTFOLIO 524+ 320+ 844+
p52
p53
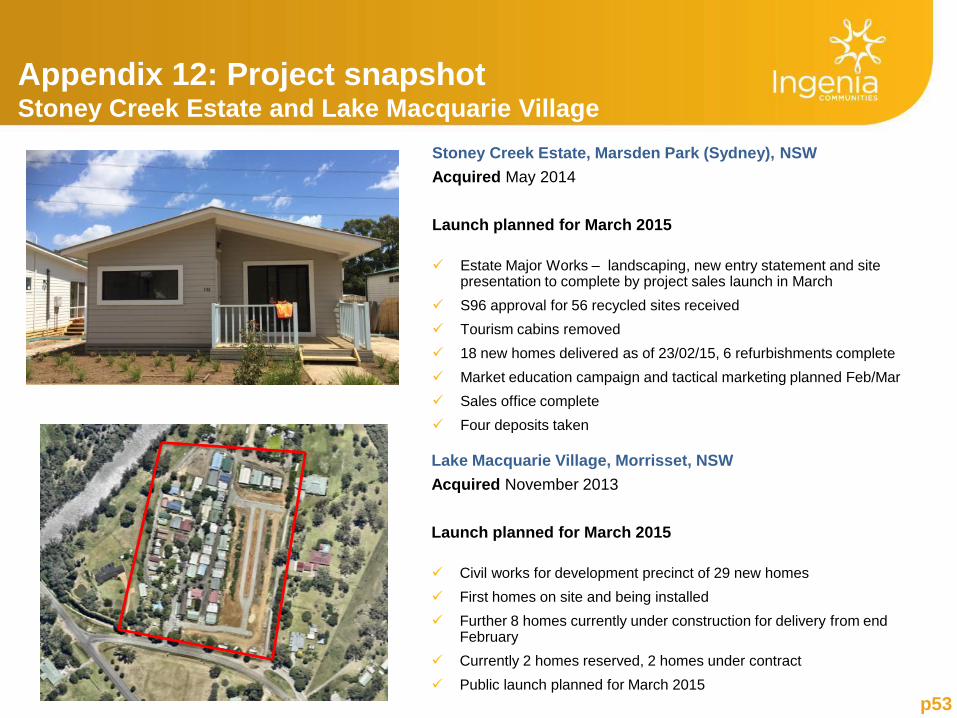
Appendix 12: Project snapshot Stoney Creek Estate and Lake Macquarie Village
Lake Macquarie Village, Morrisset, NSW
Acquired November 2013
Launch planned for March 2015
Civil works for development precinct of 29 new homes
First homes on site and being installed
Further 8 homes currently under construction for delivery from end February
Currently 2 homes reserved, 2 homes under contract
Public launch planned for March 2015
Stoney Creek Estate, Marsden Park (Sydney), NSW
Acquired May 2014
Launch planned for March 2015
Estate Major Works – landscaping, new entry statement and site
presentation to complete by project sales launch in March
S96 approval for 56 recycled sites received
Tourism cabins removed
18 new homes delivered as of 23/02/15, 6 refurbishments complete
Market education campaign and tactical marketing planned Feb/Mar
Sales office complete
Four deposits taken
p54
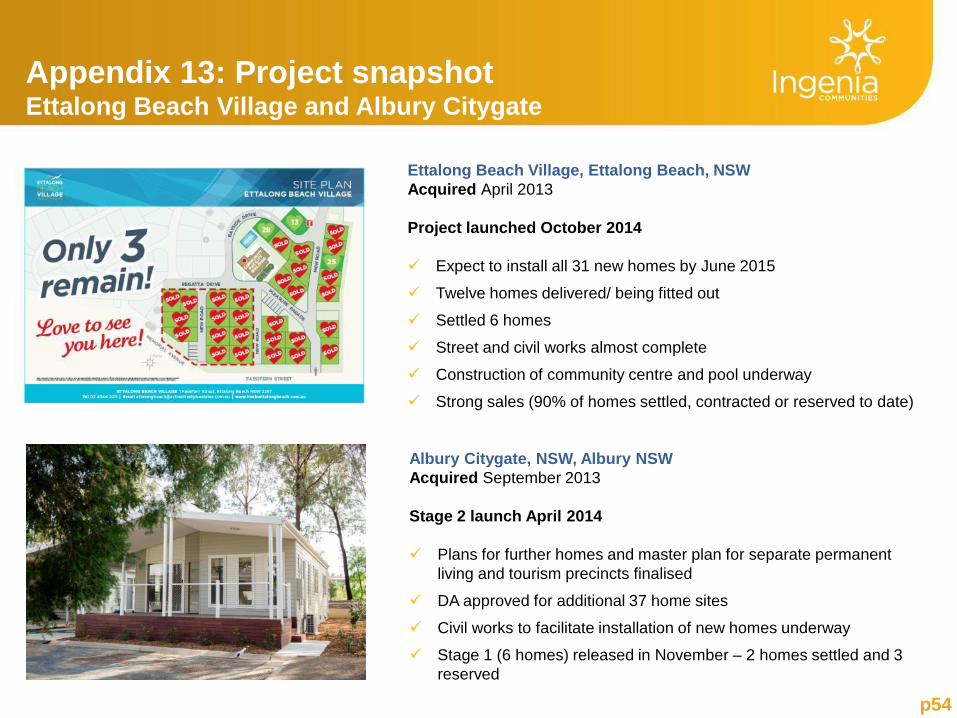
Appendix 13: Project snapshot Ettalong Beach Village and Albury Citygate
Albury Citygate, NSW, Albury NSW
Acquired September 2013
Stage 2 launch April 2014
Plans for further homes and master plan for separate permanent
living and tourism precincts finalised
DA approved for additional 37 home sites
Civil works to facilitate installation of new homes underway
Stage 1 (6 homes) released in November – 2 homes settled and 3
reserved
Ettalong Beach Village, Ettalong Beach, NSW
Acquired April 2013
Project launched October 2014
Expect to install all 31 new homes by June 2015
Twelve homes delivered/ being fitted out
Settled 6 homes
Street and civil works almost complete
Construction of community centre and pool underway
Strong sales (90% of homes settled, contracted or reserved to date)
Insert for Ettalong an image of new homes along streetscape
p55
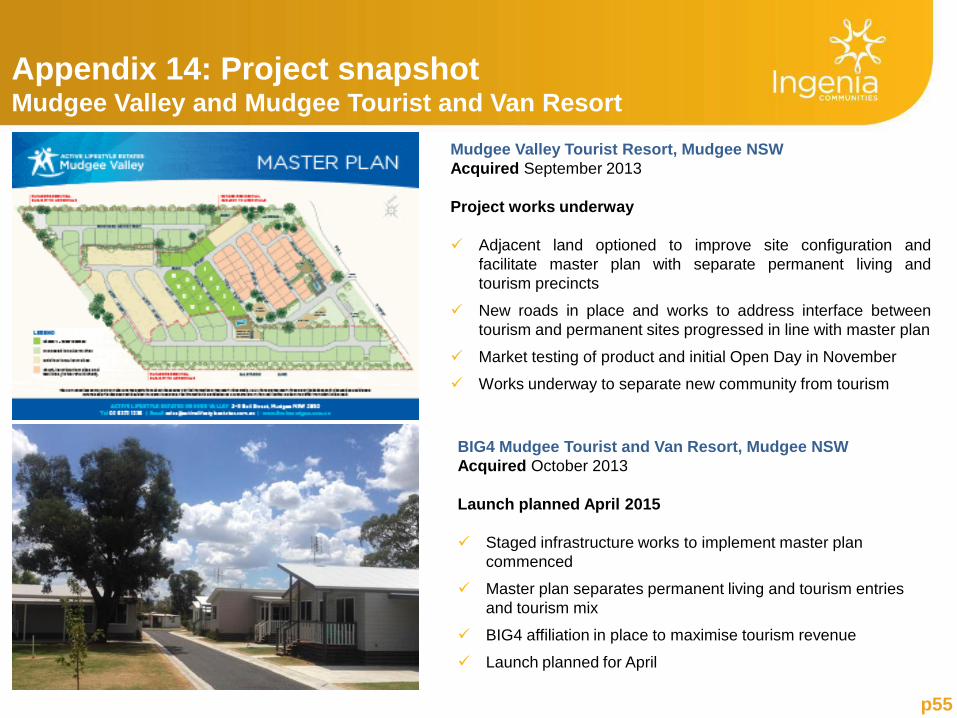
Appendix 14: Project snapshot Mudgee Valley and Mudgee Tourist and Van Resort
Mudgee Valley Tourist Resort, Mudgee NSW
Acquired September 2013
Project works underway
Adjacent land optioned to improve site configuration and
facilitate master plan with separate permanent living and
tourism precincts
New roads in place and works to address interface between
tourism and permanent sites progressed in line with master plan
Market testing of product and initial Open Day in November
Works underway to separate new community from tourism
BIG4 Mudgee Tourist and Van Resort, Mudgee NSW
Acquired October 2013
Launch planned April 2015
Staged infrastructure works to implement master plan
commenced
Master plan separates permanent living and tourism entries
and tourism mix
BIG4 affiliation in place to maximise tourism revenue
Launch planned for April
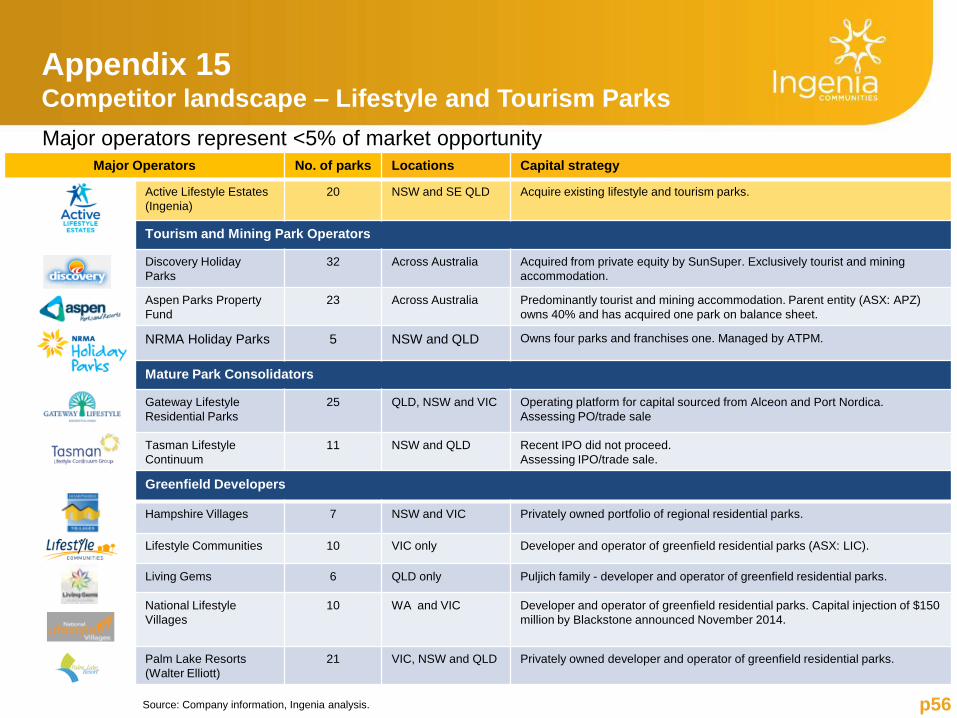
Major Operators No. of parks Locations Capital strategy
Active Lifestyle Estates
(Ingenia)
20 NSW and SE QLD Acquire existing lifestyle and tourism parks.
Tourism and Mining Park Operators
Discovery Holiday
Parks
32 Across Australia Acquired from private equity by SunSuper. Exclusively tourist and mining
accommodation.
Aspen Parks Property
Fund
23 Across Australia Predominantly tourist and mining accommodation. Parent entity (ASX: APZ)
owns 40% and has acquired one park on balance sheet.
NRMA Holiday Parks 5 NSW and QLD Owns four parks and franchises one. Managed by ATPM.
Mature Park Consolidators
Gateway Lifestyle
Residential Parks
25 QLD, NSW and VIC Operating platform for capital sourced from Alceon and Port Nordica.
Assessing PO/trade sale
Tasman Lifestyle
Continuum
11 NSW and QLD Recent IPO did not proceed.
Assessing IPO/trade sale.
Source: Company information, Ingenia analysis.
Major operators represent <5% of market opportunity
Appendix 15 Competitor landscape – Lifestyle and Tourism Parks
p56
Greenfield Developers
Hampshire Villages 7 NSW and VIC Privately owned portfolio of regional residential parks.
Lifestyle Communities 10 VIC only Developer and operator of greenfield residential parks (ASX: LIC).
Living Gems 6 QLD only Puljich family - developer and operator of greenfield residential parks.
National Lifestyle
Villages
10
WA and VIC Developer and operator of greenfield residential parks. Capital injection of $150
million by Blackstone announced November 2014.
Palm Lake Resorts
(Walter Elliott)
21 VIC, NSW and QLD Privately owned developer and operator of greenfield residential parks.
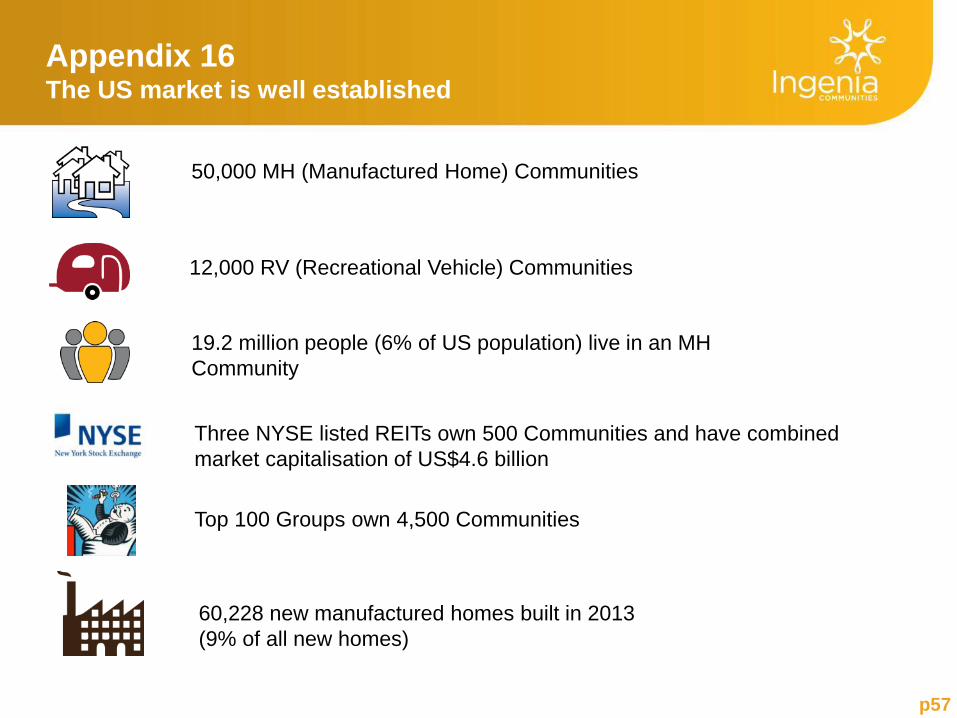
Appendix 16 The US market is well established
p57
50,000 MH (Manufactured Home) Communities
19.2 million people (6% of US population) live in an MH
Community
12,000 RV (Recreational Vehicle) Communities
Top 100 Groups own 4,500 Communities
Three NYSE listed REITs own 500 Communities and have combined
market capitalisation of US$4.6 billion
60,228 new manufactured homes built in 2013
(9% of all new homes)
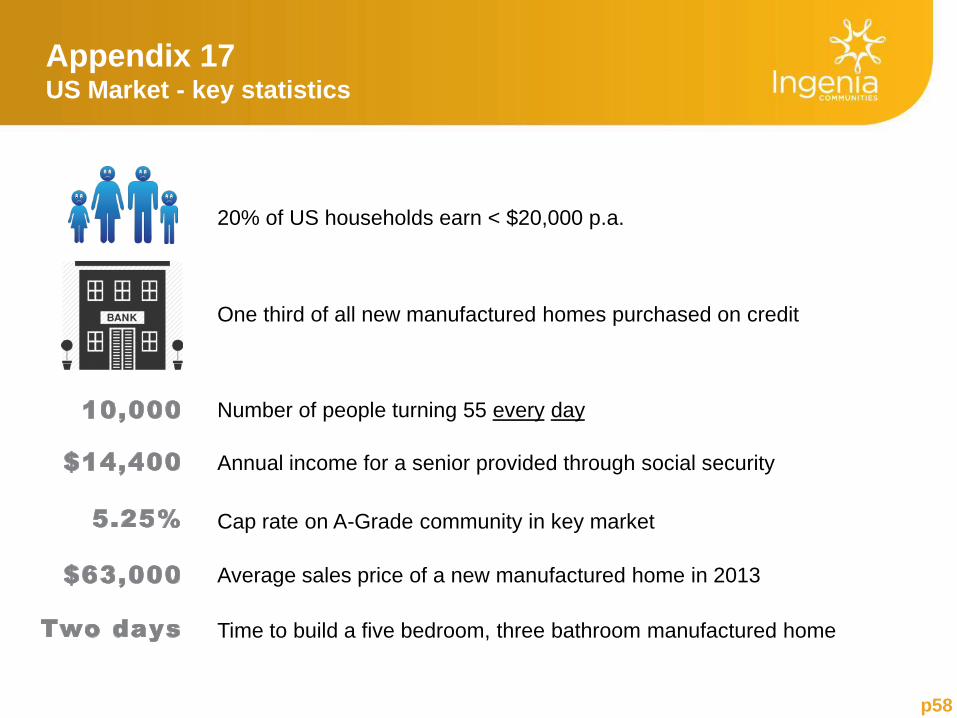
Appendix 17 US Market - key statistics
p58
Cap rate on A-Grade community in key market
Number of people turning 55 every day
Average sales price of a new manufactured home in 2013
Time to build a five bedroom, three bathroom manufactured home
Annual income for a senior provided through social security
20% of US households earn < $20,000 p.a.
One third of all new manufactured homes purchased on credit
p59
Contact Information
Simon Owen Donna Byrne
CEO & Managing Director Investor Relations
Tel: +61 2 8263 0501 Tel: +61 2 8263 0507
Mob: +61 412 389 339 Mob: +61 401 711 542
Email: [email protected] Email: [email protected]
Disclaimer
p60
This presentation was prepared by Ingenia Communities Holdings Limited (ACN 154 444 925) and Ingenia Communities RE Limited (ACN 154 464 990) as
responsible entity for Ingenia Communities Fund (ARSN 107 459 576) and Ingenia Communities Management Trust (ARSN 122 928 410) (together Ingenia
Communities Group , INA or the Group). Information contained in this presentation is current as at 24 February 2015 unless otherwise stated. This presentation
is provided for information purposes only and has been prepared without taking account of any particular reader's financial situation, objectives or needs.
Nothing contained in this presentation constitutes investment, legal, tax or other advice. Accordingly, readers should, before acting on any information in this
presentation, consider its appropriateness, having regard to their objectives, financial situation and needs, and seek the assistance of their financial or other
licensed professional adviser before making any investment decision. This presentation does not constitute an offer, invitation, solicitation or recommendation
with respect to the subscription for, purchase or sale of any security, nor does it form the basis of any contract or commitment.
Except as required by law, no representation or warranty, express or implied, is made as to the fairness, accuracy or completeness of the information, opinions
and conclusions, or as to the reasonableness of any assumption, contained in this presentation. By reading this presentation and to the extent permitted by law,
the reader releases each entity in the Group and its affiliates, and any of their respective directors, officers, employees, representatives or advisers from any
liability (including, without limitation, in respect of direct, indirect or consequential loss or damage or loss or damage arising by negligence) arising in relation to
any reader relying on anything contained in or omitted from this presentation.
The forward looking statements included in this presentation involve subjective judgment and analysis and are subject to significant uncertainties, risks and
contingencies, many of which are outside the control of, and are unknown to, the Group. In particular, they speak only as of the date of these materials, they
assume the success of the Group’s business strategies, and they are subject to significant regulatory, business, competitive and economic uncertainties and risks.
Actual future events may vary materially from forward looking statements and the assumptions on which those statements are based. Given these uncertainties,
readers are cautioned not to place undue reliance on such forward looking statements.
The Group, or persons associated with it, may have an interest in the securities mentioned in this presentation, and may earn fees as a result of transactions
described in this presentation or transactions in securities in INA.
This document is not an offer to sell or a solicitation of an offer to subscribe or purchase or a recommendation of any securities.