Embed Size (px)
Citation preview
Press conference
Paris – 25 February 2016
AXA
2015 FULL YEAR EARNINGS

Certain statements contained herein are forward-looking statements including, but not limited to, statements that are predictions of or indicate future events, trends, plans or objectives. Undue reliance should not be placed on such statements because, by their nature, they are subject to known and unknown risks and uncertainties. Please refer to the section “Cautionary statements” in page 2 of AXA’s Document de Référence for the year ended December 31, 2014, for a description of certain important factors, risks and uncertainties that may affect AXA’s business. AXA undertakes no obligation to publicly update or revise any of these forward-looking statements, whether to reflect new information, future events or circumstances or otherwise.
3 | AXA |Full Year 2015 Earnings | February 25, 2016 All notes are on page 37 of this document
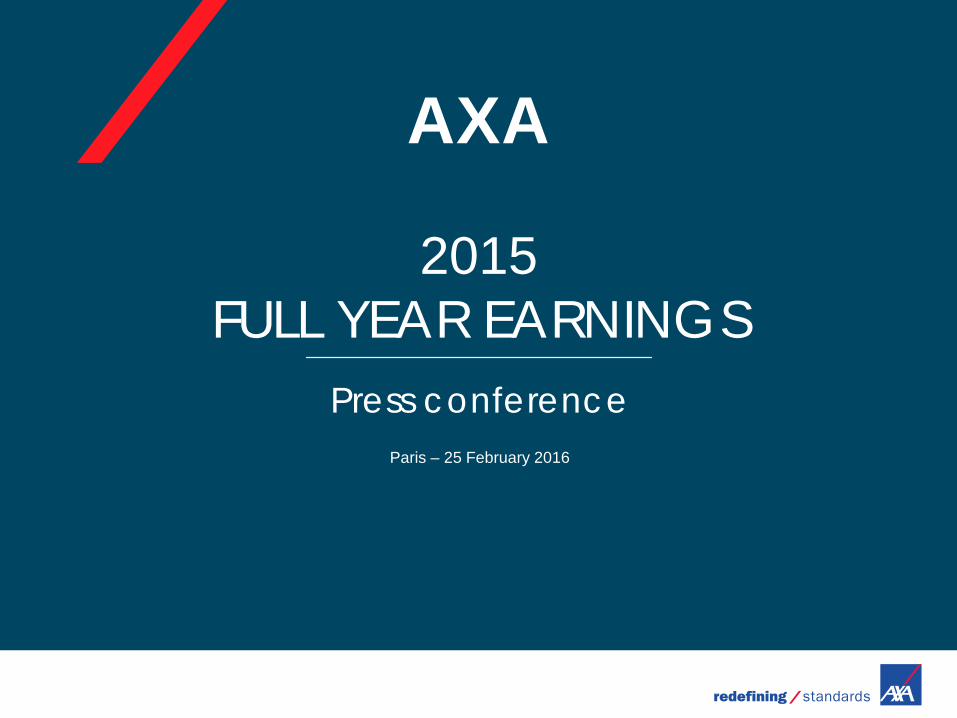
AXA at a glance in 2015
103 MILLION clients2
99 EURO BN
revenues1
1,363 EURO BN
assets under management2
5.6 EURO BN
underlying earnings1
68.5 EURO BN
shareholders’ equity2
59 countries2
1ST insurance brand
worldwide3
22% France
Business lines
Regions
Insurance Underlying Earnings4
6% United Kingdom & Ireland
5% Mediterranean & Latin America Region
9% Asia excl. Japan
7% Japan 31%
Northern, Central & Eastern Europe
3% Intern. Insurance
2% Direct
14% United States
Underlying Earnings5
36% Savings & Asset Management6
25% Protection & Health
39% Property & Casualty
and International Insurance
4 | AXA |Full Year 2015 Earnings | February 25, 2016
Agenda
1. INTRODUCTION 2. LIFE, SAVINGS & HEALTH 3. PROPERTY & CASUALTY 4. ASSET MANAGEMENT
5. EARNINGS SUMMARY & FINANCIAL STRENGTH
6. CONCLUDING REMARKS

1 Introduction
Henri de Castries Chairman & Chief Executive Officer
6 | AXA |Full Year 2015 Earnings | February 25, 2016
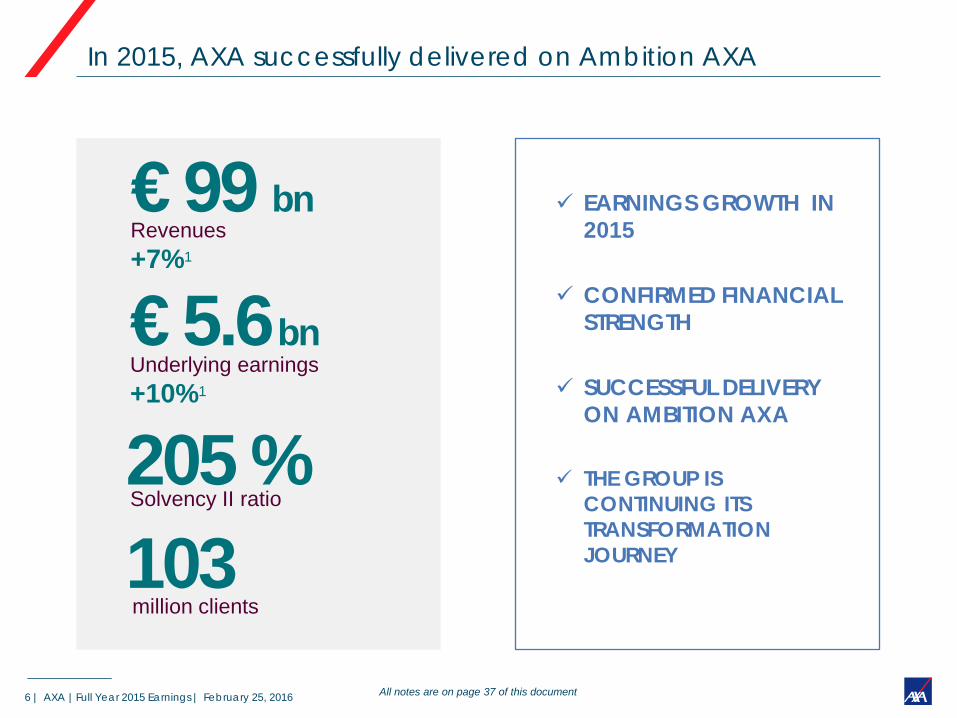
Revenues +7%1
€ 99 bn
€ 5.6 bn Underlying earnings +10%1
205 % Solvency II ratio
EARNINGS GROWTH IN 2015
CONFIRMED FINANCIAL
STRENGTH SUCCESSFUL DELIVERY
ON AMBITION AXA
THE GROUP IS CONTINUING ITS TRANSFORMATION JOURNEY
In 2015, AXA successfully delivered on Ambition AXA
All notes are on page 37 of this document
103 million clients
7 | AXA |Full Year 2015 Earnings | February 25, 2016
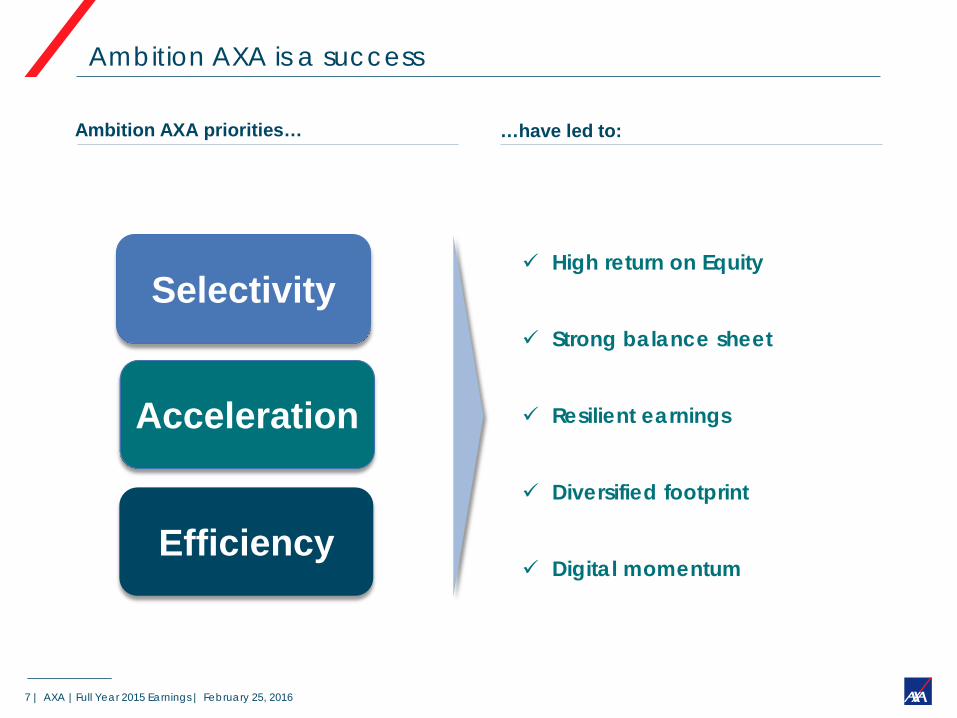
High return on Equity
Strong balance sheet
Resilient earnings
Diversified footprint
Digital momentum
Ambition AXA priorities…
Selectivity
Acceleration
Efficiency
…have led to:
Ambition AXA is a success
8 | AXA |Full Year 2015 Earnings | February 25, 2016
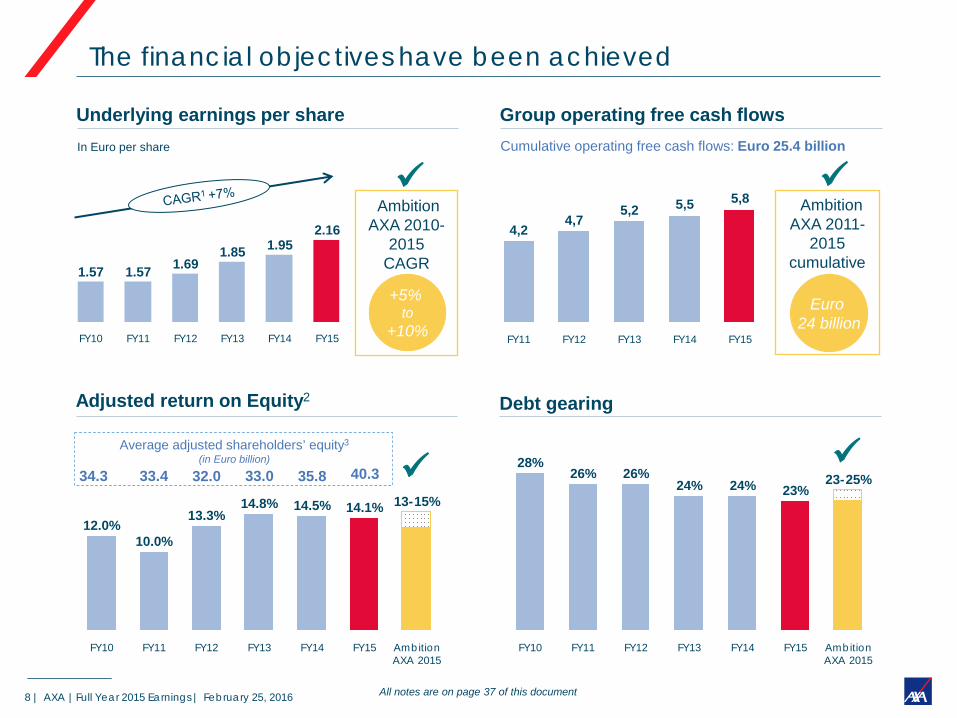
Underlying earnings per share
Adjusted return on Equity2
Group operating free cash flows
Debt gearing
The financial objectives have been achieved
Ambition AXA 2010-
2015 CAGR
+5% to
+10% FY13
1.85
FY12
1.69
FY11
1.57
FY10
1.57
FY15
2.16
FY14
1.95
FY15 Ambition AXA 2015
13-15% 14.1%
FY14
14.5%
FY13
14.8%
FY12
13.3%
FY11
10.0%
FY10
12.0%
Average adjusted shareholders’ equity3
(in Euro billion)
34.3 33.4 32.0 33.0 35.8 40.3
Ambition AXA 2015
23-25%
FY15
23%
FY14
24%
FY13
24%
FY12
26%
FY11
26%
FY10
28%
Ambition AXA 2011-
2015 cumulative
Euro 24 billion
Cumulative operating free cash flows: Euro 25.4 billion
FY14
5,8
FY15
5,5
FY13
5,2
FY12
4,7
FY11
4,2
In Euro per share
All notes are on page 37 of this document
9 | AXA |Full Year 2015 Earnings | February 25, 2016
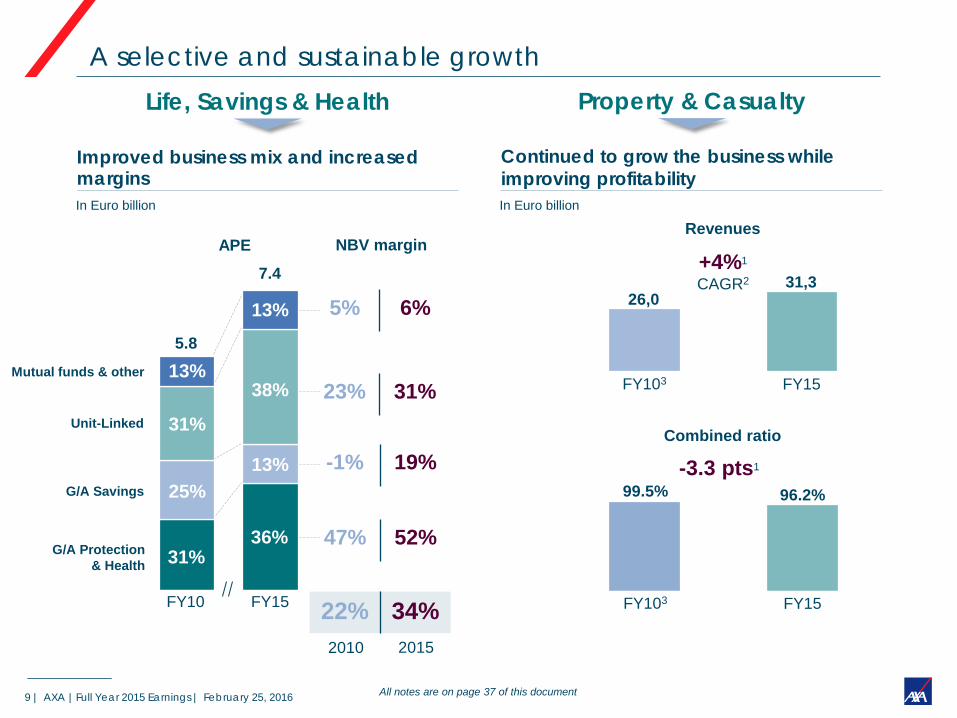
In Euro billion
Improved business mix and increased margins
APE
FY15
7.4
36%
13%
38%
13%
FY10
5.8
31%
25%
31%
13%
Continued to grow the business while improving profitability
FY15
96.2%
FY103
99.5%
31,3 26,0
Revenues
Combined ratio
2010 2015
Life, Savings & Health
G/A Protection & Health
G/A Savings
Unit-Linked
Mutual funds & other
Property & Casualty
NBV margin
5% 6%
23% 31%
-1% 19%
47% 52%
22% 34%
+4%1 CAGR2
-3.3 pts1
A selective and sustainable growth
In Euro billion
All notes are on page 37 of this document
FY15 FY103
10 | AXA |Full Year 2015 Earnings | February 25, 2016
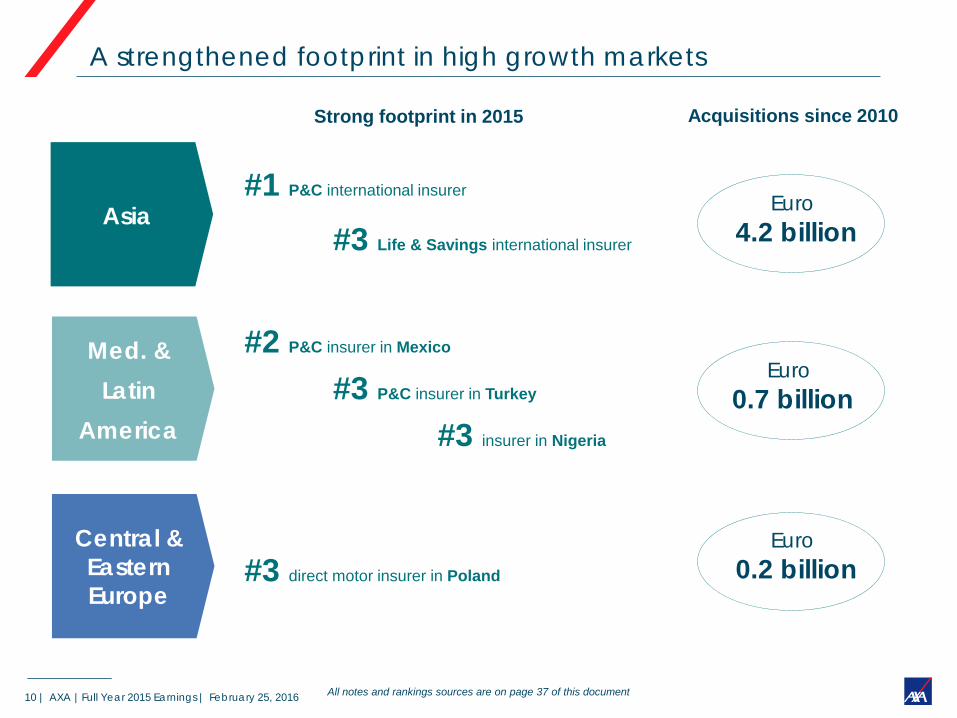
A strengthened footprint in high growth markets
All notes and rankings sources are on page 37 of this document
#2 P&C insurer in Mexico
#3 P&C insurer in Turkey
#3 Life & Savings international insurer
#1 P&C international insurer
#3 direct motor insurer in Poland
Euro 4.2 billion
Euro 0.7 billion
Euro 0.2 billion
#3 insurer in Nigeria
Med. & Latin
America
Asia
Central & Eastern Europe
Acquisitions since 2010 Strong footprint in 2015
11 | AXA |Full Year 2015 Earnings | February 25, 2016
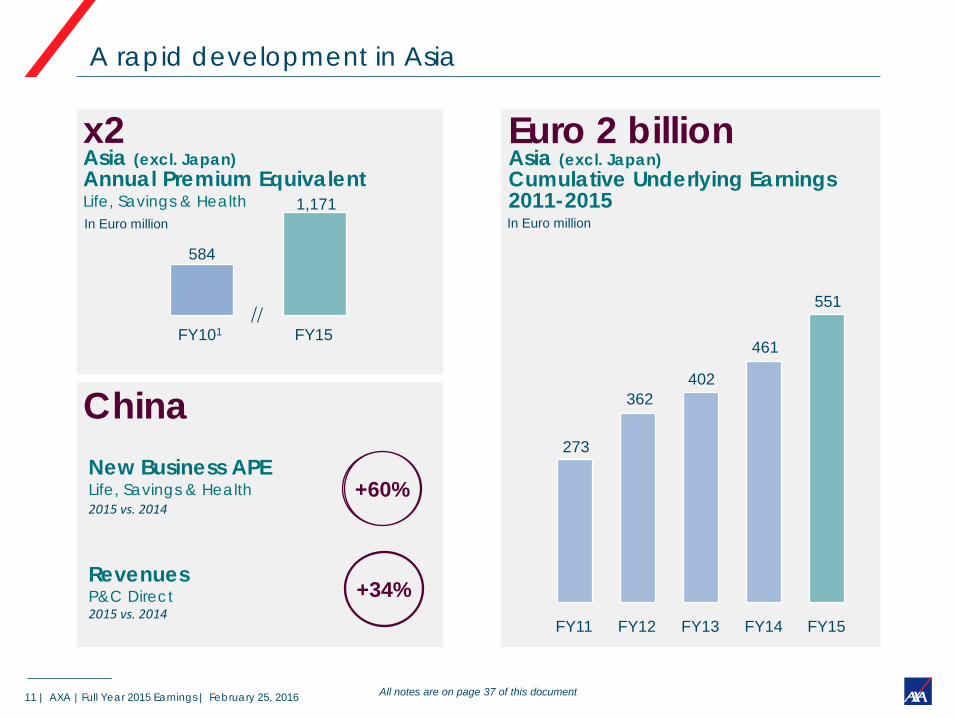
273
362 402
461
551
FY11 FY14 FY13 FY12 FY15
Euro 2 billion Asia (excl. Japan) Cumulative Underlying Earnings 2011-2015
x2 Asia (excl. Japan) Annual Premium Equivalent Life, Savings & Health
China
584
FY15 FY101
1,171 In Euro million In Euro million
All notes are on page 37 of this document
A rapid development in Asia
+60%
+34%
New Business APE Life, Savings & Health 2015 vs. 2014
Revenues P&C Direct 2015 vs. 2014
12 | AXA |Full Year 2015 Earnings | February 25, 2016
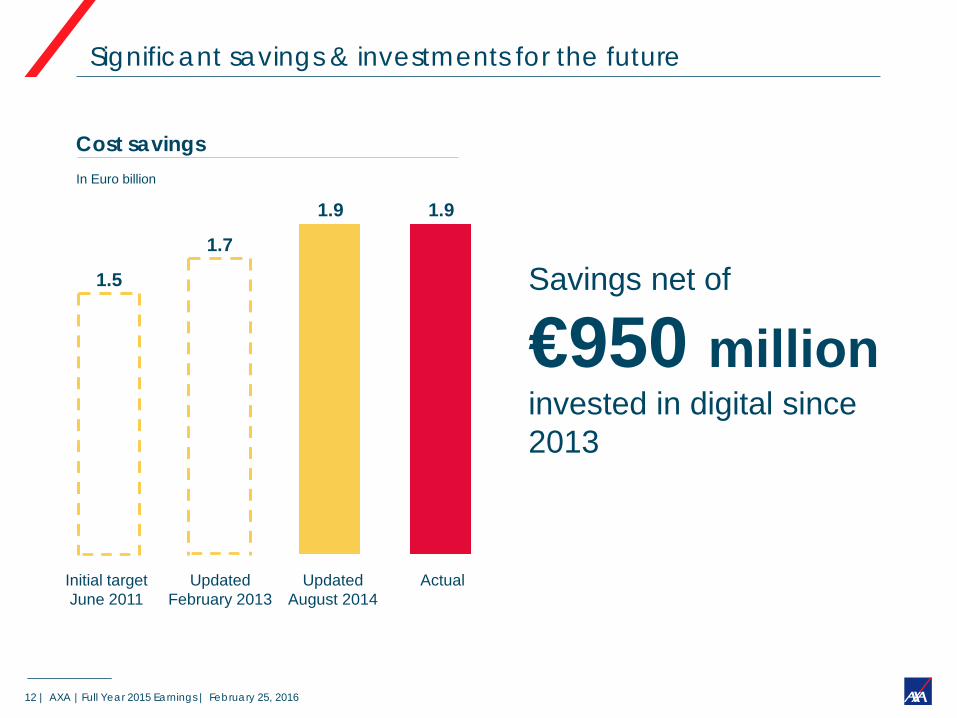
Savings net of
€950 million invested in digital since 2013
In Euro billion
1.9
Actual Updated August 2014
1.9
Updated February 2013
1.7
Initial target June 2011
1.5
Cost savings
Significant savings & investments for the future
13 | AXA |Full Year 2015 Earnings | February 25, 2016
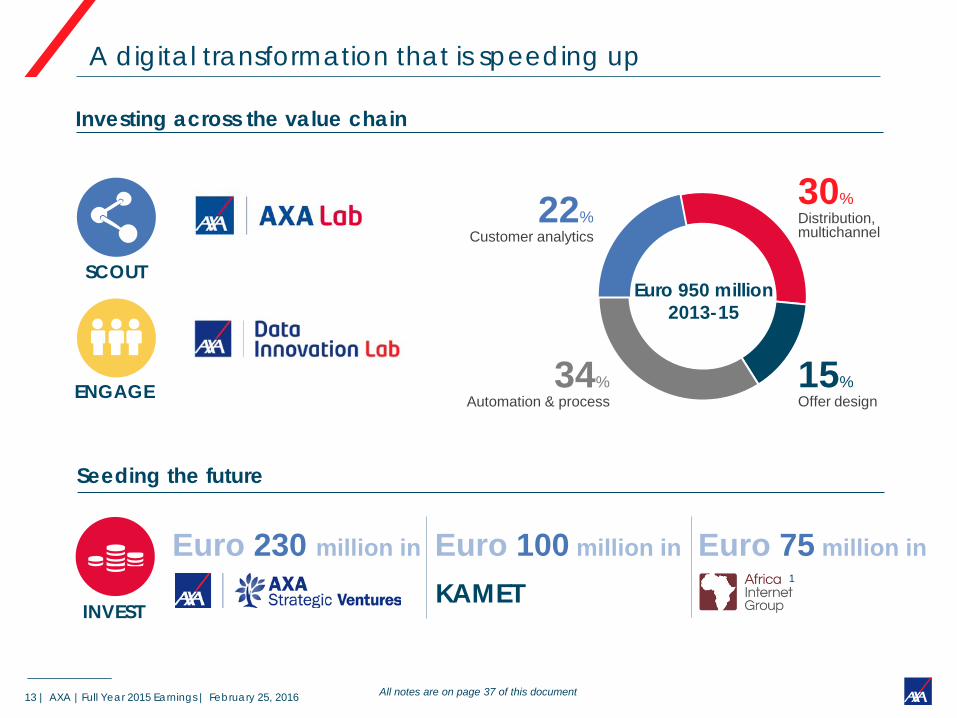
A digital transformation that is speeding up
Investing across the value chain
SCOUT
ENGAGE
INVEST
Euro 230 million in Euro 100 million in
Seeding the future
KAMET Euro 75 million in
30% Distribution, multichannel
15% Offer design
22% Customer analytics
34% Automation & process
Euro 950 million 2013-15
1
All notes are on page 37 of this document
14 | AXA |Full Year 2015 Earnings | February 25, 2016
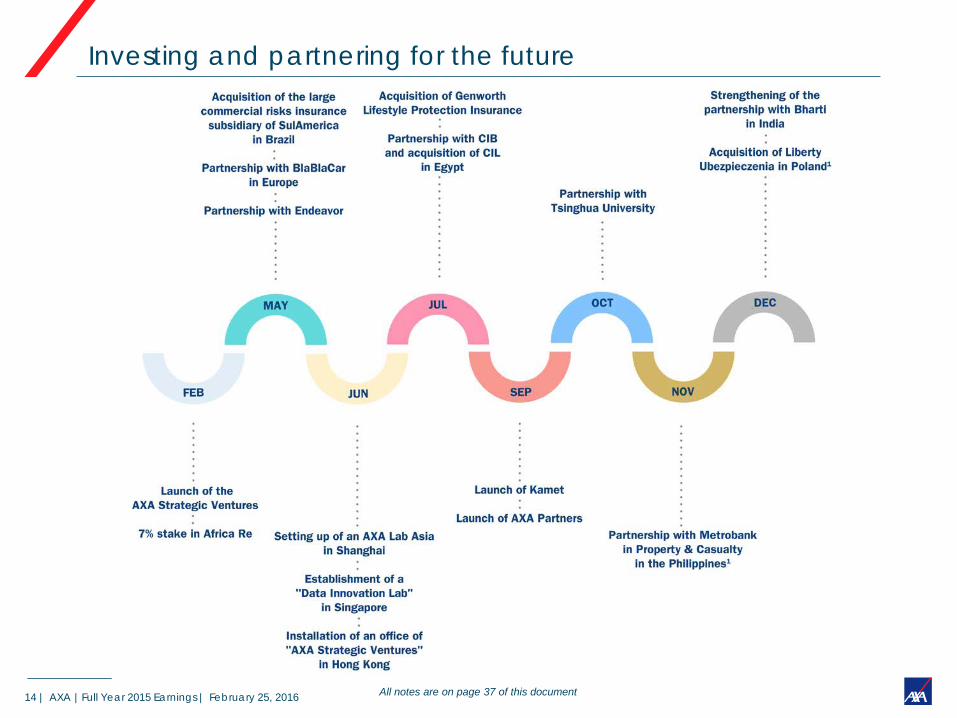
Investing and partnering for the future
All notes are on page 37 of this document
15 | AXA |Full Year 2015 Earnings | February 25, 2016
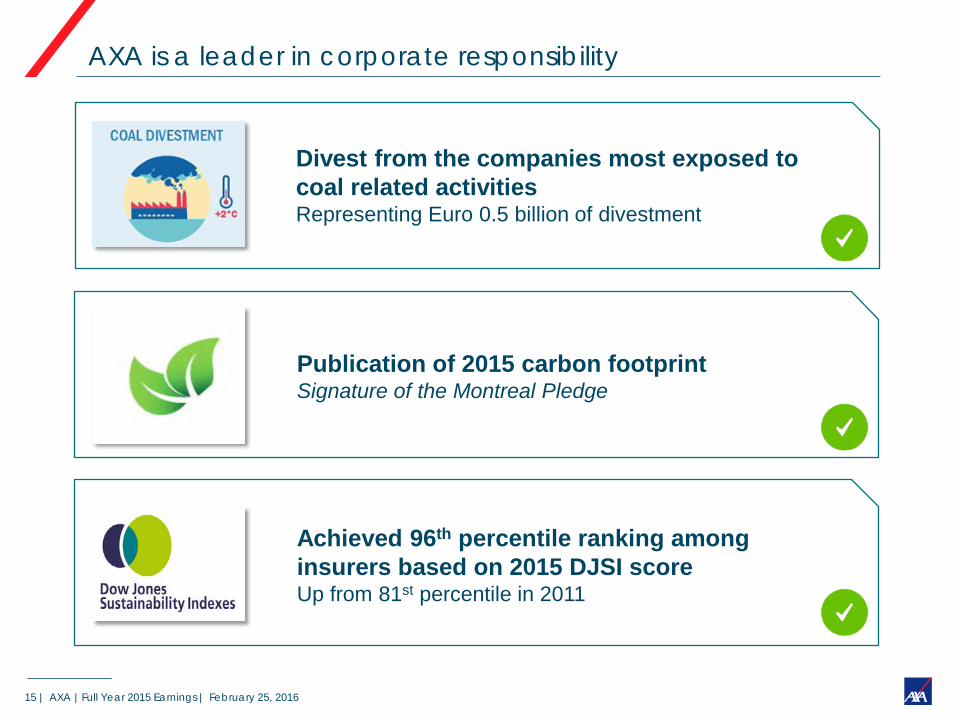
AXA is a leader in corporate responsibility
Achieved 96th percentile ranking among insurers based on 2015 DJSI score Up from 81st percentile in 2011
Divest from the companies most exposed to coal related activities Representing Euro 0.5 billion of divestment
Publication of 2015 carbon footprint Signature of the Montreal Pledge

2 Life, Savings & Health
Denis Duverne Deputy CEO
17 | AXA |Full Year 2015 Earnings | February 25, 2016
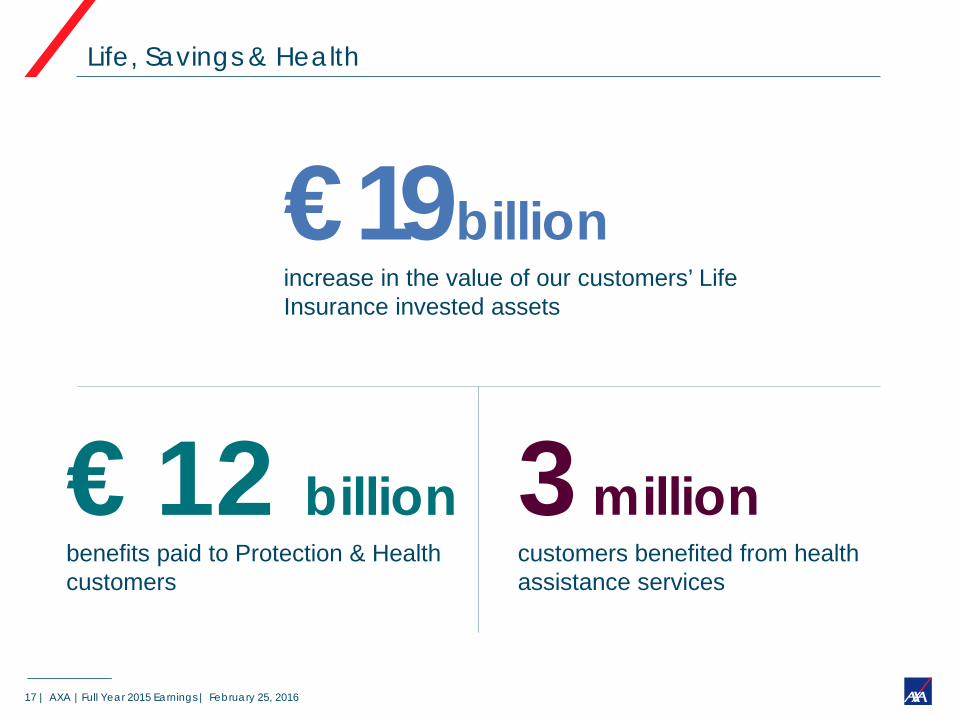
€ 12 billion benefits paid to Protection & Health customers
€ 19 billion increase in the value of our customers’ Life Insurance invested assets
3 million customers benefited from health assistance services
Life, Savings & Health
18 | AXA |Full Year 2015 Earnings | February 25, 2016
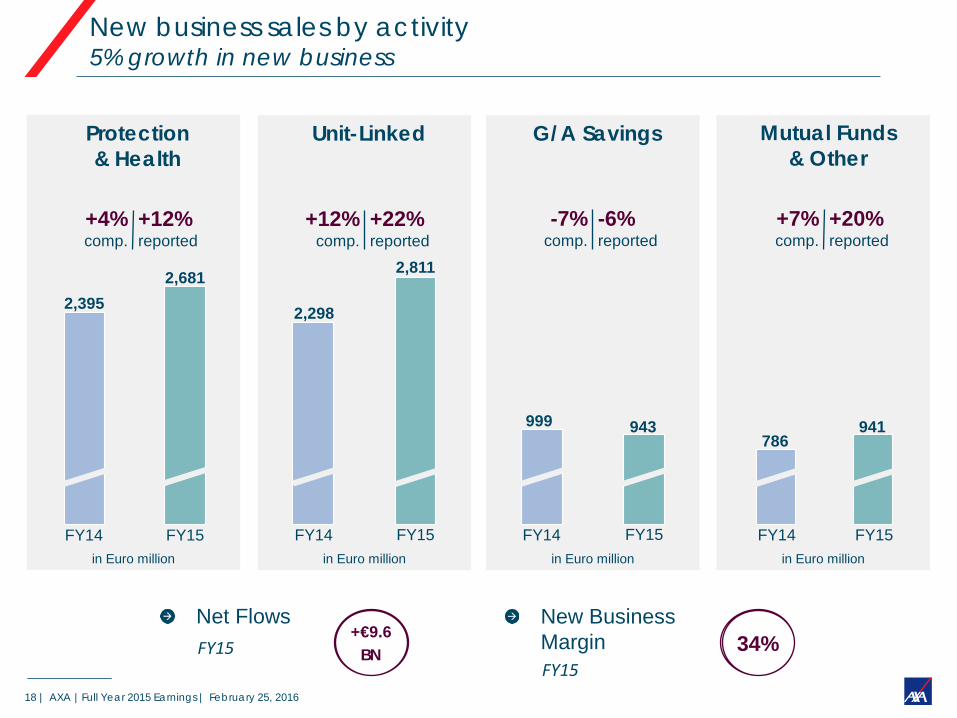
New business sales by activity 5% growth in new business
Protection & Health
Mutual Funds & Other
Unit-Linked G/A Savings
2,395 2,681 2,811
2,298
943 999 941 786
Net Flows FY15
+€9.6 BN
New Business Margin
FY15 34%
in Euro million in Euro million in Euro million in Euro million
+4% comp.
+12% reported
+12% comp.
+22% reported
-7% comp.
-6% reported
+7% comp.
+20% reported
FY14 FY15 FY14 FY15 FY14 FY15 FY14 FY15
19 | AXA |Full Year 2015 Earnings | February 25, 2016
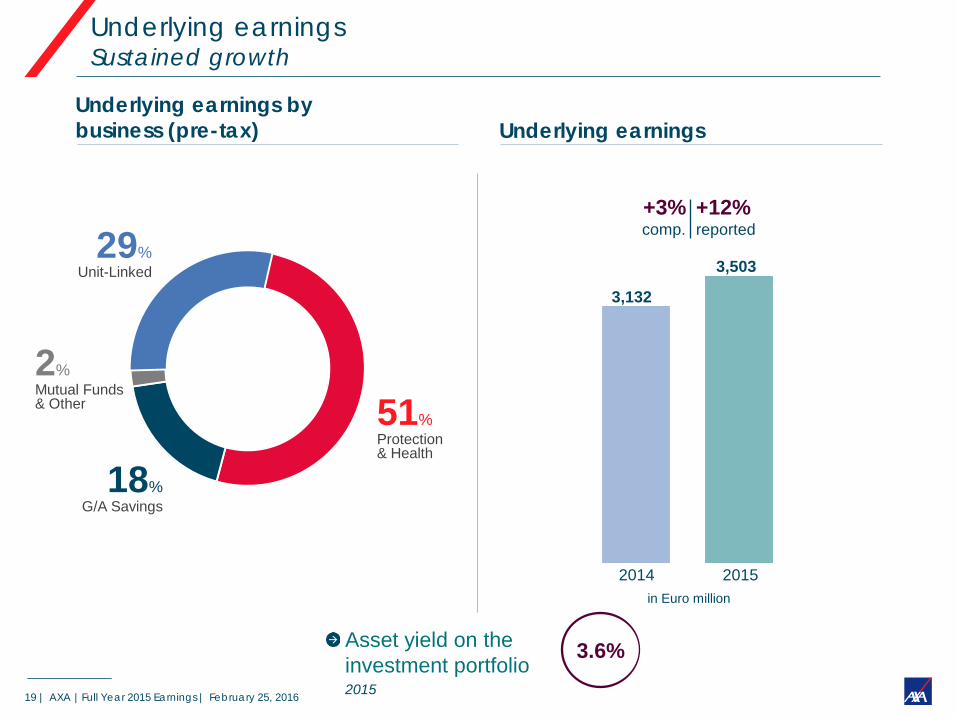
51% Protection & Health
18% G/A Savings
29% Unit-Linked
2% Mutual Funds & Other
Asset yield on the investment portfolio
2015
3.6%
Underlying earnings by business (pre-tax) Underlying earnings
+3% comp.
+12% reported
Underlying earnings Sustained growth
3,132
3,503
in Euro million
2014 2015

3 Property & Casualty
21 | AXA |Full Year 2015 Earnings | February 25, 2016
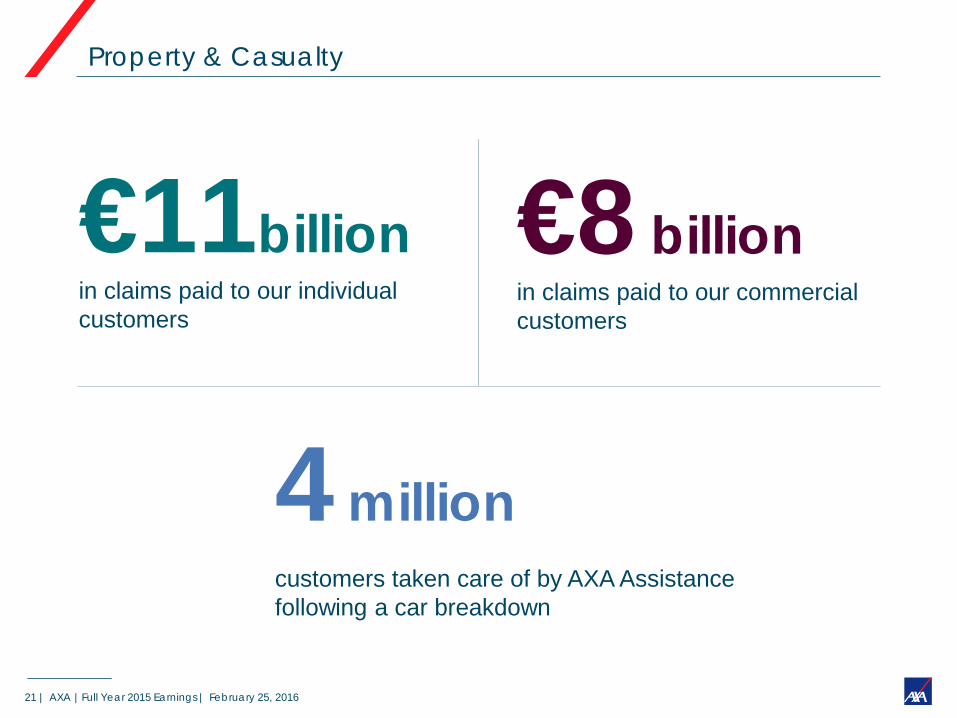
€11billion in claims paid to our individual customers
4 million customers taken care of by AXA Assistance following a car breakdown
€8 billion in claims paid to our commercial customers
Property & Casualty
22 | AXA |Full Year 2015 Earnings | February 25, 2016
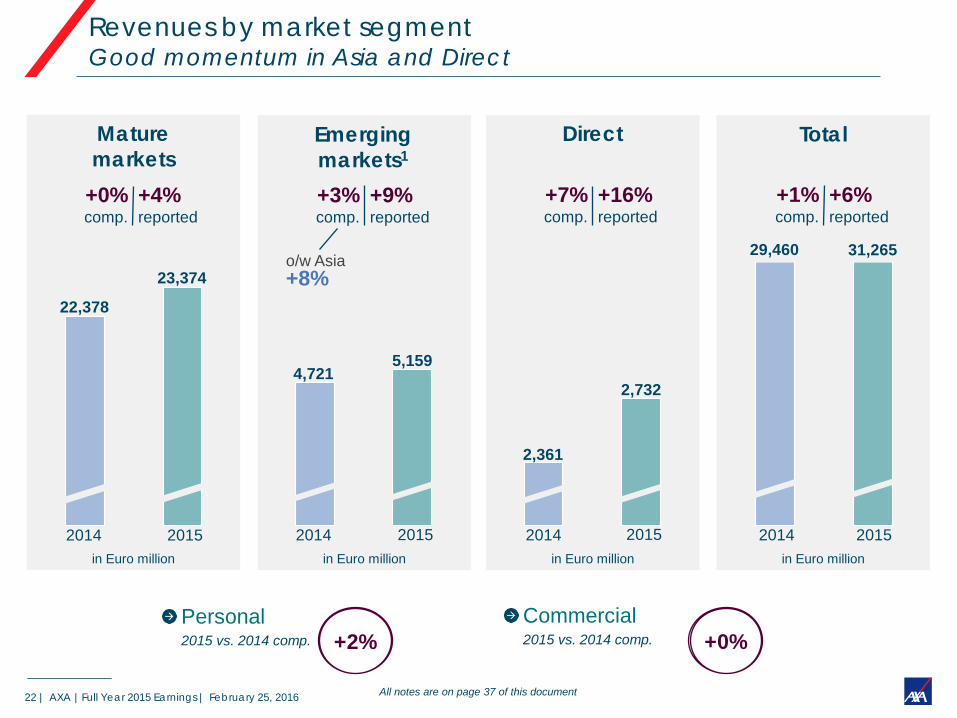
in Euro million in Euro million in Euro million in Euro million
2014 2015 2014 2015 2014 2015 2014 2015
Mature markets
Total Direct
22,378
23,374
4,721
2,361
2,732
29,460 31,265
Emerging markets1
5,159
o/w Asia +8%
+0% comp.
+4% reported
+3% comp.
+9% reported
+7% comp.
+16% reported
+1% comp.
+6% reported
Revenues by market segment Good momentum in Asia and Direct
Personal 2015 vs. 2014 comp. +2% +0%
Commercial 2015 vs. 2014 comp.
All notes are on page 37 of this document
23 | AXA |Full Year 2015 Earnings | February 25, 2016
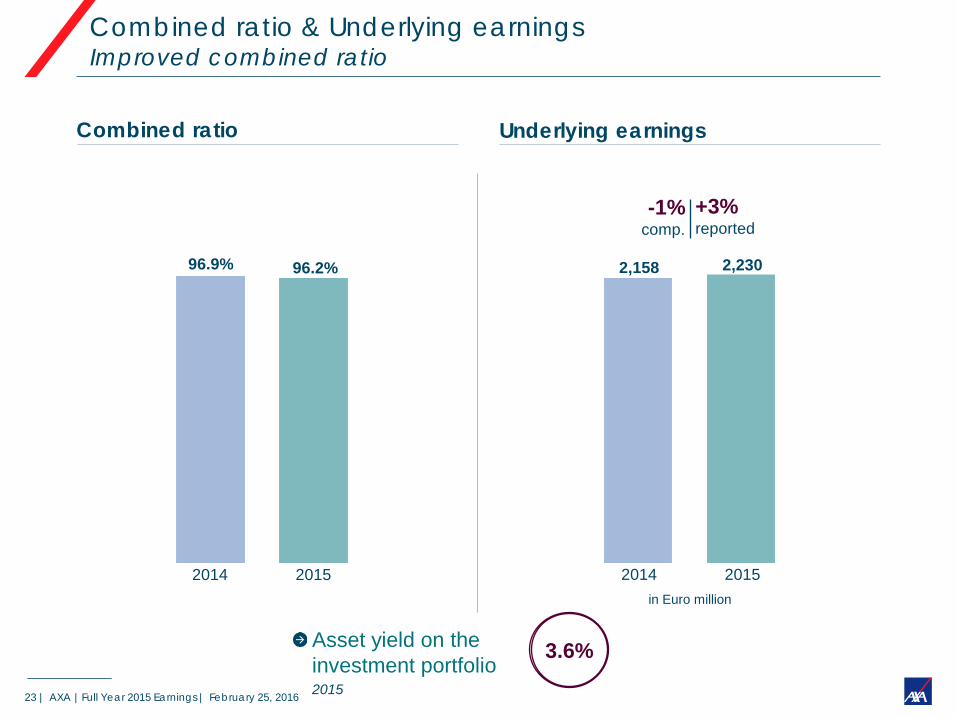
Asset yield on the investment portfolio
2015
3.6%
Combined ratio Underlying earnings
96.9% 96.2%
-1% comp.
+3% reported
Combined ratio & Underlying earnings Improved combined ratio
2,158 2,230
in Euro million
2014 2015 2014 2015

4 Asset Management
25 | AXA |Full Year 2015 Earnings | February 25, 2016
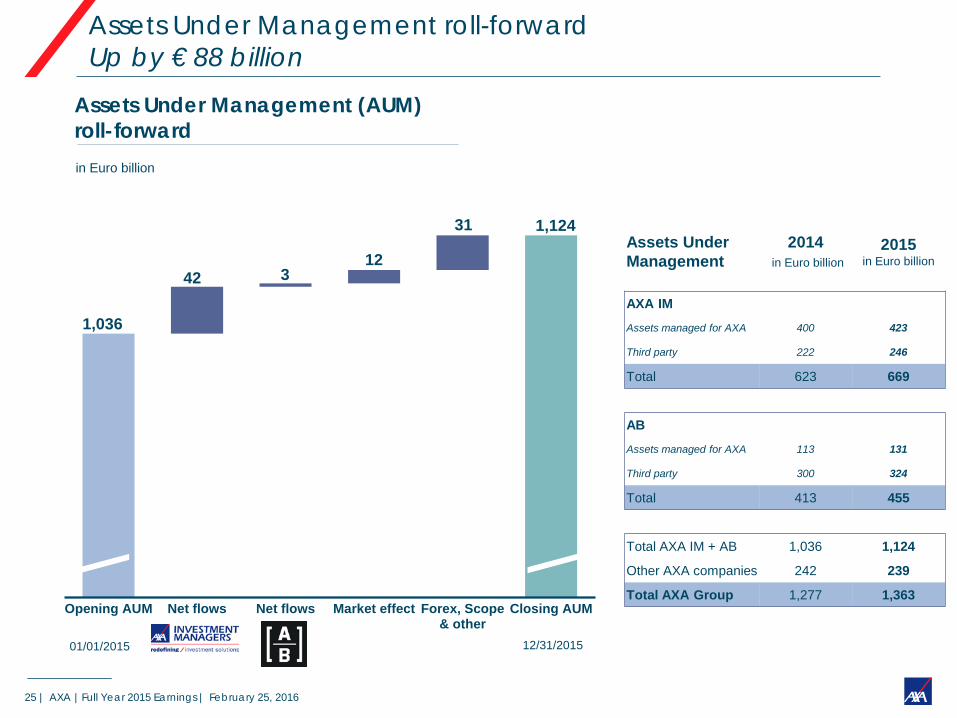
Assets Under Management (AUM) roll-forward in Euro billion
Assets Under Management roll-forward Up by € 88 billion
Opening AUM Net flows Net flows Market effect Forex, Scope& other
Closing AUM
01/01/2015 12/31/2015
Assets Under Management
2014 in Euro billion
2015 in Euro billion
AXA IM
Assets managed for AXA 400 423
Third party 222 246
Total 623 669
AB
Assets managed for AXA 113 131
Third party 300 324
Total 413 455
Total AXA IM + AB 1,036 1,124
Other AXA companies 242 239
Total AXA Group 1,277 1,363
1,036
42 3 12
31 1,124

26 | AXA |Full Year 2015 Earnings | February 25, 2016
403
458
in Euro million
Underlying earnings
234
224 193
211
19
42
in Euro billion
in Euro billion
Net flows
3 3
o/w €34 bn via JVs in Asia vs. €15bn in 2014 +1%
comp. +14% reported
(incl. JVs1)
Underlying earnings Strong growth in net flows
All notes are on page 37 of this document
2014 2015
2014 2015
2014 2015
5 Earnings summary
& Financial strength
28 | AXA |Full Year 2015 Earnings | February 25, 2016
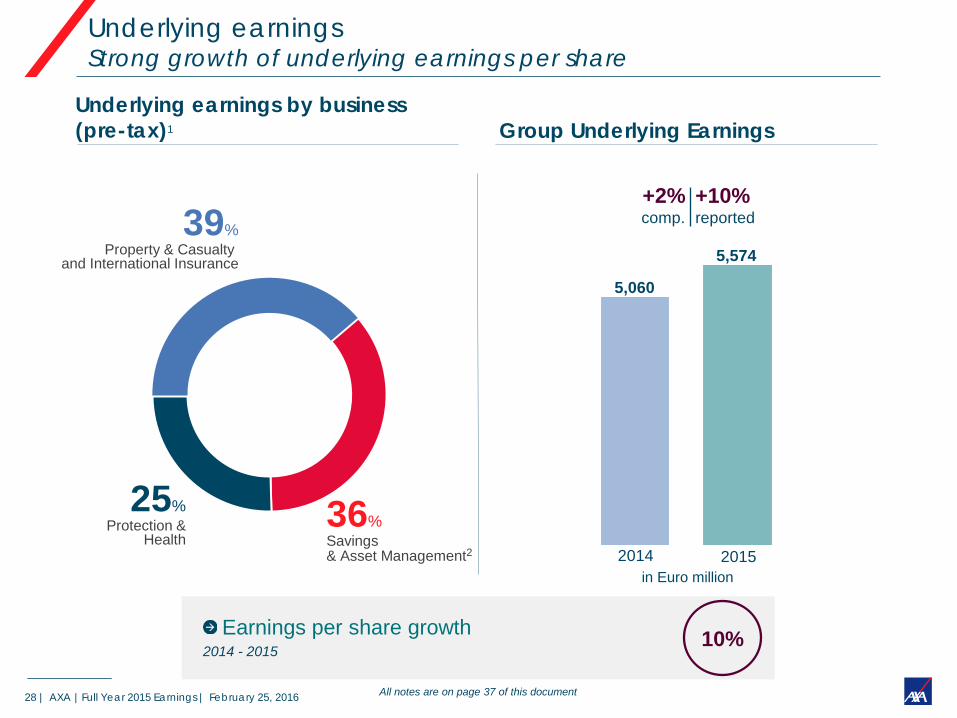
36% Savings & Asset Management2
25% Protection &
Health
39% Property & Casualty
and International Insurance
5,060
5,574
in Euro million
Underlying earnings by business (pre-tax)1 Group Underlying Earnings
10% Earnings per share growth 2014 - 2015
+2% comp.
+10% reported
Underlying earnings Strong growth of underlying earnings per share
All notes are on page 37 of this document
2014 2015
29 | AXA |Full Year 2015 Earnings | February 25, 2016
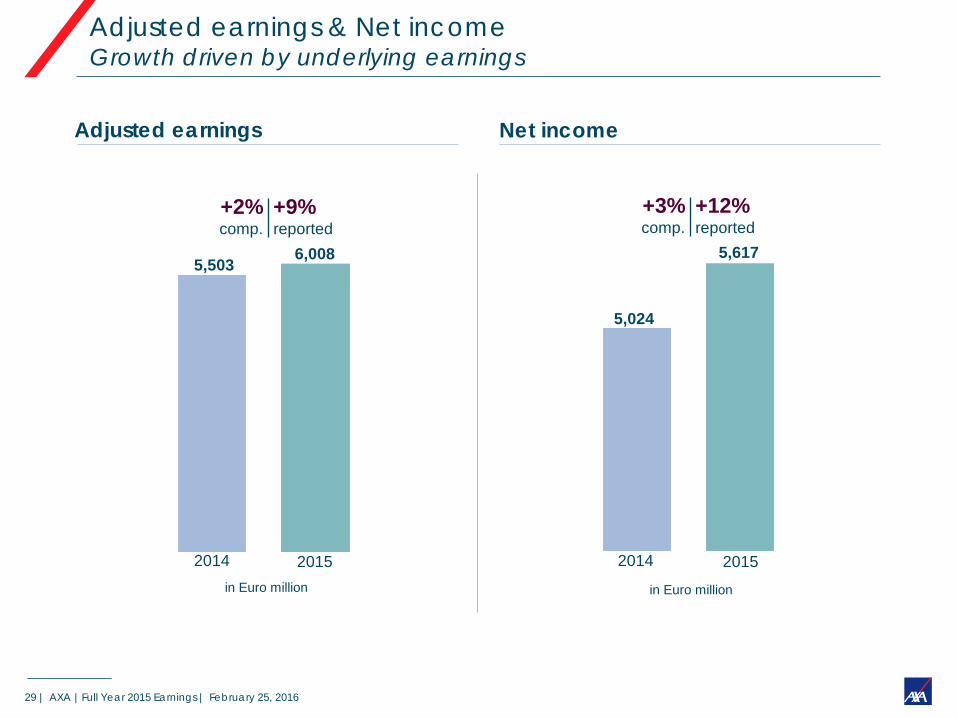
in Euro million in Euro million
Adjusted earnings Net income
+3% comp.
+12% reported
+2% comp.
+9% reported
Adjusted earnings & Net income Growth driven by underlying earnings
5,503 6,008
5,024
5,617
2014 2015 2014 2015
30 | AXA |Full Year 2015 Earnings | February 25, 2016
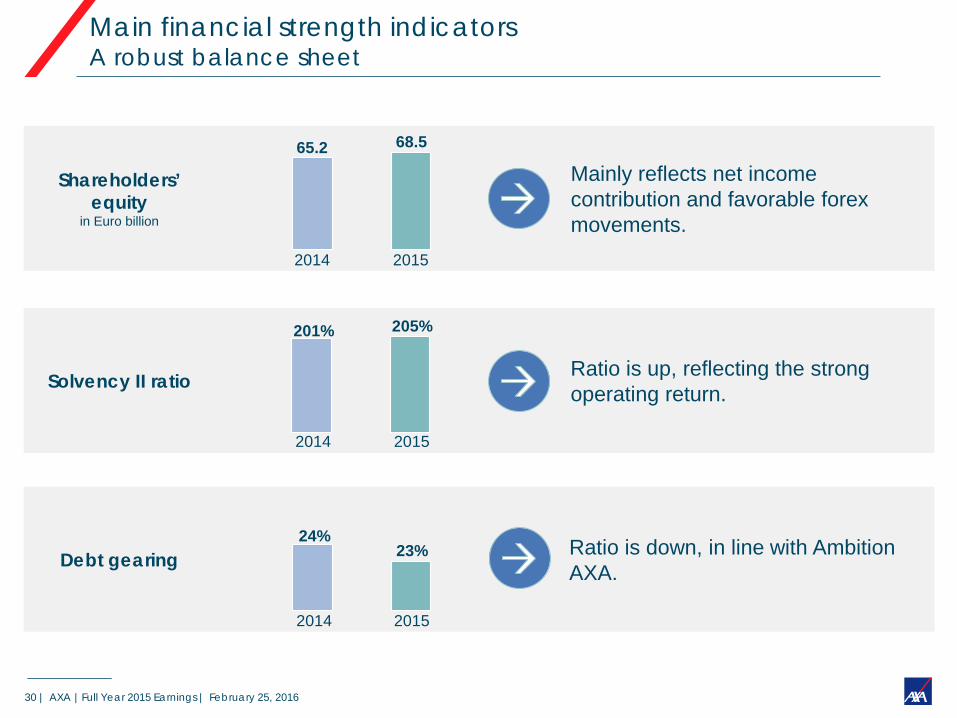
Shareholders’ equity
in Euro billion
Solvency II ratio
Debt gearing
65.2 68.5
201% 205%
24% 23%
Mainly reflects net income contribution and favorable forex movements.
Ratio is up, reflecting the strong operating return.
Ratio is down, in line with Ambition AXA.
Main financial strength indicators A robust balance sheet
2014 2015
2014 2015
2014 2015
31 | AXA |Full Year 2015 Earnings | February 25, 2016
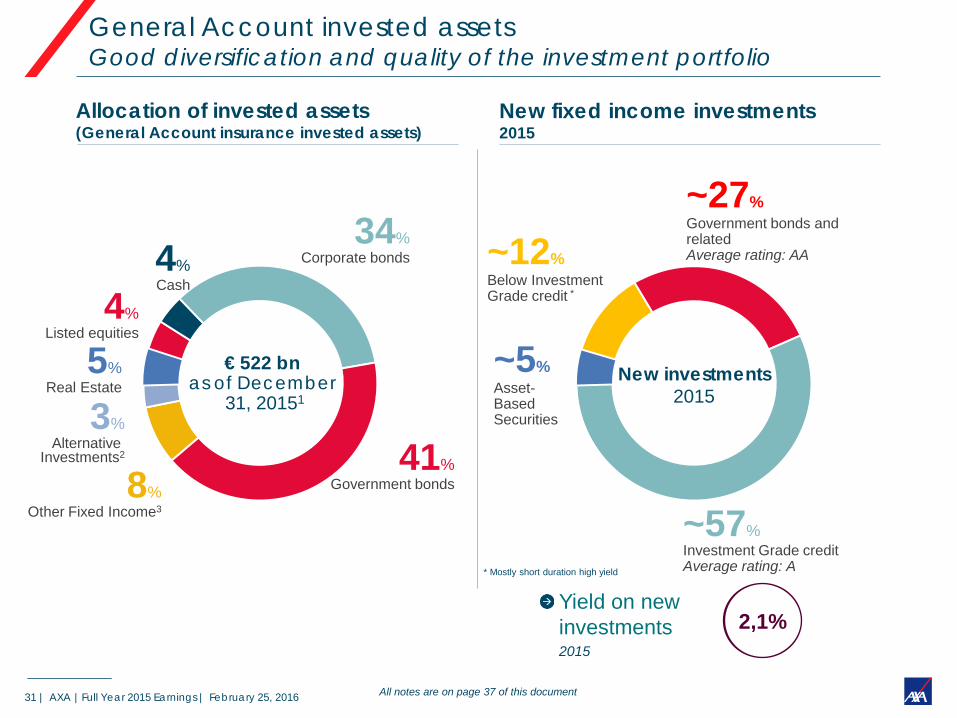
41% Government bonds
3% Alternative
Investments2
4% Listed equities
34% Corporate bonds 4%
Cash
8% Other Fixed Income3
5% Real Estate
€ 522 bn as of December
31, 20151
Allocation of invested assets (General Account insurance invested assets)
New fixed income investments 2015
General Account invested assets Good diversification and quality of the investment portfolio
~5% Asset-Based Securities
~12% Below Investment Grade credit *
~27% Government bonds and related Average rating: AA
New investments 2015
~57% Investment Grade credit Average rating: A
All notes are on page 37 of this document
Yield on new investments
2015
2,1%
* Mostly short duration high yield
32 | AXA |Full Year 2015 Earnings | February 25, 2016
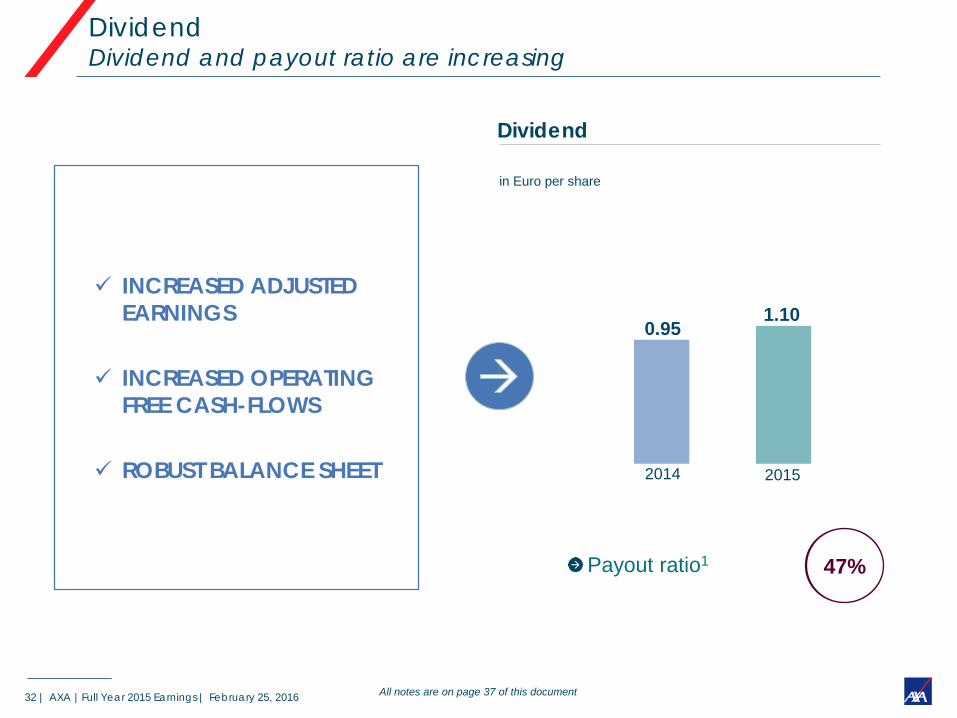
in Euro per share
1.10
Dividend
Dividend Dividend and payout ratio are increasing
Payout ratio1 47%
0.95
INCREASED ADJUSTED EARNINGS
INCREASED OPERATING FREE CASH-FLOWS
ROBUST BALANCE SHEET
All notes are on page 37 of this document
2014 2015

6 Concluding remarks
Henri de Castries Chairman & Chief Executive Officer
34 | AXA |Full Year 2015 Earnings | February 25, 2016
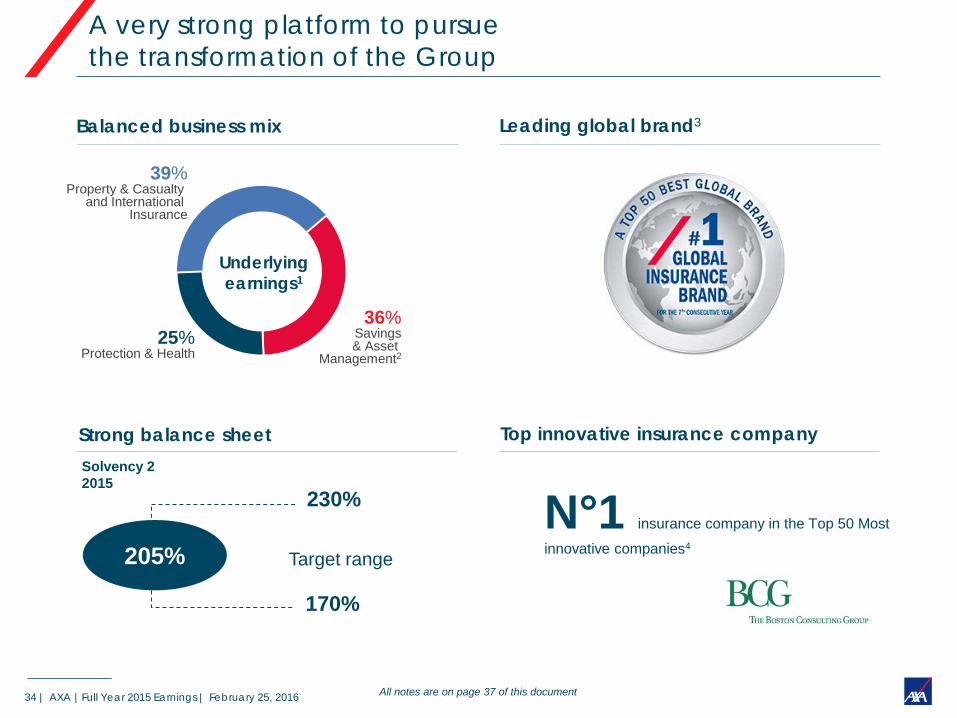
Balanced business mix
Strong balance sheet Top innovative insurance company
Leading global brand3
205%
230%
170%
Target range
N°1 insurance company in the Top 50 Most
innovative companies4
Underlying earnings1
36% Savings
& Asset Management2
25% Protection & Health
39% Property & Casualty
and International Insurance
All notes are on page 37 of this document
A very strong platform to pursue the transformation of the Group
Solvency 2 2015

Q&A Session
2015 Full Year Earnings
36 | AXA |Full Year 2015 Earnings | February 25, 2016
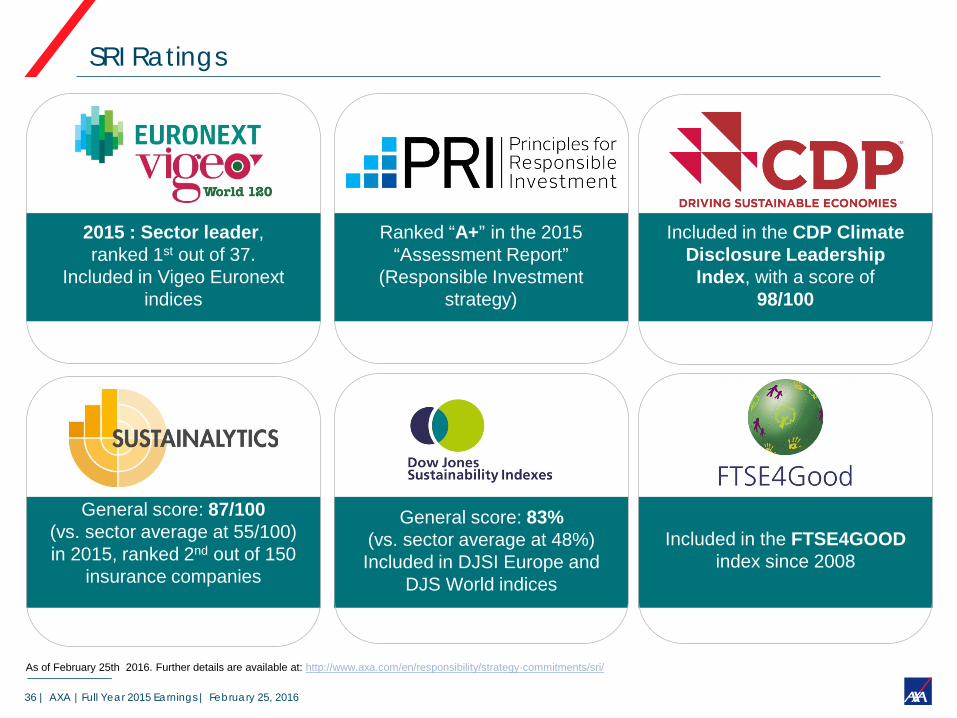
SRI Ratings
Included in the CDP Climate Disclosure Leadership
Index, with a score of 98/100
Ranked “A+” in the 2015 “Assessment Report”
(Responsible Investment strategy)
Included in the FTSE4GOOD index since 2008
General score: 83% (vs. sector average at 48%) Included in DJSI Europe and
DJS World indices
General score: 87/100 (vs. sector average at 55/100) in 2015, ranked 2nd out of 150
insurance companies
As of February 25th 2016. Further details are available at: http://www.axa.com/en/responsibility/strategy-commitments/sri/
2015 : Sector leader, ranked 1st out of 37.
Included in Vigeo Euronext indices
37 | AXA |Full Year 2015 Earnings | February 25, 2016
Notes
Changes at comparable basis are constant Forex, scope and methodology for activity indicators, and at constant Forex for earnings, unless otherwise specified. Page 3 1. 2015. 2. As of 12/31/2015. 3. Interbrand ranking 2015. 4. Underlying Earnings (Life & Savings; Property & Casualty; International Insurance). 5. Pre-tax Full Year 2015 underlying earnings, excluding holdings. 6. Including G/A Savings, Unit-Linked and Banking. Page 6 1. Changes on a reported basis. Page 7 1. Transaction pending, subject to customary closing conditions and required regulatory approvals. Page 8 1. Compound annual growth rate, on a reported basis 2. Adjusted ROE: return corresponds to adjusted earnings net of interest charges on undated debt. Equity corresponds to average shareholders’ equity excluding undated debt and reserves related to change in fair value 3. Average shareholders’ equity excluding undated debt and reserves related to change in fair value Page 9 1. Changes on a reported basis. 2. Compound annual growth rate. 3. Restated for the sale of Canadian operations. Page 10 Ranking sources : Asia Life and Savings : based on 2014 Asia ex-Japan life insurance premiums - Source: OCI, MAS, KLIA, TII, Plan for Life, ISI, CIRC, TLAA, LIAM, IRDA, BAPEPAMLK, PIC, IRI, company data, Credit Suisse estimates; As published in Credit Suisse, Asia Life Insurance Sector, October 2, 2015; Asia P&C: based on 2012 Asia ex-Japan P&C insurance premiums. Source: OCI, MAS, KIDI, TII, APRA, ISI, IRI, CIRC, OIC, Bank Negara, IRDA, BAPEPAMLK, PIC, AVI, company data, Credit Suisse estimates; As published in Credit Suisse, Asia P&C Insurance Sector, November 13, 2013; Mexico: AMIS (Asociacion Mexicana de instituciones de Seguros) as of September 2015. Turkey: Turkish Association of Insurance Companies as of November 30, 2015; Nigeria: Various NIA Digest and NAICOM website; Poland (direct motor business): KNF, companies reports, AXA estimates; Page 11 1. 2010 pro forma of the AXA APH transaction. Page 13 1. Transaction pending, subject to customary closing conditions and required regulatory approvals. Page 14 1. Transaction pending, subject to customary closing conditions and required regulatory approvals. Page 22 1. Property & Casualty high growth markets or emerging countries are: Colombia, Gulf region, Hong Kong, Malaysia, Morocco, Mexico, Singapore, Thailand and Turkey. Page 26 1. AXA IM’s joint ventures in Asia (China, Korea and India) are included at 100% in net flows, opening and closing assets under management but are excluded from revenues and average assets under management as they are not fully consolidated Page 28 1. Pre-tax Full Year 2015 underlying earnings, excluding holdings. 2. Including G/A Savings, Unit-Linked and Banking. Page 31 1. FY15 invested assets referenced in page 57 of the financial supplement are Euro 779 billion, which include notably Euro 194 billion of Unit-Linked assets and Euro 37 billion related to the banking segment 2. Mainly Private Equity and Hedge Funds 3. Other fixed income include Asset backed securities (Euro 9 billion), residential loans (Euro 12 billion), commercial & agricultural loans (Euro 18 billion) and agency pools (Euro 1 billion) Page 32 1. Based on Adjusted Earnings, net of undated debt interest charges. Page 34 1. Pre-tax Full Year 2015 underlying earnings, excluding holdings. 2. Including G/A Savings, Unit-Linked and Banking. 3. Interbrand ranking 2015. 4. Ranked 22nd in the “2015 Most innovative companies” tenth annual survey from the Boston Consulting Group’s (BCG)