Embed Size (px)
Citation preview

Henderson Group plc 47 Esplanade, Jersey JE1 0BD Registered in Jersey No. 101484 ABN 67 133 992 766
2015 Annual Report 3 March 2016 Henderson Group's Annual Report for the year ended 31 December 2015 is now available on the Henderson Group website (www.henderson.com/ir/annual-report-ir). A copy of the 2015 Annual Report is also included below.
* * *
Further information www.henderson.com/IR or
Investor enquiries Miriam McKay +44 (0) 20 7818 2106 or Head of Investor Relations +44 (0) 20 7818 5310 [email protected] or [email protected] Louise Curran Investor Relations Manager
+44 (0) 20 7818 5927 [email protected]
For
per
sona
l use
onl
y

AN
NUA
L RE
PORT
2
015
For
per
sona
l use
onl
y

Contents Performance highlights
Strategic report2 Henderson at a glance4 Chairman’s statement7 Chief Executive’s review12 Business model 14 Strategy16 Key performance indicators18 Financial review23 Risk management29 Resources, relationships and responsibilities30 Core investment management capabilities38 Client relationships and brand42 Our people: our greatest asset 44 Corporate responsibility
Governance
49 Chairman’s introduction50 Board of Directors and leadership54 Governance57 Committee reports66 Relations with shareholders67 Directors’ remuneration report85 Compliance statements and application of principles and recommendations89 Directors’ report91 Directors’ responsibilities statement92 Independent auditors’ report
Financial statements
Other information148 Glossary150 Shareholder information152 Summary of movements in AUM
Notes:
1. As a percentage of opening AUM from continuing operations (excludes TH Real Estate).
2. Assets under management from continuing operations.
3. Calculation based on continuing underlying
Investmentoutperformance
of funds over three years81%100
50
2011 2012 2013 2014 20150
66 69
81 83 81
Net new money growth1
11%20
-20
0
6
11 11
-13
-8
2011 2012 2013 2014 2015
Diluted earningsper share3
17.2p20
10
0
10.9 10.3
13.014.7
17.2
2011 2012 2013 2014 2015
Dividend per share
10.3p12
6
0
7.00 7.158.00
9.00
10.3
2011 2012 2013 2014 2015
Assets under management2
£92.0bn100
50
0
52.7 53.963.7
81.2
92.0
2011 2012 2013 2014 2015
This report and additional information about the Group can be found online at henderson.com/IR.
Pages 1 to 47 of this report constitute the Strategic report which has been signed on behalf of the Board.
Richard Gillingwater
Chairman
Andrew Formica
Chief Executive
For
per
sona
l use
onl
y

2015 was all about delivery.
•
•
•
•
•
STRE
NG
TH IN
O
UR
STRA
TEG
Y
1Henderson Group plc Annual Report 2015
Strategic reportStrategic report
For
per
sona
l use
onl
y

Henderson at a glance
Growth and globalisationHenderson is an independent asset manager, specialising in active management. We serve an increasingly global client base, offering our clients access to all major markets around the world.
North America•
•
•
•
•
UK•
•
•
•
Europe, Middle East and Africa•
•
•
•
Asia•
•
•
•
Australia•
•
•
•
2 Henderson Group plc Annual Report 2015
For
per
sona
l use
onl
y

Notes:
All data as at 31 December 2015, unless stated otherwise.
1.
TH Real Estate.
2.
3.
Total Retail
3
Alternatives
•
• 1
• 2
•
•
•
•
£92.0bn
35.1 56.9AUM by client channel (£bn)
35.1
19.38.6
29.0
AUM by product (£bn)
24.8
4.9
13.7
28.2
20.4
AUM by core capability (£bn)
3Henderson Group plc Annual Report 2015
Strategic reportStrategic report
For
per
sona
l use
onl
y

How do you measure success?
•
•
•
•
•
What makes you believe that this success is sustainable?
Chairman’s statement
In my 2014 review, I focused on the abiding importance of putting our clients’ interests at the heart of everything we do. How well embedded is this customer-centric view point?
It is of fundamental importance that everyone at Henderson respects the fact that we are trusted with our clients’ money, on which their future wellbeing may depend.
Richard Gillingwater
4 Henderson Group plc Annual Report 2015
For
per
sona
l use
onl
y

What role has the Board played in the development and execution of strategy?
the second half of 2015.
What is on the Board agenda for the coming year?
and shareholders.
Richard Gillingwater
We have continued to progress along our journey of growth and globalisation as shown not only by the organic growth of our business as explained elsewhere in this report but also by the acquisitions of Perennial Fixed Interest and Perennial Growth Management. Further information can be found on page 9. These acquisitions will accelerate our strategy to grow and globalise our business.
We have in place a robust governance framework that underpins and enables us to deliver on our strategy and support our
the Chairs of the Audit, Nomination, Remuneration and Board Risk Committees. 2015 has been another challenging year for the Board and I thought it might be useful if we set out a more detailed summary of the matters we considered during the year.
We have signed up to the Investment Association’s Statement of Principles for Investment Managers. These 10 principles represent a culture of excellence for investment managers
On the subject of culture, the Board received the results of a culture audit undertaken by KPMG. There were a lot of positives to be taken from the report but there are some areas in which we could do better and a sub-committee of the ExCo is investigating
Henderson operates in a highly and constantly developing regulatory environment. Therefore, a great deal of time has been spent by the Board and the Audit Committee on regulatory matters as we ensure that our Compliance systems are appropriately embedded in the organisation.
I would also like to take the opportunity to welcome Kalpana Desai to the Board. A description of her appointment process is set out in the report from the Nomination Committee.
This Corporate Governance Statement is correct as at 10 February 2016 and has been approved by the Board of Directors.
Richard Gillingwater
Chairman
10 February 2016
Chairman’s introduction
Contents49 Chairman’s introduction
50 Board of Directors and leadership
54 Strategy, governance structure and Board business
56 Effectiveness
57 Nomination Committee report
59 Accountability
60 Board Risk Committee report
62 Audit Committee report
66 Relations with shareholders
67 Directors’ remuneration report
85 Compliance statements and application of principles and recommendations
89 Directors’ report
91 Directors’ responsibilities statement
92 Independent auditors’ report
Dear Shareholder
CO
RPO
RATE
G
OV
ERN
AN
CE
We continue to have in place a robust governance framework that underpins and enables us to deliver on our strategy and support our business model.
Richard Gillingwater
Chairman
Our formal compliance statements with an explanation of how we applied the principles of the UK Governance Code and the recommendations set out in the ASX Principles are set out on pages 85 to 88.
Strategic reportGovernance
49Henderson Group plc Annual Report 201548 Henderson Group plc Annual Report 2015
Read more related to these topics
Strategic reportStrategic report
5Henderson Group plc Annual Report 2015
For
per
sona
l use
onl
y

FOC
US
AN
D
ENER
GY
6 Henderson Group plc Annual Report 2015
For
per
sona
l use
onl
y

Chief Executive’s review
Andrew Formica
2015 has been another strong year for Henderson. We have executed well on our strategy to grow and globalise our business.
In my review last year, I said 2015 would be all about delivery of Henderson’s strategy. A year on, how have we done?
Investment performance by core capability
Total 78% 81%
Note:
Strategic reportStrategic report
7Henderson Group plc Annual Report 2015
For
per
sona
l use
onl
y

1, 2
Knowledge. Shared.
3,000
4,000
2,000
1,000
-1,000
0
Total
InstitutionalUS RetailRetail SICAVs
(1,269)
(182)
1,241
2,7012,988
2,042
1,366742
3,554
2,040
1,3051,643UK Retail/Other3
)
1Q13 2Q13 3Q13 4Q13 1Q14 2Q14 3Q14 4Q14 1Q15 2Q15 3Q15 4Q15
11% annualised NNM growth FY151, 2
One of Henderson’s strengths is that we give experienced managers freedom to manage money according to tried and tested investment styles.”
Andrew Formica
Notes:
1.
2.
3.
8 Henderson Group plc Annual Report 2015
For
per
sona
l use
onl
y

Case study: Henderson in America
•
•
•
•
•
Strategic reportStrategic report
9Henderson Group plc Annual Report 2015
For
per
sona
l use
onl
y

What’s next?
•
•
•
•
Andrew Formica
These priorities encourage us not only to execute well, but to be agile enough to respond to changes in market conditions.”
Andrew Formica
10 Henderson Group plc Annual Report 2015
For
per
sona
l use
onl
y

AW
ARE
NES
S A
ND
AG
ILIT
Y
Strategic reportStrategic report
11Henderson Group plc Annual Report 2015
For
per
sona
l use
onl
y

A client-centric business model
Business model
How we generate and preserve value over the long term
Our strengths
•
•
•
•
•
• Knowledge. Shared
12 Henderson Group plc Annual Report 2015
For
per
sona
l use
onl
y

Our mission
Our clients and their end customers
Our resources, relationships and responsibilities
Outcomes
Core investment management capabilities •
•
Client relationships and brand p.38•
•
•
Our people p.42
Corporate responsibility p.44
For clients•
•
•
• Trust
For shareholders•
•
•
For employees•
•
•
•
Strategic reportStrategic report
13Henderson Group plc Annual Report 2015
For
per
sona
l use
onl
y

Strategy
Our strategy focuses on achieving growth and globalisation by delivering excellent performance and service to an increasingly diverse client base.
Growth and globalisation
Strategic priority How we performed in 2015
performance and service to our clients
•
•
•
•
•
2. Expand our global investment offering to meet the current and future needs of our clients
current and future needs.
•
•
•
3. Diversify our business •
•
•
•
•
to shareholders.
14 Henderson Group plc Annual Report 2015
For
per
sona
l use
onl
y

Key performance indicators
Principal risks The result
•
•
•
•
•
•
•
•
•
Read more about our strategy – our progress to date, risk management and priorities in 2016:
Doubling assets under management by 2018
2013 2018
£63.7bn AUM doubled
Net new money –
2 years to Dec 2015:
2 years to Dec 2015:
2 years to Dec 2015:
Strategic reportStrategic report
15Henderson Group plc Annual Report 2015
For
per
sona
l use
onl
y

Key performance indicators
We measure our strategic and operational progress through a set of indicators that focus on core performance factors.
2. Investment performance over 1 and 3 years (%)
100
80
90
60
50
70
1 year% of assets at/exceeding relevant metric over:
2011 2012 2013 2014 2015
3 years
1. Treating Customers Fairly (TCF)
12
10
8
6
4
2
0Outcome 1
Culture
Achieved2014
RA
G c
ount
(mon
ths)
Outcome 2Products
Outcome 3Information
Outcome 4Advice*
Outcome 5Performance
Outcome 6Barriers
Yet to be achievedIn progressAchieved2015 In progress
2014
2015
2014
2015
2014
2015
2014
2015
2014
2015
2014
2015
Note:
Link to strategy
Performance•
•
Link to strategy
Performance
•
•
• 1
8,000
4,0006,000
2,000
0
-8,000-6,000-4,000-2,000
2011 2012 2013 2014 2015
Link to strategy
Performance•
•
•
•
16 Henderson Group plc Annual Report 2015
For
per
sona
l use
onl
y

Notes:
1.
2.
4. Fee margins (bps)2
Total fee margin Management fee margin Net margin2
2011 2012 2013 2014 2015
100
60
80
20
0
40
Link to strategy
Performance•
•
5. Operating margin and compensation ratio (%)2
Compensation ratio
2011 2012 2013 2014 2015
Operating margin
50
45
35
30
40
Link to strategy
Performance•
•
6. Earnings per share on continuing 2
Basic
2011 2012 2013 2014 2015
Diluted
25
15
20
5
0
10
Link to strategy
Performance•
•
Strategic reportStrategic report
17Henderson Group plc Annual Report 2015
For
per
sona
l use
onl
y

Financial review
Financial performance
1
2015
81%£8.5bn
56.0bps44.6%35.7%
£220.0m17.2p
Last year, we said we delivered performance for clients and invested for future growth. What further progress have we made in 2015?
2015 has been a productive year for Henderson. Our recent organic investments and acquisitions are performing well. Overall, 2015 was a year of delivery.
Roger Thompson
Note:
1.
18 Henderson Group plc Annual Report 2015
For
per
sona
l use
onl
y

Net FX
31 Dec 15
46,007 8,032 2,285 591 56,91535,155 510 963 35,070
Total 81,162 8,542 3,248 (967) 91,985
Retail 8,0321,2614,3282,291
152Institutional 510Total 8,542
2015 movements in AUM (£bn)
100
0
20
40
60
80
1 Jan 15 Market/FX 31 Dec 15
3.281.2
8.5 (6.8) 5.91 92.0
Note:
1.
19Henderson Group plc Annual Report 2015
Strategic reportStrategic report
For
per
sona
l use
onl
y

Income drivers2015
£m2014
£m
Income
468.3 403.598.7 82.834.8 32.5
Net fee income from continuing operations 601.8 518.8
(0.2) 5.117.3 10.1
Net income from continuing operations 618.9 534.0
Management fees and fee margins
Performance fees
Performance fees
SICAVs 48%
Offshore Absolute Return 25%
UK OEICs & Unit Trusts 12%
Investment Trusts 10%
Segregated Mandates 4%
Other 1%
Other income and income from associates and joint ventures
Expense drivers2015 £m
2014 £m
Expenses99.9 88.4
168.7 143.6268.6 232.0118.2 102.6
Total operating expenses from continuing operations 386.8 334.6
12.1 11.6Total expenses from continuing operations 398.9 346.2
Total operating expenses
20 Henderson Group plc Annual Report 2015
For
per
sona
l use
onl
y

Finance income and expenses
Acquisition related and non-recurring items
Australian acquisitions
Tax
Liquidity and capital management
Dividend
Share buyback
21Henderson Group plc Annual Report 2015
Strategic reportStrategic report
For
per
sona
l use
onl
y

DIS
CIP
LIN
E A
ND
RE
SPO
NSI
BILI
TY
22 Henderson Group plc Annual Report 2015
For
per
sona
l use
onl
y

Developments in 2015
Capital position
Risk management
The primary purpose of the Risk and Compliance functions is to assist Henderson in achieving its strategic objectives by “doing the right business
Market and liquidity risks, cyber risks and the intensity of regulatory change were key themes in the year.
Chris Chaloner
Strategic reportStrategic report
23Henderson Group plc Annual Report 2015
For
per
sona
l use
onl
y

Risk management framework
•
• Trust
•
•
•
•
•
•
Three lines of defence
Henderson Group plc Board
Chief Executive & management
Risk & Compliance
Board Risk Committee Audit Committee
Internal Audit
2nd line of defence1st line of defence 3rd line of defence
24 Henderson Group plc Annual Report 2015
For
per
sona
l use
onl
y

Henderson’s Assurance function
Viability statement
•
•
•
•
Strategic reportStrategic report
25Henderson Group plc Annual Report 2015
For
per
sona
l use
onl
y

Strategic priorities and associated principal risks:Expand our global investment offering to meet the current and future needs of our clients
Investment performance
Market Liquidity Key personnel
Des
crip
tion
•
•
•
•
•
•
•
Tren
ds in
201
5
•
•
•
•
•
2015.
•
•
Miti
gatio
n
•
•
•
•
•
•
•
•
•
•
•
•
•
•
•
•
•
•
•
Prio
ritie
s in
201
6
•
• related trends and
•
•
Henderson funds.•
•
•
•
•
•
•
•
Reputational risk:
26 Henderson Group plc Annual Report 2015
For
per
sona
l use
onl
y

Strategic priorities and associated principal risks:
Diversify our business
Acquisitions and divestments
Strategic Operational, IT and legal Regulatory change
•
•
•
•
•
•
•
Description
•
•
•
•
•
•
•
•
•
•
Trends in 2015
•
•
•
•
•
•
•
•
•
•
•
•
•
•
•
Mitigation
•
•
•
•
•
•
•
•
•
•
•
Priorities in 2016
Strategic reportStrategic report
27Henderson Group plc Annual Report 2015
For
per
sona
l use
onl
y

EXPE
RTIS
E A
ND
A
WA
REN
ESS
28 Henderson Group plc Annual Report 2015
For
per
sona
l use
onl
y

Our clients and their end customers
Our resources, relationships and responsibilities
Collaboration
Conviction
Responsibility
For a deeper understanding of the value creating components of our business, read the following sections:
Resources, relationships and responsibilities
and relationships – our core investment management capabilities including risk management; client relationships and brand; and the talented people we employ throughout our business.
Here, we give further insight into how these resources and relationships generate value for our clients and shareholders.
Investment management capabilities
Client relationships and brand
People
Corporate Responsibility
Our mission
Outcomes
Strategic reportStrategic report
29Henderson Group plc Annual Report 2015
For
per
sona
l use
onl
y

2015 highlights •
•
•
•
•
Breadth and depth
Balancing organic growth and acquisitions
Core investment management capabilities
Last year, we explained that our investment teams operate in an environment that balances independence of thought and process with strong governance and an impactful Risk team.
Our focus is on maintaining investment performance, strengthening the support framework for fund managers and continuing to increase the breadth and depth of Henderson’s investment capabilities.
30 Henderson Group plc Annual Report 2015
For
per
sona
l use
onl
y

Established and developing teams
Future focus: opportunities and challenges
Investment management capabilities
Investment performance
AUM 31 Dec 2015 (£bn) 1 1
20.4
28.2
24.8
4.9
13.7
Total 92.0Notes:
1.
•
Alternatives £13.7bn
Global Fixed Income £24.8bn
European Equities £20.4bn
Global Equities £28.2bn
Multi-Asset £4.9bn
Total AUM£92.0bn
Strategic reportStrategic report
31Henderson Group plc Annual Report 2015
For
per
sona
l use
onl
y

What differentiates the European Equities team? Breadth and experience
Products that meet different investors’ needs
What were the highlights of 2015?Strong performance and client demand
Client communication
Awards
Henderson European Focus Fund:
Henderson Horizon Euroland Fund:
Henderson Gartmore Continental European Fund:
What developments are you most excited about for 2016?Reaping dividends
Bringing through young talent
European Equities
European Equities AUM
£20.4bn
remains as important as ever for European equity investors, especially this late in the economic cycle.”
John Bennett
32 Henderson Group plc Annual Report 2015
For
per
sona
l use
onl
y

Global Equities
What are the key elements of the Henderson Global Equities capability?
What have been the highlights in 2015?
What are you most excited about seeing develop in 2016 and beyond?
Global Equities AUM
Global Equity Income – growing demand
Our diverse range of strategies means that we are able to offer investment products that not only serve local markets but have global appeal.”
Graham Kitchen
£28.2bn
Strategic reportStrategic report
33Henderson Group plc Annual Report 2015
For
per
sona
l use
onl
y

£24.8bn
Pension partnership
What differentiates the Henderson Global Fixed Income offering?
Is client interaction a key part
What have been the highlights of 2015?
Have there been any disappointments?
What are you most excited about seeing develop in 2016 and beyond?
Global Fixed Income
Global Fixed Income AUM
opportunities and as an active manager you have to look at that with enthusiasm.”
Phil Apel
34 Henderson Group plc Annual Report 2015
For
per
sona
l use
onl
y

Multi-Asset AUM
£4.9bn
Multi-Asset
What differentiates the Henderson Multi-Asset team?
What have been the highlights of 2015?
What are you most excited about seeing develop in 2016 and beyond?
There is a greater appreciation today for something that aims to deliver income while also respecting investors’ need for their capital to be managed effectively.”
Bill McQuaker
Strategic reportStrategic report
35Henderson Group plc Annual Report 2015
For
per
sona
l use
onl
y

Alternatives AUM
£13.7bn
Absolute return equity
UK commercial property
Commodities
Alternatives
With investors generally cautious on market direction, absolute return investing has
falling markets and its focus on risk control.”
Luke Newman
36 Henderson Group plc Annual Report 2015
For
per
sona
l use
onl
y

LOC
AL
KNO
WLE
DG
E A
ND
TEA
MW
ORK
Strategic reportStrategic report
37Henderson Group plc Annual Report 2015
For
per
sona
l use
onl
y

Client relationships and brand
Meeting client expectations
Knowledge. Shared
Phil Wagstaff
For us, the focus is on excellence in client service and the establishment of long-standing relationships built upon trust.
Distribution has a pivotal role to play in delivering on the Henderson mission. Last year, we outlined the importance of putting our clients’ needs at the heart of everything we do. In 2015, we made progress against this goal.
Traditional marketing is increasingly being replaced by thought leadership. People buy people. The market doesn’t want product push – it wants genuine insight from investment experts at the top of their game. Knowledge. Shared speaks to this need.”
Gurjit Dehl
38 Henderson Group plc Annual Report 2015
For
per
sona
l use
onl
y

Broadening our global reach
What have been the key changes in Distribution through 2015?
road ahead.
How aligned is Henderson’s distribution model with client needs?
‘Institutionalisation’ and globalisation
Strategic reportStrategic report
39Henderson Group plc Annual Report 2015
For
per
sona
l use
onl
y

Tailored approach
How does Distribution ensure the products offered are well suited to Henderson’s clients?
Knowledge. Shared
What our clients say to us is as important as what we say to them.”
Rob Page
Knowledge. Shared in practiceKnowledge. Shared
40 Henderson Group plc Annual Report 2015
For
per
sona
l use
onl
y

We deal with an ever growing quantity of information and this makes timely and accurate reporting from clients like Henderson increasingly important. This is addressed by the Knowledge. Shared approach.”
Helen Marino
Our winner in this category developed a campaign based on education and the sharing of knowledge. The judges were extremely taken by the open approach, the quality of materials off and on line, and the core idea which spoke of transparency and a genuine collegiate approach – helping to position the brand clearly without relying on transient performance claims.”
Lawrence Gosling
In my 30 years in the business, I have never seen a company that produces high quality marketing materials as consistently as Henderson.”
Lawrence Andrews A brand built with our clients, for our clients
Knowledge. Shared
Knowledge. Shared
Thinking outside the box
Knowledge.
Shared.
Strategic reportStrategic report
41Henderson Group plc Annual Report 2015
For
per
sona
l use
onl
y

Our people: our greatest asset
Focusing on talent development and succession
Knowledge. Shared
Employee training attendance
498 courses attended by employees
Last year, we said that our people are set apart by their dedication to working together, across the globe, to provide an excellent service to our clients. As we expanded our business this year, what changed?
In 2015, as we became more global, we built out our culture of collaboration, with clients at the centre of everything we do.
Kathleen Reeves
42 Henderson Group plc Annual Report 2015
For
per
sona
l use
onl
y

Remuneration
Employee Engagement Survey
Length of service
17% employees for 10 years or more
Diversity and inclusion
Gender diversity
All employees
ExCo
Group Board
SubsidiaryBoards
35%(356)
65%(660)
11%(1)
89%(8)
33%(3)
67%(6)
18%(10)
82%(45)
Women Men
Priorities in 2016
Strategic reportStrategic report
43Henderson Group plc Annual Report 2015
For
per
sona
l use
onl
y

Corporate responsibility
How are your CR initiatives linked to the corporate strategy?
Responsible Investment:
Clients:
Environment:
Community:
People:
What progress have you made and what are your priorities going forward?
Last year, we noted our commitment to act responsibly, not only in the way we invest and engage with our clients, but also in terms of supporting our people, managing our impact on the environment and contributing to the communities of which we are part.
Corporate responsibility (CR) has intrinsic value to Henderson.
Roger Thompson
44 Henderson Group plc Annual Report 2015
For
per
sona
l use
onl
y

Aims and objectives
•
•
•
•
•
Progress in 2015•
•
•
•
•
Responsible Investment
Aims and objectives
•
•
•
•
Progress in 2015
•
•
•
•
Monitoring performanceCustomer Interests Staff Survey•
Customer satisfaction studies
UK Retail•
•
EMEA Institutional•
US Wholesale•
Clients
Henderson’s voting record
95%
2012 2013 2014 2015
56%
91% 94% 95%
Strategic reportStrategic report
45Henderson Group plc Annual Report 2015
For
per
sona
l use
onl
y

Aims and objectives
• 2
• and the ASX 200
•
Progress in 2015
2
Over 25,000 tCO2e offset since 2005
Environment
CDP ratings
Henderson Henderson
FTSE 100 FTSE 250
2015 99 B2014 97 A
GHG emissions by scope (tCO2e)
2015 2014
Scope 1– 12
Scope 22,148 2,053
Scope 33,380 2,661
Hotels 218 21845 49
3,643 2,928Total GHG emissions 5,8001 4,993Total per employee 5.56 4.82
Note:
1. 2
500
0
1,000
1,500
2,000
2,500
3,000
3,500
0
8
6
2
4
10
12
14
Tota
l Gro
up (t
CO
2e)
Regional GHG emissions: total Group (tCO2e)
Ave
rage
per
em
ploy
ee (t
CO
2e)
2014 20142015 2015
Regional GHG emissions: average per employee (tCO2e/FTE)
GHG emissions by region and per employee (tCO2e)
United StatesUKEurope (ex-UK)
46 Henderson Group plc Annual Report 2015
For
per
sona
l use
onl
y

Aims and objectives
•
•
Progress in 2015•
•
•
•
•
Monitoring performance
89% employee engagement
People
Aims and objectives
Knowledge.Shared
•
•
Progress in 2015• Knowledge. Shared
•
•
•
•
•
•
Henderson Foundation charitable spend
£175,444
Community
Strategic reportStrategic report
47Henderson Group plc Annual Report 2015
For
per
sona
l use
onl
y

Contents
CO
RPO
RATE
G
OV
ERN
AN
CE
48 Henderson Group plc Annual Report 2015
For
per
sona
l use
onl
y

Richard Gillingwater
Chairman’s introduction
We continue to have in place a robust governance framework that underpins and enables us to deliver on our strategy and support our business model.
Richard Gillingwater
Strategic reportGovernance
49Henderson Group plc Annual Report 2015
For
per
sona
l use
onl
y

Board of Directors and leadership
The Board comprises a Non-Executive Chairman, two Executive Directors and six other Non-Executive Directors.
Left to right: Kevin Dolan, Richard Gillingwater, Andrew Formica, Kalpana Desai, Robert Jeens, Roger Thompson, Sarah Arkle, Angela Seymour-Jackson and Tim How
50 Henderson Group plc Annual Report 2015
For
per
sona
l use
onl
y

Strategic reportGovernance
51Henderson Group plc Annual Report 2015
For
per
sona
l use
onl
y

Richard Gillingwater
Experience:
1:
Committee membership: • •
Andrew Formica
Experience:
1: 2
External appointments:
Committee membership:•
Roger Thompson
Experience:
1: 2
External appointments:
Committee membership: •
Sarah Arkle
Experience:
1:
External appointments:
Committee membership: • • • •
Kalpana Desai
Experience:
External appointments:
1:
Committee membership: • • • •
52 Henderson Group plc Annual Report 2015
For
per
sona
l use
onl
y

Kevin Dolan
Experience:
1:
External appointments:
Committee membership: • • • •
Tim How
Experience:
1:
External appointments:
Committee membership: • • • •
Robert Jeens
Experience:
1:
External appointments:
Committee membership: • • • • •
Angela Seymour-Jackson
Experience:
1:
External appointments:
Committee membership: • • • •
Notes:
1.
2.
Strategic reportGovernance
53Henderson Group plc Annual Report 2015
For
per
sona
l use
onl
y

Strategy
Strategy day
•
•
•
•
•
Board visit to Chicago
•
•
•
Board business
of the Board.
Governance
Strategy, governance structure and Board business
Read the Matters reserved to the Board on our Group website
Governance structure Henderson Group plc
Board
Code Staff
Other
54 Henderson Group plc Annual Report 2015
For
per
sona
l use
onl
y

2015 Director attendance at Board and Committee meetings
Board
Notes:
•
•
January•
90 West
•
•
February•
90 West
•
•
•
•
•
•
•
•
•
•
•
April•
•
•
•
•
•
•
•
•
June•
•
•
•
•
July•
•
•
•
•
•
•
•
•
•
•
•
October•
•
•
•
•
•
•
•
•
•
December•
•
•
•
•
•
•
•
•
An overview of the topics addressed by the Board in 2015
Strategic reportGovernance
55Henderson Group plc Annual Report 2015
For
per
sona
l use
onl
y

Governance
Training
Board evaluation reviewEvaluation of the Board’s performance
Board skills
Finance
Risk
Effectiveness
56 Henderson Group plc Annual Report 2015
For
per
sona
l use
onl
y

Nomination Committee report
•
•
•
•
•
Richard Gillingwater
The executive succession plan was revised and extended to include key roles below ExCo.
Membership•
•
•
•
•
•
•
Richard Gillingwater
Role of the Nomination Committee Read more information on our Group website
Strategic reportGovernance
57Henderson Group plc Annual Report 2015
For
per
sona
l use
onl
y

Board gender balance (%)
Board split
Tenure of Non-Executive Directors
Female
Executive Director
6+ years
3 – 6 years
1 – 3 years
Diversity
Succession planning and talent management
•
•
•
•
•
•
33
67
6
2
1
2
3
2
58 Henderson Group plc Annual Report 2015
For
per
sona
l use
onl
y

Risk management and Internal control
and accounts.
•
•
•
Governance
Accountability
Strategic reportGovernance
59Henderson Group plc Annual Report 2015
For
per
sona
l use
onl
y

Board Risk Committee report
Membership•
•
•
•
•
Our strategic objectives and the key risks to our strategy and business model are interconnected.
Sarah Arkle
60 Henderson Group plc Annual Report 2015
For
per
sona
l use
onl
y

Sarah Arkle
Role of the Board Risk CommitteeThe purpose of the Board Risk Committee is to assist the Board in the oversight of risk. The Committee also looks to identify any forward looking and emerging risks that relate to the industry or
these risks and look at mitigating actions on an ongoing basis.
Read more information on our Group website:
Henderson Group plc
Board
Risk control environment
Strategic reportGovernance
61Henderson Group plc Annual Report 2015
For
per
sona
l use
onl
y

Audit Committee report
Reliability and appropriateness of the Group’s
Membership•
•
•
•
The Company has in place arrangements to ensure that the Annual Report, taken as a whole, is fair, balanced and understandable.
Robert Jeens
62 Henderson Group plc Annual Report 2015
For
per
sona
l use
onl
y

Disposal of the investment in TH Real Estate
Acquisition of Perennial
Role of the Audit Committee
Read more information on our Group website:
Matters considered when
reviewing the Annual Report
Strategic reportGovernance
63Henderson Group plc Annual Report 2015
For
per
sona
l use
onl
y

Review of internal controls
External auditors and auditor independence
Review of external auditors
•
•
•
•
•
64 Henderson Group plc Annual Report 2015
For
per
sona
l use
onl
y

Internal audit and external review
•
•
•
•
•
Robert Jeens
Strategic reportGovernance
65Henderson Group plc Annual Report 2015
For
per
sona
l use
onl
y

Henderson shareholder base (%)
97
Total Institutional
Total Retail
3
Henderson shareholder base (%)
47
ASX listing
LSE listing
53
Relations with shareholders
66 Henderson Group plc Annual Report 2015
For
per
sona
l use
onl
y

Directors’ remuneration report
Annual Statement from the Chairman
•
•
•
•
•
•
•
•
•
Note:
2015 performance and key pay outcomes
Membership•
•
•
•
Exceptional company performance over the past three years has resulted in strong reportable reward outcomes
is the cornerstone of our remuneration policy.
Tim How
Strategic reportGovernance
67Henderson Group plc Annual Report 2015
For
per
sona
l use
onl
y

Performance against indices/peer groups in the period 2013 – 2015 (%)1
Henderson
2
FTSE 350 161.7 45.5 92.6
FTSE 350 General 3
161.7 78.6 88.4
ASX 100 244.8 41.0 99.0
Period 2011 – 2015
FTSE 350 General
4
184.3 80.3 87.0
•
•
•
•
1,3
•
1,4
•
•
•
•
•
•
68 Henderson Group plc Annual Report 2015
For
per
sona
l use
onl
y

Key pay decisions for 2016•
•
•
•
•
Notes:
1.
2.
3.
Tim How
2015201420152014
Fixed
STI
LTIP
Other
0
2,000
4,000
6,000
8,000
£’000
Andrew Formica Roger Thompson
2015
42%
58%
37%
63%
2014
Fixed
STI
LTI (face value at award) Other
Growth/dividends
Andrew Formica
0
2,000
4,000
6,000
8,000
£’000
Proportion of LTIP relating to share price growth/dividends
Strategic reportGovernance
69Henderson Group plc Annual Report 2015
For
per
sona
l use
onl
y

Directors’ remuneration report
At a glanceThe Directors’ remuneration policy was approved by shareholders at the AGM in April 2015 and will remain in force until 2018 unless material changes are proposed in the intervening period. For ease of reference, a summary of the Company’s key remuneration principles and remuneration elements is set out below.
Remuneration principles
•
•
•
•
•
Base pay
Pension
Short-Term Incentive (STI) plan
Long-Term Incentive Plan (LTIP)
Our performance The key performance outcomes which have been taken into account in the assessment of performance and reward for our Executive Directors are as follows (further details are provided on pages 73 to 79):
70 Henderson Group plc Annual Report 2015
For
per
sona
l use
onl
y

Henderson vs FTSE General Financials TSR 2013-2015 (%)
250
150
200
100
50
0
-50
210186 181
162 156 150 141127
102 102 95 90 84 83 75 74 73 72 71 65
27 23 -13-18
-4
48
S&U
Lond
on S
tock
ex.G
roup
Prov
iden
t Fin
anci
alH
ende
rson
Gro
upM
an G
roup
3I G
roup
Har
grea
ves
Lans
dow
n
Inte
rmed
iate
Cap
ital G
P.C
harle
s Ta
ylor
IG G
roup
Hol
ding
sIC
APS
chro
ders
Rat
hbon
e B
roth
ers
Jupi
ter F
und
Man
agem
ent
Tulle
tt Pr
ebon
City
of L
ondo
n In
v. G
P.
Clo
se B
roth
ers
Gro
upIP
Gro
upSV
G C
apita
lB
rew
in D
olph
in
Para
gon
GP.
of C
os.
Inve
stec
F&C
Ass
et M
anag
emen
tC
amel
liaAb
erde
en A
sset
Man
Ashm
ore
Gro
up
Inte
rnat
iona
l PS
NL.
Fin
.
-17
•
•
•
•
shareholders
•
Henderson vs ASX 100 TSR 2013-2015 (%)
250
150
200
50
100
0
-50
-100
top 101 20 to 1001
248 245
182 174 169 162 161134 127 121
95
64 53 44 33
-29-51
-90
10
Aris
tocr
at L
eisu
reH
ende
rson
Gro
up c
di.
Cha
lleng
erQ
anta
s Ai
rway
sM
acqu
arie
Gro
upR
amsa
y H
ealth
Car
eH
arve
y N
orm
an
Hol
ding
sS
eek
Ban
k of
QLN
D.
Toll
Hol
ding
s -
del
ist.2
9/05
/15
Trea
sury
Win
e Es
tate
sFl
ight
Cen
tre
Trav
el g
p.W
estp
ac B
anki
ngD
uet G
roup
Alum
ina
Dea
d - d
elis
t.O
rica
Reg
is
Res
ourc
esAr
rium
Note:
1.
STI performance measuresFinancial
2Actual
3
1
1
1
1.
2.
3.
Strategic reportGovernance
71Henderson Group plc Annual Report 2015
For
per
sona
l use
onl
y

Directors’ remuneration report
Annual report on remuneration
Role and membership of the Remuneration Committee
•
•
•
•
External advisers
Contents
72 Henderson Group plc Annual Report 2015
For
per
sona
l use
onl
y

Total remuneration
STI LTI Other Total
2015 2014 2015 2014 2015 2014 2015 2014 2015 2014 2015 2014 2015 2014
420 403 5 3 37 18 1,560 1,650 4,427 2,176 20 65 6,469 4,315338 330 2 1 27 15 650 650 1,058 741 7 3 2,082 1,740
Notes:
•
•
•
•
•
•
•
•
•
does not need to be restated.
Fees
2015 2014 2015 2014
Chairman200 200 3 4
Other Non-Executive Directors90 90 0 170 70 7 7
103 103 0 093 93 0 070 66 3 118 7
Note:
•
Pension entitlements and contributions
Strategic reportGovernance
73Henderson Group plc Annual Report 2015
For
per
sona
l use
onl
y

STI for the year ended 31 December 2015
Financial performance
1
Strategic and personal contributions
•
•
•
•
•
•
•
•
•
•
•
•
•
•
•
•
•
•
Note:
1.
74 Henderson Group plc Annual Report 2015
For
per
sona
l use
onl
y

Strategic contribution Achievement
Personal contribution Personal contribution
Strategic reportGovernance
75Henderson Group plc Annual Report 2015
For
per
sona
l use
onl
y

Weighting
25.0%
25.0%
50.0%
5%
5%
0.5%
70%
6%
n/a
n/a
5%
2.1%
16.1%
0.5%
81.5%
15.0%
n/a
n/a
16.6%
Performance 2015 – Chief Executive
Achievementvs max
Weightedachievement
vs max
Contribution to bonus
(% of salary)
42.8%
80.3%
83.2%
49.8%35.9%(out of
maximum of 50%)
179.7%
75.6%
78.5%
78.0%
75.0%
19.5% (25%)18.8% (25%)
74.2%
97.5%
93.8%
370.9%
Target (50% of maximum)
Actual outcome Threshold Maximum
0 25 50 75 100
ROE growth
Management fee growth
Operating margin growth
Investment performance
Flows
Strategic objectives
Personal objectives
Target
•
•
at its discretion.
Weighting
25.0%
25.0%
50.0%
5%
5%
0.5%
70%
6%
n/a
n/a
5%
2.1%
16.1%
0.5%
81.5%
15.0%
n/a
n/a
16.6%
Target (50% of maximum)
Actual outcome
Achievementvs max
Weightedachievement
vs max
Contribution to bonus
(% of salary)
42.8%
80.3%
83.2%
49.8%35.9% 107.8%
75.6%
78.5%
78.0%
76.0%
74.4%
58.5%
57.0%
223.3%
19.5% (25%)19.0% (25%)
(out of maximum of 50%)
Threshold Maximum
0 25 50 75 100
ROE growth
Management fee growth
Operating margin growth
Investment performance
Flows
Strategic objectives
Personal objectives
Target
•
•
at its discretion.
achieved, is set out in the tables above.
76 Henderson Group plc Annual Report 2015
For
per
sona
l use
onl
y

Deferred
Total Cash
1 Funds2
1,560.0 850.0 710.0650.03 395.0 127.5 127.5
Notes:
1.
2.
3.
LTI vesting in respect of performance periods ended in 2015
Actual
90th
accrued on
1,050,000 1,029,000 21,000 2.88 2,966 259 3,225350,000 343,000 7,000 2.88 989 69 1,058
Note:
•
Strategic reportGovernance
77Henderson Group plc Annual Report 2015
For
per
sona
l use
onl
y

LTI awards made during 2015
•
•
•
•
•
at threshold
2.793 751,879 2,100
2.793 354,457 990
Notes:
•
•
•
•
Year-on-year percentage increase in the remuneration of the Chief Executive
STI
Notes:
•
•
•
78 Henderson Group plc Annual Report 2015
For
per
sona
l use
onl
y

Total Shareholder Return (TSR) performance
0
200
400
600
£
Henderson
2010 2011 2012 2013 2015201420092008
FTSE 350 General Financial Services Index
Total Shareholder Return
Chief Executive remuneration over last seven years
2009 2010 2011 2012 2013 2014 2015
2,205 3,516 6,420 2,802 4,989 4,315 6,46974%98%
Relative importance of the spend on pay
2014 2015 £m
1 233.4 273.0 17101.8 116.0 14
2 126.9 161.2 27
Notes:
•
•
How the policy will be applied in 2016Base salary
2015 2016 Increase
£432,500£350,000
Strategic reportGovernance
79Henderson Group plc Annual Report 2015
For
per
sona
l use
onl
y

Fees for the Board Chairman and other Non-Executive Directors
•
•
Board Base fee
Total 2015
Proposed Total 2016
Chairman200,000 200,000 220,000
Other Non-Executive Directors60,000 20,000 10,000 90,000 96,50060,000 10,000 70,000 74,00060,000 12,500 20,000 10,000 102,500 109,00060,000 22,500 10,000 92,500 99,00060,000 10,000 70,000 74,00060,000 10,000 70,000 74,000
Total 200,000 360,000 12,500 62,500 60,000 695,000 746,500 3.7%Other Non-Executive Directors only 3.2%
Notes:
•
•
•
Performance targets for STI and LTI awards to be granted in 2016
1
• 2
•
•
•
•
Notes:
80 Henderson Group plc Annual Report 2015
For
per
sona
l use
onl
y

•
•
Note:
•
Strategic reportGovernance
81Henderson Group plc Annual Report 2015
For
per
sona
l use
onl
y

Outstanding LTI and other share scheme awards
General
Interest at
1,050,000 790,000 751,879 2,591,879350,000 372,500 354,457 1,076,957
Notes:
•
•
Interest at
2014
Interest at
2015
SAYE 13,941 3,964 9,736 8,169BAYE Shares 57,477 4,001 61,478
Shares 410,542 102,635 307,905 205,272 3,240,000 751,879 602,000 798,000 2,591,879
2,866,7986,721,414
Total interests in Group shares 9,588,212
BAYE Shares 2,961 2,127 5,088 722,500 354,457 1,076,957
Shares 37,549 44,289 12,516 69,322SAYE 8,411 8,411
1,159,778188,239
Total interests in Group shares 1,348,018
82 Henderson Group plc Annual Report 2015
For
per
sona
l use
onl
y

19,357 46542 2
Note:
•
Shares personally held
31 Dec 2015(or date of appointment)
31 Dec 2014
Executive Directors6,721,414 6,721,414 6,721,249
188,239 188,239 181,606Chairman and Non-Executive Director
15,000 15,000 15,000Other Non-Executive Directors
20,663 20,663 20,6633,083 3,083 3,083
11,780 11,780 11,78014,694 14,694 14,69411,082 11,082 11,082
–Total 6,985,855 6,985,855 6,979,157
Payments within the year to past Directors
Shares
193,500 19,585 71,903
256,500
578,017 55,941
236,076
Shares
Shares Shares
6,979 113,268 143,333 20,680
190,000
16,952 269,888 412,626 59,068
Shares
Shares
5,177 144,093 215,000
10,283
285,000
14,100 226,815 618,940
29,371
Strategic reportGovernance
83Henderson Group plc Annual Report 2015
For
per
sona
l use
onl
y

External directorships
Statement of shareholder voting
664,781,669 561,937,891 672,179,298 698,574,933123,355,647 216,129,042 115,986,335 79,883,565
1,616,979 1,621,804789,754,295 778,066,933 789,769,437 778,458,498
737,070 13,254,986 721,148 12,794,480
•
•
84 Henderson Group plc Annual Report 2015
For
per
sona
l use
onl
y

Compliance with the UK Corporate Governance Code
A. Leadership
A.1 The role of the Board
A.2 Division of responsibilities
A.3 The Chairman
A.4 Non-Executive Directors
B. Effectiveness
B.1 The composition of the Board
B.2 Appointments to the Board
B.3 Commitment
B.4 Development
Compliance statements and application of principles and recommendations
Strategic reportGovernance
85Henderson Group plc Annual Report 2015
For
per
sona
l use
onl
y

B.5 Information and support
B.6 Evaluation
B.7 Re-election of Directors
C. Accountability
C.1 Financial and business reporting
C.2 Risk management and internal control
C.3 Audit Committee and auditors
D. Remuneration
D.1 The level and components of remuneration
D.2 Procedure
E. Relations with shareholders
E.1 Dialogue with shareholders
E.2 Constructive use of General Meetings
86 Henderson Group plc Annual Report 2015
For
per
sona
l use
onl
y

Compliance with the ASX Corporate Governance Principles and RecommendationsPrinciple 1 – Lay solid foundations for management and oversight
1.1 Role of the Board and delegation of responsibilities
1.2 Appropriate checks undertaken when appointing Directors and information relevant to the appointment of Directors
1.3 Terms of appointment
1.4 The Company Secretary
1.5 Diversity policy and objectives
1.6 Evaluation of the Board
1.7 Evaluation of senior executives
Principle 2 – Structure the board to add value
2.1 Nomination Committee
2.2 Board skills matrix
2.3 Independence of Directors
2.4 A majority of the board of a listed entity should be independent directors
2.5 Independence of the Chairman
2.6 Induction and training
Principle 3 – Act ethically and responsibly
3.1 Code of Conduct
Principle 4 – Safeguard integrity in corporate reporting
4.1 Audit Committee
4.3 External auditors and AGM
Strategic reportGovernance
87Henderson Group plc Annual Report 2015
For
per
sona
l use
onl
y

Principle 5 – Make timely and balanced disclosure
5.1 Market Disclosure Policy
Principle 6 – Respect the rights of security holders
6.1 Online information
6.2 Investor Relations programme
6.3 Policies and processes to facilitate and encourage participation at meetings of security holders
6.4 Electronic communications
Principle 7 – Recognise and manage risk
7.1 Board Risk Committee
7.2 Risk Management Framework
7.3 Internal Audit Function
7.4 Risks and Sustainability
Principle 8 – Remunerate fairly and responsibly
8.1 Remuneration Committee
8.2 Remuneration Policies and Practices
8.3 Share Trading Policy
88 Henderson Group plc Annual Report 2015
For
per
sona
l use
onl
y

Reporting
Management report
Branches
Directors
Powers
Appointment/removal of Directors
of shareholders.
Political donations
Rounding
Annual General Meeting
Share capital and structure
Substantial shareholdings
shares
58,098,373 5.0957,201,717 5.01
56,136,581 4.92
55,342,341 4.8849,005,304 4.4034,461,477 3.04
Employee share schemes
Restrictions on voting rights
Directors’ report
21145
13746
Strategic reportGovernance
89Henderson Group plc Annual Report 2015
For
per
sona
l use
onl
y

Amendment to the Articles of Association of the Company
New issues of share capital and disapplication of pre-emption rights
Purchase of own share capital
Independent auditors
Financial reporting and going concern
Richard Gillingwater Andrew Formica
90 Henderson Group plc Annual Report 2015
For
per
sona
l use
onl
y
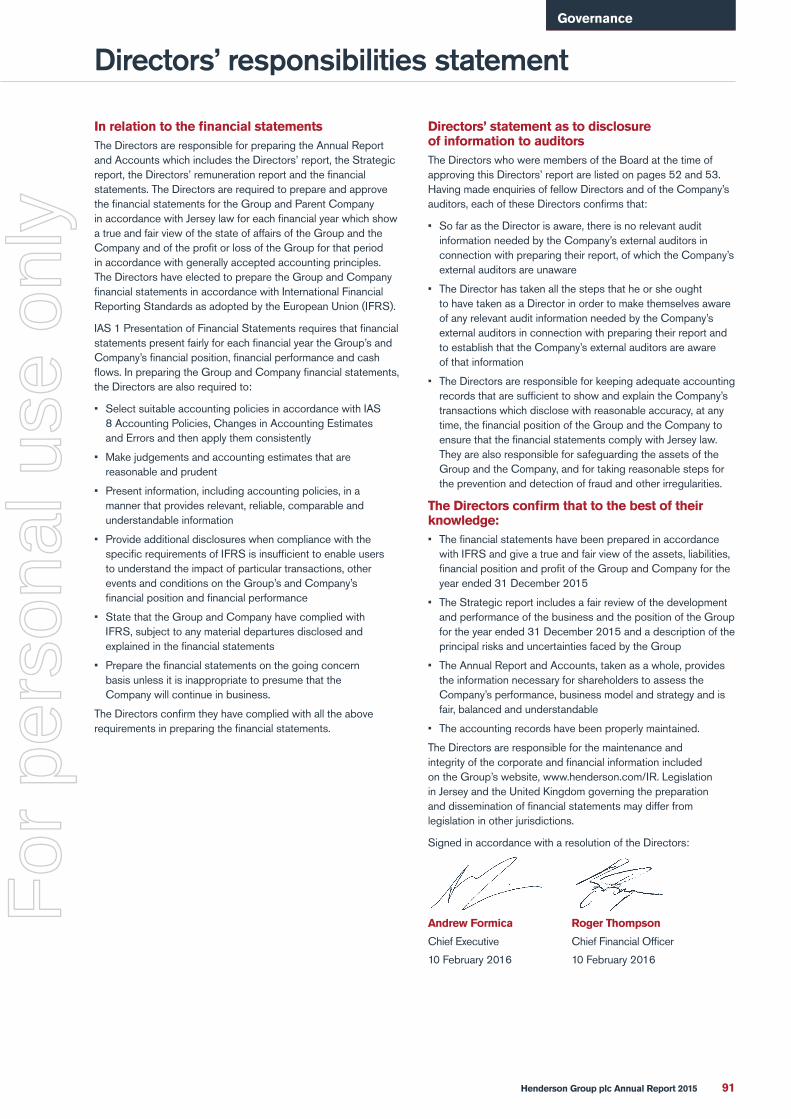
Directors’ responsibilities statement
•
•
•
•
•
•
Directors’ statement as to disclosure of information to auditors
•
•
•
knowledge:•
•
•
•
Andrew Formica Roger Thompson
Strategic reportGovernance
91Henderson Group plc Annual Report 2015
For
per
sona
l use
onl
y

Independent auditors’ report
Our opinion
•
•
•
What we have audited
•
•
•
•
•
Our audit approachContext
Materiality –
Scope –
–
–
Non-recurring areas of focus
–
–
Recurring areas of focus
–
–
The scope of our audit and our areas of focus
due to fraud.
92 Henderson Group plc Annual Report 2015
For
per
sona
l use
onl
y

Non-recurring areas of focus
Disposal of the investment in the TH Real Estate joint venture
–
–
Acquisition of Perennial business
–
–
–
Strategic reportGovernance
93Henderson Group plc Annual Report 2015
For
per
sona
l use
onl
y

Acquisition of Perennial business continued
94 Henderson Group plc Annual Report 2015
For
per
sona
l use
onl
y

Recurring areas of focus
Recognition of management fees and performance fees
Strategic reportGovernance
95Henderson Group plc Annual Report 2015
For
per
sona
l use
onl
y

How we tailored the audit scope
Materiality
Goodwill and intangible assets impairment review
–
–
–
96 Henderson Group plc Annual Report 2015
For
per
sona
l use
onl
y

Overall Group materiality
How we determined it
Rationale for benchmark applied
–
–
Going concern
Other required reportingConsistency of other informationUnder ISAs (UK and Ireland), we are required to report to you if, in our opinion:
–
–
–
The Directors’ assessment of the prospects of the Group and of the principal risks that would threaten the solvency or liquidity of the GroupUnder ISAs (UK and Ireland) we are required to report to you if we have anything material to add or to draw attention to in relation to:
Strategic reportGovernance
97Henderson Group plc Annual Report 2015
For
per
sona
l use
onl
y

Propriety of accounting records and information and explanations received
•
•
•
•
Corporate Governance statement
Other voluntary reportingOpinion on other matters
the auditOur responsibilities and those of the Directors
•
•
•
Parwinder Purewalfor and on behalf of PricewaterhouseCoopers LLP
Notes:
1.
2.
98 Henderson Group plc Annual Report 2015
For
per
sona
l use
onl
y

Contents
FIN
AN
CIA
L ST
ATE
MEN
TS
Strategic reportFinancial statements
99Henderson Group plc Annual Report 2015
For
per
sona
l use
onl
y

Financial statements
For the year ended 31 December 2015
2015 2014
Notes
Underlying
£m
Acquisition related and
non-recurring items (note 7)
£mTotal
£m
related and
Total
Income3 756.0 – 756.0 651.2 651.23 (154.2) – (154.2)
601.8 – 601.8 518.8 518.8
15.2 (0.2) (0.5) (0.7) 5.13 17.3 12.4 29.7 10.1 11.5 21.6
618.9 11.9 630.8 534.0 4.3 538.3Expenses
4.1 (381.6) (5.9) (387.5)(5.2) (56.2) (61.4)
(386.8) (62.1) (448.9)6 (12.1) (1.9) (14.0)
(398.9) (64.0) (462.9)
continuing operations 220.0 (52.1) 167.9 187.8 135.6(22.9) 16.2 (6.7) 11.9
continuing operations 197.1 (35.9) 161.2 167.2 126.9Discontinued operation
9.1 – – – 7.6 140.2 147.89.1 – – –
– – – 6.3 125.3 131.6
total operations 220.0 (52.1) 167.9 195.4 88.0 283.48 (22.9) 16.2 (6.7)
owners of the parent 197.1 (35.9) 161.2 173.5 85.0 258.5
parent arises from:161.2 126.9
– 131.6161.2 258.5
Basic and diluted earnings per share from continuing operations
10.3 14.7p10.3 14.1p
Basic and diluted earnings per share from total operations
10.4 14.7p10.4 14.1p
100 Henderson Group plc Annual Report 2015
For
per
sona
l use
onl
y

For the year ended 31 December 2015
Note2015
£m2014
161.2 258.5
8.8 0.1
0.5
14.8 3.5(9.6)
– 0.6– 0.1
21.2 (2.9) 17.6– 0.1
(0.1) 0.1Other comprehensive income after tax 11.5 13.5
Total comprehensive income after tax 172.7 272.0
Attributable to:164.0 273.6
8.7172.7 272.0
Strategic reportFinancial statements
101Henderson Group plc Annual Report 2015
For
per
sona
l use
onl
y
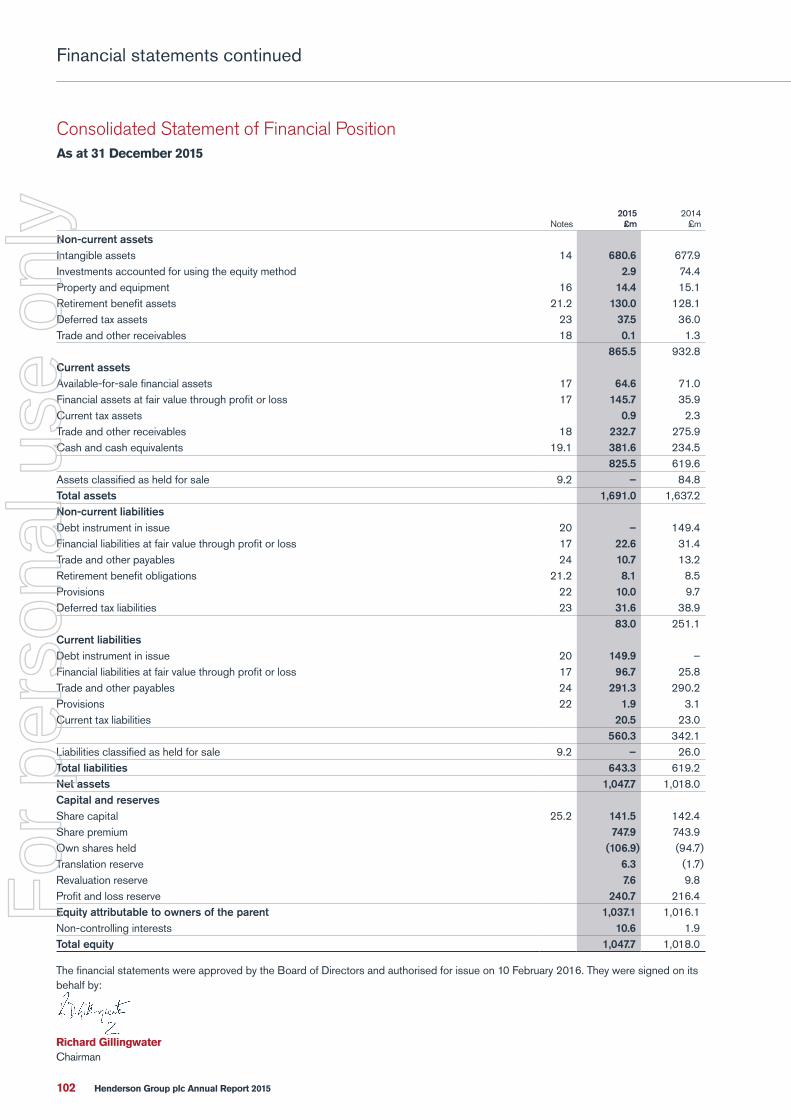
As at 31 December 2015
Notes2015
£m2014
Non-current assets14 680.6 677.9
2.9 74.416 14.4 15.1
21.2 130.0 128.123 37.5 36.018 0.1 1.3
865.5 932.8Current assets
17 64.6 71.017 145.7 35.9
0.9 2.318 232.7 275.9
19.1 381.6 234.5 825.5 619.6
9.2 – 84.8Total assets 1,691.0 1,637.2Non-current liabilities
20 – 149.417 22.6 31.424 10.7 13.2
21.2 8.1 8.522 10.0 9.723 31.6 38.9
83.0 251.1Current liabilities
20 149.917 96.7 25.824 291.3 290.222 1.9 3.1
20.5 23.0 560.3 342.1
9.2 – 26.0Total liabilities 643.3 619.2Net assets 1,047.7 1,018.0Capital and reserves
25.2 141.5 142.4747.9 743.9
(106.9)6.37.6 9.8
240.7 216.4Equity attributable to owners of the parent 1,037.1 1,016.1
10.6 1.9Total equity 1,047.7 1,018.0
Richard Gillingwater
102 Henderson Group plc Annual Report 2015
For
per
sona
l use
onl
y

For the year ended 31 December 2015
Share
Share
shares
held loss
Total
At 1 January 2014 140.4 708.6 0.1 10.7 41.9 832.3 4.0 836.3258.5 258.5 258.5
17.8 15.1 13.5
276.3 273.6 272.0
44.22.0 35.3 0.8 0.8
35.3 35.3 35.3
At 31 December 2014 142.4 743.9 9.8 216.4 1,016.1 1.9 1,018.0– – – – – 161.2 161.2 – 161.2
– – – 8.0 (2.2) (3.0) 2.8 8.7 11.5
– – – 8.0 (2.2) 158.2 164.0 8.7 172.7– – – – – (105.4) (105.4) – (105.4)
– – (63.0) – – – (63.0) – (63.0)– – 55.0 – – (55.0) – – –
0.2 4.0 (4.2) – – – – – –
– – – – – 39.2 39.2 – 39.2– – – – – 11.2 11.2 – 11.2
(1.1) – – – – (23.9) (25.0) – (25.0)At 31 December 2015 141.5 747.9 (106.9) 6.3 7.6 240.7 1,037.1 10.6 1,047.7
Strategic reportFinancial statements
103Henderson Group plc Annual Report 2015
For
per
sona
l use
onl
y

For the year ended 31 December 2015
Notes2015
£m2014
19.2 269.8 123.0
(37.8)
– – 104.7 – 84.3 13.7 – – 17.5 – 26.6 17.2 – 3.5 – – 0.4
1.6 3.8
– (26.4) – – – 16 (1.9) – 14 (6.0) – (2.6) – (4.0)
37.3 0.8
10.3 7.3(63.0)
12 (105.4)(10.9)21.5 16.6
(25.0)(172.5)
4.2Net increase in cash and cash equivalents 138.8 10.5
242.8 232.3Cash and cash equivalents at end of year 381.6 242.8
Reconciliation of cash and cash equivalents
Notes2015
£m2014
19.1 381.6 234.59.2 – 8.3
Total cash and cash equivalents 381.6 242.8
104 Henderson Group plc Annual Report 2015
For
per
sona
l use
onl
y

For the year ended 31 December 2015
Note2015
£m2014
277.0 98.4(4.8)
272.2 95.48 – 272.2 95.4
For the year ended 31 December 20152015
£m2014
272.2 95.4Total comprehensive income after tax 272.2 95.4
As at 31 December 2015
Notes2015
£m2014
Non-current assets15.1 1,029.8 1,030.8
1,029.8 1,030.8Current assets
18 8.8 2.617 41.7 34.6
19.1 7.2 7.3 57.7 44.5Total assets 1,087.5 1,075.3
Liabilities9.4 7.8
18.8 18.324 21.2 129.1
Total liabilities 49.4 155.2Net assets 1,038.1 920.1
Capital and reserves25.2 141.5 142.4
747.9 743.9(106.9)
255.6 128.5Total equity 1,038.1 920.1
Richard Gillingwater
Strategic reportFinancial statements
105Henderson Group plc Annual Report 2015
For
per
sona
l use
onl
y

For the year ended 31 December 2015
Share
Share held
Total
At 1 January 2014 140.4 708.6 134.9 914.595.4 95.4
44.22.0 35.3 0.8
35.3 35.3At 31 December 2014 142.4 743.9 128.5 920.1
– – – 272.2 272.2– – – (105.4) (105.4)– – (63.0) – (63.0)– – 55.0 (55.0) –
0.2 4.0 (4.2) – –– – – 39.2 39.2
(1.1) – – (23.9) (25.0)At 31 December 2015 141.5 747.9 (106.9) 255.6 1,038.1
For the year ended 31 December 2015
Notes2015
£m2014
272.2 95.419.3 (89.2) 21.7
183.0 117.1
10.3 7.3(63.0)
(105.4)(25.0)
(183.1)Net decrease in cash and cash equivalents (0.1)
7.3 8.8Cash and cash equivalents at end of year 19.1 7.2 7.3
106 Henderson Group plc Annual Report 2015
For
per
sona
l use
onl
y

Group and Company
statement of compliance with IFRS
on the LSE and CDIs are traded on the ASX.
2. Accounting policies
Basis of preparation
Basis of consolidation
Presentation of the Consolidated Income Statement
•
•
Strategic reportFinancial statements
107Henderson Group plc Annual Report 2015
For
per
sona
l use
onl
y

Group and Company continued
Re-presentation of liabilities
Income recognition
Commissions
Operating expenses
Finance income and expenses
Share-based payment transactions
Income taxes
Sales taxes
108 Henderson Group plc Annual Report 2015
For
per
sona
l use
onl
y

Foreign currencies
Business combinations
Goodwill
Impairment of goodwill
Investment management contracts
Computer software
Investments in subsidiaries
Equity accounted investments
Strategic reportFinancial statements
109Henderson Group plc Annual Report 2015
For
per
sona
l use
onl
y

Group and Company continued
Impairment of assets (excluding goodwill
Discontinued operation
Financial instruments
Financial assets
Financial liabilities
110 Henderson Group plc Annual Report 2015
For
per
sona
l use
onl
y

Non-controlling interests in consolidated funds
Fair value estimation
Equity shares
Purchase of own shares
Dividend recognition
Investing activities in consolidated funds re-presentation
Strategic reportFinancial statements
111Henderson Group plc Annual Report 2015
For
per
sona
l use
onl
y

and assumptions
Acquisition of Geneva Capital Management LLC
Acquisition of Perennial
Impairment of intangible assets
Share-based payment transactions
Consolidation of funds
Interests in other entities
Provisions
Deferred tax assets
Group and Company continued
112 Henderson Group plc Annual Report 2015
For
per
sona
l use
onl
y

2.3 Changes in accounting policies
2.4 Future changes in accounting policies
3. Income
Group
Notes2015
£m2014
Gross fee and deferred income 754.6 648.9
1.4 2.3756.0 651.2
Commissions and deferred acquisition costs(150.1)
(4.1)(154.2)
Net fee income 601.8 518.8
Loss from associates and joint ventures 15.2 (0.7)
Finance income1.0 0.8
7 12.3 11.511.0 3.9(1.2)1.8 2.0
21.2 4.8 4.5 29.7 21.6Net income from continuing operations 630.8 538.3
Strategic reportFinancial statements
113Henderson Group plc Annual Report 2015
For
per
sona
l use
onl
y

4. Expenses
4.1 Operating expenses
Group
Note2015
£m2014
5.2 273.0 233.431.6 30.219.8 17.6
7.7 6.99.3 8.13.2
42.9 38.5Operating expenses from continuing operations 387.5 331.2
4.2 Auditors’ remuneration
Group and Company
2015 £m
2014
0.4 0.1
– 0.6 0.5 – 0.2 0.2 – 0.3 0.2 – – 0.1
Total fees 1.5 1.1
5.1 Number of employees
Group
1 1
2015 no.
2014 no.
2015 no.
2014 no.
955 875 1,016 922955 928 1,016 922
Note:
Company
Group and Company continued
114 Henderson Group plc Annual Report 2015
For
per
sona
l use
onl
y

Note2015
£m2014 2015
£m2014
196.2 175.3 0.7 0.311.2 28.9 27.4 –
39.2 24.1 0.18.7 6.6 –
from continuing operations 273.0 233.4 0.8 0.3
6. Finance expenses
Group
Note2015
£m2014
11.3 11.31.2 0.3
22 0.7 1.2Other 0.8 0.3
14.0 13.1
7. Acquisition related and non-recurring items from continuing operations
Group2015 2014
Notes
Acquisition related items
£m
Non-recurring items
£mTotal
£m Total
ventures0.8 – 0.8 1.8 1.8
– (0.3) (0.3) 5.4 5.40.8 (0.3) 0.5 1.8 5.4 7.2
Finance income– (12.3) (12.3)– (0.1) (0.1)– – –– (12.4) (12.4)
Operating expenses and amortisation14 56.2 – 56.2 53.7 53.7
FSCS refund – – –0.7 5.2 5.9 4.2 4.2
56.9 5.2 62.1 53.7 1.3 55.0Finance expenses
22 0.7 – 0.7 1.2 1.21.2 – 1.2 0.3 0.31.9 – 1.9 1.5 1.5
operations 59.6 (7.5) 52.1 57.0 52.28 (12.7) (3.5) (16.2)
operations 46.9 (11.0) 35.9 45.8 40.3
Strategic reportFinancial statements
115Henderson Group plc Annual Report 2015
For
per
sona
l use
onl
y

7.1 Non-recurring items
2015
•
•
•
•
2014
•
•
FSCS refund
•
•
Group and Company continued
116 Henderson Group plc Annual Report 2015
For
per
sona
l use
onl
y
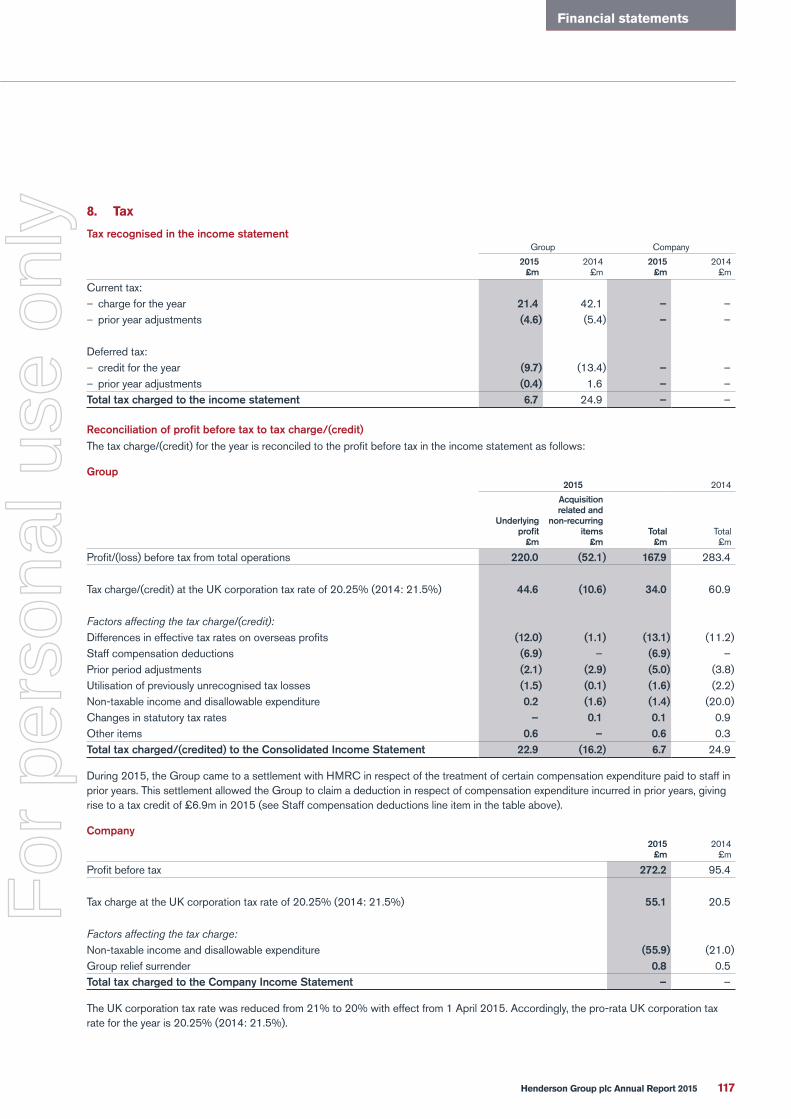
8. Tax
Tax recognised in the income statement
2015 £m
2014 2015 £m
2014
– 21.4 42.1 – – (4.6) –
– (9.7) – – (0.4) 1.6 –
Total tax charged to the income statement 6.7 24.9 –
Group2015 2014
Underlying
£m
Acquisition related and
non-recurring items
£mTotal
£mTotal
220.0 (52.1) 167.9 283.4
44.6 (10.6) 34.0 60.9
Factors affecting the tax charge/(credit):(12.0) (1.1) (13.1)(6.9) (6.9)(2.1) (2.9) (5.0)(1.5) (0.1) (1.6)0.2 (1.6) (1.4)
– 0.1 0.1 0.90.6 – 0.6 0.3
22.9 (16.2) 6.7 24.9
Company2015
£m2014
272.2 95.4
55.1 20.5
Factors affecting the tax charge:(55.9)
0.8 0.5Total tax charged to the Company Income Statement –
Strategic reportFinancial statements
117Henderson Group plc Annual Report 2015
For
per
sona
l use
onl
y

Group
9.1 Discontinued operation
2015 £m
2014
– 19.3– 0.1– 0.2– 19.6–– 7.6–– 6.3– 148.9––– 131.6
2014
114.2 74.8 9.1
Total consideration 198.1
– –
Net assets disposed 148.9
140.2
125.3
2015 £m
2014
– 71.7– 4.8– 8.3– 84.8– 26.0– 26.0
Group and Company continued
118 Henderson Group plc Annual Report 2015
For
per
sona
l use
onl
y

10. Earnings per share
Group
2015 no.
(millions)2014 no.
1,139.2 1,130.9(46.1)
Weighted average number of ordinary shares for the purpose of basic earnings per share 1,093.1 1,085.249.9 54.6
Weighted average number of ordinary shares for the purpose of diluted earnings per share 1,143.0 1,139.8
Earnings2015
£m2014
161.2 126.9
35.9 40.3Earnings for the purpose of basic and diluted earnings per share 197.1 167.2
Earnings per share2015
pence2014
18.0 15.417.2 14.7
Earnings2015
£m2014
161.2 258.5
35.9Earnings for the purpose of basic and diluted earnings per share 197.1 173.5
Earnings per share2015
pence2014
18.0 16.017.2 15.2
Earnings2015
£m2014
Earnings for the purpose of basic and diluted earnings per share 161.2 126.9
Strategic reportFinancial statements
119Henderson Group plc Annual Report 2015
For
per
sona
l use
onl
y

Group and Company continued
Earnings per share2015
pence2014
14.7 11.714.1 11.1
Earnings2015
£m2014
Earnings for the purpose of basic and diluted earnings per share 161.2 258.5
Earnings per share2015
pence2014
14.7 23.814.1 22.7
Earnings2015
£m2014
Earnings for the purpose of basic and diluted earnings per share – 131.6
Earnings per share2015
pence2014
– 12.1– 11.5
11. Share-based payments
Group
11.1 Share-based compensation plans
Deferred Equity Plan (DEP)
120 Henderson Group plc Annual Report 2015
For
per
sona
l use
onl
y

Employee Share Ownership Plan (ESOP)
Restricted Share Plan (RSP)
Long-Term Incentive Plan (LTIP)
– FTSE 350 – ASX 100
– – – –
Strategic reportFinancial statements
121Henderson Group plc Annual Report 2015
For
per
sona
l use
onl
y

11.2 Share-based payments charged to the Consolidated Income Statement from continuing operations2015
£m2014
12.6 12.55.7 3.85.4 5.4
BAYE 1.9 0.81.3 0.91.1 0.9
SAYE 0.5 0.40.4 2.7
Share-based payments expense 28.9 27.4
2015 £m
2014
28.9 27.4– 1.4
10.3 6.5Amounts settled through equity 39.2 35.3
11.3 Fair value of share-based compensation plans
2015 2014
options granted
no.
Average grant share price
£
no.
6,192,531 2.73 5,842,500 2.404,982,915 2.86 4,334,868 2.601,262,989 2.60 2,496,305 2.42
12. Dividends paid and proposed
Company
2015 £m
2015 pence per
share2014
2014
share
Dividends on ordinary shares declared and paid in the year70.9 6.40 64.0 5.8534.5 3.10 28.9 2.60
Total dividends paid and charged to equity 105.4 9.50 92.9 8.45
Group and Company continued
122 Henderson Group plc Annual Report 2015
For
per
sona
l use
onl
y

2015 £m
2015 pence per
share2014
2014
share
Dividends proposed on ordinary shares for approval by the shareholders at the AGM
81.5 7.20 72.9 6.40
13. Segmental information
Group
Entity-wide disclosures2015
£m2014
Revenues by product on continuing operations262.5 254.9257.0 178.782.8 57.162.8 51.850.0 63.3
Other 40.9 45.4Gross fee and deferred income 756.0 651.2
Geographic information2015
£m2014
Revenues from clients on continuing operationsUK 457.9 447.2
179.0 132.3112.6 66.5
3.7 1.11.4 1.91.2 0.8
Other 0.2 1.4Gross fee and deferred income 756.0 651.2
Strategic reportFinancial statements
123Henderson Group plc Annual Report 2015
For
per
sona
l use
onl
y

13. Segmental information continued2015
£m2014
Non-current assetsUK 558.1 670.4
85.2 88.353.9 8.0
Other 0.7 0.7697.9 767.4
14. Intangible assets
Group
2015
contracts Total
CostAt 1 January 523.7 361.5 14.9 900.1
29.5 18.7 6.0 54.23.5 3.8 7.3
At 31 December 556.7 384.0 20.9 961.6
Accumulated amortisationAt 1 January
At 31 DecemberCarrying value at 31 December 556.7 109.3 14.6 680.6
2014
contracts Total
CostAt 1 January 482.8 310.7 10.8 804.3
34.2 48.9 4.1 87.25.4 5.41.3 1.9 3.2
At 31 December 523.7 361.5 14.9 900.1
Accumulated amortisationAt 1 January
At 31 DecemberCarrying value at 31 December 523.7 143.0 11.2 677.9
Group and Company continued
124 Henderson Group plc Annual Report 2015
For
per
sona
l use
onl
y

15. Interests in other entities
15.1 Subsidiaries
Company
2015 £m
2014
At 31 December 1,029.8 1,030.8
UK
Group
15.2 Investments accounted for using the equity method
Group
2015 Percentage
owned
2014
USA USD 50%USA USD 50%
UK 50%UK –
AUD –
Strategic reportFinancial statements
125Henderson Group plc Annual Report 2015
For
per
sona
l use
onl
y

15.2 Investments accounted for using the equity method continued
2015 £m
2014
0.1 2.7(0.5)(0.4)(0.3) 2.4
Total share of loss (0.7)
As at 31 December
2015 £m
As at 31
2014
– 173.7Current assets – 50.9
––
Net assets – 170.0
Disposal of TH Real Estate
For the 5 months ended 31 May 2015
Underlying
£m
Acquisition related and
non-recurring items
£mTotal
£m
related and
Total
28.0 – 28.0 49.4 49.4(25.2) – (25.2)
(0.7) (2.6) (3.3)
2.1 (2.6) (0.5) 8.8 0.4(0.5) 0.5 – 1.61.6 (2.1) (0.5) 6.7
Group and Company continued
126 Henderson Group plc Annual Report 2015
For
per
sona
l use
onl
y

15.3 Interests in unconsolidated structured entities
Group
trusts funds
31 December 2015 92.0 (25.5) (0.2) 66.381.2 54.5
Trade Accrued Total
31 December 2015 5.5 92.9 4.3 102.77.6 127.5 3.5 138.6
16. Property and equipment
Group2015
£m2014
CostAt 1 January 25.0 32.1
1.9 1.6–– 0.1
At 31 December 26.9 25.0
Accumulated depreciationAt 1 January (9.9)
(2.6)7.8
At 31 December (12.5)Net book value at 31 December 14.4 15.1
Strategic reportFinancial statements
127Henderson Group plc Annual Report 2015
For
per
sona
l use
onl
y

Group
Notes2015
£m2014 2015
£m2014
145.7 35.9 145.7 35.9
for sale 9.2 – 71.7 – 71.7145.7 107.6 145.7 107.6
64.6 71.0 64.6 71.09.2 – 4.8 – 4.8
64.6 75.8 64.6 75.8
221.4 267.6 221.4 267.619.1 381.6 234.5 381.6 234.5
9.2 – 8.3 – 8.3Total loans and receivables 603.0 510.4 603.0 510.4
813.3 693.8 813.3 693.8
20 149.9 149.4 151.4 157.4301.0 300.9 301.0 300.9
Total loans and payables carried at amortised cost 450.9 450.3 452.4 458.3
119.3 57.2 119.3 57.2
for sale 9.2 – 26.0 – 26.022 11.9 12.8 11.9 12.8
131.2 96.0 131.2 96.0582.1 546.3 583.6 554.3
Company
Group and Company continued
128 Henderson Group plc Annual Report 2015
For
per
sona
l use
onl
y

Group
•
•
•
At 31 December 2015Total
Financial assets145.7 79.0 66.2 0.564.6 10.1 15.5 39.0
210.3 89.1 81.7 39.5
At 31 December 2014Total
Financial assets107.6 98.7 8.975.8 28.0 47.8
183.4 126.7 8.9 47.8
At 31 December 2015Total
Financial liabilities119.3 8.8 5.4 105.1
11.9 11.9131.2 8.8 5.4 117.0
At 31 December 2014Total
Financial liabilities83.2 83.212.8 12.896.0 96.0
Strategic reportFinancial statements
129Henderson Group plc Annual Report 2015
For
per
sona
l use
onl
y

2015 £m
2014
Fair value at 1 January 47.8 61.40.5 1.9
(23.9)9.9
(9.6)14.8 7.9
Fair value at 31 December 39.5 47.8
18. Trade and other receivables
2015 £m
2014 2015 £m
2014
120.6 147.1 –77.7 87.1 –10.4 10.0 –12.7 23.4 0.1 0.3
7.4 7.6 –4.0 2.0 –
– 8.7 2.3232.8 277.2 8.8 2.6
0.1 1.3 –Current 232.7 275.9 8.8 2.6
232.8 277.2 8.8 2.6
19. Cash and cash equivalents
19.1 Cash at bank and in hand and cash equivalents
2015 £m
2014 2015 £m
2014
308.5 197.6 7.2 7.373.1 36.9 –
381.6 234.5 7.2 7.3
Group and Company continued
130 Henderson Group plc Annual Report 2015
For
per
sona
l use
onl
y

Group
Notes2015
£m2014
167.9 283.4
– 11.3 11.6 – 28.9 28.8 – 59.6 57.6 – (0.1) 0.3 – 16 2.6 2.6 – (11.0) – – 0.8 – (5.0) – 0.4 0.1 – 2.7 1.5 – (0.2) – 1.0 0.6 – 7 (12.4) – 9.1 –
liabilities 245.7 217.719.3 33.5
(9.4) 269.8 123.0
19.3 Changes in operating assets and liabilities
2015 £m
2014 2015 £m
2014
(0.1) –29.6 (13.3)4.0 (75.9) 40.2
Changes in operating assets and liabilities 33.5 (89.2) 21.7
20. Debt instrument in issue
Group2015
Carrying value £m
2015 Fair value
£m
2014 2014
149.9 151.4 149.4 157.4
Strategic reportFinancial statements
131Henderson Group plc Annual Report 2015
For
per
sona
l use
onl
y

Group
2015 £m
2014
130.0 128.1
(8.1)
121.9 119.6
Pension service cost recognised in the Consolidated Income Statement2015
£m 2014
0.9 0.81.0 1.1
(4.8)(2.9)
Contributions to money purchase members’ accounts 5.3 5.1Net charge to the Consolidated Income Statement 2.4 2.5
Group and Company continued
132 Henderson Group plc Annual Report 2015
For
per
sona
l use
onl
y

2015 £m
2014
(1.2) 29.4(1.7)(2.9) 17.6
2015 £m
2014
At 1 January 479.4 414.91.0 1.1
Interest cost 16.9 18.4
– (3.8) – (15.6) 62.7
(20.4)At 31 December 457.5 479.4
2015 £m
2014
At 1 January 613.0 513.621.7 22.9(0.9)
(20.6) 88.32.1 2.8
(20.2)At 31 December 595.1 613.0
2015 £m
2014
(457.5)595.1 613.0(15.7)
At 31 December 121.9 119.6
Pension scheme assets
2015 £m
2014
– – 5.5 – 129.9 125.7
Bond assets 435.5 452.028.4 28.41.3 1.4
At 31 December 595.1 613.0
Strategic reportFinancial statements
133Henderson Group plc Annual Report 2015
For
per
sona
l use
onl
y
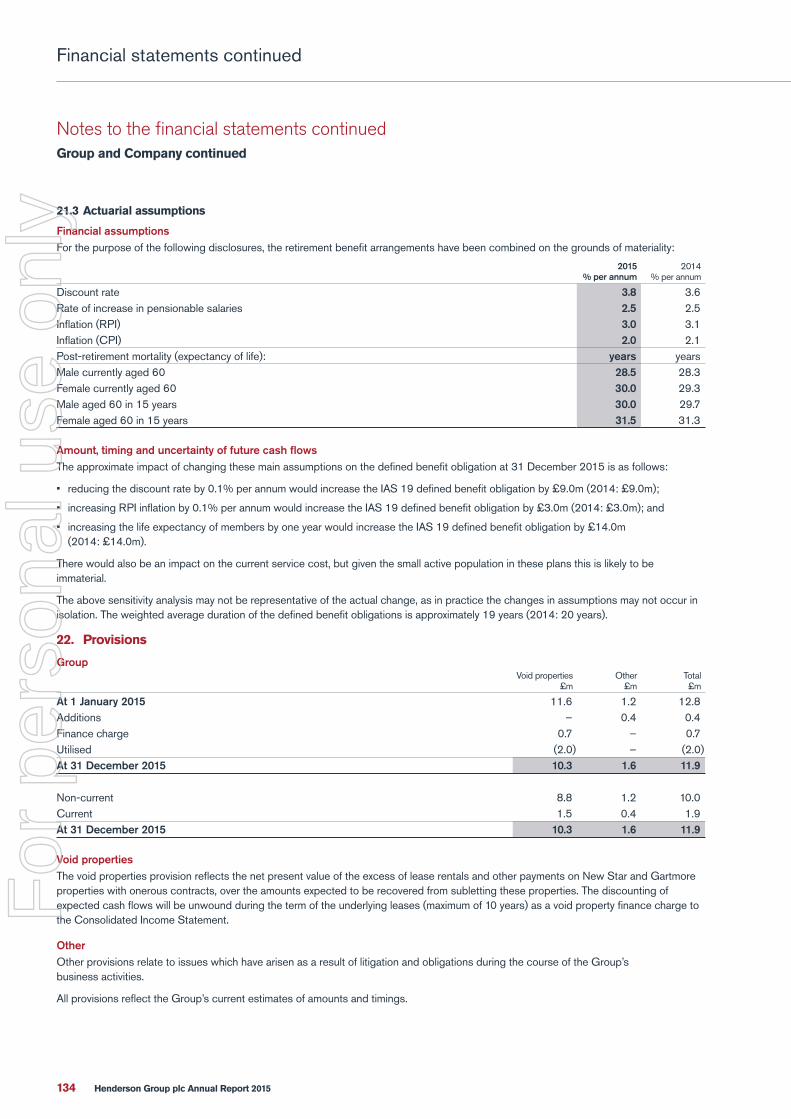
Group and Company continued
21.3 Actuarial assumptions
Financial assumptions
2015 % per annum
2014
3.8 3.62.5 2.53.0 3.12.0 2.1
years28.5 28.330.0 29.330.0 29.731.5 31.3
•
•
•
22. Provisions
Group Other Total
At 1 January 2015 11.6 1.2 12.80.4 0.4
0.7 0.7
At 31 December 2015 10.3 1.6 11.9
8.8 1.2 10.0Current 1.5 0.4 1.9At 31 December 2015 10.3 1.6 11.9
Void properties
Other
134 Henderson Group plc Annual Report 2015
For
per
sona
l use
onl
y

23. Deferred tax
Group
Accelerated
assets
Other
Total
At 1 January 2014 1.8 26.7 9.01.5
0.1 0.110.6 7.3 11.8
0.1 0.1 0.2
At 31 December 2014 1.0 30.7 2.4
1.8 10.6 0.7 10.1
3.7 3.7
0.3At 31 December 2015 0.6 (16.7) (13.2) 31.8 3.4 5.9
Assets Total
36.0At 31 December 2015 37.5 (31.6) 5.9
Strategic reportFinancial statements
135Henderson Group plc Annual Report 2015
For
per
sona
l use
onl
y

24. Trade and other payables
2015 £m
2014 2015 £m
2014
77.7 87.2 –11.6 11.5 0.9 3.0
Accruals 211.7 202.2 0.2 0.21.0 2.5 –
– 20.1 125.9302.0 303.4 21.2 129.1
10.7 13.2 –Current 291.3 290.2 21.2 129.1
302.0 303.4 21.2 129.1
25. Share capital
Group and Company
25.1 Authorised share capital2015
£m2014
274.4 274.4
25.2 Allotted share capital
no.
At 1 January 2014 1,123,422,286 140.415,744,909 2.0
At 31 December 2014 1,139,167,195 142.41,687,715 0.2
At 31 December 2015 1,131,842,109 141.5
26. Reserves
Group and Company
Nature and purpose of reserves
Share premium
Group and Company continued
136 Henderson Group plc Annual Report 2015
For
per
sona
l use
onl
y

Own shares held
2015 no. of shares
2014 no. of shares
2,115,862 316,94110,000 60,000
27,826,741 28,656,72812,180,438 15,603,766
1,119,140 931,1163,035,913 2,933,747
46,288,094 48,502,298
Translation reserve
Revaluation reserve
•
•
•
•
•
27. Financial risk management
Financial risk management objectives and policies
Strategic reportFinancial statements
137Henderson Group plc Annual Report 2015
For
per
sona
l use
onl
y

Group and Company continued
27.1 Price risk
Price risk sensitivity analysis on seed capital investments2015 2014
Consolidated Income
Statement £m
Consolidated Statement of
Comprehensive Income
£m
– 4.3 3.6
27.2 Interest rate risk
27.3 Liquidity risk
At 31 December 2015
Total
155.4 155.4 152.9
287.3 10.7 298.0 298.098.0 26.5 124.5 119.3
2.6 6.6 2.7 11.9 11.9543.3 43.8 2.7 589.8 582.1
138 Henderson Group plc Annual Report 2015
For
per
sona
l use
onl
y

At 31 December 2014
Total
10.9 155.4 166.3 152.4
286.5 11.4 297.9 297.952.1 35.8 1.9 89.8 83.2
3.4 8.0 3.4 14.8 12.8 352.9 210.6 5.3 568.8 546.3
27.4 Foreign currency risk
Foreign currency risk sensitivity analysis
Foreign currency sensitivity analysis 2015 2014
Consolidated Income
Statement £m
Consolidated Statement of
Comprehensive Income
£m
2.5 3.8 0.7 0.60.4 0.9 2.1 1.01.0 0.1 0.7 0.20.2 0.3 0.1 0.12.9 1.5 3.3 3.8
Strategic reportFinancial statements
139Henderson Group plc Annual Report 2015
For
per
sona
l use
onl
y

Group and Company continued
27.5 Credit risk
At 31 December 2015
Greater than Total
211.0 9.1 – 0.7 0.6 221.4
At 31 December 2014
Greater than Total
258.8 2.4 1.4 4.9 0.1 267.6
At 31 December 2015
AAA AA A
not rated Total
78.0 193.1 96.2 14.3 381.6
At 31 December 2014
AAA AA A
not rated Total
36.9 125.6 80.1 0.2 242.8
140 Henderson Group plc Annual Report 2015
For
per
sona
l use
onl
y

28. Leases
Group
2015 £m
2014
16.1 15.156.8 52.972.8 84.0
Total 145.7 152.0
29. Capital commitments
Group and Company
30. Related party transactions
Company
Notes2015
£m2014
Transactions with related parties during the year(1.0) 28.8
277.0 98.4(112.2) 24.2
18 8.7 2.324 (20.1)
Group
Strategic reportFinancial statements
141Henderson Group plc Annual Report 2015
For
per
sona
l use
onl
y

Group and Company continued
30. Related party transactions continued
Compensation of key management personnel (including Directors)
2015 £m
2014
14.2 15.00.3 0.4
15.5 5.9 30.0 21.3
31. Contingent liabilities
Group
•
•
•
•
•
•
142 Henderson Group plc Annual Report 2015
For
per
sona
l use
onl
y

•
•
•
•
•
Strategic reportFinancial statements
143Henderson Group plc Annual Report 2015
For
per
sona
l use
onl
y

32. Movements in controlled entities
Group
32.1 Acquisitions
Acquisition of Perennial Fixed Interest Partners Pty Ltd (PFI) and Perennial Growth Management Pty Ltd (PGM)
2015 £m
Cash 35.30.4
Total consideration 35.7
0.716.116.8
18.94.8
Goodwill recognised 23.7
Acquisition of 90 West Asset Management Limited (90 West)
32.2 Disposals
•
Group and Company continued
144 Henderson Group plc Annual Report 2015
For
per
sona
l use
onl
y

33. Events after the reporting date
Group
34. Subsidiaries of the Group
Group
UK
UK
UK
UK
UK
UK
UK
UK
UK
UK
USA USD
AUD
UK
UK
AUD
UK
AUD
AUD
UK
UK
UK
USA USD
UK
UK
UK
UK
Ireland
AUD
AUD
AUD
UK
HKD
Netherlands
Ireland
Strategic reportFinancial statements
145Henderson Group plc Annual Report 2015
For
per
sona
l use
onl
y

USA USD
CHF
SGD
UK
Netherlands
USA USD
USD
UK USD
UK
USA USD
Netherlands
UK
UK
USA USD
USA USD
CNY
UK
UK
UK
USD
UK
UK
UK
UK
UK
UK
UK
UK
UK
UK
UK
UK
UK
UK
UK
UK
UK
HKD
UK
AUD
Group and Company continued
34. Subsidiaries of the Group continued
146 Henderson Group plc Annual Report 2015
For
per
sona
l use
onl
y

Contents
OTH
ER
INFO
RMA
TIO
N
Strategic reportOther information
147Henderson Group plc Annual Report 2015
For
per
sona
l use
onl
y

Glossary
90 West
2016 Notes
AGM
AIFMD
ASX
ASX Principles
AUM
BAYE
Board
bps
BRC
CDIs
CDP
CDXs
CFDs
CFO
Code Staff
Company
compensation ratio
CPI
CRO
CSOP
DEP
Directors
EBITDA
EMEA
EPS
ESG
ESOP
ExCo
Executive Directors
ExSOP
FCA
FRC
FSCS
FTE
FX
GAAP
Gartmore
Gartmore acquisition
Geneva
GHG emissions
Group
hedge funds
return funds
Henderson
HGPS
HLAF
HMRC
HR
IAS
ICAAP
ICICL
IFRS IC
IFRS
148 Henderson Group plc Annual Report 2015
For
per
sona
l use
onl
y

KPI
LLC
LLP
LSE
LTIP
management fee margin
MiFID II
net margin
New Star
OEIC
OIML
operating margin
OTC
Perennial
PwC
RPI
RSP
SAYE
SICAV
TCF
TH Real Estate
TIAA-CREF transactions
total fee margin
TRSs
TSR
UCITS
UK/United Kingdom
and Northern Ireland
UK Code
UK Companies Act
UNPRI
Strategic reportOther information
149Henderson Group plc Annual Report 2015
For
per
sona
l use
onl
y

Shareholder information
Total number of holders of shares and CDIs and their voting rights
Twenty largest share/CDI holders
1 122,903,421 10.862 104,503,909 9.233 94,066,322 8.314 84,779,218 7.495 78,549,416 6.946 76,307,404 6.747 58,471,097 5.178 55,908,998 4.949 44,630,373 3.9410 25,841,096 2.2811 17,904,078 1.5812 16,729,253 1.4813 12,524,455 1.1114 12,208,542 1.0815 8,471,507 0.7516 6,661,721 0.5917 6,309,539 0.5618 5,249,078 0.4619 2,776,835 0.2420 1,894,013 0.17
836,690,275 73.92Total shares 1,131,842,109 100.00
Distribution of share/CDI holdings
holders
29,181 1.348,854 1.771,764 1.131,426 3.11
329 92.65Total 41,554 100.00
Stock exchange listings
150 Henderson Group plc Annual Report 2015
For
per
sona
l use
onl
y

Substantial shareholders
Total number of options over unissued shares
Restricted securities
Buyback
Company Secretary
Principal place of business in the United Kingdom
Share registryAustralia
Jersey
New Zealand
Website
Strategic reportOther information
151Henderson Group plc Annual Report 2015
For
per
sona
l use
onl
y

Opening AUM 1 Jan 2015 1
Closing AUM 31 Dec 2015
net
2
31 Dec 2015
Retail3 20,615 1,261 891 591 23,358
14,171 4,328 829 19,3286,005 2,291 351 8,6475,216 152 214 5,582
Total Retail 46,007 8,032 2,285 591 56,915 73Institutional
9,093 497 152 9,7421,266 276 23 1,565
– 38 1,464 1,4992,513 262 2,397
251 10 10215,530 396 783 2,944 19,6535,650 154 –
5 823 58Other4 29 23 2 54Total Institutional 35,155 510 963 35,070 26
Group total 81,162 8,542 3,248 91,985 55
Total asset class6 50,706 6,672 3,369 144 60,891 67
7 21,322 1,434 4,136 26,841 288 8,295 975 148 4,171
5 839 82Total Group 81,162 8,542 3,248 91,985 55
Absolute Return analysis3,395 1,994 148 12 5,5493,222 149 31 3,402
Total Absolute Return 6,617 2,143 179 12 8,951
Notes:
1.
2.
3.
5.
6.
10.
11. were audited and restated.
12.
13.
15.
16.
Summary of movements in AUM
152 Henderson Group plc Annual Report 2015
For
per
sona
l use
onl
y

(unaudited)
FY15 £m
FY14 £m
FY13 (restated)9
£m
FY12 (restated)9
£m
FY11 (restated)9
£m
IncomeManagement fees (net of commissions) 468.3 403.5 331.9 301.9 309.8Performance fees 98.7 82.8 94.5 30.4 63.4Other income 34.8 32.5 34.9 39.2 48.3
601.8 518.8 461.3 371.5 421.5(Loss)/Income from associates and joint ventures (0.2) 5.1 1.8 – (0.9)Finance income 17.3 10.1 10.2 14.1 11.6
618.9 534.0 473.3 385.6 432.2
9 (99.9) (88.4) (80.6) (83.3) (82.3)(168.7) (143.6) (128.8) (70.6) (96.5)(268.6) (232.0) (209.4) (153.9) (178.8)
Investment administration (31.6) (30.2) (24.4) (24.8) (27.2)Information technology (20.0) (17.1) (17.1) (14.4) (13.5)
(16.9) (15.0) (13.7) (13.3) (13.3)Depreciation (5.2) (4.7) (3.2) (2.8) (2.9)Other expenses9 (44.5) (35.6) (28.9) (35.5) (39.0)
(386.8) (334.6) (296.7) (244.7) (274.7)Finance expenses (12.1) (11.6) (11.1) (14.3) (17.2)
(398.9) (346.2) (307.8) (259.0) (291.9)10, 11 220.0 187.8 165.5 126.6 140.3
– 7.6 24.6 26.4 19.710, 11 220.0 195.4 190.1 153.0 160.0
(22.9) (20.6) (17.9) (15.3) (30.2)– (1.3) (2.9) (4.2) (3.4)
10, 11 197.1 173.5 169.3 133.5 126.4Acquisition related items (59.6) (57.0) (58.4) (64.1) (77.0)Non-recurring items 7.5 145.0 (4.3) 13.8 (69.2)Tax on acquisition related items 12.7 11.2 17.9 18.5 19.4Tax on non-recurring items 3.5 (14.2) 0.6 4.7 16.2Non-recurring tax credit – – – – 18.9
(35.9) 85.0 (44.2) (27.1) (91.7)11 161.2 258.5 125.1 106.4 34.7
Equity owners of the parent 161.2 258.5 125.1 106.2 34.8Non-controlling interests – – – 0.2 (0.1)
Operating margin12 (%) 35.7 35.5 35.7 34.1 34.8Compensation ratio9, 13 (%) 44.6 44.7 45.4 41.4 42.4Average number of full-time employees 955 875 812 861 838Assets under management (AUM) at year end (£bn) 92.0 81.2 63.7 53.9 52.7Average AUM for the year for margin calculations on continuing basis (£bn) 83.6 69.9 59.0 53.4 56.2Management fee margin (bps) 56.0 57.8 56.3 56.5 55.1Total fee margin (bps) 72.0 74.3 78.2 69.6 75.0Net margin14 (bps) 26.3 26.9 28.1 23.7 25.0
Weighted average number of ordinary shares for basic EPS (m) 1,093.1 1,085.2 1,058.8 1,034.0 954.1Weighted average number of ordinary shares for diluted EPS (m) 1,143.0 1,139.8 1,137.0 1,082.0 1,012.7
10, 15 (p) 18.0 16.0 16.0 12.9 13.310, 15 (p) 18.0 15.4 13.9 10.8 11.6
Basic (p) 14.7 23.8 11.8 10.3 3.610, 15 (p) 17.2 15.2 14.9 12.3 12.5
10, 15 (p) 17.2 14.7 13.0 10.3 10.9Diluted (p) 14.1 22.7 11.0 9.8 3.4Dividend per share (p) 10.30 9.00 8.00 7.15 7.00
16
Funds at or exceeding benchmark over one year (%) 78 66 78 73 59Funds at or exceeding benchmark over three years (%)17 81 83 81 69 66
153Henderson Group plc Annual Report 2015
For
per
sona
l use
onl
y

For more information, please go to our website: henderson.com/IR
For shareholder queries, please contact the Henderson Group Share Registry:
AustraliaGPO Box 4578 Melbourne, VIC 3001
T: 1300 137 981 or +61 (0) 3 9415 4081
F: +61 (0) 3 9473 2500
JerseyQueensway House Hilgrove Street, St Helier Jersey JE1 1ES
T: +44 (0) 1534 281842 F: +44 (0) 870 873 5851
New ZealandPrivate Bag 92119 Auckland 1142
T: 0800 888 017 F: +64 (0) 9 488 8787
47 Esplanade, St Helier Jersey JE1 0BD
201 Bishopsgate, London EC2M 3AE
For
per
sona
l use
onl
y