Embed Size (px)
Citation preview

2015–16STATE
BUDGET
2015–16 Budget Paper 4
Agency Statements Volume 4

Published 18 June 2015ISSN 1440-8589
AcknowledgementsThis publication is printed on FSC certified paper.Content from this publication may be reproduced with appropriate acknowledgement, as permitted under the Copyright Act 1968.© Government of South Australia 2015
2015–16BUDGETPAPERS
Budget Paper 1 | Budget Overview
Budget Paper 2 | Budget Speech
Budget Paper 3 | Budget Statement
Budget Paper 4 | Agency Statements — Volumes 1, 2, 3, 4
Budget Paper 5 | Budget Measures Statement
Budget Paper 4
2015–16 Agency Statements
Volume 4
Presented by The Honourable Tom Koutsantonis MP
Treasurer of South Australia on the Occasion of the Budget
for 2015–16

General enquiries regarding budget papers should be directed to:
The Under Treasurer Department of Treasury and Finance State Administration Centre 200 Victoria Square Adelaide SA 5000
Copies may be obtained from:
SERVICE SA Government Legislation Outlet Ground Floor EDS Centre 108 North Terrace Adelaide SA 5000
Website: www.treasury.sa.gov.au www.statebudget.sa.gov.au

Agency statements by volume
Volume 1
Attorney-General Auditor-General Communities and Social Inclusion Correctional Services Courts Defence
Volume 2
Education and Child Development Electoral Commission Emergency Services — CFS Emergency Services — MFS Emergency Services — SAFECOM Emergency Services — SES Environment Protection Authority Environment, Water and Natural Resources
Volume 3
Health and Ageing Planning, Transport and Infrastructure Police Premier and Cabinet
Volume 4
Primary Industries and Regions State Development Tourism Treasury and Finance Zero Waste

Volume 4 contents
Introduction ........................................................................................................................................ 3 Primary Industries and Regions ........................................................................................................ 9 State Development .......................................................................................................................... 53 Tourism .......................................................................................................................................... 131 Treasury and Finance ................................................................................................................... 153 Zero Waste .................................................................................................................................... 197 Accounting Standards ................................................................................................................... 209
2015–16 Agency Statements — Volume 4 1

2 2015–16 Agency Statements — Volume 4

Introduction
The 2015−16 Agency Statements outline financial and non-financial information about the services each agency provides to, and on behalf of, the South Australian community.
To assist readers who may not be familiar with official agency names, the agency statements are presented in alphabetical order as indicated in the list below.
Alphabetical list order Agency name Abbreviation
Attorney-General Attorney-General’s Department AGD
Auditor-General Auditor-General’s Department
Communities and Social Inclusion Department for Communities and Social Inclusion DCSI
Correctional Services Department for Correctional Services DCS
Courts Courts Administration Authority CAA
Defence SA Defence SA
Education and Child Development Department for Education and Child Development DECD
Electoral Commission Electoral Commission of South Australia ECSA
Emergency Services ― CFS South Australian Country Fire Service CFS
Emergency Services ― MFS South Australian Metropolitan Fire Service MFS
Emergency Services ― SAFECOM South Australian Fire and Emergency Services Commission SAFECOM
Emergency Services ― SES South Australian State Emergency Service SES
Environment Protection Authority Environment Protection Authority EPA
Environment, Water and Natural Resources
Department of Environment, Water and Natural Resources DEWNR
Health and Ageing Department for Health and Ageing DHA
Planning, Transport and Infrastructure Department of Planning, Transport and Infrastructure DPTI
Police South Australia Police SAPOL
Premier and Cabinet Department of the Premier and Cabinet DPC
Primary Industries and Regions Department of Primary Industries and Regions PIRSA
State Development Department for State Development DSD
Tourism South Australian Tourism Commission SATC
Treasury and Finance Department of Treasury and Finance DTF
Zero Waste Zero Waste SA ZWSA
2015–16 Agency Statements — Volume 4 3

Definitions
Agency An agency is an administrative unit created under the Public Sector Act 2009 or a statutory authority that is accountable for the delivery of programs on behalf of the government.
Programs and sub-programs A program is a group of related activities that contribute to achieving one of an agency’s and, in turn, the government’s objectives. Many programs are further divided into sub-programs with more specific objectives.
Overview
The agency statements outline projected agency activity and performance for 2014–15. Each agency statement conforms to the following standard presentation structure:
• Objective — outlines the agency’s objectives
• Ministerial responsibilities — identifies the minister responsible for each program/sub-program and identifies any items administered by the agency on behalf of the minister(s)
• Ministerial office resources — details the resources provided to ministerial office(s)
• Workforce summary — summarises the agency’s workforce
• Program net cost of services summary — summarises the net cost of agency programs
• Investing expenditure summary — summarises investing expenditure for the agency
• Program/sub-program information — for each agency program/sub-program, provides a description/objective, program summary (expenses, income and full-time equivalents), financial commentary, highlights and targets, performance and activity indicators
• Financial statements — budgeted financial statements for controlled and administered items
• Summary of major variations — commentary on variances and trends in the financial statements.
Presentation of changes in program structures
Where a program or function is transferred between agencies, program information for previous years is reflected in the current program structure of the receiving agency.
In contrast, the agency financial statements line net cost of providing services in the statement of comprehensive income is based on the actual program structure for the agency as it operated or is expected to operate in each year. This distinction in treatment is drawn so that financial statements accurately reflect events while, at the same time, program information is comparable and not duplicated.
Reconciliation of the financial statements to the current program structure is contained in the program net cost of services summary located at the beginning of each relevant agency section.
Introduction
4 2015–16 Agency Statements — Volume 4

Financial statements
The estimated financial statements included in the 2015−16 Agency Statements are special purpose financial statements and include, for each agency, a statement of comprehensive income, a statement of financial position and a statement of cash flows.
The format of these estimated financial statements is consistent with the model financial statements (prepared by the Department of Treasury and Finance for statutory reporting requirements) and is consistent with the requirements of AASB 101 Presentation of Financial Statements and AASB 107 Statement of Cash Flows.
Estimates in these financial statements have been prepared:
• on a basis that is consistent with Australian Accounting Standards (Australian Accounting Standards and/or interpretations that have been issued or amended but are not yet effective have not been adopted early)
• on an accrual basis, except for the statement of cash flows which has been derived from the statement of comprehensive income and statement of financial position to reflect cash payments and receipts
• using historical cost convention, except for certain assets and liabilities that are valued in accordance with the valuation policy applicable.
Consistent with Australian Accounting Standards, estimated transactions and balances that are controlled are budgeted for, and reported on, separately to estimated transactions and balances which are administered but not controlled by the agency.
Introduction
2015–16 Agency Statements — Volume 4 5

Ministerial responsibilities
The ministerial responsibilities table provides a comprehensive list of the agencies and programs which fall under the responsibility of each minister, and is presented in Ministerial Order of Precedence.
Minister Agency Programs The Hon J Weatherill Premier
Department of the Premier and Cabinet 1. Premier and Cabinet Policy and Support
2. Strategic Engagement and Communications
3. Agent-General 4. State Coordinator-General 5. Support Services and Community
Programs Department of State Development 1. Office of Economic Development Board
The Hon J Rau Deputy Premier Attorney-General Minister for Justice Reform Minister for Planning Minister for Housing and Urban Development Minister for Industrial Relations Minister for Child Protection Reform
Department of the Premier and Cabinet 6. Government Publishing Attorney-General’s Department 1. Legal and Justice Services
2. Legislation and Policy Services 3. Registration Services 4. Advocacy and Guardianship Services 5. Equal Opportunity 6. Police Ombudsman 7. Ombudsman 8. Industrial Relations 9. Fines Enforcement and Recovery 10. State Records
Courts Administration Authority 1. Court and Tribunal Case Resolution Services
2. Alternative Dispute Resolution Services Electoral Commission of South Australia 1. Electoral Services Department of Planning, Transport and Infrastructure
1. Land Use Planning
The Hon G Gago Minister for Employment, Higher Education and Skills Minister for Science and Information Economy Minister for the Status of Women Minister for Business Services and Consumers
Department of State Development 2. Employment and Skills Formation 3. Science, Technology and Information
Economy Department for Communities and Social Inclusion
1. Status of Women
Attorney-General’s Department 11. Consumer and Business Services Department of Treasury and Finance 1. Gambling Policy
The Hon JJ Snelling Minister for Health Minister for Mental Health and Substance Abuse Minister for the Arts Minister for Health Industries
Department for Health and Ageing 1. Policy, Clinical Services, System Transformation and Administration
2. Health Services Department of State Development 4. Arts
5. Health Industries
The Hon T Koutsantonis Treasurer Minister for Finance Minister for State Development Minister for Mineral Resources and Energy Minister for Small Business
Department of Treasury and Finance 2. Accountability for Public Sector Resources
3. Treasury Services 4. Financial Services Provision
Department of State Development 6. Mineral Resources and Energy 7. Opportunities for Small Business
Introduction
6 2015–16 Agency Statements — Volume 4

Minister Agency Programs The Hon IK Hunter Minister for Sustainability, Environment and Conservation Minister for Water and the River Murray Minister for Climate Change
Department of Environment, Water and Natural Resources
1. Sustainability 2. Water 3. Parks and Public Assets
Environment Protection Authority 1. Environment and Radiation Protection Zero Waste SA 1. Waste Reduction and Resource
Recovery Department of State Development 8. Water Industry Technical and Safety
Regulation The Hon A Piccolo Minister for Disabilities Minister for Police Minister for Correctional Services Minister for Emergency Services Minister for Road Safety
Department for Communities and Social Inclusion
2. Disability SA 3. Disability Services
South Australia Police 1. Public Safety 2. Crime and Criminal Justice Services 3. Road Safety
South Australian Country Fire Service 1. Country Fire Service South Australian Metropolitan Fire Service
1. South Australian Metropolitan Fire Service
South Australian Fire and Emergency Services Commission
1. Fire and Emergency Services Strategic Services and Business Support
South Australian State Emergency Services
1. State Emergency Services
Department for Correctional Services 1. Rehabilitation and Reparation 2. Custodial Services 3. Community Based Services
Department of Planning, Transport and Infrastructure
2. Road Safety
The Hon LWK Bignell Minister for Agrigulcture, Food and fisheries Minister for Forests Minister for Tourism Minister for Recreation and Sport Minister for Racing
Department of Primary Industries and Regions
1. Agriculture, Food and Fisheries 2. Forestry Policy
South Australian Tourism Commission 1. Tourism Development 2. Tourism Events 3. Tourism Marketing
Department of Planning, Transport and Infrastructure
3. Recreation, Sport and Racing
The Hon MLJ Hamilton-Smith Minister for Investment and Trade Minister for Defence Industries Minister for Veterans' Affairs
Department of State Development 9. Globally Integrating the SA Economy Defence SA 1. Defence Industry Development
2. Techport Australia Department of Treasury and Finance 5. Veterans' Affairs
The Hon GG Brock Minister for Regional Development Minister for Local Government
Department of Primary Industries and Regions
3. Regional Development
Department of Planning, Transport and Infrastructure
4. Office of Local Government
The Hon ZL Bettison Minister for Communities and Social Inclusion Minister for Social Housing Minister for Multicultural Affairs Minister for Ageing Minister for Youth Minister for Volunteers
Department for Communities and Social Inclusion
4. Domiciliary and Community Care Services
5. Social Housing 6. Communities and Partners
The Hon SE Close Minister for the Public Sector Minister for Education and Child Development
Department for Education and Child Development
1. Early Childhood Development 2. School Education 3. Care and Protection
Department of the Premier and Cabinet 7. Information and Communication Technology Services
8. Government Services 9. Public Sector Performance
Introduction
2015–16 Agency Statements — Volume 4 7
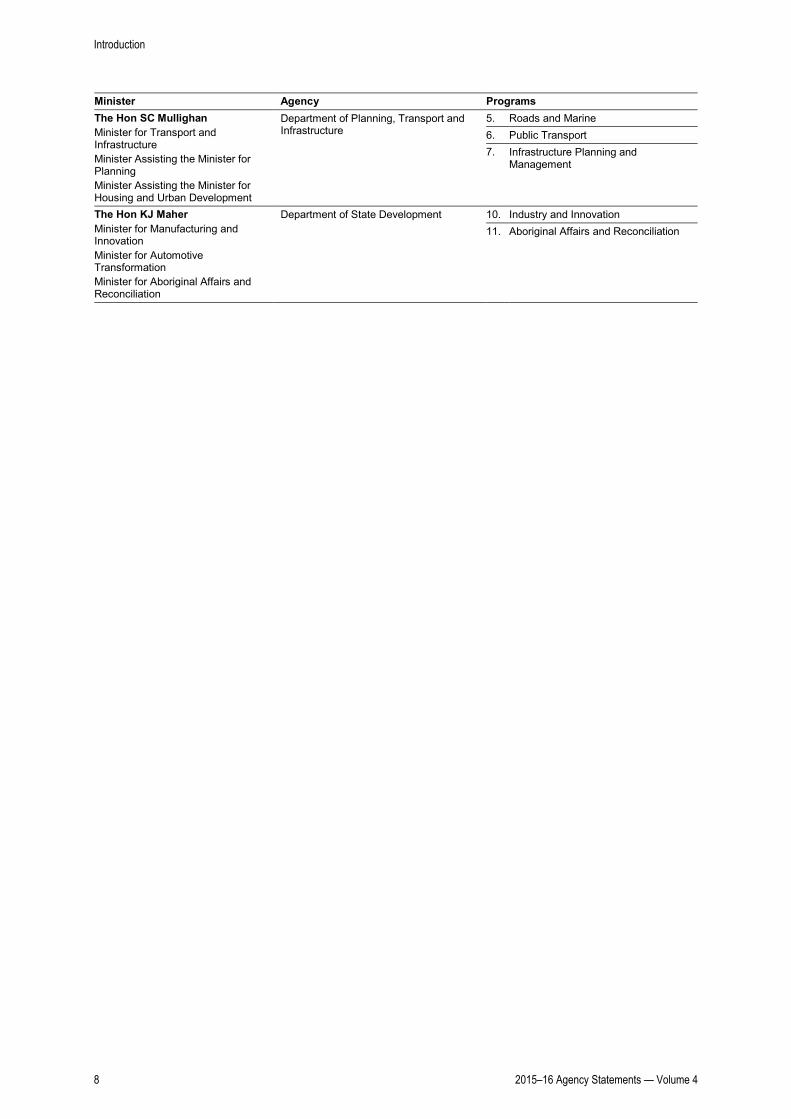
Minister Agency Programs The Hon SC Mullighan Minister for Transport and Infrastructure Minister Assisting the Minister for Planning Minister Assisting the Minister for Housing and Urban Development
Department of Planning, Transport and Infrastructure
5. Roads and Marine 6. Public Transport 7. Infrastructure Planning and
Management
The Hon KJ Maher Minister for Manufacturing and Innovation Minister for Automotive Transformation Minister for Aboriginal Affairs and Reconciliation
Department of State Development 10. Industry and Innovation 11. Aboriginal Affairs and Reconciliation
Introduction
8 2015–16 Agency Statements — Volume 4
Agency: Department of Primary Industries and Regions
Minister for Agriculture, Food and Fisheries Minister for Forests Minister for Regional Development
2015–16 Agency Statements — Volume 4 9

Primary Industries and Regions
10 2015–16 Agency Statements — Volume 4

Contents
Objective .......................................................................................................................................... 12 Ministerial responsibilities ................................................................................................................ 13 Ministerial office resources .............................................................................................................. 14 Workforce summary ........................................................................................................................ 14 Program net cost of services summary ........................................................................................... 15 Investing expenditure summary ...................................................................................................... 16 Program 1: Agriculture, Food and Fisheries ................................................................................ 17 Program 2: Forestry Policy ........................................................................................................... 32 Program 3: Regional Development .............................................................................................. 34 Financial statements ....................................................................................................................... 37 Summary of major variations........................................................................................................... 46 Additional information for administered items ................................................................................. 49
Primary Industries and Regions
2015–16 Agency Statements — Volume 4 11

Objective
The Department of Primary Industries and Regions (PIRSA) has the lead role implementing and coordinating South Australia’s economic priority — premium food and wine produced in our clean environment and exported to the world. PIRSA also has a lead role in coordinating and delivering regional development initiatives across government. These objectives reflect targets in South Australia’s Strategic Plan, including growing the contribution made by the South Australian food industry to $20.0 billion by 2020.
To assist in achieving these aims, PIRSA has the additional objectives of:
• securing sustainable access to resources such as land, water and stock
• enhancing and growing the efficiency and value of production
• ensuring and expanding access to markets
• working with South Australia’s regional communities to enhance sustainable economic prosperity.
PIRSA contributes to the productivity growth of our agriculture, food and fisheries by: enforcing strict biosecurity measures to keep our crops and farm animals free of many pests and diseases (e.g. South Australia is fruit fly and phylloxera free), preparing food safety standards which make our produce some of the safest in the world, and providing strong research and innovation capabilities. PIRSA develops and implements policies and programs that ensure that South Australia’s agricultural sector remains competitive, profitable and sustainable.
PIRSA manages the use of South Australia’s aquatic resources to maximise the environmental, social and economic benefits to South Australian communities and ensure the sustainable development of our fisheries and aquaculture industries. South Australia's clean marine environment is home to some of the most sought after, premium seafood in the world. The fisheries that operate within these waters support aquaculture production and commercial, recreational and Aboriginal traditional fishing activities that contribute to the social and economic well-being of the state and prosperity of our coastal and river regions.
PIRSA’s Forestry division works with businesses and the community to promote the future of the forestry and wood products industry in South Australia and seeks new opportunities for development. A key priority is to increase the economic value of the forest and wood products industry.
Regions SA, a division of PIRSA, is responsible for working with regional communities to identify opportunities to expand economic growth and propose strategies and projects to deliver these benefits. A reinvigorated commitment has been made through Regions SA to provide financial assistance to job creation and economic development projects from businesses, councils, Regional Development Australia groups and communities from across regional South Australia.
Primary Industries and Regions
12 2015–16 Agency Statements — Volume 4

Ministerial responsibilities
Minister Programs Sub-programs
The Hon. LWK Bignell Minister for Agriculture, Food and Fisheries Minister for Forests
1. Agriculture, Food and Fisheries 1.1 Agriculture, Food and Wine 1.2 Aquaculture 1.3 Fisheries 1.4 South Australian Research and
Development Institute (SARDI) 1.5 Rural Services 1.6 Biosecurity 1.7 South Australian River Murray
Sustainability 2. Forestry Policy Nil
The Hon. GG Brock Minister for Regional Development
3. Regional Development Nil
Administered items
In addition to the above responsibilities, the agency administers the following items on behalf of the ministers:
• Adelaide Hills Wine Industry Fund
• Apiary Industry Fund
• Aquaculture Lease Rehabilitation Fund
• Aquaculture Resource Management Fund
• Barossa Wine Industry Fund
• Cattle Industry Fund
• Citrus Growers Fund
• Clare Valley Wine Industry Fund
• Deer Industry Fund
• Dog Fence Board
• Egg Industry Deregulation Fund
• Eyre Peninsula Grain Growers Rail Fund
• Fisheries Research and Development Fund
• ForestrySA ― community service obligation
• Grain Industry Fund
• Grain Industry Research and Development Fund
• Langhorne Creek Wine Industry Fund
• McLaren Vale Wine Industry Fund
• Olive Industry Fund
• Pig Industry Fund
• Riverland Wine Industry Fund
• Rock Lobster Fishing Industry Fund
• SA Grape Growers Industry Fund
• Samcor Fund
Primary Industries and Regions
2015–16 Agency Statements — Volume 4 13

• Seed Levies Fund
• Sheep Industry Fund.
Statutes
The Department of the Premier and Cabinet maintains a list of statutes applicable to ministers.
Ministerial office resources
2015–16 Budget
Cost of provision
Minister $000 FTE
The Hon. LWK Bignell ............................................................................ 1 468 8.0
The Hon. GG Brock ................................................................................ 1 497 9.0
Workforce summary
FTEs as at 30 June
Agency 2015–16
Budget(a)
2014–15 Estimated
Result(a) 2013–14
Actual Department of Primary Industries and Regions .................................. 906.8 905.7 842.8 Less: FTEs transferred in:
High Value Food Manufacturing Centre from the Department of Further Education, Employment, Science and Technology on 1 July 2014............................................................................... — — 3.0 Regions SA resources from the Department of Further Education, Employment, Science and Technology, the Department for Manufacturing, Innovation, Trade, Resources and Energy, the Department of Planning, Transport and Infrastructure and the Department of Environment, Water and Natural Resources on 1 July 2014 ................................................ — — 11.0
Equals: Data published by the Office for the Public Sector (Department of the Premier and Cabinet) 906.8 905.7 828.8
Administered items for the Department of Primary Industries and Regions(b) ............................................................................... 2.0 2.0 11.7
Total 908.8 907.7 840.5
(a) The 2015–16 Budget and 2014–15 Estimated Result reflect the established FTE caps.
(b) Administered items FTEs are not included in the agency program information. The 2013–14 Actual result reflects staff associated with Local Government functions that transferred into PIRSA during 2013–14 and were transferred to the Department of Planning, Transport and Infrastructure on 1 July 2014.
Primary Industries and Regions
14 2015–16 Agency Statements — Volume 4

Program net cost of services summary
Net cost of services
2015–16 Budget
2014–15 Estimated
Result 2014–15 Budget
2013–14 Actual
Program $000 $000 $000 $000
1. Agriculture, Food and Fisheries .......................... 67 931 88 126 59 805 65 041
2. Forestry Policy .................................................... 7 747 1 953 8 030 6 021
3. Regional Development ........................................ 31 020 18 354 38 394 11 575
Total 106 698 108 433 106 229 82 637
Reconciliation to agency net cost of providing services(a)
Less: Net costs transferred in:
Regional Development Fund and associated administrative support from the Department of Treasury and Finance on 1 July 2014 .................... — — — 1 984
South East Forestry Partnership Program from the Department of Treasury and Finance on 1 July 2014 ............................................................ — — — 4 884
High Value Food Manufacturing Centre from the Department of Further Education, Employment, Science and Technology on 1 July 2014 ............... — — — 535
Regions SA resources from the Department of Further Education, Employment, Science and Technology, the Department for Manufacturing, Innovation, Trade, Resources and Energy, the Department of Planning, Transport and Infrastructure and the Department of Environment, Water and Natural Resources on 1 July 2014........................................................ — — — 1 344
Equals: Net cost of providing services (as per agency statement of comprehensive income) 106 698 108 433 106 229 73 890
(a) The net cost of services for individual programs are shown on a full-year basis, whereas the agency financial statements reflect revenues and expenses from the effective date of the transfer of some programs. This reconciliation shows the difference between the program notes and the financial statements.
Primary Industries and Regions
2015–16 Agency Statements — Volume 4 15

Investing expenditure summary
The 2015–16 investment program is $12.5 million.
Estimated
completion
Total project
cost 2015–16 Budget
2014–15 Estimated
Result 2014–15 Budget
Investments Quarter $000 $000 $000 $000
Existing projects Almond Centre of Excellence ............... Jun 2015 1 500 — 1 500 — Clare Regional Office ........................... Dec 2016 3 819 1 709 927 — Loxton Research Centre Redevelopment .................................... Dec 2016 6 700 4 000 477 700 Sterile Insect Technology Facility ......... Dec 2016 3 000 1 987 360 2 860
Total existing projects 15 019 7 696 3 264 3 560
Annual programs Minor Capital Works and Equipment .... n.a. n.a. 4 770 4 644 3 810
Total annual programs 4 770 4 644 3 810
Total investing expenditure 15 019 12 466 7 908 7 370
Primary Industries and Regions
16 2015–16 Agency Statements — Volume 4

Program 1: Agriculture, Food and Fisheries
Description/objective
Lead the development and delivery of South Australia’s economic priority — premium food and wine produced in our clean environment and exported to the world — to drive growth and sustainable development of the state’s primary industry resources.
Sub-programs
1.1 Agriculture, Food and Wine
1.2 Aquaculture
1.3 Fisheries
1.4 South Australian Research and Development Institute (SARDI)
1.5 Rural Services
1.6 Biosecurity
1.7 South Australian River Murray Sustainability
Program summary — expenses, income and FTEs
2015–16 Budget
2014–15 Estimated
Result 2014–15 Budget
2013–14 Actual
$000 $000 $000 $000
Expenses Employee benefit expenses.......................................... 87 503 83 735 85 201 86 184 Supplies and services ................................................... 55 535 53 222 54 447 49 906 Depreciation and amortisation expenses ...................... 5 968 5 833 6 713 5 740 Borrowing costs ............................................................ 1 778 569 2 030 652 Grants and subsidies .................................................... 83 030 79 491 70 004 25 219 Intra-government transfers ........................................... 696 711 675 748 Other expenses ............................................................ 3 147 6 932 1 975 956
Total expenses 237 657 230 493 221 045 169 405
Income Commonwealth revenues ............................................. 83 298 66 343 76 298 27 254 Intra-government transfers ........................................... 17 639 17 800 17 629 20 404 Other grants.................................................................. 30 487 27 565 29 973 28 436 Fees, fines and penalties .............................................. 5 014 2 099 5 169 2 252 Sales of goods and services ......................................... 24 768 19 595 24 301 18 911 Interest revenue ............................................................ 3 412 2 644 4 198 2 218 Net gain or loss from disposal of assets ....................... 2 212 1 181 680 -58 Other income ................................................................ 2 896 5 140 2 992 4 947
Total income 169 726 142 367 161 240 104 364
Net cost of providing services 67 931 88 126 59 805 65 041
FTEs as at June (No.) 853.5 851.8 859.9 809.3
Primary Industries and Regions
2015–16 Agency Statements — Volume 4 17

Sub-program 1.1: Agriculture, Food and Wine
Description/objective
Ensuring market access in line with South Australia’s economic priority — premium food and wine produced in our clean environment and exported to the world.
2015–16 Budget
2014–15 Estimated
Result 2014–15 Budget
2013–14 Actual
$000 $000 $000 $000 Expenses ...................................................................... 16 690 15 906 16 143 11 383 Income .......................................................................... 3 494 4 166 5 490 4 112
Net cost of sub-program 13 196 11 740 10 653 7 271
FTEs as at June (No.) 52.9 54.7 45.2 38.0
Financial commentary
2015–16 Budget/2014–15 Estimated Result
The $0.8 million increase in expenses is primarily due to:
• costs associated with lending under the Farm Finance Concessional Loans and Drought Concessional Loans schemes in 2015–16 ($0.9 million)
• expansion of new initiative funding provided in 2014–15 to commission a business case and supporting activities to establish a Northern Adelaide food park to enable food manufacturing businesses to leverage shared infrastructure and services ($0.6 million)
• expansion of the Agribusiness Investment Attraction Program (Agri-PACE) in 2015–16 ($0.2 million)
partially offset by
• reduced expenditure in line with functional budget transfer from the Department of State Development for food and wine related activities in 2015–16 ($0.5 million)
• reduced expenditure associated with the Premium Food and Wine Innovation Clusters initiative in 2015–16 ($0.3 million)
• completion of improvements to water related infrastructure in Far North South Australia under the Commonwealth Government's Drought Assistance Package in 2014–15 ($0.3 million).
The $0.7 million decrease in income is primarily due to:
• reduction in Commonwealth Government funding for the Farm Finance Concessional Loans scheme in 2015–16 ($1.3 million)
• reduction in budgeted interest earnings on deposits held with the Department of Treasury and Finance in 2015–16 ($0.3 million)
• a reduction in Commonwealth Government funding following completion of water related infrastructure activities undertaken in Far North South Australia under the Commonwealth Government's Drought Assistance Package in 2014–15 ($0.3 million)
partially offset by
• increase in budgeted interest earnings associated with increase in budgeted lending under the Farm Finance Concessional Loans and Drought Concessional Loans schemes in 2015–16 ($1.3 million).
Primary Industries and Regions
18 2015–16 Agency Statements — Volume 4
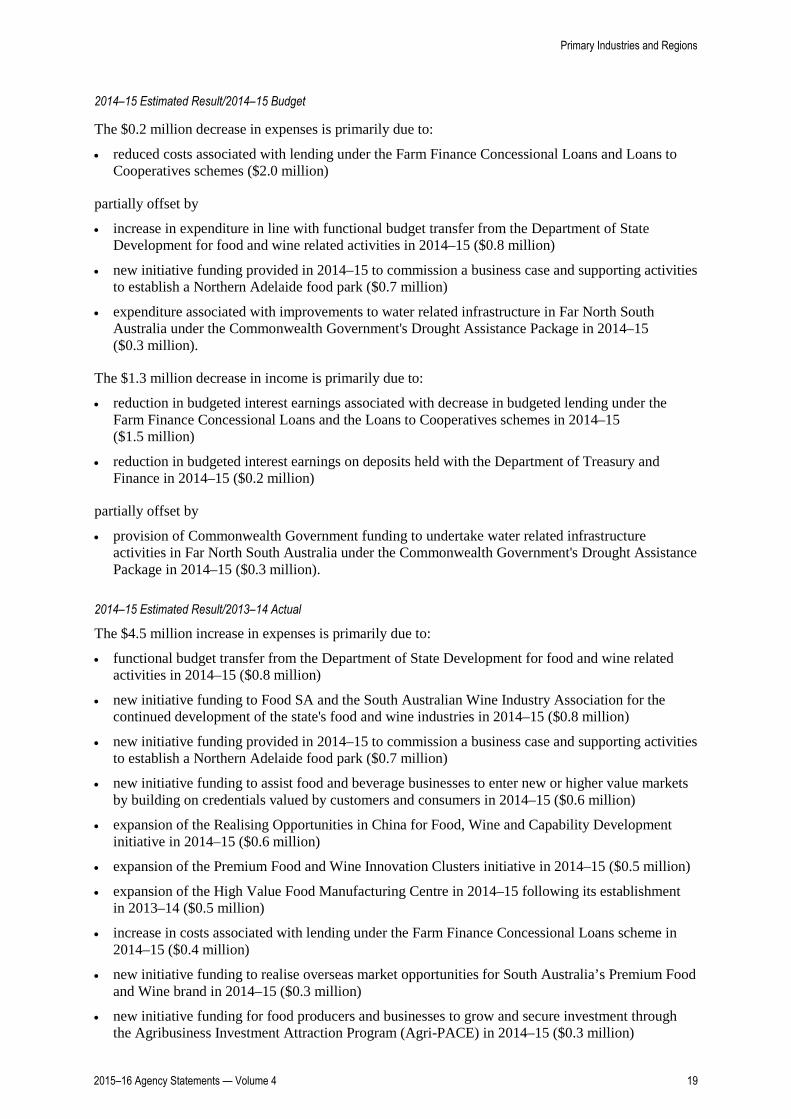
2014–15 Estimated Result/2014–15 Budget
The $0.2 million decrease in expenses is primarily due to:
• reduced costs associated with lending under the Farm Finance Concessional Loans and Loans to Cooperatives schemes ($2.0 million)
partially offset by
• increase in expenditure in line with functional budget transfer from the Department of State Development for food and wine related activities in 2014–15 ($0.8 million)
• new initiative funding provided in 2014–15 to commission a business case and supporting activities to establish a Northern Adelaide food park ($0.7 million)
• expenditure associated with improvements to water related infrastructure in Far North South Australia under the Commonwealth Government's Drought Assistance Package in 2014–15 ($0.3 million).
The $1.3 million decrease in income is primarily due to:
• reduction in budgeted interest earnings associated with decrease in budgeted lending under the Farm Finance Concessional Loans and the Loans to Cooperatives schemes in 2014–15 ($1.5 million)
• reduction in budgeted interest earnings on deposits held with the Department of Treasury and Finance in 2014–15 ($0.2 million)
partially offset by
• provision of Commonwealth Government funding to undertake water related infrastructure activities in Far North South Australia under the Commonwealth Government's Drought Assistance Package in 2014–15 ($0.3 million).
2014–15 Estimated Result/2013–14 Actual
The $4.5 million increase in expenses is primarily due to:
• functional budget transfer from the Department of State Development for food and wine related activities in 2014–15 ($0.8 million)
• new initiative funding to Food SA and the South Australian Wine Industry Association for the continued development of the state's food and wine industries in 2014–15 ($0.8 million)
• new initiative funding provided in 2014–15 to commission a business case and supporting activities to establish a Northern Adelaide food park ($0.7 million)
• new initiative funding to assist food and beverage businesses to enter new or higher value markets by building on credentials valued by customers and consumers in 2014–15 ($0.6 million)
• expansion of the Realising Opportunities in China for Food, Wine and Capability Development initiative in 2014–15 ($0.6 million)
• expansion of the Premium Food and Wine Innovation Clusters initiative in 2014–15 ($0.5 million)
• expansion of the High Value Food Manufacturing Centre in 2014–15 following its establishment in 2013–14 ($0.5 million)
• increase in costs associated with lending under the Farm Finance Concessional Loans scheme in 2014–15 ($0.4 million)
• new initiative funding to realise overseas market opportunities for South Australia’s Premium Food and Wine brand in 2014–15 ($0.3 million)
• new initiative funding for food producers and businesses to grow and secure investment through the Agribusiness Investment Attraction Program (Agri-PACE) in 2014–15 ($0.3 million)
Primary Industries and Regions
2015–16 Agency Statements — Volume 4 19

partially offset by
• completion of the Developing South Australian Food and Wine Industries initiative in 2013–14 ($1.1 million).
Highlights 2014–15
• Implemented the first round of the Building SA’s Premium Food and Wine Credentials Grant Program for the seafood industry.
• Commenced an investigation into a potential food park in northern Adelaide.
• Commenced the Functional and Luxury Food Value Chains into Asia and Australia Project.
• Ensured industry engagement and support for the LambEx 2014 National Conference.
• Utilised the new platforms of engagement developed with Shandong Government and others to foster industry connection to and trade with China, including 16 inbound missions and 3 outbound missions with participation from more than 60 companies across all agricultural and seafood sectors.
• Implemented Food Innovation Programs in PIRSA, including Round 2 of the Advanced Food Manufacturing grants program.
Targets 2015–16
• Undertake detailed planning for a potential industrial food park in northern Adelaide.
• Develop a roadmap for the Functional and Luxury Food value chains into Asia and Australia and develop proposed program and projects from the recommendations of the final reports.
• Establishment of the South Australian Food Innovation Centre.
• Continue the implementation of the China Agribusiness Initiative to foster industry engagement and market access for South Australian business in Shandong, Fujian, Hong Kong and other parts of China.
Sub-program 1.2: Aquaculture
Description/objective
Ensuring the sustainable development of South Australia’s aquaculture industry, with a statutory and regulatory responsibility for the planning and management of aquaculture in South Australia. These responsibilities are met through the zoning, granting and renewal of licences and leases under the Aquaculture Act 2001.
Through ensuring the ecologically sustainable development of the state’s aquatic resources, aquaculture will be a key contributor to South Australia’s economic priority of premium food and wine produced in our clean environment and exported to the world, securing production and economic opportunities for the future.
Primary Industries and Regions
20 2015–16 Agency Statements — Volume 4

2015–16 Budget
2014–15 Estimated
Result 2014–15 Budget
2013–14 Actual
$000 $000 $000 $000 Expenses ...................................................................... 3 599 2 754 3 569 3 016 Income .......................................................................... 2 234 1 706 2 287 1 850
Net cost of sub-program 1 365 1 048 1 282 1 166
FTEs as at June (No.) 21.3 18.8 22.7 16.3
Financial commentary
2015–16 Budget/2014–15 Estimated Result
The $0.8 million increase in expenses is primarily due to reinstatement of the expenditure base in 2015–16 that was reduced following a once-off reduction in lease and licence fee revenue in 2014–15 ($0.6 million).
The $0.5 million increase in income is primarily due to reinstatement of the revenue base in 2015–16 following a once-off reduction in lease and licence fee revenue in 2014–15 ($0.6 million).
2014–15 Estimated Result/2014–15 Budget
The $0.8 million decrease in expenses is primarily due to a reduction in expenditure as a result of a once-off reduced lease and licence fee revenue in 2014–15 following the fee setting process with industry ($0.6 million).
The $0.6 million decrease in income is primarily due to a once-off reduction in lease and licence fee revenue in 2014–15 following the fee setting process with industry ($0.6 million).
2014–15 Estimated Result/2013–14 Actual
No major variations
Highlights 2014–15
• Established four year cost recovery agreements with mussel, abalone, finfish and tuna sectors.
• Conducted a review of the Aquaculture Regulations 2005, the first complete review since their commencement in October 2005. This included an independent review of the environmental programs.
• Conducted a review of the categories assigned to land-based aquaculture licences, incorporating recommendations from an independent review process. Consultation (inter-agency, industry and public) has occurred.
• Successfully completed a disease training exercise for abalone aquaculture and wild catch sectors in November 2014, which was aimed at increasing awareness and response requirements for known abalone diseases.
Targets 2015–16
• Implement the amendments to the Aquaculture Regulations 2005, which includes changes to navigational marking, environmental monitoring, codes of practice and land-based categorisation requirements.
• Finalise the Ceduna Aquaculture Zone policy.
• Implementation of new requirements for the oyster sector to minimize environmental impacts.
Primary Industries and Regions
2015–16 Agency Statements — Volume 4 21

Sub-program 1.3: Fisheries
Description/objective
The management and administration of the living marine and freshwater resources of South Australia, as required under the Fisheries Management Act 2007. This includes the development and implementation of appropriate management plans for commercial fishing, recreational fishing and Aboriginal traditional fishing, development of government policy for sustainable resource access and allocation, and the administration of licensing and compliance services.
Through ensuring the ecologically sustainable development of the state’s aquatic resources, this sub-program will be a key contributor to South Australia’s economic priority of premium food and wine produced in our clean environment and exported to the world, securing production and economic opportunities for the future.
2015–16 Budget
2014–15 Estimated
Result 2014–15 Budget
2013–14 Actual
$000 $000 $000 $000 Expenses ...................................................................... 15 213 17 771 14 912 32 045 Income .......................................................................... 8 256 8 048 8 335 8 447
Net cost of sub-program 6 957 9 723 6 577 23 598
FTEs as at June (No.) 84.8 87.3 87.2 88.3
Financial commentary
2015–16 Budget/2014–15 Estimated Result
The $2.6 million decrease in expenses is primarily due to:
• purchase of commercial fishing licences and entitlements under the SA Marine Parks Commercial Fisheries Voluntary Catch/Effort Reduction Program in 2014–15 ($3.3 million)
partially offset by
• reinstatement of the expenditure base in 2015–16 following a once-off reduction in commercial licence fee revenue in 2014–15 ($0.4 million)
• once-off budget transfer to sub-program 1.4 South Australian Research and Development Institute to deliver on fisheries research projects in 2014–15 ($0.2 million)
• once-off reclassification to investing expenditure in 2014–15 for a fisheries vessel and other equipment ($0.1 million).
The $0.2 million increase in income is primarily due to the reinstatement of the expenditure base in 2015–16 following a once-off reduction in commercial licence fee revenue in 2014–15 ($0.3 million).
2014–15 Estimated Result/2014–15 Budget
The $2.9 million increase in expenses is primarily due to:
• purchase of commercial fishing licences and entitlements under the SA Marine Parks Commercial Fisheries Voluntary Catch/Effort Reduction program in 2014–15 ($3.3 million)
partially offset by
• once-off budget transfer to sub-program 1.4 South Australian Research and Development Institute to deliver on fisheries research projects in 2014–15 ($0.2 million)
Primary Industries and Regions
22 2015–16 Agency Statements — Volume 4

• once-off reclassification to investing expenditure in 2014–15 for a fisheries vessel and other equipment ($0.1 million).
The $0.3 million decrease in income is primarily due to reduction in revenue following the commercial licence fee setting process and agreed service delivery with industry in 2014–15 ($0.4 million).
2014–15 Estimated Result/2013–14 Actual
The $14.3 million decrease in expenses is primarily due to:
• reduced expenditure associated with purchase of commercial fishing licences and entitlements under the SA Marine Parks Commercial Fisheries Voluntary Catch/Effort Reduction program in 2014–15 ($12.4 million)
• targeted voluntary separation package (TVSP) payments in 2013–14 ($0.7 million)
• reduction in externally funded project expenditure in 2014–15 ($0.5 million)
• implementation of administrative efficiencies to meet budget savings targets in 2014–15 ($0.4 million).
The $0.4 million decrease in income is primarily due to once-off external funding for research projects partly delivered under sub-program 1.4 South Australian Research and Development Institute in 2013–14 ($0.6 million).
Highlights 2014–15
• Developed and implemented new management plans for the South Australian commercial Sardine, Spencer Gulf Prawn and Northern Zone Rock Lobster fisheries.
• Developed draft management plan for the South Australian commercial Lakes and Coorong Fishery, and undertook public consultation.
• Produced an updated report on the status of all South Australian fish stocks, using the national stock status reporting framework established in 2013, in collaboration with SARDI Aquatic Sciences.
• Annual implementation of garfish harvest strategy in management plan for the South Australian commercial Marine Scalefish Fishery.
Targets 2015–16
• Finalise and implement new management plan for the commercial Lakes and Coorong Fishery.
• Develop a stock enhancement program for Murray Cod.
• Develop an artificial reef program to provide opportunities for recreational fishers to offset access loss through marine parks.
• Undertake a review of the King George Whiting Fishery to take account of stock assessment outcomes.
Primary Industries and Regions
2015–16 Agency Statements — Volume 4 23

Sub-program 1.4: South Australian Research and Development Institute
Description/objective
South Australia’s principal provider of primary industries, natural resources and biosciences research and development, working in collaboration with state, national and international collaborators and investors. SARDI’s strategic, applied and adaptive research provides the innovation needed to underpin the competitive advantage achieved through the production of premium food and wine through secure and sustainable production systems.
2015–16 Budget
2014–15 Estimated
Result 2014–15 Budget
2013–14 Actual
$000 $000 $000 $000 Expenses ...................................................................... 77 521 79 172 74 590 75 650 Income .......................................................................... 50 795 48 226 47 056 48 692
Net cost of sub-program 26 726 30 946 27 534 26 958
FTEs as at June (No.) 407.1 411.6 418.0 408.3
Financial commentary
2015–16 Budget/2014–15 Estimated Result
The $1.7 million decrease in expenses is primarily due to:
• once-off payment to consolidated account for budgeted Flaxley Research Centre asset sales in 2014–15 ($5.3 million)
• once-off grant payment to the University of Adelaide for Roseworthy redevelopment in 2014–15 ($0.9 million)
partially offset by
• externally funded project related expenditure reductions in 2014–15 ($2.0 million)
• once-off payment to consolidated account for budgeted asset sales in 2015–16 ($1.9 million)
• once-off budgeted costs to prepare assets for sale in 2015–16 ($0.3 million).
The $2.6 million increase in income is primarily due to:
• once-off net proceeds for budgeted asset sales in 2015–16 ($2.2 million)
• lower than expected externally funded projects undertaken and project delays in 2014–15 ($2.0 million)
• higher revenue to reflect increased cost recovery together with improved leverage from externally funded grants in 2015–16 ($1.1 million)
partially offset by
• once-off revaluation for Flaxley Research Centre assets budgeted for sale in 2014–15 ($2.3 million)
• once-off net proceeds for budgeted asset sales in 2014–15 ($0.7 million).
Primary Industries and Regions
24 2015–16 Agency Statements — Volume 4

2014–15 Estimated Result/2014–15 Budget
The $4.6 million increase in expenses is primarily due to:
• once-off payment to consolidated account for budgeted Flaxley Research Centre asset sales in 2014–15 ($5.3 million)
• once-off grant payment to the University of Adelaide for Roseworthy redevelopment in 2014–15 ($0.9 million)
partially offset by
• externally funded project related expenditure reductions in 2014–15 ($2.0 million).
The $1.2 million increase in income is primarily due to:
• once-off revaluation for Flaxley Research Centre assets budgeted for sale in 2014–15 ($2.3 million)
• once-off net proceeds for budgeted asset sales in 2014–15 ($0.7 million)
partially offset by
• lower than expected externally funded projects undertaken and project delays in 2014–15 ($2.0 million).
2014–15 Estimated Result/2013–14 Actual
The $3.5 million increase in expenses is primarily due to:
• once-off payment to consolidated account for budgeted Flaxley Research Centre asset sales in 2014–15 ($5.3 million)
• once-off grant payment to the University of Adelaide for Roseworthy redevelopment in 2014–15 ($0.9 million)
• new initiative funding for the Functional Food Focus component of the Agribusiness Accelerator program in 2014–15 ($0.5 million)
partially offset by
• externally funded project related expenditure reductions in 2014–15 ($3.4 million).
The $0.5 million decrease in income is primarily due to:
• lower than expected externally funded projects undertaken and project delays in 2014–15 ($3.4 million)
• higher than budgeted revenue for sales and livestock valuation for research farms and higher diagnostic services fees in 2013–14 ($1.4 million)
• higher externally funded project revenue for investing activities in 2013–14 ($0.3 million)
partially offset by
• once-off revaluation for Flaxley Research Centre assets budgeted for sale in 2014–15 ($2.3 million)
• higher revenue to reflect increased cost recovery together with improved leverage from externally funded grants in 2014–15 ($1.8 million)
• once-off net proceeds for budgeted asset sales in 2014–15 ($0.7 million).
Primary Industries and Regions
2015–16 Agency Statements — Volume 4 25

Highlights 2014–15
• Initiated the Functional Food Research Program, which focuses on developing new products to enhance health and wellness for consumers.
• Developed DNA diagnostic technologies for use in monitoring key marine pests.
• Established South Star Poultry Alliance and the Southern Pork Alliance.
• Developed snail and slug management strategies which include the use of within paddock microwave technology to kill the pest in situ.
• Developed a new oat variety bred specifically to address low rainfall early maturity window specifically for South Australian and Western Australian growers.
Targets 2015–16
• Develop and release four new pasture species for intensive and extensive livestock production.
• Implement commercial molecular test for Phylloxera in vineyards.
• Develop new dietary formulation for feed for aquacultured kingfish.
Sub-program 1.5: Rural Services
Description/objective
Rural Solutions SA is a primary industries and natural resources consultancy business. Rural Solutions SA’s high calibre consultants deliver practical solutions for, and with their customers, by utilising their knowledge and understanding of regional communities, industries and businesses and environments and providing high quality, value for money outcomes. Customers include government agencies, natural resource management bodies, agricultural industry development organisations, food, wine, forestry, resources and energy companies, regional bodies, primary producers and community groups. Rural Solutions SA also provides coordinated front of office services at PIRSA’s main office sites across the state. Rural Solutions SA also delivers key industry improvement programs across South Australia, such as the New Horizons project.
2015–16 Budget
2014–15 Estimated
Result 2014–15 Budget
2013–14 Actual
$000 $000 $000 $000 Expenses ...................................................................... 16 445 11 825 15 864 11 068 Income .......................................................................... 13 788 9 408 13 644 7 496
Net cost of sub-program 2 657 2 417 2 220 3 572
FTEs as at June (No.) 101.9 91.9 96.4 70.8
Financial commentary
2015–16 Budget/2014–15 Estimated Result
The $4.6 million increase in expenses is primarily due to reinstatement of expenditure base in 2015–16 following lower than expected externally funded projects undertaken in 2014–15 ($4.4 million).
The $4.4 million increase in income is primarily due to reinstatement of revenue base in 2015–16 following lower than expected externally funded projects undertaken in 2014–15 ($4.4 million).
Primary Industries and Regions
26 2015–16 Agency Statements — Volume 4

2014–15 Estimated Result/2014–15 Budget
The $4.0 million decrease in expenses is primarily due to lower than expected externally funded projects undertaken in 2014–15 ($4.2 million).
The $4.2 million decrease in income is primarily due to lower than expected externally funded projects undertaken in 2014–15 ($4.2 million).
2014–15 Estimated Result/2013–14 Actual
The $0.8 million increase in expenses is primarily due to:
• higher expenditure for externally funded projects undertaken in 2014–15 ($1.9 million)
partially offset by
• TVSP payments in 2013–14 ($1.1 million).
The $1.9 million increase in income is primarily due to higher revenue for externally funded projects in 2014–15 ($1.9 million).
Highlights 2014–15
• Completed the first growing season trials for the New Horizons coordinated soil modification/improvement program across the state.
• Established a whole of government approach for camel management and identified constraints to industry development and strategies to address these constraints through the Change@SA 90 day project.
• Developed and initiated a statewide nutrient management project for the South Australia potato industry.
• Developed and initiated a project aimed at managing and treating soil acidification across the state. This includes the development of more accurate ways of mapping and measuring soil pH, resulting in substantial cost savings to farmers through applying lime only where required.
• Delivered the SheepConnect SA project in collaboration with a range of partners including Australian Wool Innovations, Commonwealth Government and Regional Natural Resource Management Boards.
Targets 2015–16
• Continue New Horizons demonstration sites and analysis to validate potential yield improvements and the economic impact across the state.
• Support the development of at least one new industry opportunity to a point at which it is business ready.
Sub-program 1.6: Biosecurity
Description/objective
Develop and implement policies, legislation, regulatory frameworks, surveillance, preparedness and response programs that protect the economy, environment, communities and human health from the negative impacts associated with the entry, establishment or spread of pests, diseases and contaminants in the areas of animal health, aquatic animal health, marine pests, vertebrate pests, weeds, plant health, food borne pathogens from primary industries and chemical residues.
Primary Industries and Regions
2015–16 Agency Statements — Volume 4 27

The programs delivered by Biosecurity SA underpin market access, maintain disease freedom and control, contributing to the success of South Australia’s economic priority of premium food and wine produced in our clean environment and exported to the world.
2015–16 Budget
2014–15 Estimated
Result 2014–15 Budget
2013–14 Actual
$000 $000 $000 $000 Expenses ...................................................................... 27 834 28 091 27 712 33 038 Income .......................................................................... 11 004 9 073 11 873 10 228
Net cost of sub-program 16 830 19 018 15 839 22 810
FTEs as at June (No.) 168.5 170.5 173.4 175.1
Financial commentary
2015–16 Budget/2014–15 Estimated Result
The $0.3 million decrease in expenses is primarily due to:
• South Australia's commitment to national eradication programs captured under the Intergovernmental Agreement on Biosecurity in 2014–15 ($0.9 million)
partially offset by
• annual indexation and enterprise bargaining agreement adjustments in 2015–16 ($0.3 million).
The $1.9 million increase in income is primarily due to an intended increase in cost recovery in 2015–16 ($2.0 million).
2014–15 Estimated Result/2014–15 Budget
The $0.4 million increase in expenses is primarily due to:
• South Australia's commitment to national eradication programs captured under the Intergovernmental Agreement on Biosecurity in 2014–15 ($0.9 million)
partially offset by
• budgeted payment to the consolidated account relating to asset sales in 2014–15 transferred to sub-program 1.4 South Australian Research Development Institute ($0.7 million).
The $2.8 million decrease in income is primarily due to:
• reduction in budgeted cost recovery in 2014–15 ($2.2 million)
• budgeted revenue from asset sales in 2014–15 transferred to sub-program 1.4 South Australian Research Development Institute ($0.7 million).
2014–15 Estimated Result/2013–14 Actual
The $4.9 million decrease in expenses is primarily due to:
• once-off expenditure in 2013–14 for fruit fly eradication responses primarily in the Riverland and Sellicks Beach ($1.8 million)
• TVSP payments in 2013–14 ($1.1 million)
• completion of the national plan for transitioning of the Branched Broomrape eradication program to a management program in 2013–14 ($0.8 million)
Primary Industries and Regions
28 2015–16 Agency Statements — Volume 4

• implementation of administrative efficiencies to meet budget savings targets in 2014–15 ($0.6 million)
• reduction in once-off externally funded project expenditure in 2014–15 ($0.4 million)
• completion of the National Feral Camel Action Plan in Aboriginal lands and rangelands funded under the State Natural Resources Management program in 2013–14 ($0.4 million).
The $1.2 million decrease in income is primarily due to:
• reduction in revenue under the State Natural Resources Management program following completion of the National Feral Camel Action Plan in Aboriginal lands and rangelands in 2013–14 ($0.4 million)
• reduction in once-off external funding received in 2013–14 for a variety of project expenditures ($0.3 million)
• a reduction in Commonwealth Government funding following completion of the national plan for transitioning the Branched Broomrape eradication program to a management program in 2013–14 ($0.2 million).
Highlights 2014–15
• Completed building plans for the Sterile Insect Technology Facility at Port Augusta and released the building tender.
• Successfully eradicated two separate Queensland Fruit Fly incursions from the Riverland and minimised potential disruption to trade from isolated fruit fly incursions.
• Assessment completed of animal health services by the World Organisation for Animal Health.
• Successfully eradicated an exotic plant pest (Potato Spindle Tuber Viroid) from a Northern Adelaide Plains tomato glasshouse property.
• Implemented the State Buffel Grass Strategic Plan including mapping, control and research.
• Undertook 85 on-farm disease investigations to exclude foot-and-mouth disease, highly pathogenic avian influenza, Newcastle disease, Hendra virus, West Nile virus and bluetongue virus.
• Delivered 50 000 aerial wild dog baits over a 10 000 kilometre flight path across 96 properties in the South Australian Arid Lands region south of the dog fence to assist in dog control.
• Completed development and released a South Australian weed control application for land holders to have ready access to control methods for declared plants on their mobile phones.
• Completed Phase 3 of the Declared Plant Review with 51 changes to plant declarations under the Natural Resources Management Act 2004.
Targets 2015–16
• Commence the building of the Sterile Insect Technology Facility at Port Augusta.
• Commence trial phase of One Biosecurity program to improve on-farm biosecurity in the animal production arena.
• Maintain horticulture export market access for the Riverland production area by retaining the region’s fruit fly pest free area status.
• Successfully deploy a Giant Pine Scale national eradication response plan in South Australia.
Primary Industries and Regions
2015–16 Agency Statements — Volume 4 29

Sub-program 1.7: South Australian River Murray Sustainability
Description/objective
The $265 million South Australian River Murray Sustainability Program (SARMS) is funded by the Commonwealth Government to support the sustainability of South Australian River Murray communities through investment in irrigation efficiencies, water returns, irrigation industry assistance and regional economic development. The program will return 40 gigalitres of water to the River Murray system and will contribute towards South Australia’s implementation of the Murray-Darling Basin Plan.
SARMS will assist South Australian Murray-Darling Basin industries and communities to prepare for the challenges presented by future climate change and changed River Murray operations as a result of implementation of the Murray-Darling Basin Plan.
2015–16 Budget
2014–15 Estimated
Result 2014–15 Budget
2013–14 Actual
$000 $000 $000 $000 Expenses ...................................................................... 80 355 74 974 68 255 3 205 Income .......................................................................... 80 155 61 740 72 555 23 539
Net cost of sub-program 200 13 234 -4 300 -20 334
FTEs as at June (No.) 17.0 17.0 17.0 12.5
Financial commentary
2015–16 Budget/2014–15 Estimated Result
The $5.4 million increase in expenses is primarily due to:
• increased irrigation industry improvement activities in 2015–16 ($6.8 million)
partially offset by
• reduced regional economic development activities in 2015–16 ($1.4 million).
The $18.4 million increase in income is primarily due to:
• additional Commonwealth Government funding for irrigation industry improvement activities in 2015–16 ($20.4 million)
partially offset by
• lower Commonwealth Government funding for regional economic development activities in 2015–16 ($2.0 million).
2014–15 Estimated Result/2014–15 Budget
The $6.7 million increase in expenses is primarily due to carryover of expenditure from 2013–14 for irrigation industry improvement activities ($6.5 million) and regional economic development activities ($0.1 million).
The $10.8 million decrease in income is primarily due to higher than budgeted funding from the Commonwealth Government in 2013–14 for irrigation industry improvement activities ($7.1 million) and regional economic development ($3.7 million).
Primary Industries and Regions
30 2015–16 Agency Statements — Volume 4

2014–15 Estimated Result/2013–14 Actual
The $71.8 million increase in expenses is primarily due to the first full year of operation for the SARMS program following its commencement in 2013–14, resulting in increased irrigation industry improvement activities ($63.5 million) and regional economic development activities ($8.3 million).
The $38.2 million increase in income is primarily due to the first full year of Commonwealth Government funding for the SARMS program following its commencement in 2013–14, resulting in increased irrigation industry improvement activities ($36.2 million) and regional economic development activities ($2.0 million) in 2014–15.
Highlights 2014–15
• Delivered Round 1 of the $240 million Irrigation Industry Improvement Program to support the required adjustment of the irrigation industry along the River Murray in response to the Murray-Darling Basin Plan.
• Returned 20.2 gigalitres of permanent water access entitlements from South Australian River Murray irrigators to the Commonwealth Government as part of South Australia’s share of the Murray-Darling Basin Plan’s water recovery target and secured over $100 million of on-ground investment with River Murray irrigators.
• Commenced the refurbishment and approved concept designs of Loxton Research Centre to enable the facility to operate as the Riverland and Mallee Primary Producers’ Business and Research Centre and support regional development.
• Delivered Round 1 of the Industry-Led Applied Research Sub-Program to improve South Australian River Murray regional productivity and innovation.
• Delivered Round 1 of the Regional Development and Innovation Fund Sub-Program to support regional development, employment opportunities or economic diversification in the River Murray Region.
• Maintained a program within SARMS to engage with Aboriginal groups through the development of partnerships, thereby allowing the groups to understand the programs and consider opportunities to increase their participation in regional economic development.
Targets 2015–16
• Continue to deliver the $240 million Irrigation Industry Improvement Program to support the required adjustment of the irrigation industry along the River Murray in response to the Murray-Darling Basin Plan.
• Commence construction on the new redevelopment of the Loxton Research Centre to enable the facility to operate as the Riverland and Mallee Primary Producers’ Business and Research Centre and support regional development.
• Continue to deliver the Industry-Led Applied Research Sub-Program to improve South Australian River Murray regional productivity and innovation.
• Continue to deliver the Regional Development and Innovation Sub-Program to support regional development, employment opportunities or economic diversification in the River Murray Region.
Primary Industries and Regions
2015–16 Agency Statements — Volume 4 31

Program 2: Forestry Policy
Description/objective
Support the sustainable development of an internationally competitive forest industry, regional development and the provision of services to the state government’s forest estate.
Program summary — expenses, income and FTEs
2015–16 Budget
2014–15 Estimated
Result 2014–15 Budget
2013–14 Actual
$000 $000 $000 $000
Expenses Employee benefit expenses.......................................... 784 803 605 726 Supplies and services ................................................... 461 465 419 406 Grants and subsidies .................................................... — — 7 006 4 889 Intra-government transfers ........................................... 6 502 685 — —
Total expenses 7 747 1 953 8 030 6 021
Total income — — — —
Net cost of providing services 7 747 1 953 8 030 6 021
FTEs as at June (No.) 5.2 5.2 4.2 5.4
Financial commentary
2015–16 Budget/2014–15 Estimated Result
The $5.8 million increase in expenses is due to increased expenditure relating to the South East Forestry Partnership program in 2015–16 ($5.8 million).
2014–15 Estimated Result/2014–15 Budget
The $6.1 million decrease in expenses is primarily due to reduction in budgeted expenditure for the South East Forestry Partnership Program in 2014–15 with carryover of expenditure into future years ($6.3 million).
2014–15 Estimated Result/2013–14 Actual
The $4.1 million decrease in expenses is primarily due to decreased expenditure associated with the South East Forestry Partnership Program in 2014–15 ($4.2 million).
Highlights 2014–15
• Monitored compliance with the ForestrySA forward sale government contract requirements.
• Progressed the $27 million South East Forestry Partnership Program that supports capital investment in the forestry sector in the south east of South Australia.
• Released the South Australian Forest and Wood Products Industry Policy Statement.
• Facilitated industry readiness for the commencement of the Illegal Logging Regulations in November 2014.
Primary Industries and Regions
32 2015–16 Agency Statements — Volume 4
Targets 2015–16
• Continue monitoring compliance with the ForestrySA forward sale government contract requirements.
• Initiate a new industry engagement model with the Forest and Wood products sector.
• Determine a way forward for the Wirrabara and Bundaleer forests by leading the inter-agency review group.
Primary Industries and Regions
2015–16 Agency Statements — Volume 4 33
Program 3: Regional Development
Description/objective
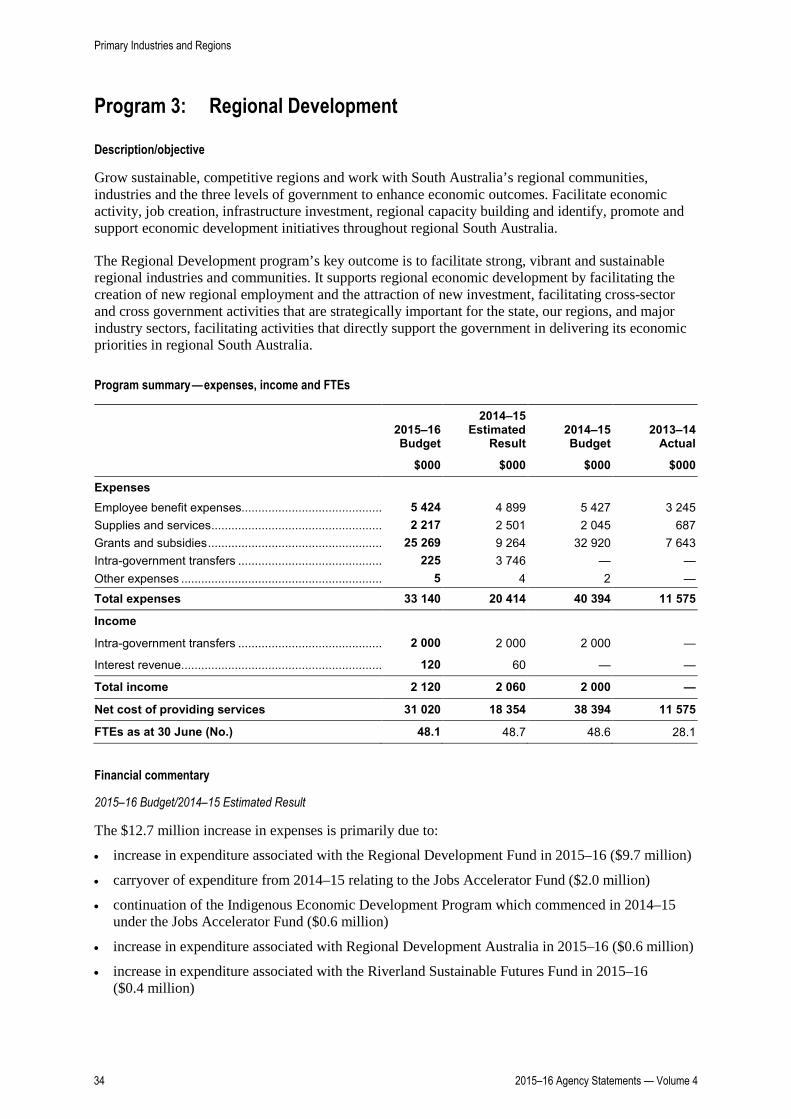
Grow sustainable, competitive regions and work with South Australia’s regional communities, industries and the three levels of government to enhance economic outcomes. Facilitate economic activity, job creation, infrastructure investment, regional capacity building and identify, promote and support economic development initiatives throughout regional South Australia.
The Regional Development program’s key outcome is to facilitate strong, vibrant and sustainable regional industries and communities. It supports regional economic development by facilitating the creation of new regional employment and the attraction of new investment, facilitating cross-sector and cross government activities that are strategically important for the state, our regions, and major industry sectors, facilitating activities that directly support the government in delivering its economic priorities in regional South Australia.
Program summary — expenses, income and FTEs
2015–16 Budget
2014–15 Estimated
Result 2014–15 Budget
2013–14 Actual
$000 $000 $000 $000
Expenses Employee benefit expenses.......................................... 5 424 4 899 5 427 3 245 Supplies and services ................................................... 2 217 2 501 2 045 687 Grants and subsidies .................................................... 25 269 9 264 32 920 7 643 Intra-government transfers ........................................... 225 3 746 — — Other expenses ............................................................ 5 4 2 —
Total expenses 33 140 20 414 40 394 11 575
Income
Intra-government transfers ........................................... 2 000 2 000 2 000 —
Interest revenue ............................................................ 120 60 — —
Total income 2 120 2 060 2 000 —
Net cost of providing services 31 020 18 354 38 394 11 575
FTEs as at 30 June (No.) 48.1 48.7 48.6 28.1
Financial commentary
2015–16 Budget/2014–15 Estimated Result
The $12.7 million increase in expenses is primarily due to:
• increase in expenditure associated with the Regional Development Fund in 2015–16 ($9.7 million)
• carryover of expenditure from 2014–15 relating to the Jobs Accelerator Fund ($2.0 million)
• continuation of the Indigenous Economic Development Program which commenced in 2014–15 under the Jobs Accelerator Fund ($0.6 million)
• increase in expenditure associated with Regional Development Australia in 2015–16 ($0.6 million)
• increase in expenditure associated with the Riverland Sustainable Futures Fund in 2015–16 ($0.4 million)
Primary Industries and Regions
34 2015–16 Agency Statements — Volume 4

partially offset by
• reduction in expenditure associated with Enterprise Zone Fund for the Upper Spencer Gulf and Outback in 2015–16 ($0.2 million).
2014–15 Estimated Result/2014–15 Budget
The $20.0 million decrease in expenses is primarily due to:
• lower than budgeted expenditure for the Regional Development Fund with carryover of funds into future years ($12.3 million)
• reclassification of expenditure under the Jobs Accelerator Fund to financing expenditure for Regions Loans Scheme from 2014–15 ($4.0 million)
• lower than budgeted expenditure for the Jobs Accelerator Fund with carryover of funds into 2015–16 ($2.0 million)
• continuation of the Indigenous Economic Development Program into 2015–16 under the Jobs Accelerator Fund ($1.0 million)
• lower than budgeted expenditure for the Riverland Sustainable Futures Fund with carryover of funds into 2015–16 ($0.7 million).
2014–15 Estimated Result/2013–14 Actual
The $8.8 million increase in expenses is primarily due to:
• increase in expenditure associated with the Regional Development Fund in 2014–15 ($4.7 million)
• first full year of expenditure associated with departmental allocated overheads ($1.0 million) and the office of the Minister for Regional Development in 2014–15 ($1.1 million)
• key regional initiatives in 2014–15 funded from the Save The River Murray Fund ($2.0 million)
• increase in expenditure associated with Regional Development Australia in 2014–15 ($1.4 million)
• first full year of operation following establishment of Regions SA division to provide a clear, strategic focus to state government regional activity in 2014–15 ($1.3 million)
partially offset by
• lower than budgeted expenditure for the Riverland Sustainable Futures Fund in 2013–14 with carryover into 2015–16 ($2.8 million).
The $2.1 million increase in income is primarily due to funding sourced from the Save the River Murray Fund to be applied towards key regional initiatives in 2014–15 ($2.0 million).
Highlights 2014–15
• Supported the four Country Cabinet meetings held at Renmark in the Riverland, Strathalbyn in the Adelaide Hills and Alexandrina area, Streaky Bay on the West Coast, and Jamestown in the Mid North.
• Supported the Regional South Australia Cabinet Committee to ensure greater focus on the needs of regional South Australia in the making of government decisions and improved coordination of government programs.
• Developed, in conjunction with the seven non-metropolitan Regional Development Australia Associations, a framework for collaboration to support merit-based proposals and program-driven initiatives for regional development.
• Held the inaugural Regional Summit in Whyalla on 20 May 2015.
Primary Industries and Regions
2015–16 Agency Statements — Volume 4 35

Targets 2015–16
• Facilitate job creation and investment in regions by supporting private sector and community based projects with the Regional Development Fund through:
– facilitating consideration of priority projects from South Australia for funding by the Commonwealth Government including the National Stronger Regions Fund
– contributing to a second Regional Summit in regional South Australia.
Primary Industries and Regions
36 2015–16 Agency Statements — Volume 4

Primary Industries and Regions
Statement of comprehensive income______________________________________________________________________________________________________________________________________________________________________________________________________________
2015–16Budget
$000
2014–15Estimated
Result
$000
2014–15Budget
$000
2013–14Actual
$000
Expenses
Employee benefit expenses Salaries, wages, annual and sick leave .........................................................................................................................................................................76 023 72 443 74 324 68 571 Long service leave .........................................................................................................................................................................3 664 3 552 3 573 2 360 Payroll tax .........................................................................................................................................................................3 929 3 656 3 668 3 988 Superannuation .........................................................................................................................................................................8 674 8 258 8 264 7 229 Other .........................................................................................................................................................................1 421 1 528 1 404 6 686Supplies and services General supplies and services ................................................................................................................................................................................57 641 55 630 56 353 50 900 Consultancy expenses ................................................................................................................................................................................572 558 558 —Depreciation and amortisation expenses .........................................................................................................................................................................5 968 5 833 6 713 5 740Borrowing costs .........................................................................................................................................................................1 778 569 2 030 652Grants and subsidies .........................................................................................................................................................................108 299 88 755 109 930 30 424Intra-government transfers .........................................................................................................................................................................7 423 5 142 675 748Other expenses .........................................................................................................................................................................3 152 6 936 1 977 956
Total expenses 278 544 252 860 269 469 178 254
Income
Commonwealth revenues ................................................................................................................................................................................83 298 66 343 76 298 27 254Intra-government transfers ................................................................................................................................................................................19 639 19 800 19 629 20 404Other grants ................................................................................................................................................................................30 487 27 565 29 973 28 436Fees, fines and penalties ................................................................................................................................................................................5 014 2 099 5 169 2 252Sales of goods and services ................................................................................................................................................................................24 768 19 595 24 301 18 911Interest revenues ................................................................................................................................................................................3 532 2 704 4 198 2 218Net gain or loss from disposal of assets ................................................................................................................................................................................2 212 1 181 680 -58Other income ................................................................................................................................................................................2 896 5 140 2 992 4 947
Total income 171 846 144 427 163 240 104 364
Net cost of providing services 106 698 108 433 106 229 73 890
Income from/expenses to state government
Income Appropriation ................................................................................................................................................................................104 085 90 746 106 229 77 136 Other income ................................................................................................................................................................................— 3 021 — 20 446
Net income from/expenses to state government 104 085 93 767 106 229 97 582
Net result -2 613 -14 666 — 23 692
Other comprehensive income
Changes in property, plant and equipment assetrevaluation surplus ................................................................................................................................................................................— -465 — —
Total comprehensive result -2 613 -15 131 — 23 692
Primary Industries and Regions
2015–16 Agency Statements — Volume 4 37

Primary Industries and Regions
Statement of financial position______________________________________________________________________________________________________________________________________________________________________________________________________________
2015–16Budget
$000
2014–15Estimated
Result
$000
2014–15Budget
$000
2013–14Actual
$000
Assets
Current assets
Cash and cash equivalents .......................................................................................................................................81 211 109 099 92 234 114 537Receivables .......................................................................................................................................67 935 49 250 72 077 32 965Inventories .......................................................................................................................................181 181 373 181Other current assets .......................................................................................................................................173 173 143 173
Total current assets 149 500 158 703 164 827 147 856
Non current assets
Financial assets .......................................................................................................................................4 519 4 519 4 501 4 501Land and improvements .......................................................................................................................................92 986 88 333 90 650 91 362Plant and equipment .......................................................................................................................................17 063 14 637 16 560 12 503Heritage assets .......................................................................................................................................— — 49 —Intangible assets .......................................................................................................................................2 387 2 968 2 107 3 544Biological assets - other .......................................................................................................................................1 918 1 918 1 874 1 918Other non-current assets .......................................................................................................................................58 58 78 58
Total non-current assets 118 931 112 433 115 819 113 886
Total assets 268 431 271 136 280 646 261 742
Liabilities
Current liabilities
Payables .................................................................................................................................................................................11 033 10 780 11 088 10 652Short-term borrowings .................................................................................................................................................................................35 206 37 506 63 745 14 156Employee benefits Salaries and wages .................................................................................................................................................................................1 330 633 673 290 Annual leave .................................................................................................................................................................................5 780 5 481 6 104 5 236 Long service leave .................................................................................................................................................................................2 056 1 919 2 261 1 782 Other .................................................................................................................................................................................485 485 436 485Short-term provisions .................................................................................................................................................................................511 503 560 495Other current liabilities .................................................................................................................................................................................14 601 14 678 12 124 14 723
Total current liabilities 71 002 71 985 96 991 47 819
Non current liabilities
Long-term borrowings ................................................................................................................................................................................9 303 9 303 — 9 303Long-term employee benefits Long service leave ................................................................................................................................................................................20 967 20 161 21 286 19 811Long-term provisions ................................................................................................................................................................................1 952 1 867 2 065 1 781Other non-current liabilities ................................................................................................................................................................................83 83 — 160
Total non-current liabilities 32 305 31 414 23 351 31 055
Total liabilities 103 307 103 399 120 342 78 874
Net assets 165 124 167 737 160 304 182 868
Primary Industries and Regions
38 2015–16 Agency Statements — Volume 4

Primary Industries and Regions
Statement of financial position______________________________________________________________________________________________________________________________________________________________________________________________________________
2015–16Budget
$000
2014–15Estimated
Result
$000
2014–15Budget
$000
2013–14Actual
$000
Equity
Retained earnings .......................................................................................................................................127 634 130 247 122 524 144 913Asset revaluation reserve .......................................................................................................................................37 490 37 490 37 780 37 955
Total equity 165 124 167 737 160 304 182 868
Balances as at 30 June end of period.
Primary Industries and Regions
2015–16 Agency Statements — Volume 4 39

Primary Industries and Regions
Statement of cash flows______________________________________________________________________________________________________________________________________________________________________________________________________________
2015–16Budget
$000
2014–15Estimated
Result
$000
2014–15Budget
$000
2013–14Actual
$000
Operating activities
Cash outflows
Employee benefit payments ..............................................................................................................................................................................91 523 88 237 89 591 89 282Payments for supplies and services ..............................................................................................................................................................................58 290 56 310 57 185 51 414Interest paid ..............................................................................................................................................................................1 778 569 2 030 651Grants and subsidies ..............................................................................................................................................................................108 299 88 755 109 930 28 895GST paid ..............................................................................................................................................................................— — — 9 750Intra-government transfers ..............................................................................................................................................................................7 423 5 142 675 748Other payments ..............................................................................................................................................................................3 055 6 839 1 880 682
Cash used in operations 270 368 245 852 261 291 181 422
Cash inflows
Intra-government transfers ..........................................................................................................................................................................19 639 19 800 19 629 20 404Commonwealth receipts ..........................................................................................................................................................................83 298 66 343 76 298 19 039Other grants ..........................................................................................................................................................................30 487 27 565 29 973 31 423Fees, fines and penalties ..........................................................................................................................................................................5 014 2 099 5 169 2 452Sales of goods and services ..........................................................................................................................................................................16 768 27 595 24 301 19 299Interest received ..........................................................................................................................................................................3 532 2 704 4 198 1 479GST received ..........................................................................................................................................................................— — — 9 057Other receipts ..........................................................................................................................................................................2 896 2 830 2 992 3 570
Cash generated from operations 161 634 148 936 162 560 106 723
State government
Appropriation ..............................................................................................................................................................................104 085 90 746 106 229 77 136Other receipts ..............................................................................................................................................................................— 3 021 — 20 446
Net cash provided by state government 104 085 93 767 106 229 97 582
Net cash provided by (+)/used in (-) operating activities -4 649 -3 149 7 498 22 883
Investing activities
Cash outflows
Purchase of property, plant and equipment .......................................................................................................................................12 446 7 883 7 370 4 095Purchase of intangibles .......................................................................................................................................20 25 — 1 487Advances paid .......................................................................................................................................14 000 27 450 36 300 2 147Other payments .......................................................................................................................................— 18 — —
Cash used in investing activities 26 466 35 376 43 670 7 729
Cash inflows
Proceeds from sale of property, plant and equipment .......................................................................................................................................2 212 6 572 680 214Repayment of advances .......................................................................................................................................3 315 3 165 4 026 6 642Other receipts .......................................................................................................................................— — — 1 410
Cash generated from investing activities 5 527 9 737 4 706 8 266
Net cash provided by (+)/used in (-) investing activities -20 939 -25 639 -38 964 537
Primary Industries and Regions
40 2015–16 Agency Statements — Volume 4
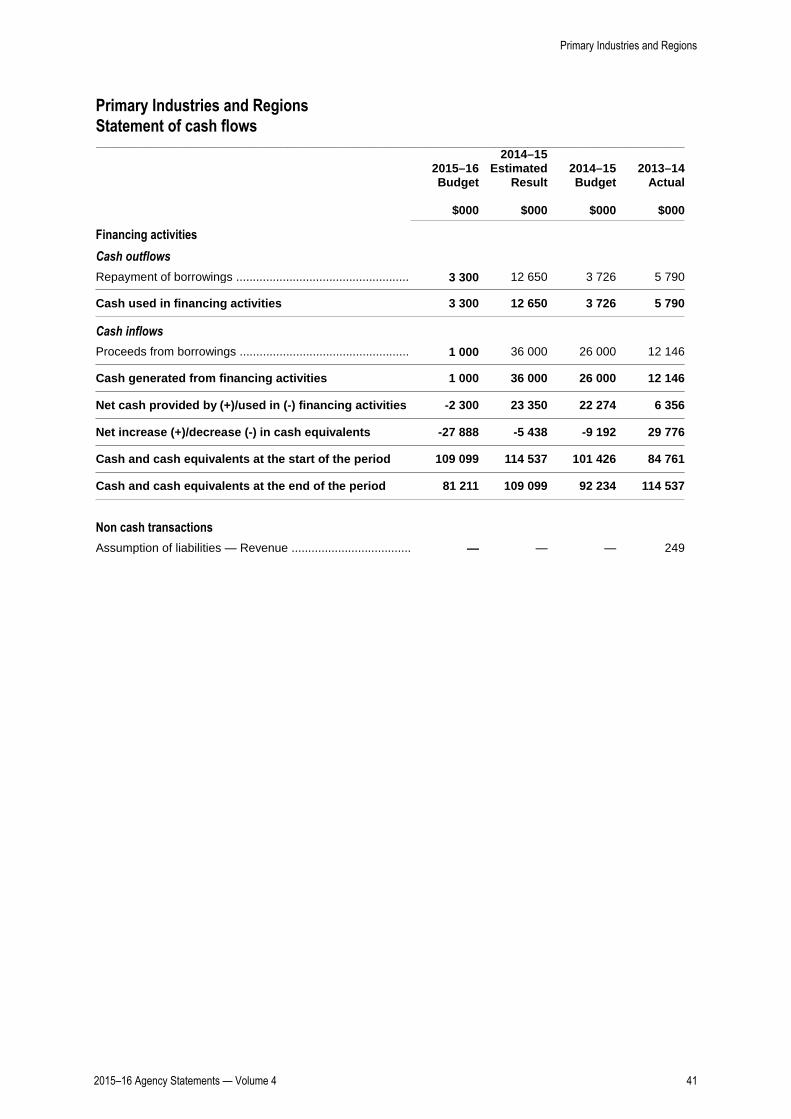
Primary Industries and Regions
Statement of cash flows______________________________________________________________________________________________________________________________________________________________________________________________________________
2015–16Budget
$000
2014–15Estimated
Result
$000
2014–15Budget
$000
2013–14Actual
$000
Financing activities
Cash outflows
Repayment of borrowings ..............................................................................................................................................................................3 300 12 650 3 726 5 790
Cash used in financing activities 3 300 12 650 3 726 5 790
Cash inflows
Proceeds from borrowings .............................................................................................................................................................................1 000 36 000 26 000 12 146
Cash generated from financing activities 1 000 36 000 26 000 12 146
Net cash provided by (+)/used in (-) financing activities -2 300 23 350 22 274 6 356
Net increase (+)/decrease (-) in cash equivalents -27 888 -5 438 -9 192 29 776
Cash and cash equivalents at the start of the period 109 099 114 537 101 426 84 761
Cash and cash equivalents at the end of the period 81 211 109 099 92 234 114 537
Non cash transactions
Assumption of liabilities — Revenue ...............................................................................................................................................................................— — — 249
Primary Industries and Regions
2015–16 Agency Statements — Volume 4 41

Administered items for the Department of Primary Industries and Regions
Statement of comprehensive income______________________________________________________________________________________________________________________________________________________________________________________________________________
2015–16Budget
$000
2014–15Estimated
Result
$000
2014–15Budget
$000
2013–14Actual
$000
Expenses
Employee benefit expenses Salaries, wages, annual and sick leave .........................................................................................................................................................................602 590 590 1 109 Long service leave .........................................................................................................................................................................— — — 74 Payroll tax .........................................................................................................................................................................— — 1 55 Superannuation .........................................................................................................................................................................— — 1 89 Other .........................................................................................................................................................................89 86 81 179Supplies and services General supplies and services ................................................................................................................................................................................1 727 2 723 1 962 3 192Depreciation and amortisation expenses .........................................................................................................................................................................— — — 411Grants and subsidies .........................................................................................................................................................................13 624 14 082 13 582 111 822Intra-government transfers .........................................................................................................................................................................18 283 18 030 17 961 18 476Other expenses .........................................................................................................................................................................108 123 116 192
Total expenses 34 433 35 634 34 294 135 599
Income
Commonwealth revenues ................................................................................................................................................................................— — — 99 032Intra-government transfers ................................................................................................................................................................................769 749 743 1 472Other grants ................................................................................................................................................................................— — — 18Fees, fines and penalties ................................................................................................................................................................................16 429 15 282 16 467 15 305Sales of goods and services ................................................................................................................................................................................782 667 782 312Interest revenues ................................................................................................................................................................................530 521 532 587Net gain or loss from disposal of assets ................................................................................................................................................................................— — — -12Other income ................................................................................................................................................................................11 024 11 000 11 061 12 679
Total income 29 534 28 219 29 585 129 393
Income from/expenses to state government
Income Appropriation ................................................................................................................................................................................4 701 4 868 3 901 4 918
Net income from/expenses to state government 4 701 4 868 3 901 4 918
Total comprehensive result -198 -2 547 -808 -1 288
Primary Industries and Regions
42 2015–16 Agency Statements — Volume 4

Administered items for the Department of Primary Industries and Regions
Statement of financial position______________________________________________________________________________________________________________________________________________________________________________________________________________
2015–16Budget
$000
2014–15Estimated
Result
$000
2014–15Budget
$000
2013–14Actual
$000
Assets
Current assets
Cash and cash equivalents .......................................................................................................................................19 244 19 441 23 142 23 611Receivables .......................................................................................................................................272 272 775 312Inventories .......................................................................................................................................193 193 149 193
Total current assets 19 709 19 906 24 066 24 116
Non current assets
Land and improvements .......................................................................................................................................55 55 57 5 273Plant and equipment .......................................................................................................................................12 12 13 1 402
Total non-current assets 67 67 70 6 675
Total assets 19 776 19 973 24 136 30 791
Liabilities
Current liabilities
Payables .................................................................................................................................................................................524 523 5 625 696Employee benefits Salaries and wages .................................................................................................................................................................................5 5 — 8 Annual leave .................................................................................................................................................................................— — — 77 Long service leave .................................................................................................................................................................................— — — 33 Other .................................................................................................................................................................................— — — 9Short-term provisions .................................................................................................................................................................................— — — 1Other current liabilities .................................................................................................................................................................................677 677 951 939
Total current liabilities 1 206 1 205 6 576 1 763
Non current liabilities
Long-term employee benefits Long service leave ................................................................................................................................................................................— — — 365Long-term provisions ................................................................................................................................................................................— — — 2
Total non-current liabilities — — — 367
Total liabilities 1 206 1 205 6 576 2 130
Net assets 18 570 18 768 17 560 28 661
Equity
Retained earnings .......................................................................................................................................18 560 18 758 17 550 27 219Asset revaluation reserve .......................................................................................................................................10 10 10 1 442
Total equity 18 570 18 768 17 560 28 661
Balances as at 30 June end of period.
Primary Industries and Regions
2015–16 Agency Statements — Volume 4 43

Administered items for the Department of Primary Industries and Regions
Statement of cash flows______________________________________________________________________________________________________________________________________________________________________________________________________________
2015–16Budget
$000
2014–15Estimated
Result
$000
2014–15Budget
$000
2013–14Actual
$000
Operating activities
Cash outflows
Employee benefit payments ..............................................................................................................................................................................691 675 666 1 417Payments for supplies and services ..............................................................................................................................................................................1 726 2 724 1 963 3 696Grants and subsidies ..............................................................................................................................................................................13 624 14 082 13 582 112 045Intra-government transfers ..............................................................................................................................................................................18 283 18 030 17 961 18 447Other payments ..............................................................................................................................................................................108 123 116 4 465
Cash used in operations 34 432 35 634 34 288 140 070
Cash inflows
Intra-government transfers ..........................................................................................................................................................................769 749 743 1 472Commonwealth receipts ..........................................................................................................................................................................— — — 99 358Fees, fines and penalties ..........................................................................................................................................................................16 429 15 282 16 467 15 266Sales of goods and services ..........................................................................................................................................................................782 667 782 351Interest received ..........................................................................................................................................................................530 521 532 591Other receipts ..........................................................................................................................................................................11 024 11 000 11 061 12 680
Cash generated from operations 29 534 28 219 29 585 129 718
State government
Appropriation ..............................................................................................................................................................................4 701 4 868 3 901 4 918
Net cash provided by state government 4 701 4 868 3 901 4 918
Net cash provided by (+)/used in (-) operating activities -197 -2 547 -802 -5 434
Investing activities
Cash outflows
Purchase of property, plant and equipment .......................................................................................................................................— — — 148
Cash used in investing activities — — — 148
Net cash provided by (+)/used in (-) investing activities — — — -148
Primary Industries and Regions
44 2015–16 Agency Statements — Volume 4

Administered items for the Department of Primary Industries and Regions
Statement of cash flows______________________________________________________________________________________________________________________________________________________________________________________________________________
2015–16Budget
$000
2014–15Estimated
Result
$000
2014–15Budget
$000
2013–14Actual
$000
Financing activities
Cash outflows
Cash transfers from restructuring activities ...............................................................................................................................................................................— 1 623 1 623 —
Cash used in financing activities — 1 623 1 623 —
Cash inflows
Proceeds from restructuring activities .............................................................................................................................................................................— — — 1 622
Cash generated from financing activities — — — 1 622
Net cash provided by (+)/used in (-) financing activities — -1 623 -1 623 1 622
Net increase (+)/decrease (-) in cash equivalents -197 -4 170 -2 425 -3 960
Cash and cash equivalents at the start of the period 19 441 23 611 25 567 27 571
Cash and cash equivalents at the end of the period 19 244 19 441 23 142 23 611
Primary Industries and Regions
2015–16 Agency Statements — Volume 4 45

Summary of major variations
The following commentary relates to variations between the 2015–16 Budget and the 2014–15 Estimated Result.
Statement of comprehensive income — controlled
Expenses
The $25.7 million increase in expenses is primarily due to:
• increase in expenditure associated with the Regional Development Fund in 2015–16 ($9.7 million)
• increase in expenditure relating to the South East Forestry Partnership program in 2015–16 ($5.8 million)
• increased expenditure under the South Australian River Murray Sustainability Program in 2015–16 ($5.4 million)
• annual indexation and enterprise bargaining agreement adjustments in 2015–16 ($4.6 million)
• reinstatement of expenditure base in 2015–16 following lower than expected externally funded projects undertaken in Rural Services in 2014–15 ($4.4 million)
• carryover of expenditure from 2014–15 relating to the Job Accelerator Fund ($2.0 million)
• once-off payment to consolidated account for budgeted asset sales in 2015–16 ($1.9 million)
• expansion of new initiative funding provided in 2014–15 to commission a business case and supporting activities to establish a Northern Adelaide food park ($0.6 million)
partially offset by
• once-off payment to consolidated account for budgeted Flaxley Research Centre asset sales in 2014–15 ($5.3 million)
• once-off purchase of commercial fishing licences and entitlements under the SA Marine Parks Commercial Fisheries Voluntary Catch/Effort Reduction Program in 2014–15 ($3.3 million).
Income
The $27.4 million increase in income is primarily due to:
• additional Commonwealth Government funding for the South Australian River Murray Sustainability Program in 2015–16 ($18.4 million)
• reinstatement of revenue base in 2015–16 following lower than expected externally funded projects undertaken in Rural Services in 2014–15 ($4.4 million)
• once-off net proceeds for budgeted asset sales in 2015–16 ($2.2 million)
• revenue increases associated with budgeted cost recovery initiatives in 2015–16 ($2.0 million).
Statement of financial position ― controlled
The $2.7 million decrease in total assets is primarily due to:
• continuing depreciation and amortisation charges on the department’s asset base ($6.0 million)
• a reduction in amounts advanced and repaid under the Loans to Cooperatives scheme in 2014–15 ($2.3 million)
Primary Industries and Regions
46 2015–16 Agency Statements — Volume 4

• reductions in cash holdings in relation to funds held and used for:
– the South Australian River Murray Sustainability Program ($14.0 million)
– Farm Finance Concessional Loans scheme ($5.0 million)
– Drought Concessional Loans scheme ($8.0 million)
– reduced interest on loans and deposits ($0.9 million)
– reduced cash balances from carryover projects from 2013–14 ($0.6 million)
partially offset by
• capital investment and minor works budgeted in 2015–16 ($12.5 million)
• budgeted advances under the Farm Finance Concessional Loans ($5.0 million) and Drought Concessional Loans schemes ($8.0 million)
• an increase in amounts receivable from the Commonwealth in 2014–15 for the South Australian River Murray Sustainability Program ($8.0 million).
The $0.1 million decrease in total liabilities is primarily due to:
• a decrease in amounts advanced under the Loans to Cooperatives scheme ($2.3 million)
partially offset by
• inflationary increases and movement in the provisions for employee benefits ($1.2 million)
• budgeted increases in amounts payable to suppliers and employees ($1.0 million).
Statement of cash flows ― controlled
The $1.5 million decrease in net operating cash flows is primarily due to:
• movement in the net cost of providing services (excluding depreciation) discussed under the statement of comprehensive income ($1.7 million) offset by amounts receivable from the Commonwealth in 2014–15 for the South Australian River Murray Sustainability Program ($8.0 million)
partially offset by
• an increase in 2015–16 appropriation and other receipts ($10.3 million).
The $4.7 million increase in net investing cash flows is primarily due to:
• reduced advances under for the Farm Finance Concessional Loans ($15.5 million) and the Regions Loan schemes ($4.0 million)
• reduced expenditure relating to the establishment of a research site for the Almond Centre of Excellence ($1.5 million)
partially offset by
• increased advances made under the Drought Concessional Loans scheme ($6.0 million)
• increased capital expenditure on the Loxton Research Centre Redevelopment ($3.5 million), the Sterile Insect Technology Facility ($1.6 million) and the Clare Regional Office ($0.8 million) in 2015–16
• reduced proceeds from proposed asset sales ($4.4 million).
Primary Industries and Regions
2015–16 Agency Statements — Volume 4 47

The $25.7 million decrease in net financing cash flows is primarily due to:
• reduced borrowings following advances made under the Farm Finance Concessional Loans ($25.0 million) and Drought Concessional Loans schemes ($10.0 million) in 2014–15
partially offset by
• reduced repayments under the Farm Finance Concessional Loans scheme ($9.6 million).
Statement of comprehensive income — administered items
The $1.2 million decrease in expenses is primarily due to once-off additional cost recovery negotiated with industry for delivery of PIRSA programs in 2014–15 ($1.0 million).
The $1.3 million increase in income is primarily due to indexation of fees and charges and the movement of industry levy collections ($1.1 million).
Statement of financial position ― administered items
The $0.2 million decrease in total assets is due to the net change in operating cash flows for 2015–16 as discussed under the statement of cash flows — administered.
There is no material movement in total liabilities.
Statement of cash flows ― administered items
The $2.4 million increase in net operating cash flows is primarily due to:
• movement in the net cost of providing services (excluding depreciation) discussed under the statement of comprehensive income ($2.5 million)
partially offset by
• a decrease in 2015–16 appropriation ($0.2 million) due to changes in the ForestrySA community service obligation.
Additional information for administered items
Additional information on administered items is included in the following table.
Primary Industries and Regions
48 2015–16 Agency Statements — Volume 4

Additional information for administered items for the Department of Primary Industries and Regions Statement of cash flows
2015–16 Budget
2014–15 Estimated
Result 2014–15 Budget
2013–14 Actual
$000 $000 $000 $000
Operating activities
Cash outflows Employee benefit payments
Parliamentary salaries and electorate expense allowances ........................................................................ 602 590 579 387 Various industry funds ...................................................... 89 85 87 118
Payments for supplies and services Various industry funds ...................................................... 1 726 2 724 1 963 2 429
Grants and subsidies Regulatory fees paid from Fisheries Research and Development Fund ............................................................ 797 473 782 667 Regulatory fees paid from Aquaculture Resource Management Fund ............................................................ 326 240 326 867 Forestry community service obligation payment ............... 3 709 3 898 3 233 3 154 Various industry funds ...................................................... 8 792 9 471 9 241 9 097
Intra-government transfers Regulatory fees transferred from Fisheries Research and Development Fund ..................................................... 12 600 11 859 12 335 11 805 Regulatory fees transferred from Aquaculture Resource Management Fund............................................ 2 162 1 605 2 161 1 460 Forestry community service obligation payment ............... 390 380 380 374 Various industry funds ...................................................... 3 131 4 186 3 085 4 113
Other payments Various industry funds ……………………………………… 108 123 116 131
Cash used in operations 34 432 35 634 34 288 34 602
Cash inflows
Intra-government transfers Various industry funds ...................................................... 769 749 743 721
Fees, fines and penalties Fisheries licence fees ....................................................... 14 254 13 929 14 099 13 595 Aquaculture licence fees ................................................... 1 798 1 086 1 797 944 Various industry funds ...................................................... 377 267 571 709
Sales of goods and services Various industry funds ..................................................... 782 667 782 668
Interest received Various industry funds ...................................................... 530 521 532 441
Other receipts Various industry funds ...................................................... 11 024 11 000 11 061 12 496
Cash generated from operations 29 534 28 219 29 585 29 574
Primary Industries and Regions
2015–16 Agency Statements — Volume 4 49

2015–16 Budget
2014–15 Estimated
Result 2014–15 Budget
2013–14 Actual
$000 $000 $000 $000
State government Appropriation
Parliamentary salaries and electorate expense allowances ........................................................................ 602 590 590 365 Forestry community service obligation payment ............... 4 099 4 278 3 311 3 516
Net cash provided by state government 4 701 4 868 3 901 3 881
Net cash provided by (+)/used in (-) operating activities -197 -2 547 -802 -1 147
Net increase (+)/decrease (-) in cash equivalents -197 -2 547 -802 -1 147
Cash and cash equivalents at the start of the financial year (as at 1 July) 19 441 21 988 19 508 23 135
Cash and cash equivalents at the end of the financial year (as at 30 June) 19 244 19 441 18 706 21 988
Primary Industries and Regions
50 2015–16 Agency Statements — Volume 4

Additional information for administered items for the Department of Primary Industries and Regions Reconciliation to statement of cash flows
2015–16 Budget
2014–15 Estimated
Result 2014–15 Budget
2013–14 Actual
$000 $000 $000 $000
Reconciliation to operating payments Operating payments (as per additional information for administered items) ................................................................ 34 432 35 634 34 288 34 602 Add: Costs transferred out:
Cash held on behalf of the Department for Manufacturing, Innovation, Trade, Resources and Energy .............................................................................. — — — 4 436 Outback Communities Authority........................................ — — — 1 845 Local Government Grants Commission ............................ — — — 99 187
Equals: Operating payments (as per administered items statement of cash flows) 34 432 35 634 34 288 140 070
Reconciliation to operating receipts
Operating receipts (as per additional information for administered items) ................................................................ 29 534 28 219 29 585 29 574 Add: Costs transferred out:
Outback Communities Authority........................................ — — — 1 054 Local Government Grants Commission ............................ — — — 99 090
Equals: Operating receipts (as per administered items statement of cash flows) 29 534 28 219 29 585 129 718
Reconciliation to Appropriation receipts Appropriation receipts (as per additional information for administered items) ................................................................ 4 701 4 868 3 901 3 881 Add: Costs transferred out:
Outback Communities Authority........................................ — — — 618 Local Government Grants Commission ............................ — — — 419
Equals: Appropriation receipts (as per administered items statement of cash flows) 4 701 4 868 3 901 4 918
Reconciliation to investing payments
Investing payments (as per additional information for administered items) ................................................................ — — — — Add: Costs transferred out:
Outback Communities Authority........................................ — — — 148
Equals: Investing payments (as per administered items statement of cash flows) — — — 148
Primary Industries and Regions
2015–16 Agency Statements — Volume 4 51
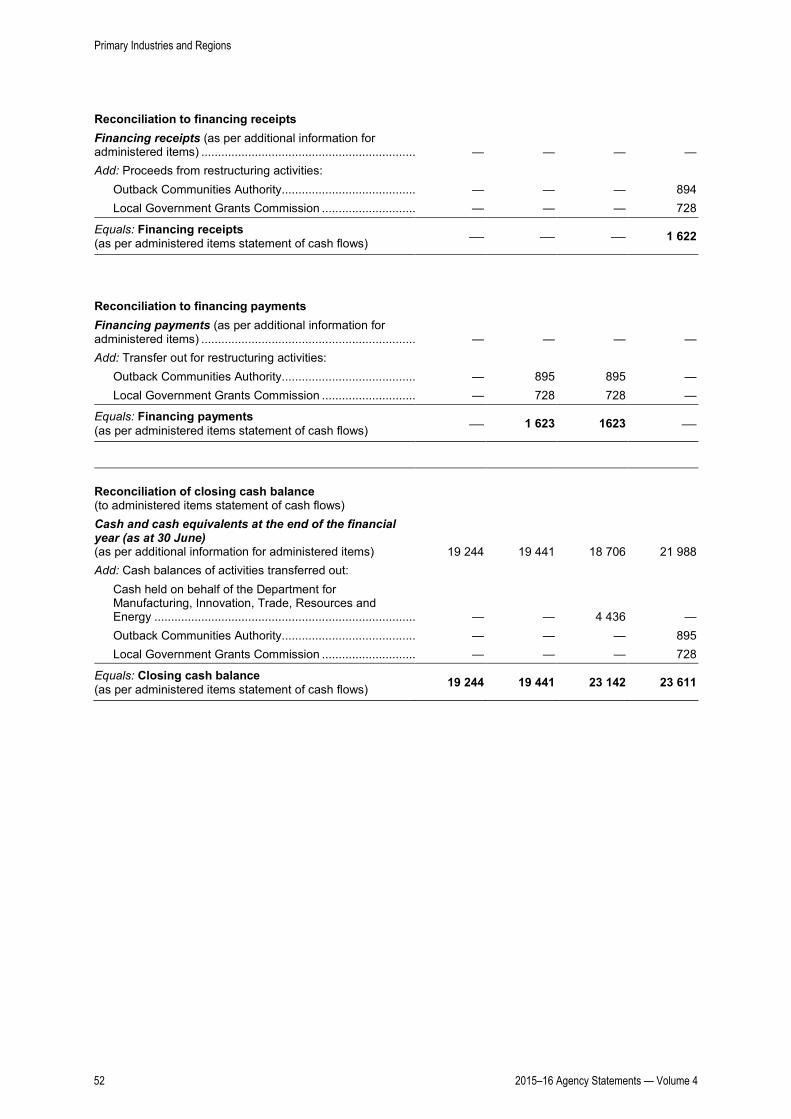
Reconciliation to financing receipts
Financing receipts (as per additional information for administered items) ................................................................ — — — — Add: Proceeds from restructuring activities:
Outback Communities Authority........................................ — — — 894 Local Government Grants Commission ............................ — — — 728
Equals: Financing receipts (as per administered items statement of cash flows) — — — 1 622
Reconciliation to financing payments Financing payments (as per additional information for administered items) ................................................................ — — — — Add: Transfer out for restructuring activities:
Outback Communities Authority........................................ — 895 895 — Local Government Grants Commission ............................ — 728 728 —
Equals: Financing payments (as per administered items statement of cash flows) — 1 623 1623 —
Reconciliation of closing cash balance (to administered items statement of cash flows)
Cash and cash equivalents at the end of the financial year (as at 30 June) (as per additional information for administered items) 19 244 19 441 18 706 21 988 Add: Cash balances of activities transferred out:
Cash held on behalf of the Department for Manufacturing, Innovation, Trade, Resources and Energy .............................................................................. — — 4 436 — Outback Communities Authority........................................ — — — 895 Local Government Grants Commission ............................ — — — 728
Equals: Closing cash balance (as per administered items statement of cash flows) 19 244 19 441 23 142 23 611
Primary Industries and Regions
52 2015–16 Agency Statements — Volume 4
Agency: Department of State Development
Premier Minister for Employment, Higher Education and Skills Minister for Science and Information Economy Minister for the Arts Minister for Health Industries Minister for State Development Minister for Mineral Resources and Energy Minister for Small Business Minister for Water and the River Murray Minister for Investment and Trade Minister for Manufacturing and Innovation Minister for Automotive Transformation Minister for Aboriginal Affairs and Reconciliation
2015–16 Agency Statements — Volume 4 53

State Development
54 2015–16 Agency Statements — Volume 4

Contents
Objective .......................................................................................................................................... 56 Ministerial responsibilities ................................................................................................................ 57 Ministerial office resources .............................................................................................................. 58 Workforce summary ........................................................................................................................ 58 Program net cost of services summary ........................................................................................... 59 Investing expenditure summary ...................................................................................................... 60 Program 1: Office of the Economic Development Board ............................................................. 62 Program 2: Employment and Skills Formation ............................................................................ 64 Program 3: Science, Technology and Information Economy ...................................................... 72 Program 4: Arts ............................................................................................................................ 76 Program 5: Health Industries ....................................................................................................... 85 Program 6: Mineral Resources and Energy ................................................................................. 87 Program 7: Opportunities for Small Business ............................................................................ 100 Program 8: Water Industry Technical and Safety Regulation.................................................... 102 Program 9: Globally Integrating the SA Economy ..................................................................... 104 Program 10: Industry and Innovation ........................................................................................... 109 Program 11: Aboriginal Affairs and Reconciliation ...................................................................... 115 Financial statements ..................................................................................................................... 118 Summary of major variations......................................................................................................... 125 Additional information for administered items ............................................................................... 127
State Development
2015–16 Agency Statements — Volume 4 55

Objective
As the lead agency for six of the 10 South Australian economic priorities, the Department of State Development is responsible for driving economic growth and creating jobs.
The department supports South Australia’s economic transformation under priorities of:
• unlocking the full potential of SA’s resources, energy and renewable assets
• a globally recognised leader in health research and ageing
• the Knowledge State — attracting a diverse student body and commercialising our research
• growth through innovation
• promoting our international connections and engagement
• ensuring our small businesses have access to capital and global markets.
The department brings together responsibility for the state’s growing resources and energy portfolio, the transformation to high-value manufacturing and responsibility for training, employment and skills initiatives and science. The department works in close partnership with business, the education sector, community and key stakeholders to harness South Australia’s expertise in innovation, skills development and industry transformation.
The department also provides leadership for cross-government policy development on Aboriginal affairs, reconciliation and Aboriginal economic development. This includes skills development, job creation, business development and sustainable employment for Aboriginal people, including support for Aboriginal young people and those living in regional and remote South Australia.
The department is also responsible for maximising the social and economic contribution made by the arts and driving opportunities to grow creative industries through innovation, as well as high-value technology sectors, including medical research and biotechnology.
Increasing the focus on innovation will be crucial to assisting all sectors move up the value chain through more advanced techniques and services.
The department also has responsibility for implementing the automotive transformation strategy for South Australia, together with the Commonwealth Government’s Growth Fund.
The department drives South Australia’s continuing high-growth and high-value sectors including minerals and resources, information and communications technology, advanced manufacturing and renewable energy. It also coordinates the state government's engagement with small to medium businesses, ensuring local firms have access to growing supply chain opportunities in sectors such as oil and gas, defence and aerospace.
The department further develops trade opportunities and the internationalisation of our economy. By working with the business and the higher education sectors it is building a smart future for South Australia.
State Development
56 2015–16 Agency Statements — Volume 4

Ministerial responsibilities
Minister Programs Sub-programs
The Hon. JW Weatherill Premier
1. Office of the Economic Development Board
Nil
The Hon. GE Gago Minister for Employment, Higher Education and Skills Minister for Science and Information Economy
2. Employment and Skills Formation
2.1 Training, Employment and Skills
2.2 Quality Assurance and Regulatory Services
2.3 International and Higher Education
3. Science, Technology and Information Economy
Nil
The Hon. JJ Snelling Minister for the Arts Minister for Health Industries
4. Arts 4.1 State Library and Statewide Information Services
4.2 Support to Public Libraries and Community Information Services
4.3 Access to Art, Museum and Heritage Services and Preservation of State Collections
4.4 Arts Industry Development and Access to Artistic Product
5. Health Industries Nil
The Hon. T Koutsantonis Minister for State Development Minister for Mineral Resources and Energy Minister for Small Business
6. Mineral Resources and Energy
6.1 Mineral Resources 6.2 Energy Resources 6.3 Olympic Dam Taskforce 6.4 Energy Policy and Programs 6.5 Electricity and Gas Technical
and Safety Regulation 6.6 RenewablesSA
7. Opportunities for Small Business
Nil
The Hon. IK Hunter Minister for Water and the River Murray
8. Water Industry Technical and Safety Regulation
Nil
The Hon. MLJ Hamilton-Smith Minister for Investment and Trade
9. Globally Integrating the SA Economy
9.1 International, Trade Engagement and Migration
9.2 Investment Attraction
The Hon. KJ Maher Minister for Manufacturing and Innovation Minister for Automotive Transformation Minister for Aboriginal Affairs and Reconciliation
10. Industry and Innovation 10.1 Manufacturing and Innovation 10.2 Automotive Transformation
11. Aboriginal Affairs and Reconciliation
Nil
Note: Some program numbers have changed due to changes in ministerial responsibilities.
State Development
2015–16 Agency Statements — Volume 4 57

Administered items
In addition to the above responsibilities, the agency administers the following items on behalf of the ministers:
• Anangu Pitjantjatjara Yankunytjatjara (APY) Taskforce
• Ministers’ salaries and allowances pursuant to the Parliamentary Remuneration Act 1990
• Royalties.
Statutes
The Department of the Premier and Cabinet maintains a list of statutes applicable to ministers.
Ministerial office resources
2015–16 Budget
Cost of provision
Minister $000 FTE
The Hon. GE Gago ................................................................................. 1 963 11.0
The Hon. MLJ Hamilton-Smith................................................................ 1 491 8.0
The Hon. KJ Maher ................................................................................ 1 299 7.0
Workforce summary
FTEs as at 30 June
Agency 2015–16
Budget(a)
2014–15 Estimated
Result(a) 2013–14 Actual(b)
Department of State Development ..................................................... 3 295.0 3 426.0 3 488.2
Administered items for the Department of State Development ........... 3.0 3.0 3.0
Total (as per agency programs) 3 298.0 3 429.0 3 491.2
Add: FTEs transferred out: Regional functions to Regions SA on 1 July 2014 .............................. — — 5.0
High Value Food Manufacturing Centre to Primary Industries and Regions SA on 1 July 2014 ................................................................ — — 3.0 Less: FTEs transferred in: Industry Participation Advocate from the Department of the Premier and Cabinet on 1 July 2015 ................................................................
— 3.8 6.3
Department for Further Education, Employment, Science and Technology and TAFE SA on 1 July 2014 ..........................................
— — 2 893.7
Arts SA, Aboriginal Affairs and Reconciliation, Invest in SA and Office of the Economic Development Board from the Department of the Premier and Cabinet on 1 July 2014 ............................................
—
— 116.6
Health Industries SA from the Department of Health on 1 July 2014 .. — — 3.0
Total as per data published by the Office for the Public Sector (Department of the Premier and Cabinet) 3 298.0 3 425.2 479.6
(a) The 2015–16 Budget and 2014–15 Estimated Result reflect the established FTE caps.
(b) Data published by Office for the Public Sector (Department of the Premier and Cabinet).
State Development
58 2015–16 Agency Statements — Volume 4

Program net cost of services summary(a)
Net Cost of Services
2015–16 Budget
2014–15 Estimated
Result 2014–15 Budget
2013–14 Actual
Program $000 $000 $000 $000
1. Office of Economic Development Board .............. 3 109 3 528 2 215 1 714
2. Employment and Skills Formation ........................ 358 618 406 329 367 031 491 689
3. Science, Technology and Information Economy .. 15 735 16 033 15 926 19 733
4. Arts ....................................................................... 142 973 140 134 134 821 135 227
5. Health Industries .................................................. 2 470 2 736 2 600 522
6. Mineral Resources and Energy ............................ 42 288 45 950 46 176 49 605
7. Opportunities for Small Business ......................... 2 364 2 275 2 015 2 699
8. Water Industry Technical and Safety Regulation ............................................................ 89 94 105 -258
9. Globally Integrating the SA Economy ................... 19 377 18 889 14 305 9 453
10. Industry and Innovation ........................................ 37 217 23 774 26 296 26 034
11. Aboriginal Affairs and Reconciliation .................... 12 879 11 957 13 186 12 272
Total 637 119 671 699 624 676 748 690
Reconciliation to agency net cost of providing services
Add: Net costs transferred out:
Regional functions to Primary Industries and Regions SA on 1 July 2014 ..................................... — — — 610
High Value Food Manufacturing Centre to Primary Industries and Regions SA on 1 July 2014 ............. — — — 535
Less: Net costs transferred in:
Population and Migration Policy unit from the Department of the Premier and Cabinet on 1 December 2013 ................................................... — — — 191
Industry Participation Advocate from the Department of the Premier and Cabinet on 1 July 2015 ............................................................. — 1 149 844 1 410
Department for Further Education, Employment, Science and Technology and TAFE SA on 1 July 2014 ............................................................. — — — 509 366
Arts SA, Aboriginal Affairs and Reconciliation, Invest in SA and Office of the Economic Development Board from the Department of the Premier and Cabinet on 1 July 2014 ....................... — — 381 141 784
Health Industries SA from the Department for Health and Ageing on 1 July 2014 .......................... — — 2 600 522
Equals: Net cost of providing services (as per agency statement of comprehensive income) 637 119 670 550 620 851 96 562
(a) The 2014–15 Budget amounts contained in the 2015–16 Agency Statements differs from those amounts contained in the 2014–15 Agency Statements to reflect internal resource allocations for each program. The 2014–15 Budget amounts in these statements have been amended for comparative purposes.
State Development
2015–16 Agency Statements — Volume 4 59
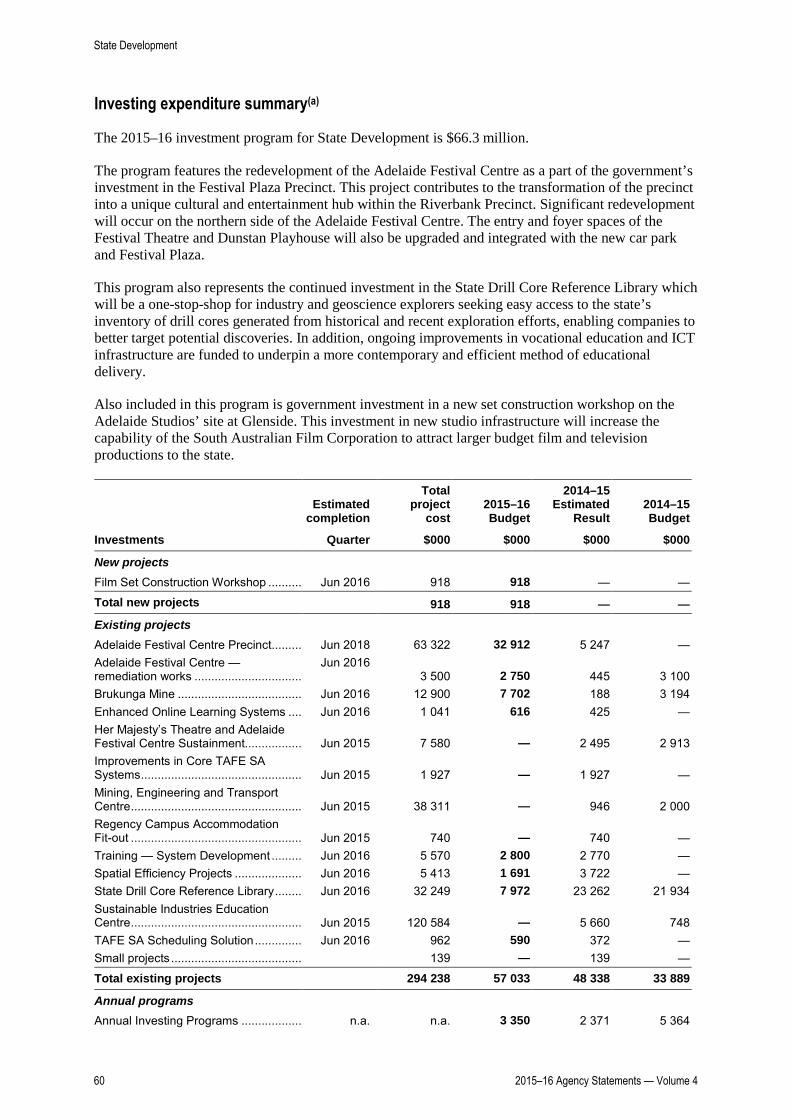
Investing expenditure summary(a)
The 2015–16 investment program for State Development is $66.3 million.
The program features the redevelopment of the Adelaide Festival Centre as a part of the government’s investment in the Festival Plaza Precinct. This project contributes to the transformation of the precinct into a unique cultural and entertainment hub within the Riverbank Precinct. Significant redevelopment will occur on the northern side of the Adelaide Festival Centre. The entry and foyer spaces of the Festival Theatre and Dunstan Playhouse will also be upgraded and integrated with the new car park and Festival Plaza.
This program also represents the continued investment in the State Drill Core Reference Library which will be a one-stop-shop for industry and geoscience explorers seeking easy access to the state’s inventory of drill cores generated from historical and recent exploration efforts, enabling companies to better target potential discoveries. In addition, ongoing improvements in vocational education and ICT infrastructure are funded to underpin a more contemporary and efficient method of educational delivery.
Also included in this program is government investment in a new set construction workshop on the Adelaide Studios’ site at Glenside. This investment in new studio infrastructure will increase the capability of the South Australian Film Corporation to attract larger budget film and television productions to the state.
Estimated
completion
Total project
cost 2015–16 Budget
2014–15 Estimated
Result 2014–15 Budget
Investments Quarter $000 $000 $000 $000
New projects Film Set Construction Workshop .......... Jun 2016 918 918 — —
Total new projects 918 918 — — Existing projects Adelaide Festival Centre Precinct ......... Jun 2018 63 322 32 912 5 247 — Adelaide Festival Centre — remediation works ................................
Jun 2016 3 500 2 750 445 3 100
Brukunga Mine ..................................... Jun 2016 12 900 7 702 188 3 194 Enhanced Online Learning Systems .... Jun 2016 1 041 616 425 — Her Majesty’s Theatre and Adelaide Festival Centre Sustainment................. Jun 2015 7 580 — 2 495 2 913 Improvements in Core TAFE SA Systems ................................................ Jun 2015 1 927 — 1 927 — Mining, Engineering and Transport Centre ................................................... Jun 2015 38 311 — 946 2 000 Regency Campus Accommodation Fit-out ................................................... Jun 2015 740 — 740 — Training — System Development ......... Jun 2016 5 570 2 800 2 770 — Spatial Efficiency Projects .................... Jun 2016 5 413 1 691 3 722 — State Drill Core Reference Library ........ Jun 2016 32 249 7 972 23 262 21 934 Sustainable Industries Education Centre ................................................... Jun 2015 120 584 — 5 660 748 TAFE SA Scheduling Solution .............. Jun 2016 962 590 372 — Small projects ....................................... 139 — 139 —
Total existing projects 294 238 57 033 48 338 33 889
Annual programs Annual Investing Programs .................. n.a. n.a. 3 350 2 371 5 364
State Development
60 2015–16 Agency Statements — Volume 4

Estimated
completion
Total project
cost 2015–16 Budget
2014–15 Estimated
Result 2014–15 Budget
Investments Quarter $000 $000 $000 $000 IT Systems and Infrastructure............... n.a. n.a. 2 000 714 2 000 Minerals Asset Upgrade and Replacement ........................................ n.a. n.a. 964 528 228 Purchase of Plant and Equipment — TAFE SA .............................................. n.a. n.a. 1 237 — 1 206 Small programs .................................... n.a. n.a. 829 704 1 032
Total annual programs 8 380 4 317 9 830
Total investing expenditure 295 156 66 331 52 655 43 719
(a) Investing expenditure totals do not match purchase of property, plant and equipment and purchase of intangibles in the statement of cash flows due to the inclusion of accrued expenditure and machinery of government changes.
State Development
2015–16 Agency Statements — Volume 4 61

Program 1: Office of the Economic Development Board
Description/objective
Supports the Economic Development Board (EDB) by providing a secretariat function as well as oversight and management of its assigned budget, including procurement and contracting management functions.
Program summary — expenses, income and FTEs(a)
2015–16 Budget
2014–15 Estimated
Result 2014–15 Budget
2013–14 Actual
$000 $000 $000 $000
Expenses Employee benefit expenses.......................................... 1 610 1 705 1 420 1 377 Supplies and services ................................................... 1 494 2 263 799 337 Intra-government transfers ........................................... 2 8 1 — Other expenses ............................................................ 5 10 8 —
Total expenses 3 111 3 986 2 228 1 714
Income Intra-government transfers ........................................... — 441 — — Sales of goods and services ......................................... — 7 4 — Other income ................................................................ 2 10 9 —
Total income 2 458 13 —
Net cost of providing services 3 109 3 528 2 215 1 714
FTEs as at 30 June (No.) 5.7 6.9 5.4 2.8
(a) The 2014–15 Budget amounts contained in the 2015–16 Agency Statements differs from those amounts contained in the 2014–15 Agency Statements to reflect internal resource allocations for each program. The 2014–15 Budget amounts in these statements have been amended for comparative purposes.
Financial commentary
2015–16 Budget/2014–15 Estimated Result
The $0.9 million decrease in expenses is primarily due to:
• once-off expenditure in 2014–15 for the defence industry investment advocacy ($0.4 million)
• changes in overhead allocations between financial years which are allocated across programs ($0.3 million).
The $0.5 million decrease in income is primarily due to once-off 2014–15 funding transferred from the Department of the Premier and Cabinet for the defence industry investment advocacy ($0.4 million).
2014–15 Estimated Result/2014–15 Budget
The $1.8 million increase in expenses is primarily due to:
• additional expenditure for the expanded role of the Office of the Economic Development Board ($1.0 million)
• the transfer of the former Advanced Manufacturing Council budget from the Industry and Innovation program ($0.7 million)
• once-off expenditure in 2014–15 for the defence industry investment advocacy ($0.4 million).
State Development
62 2015–16 Agency Statements — Volume 4
The $0.4 million increase in income is primarily due to once-off funding transferred from the Department of the Premier and Cabinet for defence industry advocacy ($0.4 million).
2014–15 Estimated Result/2013–14 Actual
The $2.3 million increase in expenses is primarily due to:
• additional expenditure for the expanded role of the Office of the Economic Development Board ($1.0 million)
• the transfer of the former Advanced Manufacturing Council budget from the Industry and Innovation program ($0.7 million)
• changes in overhead allocations between financial years which are allocated across programs ($0.5 million)
• once-off expenditure in 2014–15 for the defence industry investment advocacy ($0.4 million).
The $0.5 million increase in income is primarily due to once-off 2014–15 funding transferred from the Department of the Premier and Cabinet the defence industry investment advocacy ($0.4 million).
Highlights 2014–15
• Created the Unlocking Capital for Jobs program.
• Promoted the Food Park initiative and led industry consultation and site selection processes.
• Evaluated options for the redesign of the Investment Attraction framework across government.
• Provided strategic advice for visits to Singapore by the Premier (2014) and the Minister for Investment and Trade (2015).
• Facilitated the three South Australian universities being the lead institutions in Australia for the development of the new Research Engagement for Australia measure created by the Australian Academy of Technological Science and Engineering.
• Led South Australia’s ‘local build’ response to the Commonwealth’s pending procurement for the next generation submarines.
Targets 2015–16
• Provide advice to government on the proposed Food Park project and develop and implement the master planning should the project proceed.
• Complete delivery of the Unlocking Capital for Jobs program pilot.
• Develop and implement industry development plans that assist the state’s industry transition.
• Identify innovative companies located in South Australia with a view to driving future industry growth and sustainable economic development.
• Assist in the development of the state’s healthy ageing strategy which will improve the liveability of older people and capture the associated economic growth opportunities.
State Development
2015–16 Agency Statements — Volume 4 63

Program 2: Employment and Skills Formation
Description/objective
Strengthen the economic prosperity and social wellbeing of South Australians through:
• strategic employment, skills formation and workforce development
• implementing the WorkReady and Jobs and Skills policies.
Sub-programs
2.1 Training, Employment and Skills
2.2 Quality Assurance and Regulatory Services
2.3 International and Higher Education
Program summary — expenses, income and FTEs(a)
2015–16 Budget
2014–15 Estimated
Result 2014–15 Budget
2013–14 Actual
$000 $000 $000 $000
Expenses Employee benefit expenses.......................................... 241 978 263 640 255 614 319 280 Supplies and services ................................................... 181 102 200 710 167 836 231 358 Depreciation and amortisation expenses ...................... 28 098 27 904 28 277 27 566 Borrowing costs ............................................................ — — — 4 Grants and subsidies .................................................... 38 863 42 286 41 865 39 309 Intra-government transfers ........................................... 2 668 3 641 2 216 2 175 Other expenses ............................................................ 3 732 3 639 3 679 6 833
Total expenses 496 441 541 820 499 487 626 525
Income Commonwealth revenues ............................................. 39 879 43 812 39 052 40 231 Intra-government transfers ........................................... 1 009 1 009 968 2 563 Other grants.................................................................. 2 326 2 582 1 916 2 074 Sales of goods and services ......................................... 92 365 87 211 88 259 85 823 Interest revenues .......................................................... — — — 12 Net gain or loss from disposal of assets ....................... -46 -2 110 70 -375 Other income ................................................................ 2 290 2 987 2 191 4 508
Total income 137 823 135 491 132 456 134 836
Net cost of providing services 358 618 406 329 367 031 491 689
FTEs as at 30 June (No.) 2 637.9 2 756.7 2 716.3 2 840.1
(a) The 2014–15 Budget amounts contained in the 2015–16 Agency Statements differs from those amounts contained in the 2014–15 Agency Statements to reflect internal resource allocations for each program. The 2014–15 Budget amounts in these statements have been amended for comparative purposes.
State Development
64 2015–16 Agency Statements — Volume 4

Sub-program 2.1: Training, Employment and Skills
Description/objective
Coordinate high quality training, employment and skills development targeted to South Australia’s economic priorities, economic transformation and jobs through:
• aligning the investment of public funds with strategic needs
• vocational education and training provided by TAFE SA and other registered training organisations
• supporting individuals and employers to develop workforce skills that are linked to employment opportunities, such as through apprenticeships
• employer-led projects that focus on assisting job seekers and people with barriers to employment, to gain a job in their local communities
• supporting industries affected by economic restructuring to gain skills to generate jobs
• building foundation skills through vocational and community education, providing career advice, skills recognition and employment services that prepare people for training and/or job opportunities
• providing state and national policy advice.
2015–16 Budget
2014–15 Estimated
Result 2014–15 Budget
2013–14 Actual
$000 $000 $000 $000 Expenses ...................................................................... 487 401 532 292 490 067 617 883 Income .......................................................................... 137 796 134 824 132 413 134 532
Net cost of sub-program 349 605 397 468 357 654 483 351 FTEs as at 30 June (No.) 2 524.5 2 639.6 2 600.6 2 718.6
Financial commentary
2015–16 Budget/2014–15 Estimated Result
The $44.9 million decrease in expenses is primarily due to:
• additional expenditure to meet the level of demand for vocational education and training ($20.0 million) and to support the operations of TAFE SA in 2014–15 ($7.0 million)
• greater efficiencies and improved targeting of training across the vocational education and training sector ($11.6 million)
• targeted voluntary separation packages provided by TAFE SA in 2014–15 ($3.2 million)
• reduced expenditure under the Critical Skills Investment program ($3.1 million).
The $3.0 million increase in income is primarily due to:
• indexation of TAFE SA fee for service income ($5.8 million)
partially offset by
• finalisation of the Commonwealth Government funded Joint Group Training ($0.9 million) and Child Care Fee Waiver ($1.8 million) programs in 2014–15.
State Development
2015–16 Agency Statements — Volume 4 65

2014–15 Estimated Result/2014–15 Budget
The $42.2 million increase in expenses is primarily due to:
• additional expenditure to meet the level of demand for vocational education and training ($20.0 million) and to support the operations of TAFE SA in 2014–15 ($7.0 million)
• changes in the allocation of TAFE SA specific ICT functions ($5 million) and portfolio corporate overheads ($3.0 million) between financial years which are allocated across programs
• targeted voluntary separation packages provided by TAFE SA ($3.2 million)
• changes in overhead allocation between financial years which are allocated across programs ($3.0 million)
• a reclassification of investing to operating expenses ($1.8 million)
partially offset by
• reduced expenditure under the Critical Skills Investment program ($2.6 million).
The $2.4 million increase in income is primarily due to:
• an increase in Commonwealth Government funding under the National Partnership Agreement on Skills Reform for budgeted payments not received in 2013–14 ($4.6 million)
partially offset by
• lower fee for service income in TAFE SA ($1.4 million)
• a reduction in Commonwealth Government funding for the Joint Group Training program ($0.4 million).
2014–15 Estimated Result/2013–14 Actual
The $85.6 million decrease in expenses is primarily due to:
• a higher number of targeted voluntary separation packages provided by TAFE SA in 2013–14 ($43.7 million)
• finalisation of the Commonwealth Government funded Productivity Places Program in 2013–14 ($10.6 million)
• increased training expenditure under the Skills for All program ($11.7 million) and transitional support for TAFE SA ($14.0 million) in 2013–14
• changes in overhead allocations between financial years which are allocated across programs ($7.0 million).
Highlights 2014–15
• Provided government subsidised vocational education and training to 100 000 people in South Australia in 2014.
• Launched the WorkReady policy, following the independent external and red tape reduction evaluations of the Skills for All initiative.
• Established the Strategic Employment Fund to deliver tailored and timely projects on a job-first basis to provide clearer pathways into work by responding to the local and regional workforce needs of employers.
• Supported over 26 100 South Australians without a job or a formal qualification to commence a qualification to improve their chances of finding work, and supported 100 families experiencing intergenerational joblessness in Northern Adelaide to help family members overcome barriers to entering the workforce.
State Development
66 2015–16 Agency Statements — Volume 4

• Worked with over 1200 automotive component manufacturing workers on re-skilling and re-employment options following the announcements of the closure of GM Holden, Toyota and Ford.
• Officially opened the Mining, Engineering and Transport Centre at the TAFE SA Regency Park campus to help deliver the 20 000 new workers projected by the Training and Skills Commission to be required to support the growth of the mining, transport, defence, engineering, and allied industries up to 2017–18.
Targets 2015–16
• Implement WorkReady initiatives to meet South Australia’s economic priorities by:
– targeting investment in skills to areas of strategic need, including those that support economic transformation
– increasing training completion rates and better linking training with employment opportunities
– implementing a ‘Jobs First’ approach to purchasing training and employment services from approved providers to develop tailored responses for specific groups, industries or regions and provide work placements and transitions to employment in response to emerging opportunities such as new ventures and projects including those affected by economic restructuring.
• Continue to develop business understanding of the importance of skill development, and awareness of the availability of government and private sector support mechanisms through WorkReady.
• Allow for job opportunities for mature workers who want to remain in the workforce which will help South Australia achieve an international reputation for high levels of older citizen participation in economic and community life.
• Continue to strengthen the relationship with business and industry to develop the skills the workforce needs.
Performance indicators(a)
2015–16
Target
2014–15 Estimated
Result 2014–15
Target 2013–14
Actual
% of South Australians aged 15 to 64 participating in VET 11.5% 11.5% 12.7% 14.8% Load pass rates Load pass rates report the extent to which students pass their assessment in an assessable module or unit of competency.
87.5% 87.0% 87.0% 87.1%
% of qualification completions at certificate III and above categorised by student groups:
72.0% 64.2% 77.0% 73.0%
• % of Indigenous students 42.0% 44.0% 56.0% 52.9% • % of students with a disability 47.5% 50.4% 67.0% 57.4% • % of mature age students (45–64)
New indicator introduced for 2015–16. Student groups are those targeted in the National Partnerships Agreement for Skills Reform Implementation Plan.
79.3% 78.1% n.a. 85.0%
% of apprentices and trainees completing their training contract In 2014 the method for setting targets and calculating results was changed to align with published National Centre for Vocational Education Research (NCVER) vocational education and training statistics which provides for comparison across other jurisdictions. The 2013–14 Actual and 2014–15 Estimated Result for apprentices and trainees completing their training contract uses the new NCVER method. The 2014–15 Target was based on the earlier methodology and is not comparable to the 2013–14 Actual and 2014–15 Estimated Result.
56.0% 55.6% 63.0% 55.5%
% of VET graduates employed or in further study after the training
90.0% 89.0% 90.0% 89.6%
% of graduates unemployed before their VET course who found work after training
45.0% 43.6% 46.0% 40.9%
State Development
2015–16 Agency Statements — Volume 4 67
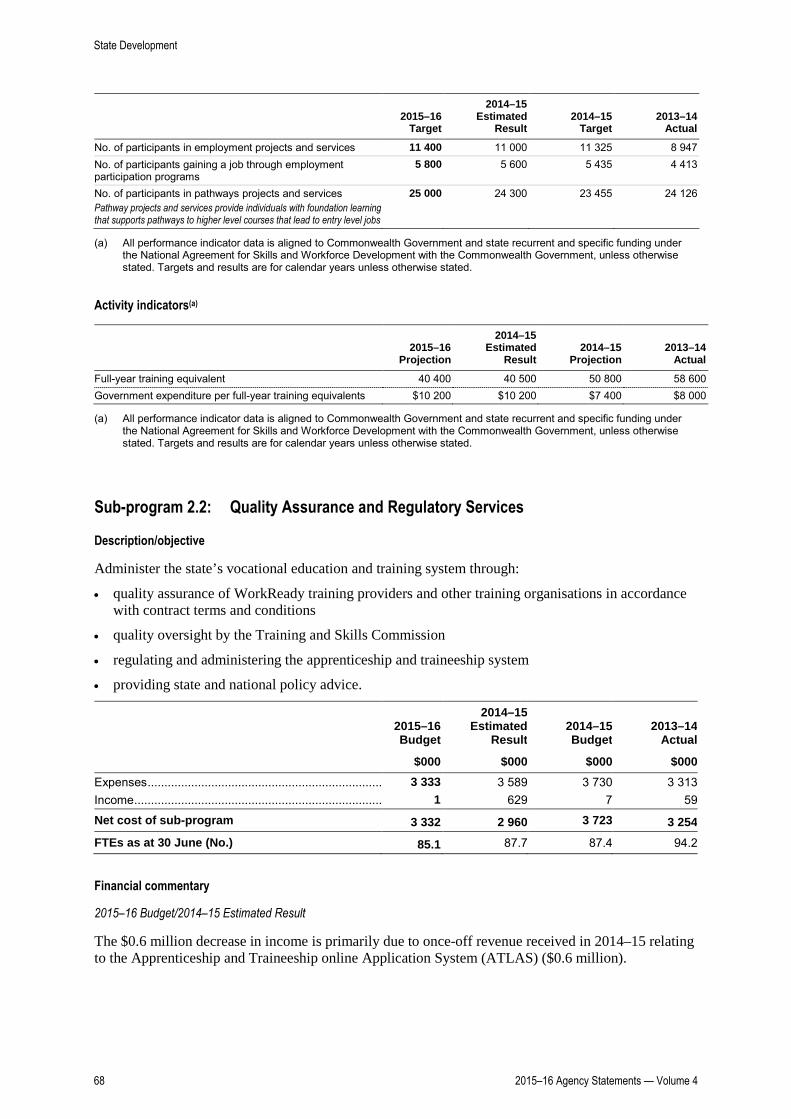
2015–16
Target
2014–15 Estimated
Result 2014–15
Target 2013–14
Actual
No. of participants in employment projects and services 11 400 11 000 11 325 8 947 No. of participants gaining a job through employment participation programs
5 800 5 600 5 435 4 413
No. of participants in pathways projects and services Pathway projects and services provide individuals with foundation learning that supports pathways to higher level courses that lead to entry level jobs
25 000 24 300 23 455 24 126
(a) All performance indicator data is aligned to Commonwealth Government and state recurrent and specific funding under the National Agreement for Skills and Workforce Development with the Commonwealth Government, unless otherwise stated. Targets and results are for calendar years unless otherwise stated.
Activity indicators(a)
2015–16
Projection
2014–15 Estimated
Result 2014–15
Projection 2013–14
Actual
Full-year training equivalent 40 400 40 500 50 800 58 600 Government expenditure per full-year training equivalents $10 200 $10 200 $7 400 $8 000
(a) All performance indicator data is aligned to Commonwealth Government and state recurrent and specific funding under the National Agreement for Skills and Workforce Development with the Commonwealth Government, unless otherwise stated. Targets and results are for calendar years unless otherwise stated.
Sub-program 2.2: Quality Assurance and Regulatory Services
Description/objective
Administer the state’s vocational education and training system through:
• quality assurance of WorkReady training providers and other training organisations in accordance with contract terms and conditions
• quality oversight by the Training and Skills Commission
• regulating and administering the apprenticeship and traineeship system
• providing state and national policy advice.
2015–16 Budget
2014–15 Estimated
Result 2014–15 Budget
2013–14 Actual
$000 $000 $000 $000 Expenses ...................................................................... 3 333 3 589 3 730 3 313 Income .......................................................................... 1 629 7 59
Net cost of sub-program 3 332 2 960 3 723 3 254 FTEs as at 30 June (No.) 85.1 87.7 87.4 94.2
Financial commentary
2015–16 Budget/2014–15 Estimated Result
The $0.6 million decrease in income is primarily due to once-off revenue received in 2014–15 relating to the Apprenticeship and Traineeship online Application System (ATLAS) ($0.6 million).
State Development
68 2015–16 Agency Statements — Volume 4

2014–15 Estimated Result/2014–15 Budget
The $0.6 million increase in income is primarily due to once-off revenue received in 2014–15 relating to the ATLAS system ($0.6 million).
2014–15 Estimated Result/2013–14 Actual
The $0.6 million increase in income is primarily due to once-off revenue received in 2014–15 relating to the ATLAS system ($0.6 million).
Highlights 2014–15
• Conducted independent validation of assessment for 14 Skills for All courses to verify that graduates can apply their skills and knowledge in the workplace to industry standards.
• Conducted student and graduate surveys and employer surveys to guide quality improvement.
• Conducted reviews against contract terms and conditions for 55 Skills for All training providers to assess compliance with quality training and contractual obligations.
• Provided professional development programs to training providers to improve training outcomes in line with Skills for All priorities, with a particular focus on assessment validation and Foundation Skills.
• Reduced red tape by significantly increasing the proportion of apprenticeship and traineeship training contract approvals undertaken within 10 days from the time all training documentation is completed and received.
• Assisted almost 1000 new clients through the Office of the Training Advocate to address employment and/or training related enquiries or complaints.
Targets 2015–16
• Conduct independent validation of assessments for selected publicly funded skills and employment services to verify that participants can apply their skills and knowledge in the workplace to industry standards.
• Conduct reviews against contract terms and conditions for skills and employment services providers to assess compliance with quality standards and contractual obligations.
• Provide professional development programs to skills and employment services providers to improve outcomes in line with WorkReady priorities, with a particular focus on foundation skills, assessment and effective engagement with industry.
• Reduce red tape for employers through the implementation of a suite of nationally consistent regulatory and administrative rules for traineeships and apprenticeships.
State Development
2015–16 Agency Statements — Volume 4 69

Performance indicators
2015–16
Target
2014–15 Estimated
Result 2014–15
Target 2013–14
Actual
% of VET graduates rating their satisfaction with quality of training at four or more on a scale of 1 (strongly disagree) to 5 (strongly agree)
VET performance indicator data is aligned to Commonwealth Government and state recurrent and specific funding under the National Agreement for Skills and Workforce Development, unless otherwise stated. Targets and results for are for calendar years unless otherwise stated.
90.0% 89.1% 90.0% 88.4%
% of training contracts approved within 10 days from time of receipt Calculated from the point at which all completed training documentation is received for approval.
95.0% 97.0% 85.0% 82.0%
% of satisfied clients as measured through annual sample surveys:
• trainees/apprentices 95.0% 94.0% 95.0% 97.2% • employers 95.0% 95.0% 95.0% 94.5%
Sub-program 2.3: International and Higher Education
Description/objective
Establish an international reputation for South Australia’s higher education institutions and support them in sustaining the state’s reputation for quality teaching and learning for both domestic and international students.
Provide high level strategic policy advice to the Minister on higher education policy and planning.
2015–16 Budget
2014–15 Estimated
Result 2014–15 Budget
2013–14 Actual
$000 $000 $000 $000 Expenses ...................................................................... 5 707 5 939 5 690 5 329 Income .......................................................................... 26 38 36 245
Net cost of sub-program 5 681 5 901 5 654 5 084 FTEs as at 30 June (No.) 28.3 29.4 28.3 27.3
Financial commentary
2015–16 Budget/2014–15 Estimated Result
No major variations.
2014–15 Estimated Result/2014–15 Budget
No major variations.
2014–15 Estimated Result/2013–14 Actual
The $0.6 million increase in expenses is primarily due to increased resourcing for the TAFE SA international unit in 2014–15 ($0.8 million).
State Development
70 2015–16 Agency Statements — Volume 4

Highlights 2014–15
• Maintained the value of South Australian educational exports, including vocational education, at over $900 million in 2014–15.
• Implemented education marketing strategies for China, India, Malaysia and Vietnam to increase the number of international students choosing to study in South Australia.
• Supported Ministerial delegations to China, India, Malaysia, Singapore, and Vietnam to promote Adelaide as an education destination for international students, and identified opportunities for increasing the state’s education exports.
• Worked with the state’s public universities and the Department for Education and Child Development to implement a key deliverable in the government’s High Quality Education policy to have all new teachers to be Masters qualified by 2020.
• Established the Premier’s Higher Education Committee to advise the state government on policies and strategic settings to maximise the potential of the state’s universities for the benefit of the South Australian community.
• Delivered the inaugural Higher Education Regional Summit in Whyalla in conjunction with the state’s universities and regional organisations to support regions in gaining independent, expert advice on policy issues impacting on their communities.
Targets 2015–16
• Attract international students into science, technology, engineering and mathematics (STEM) undergraduate and postgraduate studies.
• Finalise and implement the South Australian International Student Strategy for positioning South Australia as a leader in delivering quality, globally competitive education.
• Better coordination of services to meet the needs of an increasing student population, such as accommodation, employment opportunities and support services.
Performance indicators(a)(b)
2015–16 Target(c)
2014–15 Estimated
Result 2014–15
Target 2013–14
Actual
% of South Australia’s share of overseas students 5.3% 5.2% 5.7% 5.4% No. of international student enrolments 31 900 30 726 45 000 28 300 No. of international student commencements 17 300 16 459 17 300 14 322
(a) The indicators in this sub-program are for international education. The Commonwealth Department of Education, Employment and Workplace Relations categorises international education into higher education, vocational and technical education, English language intensive courses for overseas students, schools, and other sectors. The other sector includes foundation, bridging and enabling courses plus other courses that do not lead to a qualification under the Australian Qualifications Framework. Targets and results are for calendar years.
(b) Achievement against targets is affected by external factors impacting on international student numbers, including policy changes to student visas implemented in 2009–10 and the high Australian dollar.
(c) The 2015–16 Target is based on South Australia’s economic priority 4 objective: Increase the number of international students studying in South Australia from 28 300 in 2013 (baseline) to 34 400 in 2017.
State Development
2015–16 Agency Statements — Volume 4 71

Program 3: Science, Technology and Information Economy
Description/objective
Provide the government with a strategic and coordinated focus in science, technology and information economy policy development and program delivery to support state productivity, and maximise economic benefit to the state by:
• identifying strategic priorities for state government investment in science and research, and facilitating and coordinating strategic bids for Commonwealth Government funding
• raising awareness within government, business and the community of the critical importance of science, research and innovation to the state’s prosperity
• providing funding to research organisations and industry, to build our research strengths through people, partnerships and strategic infrastructure
• facilitating linkages between research providers and commercial end-users (industry) to maximise the benefits of research for the South Australian economy
• facilitating new approaches to improving research commercialisation, and providing support to attract more venture capital to South Australia
• supporting policy reforms and program initiatives to increase STEM and entrepreneurship skills to drive innovation
• developing the South Australian bioscience industry by providing assistance in business development, finance, infrastructure and marketing
• developing strategy and facilitating programs and projects for promoting the information economy, implementing initiatives that support digital literacy across the community and supporting entrepreneurs to create start-up technology companies to commercialise information and communications technology (ICT) products and services.
State Development
72 2015–16 Agency Statements — Volume 4

Program summary — expenses, income and FTEs(a)
2015–16 Budget
2014–15 Estimated
Result 2014–15 Budget
2013–14 Actual
$000 $000 $000 $000
Expenses Employee benefit expenses.......................................... 2 407 1 940 2 300 3 379 Supplies and services ................................................... 2 167 1 133 1 338 1 512 Depreciation and amortisation expenses ...................... — — — 63 Grants and subsidies .................................................... 5 468 7 031 6 697 9 000 Intra-government transfers ........................................... 5 882 6 151 5 757 6 700 Other expenses ............................................................ 26 19 20 45
Total expenses 15 950 16 274 16 112 20 699
Income Commonwealth revenues ............................................. — — — 3 Intra-government transfers ........................................... 125 125 — 14 Other grants.................................................................. 1 1 1 500 Sales of goods and services ......................................... — 15 9 30 Other income ................................................................ 89 100 176 419
Total income 215 241 186 966
Net cost of providing services 15 735 16 033 15 926 19 733
FTEs as at 30 June (No.) 20.0 17.3 20.0 29.6
(a) The 2014–15 Budget amounts contained in the 2015–16 Agency Statements differs from those amounts contained in the 2014–15 Agency Statements to reflect internal resource allocations for each program. The 2014–15 Budget amounts in these statements have been amended for comparative purposes.
Financial commentary
2015–16 Budget/2014–15 Estimated Result
No major variations.
2014–15 Estimated Result/2014–15 Budget
No major variations.
2014–15 Estimated Result/2013–14 Actual
The $4.4 million decrease in expenses is primarily due to:
• cessation of payments under the Education Investment Fund in 2013–14 ($2.0 million)
• completion of the Adelaide Wi-Fi project in 2013–14 ($1.5 million)
• changes in overhead allocations between financial years which are allocated across programs ($0.8 million).
The $0.7 million decrease in income is primarily due to a once-off contribution from the Adelaide City Council for the Adelaide Wi-Fi project in 2013-14 ($0.5 million).
State Development
2015–16 Agency Statements — Volume 4 73

Highlights 2014–15
• Invested in 35 research projects under the Premier’s Research and Industry Fund (PRIF), leveraging more than $9.3 million in partner funds and collectively supporting the employment of 107 people across the duration of these projects.
• Established, in conjunction with SA Health and the South Australian Health and Medical Research Institute, the Medical Research Commercialisation Fund in South Australia, and successfully launched the Venture Catalyst Program and the South Australian Micro Finance Fund.
• Completed the Adelaide Wi-Fi project and signed a memorandum of understanding (MoU) with the Adelaide City Council and global technology company Cisco to establish the first Internet of Things Innovation Hub in Australia and launched two Smart City projects (Smart Parking and Smart Street Lighting). Adelaide was accepted into Cisco’s international Smart and Connected Communities Lighthouse City Program.
• Launched several STEM focused awareness programs including the Inspiring South Australia Program which will leverage more than $1 million from the Commonwealth Government and universities.
• BioSA Tech Hub, together with the existing BioSA Incubator, has doubled the business incubation space. Over 150 full-time equivalents are now employed between the two facilities which are both at full capacity.
• Supported bioscience and related companies with grants totalling $2 million to develop commercial technologies in agriculture/food/wine, biofuels, medical devices and pharmaceuticals.
Targets 2015–16
• Re-focus the Premier’s Research and Industry Fund to further develop the state’s science and research capability and capacity through larger scale and targeted investments which deliver on the Investing in Science Action Plan, and support South Australia’s economic priorities and areas of research excellence.
• Establish the Internet of Things Innovation Hub in partnership with the Adelaide City Council and Cisco.
• Deliver the STEM Internships Program to enable students to gain valuable industry experience through structured work placements with local defence and STEM companies, and offer scholarships for students studying STEM subjects relevant to local companies.
• Continue to liaise and negotiate with the Commonwealth Government and NBNCo to maximise the rate and impact of the South Australian rollout of the NBN fibre network, and ensure the proportion of South Australian premises with access to broadband services delivered by fibre technology meets the national average by 2020.
Performance indicators(a)
2015–16
Target
2014–15 Estimated
Result 2014–15
Target 2013–14
Actual
University — Industry Engagement • Cumulative industry funding to publicly funded research
sector Seeking annual increase, from baseline $270 million in 2012 to $570 million by 2017. There is a two year lag for relevant data from the Commonwealth Department of Education and Training, and Australian Bureau of Statistics. Data is by calendar year.
$450m
n.a.
$390m
n.a.
State Development
74 2015–16 Agency Statements — Volume 4

2015–16
Target
2014–15 Estimated
Result 2014–15
Target 2013–14
Actual
STEM students • No. of STEM students commencing undergraduate and
postgraduate studies each year The target in economic priority 4 is Increase the number of STEM students commencing undergraduate and postgraduate studies each year from 11 200 in 2013 (baseline) to 13 100 by 2017. Data is by calendar year and is reported by the Commonwealth Department of Education and Training in August of the following year.
12 150
n.a.
11 675
11 200
Adelaide Smart City • Smart City Pilot projects completed
Adelaide City Council, Cisco and the Department of State Development are partnering to deliver Internet of Things pilot projects to enhance Adelaide’s position as a Smart City.
3 n.a. n.a. n.a.
Bioscience Industry Development • No. of new companies created 4 3 4 4 • No. of projects assisted
The indicator represents projects undertaken by research organisations and companies.
50 50 50 50
• Value of grants provided to companies $2m $2m $2m $1.4m • No. of short courses and networking functions held 12 12 12 15 • No. of Australian provisional patent applications filed by
South Australian universities 30 37 25 39
(a) The 2014–15 Agency Statement did not identify Program 3 activity or performance indicators. The 2015–16 activity and performance measures are derived from targets in economic priority 4, and actions in the Investing in Science Action Plan.
Activity indicators(a)
2015–16
Projection
2014–15 Estimated
Result 2014–15
Projection 2013–14
Actual
Increase South Australian science and research capabilities and capacity through strategic investments by the Premier’s Research and Industry Fund
• Fully allocate budgeted funds in research areas of strategic economic priority
$5.9m $5.9m $6.5m $6m
Monitor progress of Investing in Science Action Plan • Summary progress report from the South Australian
Science Council to the Minister for Science and Information Economy (6 monthly) and one progress report to Cabinet annually
– Biannual report 2 1 1 n.a. – Annual report
Reporting regime implemented February 2015, first progress report delivered May 2015.
1 n.a. n.a. n.a.
Support South Australian STEM student engagement with local defence and STEM focused companies
• Allocate budgeted program for the STEM scholarships program
8 10 8–12 n.a.
• Allocate budgeted program for the STEM Internships Program
8 11 8 n.a.
Support commercialisation activity in South Australia • Allocate budgeted program funding for up to five Venture
Catalyst projects and eleven Micro Finance Fund projects.
– Venture Catalyst projects 5 3-5 5 n.a. – Micro Finance Fund projects The number of projects funded will depend on proposal quality and strength of business case.
11 10 10 n.a.
(a) The 2014–15 Agency Statement did not identify Program 3 activity or performance indicators. The 2015–16 activity and performance measures are derived from targets in economic priority 4, and actions in the Investing in Science Action Plan.
State Development
2015–16 Agency Statements — Volume 4 75

Program 4: Arts
Description/objective
Ensure the state recognises and capitalises on economic opportunities arising from the diverse arts and cultural organisations, practitioners, events and physical assets in the state by developing programs that build on cultural heritage and creativity, and providing financial support to the creative industries.
Sub-programs
4.1 State Library and Statewide Information Services
4.2 Support to Public Libraries and Community Information Services
4.3 Access to Art, Museum and Heritage Services and Preservation of State Collections
4.4 Arts Industry Development and Access to Artistic Product
Program summary — expenses, income and FTEs(a)
2015–16 Budget
2014–15 Estimated
Result 2014–15 Budget
2013–14 Actual
$000 $000 $000 $000
Expenses Employee benefit expenses.......................................... 6 963 10 139 11 085 12 161 Supplies and services ................................................... 8 961 6 272 6 939 6 359 Depreciation and amortisation expenses ...................... 6 333 6 435 6 435 6 254 Borrowing costs ............................................................ — — — 1 Grants and subsidies .................................................... 19 573 22 718 20 413 21 699 Intra-government transfers ........................................... 111 548 105 289 99 798 99 377 Other expenses ............................................................ 348 292 303 906
Total expenses 153 726 151 145 144 973 146 757
Income Commonwealth revenues ............................................. — 250 250 534 Intra-government transfers ........................................... 1 450 2 280 1 450 1 007 Other grants.................................................................. 8 8 8 — Sales of goods and services ......................................... 6 783 6 848 6 798 7 199 Interest revenues .......................................................... — — — 1 Net gain or loss from disposal of assets ....................... — -300 — -92 Resources received free of charge ............................... — 300 — 1 750 Other income ................................................................ 2 512 1 625 1 646 1 131
Total income 10 753 11 011 10 152 11 530
Net cost of providing services 142 973 140 134 134 821 135 227
FTEs as at 30 June (No.) 76.9 99.6 96.2 88.5
(a) The 2014–15 Budget amounts contained in the 2015–16 Agency Statements differs from those amounts contained in the 2014–15 Agency Statements to reflect internal resource allocations for each program. The 2014–15 Budget amounts in these statements have been amended for comparative purposes.
State Development
76 2015–16 Agency Statements — Volume 4

Sub-program 4.1: State Library and Statewide Information Services
Description/objective
Provide library and information services to the public, industry and government agencies.
2015–16 Budget
2014–15 Estimated
Result 2014–15 Budget
2013–14 Actual
$000 $000 $000 $000 Expenses ...................................................................... 16 201 17 756 17 361 17 254 Income .......................................................................... 12 45 41 171
Net cost of sub-program 16 189 17 711 17 320 17 083 FTEs as at 30 June (No.) 5.2 7.9 8.2 8.0
Financial commentary
2015–16 Budget/2014–15 Estimated Result
The $1.6 million decrease in expenses is primarily due to:
• external painting and essential heritage restoration works undertaken for the State Library’s Institute Building in 2014–15 ($1.2 million)
• changes in overhead allocations between financial years which are allocated across programs ($0.4 million).
2014–15 Estimated Result/2014–15 Budget
No major variations.
2014–15 Estimated Result/2013–14 Actual
No major variations.
Highlights 2014–15
• Completed the heritage restoration of the State Library’s Institute Building.
• Completed South Australia’s Centenary of Anzac website — a digital record of the state’s reflections on South Australians at war.
• Commenced development of a new web resource for the records of the South Australian Red Cross Information Bureau — a tracing bureau for missing soldiers — with phase one released to the public in May 2015.
• Increased user access to the State Library’s digitised collections by providing a new online image viewer giving access to high quality images, zoom capacity and social media sharing.
Targets 2015–16
• Develop a new State Library website to support learning and research, as well as to provide easier access to the library’s digitised collections, other online content and services
• Expand the State Library’s online collection and continue to preserve the State Library’s digital collections.
• Deliver South Australia’s Centenary of Anzac projects, including completion of the South Australian Red Cross Information Bureau web resource.
State Development
2015–16 Agency Statements — Volume 4 77

Performance indicators
2015–16
Target
2014–15 Estimated
Result 2014–15
Target 2013–14
Actual
% of library reference enquiries resolved within agreed customer timeframe
92% 92% 92% 95%
Activity indicators
2015–16
Projection
2014–15 Estimated
Result 2014–15
Projection 2013–14
Actual
No. of State Library visitors Reduction in visitation relates to the first full-year impact of the relocation of the City of Adelaide Lending Library from the Spence Building.
650 000 600 000 900 000 769 895
No. of State Library website visitors 950 000 950 000 800 000 1 118 510 Amount of external revenue received $1.212m $1.344m $1.200m $1.493m External revenue received as a % of total revenue 8% 9% 8% 9%
Sub-program 4.2: Support to Public Libraries and Community Information Services
Description/objective
Provide support and information services to the community and public libraries.
2015–16 Budget
2014–15 Estimated
Result 2014–15 Budget
2013–14 Actual
$000 $000 $000 $000 Expenses ...................................................................... 18 657 18 446 18 350 18 308 Income .......................................................................... 4 14 13 65
Net cost of sub-program 18 653 18 432 18 337 18 243
FTEs as at 30 June (No.) 1.8 2.7 2.7 2.6
Financial commentary
2015–16 Budget/2014–15 Estimated Result
No major variations.
2014–15 Estimated Result/2014–15 Budget
No major variations.
2014–15 Estimated Result/2013–14 Actual
No major variations.
State Development
78 2015–16 Agency Statements — Volume 4

Highlights 2014–15
• Completed the roll out of the One Card system for public libraries, in collaboration with South Australian councils and the Local Government Association.
• Completed the Tomorrow’s Libraries: Future directions of the South Australian Public Library Network — a 2015–2020 strategic plan.
Targets 2015–16
• Commence a statewide radio frequency identification tagging process for two million items in libraries across the state which will enhance self-service borrowing and automated sorting of items.
• Commence implementation of the Public Library Network’s Tomorrow’s Libraries strategic plan.
• Commence planning with Shandong Library for the implementation by 2020 of a One Card library network for Shandong Province, China.
• Work with regional councils to undertake community led planning on the future roles of School Community Libraries now that the One Card project has provided new possibilities for library service delivery.
Activity indicators
2015–16
Projection
2014–15 Estimated
Result 2014–15
Projection 2013–14
Actual
No. of items purchased and catalogued 286 000 286 000 279 000 269 000
Sub-program 4.3: Access to Art, Museum and Heritage Services and Preservation of State Collections
Description/objective
Provision of museum, visual arts and preservation services that enable the state’s cultural, heritage and arts assets to be maintained and kept accessible to the community.
2015–16 Budget
2014–15 Estimated
Result 2014–15 Budget
2013–14 Actual
$000 $000 $000 $000 Expenses ...................................................................... 35 436 35 910 36 072 34 704 Income .......................................................................... 3 138 2 283 2 275 1 170
Net cost of sub-program 32 298 33 627 33 797 33 534 FTEs as at 30 June (No.) 39.2 42.7 40.4 35.8
State Development
2015–16 Agency Statements — Volume 4 79

Financial commentary
2015–16 Budget/2014–15 Estimated Result
The $0.9 million increase in income is due to funding to the Art Gallery of South Australia from BHP Billiton for the TARNANTHI — Contemporary Aboriginal and Torres Strait Islander Art Festival ($0.9 million).
2014–15 Estimated Result/2014–15 Budget
No major variations.
2014–15 Estimated Result/2013–14 Actual
The $1.2 million increase in expenses is primarily due to:
• expenditure for the international Fashion Icons exhibition in 2014–15 ($1.7 million)
partially offset by
• changes in overhead allocations between financial years which are allocated across programs ($0.4 million).
The $1.1 million increase in income is primarily due to funding to the Art Gallery of South Australia from BHP Billiton for the TARNANTHI — Contemporary Aboriginal and Torres Strait Islander Art Festival ($1.2 million).
Highlights 2014–15
• Doubled the content of the free Adelaidia interactive app, which allows users to explore Adelaide's history through providing information, historical photographs and stories, as well as audio and video material.
• Held the major international exhibition Fashion Icons: Masterpieces from the collection of the Musée des Arts Décoratifs, Paris in the Art Gallery of South Australia to showcase iconic garments spanning eight decades.
• Commenced work on the Art Gallery of South Australia digital strategy, with funding support from the Ian Potter Foundation.
• Implemented the South Australian Museum’s strategic plan which focuses on its collections and knowledge sharing.
• Continued the entomology collection preservation project at the South Australian Museum which included delivery of an expanded scope to address the insect infestation of the birds and mammals collections.
Targets 2015–16
• Celebrate Carrick Hill’s anniversary of being open to the public for 30 years in 2016 through special events and initiatives.
• Expand the online content in both the free Adelaidia interactive app and the SA History Hub website.
• Present the TARNANTHI — Contemporary Aboriginal and Torres Strait Islander Art Festival and the 2016 Adelaide Biennial of Australian Art at the Art Gallery of South Australia.
State Development
80 2015–16 Agency Statements — Volume 4
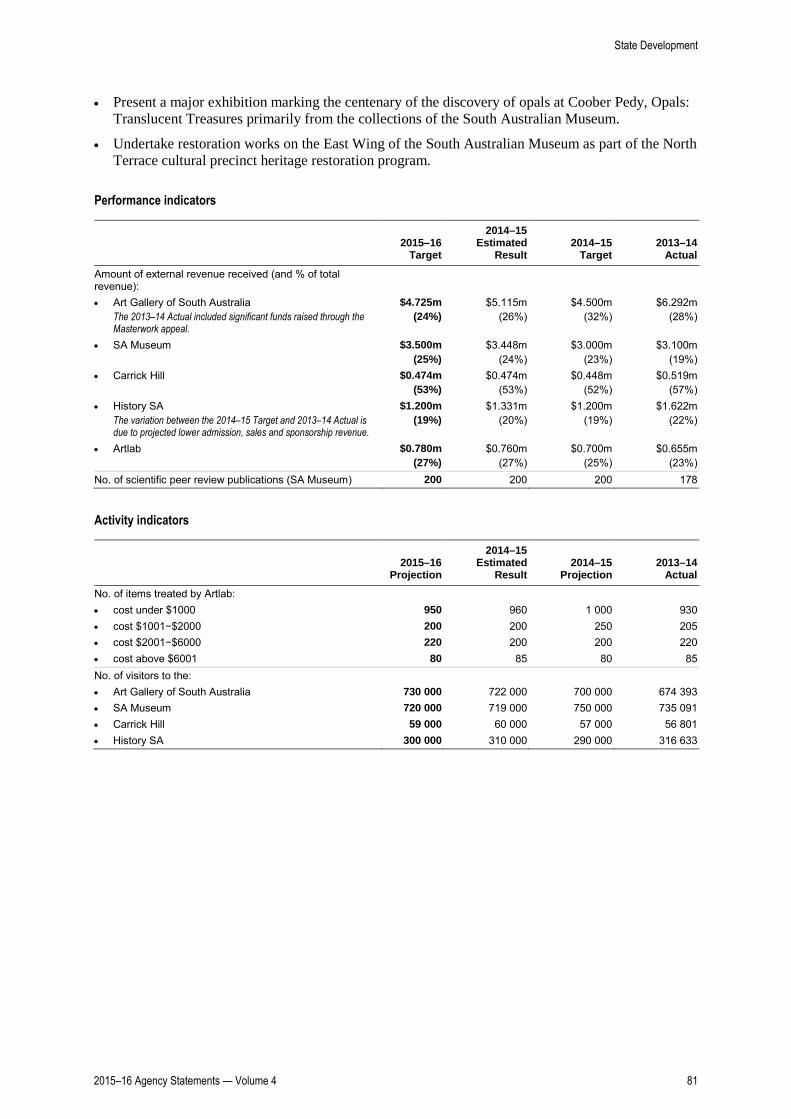
• Present a major exhibition marking the centenary of the discovery of opals at Coober Pedy, Opals: Translucent Treasures primarily from the collections of the South Australian Museum.
• Undertake restoration works on the East Wing of the South Australian Museum as part of the North Terrace cultural precinct heritage restoration program.
Performance indicators
2015–16
Target
2014–15 Estimated
Result 2014–15
Target 2013–14
Actual
Amount of external revenue received (and % of total revenue):
• Art Gallery of South Australia The 2013–14 Actual included significant funds raised through the Masterwork appeal.
$4.725m (24%)
$5.115m (26%)
$4.500m (32%)
$6.292m (28%)
• SA Museum $3.500m (25%)
$3.448m (24%)
$3.000m (23%)
$3.100m (19%)
• Carrick Hill $0.474m (53%)
$0.474m (53%)
$0.448m (52%)
$0.519m (57%)
• History SA The variation between the 2014–15 Target and 2013–14 Actual is due to projected lower admission, sales and sponsorship revenue.
$1.200m (19%)
$1.331m (20%)
$1.200m (19%)
$1.622m (22%)
• Artlab $0.780m (27%)
$0.760m (27%)
$0.700m (25%)
$0.655m (23%)
No. of scientific peer review publications (SA Museum) 200 200 200 178
Activity indicators
2015–16
Projection
2014–15 Estimated
Result 2014–15
Projection 2013–14
Actual
No. of items treated by Artlab: • cost under $1000 950 960 1 000 930 • cost $1001−$2000 200 200 250 205 • cost $2001−$6000 220 200 200 220 • cost above $6001 80 85 80 85 No. of visitors to the: • Art Gallery of South Australia 730 000 722 000 700 000 674 393 • SA Museum 720 000 719 000 750 000 735 091 • Carrick Hill 59 000 60 000 57 000 56 801 • History SA 300 000 310 000 290 000 316 633
State Development
2015–16 Agency Statements — Volume 4 81

Sub-program 4.4: Arts Industry Development and Access to Artistic Product
Description/objective
Provide services that increase opportunities for artists, cultural tourism, festivals and events and provide for productions, exhibitions, tours and events to the community.
2015–16 Budget
2014–15 Estimated
Result 2014–15 Budget
2013–14 Actual
$000 $000 $000 $000 Expenses ...................................................................... 83 432 79 033 73 190 76 491 Income .......................................................................... 7 599 8 669 7 823 10 124
Net cost of sub-program 75 833 70 364 65 367 66 367 FTEs as at 30 June (No.) 30.7 46.3 44.9 42.1
Financial commentary
2015–16 Budget/2014–15 Estimated Result
The $4.4 million increase in expenses is primarily due to:
• the upgrade of infrastructure at regional arts theatres by Country Arts SA ($4.3 million)
• expenditure on the Adelaide Festival Centre Precinct and technical equipment ($2.8 million)
partially offset by
• efficiency savings ($1.3 million)
• changes in overhead allocations between financial years which are allocated across the programs ($0.7 million)
• once-off funding in 2014–15 for the Shandong Cultural Project ($0.3 million)
• new artistic and cultural endeavours ($0.3 million).
The $1.1 million decrease in income is primarily due to:
• cessation in 2014–15 of funding relating to the Cultural Places — Goolwa pilot under the Australia Council's Community Partnerships arts funding program ($0.3 million)
• once-off funding in 2014–15 for the Shandong Cultural Project ($0.3 million)
• new artistic and cultural endeavours ($0.3 million).
2014–15 Estimated Result/2014–15 Budget
The $5.8 million increase in expenses is primarily due to:
• an increase in agency operating expenditure following the sale of the Netley Commercial Park ($3.4 million)
• expenditure on arts events in 2014–15 ($1.6 million)
• the establishment of the James Morrison Academy of Music in Mount Gambier and new artistic and cultural endeavours ($0.6 million)
• expenditure on the Adelaide Festival Centre Precinct and technical equipment ($0.5 million).
State Development
82 2015–16 Agency Statements — Volume 4

The $0.8 million increase in income is primarily due to funding for the establishment of the James Morrison Academy of Music in Mount Gambier and new artistic and cultural endeavours ($0.6 million).
2014–15 Estimated Result/2013–14 Actual
The $2.5 million increase in expenses is primarily due to:
• an increase in agency operating expenditure following the sale of the Netley Commercial Park ($3.4 million)
• the establishment of the James Morrison Academy of Music in Mount Gambier and new artistic and cultural endeavours ($0.6 million)
partially offset by
• changes in overhead allocations between financial years which are allocated across programs ($1.0 million).
The $1.5 million decrease in income is primarily due to a donated asset for the Adelaide Festival Centre Riverside Bistro in 2013–14 ($1.8 million).
Highlights 2014–15
• Delivered JamFactory and Guildhouse marketing, promotion, collaboration and partnership activities to build the capacity of the state’s artists and craft practitioners.
• Increased audiences and provided opportunities for South Australian artists to present their work. The Adelaide Fringe and the Adelaide Festival, including Writers Week, recorded significant growth in attendances.
• Delivered, via the Adelaide Festival Centre, the Shandong Cultural Project as part of the 2014 OzAsia Festival, and signed a Memorandum of Understanding (MoU) to progress the reciprocal cultural component of the South Australia–Shandong sister-state relationship.
• Completed sustainment works at Adelaide Festival Centre and Her Majesty’s Theatre.
• Delivered a successful new music and industry initiative, the Robert Stigwood Fellowship Program, to support the development of artists and music industry entrepreneurs.
Targets 2015–16
• Undertake building remediation works at the Adelaide Festival Centre.
• Commence the redevelopment of the Festival Plaza Precinct at the Adelaide Festival Centre, including the new plaza, upgraded entries, foyers and technical equipment for the theatres.
• Continue the development of the St Paul’s Creative Centre as a hub that enables collaboration and connectivity through physical and digital clustering of arts and broader creative industries businesses and practitioners.
• Deliver benefits to the music industry through the programs and activity of the Music Development Office and increase the industry’s capabilities and development of markets, locally, nationally and internationally.
• Deliver a reciprocal cultural exchange in Shandong Province, China, under the terms of the existing MoU between the Adelaide Festival Centre and the Shandong Provincial Department of Culture.
State Development
2015–16 Agency Statements — Volume 4 83
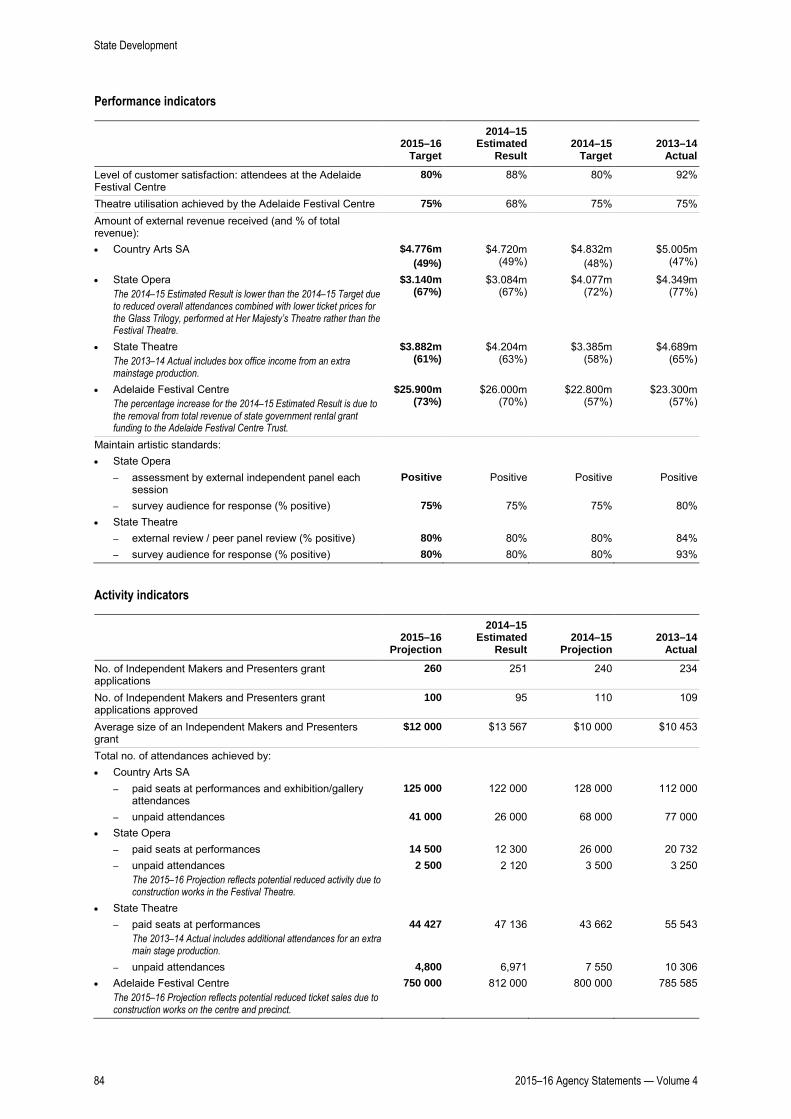
Performance indicators
2015–16
Target
2014–15 Estimated
Result 2014–15
Target 2013–14
Actual
Level of customer satisfaction: attendees at the Adelaide Festival Centre
80% 88% 80% 92%
Theatre utilisation achieved by the Adelaide Festival Centre 75% 68% 75% 75% Amount of external revenue received (and % of total revenue):
• Country Arts SA
$4.776m (49%)
$4.720m (49%)
$4.832m (48%)
$5.005m (47%)
• State Opera The 2014–15 Estimated Result is lower than the 2014–15 Target due to reduced overall attendances combined with lower ticket prices for the Glass Trilogy, performed at Her Majesty’s Theatre rather than the Festival Theatre.
$3.140m (67%)
$3.084m (67%)
$4.077m (72%)
$4.349m (77%)
• State Theatre The 2013–14 Actual includes box office income from an extra mainstage production.
$3.882m (61%)
$4.204m (63%)
$3.385m (58%)
$4.689m (65%)
• Adelaide Festival Centre The percentage increase for the 2014–15 Estimated Result is due to the removal from total revenue of state government rental grant funding to the Adelaide Festival Centre Trust.
$25.900m (73%)
$26.000m (70%)
$22.800m (57%)
$23.300m (57%)
Maintain artistic standards: • State Opera
– assessment by external independent panel each session
Positive Positive Positive Positive
– survey audience for response (% positive) 75% 75% 75% 80% • State Theatre
– external review / peer panel review (% positive) 80% 80% 80% 84% – survey audience for response (% positive) 80% 80% 80% 93%
Activity indicators
2015–16
Projection
2014–15 Estimated
Result 2014–15
Projection 2013–14
Actual
No. of Independent Makers and Presenters grant applications
260 251 240 234
No. of Independent Makers and Presenters grant applications approved
100 95 110 109
Average size of an Independent Makers and Presenters grant
$12 000 $13 567 $10 000 $10 453
Total no. of attendances achieved by: • Country Arts SA
– paid seats at performances and exhibition/gallery attendances
125 000 122 000 128 000 112 000
– unpaid attendances 41 000 26 000 68 000 77 000 • State Opera
– paid seats at performances 14 500 12 300 26 000 20 732 – unpaid attendances
The 2015–16 Projection reflects potential reduced activity due to construction works in the Festival Theatre.
2 500 2 120 3 500 3 250
• State Theatre – paid seats at performances
The 2013–14 Actual includes additional attendances for an extra main stage production.
44 427 47 136 43 662 55 543
– unpaid attendances 4,800 6,971 7 550 10 306 • Adelaide Festival Centre
The 2015–16 Projection reflects potential reduced ticket sales due to construction works on the centre and precinct.
750 000 812 000 800 000 785 585
State Development
84 2015–16 Agency Statements — Volume 4

Program 5: Health Industries
Description/objective
Increase investment and employment in South Australia’s health and biomedical sector to achieve the government’s vision for the state to become a globally recognised leader in health research, ageing and related services and products.
Program summary — expenses, income and FTEs
2015–16 Budget
2014–15 Estimated
Result 2014–15 Budget
2013–14 Actual
$000 $000 $000 $000
Expenses Employee benefit expenses.......................................... 841 989 478 278 Supplies and services ................................................... 1 624 1 734 2 122 244 Grants and subsidies .................................................... — 13 — — Intra-government transfers ........................................... 2 3 — — Other expenses ............................................................ 4 3 — —
Total expenses 2 471 2 742 2 600 522
Income Sales of goods and services ......................................... — 3 — — Other income ................................................................ 1 3 — —
Total income 1 6 — —
Net cost of providing services 2 470 2 736 2 600 522
FTEs as at 30 June (No.) 7.4 7.5 3 3
Financial commentary
2015–16 Budget/2014–15 Estimated Result
No major variations.
2014–15 Estimated Result/2014–15 Budget
No major variations.
2014–15 Estimated Result/2013–14 Actual
The $2.2 million increase in expenses is primarily due to the establishment of the Health Industries program in early 2014. The 2013–14 Actual reflects part year costs.
Highlights 2014–15
• Developed investment opportunities for the life sciences sector in South Australia, with five companies in final stages of negotiation and up to 20 companies in early stage negotiations.
• Identified major South Australian companies exporting health and biomedical goods and services, and international investment and trade opportunities, including the key markets of China and the United States of America.
State Development
2015–16 Agency Statements — Volume 4 85

• Undertook analysis of South Australia’s global competitive advantages in the life sciences sector.
• Prepared value propositions for twenty-first century medicine and engaged with stakeholders to leverage local networks in order to attract investment and create employment in the sector.
Targets 2015–16
• Continue to attract venture capital and other investors to develop and expand health businesses and projects in South Australia.
• Develop a global-level action plan aimed to raise awareness of the value propositions that South Australia has to offer investors in the life sciences.
• Leverage local expertise in the life sciences sector to attract investments by creating more export opportunities, channelling more clinical research investments and also through increased training, education and services.
• Increase South Australia’s share of Australia’s clinical trials market.
• Establish a leading telehealth industry encompassing telehealth service, remote and mobile monitoring.
• Work in partnership to develop the North Terrace Health Precinct as the cornerstone of South Australia’s health economy, and secure significant health and biomedical conferences in South Australia to promote business-to-business research partnering.
• Increase the number of major South Australian companies exporting health and biomedical goods and services (including medical devices).
Performance indicators(a)
2015–16
Target
2014–15 Estimated
Result 2014–15
Target 2013–14
Actual
Attract new major health and biomedical companies to establish facilities in South Australia
2 n.a. n.a. n.a.
Secure significant health/biomedical conferences to South Australia
3 n.a. n.a. n.a.
(a) New targets were determined for this program during 2014–15 as part of the Health Industries of South Australia’s establishment process.
State Development
86 2015–16 Agency Statements — Volume 4

Program 6: Mineral Resources and Energy
Description/objective
Unlock the full potential of South Australia’s resources, energy and renewable assets and maintain the state’s reputation as a leading resource investment destination.
Sub-programs
6.1 Mineral Resources
6.2 Energy Resources
6.3 Olympic Dam Taskforce
6.4 Energy Policy and Programs
6.5 Electricity and Gas Technical and Safety Regulation
6.6 RenewablesSA
Program summary — expenses, income and FTEs(a)
2015–16 Budget
2014–15 Estimated
Result 2014–15 Budget
2013–14 Actual
$000 $000 $000 $000
Expenses Employee benefit expenses.......................................... 34 888 35 779 36 213 37 795 Supplies and services ................................................... 27 465 31 786 31 150 34 448 Depreciation and amortisation expenses ...................... 1 726 1 725 1 726 1 254 Borrowing costs ............................................................ — — — 5 Grants and subsidies .................................................... 16 636 13 203 12 198 12 497 Intra-government transfers ........................................... 55 65 9 14 Other expenses ............................................................ 162 130 134 205
Total expenses 80 932 82 688 81 430 86 218
Income Commonwealth revenues ............................................. 226 661 220 665 Intra-government transfers ........................................... 6 950 6 867 6 667 6 539 Other grants.................................................................. 4 3 4 — Fees, fines and penalties .............................................. 23 308 21 841 20 557 21 585 Sales of goods and services ......................................... 5 341 4 113 5 285 4 971 Net gain or loss from disposal of assets ....................... — — — 3 Other income ................................................................ 2 815 3 253 2 521 2 850
Total income 38 644 36 738 35 254 36 613
Net cost of providing services 42 288 45 950 46 176 49 605
FTEs as at 30 June (No.) 332.5 331.2 332.8 312.6
(a) The 2014–15 Budget amounts contained in the 2015–16 Agency Statements differs from those amounts contained in the 2014–15 Agency Statements to reflect internal resource allocations for each program. The 2014–15 Budget amounts in these statements have been amended for comparative purposes.
State Development
2015–16 Agency Statements — Volume 4 87

Sub-program 6.1: Mineral Resources
Description/objective
Maximise the community’s net benefit from the state’s ownership of the rights to mineral resources.
Manage the state’s mineral resources by regulating operations and developing sustainable practices for exploration and development.
Provide comprehensive, high quality geoscientific data and advice, and develop an effective and efficient policy, regulatory and legislative framework.
Collect royalties with trustworthy compliance frameworks.
2015–16 Budget
2014–15 Estimated
Result 2014–15 Budget
2013–14 Actual
$000 $000 $000 $000 Expenses ...................................................................... 30 039 34 872 34 154 36 110 Income .......................................................................... 13 306 12 468 11 919 12 932
Net cost of sub-program 16 733 22 404 22 235 23 178 FTEs as at 30 June (No.) 175.2 176.4 177.9 167.6
Financial commentary
2015–16 Budget/2014–15 Estimated Result
The $4.8 million decrease in expenses is primarily due to:
• the completion of the Plan for Accelerating Exploration (PACE) Frontiers initiative in 2014–15 ($1.9 million)
• a reduction in operating expenditure in line with the forward plan for the Brukunga Rock Dumps Strategy ($1.4 million)
• changes in overhead allocations between financial years which are allocated across programs ($1.0 million)
• a reduction in expenditure for the Mining and Petroleum Services Centre of Excellence ($0.7 million)
• expenditure for the Eyre Peninsula Land Use Support initiative ending in 2014–15 ($0.3 million).
The $0.8 million increase in income is primarily due to increased recovery of costs through regulated fees and charges ($0.8 million).
2014–15 Estimated Result/2014–15 Budget
The $0.7 million increase in expenses is primarily due to:
• reclassification of expenditure for the Brukunga Rock Dumps strategy from investing to operating ($1.0 million)
partially offset by
• a reduction in expenditure for the Mining and Petroleum Services Centre of Excellence ($0.3 million).
State Development
88 2015–16 Agency Statements — Volume 4

The $0.5 million increase in income is primarily due to increased recovery of costs through regulated fees and charges ($0.4 million).
2014–15 Estimated Result/2013–14 Actual
The $1.2 million decrease in expenses is primarily due to:
• changes in overhead allocations between financial years which are allocated across programs ($0.6 million)
• the completion of the design phase of the State Drill Core Reference Library in 2013–14 ($0.2 million).
The $0.5 million decrease in income is primarily due to lower activity attracting fees and charges in 2014–15 ($0.5 million).
Highlights 2014–15
• Delivered Year 2 of the augmented PACE Frontiers program to stimulate new exploration in remote regions through a new program of regional drilling, airborne surveying and mineral systems and geological mapping, in partnership with the Deep Exploration Technologies Cooperative Research Centre (CRC).
• Delivered Year 2 of the Eyre Peninsula Land Use Support Program including the facilitated community workshops and engagement programs designed to assist landholders, farming businesses and communities.
• Contributed to the continued growth of South Australia’s mining industry through case management of Mining Act 1971 final approvals for the Portia gold mine, the Hillside copper/gold mine and extensions to the Kanmantoo copper mine.
• Led the delivery of innovation projects for the Mining and Petroleum Services Centre of Excellence which foster the commercialisation of new technologies and build globally competitive resource sector supply chains.
• Commenced construction of the new State Drill Core Reference Library as part of a resources hub at the Tonsley Redevelopment to underpin a strong mineral and energy exploration sector, leading to new world class discoveries.
• Facilitated the development of regional resource infrastructure through a Regional Resources Infrastructure Taskforce that will be the state’s single point of reference for the facilitation of the planning, development and delivery of resources infrastructure that also provides flow on benefits to surrounding communities, industries and businesses.
Targets 2015–16
• Finalise construction and transition operations to the new State Drill Core Reference Library.
• Release the products and outcomes of the PACE Frontiers 2014–15 programs, specifically the Mineral Systems Drilling reports and data from the Gawler Craton in collaboration with the Deep Exploration Technologies CRC.
• Finalise the state’s largest aero-magnetic survey covering the under explored south west region of the state as a precursor to exploration release areas being delivered to the market.
• Release new guidelines and determinations to further support a one window to government approach to streamlined assessment and approvals processes under the Mining Act 1971.
• Lead the consultation, development and implementation of a Multiple Land Use Framework in support of growing the mining industry in collaboration with regional communities.
• Enhance and increase royalty audit activities to improve accuracy of industry royalty returns.
State Development
2015–16 Agency Statements — Volume 4 89

Performance indicators
2015–16
Target
2014–15 Estimated
Result 2014–15
Target 2013–14
Actual
Exploration expenditure This indicator is aligned with the target to increase private investment in mineral and energy resources — economic priority 1 Unlocking the full potential of South Australia’s resources, energy & renewable assets.
$200m $120m $200m $116.4m
Activity indicators
2015–16
Projection
2014–15 Estimated
Result 2014–15
Projection 2013–14
Actual
No. of final approvals for new mines 2 2 2 2
Sub-program 6.2: Energy Resources
Description/objective
Maximise the community’s net benefit from the state’s ownership of the rights to petroleum, geothermal and geologic gas storage resources. Deliver world-class regulation so that both investors and the public have confidence that all operations are undertaken pursuant to the Petroleum and Geothermal Energy Act 2000.
Provide comprehensive, high quality geoscientific data and advice, and develop an effective and efficient policy, regulatory and legislative framework. Develop sustainable practices for exploration and development.
Collect royalties with trustworthy compliance frameworks.
2015–16 Budget
2014–15 Estimated
Result 2014–15 Budget
2013–14 Actual
$000 $000 $000 $000 Expenses ...................................................................... 14 415 12 200 15 970 10 323 Income .......................................................................... 11 084 10 372 9 521 9 466
Net cost of sub-program 3 331 1 828 6 449 857 FTEs as at 30 June (No.) 60.6 59.6 60.9 50.1
Financial commentary
2015–16 Budget/2014–15 Estimated Result
The $2.2 million increase in expense is primarily due to grant expenditure for the Innamincka Airstrip carried over to 2015–16 ($2.4 million).
The $0.7 million increase in income is primarily due to:
• the indexation of fees and charges revenue ($0.4 million)
• additional Petroleum Retention Licences revenue as a result of increased activity ($0.3 million).
State Development
90 2015–16 Agency Statements — Volume 4
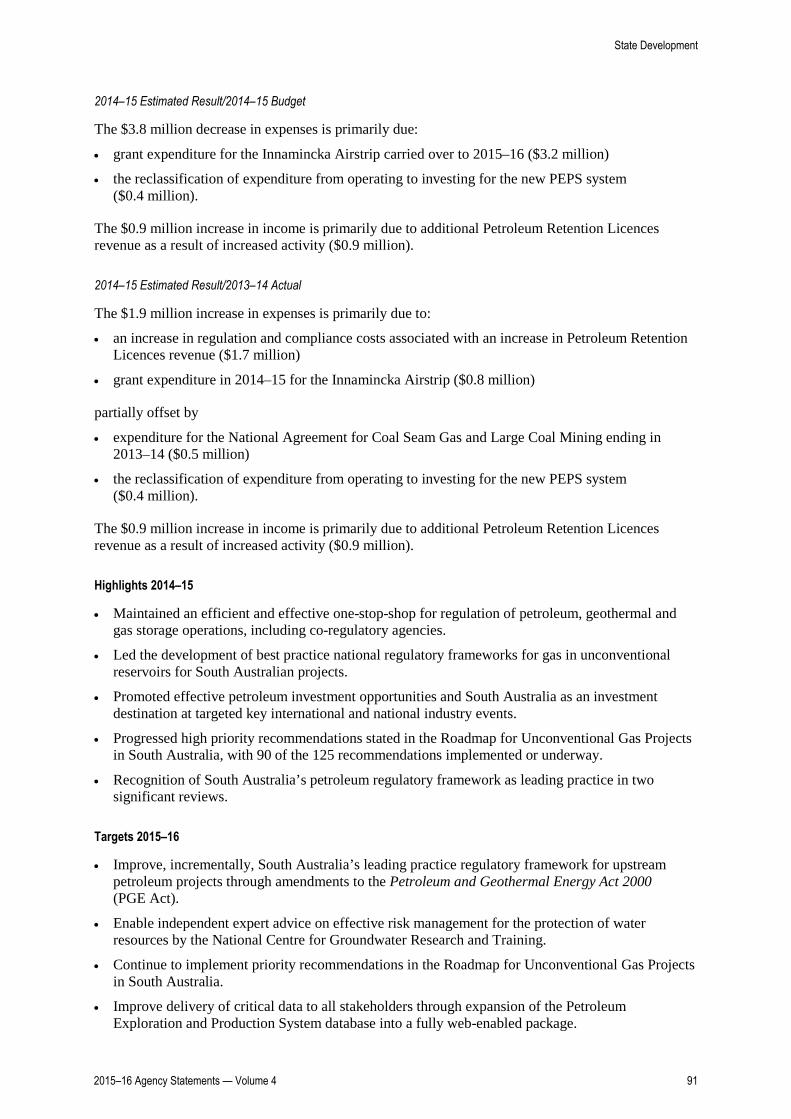
2014–15 Estimated Result/2014–15 Budget
The $3.8 million decrease in expenses is primarily due:
• grant expenditure for the Innamincka Airstrip carried over to 2015–16 ($3.2 million)
• the reclassification of expenditure from operating to investing for the new PEPS system ($0.4 million).
The $0.9 million increase in income is primarily due to additional Petroleum Retention Licences revenue as a result of increased activity ($0.9 million).
2014–15 Estimated Result/2013–14 Actual
The $1.9 million increase in expenses is primarily due to:
• an increase in regulation and compliance costs associated with an increase in Petroleum Retention Licences revenue ($1.7 million)
• grant expenditure in 2014–15 for the Innamincka Airstrip ($0.8 million)
partially offset by
• expenditure for the National Agreement for Coal Seam Gas and Large Coal Mining ending in 2013–14 ($0.5 million)
• the reclassification of expenditure from operating to investing for the new PEPS system ($0.4 million).
The $0.9 million increase in income is primarily due to additional Petroleum Retention Licences revenue as a result of increased activity ($0.9 million).
Highlights 2014–15
• Maintained an efficient and effective one-stop-shop for regulation of petroleum, geothermal and gas storage operations, including co-regulatory agencies.
• Led the development of best practice national regulatory frameworks for gas in unconventional reservoirs for South Australian projects.
• Promoted effective petroleum investment opportunities and South Australia as an investment destination at targeted key international and national industry events.
• Progressed high priority recommendations stated in the Roadmap for Unconventional Gas Projects in South Australia, with 90 of the 125 recommendations implemented or underway.
• Recognition of South Australia’s petroleum regulatory framework as leading practice in two significant reviews.
Targets 2015–16
• Improve, incrementally, South Australia’s leading practice regulatory framework for upstream petroleum projects through amendments to the Petroleum and Geothermal Energy Act 2000 (PGE Act).
• Enable independent expert advice on effective risk management for the protection of water resources by the National Centre for Groundwater Research and Training.
• Continue to implement priority recommendations in the Roadmap for Unconventional Gas Projects in South Australia.
• Improve delivery of critical data to all stakeholders through expansion of the Petroleum Exploration and Production System database into a fully web-enabled package.
State Development
2015–16 Agency Statements — Volume 4 91

Sub-program 6.3: Olympic Dam Taskforce
Description/objective
Provide specialised facilitation of resource projects that are significant in terms of size and complexity, and guide proposed projects through government’s policy, planning, technical, legal, financial and environmental requirements to enable approval and implementation. Projects include:
• BHP Billiton’s Olympic Dam expansion proposal
• Nyrstar’s Port Pirie Smelter transformation
• Arrium’s iron ore mining and export operations and steel manufacturing activities around Whyalla.
2015–16 Budget
2014–15 Estimated
Result 2014–15 Budget
2013–14 Actual
$000 $000 $000 $000 Expenses ...................................................................... 7 321 2 598 1 977 3 258 Income .......................................................................... 16 638 7 546
Net cost of sub-program 7 305 1 960 1 970 2 712 FTEs as at 30 June (No.) 11.4 7.3 8.4 7.7
Financial commentary
2015–16 Budget/2014–15 Estimated Result
The $4.7 million increase in expenses is primarily due to:
• expenditure commencing in 2015–16 for OZ Minerals increased investment in South Australia and relocation of head office from Melbourne ($4.0 million)
• changes in overhead allocations between financial years which are allocated across programs ($0.8 million)
partially offset by
• reduced expenditure relating to the Nystar project ($0.6 million).
The $0.6 million decrease in income is primarily due to a once-off reimbursement in 2014–15 of external consultancy costs associated with the Nystar project ($0.6 million).
2014–15 Estimated Result/2014–15 Budget
The $0.6 million increase in expenses and income is primarily due to a once-off reimbursement of external consultancy costs associated with the Nystar project ($0.6 million).
2014–15 Estimated Result/2013–14 Actual
The $0.7 million decrease in expenses is primarily due to:
• expenditure for the Port Pirie Transformation project ending in 2013–14 ($1.0 million)
• changes in overhead allocations between financial years which are allocated across programs ($0.3 million)
partially offset by
• once-off expenditure associated with the Nystar project ($0.6 million).
State Development
92 2015–16 Agency Statements — Volume 4

Highlights 2014–15
• Ensured seamless cross-government case management for BHP Billiton’s Olympic Dam operations and continued to facilitate the development path towards substantial expansion of mining, processing and export operations.
• Facilitated the Nyrstar Port Pirie Transformation project, including monitoring of financial arrangements, implementation of the Targeted Lead Abatement Program and compliance with development conditions.
• Facilitated the continued expansion and business sustainability of Arrium’s steel making and mining operations in South Australia.
• Progressed the recommendations of the Regional Mining Infrastructure Plan including assessment of the commerciality of key iron ore projects and options for sharing and upgrading existing infrastructure.
• Implemented temporary arrangements to minimise environmental issues for the Ridley (Dry Creek) Salt Field project and commenced investigations and trials for the closure project.
• Facilitated continued development of the Spencer Gulf Ecosystem and Development Initiative.
Targets 2015–16
• Continue cross-government case management for BHP Billiton’s Olympic Dam operations and facilitate the development path towards substantial expansion, including the first stage — assist BHP Billiton to commence construction of the Heap Leach Demonstration Trial.
• Facilitate the Nyrstar Port Pirie Transformation project, including monitoring of financial arrangements and implementation of the Targeted Lead Abatement Program for Port Pirie.
• Implement the next stage of closure for the Ridley (Dry Creek) Salt Fields, which will include future land use planning, land liability framework, water management, negotiation of a conservation plan and a communications plan with close watch on dust management.
• Facilitate negotiations regarding funding by both industry and Commonwealth Government for the Spencer Gulf Ecosystem and Development Initiative.
• Develop a copper strategy and a magnetite marketing strategy in collaboration with industry, research institutions and community.
• Undertake, through the Resources Infrastructure Taskforce, the next stage of work to support resource sector demand including making recommendations on high capacity ports, and the provision of power, water and multi-user infrastructure to support mining in key regions.
Sub-program 6.4: Energy Policy and Programs
Description/objective
Provide policy advice and coordination of energy market reforms, including national reforms, sustainability, energy efficiency and renewable energy policy.
Manage energy programs for the delivery of services to remote areas in support of energy efficiency, renewable energy and the provision of safe and reliable electricity services across towns in off-grid remote areas of the state, including remote Aboriginal lands.
State Development
2015–16 Agency Statements — Volume 4 93
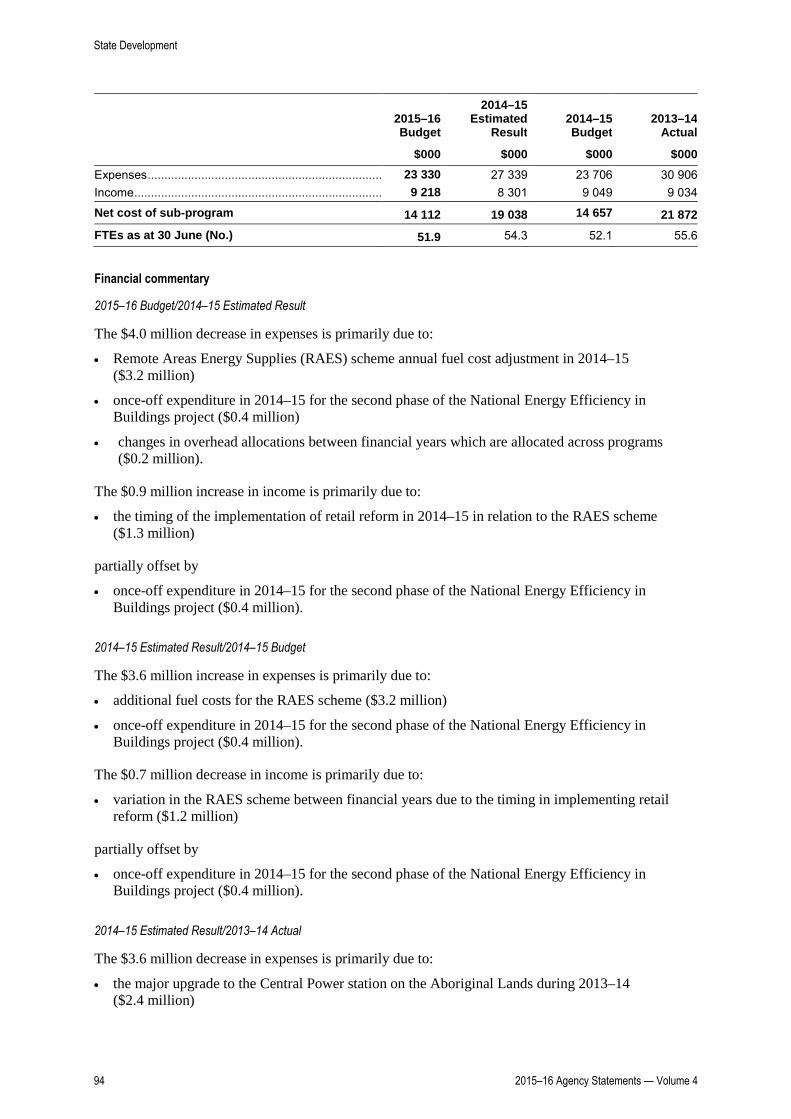
2015–16 Budget
2014–15 Estimated
Result 2014–15 Budget
2013–14 Actual
$000 $000 $000 $000 Expenses ...................................................................... 23 330 27 339 23 706 30 906 Income .......................................................................... 9 218 8 301 9 049 9 034
Net cost of sub-program 14 112 19 038 14 657 21 872 FTEs as at 30 June (No.) 51.9 54.3 52.1 55.6
Financial commentary
2015–16 Budget/2014–15 Estimated Result
The $4.0 million decrease in expenses is primarily due to:
• Remote Areas Energy Supplies (RAES) scheme annual fuel cost adjustment in 2014–15 ($3.2 million)
• once-off expenditure in 2014–15 for the second phase of the National Energy Efficiency in Buildings project ($0.4 million)
• changes in overhead allocations between financial years which are allocated across programs ($0.2 million).
The $0.9 million increase in income is primarily due to:
• the timing of the implementation of retail reform in 2014–15 in relation to the RAES scheme ($1.3 million)
partially offset by
• once-off expenditure in 2014–15 for the second phase of the National Energy Efficiency in Buildings project ($0.4 million).
2014–15 Estimated Result/2014–15 Budget
The $3.6 million increase in expenses is primarily due to:
• additional fuel costs for the RAES scheme ($3.2 million)
• once-off expenditure in 2014–15 for the second phase of the National Energy Efficiency in Buildings project ($0.4 million).
The $0.7 million decrease in income is primarily due to:
• variation in the RAES scheme between financial years due to the timing in implementing retail reform ($1.2 million)
partially offset by
• once-off expenditure in 2014–15 for the second phase of the National Energy Efficiency in Buildings project ($0.4 million).
2014–15 Estimated Result/2013–14 Actual
The $3.6 million decrease in expenses is primarily due to:
• the major upgrade to the Central Power station on the Aboriginal Lands during 2013–14 ($2.4 million)
State Development
94 2015–16 Agency Statements — Volume 4

• changes in overhead allocations between financial years which are allocated across programs ($1.0 million).
The $0.7 million decrease in income is primarily due to once-off expenditure in 2014–15 for the second phase of the National Energy Efficiency in Buildings project ($0.4 million).
Highlights 2014–15
• Delivered the framework enabling the establishment of Energy Consumers on 30 January 2015. The organisation is tasked with increasing consumer advocacy on national energy market matters of strategic importance and material consequence for energy consumers, in particular household and small business consumers.
• Completed a proposal to the Australian Energy Market Commission for amendments to the national energy frameworks in relation to transmissions connections and planning, and submitted for assessment.
• Amended regulations to enact the Retailer Energy Efficiency Scheme to 2020 and set scheme targets and energy saving activity specifications for the period 2015 to 2017.
• On behalf of all Australian jurisdictions:
– completed national stakeholder engagement on energy efficiency requirements for new buildings and commenced four targeted national projects to improve compliance with the energy efficiency provisions of the national Construction Code
– developed minimum luminaire efficacy rating for street lights, and incorporated, for the first time, the minimum requirement into Standards Australia draft specifications.
• Continued the provision of safe and reliable electricity to customers across 13 off-grid remote towns outside of the Aboriginal lands and 15 remote communities within the Aboriginal lands through a range of infrastructure and productivity projects designed to improve efficiency and security of supply.
• Undertook a full analysis of the Coober Pedy Hybrid Generation project which will deliver high penetration renewable electricity.
• Assisted all households through the Energy Advisory Service, Energy Partners Program, and a range of other direct and indirect services to improve energy literacy and affordability.
Targets 2015–16
• Deliver the framework for providing the Australian Energy Regulator with a new function of monitoring and reporting on the wholesale electricity market.
• Develop a business case and commence a pilot of innovative energy efficiency and decentralised supply solutions in small communities supplied through the Remote Areas Energy Supplies scheme.
• Lead development and implementation, on behalf of all Australian jurisdictions of:
– key elements of the five-year strategy to improve compliance with the energy efficiency requirements for new buildings, across compliance checking, industry capacity building and consumer protection
– large scale street lighting system design classifications scale to enable best practice energy efficient design.
• Develop a national energy productivity policy framework, in collaboration with all Australian jurisdictions, to drive collaborative action on energy efficiency and energy market reforms.
State Development
2015–16 Agency Statements — Volume 4 95

• Facilitate efficient delivery of the Retailer Energy Efficiency Scheme to the low-income households and the small to medium enterprise (SME) sectors, identifying and addressing any market barriers.
• Finalise long-term contracts for the Remote Area Energy Supply scheme for the delivery of electricity and associated services in remote off-grid towns.
Performance indicators
2015–16
Target
2014–15 Estimated
Result 2014–15
Target 2013–14
Actual
% of renewable energy generated Targets are based on forecasts released by the Australian Energy Market Operator. A number of factors can influence the results including weather and demand during the period.
51.6% 49.9% 36.3% 39.3%
% of government renewable energy purchase The 2012–13 Mid-Year Budget Review noted that in 2014–15, the government’s minimum greenpower purchase requirement would be deferred. Shared Services SA advised that the 20 per cent greenpower purchase in the small market electricity contract ceased on 31 December 2013. For the large market electricity contract, the 20 per cent greenpower purchase increased to 50 per cent greenpower purchase on 1 July 2014, until it ceased on 31 December 2014.
n.a 21% 21% 18.5%
% of energy efficiency of government buildings The 2014–15 Estimated Result and the 2015–16 Target are based on a linear progression between the actual 2013–14 result and the 2020 target for South Australia’s Strategic Plan target T61 (30 per cent improvement by 2020).
25.9% 24.8% 23.4% 23.8%
South Australia’s residential energy efficiency index The energy efficiency index describes the number of residential dwellings that can have their annual energy needs met by 1 terajoule of energy. Actual results for 2013–14 exceeded the 2014 milestone (23.74) and 2020 target (24.82) for South Australia’s Strategic Plan target T60. The 2015–16 Target is based on a linear progression between the 2014 milestone and the 2020 target for SASP target T60.
24.14 27.21 24.08 27.21
Sub-program 6.5: Electricity and Gas Technical and Safety Regulation
Description/objective
Enforcement, compliance and promotion of technical and safety regulation and the monitoring and management of emergency (energy related) events.
2015–16 Budget
2014–15 Estimated
Result 2014–15 Budget
2013–14 Actual
$000 $000 $000 $000 Expenses ...................................................................... 5 143 5 107 4 940 4 884 Income .......................................................................... 5 020 4 958 4 757 4 633
Net cost of sub-program 123 149 183 251 FTEs as at 30 June (No.) 30.5 30.7 30.6 28.5
Financial commentary
2015–16 Budget/2014–15 Estimated Result
No major variations.
State Development
96 2015–16 Agency Statements — Volume 4

2014–15 Estimated Result/2014–15 Budget
No major variations.
2014–15 Estimated Result/2013–14 Actual
No major variations.
Highlights 2014–15
• Maintained a low level of energy related incidents and accidents through community engagement and education.
• Continued the review of the Electricity Act 1996 and Gas Act 1997.
• Project managed and successfully enforced various technical non-compliances with standards and legislation, as they arose throughout the year.
• Reviewed and approved the release of the updated 2014 edition of the SA Power Networks Service and Installation Rules.
• Participated in ongoing national negotiations with the aim of introducing the proposed electrical equipment safety system.
Targets 2015–16
• Maintain low levels of gas and electricity accidents and fatalities as the overarching objective of the Office of the Technical Regulator.
• Deliver amendments to the Electricity Act 1996, the Gas Act 1997 and related regulations for technical and safety issues including hazard trees; the approval of safety, reliability, maintenance and technical management plans and the implementation of the intergovernmental agreement on electricity industry safety.
Activity indicators
2015–16
Projection
2014–15 Estimated
Result 2014–15
Projection 2013–14
Actual
No. of safety presentations to key stakeholders Some of the presentations provided by the Office of the Technical Regulator are in collaboration with industry training bodies as part of the training for apprentices or are as a refresher course for licenced trade personnel.
130 100 180 136
No. of proactive technical and safety audits 2 100 2 100 2 300 2 045
State Development
2015–16 Agency Statements — Volume 4 97

Sub-program 6.6: RenewablesSA
Description/objective
Provides specialist support to enable renewable energy investment and industry development for the state. The objective is to act as an enabler of opportunities and remove barriers for renewable energy investment for South Australia.
2015–16 Budget
2014–15 Estimated
Result 2014–15 Budget
2013–14 Actual
$000 $000 $000 $000 Expenses ...................................................................... 684 572 683 737 Income .......................................................................... — 1 1 2
Net cost of sub-program 684 571 682 735 FTEs as at 30 June (No.) 2.9 2.9 2.9 3.1
Financial commentary
2015–16 Budget/2014–15 Estimated Result
No major variations.
2014–15 Estimated Result/2014–15 Budget
No major variations.
2014–15 Estimated Result/2013–14 Actual
No major variations.
Highlights 2014–15
• Supported the passage of legislative amendments through Parliament to provide a form of tenement for wind farm developers on pastoral leasehold land and fast-track access to pastoral land for commercial scale solar development.
• Facilitated resolution of a multiple land access issue for a major wind farm development.
• Completed administration of a funding deed for a low income housing solar project for 80 new affordable houses in regional towns in the Mid North.
• Delivered a new guide to commercial scale solar development in South Australia.
• Facilitated land access issues relating to an off-grid energy project at Coober Pedy.
• Facilitated crown sponsorship of two renewable energy projects in the state.
Targets 2015–16
• Facilitate South Australian energy projects seeking Commonwealth Government funding.
• Implement further stages of a bioenergy roadmap.
• Deliver a Low Carbon Investment Plan to support achievement of $10 billion target in low carbon generation by 2025.
State Development
98 2015–16 Agency Statements — Volume 4

Performance indicators
2015–16
Target
2014–15 Estimated
Result 2014–15
Target 2013–14
Actual
Value of capital expenditure in renewable energy (cumulative)
$6.5b $6b $6b $5.5b
Activity indicators
2015–16
Projection
2014–15 Estimated
Result 2014–15
Projection 2013–14
Actual
No. of renewable energy projects achieving financial close 2 3 2 3
State Development
2015–16 Agency Statements — Volume 4 99

Program 7: Opportunities for Small Business
Description/objective
Supports small businesses establish, grow and be sustainable by providing online self-help tools, resources and information, advice and support for business licensing, along with targeted business development training and workshops.
Supports the role of the Small Business Commissioner.
Program summary — expenses, income and FTEs(a)
2015–16 Budget
2014–15 Estimated
Result 2014–15 Budget
2013–14 Actual
$000 $000 $000 $000
Expenses Employee benefit expenses.......................................... 1 479 1 366 1 255 1 574 Supplies and services ................................................... 882 909 760 864 Depreciation and amortisation expenses ...................... — — — 4 Grants and subsidies .................................................... — — 1 279 Intra-government transfers ........................................... 1 1 — — Other expenses ............................................................ 2 1 2 3
Total expenses 2 364 2 277 2 018 2 724
Income Intra-government transfers ........................................... — — — 1 Sales of goods and services ......................................... — 1 1 2 Other income ................................................................ — 1 2 22
Total income — 2 3 25
Net cost of providing services 2 364 2 275 2 015 2 699
FTEs as at 30 June (No.) 9.1 8.0 9.0 11.7
(a) The 2014–15 Budget amounts contained in the 2015–16 Agency Statements differs from those amounts contained in the 2014–15 Agency Statements to reflect internal resource allocations for each program. The 2014–15 Budget amounts in these statements have been amended for comparative purposes.
Financial commentary
2015–16 Budget/2014–15 Estimated Result
No major variations.
2014–15 Estimated Result/2014–15 Budget
No major variations.
2014–15 Estimated Result/2013–14 Actual
No major variations.
State Development
100 2015–16 Agency Statements — Volume 4

Highlights 2014–15
• Continued to provide a comprehensive range of online business self-help tools and information, such as workbooks, checklists and online videos via the small business website.
• Delivered business capability development programs through partner organisations such as Business SA, Regional Development Australia and local councils.
• Launched the SA Micro Finance Fund to help people to translate good ideas and business models into new growth orientated businesses
• Supported small businesses in northern Adelaide through the provision of targeted services and support through the Polaris Centre.
• Continued to provide further assistance to small business through improved and refined dispute resolution services.
• Implemented family support activities in partnership with Family Business Australia, Bendigo Adelaide Bank, KPMG and the University of Adelaide.
Targets 2015–16
• Improve the business and regulatory environment for all small businesses in conjunction with industry.
• Create a business environment that encourages and supports entrepreneurship and enterprise creation in which start-ups have scope to expand rapidly and where established businesses have opportunities and capabilities to grow.
• Continue to provide relevant information, self-help tools, resources, business management training, coaching, mentoring and other targeted support.
• Facilitate opportunities for small businesses to access new global markets and capital, by:
– Supporting 50 small and medium businesses to enter new global markets
– Unlocking $50 million in bank lending to small and medium businesses
– Supporting 10 companies to access seed or early-stage capital to expand and grow.
• Continue to undertake and contribute to activities that support the implementation of the Small Business Charter.
Activity indicators
2015–16
Projection
2014–15 Estimated
Result 2014–15
Projection 2013–14
Actual
No. of firms provided with base level business information resources Data for 2014–15 and 2013–14 was not recorded due to the target being under development.
8 000 n.a. n.a. n.a.
No. of firms supported to build business capability Data for 2014–15 and 2013–14 was not recorded due to the target being under development.
700 n.a. n.a. n.a.
State Development
2015–16 Agency Statements — Volume 4 101

Program 8: Water Industry Technical and Safety Regulation
Description/objective
Enforcement, compliance and promotion of technical and safety regulation of plumbing and equipment.
Program summary — expenses, income and FTEs(a)
2015–16 Budget
2014–15 Estimated
Result 2014–15 Budget
2013–14 Actual
$000 $000 $000 $000
Expenses Employee benefit expenses.......................................... 1 503 1 562 1 570 1 382 Supplies and services ................................................... 1 103 1 007 1 012 806 Grants and subsidies .................................................... — — 2 3 Intra-government transfers ........................................... 2 3 — — Other expenses ............................................................ 4 3 3 5
Total expenses 2 612 2 575 2 587 2 196
Income Intra-government transfers ........................................... 2 512 2 467 2 467 2 436 Sales of goods and services ......................................... — 2 2 16 Other income ................................................................ 11 12 13 2
Total income 2 523 2 481 2 482 2 454
Net cost of providing services 89 94 105 -258
FTEs as at 30 June (No.) 16.8 16.9 16.9 15.0
(a) The 2014–15 Budget amounts contained in the 2015–16 Agency Statements differs from those amounts contained in the 2014–15 Agency Statements to reflect internal resource allocations for each program. The 2014–15 Budget amounts in these statements have been amended for comparative purposes.
Financial commentary
2015–16 Budget/2014–15 Estimated Result
No major variations.
2014–15 Estimated Result/2014–15 Budget
No major variations.
2014–15 Estimated Result/2013–14 Actual
The $0.4 million increase in expenses is primarily due to information technology systems projects undertaken in 2014–15 ($0.3 million).
Highlights 2014–15
• Increased presence of the Office of the Technical Regulator in metropolitan and regional areas through participation at stakeholder meetings and regular audits of onsite plumbing and equipment.
• Continued supportive and collaborative operational relationships with water regulators (Essential Services Commission of South Australia, Department for Health and Ageing, Environment Protection Authority, Department of Environment, Water and Natural Resources).
State Development
102 2015–16 Agency Statements — Volume 4

• Developed supporting documentation and resources for the regulation of water industry entities.
• Introduced amendments to AS/NZS 3500 Plumbing and Drainage Standard.
• Consulted with the plumbing, gas and electrical industry on future project for implementing electronic Certificates of Compliance forms.
• Consulted with the plumbing industry to further raise awareness of backflow devices, generating a reduction in the number of backflow devices in South Australia that were registered as not having been tested in accordance with AS/NZS 3500.
Targets 2015–16
• Approve at least 50 per cent of the safety, reliability, maintenance and technical management plans from all licensed water industry entities.
• Consolidate annual technical reporting requirements by water industry entities to satisfy all water regulators.
• Continue consultation with the water industry, including presentations to stakeholders, and involvement on water industry representative committees.
• Upload historic residential and commercial property plumbing drawings, covering pipework and fittings as constructed by plumbing contractors, onto the Department of Planning, Transport and Infrastructure’s On-line Property Location Browser (PLB). The PLB website is available for public access.
• Implement the electronic Certificate of Compliance forms for use in the plumbing, gas and electrical industries.
Activity indicators
2015–16
Projection
2014–15 Estimated
Result 2014–15
Projection 2013–14
Actual
No. of safety presentations to key stakeholders Some of the presentations provided by the Office of the Technical Regulator are in collaboration with industry training bodies as part of the training for apprentices or are as a refresher course for licensed trade personnel.
50 25 60 38
No. of proactive technical and safety audits of on-site plumbing
8 000 7 300 8 000 9 630
No. of approved safety, reliability, maintenance and technical management plans
35 n.a. n.a. n.a.
No. of proactive technical and safety audits of water industry entities operating water and sewerage infrastructure
5 n.a. n.a. n.a.
State Development
2015–16 Agency Statements — Volume 4 103
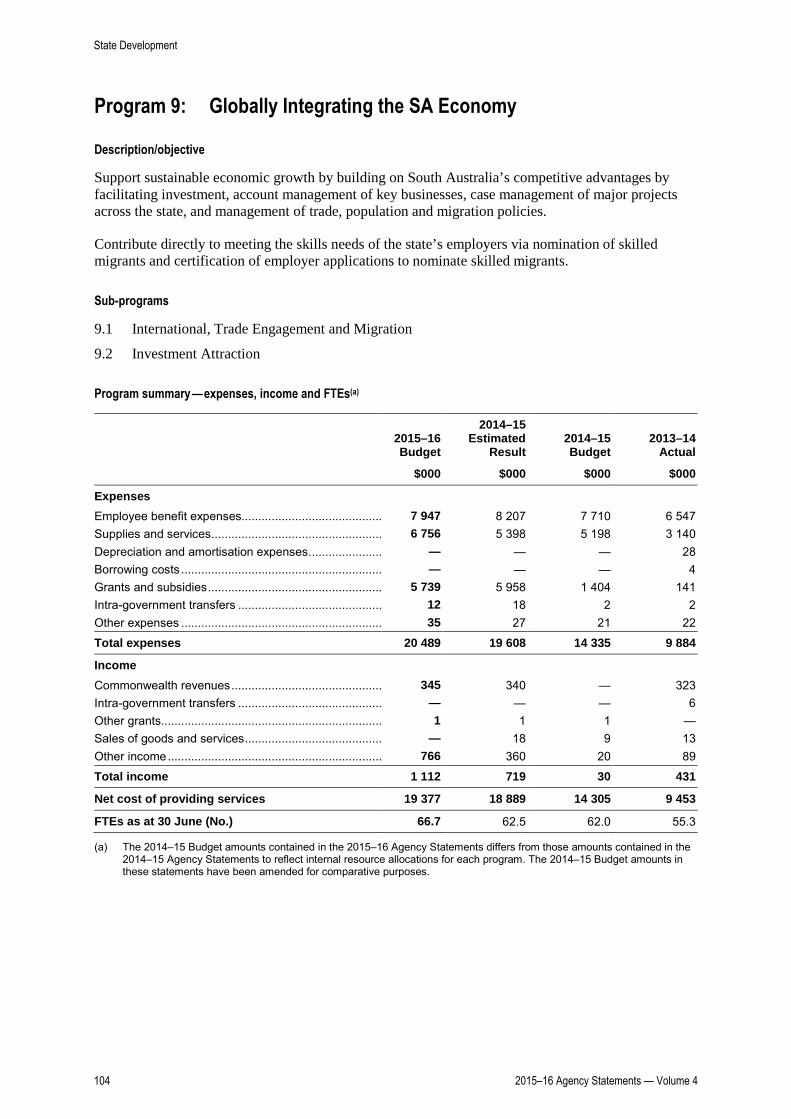
Program 9: Globally Integrating the SA Economy
Description/objective
Support sustainable economic growth by building on South Australia’s competitive advantages by facilitating investment, account management of key businesses, case management of major projects across the state, and management of trade, population and migration policies.
Contribute directly to meeting the skills needs of the state’s employers via nomination of skilled migrants and certification of employer applications to nominate skilled migrants.
Sub-programs
9.1 International, Trade Engagement and Migration
9.2 Investment Attraction
Program summary — expenses, income and FTEs(a)
2015–16 Budget
2014–15 Estimated
Result 2014–15 Budget
2013–14 Actual
$000 $000 $000 $000
Expenses Employee benefit expenses.......................................... 7 947 8 207 7 710 6 547 Supplies and services ................................................... 6 756 5 398 5 198 3 140 Depreciation and amortisation expenses ...................... — — — 28 Borrowing costs ............................................................ — — — 4 Grants and subsidies .................................................... 5 739 5 958 1 404 141 Intra-government transfers ........................................... 12 18 2 2 Other expenses ............................................................ 35 27 21 22
Total expenses 20 489 19 608 14 335 9 884
Income Commonwealth revenues ............................................. 345 340 — 323 Intra-government transfers ........................................... — — — 6 Other grants.................................................................. 1 1 1 — Sales of goods and services ......................................... — 18 9 13 Other income ................................................................ 766 360 20 89
Total income 1 112 719 30 431
Net cost of providing services 19 377 18 889 14 305 9 453
FTEs as at 30 June (No.) 66.7 62.5 62.0 55.3
(a) The 2014–15 Budget amounts contained in the 2015–16 Agency Statements differs from those amounts contained in the 2014–15 Agency Statements to reflect internal resource allocations for each program. The 2014–15 Budget amounts in these statements have been amended for comparative purposes.
State Development
104 2015–16 Agency Statements — Volume 4
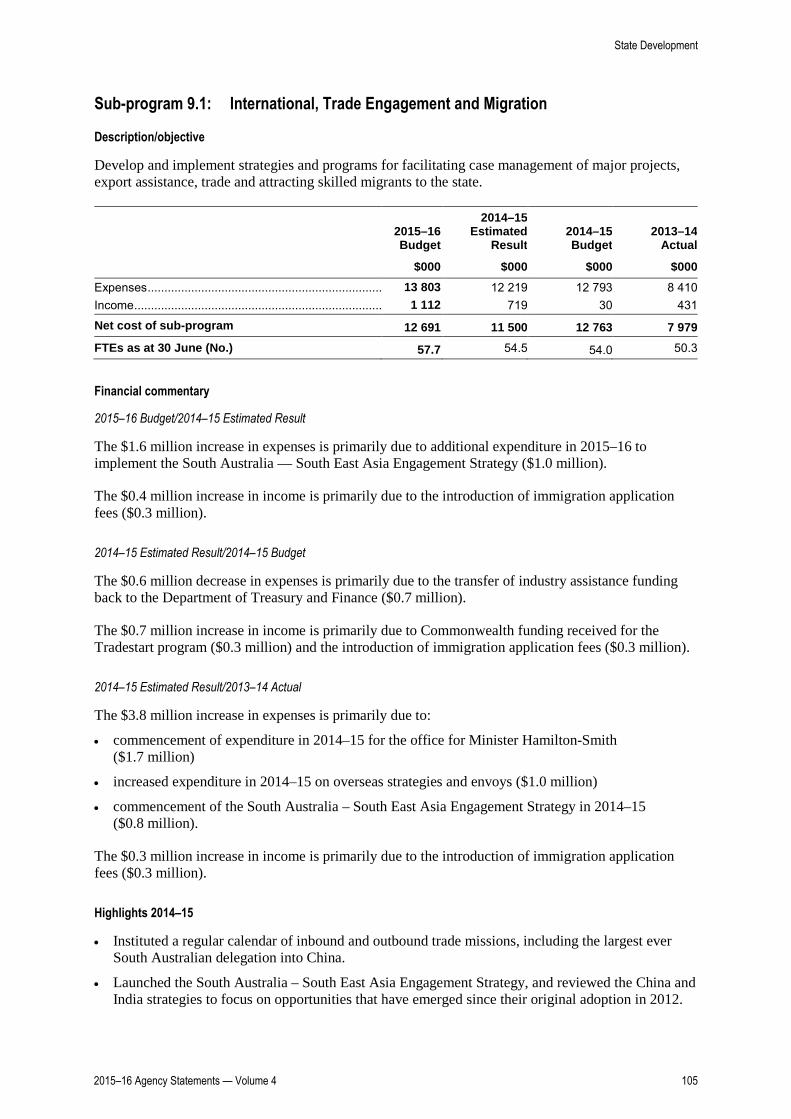
Sub-program 9.1: International, Trade Engagement and Migration
Description/objective
Develop and implement strategies and programs for facilitating case management of major projects, export assistance, trade and attracting skilled migrants to the state.
2015–16 Budget
2014–15 Estimated
Result 2014–15 Budget
2013–14 Actual
$000 $000 $000 $000 Expenses ...................................................................... 13 803 12 219 12 793 8 410 Income .......................................................................... 1 112 719 30 431
Net cost of sub-program 12 691 11 500 12 763 7 979 FTEs as at 30 June (No.) 57.7 54.5 54.0 50.3
Financial commentary
2015–16 Budget/2014–15 Estimated Result
The $1.6 million increase in expenses is primarily due to additional expenditure in 2015–16 to implement the South Australia — South East Asia Engagement Strategy ($1.0 million).
The $0.4 million increase in income is primarily due to the introduction of immigration application fees ($0.3 million).
2014–15 Estimated Result/2014–15 Budget
The $0.6 million decrease in expenses is primarily due to the transfer of industry assistance funding back to the Department of Treasury and Finance ($0.7 million).
The $0.7 million increase in income is primarily due to Commonwealth funding received for the Tradestart program ($0.3 million) and the introduction of immigration application fees ($0.3 million).
2014–15 Estimated Result/2013–14 Actual
The $3.8 million increase in expenses is primarily due to:
• commencement of expenditure in 2014–15 for the office for Minister Hamilton-Smith ($1.7 million)
• increased expenditure in 2014–15 on overseas strategies and envoys ($1.0 million)
• commencement of the South Australia – South East Asia Engagement Strategy in 2014–15 ($0.8 million).
The $0.3 million increase in income is primarily due to the introduction of immigration application fees ($0.3 million).
Highlights 2014–15
• Instituted a regular calendar of inbound and outbound trade missions, including the largest ever South Australian delegation into China.
• Launched the South Australia – South East Asia Engagement Strategy, and reviewed the China and India strategies to focus on opportunities that have emerged since their original adoption in 2012.
State Development
2015–16 Agency Statements — Volume 4 105
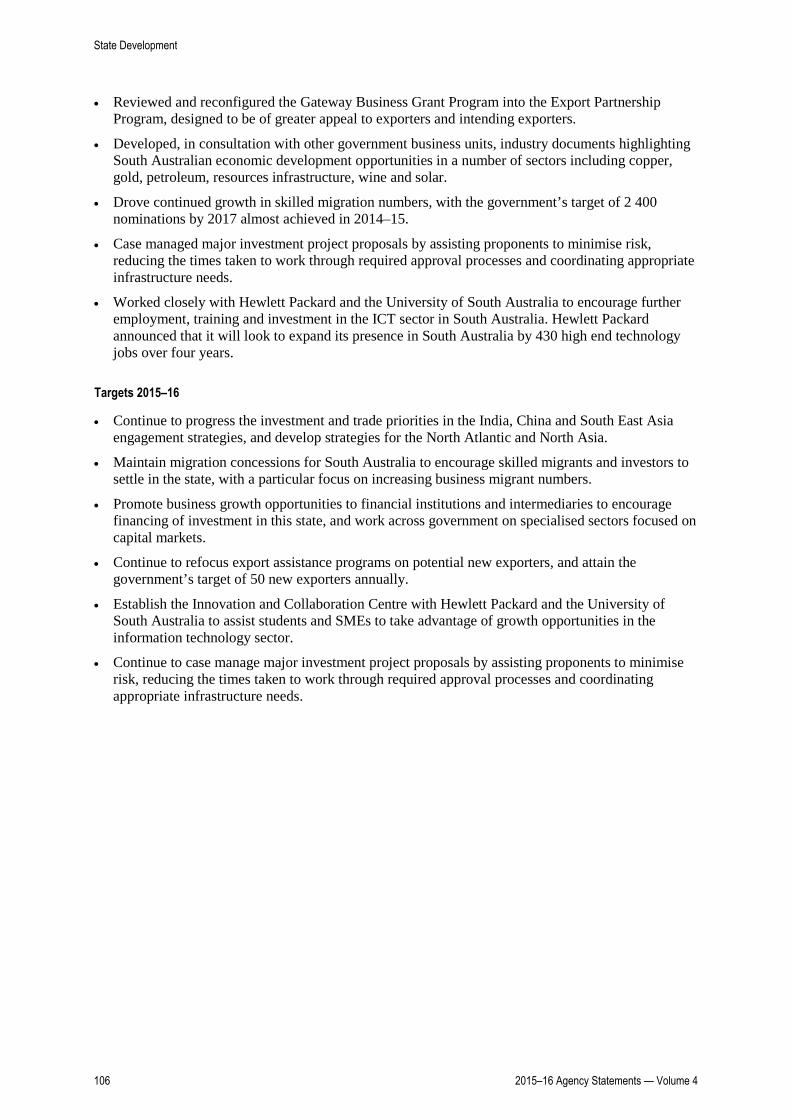
• Reviewed and reconfigured the Gateway Business Grant Program into the Export Partnership Program, designed to be of greater appeal to exporters and intending exporters.
• Developed, in consultation with other government business units, industry documents highlighting South Australian economic development opportunities in a number of sectors including copper, gold, petroleum, resources infrastructure, wine and solar.
• Drove continued growth in skilled migration numbers, with the government’s target of 2 400 nominations by 2017 almost achieved in 2014–15.
• Case managed major investment project proposals by assisting proponents to minimise risk, reducing the times taken to work through required approval processes and coordinating appropriate infrastructure needs.
• Worked closely with Hewlett Packard and the University of South Australia to encourage further employment, training and investment in the ICT sector in South Australia. Hewlett Packard announced that it will look to expand its presence in South Australia by 430 high end technology jobs over four years.
Targets 2015–16
• Continue to progress the investment and trade priorities in the India, China and South East Asia engagement strategies, and develop strategies for the North Atlantic and North Asia.
• Maintain migration concessions for South Australia to encourage skilled migrants and investors to settle in the state, with a particular focus on increasing business migrant numbers.
• Promote business growth opportunities to financial institutions and intermediaries to encourage financing of investment in this state, and work across government on specialised sectors focused on capital markets.
• Continue to refocus export assistance programs on potential new exporters, and attain the government’s target of 50 new exporters annually.
• Establish the Innovation and Collaboration Centre with Hewlett Packard and the University of South Australia to assist students and SMEs to take advantage of growth opportunities in the information technology sector.
• Continue to case manage major investment project proposals by assisting proponents to minimise risk, reducing the times taken to work through required approval processes and coordinating appropriate infrastructure needs.
State Development
106 2015–16 Agency Statements — Volume 4

Performance indicators(a)
2015–16
Target
2014–15 Estimated
Result 2014–15
Target 2013–14
Actual
Business migration (892, 893 Visa): • no. of state nominations approved 50 80 150 96 • no. of jobs created 30 70 150 55 • value of investments The 892, 893 visa outcomes relate to business migrants who have successfully met migration requirements and can now apply for permanent residency. These outcomes are verified after two years.
$25m $9.3m $80m $66m
Business migration (132, 188 Visa) • no. of jobs created (FTE) 200 328 200 391 • value of investments The 132, 188 visa results relate to investment outcomes anticipated by new business migrants nominated by the state to support their visa application to undertake business activities in South Australia. These outcomes are verified after two years.
$100m $141m $100m $133m
(a) Onshore business migrants who completed their requirements to seek permanent residency remained relatively steady in 2013–14. Investment and jobs created by business migrants receiving second stage sponsorship is expected to be lower in 2014–15 than the target. This is partially a data collection issue as only migration business assets information has been collected and not the totality of investments in the state. In 2015–16 the numbers of second stage sponsored migrants will decline as this legacy program winds down. Numbers will increase again when the first wave of new 888 applicants apply for second stage nomination in 2016–17. This will be expanded for 2015–16 data collection.
Activity indicators(a)
2015–16
Projection
2014–15 Estimated
Result 2014–15
Projection 2013–14
Actual
Regional certifying body: • No. of applications processed for ‘advice’ by the
regional certifying body (RCB) The number of applications received for RCB advice in 2014–15 was higher than the previous year; this reflected employers’ resubmitting applications that were not of sufficient quality. The number of applications and satisfied advice outcomes is expected to decrease slightly in 2015–16 due to softer labour market conditions.
450 520 600 636
State sponsorships: • No. of skilled nominations approved (489, 190 visa
subclass) The target projection was revised down from 2700 to 2400 to align with economic priority 9 targets and is estimated to be 98 per cent achieved through increased promotion and streamlined state nomination requirements. The same projection has been set for 2015–16.
2 400 2 350 2 400 2 226
• No. of business skills nominations approved — new migrants (188, 132 visa subclass) Renewed marketing efforts in China and more competitive eligibility criteria has seen an improvement in state nominated business migrant applications. While fewer Significant Investor applications are expected due to changes in the qualifying investment criteria, increased applications are expected overall in 2015–16 as the Federal Immigration Department will relax some business visa criteria from 1 July 2015.
200 165 150 130
(a) General factors that affect the demand for state nomination and South Australian employer nomination advice by the RCB are job opportunities, global and national competition for skilled migrants, restrictedness of visa eligibility criteria imposed by the Government of South Australia or Commonwealth Government Department of Immigration and Border Protection (DIBP) and global economic conditions.
State Development
2015–16 Agency Statements — Volume 4 107

Sub-program 9.2: Investment Attraction
Description/objective
Lead and coordinate cross–government investment attraction activity and seek and establish investment across major industry sectors.
Attract new investors and businesses to South Australia, and identify business development opportunities for the state.
2015–16 Budget
2014–15 Estimated
Result 2014–15 Budget
2013–14 Actual
$000 $000 $000 $000 Expenses ...................................................................... 6 686 7 389 1 542 1 474 Income .......................................................................... — — — —
Net cost of sub-program 6 686 7 389 1 542 1 474 FTEs as at 30 June (No.) 9.0 8.0 8.0 5.0
Financial commentary
2015–16 Budget/2014–15 Estimated Result
The $0.7 million decrease in expenses is primarily due to:
• once-off expenditure in 2014–15 for the Hewlett-Packard Innovation and Collaboration Centre ($5.5 million)
partially offset by
• the commencement of expenditure in 2015–16 for the Industry Attraction Fund ($5.0 million).
2014–15 Estimated Result/2014–15 Budget
The $5.8 million increase in expenses is primarily due to once-off expenditure in 2014-15 for the Hewlett-Packard Innovation and Collaboration Centre ($5.5 million).
2014–15 Estimated Result/2013–14 Actual
The $5.9 million increase in expenses is primarily due to once-off expenditure for the Hewlett-Packard Innovation and Collaboration Centre carried over from 2013–14 to 2014–15 ($5.5 million).
Targets 2015–16
• Establish a new stand-alone Investment Attraction Agency with a priority on attracting foreign direct investment, supported by the Department of State Development.
• Create new jobs through investment in targeted industries.
• Develop and market suitable projects for investment.
• Proactively identify and attract new investors to the state.
• Facilitate reinvestment from firms with an existing presence in the state.
State Development
108 2015–16 Agency Statements — Volume 4

Program 10: Industry and Innovation
Description/objective
Assist with the transformation of the state’s economy to utilise advanced technologies with innovative business and revenue models to build globally competitive high-value firms and activities.
Through targeted programs such as Manufacturing Works and Our Jobs Plan, support the state’s manufacturing and small business sectors to increase and build their capacity and capability to innovate, develop new products, and enter and compete in new markets.
Sub-programs
10.1 Manufacturing and Innovation
10.2 Automotive Transformation
Program summary — expenses, income and FTEs(a)
2015–16 Budget
2014–15 Estimated
Result 2014–15 Budget
2013–14 Actual
$000 $000 $000 $000
Expenses Employee benefit expenses.......................................... 6 443 7 099 7 640 9 854 Supplies and services ................................................... 11 227 6 950 7 979 5 991 Depreciation and amortisation expenses ...................... — — — 77 Grants and subsidies .................................................... 19 484 10 089 10 852 7 748 Intra-government transfers ........................................... 27 25 3 3 336 Other expenses ............................................................ 58 33 34 61
Total expenses 37 239 24 196 26 508 27 067
Income Commonwealth revenues ............................................. — 264 61 313 Intra-government transfers ........................................... — 100 100 144 Other grants.................................................................. 2 1 1 — Other income ................................................................ 20 57 50 576
Total income 22 422 212 1 033
Net cost of providing services 37 217 23 774 26 296 26 034
FTEs as at 30 June (No.) 67.8 63.6 64.5 72.0
(a) The 2014–15 Budget amounts contained in the 2015–16 Agency Statements differs from those amounts contained in the 2014–15 Agency Statements to reflect internal resource allocations for each program. The 2014–15 Budget amounts in these statements have been amended for comparative purposes.
State Development
2015–16 Agency Statements — Volume 4 109

Sub-program 10.1: Manufacturing and Innovation
Description/objective
Assist development and improve the efficiency and international competitiveness of South Australian manufacturers, by driving and encouraging research and development, investment in innovation and capability development.
The objectives of the sub-program are to:
• improve collaboration between industry and research and connect firms to knowledge providers, industry trends, current and emerging technologies and collaboration networks
• maximise local industry participation in major private sector projects
• lead the delivery of strategic land development projects with economic development objectives as a priority, including the Tonsley Redevelopment project
• provide a first point of contact for South Australian manufacturing firms to access advice, information and resources to build their knowledge and capability in relation to research links; innovation, competitiveness and productivity improvement strategies; participation in supply chains, and current and emerging manufacturing technologies, systems and processes
• reinforce the competitive strengths of the South Australian economy by developing and leading the implementation of manufacturing policies and programs across all industry sectors
• build local industry capability and capacity to supply major mining, resources and infrastructure projects
• facilitate higher levels of innovation across industry and government to improve competitiveness and performance of business and key sectors.
2015–16 Budget
2014–15 Estimated
Result 2014–15 Budget
2013–14 Actual
$000 $000 $000 $000 Expenses ...................................................................... 19 606 15 409 16 039 23 131 Income .......................................................................... 17 405 195 1 022
Net cost of sub-program 19 589 15 004 15 844 22 109 FTEs as at 30 June (No.) 50.1 45.3 46.1 54.9
Financial commentary
2015–16 Budget/2014–15 Estimated Result
The $4.2 million increase in expenses is primarily due to:
• an increase in expenditure on the Our Jobs Plan program in 2015–16 ($4.7 million)
• changes in overhead allocations between financial years which are allocated across programs ($0.6 million)
• increased grant expenditure for Hills Limited in 2015–16 ($0.5 million)
partially offset by:
• reduced expenditure for Manufacturing Works ($1.3 million)
State Development
110 2015–16 Agency Statements — Volume 4

2014–15 Estimated Result/2014–15 Budget
The $0.6 million decrease in expenses is primarily due to the transfer the former Advanced Manufacturing Council budget to the Office of the Economic Development Board program ($0.7 million).
2014–15 Estimated Result/2013–14 Actual
The $7.7 million decrease in expenses is primarily due to:
• once-off expenditure during 2013–14 relating to the sale of Renewal SA property at Felixstow ($2.8 million)
• savings initiatives in general operations ($2.5 million)
• reduced expenditure for Manufacturing Works ($1.3 million)
• changes in overhead allocations between financial years which are allocated across programs ($0.9 million)
• cessation of the South East Fund in 2013–14 ($0.9 million)
• the transfer of the former Advanced Manufacturing Council budget to the Office of the Economic Development Board ($0.7 million)
• the transfer of expenditure to the Industry Participation Advocate ($0.5 million)
• reduced grant expenditure for Hills Limited in 2014–15 ($0.5 million)
partially offset by
• increased expenditure on the Our Jobs Plan program in 2014–15 ($3.6 million).
Highlights 2014–15
• Facilitated continuing economic development programs aimed at developing globally competitive supply chains for the minerals and energy sector.
• Delivered Manufacturing Works programs and initiatives including the acceleration activities in accordance with Our Jobs Plan.
• Developed an on-shore oil and gas training facility and a remote operations centre infrastructure as part of the Mining and Petroleum Services Centre of Excellence and facilitated business delegations to the United States of America and Sweden.
• Delivered the Innovation for Growth pilot program to support and accelerate the growth strategies of South Australian manufacturing firms.
• Continued to lead the Tonsley Redevelopment:
– Hills Industries began operating their innovation centres in January 2015.
– Flinders University opened the new facility in January 2015, incorporating the School of Computer Science, Engineering and Mathematics and other Flinders University business units
– Siemens million turbo-machinery workshop opened in May 2015
– CoHAB co-working space opened in April 2015 providing affordable, flexible business accommodation.
• Led the development of the Northern Economic Plan in partnership with local government, industry and the community.
State Development
2015–16 Agency Statements — Volume 4 111

Targets 2015–16
• Implement the PACE Supply Chain development program specifically focussed on sales, marketing and export readiness for minerals and energy suppliers.
• Continue to lead the Tonsley Redevelopment.
• Continue to deliver Our Jobs Plan programs, accelerating manufacturing initiatives to assist firms in responding to the economic conditions that threaten to erode manufacturing and are consistent with the state government’s strategic priority to grow advanced manufacturing.
• Coordinate the delivery of the Northern Economic Plan.
• Continue to build South Australia’s industry capability to innovate through supporting cluster development, entrepreneurship and commercialisations.
Performance indicators
2015–16
Target
2014–15 Estimated
Result 2014–15
Target 2013–14
Actual
Applied Research Engagement Programs — Participating Companies
19 35 33 28
Projects that are accepted into the programs must be technically feasible, have clear commercial potential and provide economic benefits to South Australia.
Applied Research Engagement Programs — Awareness Events and Industry Tours of Research Facilities
4 10 13 11
Business Transformation This program commenced in 2014–15.
24 39 30 n.a.
Centre of Excellence projects This program commenced in 2014–15.
5 10 10 n.a.
ICN Resource projects This program commenced in 2014–15.
$50 million $56 million $50 million n.a.
Sub-program 10.2: Automotive Transformation
Description/objective
Support companies operating within the automotive supply chain to successfully diversify and secure alternate revenue streams to drive sustainable growth, long-term employment and potential for export revenues.
The objectives of this sub-program are to:
• retain and build on key manufacturing capabilities and skills in automotive supply firms, by assisting companies to apply their capabilities and develop new capabilities in alternate industry sectors
• increase the competiveness and profitability of firms that operate within the automotive supply chain, by providing assistance for the development and implementation of diversification strategies
• upskill management and the workforce to effectively apply new and existing capabilities to new opportunities, by providing access to relevant skills and employment programs
• identify and assess options for the alternative use of the GM Holden Ltd’s site at Elizabeth in consultation with GM Holden.
State Development
112 2015–16 Agency Statements — Volume 4
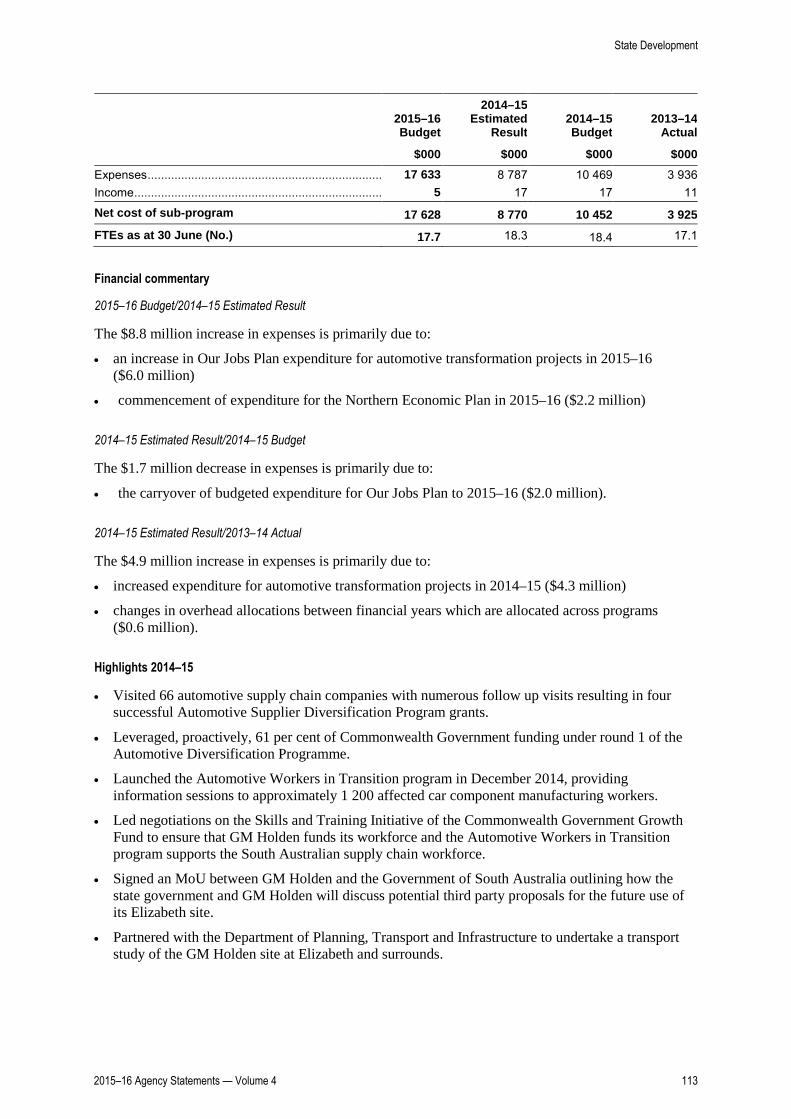
2015–16 Budget
2014–15 Estimated
Result 2014–15 Budget
2013–14 Actual
$000 $000 $000 $000 Expenses ...................................................................... 17 633 8 787 10 469 3 936 Income .......................................................................... 5 17 17 11
Net cost of sub-program 17 628 8 770 10 452 3 925 FTEs as at 30 June (No.) 17.7 18.3 18.4 17.1
Financial commentary
2015–16 Budget/2014–15 Estimated Result
The $8.8 million increase in expenses is primarily due to:
• an increase in Our Jobs Plan expenditure for automotive transformation projects in 2015–16 ($6.0 million)
• commencement of expenditure for the Northern Economic Plan in 2015–16 ($2.2 million)
2014–15 Estimated Result/2014–15 Budget
The $1.7 million decrease in expenses is primarily due to:
• the carryover of budgeted expenditure for Our Jobs Plan to 2015–16 ($2.0 million).
2014–15 Estimated Result/2013–14 Actual
The $4.9 million increase in expenses is primarily due to:
• increased expenditure for automotive transformation projects in 2014–15 ($4.3 million)
• changes in overhead allocations between financial years which are allocated across programs ($0.6 million).
Highlights 2014–15
• Visited 66 automotive supply chain companies with numerous follow up visits resulting in four successful Automotive Supplier Diversification Program grants.
• Leveraged, proactively, 61 per cent of Commonwealth Government funding under round 1 of the Automotive Diversification Programme.
• Launched the Automotive Workers in Transition program in December 2014, providing information sessions to approximately 1 200 affected car component manufacturing workers.
• Led negotiations on the Skills and Training Initiative of the Commonwealth Government Growth Fund to ensure that GM Holden funds its workforce and the Automotive Workers in Transition program supports the South Australian supply chain workforce.
• Signed an MoU between GM Holden and the Government of South Australia outlining how the state government and GM Holden will discuss potential third party proposals for the future use of its Elizabeth site.
• Partnered with the Department of Planning, Transport and Infrastructure to undertake a transport study of the GM Holden site at Elizabeth and surrounds.
State Development
2015–16 Agency Statements — Volume 4 113

Targets 2015–16
• Revisit all eligible Tier 1 and 2 automotive supply chain manufacturers and facilitate access to potential alternative market opportunities.
• Maximise opportunities for the supply chain companies to relevant state and Commonwealth Government programs.
• Revisit and inform all eligible Tier 1, 2 and 3 companies and their workforce regarding the state government response for workers.
• Ensure all automotive workers receive information on the state government support package and the opportunity that it presents.
• Maintain dialogue with GM Holden and develop a comprehensive profile on the infrastructure and strategic value of the Elizabeth site.
• Develop a profile of other automotive supply chain sites that may potentially become available including an opportunity register.
Performance indicators
2015–16
Target
2014–15 Estimated
Result 2014–15
Target 2013–14
Actual
No. of visits to eligible Tier 1 and 2 automotive supply chain manufacturers New indicator.
100 n.a. n.a. n.a.
No. of diversification program grants New indicator.
10 n.a. n.a. n.a.
No. of Automotive Sector Supplier Forums held New indicator.
3 n.a. n.a. n.a.
No. of service provider contracts in place to support workers in Transition New indicator.
16 n.a. n.a. n.a.
No. of formal meetings held with GM Holden about their Elizabeth site New indicator.
8 n.a. n.a. n.a.
State Development
114 2015–16 Agency Statements — Volume 4
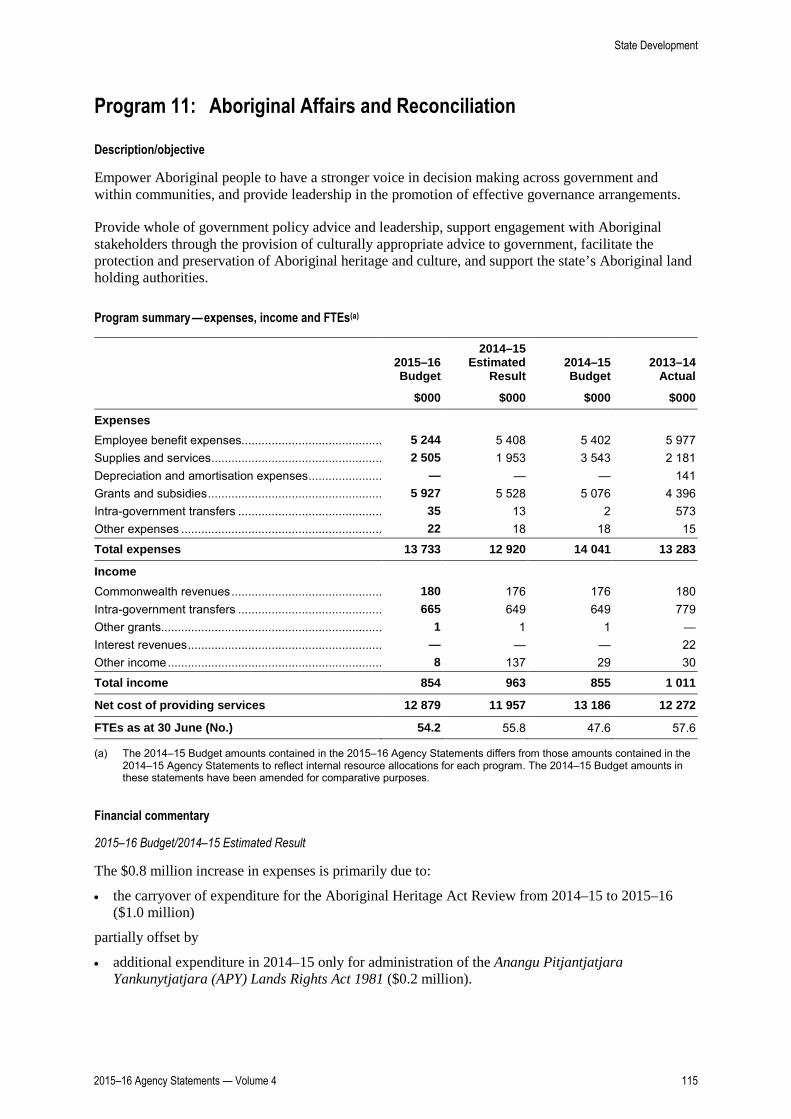
Program 11: Aboriginal Affairs and Reconciliation
Description/objective
Empower Aboriginal people to have a stronger voice in decision making across government and within communities, and provide leadership in the promotion of effective governance arrangements.
Provide whole of government policy advice and leadership, support engagement with Aboriginal stakeholders through the provision of culturally appropriate advice to government, facilitate the protection and preservation of Aboriginal heritage and culture, and support the state’s Aboriginal land holding authorities.
Program summary — expenses, income and FTEs(a)
2015–16 Budget
2014–15 Estimated
Result 2014–15 Budget
2013–14 Actual
$000 $000 $000 $000
Expenses Employee benefit expenses.......................................... 5 244 5 408 5 402 5 977 Supplies and services ................................................... 2 505 1 953 3 543 2 181 Depreciation and amortisation expenses ...................... — — — 141 Grants and subsidies .................................................... 5 927 5 528 5 076 4 396 Intra-government transfers ........................................... 35 13 2 573 Other expenses ............................................................ 22 18 18 15
Total expenses 13 733 12 920 14 041 13 283
Income Commonwealth revenues ............................................. 180 176 176 180 Intra-government transfers ........................................... 665 649 649 779 Other grants.................................................................. 1 1 1 — Interest revenues .......................................................... — — — 22 Other income ................................................................ 8 137 29 30
Total income 854 963 855 1 011
Net cost of providing services 12 879 11 957 13 186 12 272
FTEs as at 30 June (No.) 54.2 55.8 47.6 57.6
(a) The 2014–15 Budget amounts contained in the 2015–16 Agency Statements differs from those amounts contained in the 2014–15 Agency Statements to reflect internal resource allocations for each program. The 2014–15 Budget amounts in these statements have been amended for comparative purposes.
Financial commentary
2015–16 Budget/2014–15 Estimated Result
The $0.8 million increase in expenses is primarily due to:
• the carryover of expenditure for the Aboriginal Heritage Act Review from 2014–15 to 2015–16 ($1.0 million)
partially offset by
• additional expenditure in 2014–15 only for administration of the Anangu Pitjantjatjara Yankunytjatjara (APY) Lands Rights Act 1981 ($0.2 million).
State Development
2015–16 Agency Statements — Volume 4 115

2014–15 Estimated Result/2014–15 Budget
The $1.1 million decrease in expenses is primarily due to the transfer of the APY landfills project to the Department of Planning, Transport and Infrastructure in October 2014 ($1.0 million).
2014–15 Estimated Result/2013–14 Actual
No major variations.
Highlights 2014–15
• Commenced and implemented the Aboriginal Lands Trust Act 2014.
• Engaged Jawun to commence operations in South Australia to broker partnerships between corporate South Australia and Aboriginal communities, and reached agreement to develop a public sector secondment program.
• Developed the Aboriginal Regional Authority policy with Aboriginal communities through a design process involving four trial sites and extensive statewide consultation attended by over 350 participants.
• Engaged Flinders University to develop and deliver a Nations Rebuilding Curriculum to senior level public servants and Aboriginal groups.
• Reviewed Division 1B of the Maralinga Tjarutja Land Rights Act 1984.
Targets 2015–16
• Implement the Aboriginal Regional Authority policy, including recognition of at least one Aboriginal Regional Authority.
• Deliver the Nations Rebuilding Curriculum to at least one Aboriginal group and one group of senior public servants.
• Develop a public business register for South Australian Aboriginal businesses which will create a forum to connect government and non-government procurers with Aboriginal businesses.
• Implement legislative changes to the Anangu Pitjantjatjara Yankunytjatjara Land Rights Act 1981 in response to the review of the Act undertaken in 2013–14.
• Develop a new statewide Aboriginal economic participation strategy for consultation to deliver increased opportunities for economic participation and improved economic outcomes for Aboriginal South Australians.
Performance indicators
2015–16
Target
2014–15 Estimated
Result 2014–15
Target 2013–14
Actual
No. of regional authorities recognised under the new policy New indicator.
1 n.a. n.a. n.a.
Secondment of senior public servants to Jawun partner organisations for between four to six weeks New indicator.
2 n.a. n.a. n.a.
No. of Aboriginal Nations Rebuilding programs delivered New indicator.
2 1 n.a. n.a.
State Development
116 2015–16 Agency Statements — Volume 4

Activity indicators
2015–16
Projection
2014–15 Estimated
Result 2014–15
Projection 2013–14
Actual
No. of local councils that participate in heritage legislation awareness workshops New indicator.
5 4 n.a. n.a.
State Development
2015–16 Agency Statements — Volume 4 117

Department of State Development
Statement of comprehensive income______________________________________________________________________________________________________________________________________________________________________________________________________________
2015–16Budget
$000
2014–15Estimated
Result
$000
2014–15Budget
$000
2013–14Actual
$000
Expenses
Employee benefit expenses Salaries, wages, annual and sick leave .........................................................................................................................................................................253 560 268 363 257 191 44 849 Long service leave .........................................................................................................................................................................8 527 9 888 9 234 1 951 Payroll tax .........................................................................................................................................................................13 439 15 329 14 599 2 638 Superannuation .........................................................................................................................................................................28 569 29 027 30 920 4 782 Other .........................................................................................................................................................................7 070 13 607 4 616 4 338Supplies and services General supplies and services ................................................................................................................................................................................241 502 255 972 240 669 44 634 Consultancy expenses ................................................................................................................................................................................7 227 6 874 2 881 5 864Depreciation and amortisation expenses .........................................................................................................................................................................36 354 36 231 37 073 2 059Borrowing costs .........................................................................................................................................................................— — 2 16Grants and subsidies .........................................................................................................................................................................107 169 102 254 95 040 20 406Intra-government transfers .........................................................................................................................................................................121 166 117 584 110 540 4 441Other expenses .........................................................................................................................................................................4 453 4 183 4 182 1 787
Total expenses 829 036 859 312 806 947 137 765
Income
Commonwealth revenues ................................................................................................................................................................................40 450 45 327 42 837 1 425Intra-government transfers ................................................................................................................................................................................12 734 14 038 12 450 9 627Other grants ................................................................................................................................................................................2 522 2 874 2 362 — Fees, fines and penalties ................................................................................................................................................................................22 694 21 841 20 557 21 585Sales of goods and services ................................................................................................................................................................................105 125 97 776 101 000 4 869Interest revenues ................................................................................................................................................................................— 19 — 6Net gain or loss from disposal of assets ................................................................................................................................................................................-46 -2 410 — -12Resources received free of charge ................................................................................................................................................................................— 300 — — Other income ................................................................................................................................................................................8 438 8 997 6 890 3 703
Total income 191 917 188 762 186 096 41 203
Net cost of providing services 637 119 670 550 620 851 96 562
Income from/expenses to state government
Income Appropriation ................................................................................................................................................................................649 586 670 395 634 035 92 031 Other income ................................................................................................................................................................................— 16 033 — 4 033Expenses Cash alignment ................................................................................................................................................................................— 6 379 — 1 109 Payments to Consolidated Account (a)................................................................................................................................................................................2 101 8 504 3 000 —
Net income from/expenses to state government 647 485 671 545 631 035 94 955
Net result 10 366 995 10 184 -1 607
Other comprehensive income
Changes in property, plant and equipment assetrevaluation surplus ................................................................................................................................................................................— — — 1 680
Total comprehensive result 10 366 995 10 184 73
(a) This line was not reported in the statement of comprehensive income in the 2014-15 Budget.
State Development
118 2015–16 Agency Statements — Volume 4

Department of State Development
Statement of financial position________________________________________________________________________________________________________________________________________________________________________________________________________________
2015–16Budget
$000
2014–15Estimated
Result
$000
2014–15Budget
$000
2013–14Actual
$000
Assets
Current assets
Cash and cash equivalents .......................................................................................................................................159 410 146 467 208 261 22 493Receivables .......................................................................................................................................73 281 73 356 103 300 4 701Inventories .......................................................................................................................................742 742 932 — Other current assets .......................................................................................................................................2 989 2 577 1 428 281Non-current assets held for sale .......................................................................................................................................48 590 48 590 9 570 7 500
Total current assets 285 012 271 732 323 491 34 975
Non current assets
Financial assets .......................................................................................................................................6 103 6 103 5 940 — Land and improvements .......................................................................................................................................950 707 934 837 1 007 410 12 646Plant and equipment .......................................................................................................................................41 208 37 589 29 104 11 631Heritage assets .......................................................................................................................................4 996 5 116 5 033 104Intangible assets .......................................................................................................................................28 770 25 884 22 999 707
Total non-current assets 1 031 784 1 009 529 1 070 486 25 088
Total assets 1 316 796 1 281 261 1 393 977 60 063
Liabilities
Current liabilities
Payables .................................................................................................................................................................................102 059 101 076 141 182 13 177Employee benefits Salaries and wages .................................................................................................................................................................................270 9 278 10 325 183 Annual leave .................................................................................................................................................................................14 185 13 876 13 800 3 960 Long service leave .................................................................................................................................................................................7 112 6 767 12 734 2 711 Other .................................................................................................................................................................................5 800 5 722 6 845 61Short-term provisions .................................................................................................................................................................................2 343 2 268 2 121 134Other current liabilities .................................................................................................................................................................................12 010 12 010 14 305 7 171
Total current liabilities 143 779 150 997 201 312 27 397
Non current liabilities
Long-term employee benefits Long service leave ................................................................................................................................................................................75 350 67 759 78 598 9 222 Other ................................................................................................................................................................................188 188 1 209Long-term provisions ................................................................................................................................................................................9 016 8 714 8 362 466Other non-current liabilities ................................................................................................................................................................................578 818 817 1 058
Total non-current liabilities 85 132 77 479 87 778 10 955
Total liabilities 228 911 228 476 289 090 38 352
Net assets 1 087 885 1 052 785 1 104 887 21 711
Equity
Contributed capital .......................................................................................................................................253 692 228 958 249 410 — Retained earnings .......................................................................................................................................466 380 456 014 469 534 16 152Asset revaluation reserve .......................................................................................................................................364 314 364 314 382 607 5 559Other reserves .......................................................................................................................................3 499 3 499 3 336 —
Total equity 1 087 885 1 052 785 1 104 887 21 711
Balances as at 30 June end of period.
State Development
2015–16 Agency Statements — Volume 4 119

Department of State Development
Statement of cash flows________________________________________________________________________________________________________________________________________________________________________________________________________________
2015–16Budget
$000
2014–15Estimated
Result
$000
2014–15Budget
$000
2013–14Actual
$000
Operating activities
Cash outflows
Employee benefit payments ..............................................................................................................................................................................311 369 325 433 304 743 58 121Payments for supplies and services ..............................................................................................................................................................................248 896 263 013 243 717 57 182Interest paid ..............................................................................................................................................................................— — 2 16Grants and subsidies ..............................................................................................................................................................................107 169 102 254 95 040 20 552GST paid ..............................................................................................................................................................................— — — 704Intra-government transfers ..............................................................................................................................................................................121 166 117 584 110 540 3 941Other payments ..............................................................................................................................................................................3 964 3 664 3 696 780
Cash used in operations 792 564 811 948 757 738 141 296
Cash inflows
Intra-government transfers ..........................................................................................................................................................................12 734 14 038 12 450 9 627Commonwealth receipts ..........................................................................................................................................................................40 450 45 327 42 837 1 569Other grants ..........................................................................................................................................................................2 522 2 874 2 362 — Fees, fines and penalties ..........................................................................................................................................................................22 694 21 841 20 557 20 652Sales of goods and services ..........................................................................................................................................................................105 191 97 842 101 066 4 922Interest received ..........................................................................................................................................................................— 19 — 8Dividends received ..........................................................................................................................................................................600 600 600 — GST received ..........................................................................................................................................................................— — — 6 476Other receipts ..........................................................................................................................................................................7 752 8 281 6 207 5 980
Cash generated from operations 191 943 190 822 186 079 49 234
State government
Appropriation ..............................................................................................................................................................................649 586 670 395 634 035 92 031Other receipts ..............................................................................................................................................................................— 16 033 — 4 033Payments Cash alignment ..............................................................................................................................................................................— 6 379 — 1 109 Other ..............................................................................................................................................................................2 101 8 504 3 000 —
Net cash provided by state government 647 485 671 545 631 035 94 955
Net cash provided by (+)/used in (-) operating activities 46 864 50 419 59 376 2 893
Investing activities
Cash outflows
Purchase of property, plant and equipment .......................................................................................................................................59 525 48 813 41 719 1 787Purchase of intangibles .......................................................................................................................................6 806 3 842 2 000 — Advances paid .......................................................................................................................................— 7 000 7 000 —
Cash used in investing activities 66 331 59 655 50 719 1 787
Cash inflows
Proceeds from sale of property, plant and equipment .......................................................................................................................................7 676 16 195 12 050 6Repayment of advances .......................................................................................................................................— — — 2
Cash generated from investing activities 7 676 16 195 12 050 8
Net cash provided by (+)/used in (-) investing activities -58 655 -43 460 -38 669 -1 779
State Development
120 2015–16 Agency Statements — Volume 4

Department of State Development
Statement of cash flows________________________________________________________________________________________________________________________________________________________________________________________________________________
2015–16Budget
$000
2014–15Estimated
Result
$000
2014–15Budget
$000
2013–14Actual
$000
Financing activities
Cash inflows
Capital contributions from state government .............................................................................................................................................................................24 734 10 263 10 263 — Proceeds from restructuring activities .............................................................................................................................................................................— 106 752 160 866 —
Cash generated from financing activities 24 734 117 015 171 129 —
Net cash provided by (+)/used in (-) financing activities 24 734 117 015 171 129 —
Net increase (+)/decrease (-) in cash equivalents 12 943 123 974 191 836 1 114
Cash and cash equivalents at the start of the period 146 467 22 493 16 425 21 379
Cash and cash equivalents at the end of the period 159 410 146 467 208 261 22 493
Non cash transactions
Assets received (+) / donated (-) free of charge ...............................................................................................................................................................................— 300 — —
State Development
2015–16 Agency Statements — Volume 4 121

Administered items for the Department of State Development
Statement of comprehensive income______________________________________________________________________________________________________________________________________________________________________________________________________________
2015–16Budget
$000
2014–15Estimated
Result
$000
2014–15Budget
$000
2013–14Actual
$000
Expenses
Employee benefit expenses Salaries, wages, annual and sick leave .........................................................................................................................................................................916 894 892 319Supplies and services General supplies and services ................................................................................................................................................................................94 1 048 92 35Grants and subsidies .........................................................................................................................................................................373 300 364 — Intra-government transfers .........................................................................................................................................................................7 162 8 665 7 209 1 422Other expenses .........................................................................................................................................................................295 518 259 094 330 293 301 491
Total expenses 304 063 270 001 338 850 303 267
Income
Sales of goods and services ................................................................................................................................................................................— — — 17Interest revenues ................................................................................................................................................................................— 781 — — Other income ................................................................................................................................................................................295 518 259 094 330 293 301 418
Total income 295 518 259 875 330 293 301 435
Income from/expenses to state government
Income Appropriation ................................................................................................................................................................................8 545 8 749 8 557 1 711 Other income ................................................................................................................................................................................— 5 — 2
Net income from/expenses to state government 8 545 8 754 8 557 1 713
Total comprehensive result — -1 372 — -119
State Development
122 2015–16 Agency Statements — Volume 4

Administered items for the Department of State Development
Statement of financial position________________________________________________________________________________________________________________________________________________________________________________________________________________
2015–16Budget
$000
2014–15Estimated
Result
$000
2014–15Budget
$000
2013–14Actual
$000
Assets
Current assets
Cash and cash equivalents .......................................................................................................................................18 549 18 549 42 17 768Receivables .......................................................................................................................................1 565 1 565 23 217 1 493
Total current assets 20 114 20 114 23 259 19 261
Non current assets
Land and improvements .......................................................................................................................................418 418 — —
Total non-current assets 418 418 — —
Total assets 20 532 20 532 23 259 19 261
Liabilities
Current liabilities
Payables .................................................................................................................................................................................19 060 19 060 22 972 19 060Other current liabilities .................................................................................................................................................................................33 33 — 33
Total current liabilities 19 093 19 093 22 972 19 093
Total liabilities 19 093 19 093 22 972 19 093
Net assets 1 439 1 439 287 168
Equity
Retained earnings .......................................................................................................................................1 439 1 439 287 168
Total equity 1 439 1 439 287 168
Balances as at 30 June end of period.
State Development
2015–16 Agency Statements — Volume 4 123

Administered items for the Department of State Development
Statement of cash flows________________________________________________________________________________________________________________________________________________________________________________________________________________
2015–16Budget
$000
2014–15Estimated
Result
$000
2014–15Budget
$000
2013–14Actual
$000
Operating activities
Cash outflows
Employee benefit payments ..............................................................................................................................................................................916 894 892 319Payments for supplies and services ..............................................................................................................................................................................94 1 048 92 — Grants and subsidies ..............................................................................................................................................................................373 300 364 — Intra-government transfers ..............................................................................................................................................................................7 162 8 665 7 209 1 422Other payments ..............................................................................................................................................................................295 518 259 094 330 293 305 340
Cash used in operations 304 063 270 001 338 850 307 081
Cash inflows
Sales of goods and services ..........................................................................................................................................................................— — — 13Interest received ..........................................................................................................................................................................— 781 — — Other receipts ..........................................................................................................................................................................295 518 259 094 330 293 323 081
Cash generated from operations 295 518 259 875 330 293 323 094
State government
Appropriation ..............................................................................................................................................................................8 545 8 749 8 557 1 711Other receipts ..............................................................................................................................................................................— 5 — 2
Net cash provided by state government 8 545 8 754 8 557 1 713
Net cash provided by (+)/used in (-) operating activities — -1 372 — 17 726
Investing activities
Cash outflows
Purchase of property, plant and equipment .......................................................................................................................................— 418 — —
Cash used in investing activities — 418 — —
Net cash provided by (+)/used in (-) investing activities — -418 — —
Financing activities
Cash inflows
Proceeds from restructuring activities .............................................................................................................................................................................— 2 571 — —
Cash generated from financing activities — 2 571 — —
Net cash provided by (+)/used in (-) financing activities — 2 571 — —
Net increase (+)/decrease (-) in cash equivalents — 781 — 17 726
Cash and cash equivalents at the start of the period 18 549 17 768 42 42
Cash and cash equivalents at the end of the period 18 549 18 549 42 17 768
State Development
124 2015–16 Agency Statements — Volume 4

Summary of major variations
The following commentary relates to variations between the 2015–16 Budget and the 2014–15 Estimated Result.
Statement of comprehensive income — controlled
Expenses
The $30.3 million decrease in expenses is primarily due to:
• additional expenditure in 2014–15 to meet the demand for vocational education training ($20.0 million) and support the operations of TAFE SA ($7.0 million)
• increased efficiency and greater targeting of training across the vocational education and training sector ($11.6 million)
• efficiency savings across the department ($10.0 million)
• once-off expenditure in 2014–15 for the Hewlett-Packard Innovation and Collaboration Centre ($5.5 million)
• a fuel cost adjustment for the Remote Areas Energy Supplies (RAES) scheme in 2014–15 ($3.2 million)
• targeted voluntary separation packages provided by TAFE SA in 2014–15 ($3.2 million)
• reduced expenditure under the Critical Skills Investment Program ($3.1 million)
partially offset by
• an increase in Our Jobs Plan expenditure in 2015–16 ($12.9 million)
• commencement of expenditure in 2015–16 for the Industry Attraction Fund ($5.0 million)
• the upgrade of infrastructure at regional arts theatres by Country Arts SA ($4.3 million)
• expenditure commencing in 2015–16 for OZ Minerals increased investment in South Australia and relocation of head office from Melbourne ($4.0 million)
• grant expenditure for the Innamincka Airstrip carried over to 2015–16 ($2.4 million)
Income
The $3.2 million increase in income is primarily due to:
• indexation of TAFE SA fee for service income ($5.8 million)
partially offset by
• finalisation of the Commonwealth Government funded Joint Group Training ($0.9 million) and Child Care Fee Waiver ($1.8 million) programs in 2014–15.
Statement of financial position — controlled
The $35.1 million increase in net assets is primarily due to:
• an increase in non-current assets associated with the expanded investing program in 2015–16, predominantly for the Adelaide Festival Centre Precinct upgrade ($22.3 million)
• an increase in cash and cash equivalents ($12.9 million).
State Development
2015–16 Agency Statements — Volume 4 125

Statement of cash flows — controlled
The movements in cash outflows and inflows are generally consistent with the changes discussed above under the statement of comprehensive income and the statement of financial position.
Statement of comprehensive income — administered items
The $34.1 million increase in expenses is primarily due to:
• higher returns to the Consolidated Accounts for royalties from minerals and petroleum productions ($37.0 million)
partially offset by
• reduction in expenditure associated with APY Lands additional services ($1.3 million)
• reduction in expenditure associated with Aboriginal Communities ($0.7 million)
• reduction in Native Title petroleum production payments ($0.6 million).
The $35.6 million increase in income is primarily due to:
• increase in royalties revenue from minerals and petroleum productions ($37.0 million)
partially offset by
• reduction in interest revenue associated with APY Lands additional services and Aboriginal Communities ($0.8 million)
• reduction in Native Title petroleum production revenue ($0.6 million).
Statement of financial position — administered items
No major variations.
Statement of cash flows — administered items
The movements in cash outflows and inflows are generally consistent with the changes discussed above under the statement of comprehensive income and the statement of financial position.
Additional information for administered items
Additional information on administered items is included in the following table.
State Development
126 2015–16 Agency Statements — Volume 4

Additional information for administered items for the Department of State Development Statement of cash flows
2015–16 Budget
2014–15 Estimated
Result 2014–15 Budget
2013–14 Actual
$000 $000 $000 $000
Operating activities
Cash outflows
Employee benefit payments Parliamentary salaries and electorate expense allowances ....................................................................... 916 894 892 631
Grants and subsidies APY Lands — additional services ..................................... 373 300 364 532
Supplies and services APY Lands — additional services ..................................... 94 529 92 — Aboriginal Communities — additional services ................. — 519 — — Commonwealth Essential Services capital works fund ..... — — — 725
Intra-government transfers APY Lands — additional services ..................................... 5 861 6 782 5 718 9 238 Small Business Commissioner.......................................... 1 301 1 686 1 491 1 422 Aboriginal Communities — additional services ................. — 197 — — Commonwealth Essential Services capital works fund ..... — — — 1 950
Other payments Receipts paid to Consolidated Account ............................ 289 734 252 732 323 062 295 755 Native Title Agreement — royalty ..................................... 5 784 6 362 7 231 9 585
Cash used in operations 304 063 270 001 338 850 319 838
Cash inflows
Interest received APY Lands — additional services ..................................... — 433 — 513 Aboriginal Communities — additional services ................. — 348 — — Commonwealth Essential Services capital works fund ..... — — — 397
Other grants Commonwealth Essential Services capital works fund ..... — — — 1 897
Other receipts Mining royalties ................................................................. 289 734 252 732 323 062 312 278 Native Title Agreement — royalty ..................................... 5 784 6 362 7 231 10 335 Renewable Remote Power Generation ............................. — — — 468 APY Lands — additional services ..................................... — — — 83 Mintabie and private royalties ........................................... — — — 13
Cash generated from operations 295 518 259 875 330 293 325 984
State government
Appropriation Parliamentary salaries and electorate expense allowances ........................................................................ 916 894 892 603 APY Lands — additional services ..................................... 6 328 6 174 6 174 6 023
State Development
2015–16 Agency Statements — Volume 4 127
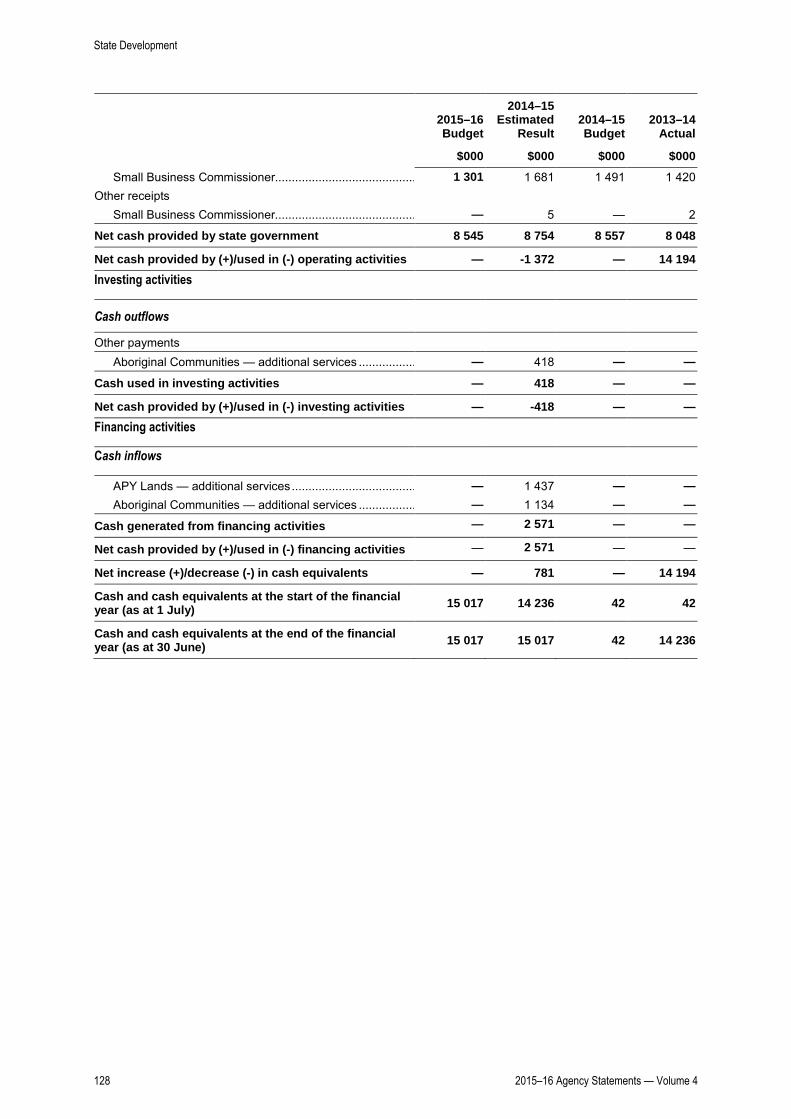
2015–16 Budget
2014–15 Estimated
Result 2014–15 Budget
2013–14 Actual
$000 $000 $000 $000
Small Business Commissioner.......................................... 1 301 1 681 1 491 1 420 Other receipts
Small Business Commissioner.......................................... — 5 — 2
Net cash provided by state government 8 545 8 754 8 557 8 048
Net cash provided by (+)/used in (-) operating activities — -1 372 — 14 194 Investing activities
Cash outflows
Other payments Aboriginal Communities — additional services ................. — 418 — —
Cash used in investing activities — 418 — —
Net cash provided by (+)/used in (-) investing activities — -418 — — Financing activities
Cash inflows
APY Lands — additional services ..................................... — 1 437 — — Aboriginal Communities — additional services ................. — 1 134 — —
Cash generated from financing activities — 2 571 — —
Net cash provided by (+)/used in (-) financing activities — 2 571 — —
Net increase (+)/decrease (-) in cash equivalents — 781 — 14 194
Cash and cash equivalents at the start of the financial year (as at 1 July) 15 017 14 236 42 42
Cash and cash equivalents at the end of the financial year (as at 30 June) 15 017 15 017 42 14 236
State Development
128 2015–16 Agency Statements — Volume 4

Additional information for administered items for the Department of State Development Reconciliation to statement of cash flows
2015–16 Budget
2014–15 Estimated
Result 2014–15 Budget
2013–14 Actual
$000 $000 $000 $000
Reconciliation to operating payments Operating payments (as per additional information for administered items) ................................................................ 304 063 270 001 338 850 319 838 Less: Transferred in:
APY Lands from the Department of the Premier and Cabinet ............................................... — — — 9 770 Commonwealth Essential Services capital works fund ..... — — — 2 675 Parliamentary salaries and electorate expense allowances from the Department for Further Education, Employment, Science and Technology ............................. — — — 312
Equals: Operating payments (as per administered items statement of cash flows) 304 063 270 001 338 850 307 081
Reconciliation to operating receipts
Operating receipts (as per additional information for administered items) ................................................................ 295 518 259 875 330 293 325 984 Less: Transferred in:
Commonwealth Essential Services capital works fund ..... — — — 2 294 APY Lands from the Department of the Premier and Cabinet ............................................... — — — 596
Equals: Operating receipts (as per administered items statement of cash flows) 295 518 259 875 330 293 323 094
Reconciliation of closing cash balance Cash and cash equivalents at the end of the financial year (as at 30 June) (as per additional information for administered items) ................................................................
15 017 15 017 42 14 236
Less: Transferred in: APY Lands from the Department of the Premier and Cabinet ............................................... -3 151 -3 151 — -3 151 Commonwealth Essential Service capital works fund ....... -381 -381 — -381
Equals: Cash and cash equivalents at the end of the period (as per administered items statement of cash flows) 18 549 18 549 42 17 768
State Development
2015–16 Agency Statements — Volume 4 129

State Development
130 2015–16 Agency Statements — Volume 4

Agency: South Australian Tourism Commission
Minister for Tourism
2015–16 Agency Statements — Volume 4 131
Tourism
132 2015–16 Agency Statements — Volume 4

Contents
Objective ........................................................................................................................................ 134 Ministerial responsibilities .............................................................................................................. 134 Workforce summary ...................................................................................................................... 134 Program net cost of services summary ......................................................................................... 134 Investing expenditure summary .................................................................................................... 135 Program 1: Tourism Development ............................................................................................. 136 Program 2: Tourism Events ....................................................................................................... 140 Program 3: Tourism Marketing................................................................................................... 143 Financial statements ..................................................................................................................... 148 Summary of major variations......................................................................................................... 151
Tourism
2015–16 Agency Statements — Volume 4 133

Objective
The South Australian Tourism Commission (SATC) markets South Australia as a holiday destination nationally and internationally and builds the state’s events calendar by securing, developing and expanding major events and festivals to grow the visitor economy and create jobs for the state. The SATC is working towards achieving the state’s tourism expenditure potential of $8 billion by 2020.
Ministerial responsibilities
Minister Programs Sub-programs
The Hon. LWK Bignell Minister for Tourism
1. Tourism Development 1.1 Destination Development 1.2 Strategy and Policy
2. Tourism Events Nil
3. Tourism Marketing 3.1 Domestic Marketing 3.2 International and Trade
Marketing
Statutes
The Department of the Premier and Cabinet maintains a list of statutes applicable to ministers.
Workforce summary
FTEs as at 30 June
Agency 2015–16
Budget(a)
2014–15 Estimated
Result(a) 2013–14 Actual(b)
South Australian Tourism Commission ........................................... 107.0 101.1 94.6
Total 107.0 101.1 94.6
(a) The 2015–16 Budget and 2014–15 Estimated Result reflect the established FTE caps.
(b) Data published by the Office for the Public Sector (Department of the Premier and Cabinet).
Program net cost of services summary
Net cost of services
2015–16 Budget
2014–15 Estimated
Result 2014–15 Budget
2013–14 Actual
Program $000 $000 $000 $000
1. Tourism Development ......................................... 9 939 7 278 7 698 7 639
2. Tourism Events ................................................... 20 471 17 371 15 036 14 509
3. Tourism Marketing .............................................. 38 252 27 489 27 423 31 611
Total 68 662 52 138 50 157 53 759
Tourism
134 2015–16 Agency Statements — Volume 4
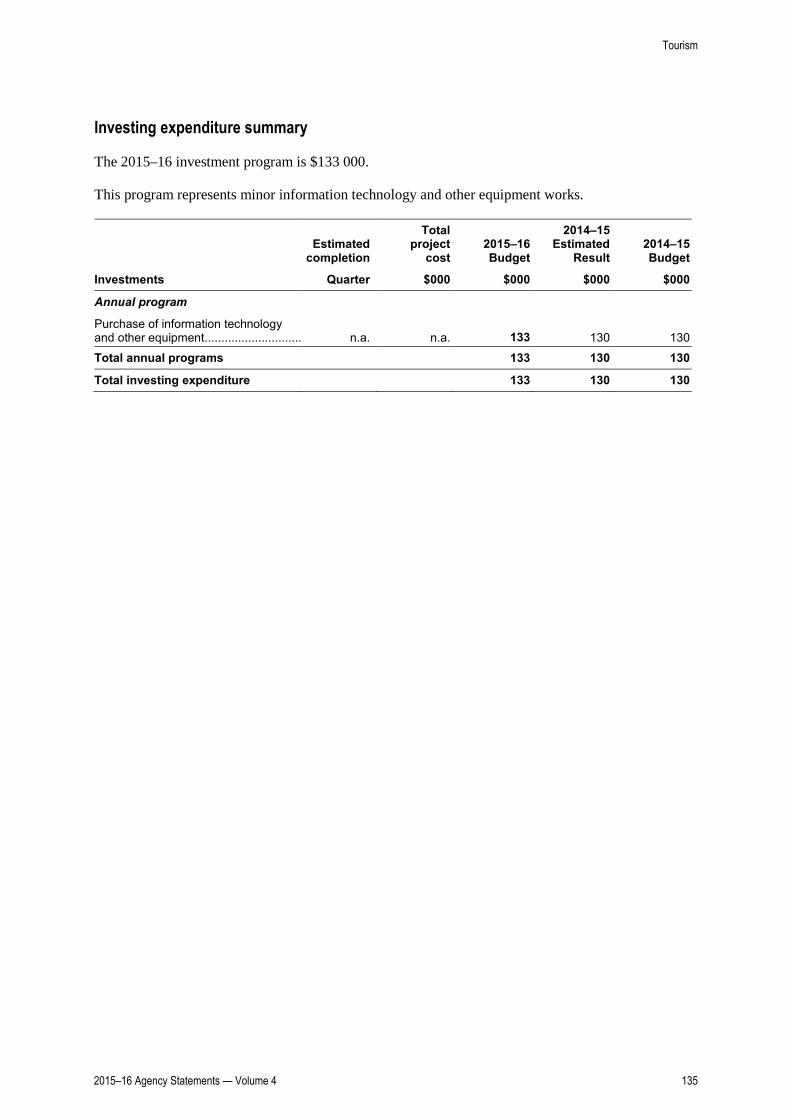
Investing expenditure summary
The 2015–16 investment program is $133 000.
This program represents minor information technology and other equipment works.
Estimated
completion
Total project
cost 2015–16 Budget
2014–15 Estimated
Result 2014–15 Budget
Investments Quarter $000 $000 $000 $000
Annual program Purchase of information technology and other equipment ............................. n.a.
n.a. 133 130 130
Total annual programs 133 130 130
Total investing expenditure 133 130 130
Tourism
2015–16 Agency Statements — Volume 4 135

Program 1: Tourism Development
Description/objective
The Tourism Development team builds tourism opportunity by improving visitor access into and around the state and providing advice to the industry in terms of research, policy and planning.
Sub-programs
1.1 Destination Development
1.2 Strategy and Policy
Program summary — expenses, income and FTEs
2015–16 Budget
2014–15 Estimated
Result 2014–15 Budget
2013–14 Actual
$000 $000 $000 $000
Expenses Employee benefit expenses.......................................... 1 433 1 406 1 531 2 318 Supplies and services ................................................... 3 674 1 575 2 410 2 063 Depreciation and amortisation expenses ...................... 46 46 61 63 Grants and subsidies .................................................... 4 840 4 309 3 979 3 299 Intra-government transfers ........................................... — — 3 — Other expenses ............................................................ 14 14 18 96
Total expenses 10 007 7 350 8 002 7 839
Income Sales of goods and services ......................................... 68 72 304 200
Total income 68 72 304 200
Net cost of providing services 9 939 7 278 7 698 7 639
FTEs as at 30 June (No.) 15.6 14.0 16.4 18.2
Tourism
136 2015–16 Agency Statements — Volume 4

Sub-program 1.1: Destination Development
Description/objective
The primary objective of the Destination Development team is to facilitate the building of tourism capability in South Australia in terms of ease of access function to and within the state, facilitating cruise ship arrivals, improving industry capability and promoting tourism infrastructure investment.
2015–16 Budget
2014–15 Estimated
Result 2014–15 Budget
2013–14 Actual
$000 $000 $000 $000 Expenses ...................................................................... 3 731 3 742 4 570 4 902 Income .......................................................................... 61 72 251 197
Net cost of sub-program 3 670 3 670 4 319 4 705
FTEs as at 30 June (No.) 10.4 10.3 12.1 13.6
Financial commentary
2015–16 Budget/2014–15 Estimated Result
No major variations.
2014–15 Estimated Result/2014–15 Budget
The $0.8 million decrease in expenses is primarily due to:
• a decrease in infrastructure development expenditure in 2014–15 ($0.3 million)
• the conclusion of contractual arrangements with providers of air access to South Australia ($0.5 million).
2014–15 Estimated Result/2013–14 Actual
The $1.2 million decrease in expenses is primarily due to:
• a decrease in infrastructure development expenditure in 2014–15 ($0.3 million)
• the conclusion of contractual arrangements with providers of air access to South Australia in 2014–15 ($0.5 million)
• additional operational efficiencies achieved in 2014–15 ($0.4 million).
Highlights 2014–15
• Worked with and maintained strong working relationships with all the international airlines directly servicing Adelaide. This included partnering with airlines to undertake joint marketing activities to raise awareness of South Australia as a tourism destination which assists in ensuring the sustainability of the services.
• Hosted 32 cruise ship visits to South Australian ports, with a total capacity of up to 87 000 passengers and crew. This included 19 ship visits to the Port Adelaide Passenger Terminal, seven visits to Kangaroo Island’s Penneshaw and six visits to Port Lincoln.
• Provided assistance to South Australian tourism operators with an international appeal to increase their capabilities. Assistance included the provision of advice, facilitation of industry partnerships and relationship development and engagement with tourism distribution channels.
Tourism
2015–16 Agency Statements — Volume 4 137

• In partnership with the state’s 11 regional tourism organisations, developed updated three year destination action plans. The plans identify achievable actions for the region’s tourism organisations and the SATC to contribute to the growth of tourism in the regions.
• Established five new theme based touring routes across South Australia, capitalising on the state’s competitive strengths and the growing self-drive market. The tourism routes showcase all 11 regions.
Targets 2015–16
• Continue to work with targeted international airlines to encourage them to maintain, increase or include direct flights to Adelaide.
• Host 37 cruise ship visits to South Australian ports with a total capacity of up to 88 000 passengers. This will consist of 22 visits to the Port Adelaide Passenger Terminal, ten visits to Kangaroo Island’s Penneshaw, four visits to Port Lincoln and one visit to Robe.
• Focus on working with existing tourism operators whose products have international appeal, to build their capability, and ensure South Australia has a broad range of desirable and saleable product.
• Monitor and manage destination action plans for the regions.
Sub-program 1.2: Strategy and Policy
Description/objective
To develop and influence strategies and policies to support government economic and tourism objectives, provide market research that underpins those policies and provide valuable robust data for the tourism industry to help plan for future growth.
2015–16 Budget
2014–15 Estimated
Result 2014–15 Budget
2013–14 Actual
$000 $000 $000 $000 Expenses ...................................................................... 6 276 3 608 3 432 2 937 Income .......................................................................... 7 — 53 3
Net cost of sub-program 6 269 3 608 3 379 2 934
FTEs as at 30 June (No.) 5.2 3.7 4.3 4.6
Financial commentary
2015–16 Budget/2014–15 Estimated Result
The $2.7 million increase in expenses is primarily due to:
• additional investment in the Convention Bid Fund aimed towards bidding for national and international business conventions at the newly expanded Adelaide Convention Centre ($2.5 million).
2014–15 Estimated Result/2014–15 Budget
No major variations.
Tourism
138 2015–16 Agency Statements — Volume 4

2014–15 Estimated Result/2013–14 Actual
The $0.7 million increase in expenses is primarily due to:
• the establishment of the Convention Bid Fund aimed towards bidding for business conventions at the newly expanded Adelaide Convention Centre ($1.0 million)
partially offset by
• additional operational efficiencies achieved in 2014–15 ($0.3 million).
Highlights 2014–15
• As at May 2015, the Convention Bid Fund has been successful in bidding for 12 events, which will attract more than 15 000 delegates to Adelaide and generate an estimated economic value of more than $64 million.
• Launched and commenced the implementation of the South Australian Tourism Plan 2020 and the SATC Corporate Plan 2015–17, which were developed following extensive consultation with industry, business and government. The plan is underpinned by six strategic directions and is guiding the SATC’s focus and efforts towards achieving the delivery of the Premier’s economic priority 5: South Australia — a growing destination choice for international and domestic travellers.
• Collaborating with the Department of Environment, Water and Natural Resources (DEWNR) on the development of a Nature Based Tourism Action Plan. The plan is aimed at increasing consumer demand and investment in nature-based tourism in our state’s national parks, marine parks and reserves.
• Contributed to programs initiated under the National Tourism 2020 framework, including advancing and reporting on investment and regulatory reform, collaborating on investment attraction activities and the Kangaroo Island Tourism Employment Plan.
• Represented the tourism sector in a wide range of government policy initiatives, including the provision of 10 year licences for shark cage dive operators, Naracoorte Caves master planning, creation of Mount Lofty Ranges as an international mountain bike destination and project development of the Kangaroo Island multi-day walk experience.
• Secured $4.0 million in matched Commonwealth Government investment over four years towards major tourism projects in South Australia through the national Tourism Demand Driving Infrastructure program.
Targets 2015–16
• Continue to partner with the Adelaide Convention Centre and Adelaide Convention Bureau to support the business tourism sector by attracting more conventions to Adelaide. The business community in South Australia will benefit from additional funding through the Convention Bid Fund.
• In conjunction with the tourism industry, continue the implementation of the South Australian Tourism Plan 2020.
• Provide ongoing analysis to support the SATC’s domestic and international marketing, events and destination development objectives.
• Contribute to the success of the tourism industry by identifying where planning, policy and project objectives of government agencies and industry can be utilised, influenced or improved for the benefit of tourism.
• In collaboration with the DEWNR, finalise and commence implementation of the Nature Based Tourism Action Plan.
• Identify projects and secure Commonwealth Government agreement for the allocation of funding in 2015–16 under the Tourism Demand Driver Infrastructure program.
Tourism
2015–16 Agency Statements — Volume 4 139

Program 2: Tourism Events
Description/objective
To strategically build and promote the state’s event calendar by developing and attracting new events and managing and growing existing events.
Program summary — expenses, income and FTEs
2015–16 Budget
2014–15 Estimated
Result 2014–15 Budget
2013–14 Actual
$000 $000 $000 $000
Expenses Employee benefit expenses.......................................... 2 575 2 709 2 239 2 373 Supplies and services ................................................... 19 749 15 192 14 799 15 671 Depreciation and amortisation expenses ...................... 227 227 215 209 Grants and subsidies .................................................... 3 912 5 273 4 616 2 552 Intra-government transfers ........................................... — — 39 — Other expenses ............................................................ 33 31 27 145
Total expenses 26 496 23 432 21 935 20 950
Income Intra-government transfers ........................................... 182 176 — 313 Sales of goods and services ......................................... 5 843 5 885 6 899 6 128
Total income 6 025 6 061 6 899 6 441
Net cost of providing services 20 471 17 371 15 036 14 509
FTEs as at 30 June (No.) 28.6 26.9 24.0 21.0
Financial commentary
2015–16 Budget/2014–15 Estimated Result
The $3.1 million increase in expenses is primarily due to:
• additional investment in the Events Bid Fund from 2015–16 to secure additional major events for the state ($5.0 million)
• additional investment in 2015–16 to further promote and grow the Santos Tour Down Under event which will support additional community events, festival growth and increased broadcasting and digital communications expenditure ($1.5 million)
• increased expenditure to engage with the local fashion and creative industries to grow the existing Adelaide Fashion Festival to an event of significance for the state with a focus on Asia ($0.5 million)
• additional expenditure for the Tasting Australia event to be held annually from 2015–16 ($1.0 million)
partially offset by
• once-off expenditure occurring in 2014–15 on events such as the 2015 International Cricket Council (ICC) Cricket World Cup and the 2015 World Tennis Challenge ($3.6 million)
Tourism
140 2015–16 Agency Statements — Volume 4

• additional investment in the 2015 Santos Tour Down Under event in 2014–15, including festival growth, marketing and communications expenditure ($0.8 million)
• a decrease in expenditure associated with operating overhead costs for managed events ($0.5 million).
2014–15 Estimated Result/2014–15 Budget
The $1.5 million increase in expenses is primarily due to:
• once-off expenditure occurring in 2014–15 on events such as the 2015 ICC Cricket World Cup ($1.3 million)
• additional investment in the 2015 Santos Tour Down Under in 2014–15 for festival growth, marketing and communications for the event ($0.8 million)
partially offset by
• a decrease in the recognition of the provision of goods and services as non-cash expenditure for managed events in 2014–15 ($0.6 million).
The $0.8 million decrease in income is primarily due to a decrease in the recognition of the provision of goods and services as non-cash sponsorship for managed events in 2014–15.
2014–15 Estimated Result/2013–14 Actual
The $2.9 million increase in net cost is primarily due to:
• the establishment of the Events Bid Fund in 2014–15 ($1.5 million)
• once-off expenditure occurring in 2014–15 on events such as the 2015 ICC Cricket World Cup ($3.1 million)
• additional investment in the 2015 Santos Tour Down Under in 2014–15 for festival growth, marketing and communications for the event ($0.8 million)
partially offset by
• a decrease in expenditure associated with the Tasting Australia event which was staged in 2013–14 and not in 2014–15 ($1.0 million)
• a decrease in expenditure associated with operating costs for managed events such as the once-off Word Adelaide event staged in 2013–14 and the cessation of various event sponsorships ($1.5 million).
Highlights 2014–15
• The 2015 Santos Tour Down Under event attracted 37 300 event specific visitors, injecting $47.9 million into the South Australian economy and creating 614 full-time equivalent jobs. The event attracted crowds of more than 786 000 people and generated $194 million of media coverage. The 2015 event also saw the inclusion of the Santos Women’s Tour, with 95 entries, 17 teams, and a final stage in Victoria Park in front of more than 4 000 spectators.
• The 2015 Credit Union Christmas Pageant secured an estimated overall audience of 560 000, with 345 000 people lining the streets, 146 000 watching the live television broadcast and 69 000 viewing the replay of the event. Public relations and publicity/media coverage outcomes generated more than $18.2 million in value for the state.
Tourism
2015–16 Agency Statements — Volume 4 141

• South Australia hosted six 2015 ICC Cricket World Cup matches, including India versus Pakistan and a quarter final match between Australia and Pakistan. The India versus Pakistan match had a vast television audience and was a sell-out with more than 45 per cent of attendees travelling from interstate and more than 10 per cent of attendees travelling from overseas.
• Secured 10 major events, forecast to inject $51.4 million into the South Australia economy under the first year of the Events Bid Fund. These events include the 2016 Australian Swimming Championships (selection trials for the 2016 Olympic Games), the Rescue 2018 World Life Saving Championships and the Liverpool Football Club v Adelaide United exhibition match at Adelaide Oval.
• A range of international, national and regional events were sponsored and staged in South Australia. These events included the South Australian Living Arts Festival, Bay to Birdwood, The Suit, Feast Festival, the Australian International 3 Day Event, the World Tennis Challenge, WOMADelaide and the Barossa Vintage Festival.
Targets 2015–16
• Utilise the increased investment in the Events Bid Fund to continue to secure a range of once-off events and at least one new annual event to act as a drawcard for attracting more international and national visitors to South Australia. The focus will be on securing events aligned with South Australia's strengths, such as arts and culture, live music, food and wine, national and international sports and mass participation events.
• To continue to support, grow and market existing events and festivals to build a balanced calendar of events that delivers strong economic outcomes, creates vibrancy, utilises existing or upgraded infrastructure and provides visitors with more reasons to come to South Australia.
• To continue to grow the Santos Tour Down Under, Credit Union Christmas Pageant and Tasting Australia events to deliver strong economic, promotional and community benefits for all South Australians.
• To re-launch the Adelaide Fashion Festival, with the aim of promoting South Australia and its fashion and design industries as well as optimise opportunities to strengthen cultural links with China.
• Maximise the economic, tourism and community benefits of hosting major national and international events in South Australia. These include the Liverpool versus Adelaide United match, the Australian Masters Games, the World Duathlon Championships, the Pacific School Games, the Australian Deaf Games, the Australian Swimming Championships, the Australian Age Swimming Championships and the Club Crew (Dragon Boat) World Championship events.
• Provide leadership to the South Australian events and festivals industry, including conducting a workshop in Adelaide and two workshops in regional South Australia with the aim of upskilling the industry and providing networking and collaboration opportunities.
Tourism
142 2015–16 Agency Statements — Volume 4

Program 3: Tourism Marketing
Description/objective
To develop and implement marketing activities and campaigns to increase the number of international and national visitors to and within South Australia.
Sub-programs
3.1 Domestic Marketing
3.2 International and Trade Marketing
Program summary — expenses, income and FTEs
2015–16 Budget
2014–15 Estimated
Result 2014–15 Budget
2013–14 Actual
$000 $000 $000 $000
Expenses Employee benefit expenses.......................................... 5 581 6 052 5 320 6 414 Supplies and services ................................................... 31 713 21 124 21 975 24 404 Depreciation and amortisation expenses ...................... 221 221 218 222 Grants and subsidies .................................................... 1 401 1 017 769 1 072 Intra-government transfers ........................................... — 50 8 135 Other expenses ............................................................ 70 66 64 353
Total expenses 38 986 28 530 28 354 32 600
Income Sales of goods and services ......................................... 734 1 041 931 938 Intra-government transfers ........................................... — — — 51
Total income 734 1 041 931 989
Net cost of providing services 38 252 27 489 27 423 31 611
FTEs as at 30 June (No.) 62.8 60.2 56.7 55.4
Tourism
2015–16 Agency Statements — Volume 4 143

Sub-program 3.1: Domestic Marketing
Description/objective
To develop and implement national marketing campaigns to grow awareness of the state’s tourism experiences and as a result increase visitation to and within South Australia.
2015–16 Budget
2014–15 Estimated
Result 2014–15 Budget
2013–14 Actual
$000 $000 $000 $000 Expenses ...................................................................... 21 076 16 400 16 608 19 378 Income .......................................................................... 86 3 366 236
Net cost of sub-program 20 990 16 397 16 242 19 142
FTEs as at 30 June (No.) 40.4 38.0 36.6 31.6
Financial commentary
2015–16 Budget/2014–15 Estimated Result
The $4.7 million increase in expenses is primarily due to:
• additional investment in 2015–16 for domestic marketing campaigns to promote Adelaide and South Australian regional tourism experiences and products to the Australian market ($3.0 million)
• the reallocation of funding from 2014–15 to 2013–14 for the development, production and media purchase for the Adelaide ‘Breathe’ marketing campaign ($2.4 million)
partially offset by
• a decrease in expenditure associated with SATC’s online development projects in 2014–15 ($0.7 million).
2014–15 Estimated Result/2014–15 Budget
No major variations.
2014–15 Estimated Result/2013–14 Actual
The $3.0 million decrease in expenses is primarily due to:
• increased expenditure in 2013–14 for the development, production and media purchase for the Adelaide ‘Breathe’ campaign ($4.7 million)
partially offset by
• an increase in expenditure associated with online development projects in 2014–15 ($0.6 million)
• an increase in expenditure associated with the reallocation of funding from sub-program 3.2 in 2014–15 ($1.1 million).
Highlights 2014–15
• Continued to run the Barossa Be Consumed campaign in Melbourne, Sydney and Brisbane, including sponsorship of The Living Room and Weekend Feast programs to highlight regional producers and food and wine offerings in the Barossa Valley. The Adelaide ‘Breathe’ campaign was also continued domestically in Melbourne, Sydney and Brisbane across cinema, online and print.
Tourism
144 2015–16 Agency Statements — Volume 4

• Encouraged South Australians to holiday in their own state through the Best Backyard campaign, producing three new television commercials for the intrastate market, namely Adelaide Hills, Limestone Coast and Kangaroo Island. These complete the suite of Best Backyard film assets with all regions being showcased across television, cinema and online advertising in South Australia.
• Worked closely with major South Australian events on a joint sponsorship proposal with Virgin Australia. The Santos Tour Down Under, Adelaide Fringe, WOMADelaide and Clipsal 500 events were packaged and promoted in the interstate market to generate awareness of major South Australian festivals and drive interstate visitation to these events.
• The Through Local Eyes film project, where local filmmakers work with the SATC to create short films for YouTube, has reached 1.65 million views. Five new films were created and released, bringing the total number of films to 33.
• Identified and leveraged key broadcast destination opportunities like Sean’s Kitchen to showcase and strengthen South Australia’s position as a world class food and wine destination to a national and international audience.
• Conceptualised, designed and delivered three YouTube films targeted at Indian audiences around the Cricket World Cup and Adelaide. The films amassed more than 130 000 views in the three months leading up to the India versus Pakistan game and over ten media clips in India highlighting the films. The videos were also widely watched on Adelaide Oval and Education Adelaide Facebook pages. It was also sent to the SATC India travel agent networks and used in travel agent newsletters to consumers.
Targets 2015–16
• Further progress market activity on greater Adelaide and the Barossa Valley domestically, utilising the existing television commercials to promote South Australia as a leading food and wine destination. This activity will be supported via editorial and print advertisements and communication through our trade partner websites which tells South Australia’s broader story.
• Revitalise the marketing strategy for the intrastate Best Backyard campaign to continue to encourage South Australians to take holidays and breaks, including day trips in their own state.
• Utilise the additional investment in domestic marketing to work with a major travel trade partner to run a significant cooperative marketing campaign promoting the state’s tourism regions, experiences and events in key interstate markets to drive visitation to the state.
• Delivery of the Regional Consumer Cooperative Marketing Fund, which will provide up to $20 000 to the 11 regional tourism bodies for consumer-based marketing activities. This funding is to be matched by the region, essentially doubling the marketing spend that would normally be undertaken.
• Enhance the SATC’s consumer website <southaustralia.com> through the addition of new assets, including a South Australian travel planner and online magazines of South Australia specifically built to be viewed on mobile phone and tablets.
• Identify key broadcast show opportunities to generate global visibility for South Australia and build on the momentum established by the Cricket World Cup to promote South Australia in India, working closely with Tourism Australia in this market.
Tourism
2015–16 Agency Statements — Volume 4 145

Sub-program 3.2: International and Trade Marketing
Description/objective
Position South Australia as a compelling part of an Australian journey for overseas visitors by working cooperatively with distribution partners and implementing marketing campaigns to ensure consumers are aware of, and visit, South Australia as a holiday destination.
2015–16 Budget
2014–15 Estimated
Result 2014–15 Budget
2013–14 Actual
$000 $000 $000 $000 Expenses ...................................................................... 17 910 12 130 11 746 13 222 Income .......................................................................... 648 1 038 565 753
Net cost of sub-program 17 262 11 092 11 181 12 469
FTEs as at 30 June (No.) 22.4 22.2 20.1 23.8
Financial commentary
2015–16 Budget/2014–15 Estimated Result
The $6.2 million increase in net cost is primarily due to:
• additional investment in 2015–16 in international marketing with a focus on growing tourism opportunities from the emerging international markets of China, India and South East Asia (Malaysia and Singapore) and the traditional markets of the United States of America, United Kingdom, Europe and New Zealand ($7.0 million).
partially offset by
• additional expenditure in 2014–15 for the Corroboree Europe campaign ($0.2 million)
• the implementation of operational efficiencies in 2015–16 ($0.6 million).
2014–15 Estimated Result/2014–15 Budget
No major variations.
2014–15 Estimated Result/2013–14 Actual
The $1.4 million decrease in net cost is primarily due to:
• a decrease in expenditure associated with the reallocation of funding to sub-program 3.1 in 2014–15 ($1.1 million)
• the implementation of operational efficiencies in 2014–15 ($0.3 million).
Highlights 2014–15
• Hosted Discover SA, a South Australian trade event which provides tourism operators with an opportunity to directly promote and sell their product to key domestic and international travel trade. A record 59 buyers attended and also participated in a state-wide familiarisation program.
• Hosted Corroboree Europe in South Australia, a major familiarisation and training event for travel agents across the United Kingdom and Europe. The three day workshop provided an opportunity for 138 Australian tourism operators, including 14 South Australian operators to showcase their tourism offering to 300 United Kingdom and European buyers. Travel agents also participated in familiarisation visits, allowing them to experience South Australia’s regions and product first hand.
Tourism
146 2015–16 Agency Statements — Volume 4

• Conducted more than 60 targeted marketing campaigns in our key international markets aimed at increasing awareness and consumer demand for South Australia as a holiday destination.
• Undertook a three month consumer facing campaign in Malaysia showcasing a more appealing South Australia, building destination awareness and growing visitation from the Malaysian market. Campaign elements included the production of an online 60 second video as well as banner and print advertising, including editorial features.
• Undertook a cooperative marketing campaign in New Zealand with leading travel retailer House of Travel, aimed at driving visitation to South Australia. Campaign elements included television commercials as well as print and digital advertisements.
• Partnered with Trip Advisor in the United Kingdom and United States of America markets in the promotion of ‘Adelaide. Australia’s Wine & Wildlife Capital’. This digital campaign is aimed at independent travelers in North America and United Kingdom and directs people to a specifically designed micro-site focussing on major South Australian themes, including nature and wildlife, wine and food and outback experiences. The site is designed to build destination and experience awareness and provide information for consumers to book holidays to South Australia.
Targets 2015–16
• Launch a New Zealand consumer campaign with key travel and airline partners. The campaign will include television, digital and press advertising.
• In conjunction with key airline and trade partners, invest the additional funding to conduct high impact cooperative marketing campaigns in the traditional markets of the United States of America, United Kingdom, Germany, France and Italy to further grow visitation to the State, incorporating significant digital, cinema and magazine advertising.
• Target the emerging tourism markets of China and India by conducting large scale consumer and trade campaigns, with a focus on the digital environment to raise consumer awareness and demand for South Australia as a tourism destination in Shanghai, Beijing and Guangdong as well as the Shandong Province.
• Partner with key airlines and travel agent partners to undertake cooperative marketing activity in the Singapore and Malaysian markets. Additional funding will be used to develop and conduct marketing campaigns, including print and magazine advertising as well as work with key travel operators in the digital environment.
• To expand joint marketing campaigns with all international airlines who service South Australia to grow demand for South Australia and maintain air capacity. In addition, the marketing activity listed above will have the objective and added benefits of raising South Australian visibility as a tourist destination with potential targeted airlines that do not currently service the state.
Tourism
2015–16 Agency Statements — Volume 4 147

South Australian Tourism Commission
Statement of comprehensive income______________________________________________________________________________________________________________________________________________________________________________________________________________
2015–16Budget
$000
2014–15Estimated
Result
$000
2014–15Budget
$000
2013–14Actual
$000
Expenses
Employee benefit expenses Salaries, wages, annual and sick leave .........................................................................................................................................................................7 944 8 454 7 485 8 685 Long service leave .........................................................................................................................................................................238 253 235 253 Payroll tax .........................................................................................................................................................................442 468 429 501 Superannuation .........................................................................................................................................................................795 830 743 820 Other .........................................................................................................................................................................170 162 198 846Supplies and services General supplies and services ................................................................................................................................................................................55 136 37 891 39 153 42 098 Consultancy expenses ................................................................................................................................................................................— — 31 40Depreciation and amortisation expenses .........................................................................................................................................................................494 494 494 494Grants and subsidies .........................................................................................................................................................................10 153 10 599 9 364 6 923Intra-government transfers .........................................................................................................................................................................— 50 50 135Other expenses .........................................................................................................................................................................117 111 109 594
Total expenses 75 489 59 312 58 291 61 389
Income
Intra-government transfers ................................................................................................................................................................................182 176 — 364Sales of goods and services ................................................................................................................................................................................6 645 6 998 8 134 6 985Net gain or loss from disposal of assets ................................................................................................................................................................................— — — -1Other income ................................................................................................................................................................................— — — 282
Total income 6 827 7 174 8 134 7 630
Net cost of providing services 68 662 52 138 50 157 53 759
Income from/expenses to state government
Income Appropriation ................................................................................................................................................................................69 007 51 335 50 502 52 884 Other income ................................................................................................................................................................................— 1 148 — 700
Net income from/expenses to state government 69 007 52 483 50 502 53 584
Total comprehensive result 345 345 345 -175
Tourism
148 2015–16 Agency Statements — Volume 4

South Australian Tourism Commission
Statement of financial position______________________________________________________________________________________________________________________________________________________________________________________________________________
2015–16Budget
$000
2014–15Estimated
Result
$000
2014–15Budget
$000
2013–14Actual
$000
Assets
Current assets
Cash and cash equivalents .......................................................................................................................................3 594 2 855 5 456 1 287Receivables .......................................................................................................................................689 689 936 819Other current assets .......................................................................................................................................10 10 67 492
Total current assets 4 293 3 554 6 459 2 598
Non current assets
Financial assets .......................................................................................................................................— — 400 —Plant and equipment .......................................................................................................................................1 334 1 695 1 680 2 059
Total non-current assets 1 334 1 695 2 080 2 059
Total assets 5 627 5 249 8 539 4 657
Liabilities
Current liabilities
Payables .................................................................................................................................................................................2 862 2 862 5 516 2 471Employee benefits Salaries and wages .................................................................................................................................................................................104 59 209 129 Annual leave .................................................................................................................................................................................581 592 576 603 Long service leave .................................................................................................................................................................................289 289 281 289 Other .................................................................................................................................................................................19 19 16 19Short-term provisions .................................................................................................................................................................................12 12 12 12Other current liabilities .................................................................................................................................................................................155 155 154 218
Total current liabilities 4 022 3 988 6 764 3 741
Non current liabilities
Long-term employee benefits Long service leave ................................................................................................................................................................................1 242 1 242 1 292 1 242Long-term provisions ................................................................................................................................................................................52 53 52 53Other non-current liabilities ................................................................................................................................................................................475 475 629 475
Total non-current liabilities 1 769 1 770 1 973 1 770
Total liabilities 5 791 5 758 8 737 5 511
Net assets -164 -509 -198 -854
Equity
Contributed capital .......................................................................................................................................64 64 64 64Retained earnings .......................................................................................................................................-228 -573 -262 -918
Total equity -164 -509 -198 -854
Balances as at 30 June end of period.
Tourism
2015–16 Agency Statements — Volume 4 149

South Australian Tourism Commission
Statement of cash flows______________________________________________________________________________________________________________________________________________________________________________________________________________
2015–16Budget
$000
2014–15Estimated
Result
$000
2014–15Budget
$000
2013–14Actual
$000
Operating activities
Cash outflows
Employee benefit payments ..............................................................................................................................................................................9 556 10 248 9 070 11 162Payments for supplies and services ..............................................................................................................................................................................55 136 37 018 38 794 48 743Grants and subsidies ..............................................................................................................................................................................10 153 10 599 9 364 7 615Intra-government transfers ..............................................................................................................................................................................— 50 50 149Other payments ..............................................................................................................................................................................117 174 109 131
Cash used in operations 74 962 58 089 57 387 67 800
Cash inflows
Intra-government transfers ..........................................................................................................................................................................182 176 — 401Sales of goods and services ..........................................................................................................................................................................6 645 7 128 8 245 7 892GST received ..........................................................................................................................................................................— — — 3 881Other receipts ..........................................................................................................................................................................— — — 19
Cash generated from operations 6 827 7 304 8 245 12 193
State government
Appropriation ..............................................................................................................................................................................69 007 51 335 50 502 52 884Other receipts ..............................................................................................................................................................................— 1 148 — 700
Net cash provided by state government 69 007 52 483 50 502 53 584
Net cash provided by (+)/used in (-) operating activities 872 1 698 1 360 -2 023
Investing activities
Cash outflows
Purchase of property, plant and equipment .......................................................................................................................................133 130 130 164
Cash used in investing activities 133 130 130 164
Cash inflows
Proceeds from sale of property, plant and equipment .......................................................................................................................................— — — 22
Cash generated from investing activities — — — 22
Net cash provided by (+)/used in (-) investing activities -133 -130 -130 -142
Net increase (+)/decrease (-) in cash equivalents 739 1 568 1 230 -2 165
Cash and cash equivalents at the start of the period 2 855 1 287 4 226 3 452
Cash and cash equivalents at the end of the period 3 594 2 855 5 456 1 287
Tourism
150 2015–16 Agency Statements — Volume 4

Summary of major variations
The following commentary relates to variations between the 2015–16 Budget and the 2014–15 Estimated Result.
Statement of comprehensive income — controlled
Expenses
The $16.2 million increase in expenses is primarily due to:
• additional investment in the Convention Bid Fund aimed towards bidding for national and international business conventions at the newly expanded Adelaide Convention Centre ($2.5 million)
• additional investment in the Events Bid Fund from 2015–16 to secure additional major events for the state ($5.0 million)
• additional investment to further promote and grow the Santos Tour Down Under event which will support additional community events, festival growth and increased broadcasting and digital communications expenditure ($1.5 million)
• increased expenditure to engage with the local fashion and creative industries to grow the existing Adelaide Fashion Festival to an event of significance for the state with a focus on Asia ($0.5 million)
• additional expenditure associated with making the Tasting Australia event an annual event from 2015–16 ($1.0 million)
• additional investment in domestic marketing campaigns to promote Adelaide and South Australian regional tourism experiences and products to the Australian market ($3.0 million)
• expenditure for major marketing campaigns brought forward from 2014–15 to 2013–14 for the development, production and media purchase for the Adelaide ‘Breathe’ campaign ($2.4 million)
• additional investment in international marketing with a focus on growing tourism opportunities from the emerging international markets of China, India and South East Asia (Malaysia and Singapore) and the traditional markets of the United States of America, United Kingdom, Europe and New Zealand ($7.0 million).
partially offset by
• once-off expenditure occurring in 2014–15 on events such as the 2015 ICC Cricket World Cup and the 2015 World Tennis Challenge ($3.6 million)
• additional investment in the 2015 Santos Tour Down Under in 2014–15 for festival growth, marketing and communications for the event ($0.8 million)
• a decrease in expenditure associated with operating overhead costs for managed events ($0.5 million)
• a decrease in expenditure associated with SATC’s online development projects in 2014–15 ($0.7 million)
• the implementation of operational efficiencies in 2015–16 ($0.6 million)
• a decrease in the recognition of the provision of goods and services as non-cash expenditure for managed events in 2015–16 ($0.3 million)
Tourism
2015–16 Agency Statements — Volume 4 151

Income
The $0.3 million decrease in income is primarily due to a decrease in the recognition of the provision of goods and services as non-cash sponsorship for managed events in 2015–16.
Statement of financial position — controlled
No major variations.
Statement of cash flows — controlled
No major variations.
Tourism
152 2015–16 Agency Statements — Volume 4

Agency: Department of Treasury and Finance
Minister for Business Services and Consumers Treasurer Minister for Finance Minister for Veterans’ Affairs
2015–16 Agency Statements — Volume 4 153

Treasury and Finance
154 2015–16 Agency Statements — Volume 4

Contents
Objective ........................................................................................................................................ 156 Ministerial responsibilities .............................................................................................................. 156 Ministerial office resources ............................................................................................................ 156 Workforce summary ...................................................................................................................... 157 Program net cost of services summary ......................................................................................... 157 Investing expenditure summary .................................................................................................... 158 Program 1: Gambling Policy ...................................................................................................... 159 Program 2: Accountability for Public Sector Resources ............................................................ 161 Program 3: Treasury Services ................................................................................................... 163 Program 4: Financial Services Provision ................................................................................... 165 Program 5: Veterans’ Affairs ...................................................................................................... 174 Financial statements ..................................................................................................................... 176 Summary of major variations......................................................................................................... 191
Treasury and Finance
2015–16 Agency Statements — Volume 4 155
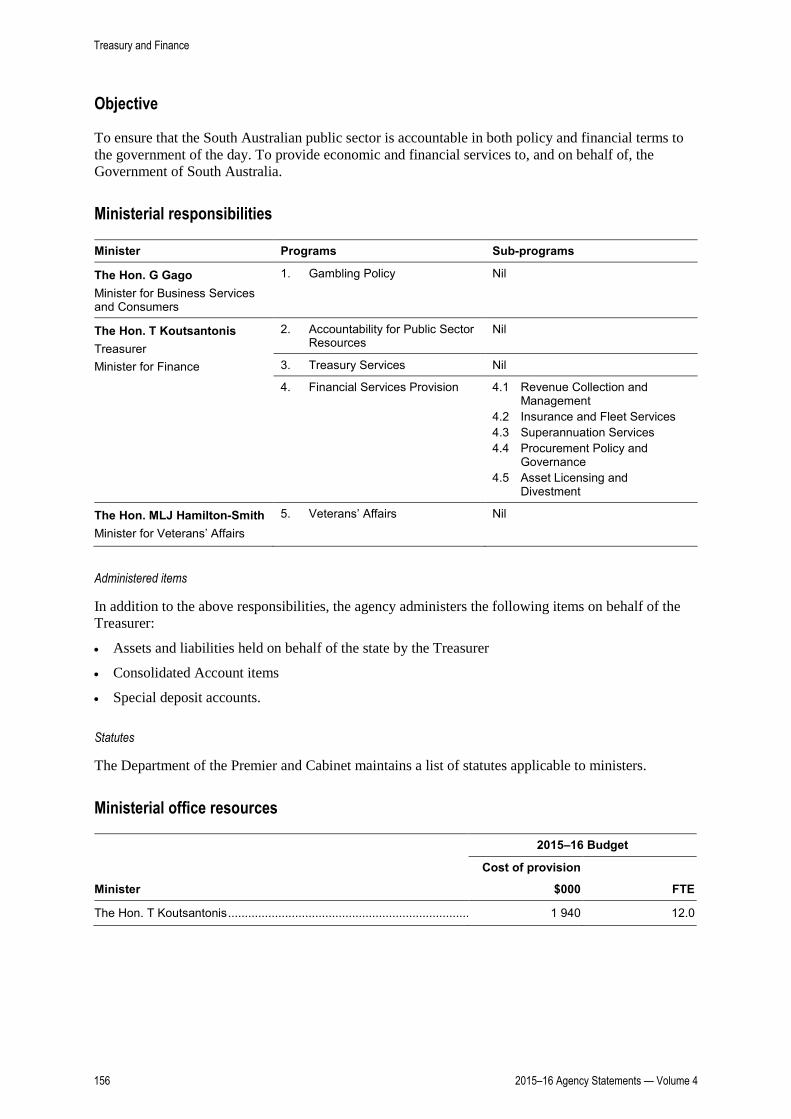
Objective
To ensure that the South Australian public sector is accountable in both policy and financial terms to the government of the day. To provide economic and financial services to, and on behalf of, the Government of South Australia.
Ministerial responsibilities
Minister Programs Sub-programs
The Hon. G Gago Minister for Business Services and Consumers
1. Gambling Policy Nil
The Hon. T Koutsantonis Treasurer Minister for Finance
2. Accountability for Public Sector Resources
Nil
3. Treasury Services Nil
4. Financial Services Provision 4.1 Revenue Collection and Management
4.2 Insurance and Fleet Services 4.3 Superannuation Services 4.4 Procurement Policy and
Governance 4.5 Asset Licensing and
Divestment
The Hon. MLJ Hamilton-Smith Minister for Veterans’ Affairs
5. Veterans’ Affairs Nil
Administered items
In addition to the above responsibilities, the agency administers the following items on behalf of the Treasurer:
• Assets and liabilities held on behalf of the state by the Treasurer
• Consolidated Account items
• Special deposit accounts.
Statutes
The Department of the Premier and Cabinet maintains a list of statutes applicable to ministers.
Ministerial office resources
2015–16 Budget
Cost of provision
Minister $000 FTE
The Hon. T Koutsantonis ........................................................................ 1 940 12.0
Treasury and Finance
156 2015–16 Agency Statements — Volume 4

Workforce summary
FTEs as at 30 June
Agency 2015–16
Budget(a)
2014–15 Estimated Result(a)(c)
2013–14 Actual(b)
Department of Treasury and Finance ................................................. 524.2 579.0 538.4
Administered items for the Department of Treasury and Finance....... 215.7 215.7 186.0
Total 739.9 794.7 724.4
Add: FTEs transferred out: Motor Injury Insurance Reform concluded 30 June 2014 ................................................................................ — — 14.0
Equals: ............................................................................................... 739.9 794.7 738.4
(a) The 2015–16 Budget and 2014–15 Estimated Result reflect the established FTE caps.
(b) Data published by the Office for the Public Sector (Department of the Premier and Cabinet).
(c) Includes a reduction of 82.0 FTEs following the transfer of the Department of Treasury and Finance’s corporate services function to the Department of the Premier and Cabinet in 2014–15.
Program net cost of services summary
Net cost of services
2015–16 Budget
2014–15 Estimated
Result 2014–15 Budget
2013–14 Actual
Program $000 $000 $000 $000
1. Gambling Policy .................................................. 871 822 367 378
2. Accountability for Public Sector Resources ......... 15 460 17 288 16 534 15 420
3. Treasury Services ............................................... — 11 — 100
4. Financial Services Provision ............................... 35 375 42 968 38 555 44 089
5. Veterans’ Affairs .................................................. 4 808 1 093 1 059 1 058
Total 56 514 62 182 56 515 61 045 Reconciliation to agency net cost of providing services
Add: Net costs transferred out: Review of Workers Compensation and Rehabilitation ceased 30 June 2014 ...................... — — — -8
Motor Injury Insurance Reform ceased 30 June 2014 ......................................................... — — — 561
Vehicles for Ministers, Leader of the Opposition, MPs and VIPs to the Department of the Premier and Cabinet on 1 April 2014 ..................................
— — — 3 878
Ministerial Support Services — Minister for Finance ceased 26 March 2014 ............................. — — — 1 298
Less: Net costs transferred in: Veterans’ Affairs from the Department for Communities and Social Inclusion on 1 July 2014 ............................................................
— — 1 059 —
Equals: Net cost of providing services (as per agency statement of comprehensive income) 56 514 62 182 55 456 66 774
Treasury and Finance
2015–16 Agency Statements — Volume 4 157
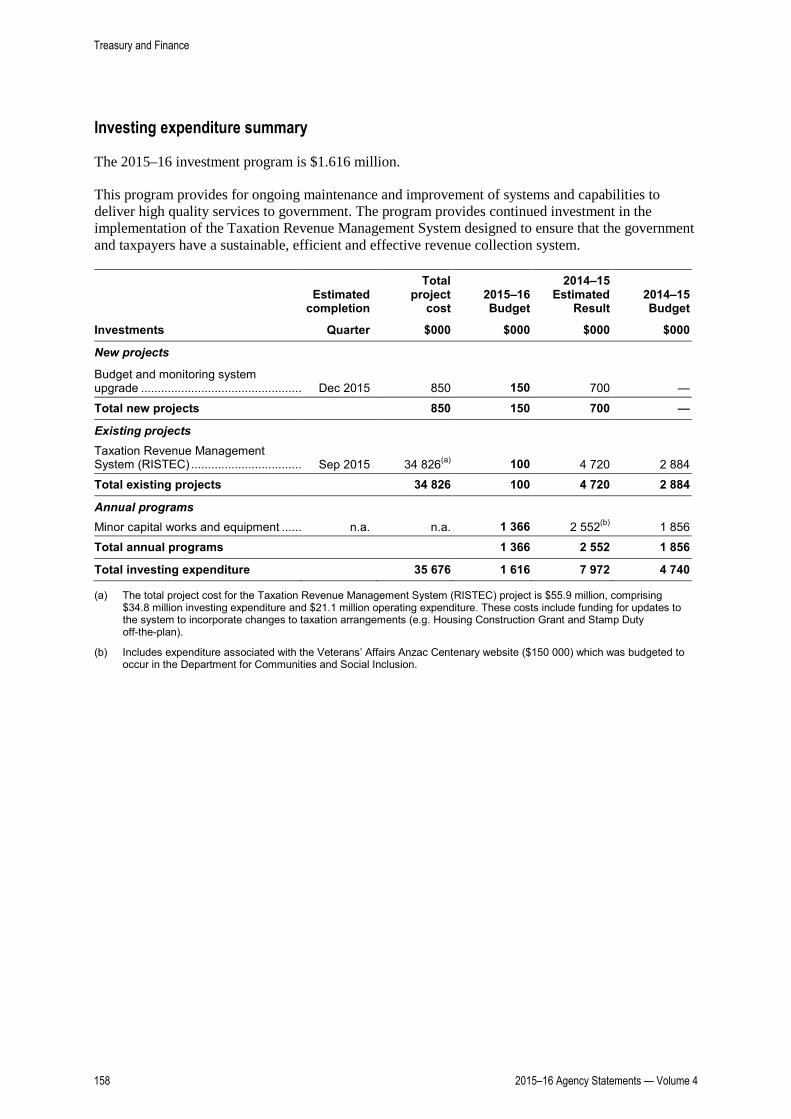
Investing expenditure summary
The 2015–16 investment program is $1.616 million.
This program provides for ongoing maintenance and improvement of systems and capabilities to deliver high quality services to government. The program provides continued investment in the implementation of the Taxation Revenue Management System designed to ensure that the government and taxpayers have a sustainable, efficient and effective revenue collection system.
Estimated
completion
Total project
cost 2015–16 Budget
2014–15 Estimated
Result 2014–15 Budget
Investments Quarter $000 $000 $000 $000
New projects Budget and monitoring system upgrade ................................................
Dec 2015 850 150 700 —
Total new projects 850 150 700 —
Existing projects Taxation Revenue Management System (RISTEC) ................................. Sep 2015 34 826(a) 100 4 720 2 884
Total existing projects 34 826 100 4 720 2 884
Annual programs Minor capital works and equipment ...... n.a. n.a. 1 366 2 552(b) 1 856
Total annual programs 1 366 2 552 1 856
Total investing expenditure 35 676 1 616 7 972 4 740
(a) The total project cost for the Taxation Revenue Management System (RISTEC) project is $55.9 million, comprising $34.8 million investing expenditure and $21.1 million operating expenditure. These costs include funding for updates to the system to incorporate changes to taxation arrangements (e.g. Housing Construction Grant and Stamp Duty off-the-plan).
(b) Includes expenditure associated with the Veterans’ Affairs Anzac Centenary website ($150 000) which was budgeted to occur in the Department for Communities and Social Inclusion.
Treasury and Finance
158 2015–16 Agency Statements — Volume 4

Program 1: Gambling Policy
Description/objective
The Department of Treasury and Finance provides policy advice to the government on economic, social and regulatory issues associated with gambling.
Program summary ― expenses, income and FTEs
2015–16 Budget
2014–15 Estimated
Result 2014–15
Budget(a) 2013–14
Actual
$000 $000 $000 $000
Expenses Employee benefit expenses.......................................... 501 496 306 346 Supplies and services ................................................... 231 203 41 42 Depreciation and amortisation expenses ...................... 15 11 13 1 Grants and subsidies .................................................... 106 95 — — Other expenses ............................................................ 39 34 19 —
Total expenses 892 839 379 389
Income Sales of goods and services ......................................... 21 17 12 11
Total income 21 17 12 11
Net cost of providing services 871 822 367 378
FTEs as at 30 June (No.) 4.1 4.3 2.3 2.1
(a) Includes part of the budget reallocation from the 2014–15 Budget sub-program 6.2: Ministerial Support Services — Treasurer.
Financial commentary
2015–16 Budget/2014–15 Estimated Result
No major variations.
2014–15 Estimated Result/2014–15 Budget
The increase in expenditure is primarily due to:
• the commencement of preparatory work on regulatory and tax arrangements for authorised betting operations, including sports integrity and place of consumption taxation ($0.2 million)
• the allocation of corporate overhead costs to the program ($0.1 million).
2014–15 Estimated Result/2013–14 Actual
The increase in expenditure is primarily due to:
• the commencement of preparatory work on regulatory and tax arrangements for authorised betting operations, including sports integrity and place of consumption taxation ($0.2 million)
• the allocation of corporate overhead costs to the program ($0.1 million).
Treasury and Finance
2015–16 Agency Statements — Volume 4 159

Highlights 2014–15
• Reviewed the operation of legislative amendments included in the Statutes Amendment (Gambling Reform) Act 2013.
• Monitored the operation of the Adelaide Casino regulatory and tax arrangements and facilitated changes to ensure ongoing competitiveness of premium gaming.
• Commenced preparatory work on regulatory and tax arrangements for authorised betting operations, including sports integrity and place of consumption taxation.
Targets 2015–16
• Progress the Statutes Amendment (Gambling Measures) Bill 2015, which offers improvements to the regulatory framework for gaming.
• Develop and progress amendments to the Authorised Betting Operations Act 2000 that will assist in reducing red tape for the wagering sector.
• Develop options for regulatory and tax arrangements for authorised betting operations, including sports integrity and place of consumption taxation.
• Progress changes to the Collections for Charitable Purposes Act 1939 to reduce regulatory duplication.
Treasury and Finance
160 2015–16 Agency Statements — Volume 4

Program 2: Accountability for Public Sector Resources
Description/objective
Treasury and Finance has the role of ensuring accountability for public sector resources through providing policy, economic and financial advice to the government and coordinating resource allocations for government programs and priorities at the whole of government level.
Program summary ― expenses, income and FTEs
2015–16 Budget
2014–15 Estimated
Result 2014–15
Budget(a) 2013–14
Actual
$000 $000 $000 $000
Expenses Employee benefit expenses......................................... 10 815 12 176 12 904 13 291 Supplies and services .................................................. 3 227 3 761 3 947 4 970 Depreciation and amortisation expenses ..................... 323 248 597 106 Grants and subsidies ................................................... 2 297 2 090 — 28 Other expenses ........................................................... 912 809 885 —
Total expenses 17 574 19 084 18 333 18 395 Income Intra-government transfers .......................................... 159 155 272 271 Sales of goods and services ........................................ 1 256 907 702 790 Interest revenue ........................................................... — 13 — 4 Other income ............................................................... 699 721 825 1 910
Total income 2 114 1 796 1 799 2 975 Net cost of providing services 15 460 17 288 16 534 15 420 FTEs as at 30 June (No.) 96.0 101.0 120.9 101.7
(a) Includes part of the budget reallocation from the 2014–15 Budget sub-program 6.2: Ministerial Support Services — Treasurer.
Financial commentary
2015–16 Budget/2014–15 Estimated Result
The decrease in expenditure is primarily due to a reduction in expenditure related to the Tax Reform Review project ($1.7 million).
2014–15 Estimated Result/2014–15 Budget
The $0.7 million increase in expenditure is primarily due to:
• the establishment of the Tax Reform Review project in 2014–15 ($1.7 million)
partially offset by
• a realignment of depreciation expense charged across all programs ($0.4 million)
• the implementation of savings measures ($0.3 million).
Treasury and Finance
2015–16 Agency Statements — Volume 4 161

2014–15 Estimated Result/2013–14 Actual
The $0.7 million increase in expenditure is primarily due to:
• the establishment of the Tax Reform Review project in 2014–15 ($1.7 million)
partially offset by
• a decrease in expenditure relating to the transition of banking services in 2013–14 ($1.1 million).
The decrease in income is primarily due to additional cost recovery income in 2013–14 for the transition of banking services ($1.1 million).
Highlights 2014–15
• Produced and published the consolidated 2013–14 financial statements for the Government of South Australia, the 2014–15 Mid-Year Budget Review and the 2015–16 Budget.
• Undertook a comprehensive review of state taxes and released the State Tax Review Discussion Paper and supported public consultation on state tax reform options.
• Presented the state’s position on horizontal fiscal equalisation issues during the Commonwealth Grants Commission’s 2015 methodology review.
• Supported the development and release of the An Affordable Place to Live Statement — Keeping SA Affordable and the Charter of Affordability.
• Implemented further measures and training to strengthen the governance arrangements and procedures for the development and assessment of capital proposals for the Government of South Australia’s investment programs.
Targets 2015–16
• Provide advice and analysis on proposals arising out of the Commonwealth Government’s white papers on Tax Reform and the Federation.
• Produce the consolidated 2014–15 financial statements for the Government of South Australia, the 2015–16 Mid-Year Budget Review and the 2016–17 Budget.
• Analyse the National Disability Insurance Scheme transition bilateral agreement and provide advice and analysis on its implications.
Treasury and Finance
162 2015–16 Agency Statements — Volume 4

Program 3: Treasury Services
Description/objective
Management of the government’s financial assets and liabilities and provision of certainty of funding to the state.
Program summary — expenses, income and FTEs
2015–16 Budget
2014–15 Estimated
Result 2014–15 Budget
2013–14 Actual
$000 $000 $000 $000
Expenses Employee benefit expenses.......................................... 5 138 5 034 4 662 4 556 Supplies and services ................................................... 856 839 1 366 2 136 Depreciation and amortisation expenses ...................... 10 10 9 10 Grants and subsidies .................................................... 420 392 — —
Total expenses 6 424 6 275 6 037 6 702
Income Sales of goods and services ......................................... 6 424 6 264 6 037 6 602
Total income 6 424 6 264 6 037 6 602 Net cost of providing services — 11 — 100 FTEs as at 30 June (No.) 40.6 41.9 50.6 43.6
Financial commentary
2015–16 Budget/2014–15 Estimated Result
No major variations.
2014–15 Estimated Result/2014–15 Budget
No major variations.
2014–15 Estimated Result/2013–14 Actual
No major variations.
Highlights 2014–15
• Successfully issued a new 10 year bond attracting 37 investors across Asia, Europe and Australia.
Targets 2015–16
• Extend further the South Australian Government Financing Authority (SAFA) debt profile with increased investor penetration.
• Successfully transition to a new treasury management system.
Treasury and Finance
2015–16 Agency Statements — Volume 4 163

Performance indicators
2015–16
Target
2014–15 Estimated
Result 2014–15
Target 2013–14
Actual
% of debt financing demands of the state and its instrumentalities met during year
100% 100% 100% 100%
% of clients satisfied with the SAFA services — assessed on timeliness, cost effectiveness and flexibility in service delivery
90%
90% 90% 95%
Treasury and Finance
164 2015–16 Agency Statements — Volume 4
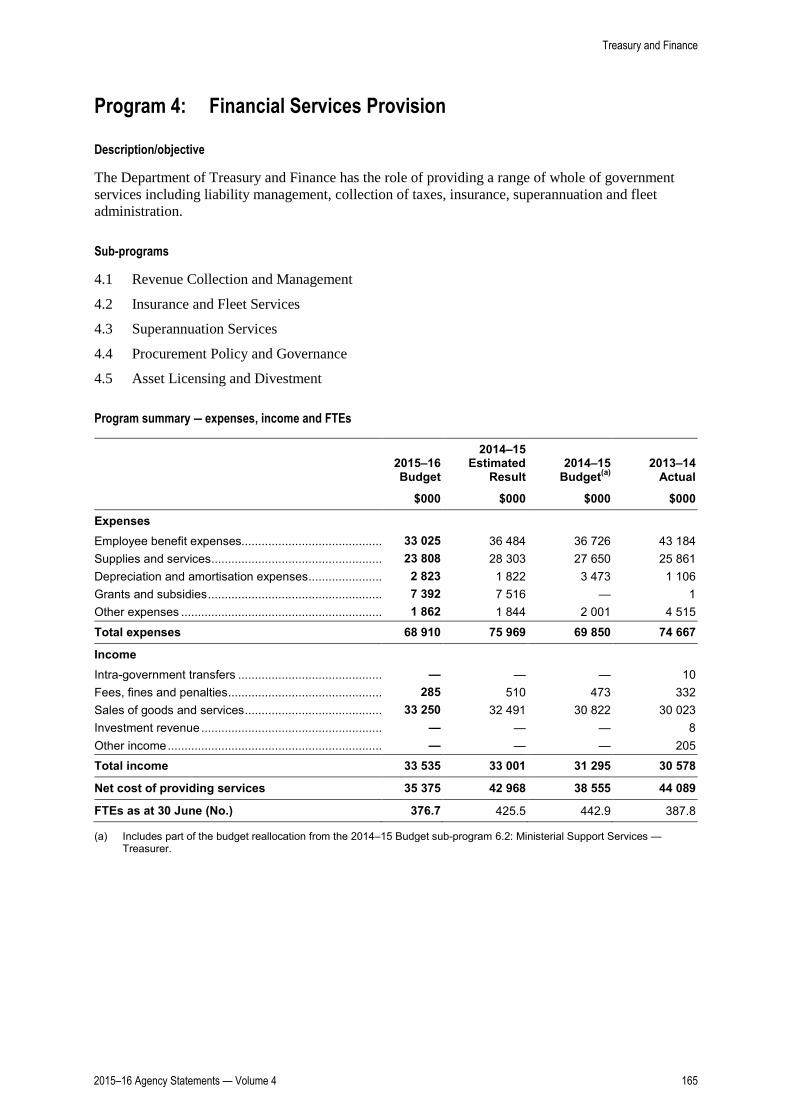
Program 4: Financial Services Provision
Description/objective
The Department of Treasury and Finance has the role of providing a range of whole of government services including liability management, collection of taxes, insurance, superannuation and fleet administration.
Sub-programs
4.1 Revenue Collection and Management
4.2 Insurance and Fleet Services
4.3 Superannuation Services
4.4 Procurement Policy and Governance
4.5 Asset Licensing and Divestment
Program summary ― expenses, income and FTEs
2015–16 Budget
2014–15 Estimated
Result 2014–15
Budget(a) 2013–14
Actual
$000 $000 $000 $000
Expenses Employee benefit expenses.......................................... 33 025 36 484 36 726 43 184 Supplies and services ................................................... 23 808 28 303 27 650 25 861 Depreciation and amortisation expenses ...................... 2 823 1 822 3 473 1 106 Grants and subsidies .................................................... 7 392 7 516 — 1 Other expenses ............................................................ 1 862 1 844 2 001 4 515
Total expenses 68 910 75 969 69 850 74 667
Income Intra-government transfers ........................................... — — — 10 Fees, fines and penalties .............................................. 285 510 473 332 Sales of goods and services ......................................... 33 250 32 491 30 822 30 023 Investment revenue ...................................................... — — — 8 Other income ................................................................ — — — 205
Total income 33 535 33 001 31 295 30 578
Net cost of providing services 35 375 42 968 38 555 44 089
FTEs as at 30 June (No.) 376.7 425.5 442.9 387.8
(a) Includes part of the budget reallocation from the 2014–15 Budget sub-program 6.2: Ministerial Support Services — Treasurer.
Treasury and Finance
2015–16 Agency Statements — Volume 4 165

Sub-program 4.1: Revenue Collection and Management
Description/objective
Management of taxation legislation, revenue systems and compliance systems to enable the government to raise revenue using its taxation powers and the provision of policy advice on taxation issues. Management of various grants and subsidy schemes for the government.
2015–16 Budget
2014–15 Estimated
Result 2014–15 Budget
2013–14 Actual
$000 $000 $000 $000 Expenses ...................................................................... 40 336 41 257 42 676 45 990 Income .......................................................................... 7 599 7 559 7 837 7 241
Net cost of sub-program 32 737 33 698 34 839 38 749
FTEs as at 30 June (No.) 202.1 221.9 245.4 205.1
Financial commentary
2015–16 Budget/2014–15 Estimated Result
The $0.9 million decrease in expenditure is primarily due to:
• a reduction in expenditure relating to the state taxation revenue system (RISTEC) project ($2.1 million)
partially offset by
• an increase in expenditure due to the realignment of the depreciation expense charged across all programs ($1.1 million).
2014–15 Estimated Result/2014–15 Budget
The decrease in expenditure is primarily due to a realignment of the depreciation expense charged across all programs ($1.1 million).
2014–15 Estimated Result/2013–14 Actual
The decrease in expenditure is due to a once-off write off of capitalised assets relating to RISTEC release 3 in 2013–14 ($4.5 million).
Highlights 2014–15
• Processed rebates for eligible employers as part of the second year of the payroll tax rebate payment scheme announced in the 2013–14 Budget.
• Implemented a scheme, in consultation with industry, to ensure that pensioners and concession card holders living in retirement villages were not adversely affected by the removal of the fixed property emergency services levy remission.
• Implemented an amendment to the Stamp Duties Act 1923 which gave effect to an extension of the boundaries for the stamp duty concession on the purchase of an off-the-plan apartment.
• Implemented an internet payment channel to allow credit card transactions via the internet for land tax and emergency services levy payments.
• Implemented a collection and compliance regime in connection with Casino Duty on net gambling revenue, as per the approved Casino Duty Agreement of 11 October 2013 and the Casino Act 1997.
Treasury and Finance
166 2015–16 Agency Statements — Volume 4

Targets 2015–16
• Draft legislative changes to implement the government’s tax reform measures.
• Successfully implement release two of the state taxation revenue system (RISTEC).
Performance indicators
2015–16
Target
2014–15 Estimated
Result 2014–15
Target 2013–14
Actual
Revenue resulting from compliance initiatives $79.7m $68.6m $71.7m $95.7m % of revenue banked on day of receipt >97% 98.48% >97% 97.59% Cost for collection of $100 tax (on a cash basis) <75cents 55 cents <75 cents 61 cents
Activity indicators
2015–16
Projection
2014–15 Estimated
Result 2014–15
Projection 2013–14
Actual
Taxation revenue collected by RevenueSA $3.8b $3.6b $3.6b $3.4b
Sub-program 4.2: Insurance and Fleet Services
Description/objective
The objectives of this sub-program include:
• provision of insurance cover to government agencies through the insurance and reinsurance of government risks
• provision of advice to the government on issues relating to the insurance and management of those risks
• provision of fleet management services to agencies and vehicle disposal services from government.
2015–16 Budget
2014–15 Estimated
Result 2014–15 Budget
2013–14 Actual
$000 $000 $000 $000 Expenses ...................................................................... 7 474 7 304 6 036 7 033 Income .......................................................................... 7 474 7 304 6 036 7 048
Net cost of sub-program — — — -15
FTEs as at 30 June (No.) 42.7 44.0 36.3 41.2
Financial commentary
2015–16 Budget/2014–15 Estimated Result
No major variations.
2014–15 Estimated Result/2014–15 Budget
The increase in expenditure and income reflect the higher activity base from 2013–14.
The increase in revenue is primarily due to increased cost recovery.
Treasury and Finance
2015–16 Agency Statements — Volume 4 167

2014–15 Estimated Result/2013–14 Actual
No major variations.
Highlights 2014–15
• Renewed the government’s catastrophe reinsurance program with increased property and general liability limits but an overall decrease in premiums.
• Managed the government’s fleet management and vehicle disposal contracts to enable effective and efficient outcomes for the government’s vehicle fleet.
Targets 2015–16
• Assess and review reinsurance covers for emerging liability risks.
Performance indicators
2015–16
Target
2014–15 Estimated
Result 2014–15
Target 2013–14
Actual
Eligible clients issued with agency agreements 100% 100% 100% 100% Comprehensive government catastrophe reinsurance program at a competitive market price
Selected catastrophic
risks covered at competitive market prices
Selected catastrophic
risks covered at competitive market prices
Selected catastrophic
risks covered at competitive
market prices
Selected catastrophic
risks covered at competitive
market prices Operating expense per $100 premium revenue <$6.00 $4.92 <$5.00 $4.09
Activity indicators
2015–16
Projection
2014–15 Estimated
Result 2014–15
Projection 2013–14
Actual
No. of new vehicles purchased 3 000 2 690 2 700 2 328 No. of vehicles disposed 3 000 2 968 2 700 2 511
Treasury and Finance
168 2015–16 Agency Statements — Volume 4

Sub-program 4.3: Superannuation Services
Description/objective
The objectives of this sub-program are to:
• administer the various public sector superannuation schemes for the South Australian Superannuation Board and the Southern Select Super Corporation, as well as the superannuation arrangements for parliamentarians, judges and former governors.
• provide superannuation policy and legislative advice to the South Australian Superannuation Board, the Southern Select Super Corporation, the Under Treasurer, the Treasurer and the Minister for Finance.
2015–16 Budget
2014–15 Estimated
Result 2014–15 Budget
2013–14 Actual
$000 $000 $000 $000 Expenses ...................................................................... 18 369 18 195 16 632 16 611 Income .......................................................................... 18 409 18 036 17 294 16 121
Net cost of sub-program -40 159 -662 490
FTEs as at 30 June (No.) 121.1 124.8 134.1 118.8
Financial commentary
2015–16 Budget/2014–15 Estimated Result
No major variations.
2014–15 Estimated Result/2014–15 Budget
The increase in expenditure is primarily due to key projects commencing in 2014–15, principally the Project Protect and ICT Solution Project ($0.9 million), and an increase in operating expenditure as a result of increased member activity ($0.3 million).
The increase in income is primarily due to increased cost recovery in 2014–15.
2014–15 Estimated Result/2013–14 Actual
The $1.5 million increase in expenditure is primarily due to key projects commencing in 2014–15, principally the Project Protect and ICT Solution Project ($0.9 million), and an increase in operating expenditure as a result of increased member activity in 2014–15 ($0.3 million).
The $1.9 million increase in revenue is primarily due to increased cost recovery in 2014–15.
Highlights 2014–15
• Finalised a review of insurance products.
• Commenced procurement of a next generation commercial administration system with complementary electronic document and workflow management capabilities.
• Finalised procurement of an Australian Financial Services licence holder to provide financial advice services to Super SA members via a third party outsourced relationship.
Treasury and Finance
2015–16 Agency Statements — Volume 4 169
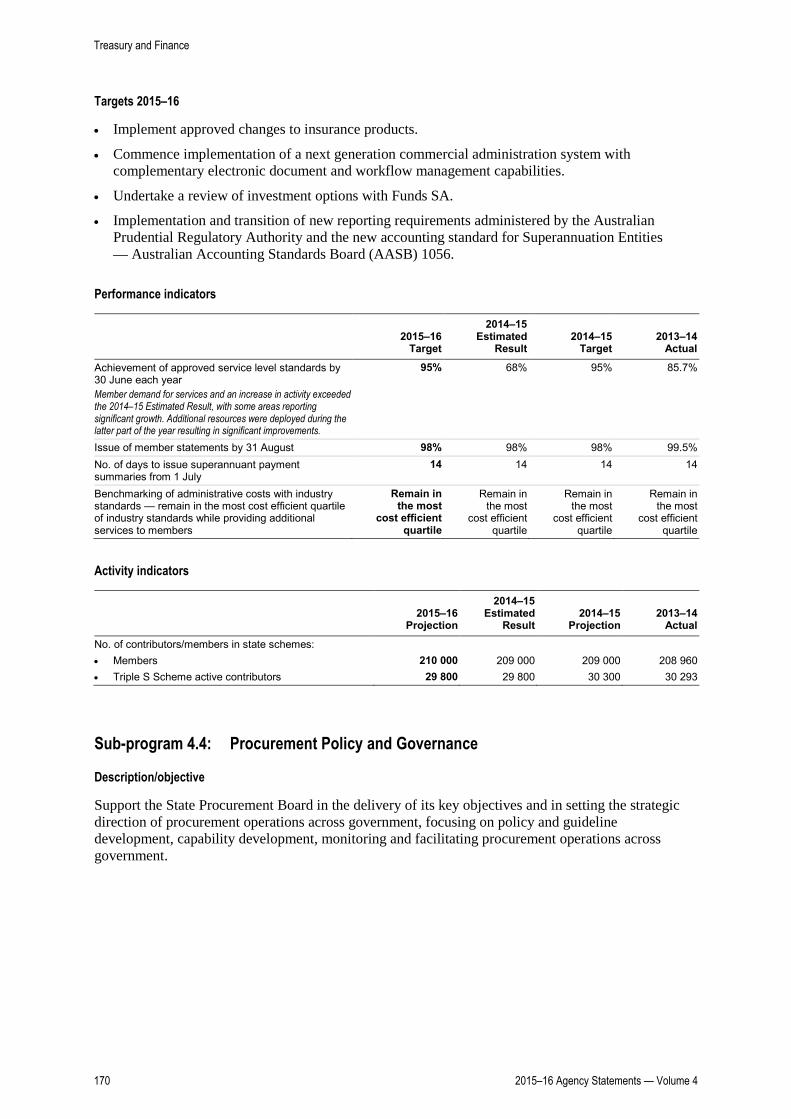
Targets 2015–16
• Implement approved changes to insurance products.
• Commence implementation of a next generation commercial administration system with complementary electronic document and workflow management capabilities.
• Undertake a review of investment options with Funds SA.
• Implementation and transition of new reporting requirements administered by the Australian Prudential Regulatory Authority and the new accounting standard for Superannuation Entities — Australian Accounting Standards Board (AASB) 1056.
Performance indicators
2015–16
Target
2014–15 Estimated
Result 2014–15
Target 2013–14
Actual
Achievement of approved service level standards by 30 June each year Member demand for services and an increase in activity exceeded the 2014–15 Estimated Result, with some areas reporting significant growth. Additional resources were deployed during the latter part of the year resulting in significant improvements.
95% 68% 95% 85.7%
Issue of member statements by 31 August 98% 98% 98% 99.5% No. of days to issue superannuant payment summaries from 1 July
14 14 14 14
Benchmarking of administrative costs with industry standards — remain in the most cost efficient quartile of industry standards while providing additional services to members
Remain in the most
cost efficient quartile
Remain in the most
cost efficient quartile
Remain in the most
cost efficient quartile
Remain in the most
cost efficient quartile
Activity indicators
2015–16
Projection
2014–15 Estimated
Result 2014–15
Projection 2013–14
Actual
No. of contributors/members in state schemes: • Members 210 000 209 000 209 000 208 960 • Triple S Scheme active contributors 29 800 29 800 30 300 30 293
Sub-program 4.4: Procurement Policy and Governance
Description/objective
Support the State Procurement Board in the delivery of its key objectives and in setting the strategic direction of procurement operations across government, focusing on policy and guideline development, capability development, monitoring and facilitating procurement operations across government.
Treasury and Finance
170 2015–16 Agency Statements — Volume 4

2015–16 Budget
2014–15 Estimated
Result 2014–15 Budget
2013–14 Actual
$000 $000 $000 $000
Expenses ...................................................................... 2 264 2 013 2 204 2 064
Income .......................................................................... 53 34 64 80
Net cost of sub-program 2 211 1 979 2 140 1 984
FTEs as at 30 June (No.) 10.3 10.7 13.4 11.4
Financial commentary
2015–16 Budget/2014–15 Estimated Result
No major variations.
2014–15 Estimated Result/2014–15 Budget
No major variations.
2014–15 Estimated Result/2013–14 Actual
No major variations.
Highlights 2014–15
• Completed 11 procurement compliance reviews and eight procurement accreditation reviews.
• Reviewed the State Procurement Board policy framework and developed a methodology and project plan to guide its development and implementation in 2015–16.
• Developed and implemented updated guidelines covering the Contract Management and Market Analysis and Acquisition Strategy, the new mandated acquisition planning template and five better practice handbooks.
• Conducted regular discussion forums with agency heads of procurement and implemented a bi-annual procurement practitioners forum.
• Established a measurement regime to measure the effectiveness of the board’s targeted training program.
• Established a mechanism to gather supplier feedback on their experience with government procurement processes.
Targets 2015–16
• Develop and finalise the revised State Procurement Board policy framework.
• Continue to develop strategies to improve procurement capability across government.
• Review the assurance and accreditation programs and report any recommended improvements to the State Procurement Board.
• Work with the Commonwealth Government to implement the Trans-Pacific Partnership and World Trade Organisation Government Procurement Chapters.
Treasury and Finance
2015–16 Agency Statements — Volume 4 171

Sub-program 4.5: Asset Licensing and Divestment
Description/objective
Progress initiatives aimed at realising the value of the state’s assets to strengthen the state’s balance sheet. These initiatives include a range of commercial property sales, the Compulsory Third Party Insurance Market Reform project and the Land Services Group project.
2015–16 Budget
2014–15 Estimated
Result 2014–15 Budget
2013–14 Actual
$000 $000 $000 $000
Expenses ...................................................................... 467 7 200 2 302 2 969
Income .......................................................................... — 68 64 88
Net cost of sub-program 467 7 132 2 238 2 881
FTEs as at 30 June (No.) 0.5 24.0 13.7 11.3
Financial commentary
2015–16 Budget/2014–15 Estimated Result
The decrease in expenditure is primarily due to:
• a reduction in expenditure relating to the Compulsory Third Party Insurance Market Reform project ($3.5 million)
• a reduction in expenditure relating to the Land Services Group project ($0.5 million)
• a reduction in expenditure relating to the divestment of commercial properties in the Adelaide Central Business District (CBD), specifically the State Administration Precinct ($2.0 million).
2014–15 Estimated Result/2014–15 Budget
The $4.9 million increase in expenditure is primarily due to:
• establishment of the Compulsory Third Party Insurance Market Reform project in 2014–15 ($3.5 million)
• establishment of the Land Services Group project in 2014–15 ($0.5 million)
• the carryover of funding from 2013–14 to 2014–15 relating to the divestment of commercial properties in the Adelaide CBD, specifically the State Administration Precinct ($0.2 million)
• additional expenditure for post transaction activities relating to the forestry land holding administration ($0.2 million).
2014–15 Estimated Result/2013–14 Actual
The $4.2 million increase in expenditure is primarily due to:
• establishment of the Compulsory Third Party (CTP) Insurance Market Reform project in 2014–15 ($3.5 million)
• establishment of the Land Services Group project in 2014–15 ($0.5 million)
• the carryover of funding from 2013–14 to 2014–15 relating to the divestment of commercial properties in the Adelaide CBD, specifically the State Administration precinct ($0.2 million)
• additional expenditure for post transaction activities relating to the Forestry land holding administration ($0.2 million).
Treasury and Finance
172 2015–16 Agency Statements — Volume 4

Highlights 2014–15
• Finalised the divestment of 60 Wakefield Street, 21 Divett Place and 11–19 Penny Place, Adelaide and 621 Goodwood Road, Panorama (the former Panorama TAFE).
• Undertook preparatory work on the CTP insurance market reforms with the aim of extracting appropriate value for the state and opening up the CTP insurance market to private insurers from 1 July 2016.
Targets 2015–16
• Progress the divestment of the State Administration Centre Precinct, including the State Administration Centre, Education Building, Torrens Building, Hemmings Place, 30 Wakefield Street, Adelaide and 24 Flinders Street, Adelaide.
• Progress the divestment of three former TAFE sites.
• Finalise the CTP insurance market reforms and open up the CTP insurance market to private insurers from 1 July 2016.
Treasury and Finance
2015–16 Agency Statements — Volume 4 173
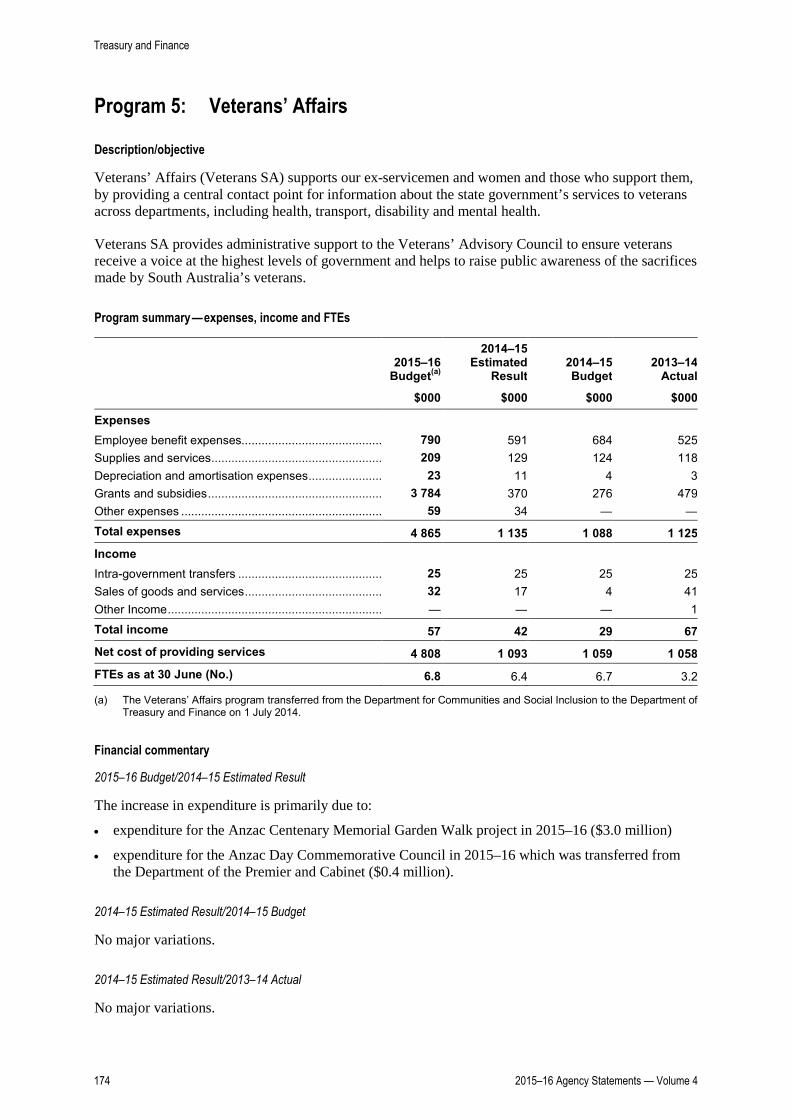
Program 5: Veterans’ Affairs
Description/objective
Veterans’ Affairs (Veterans SA) supports our ex-servicemen and women and those who support them, by providing a central contact point for information about the state government’s services to veterans across departments, including health, transport, disability and mental health.
Veterans SA provides administrative support to the Veterans’ Advisory Council to ensure veterans receive a voice at the highest levels of government and helps to raise public awareness of the sacrifices made by South Australia’s veterans.
Program summary — expenses, income and FTEs
2015–16
Budget(a)
2014–15 Estimated
Result 2014–15 Budget
2013–14 Actual
$000 $000 $000 $000
Expenses Employee benefit expenses.......................................... 790 591 684 525 Supplies and services ................................................... 209 129 124 118 Depreciation and amortisation expenses ...................... 23 11 4 3 Grants and subsidies .................................................... 3 784 370 276 479 Other expenses ............................................................ 59 34 — —
Total expenses 4 865 1 135 1 088 1 125 Income Intra-government transfers ........................................... 25 25 25 25 Sales of goods and services ......................................... 32 17 4 41 Other Income ................................................................ — — — 1
Total income 57 42 29 67 Net cost of providing services 4 808 1 093 1 059 1 058 FTEs as at 30 June (No.) 6.8 6.4 6.7 3.2
(a) The Veterans’ Affairs program transferred from the Department for Communities and Social Inclusion to the Department of Treasury and Finance on 1 July 2014.
Financial commentary
2015–16 Budget/2014–15 Estimated Result
The increase in expenditure is primarily due to:
• expenditure for the Anzac Centenary Memorial Garden Walk project in 2015–16 ($3.0 million)
• expenditure for the Anzac Day Commemorative Council in 2015–16 which was transferred from the Department of the Premier and Cabinet ($0.4 million).
2014–15 Estimated Result/2014–15 Budget
No major variations.
2014–15 Estimated Result/2013–14 Actual
No major variations.
Treasury and Finance
174 2015–16 Agency Statements — Volume 4

Highlights 2014–15
• Establishment of the Anzac Centenary Coordination Unit.
• Development and launch of the Government of South Australia’s Anzac Centenary website.
• Creation of a Flags Fund to enable ex-service organisations to replace/install national flags, state flags or military ensigns.
• Providing grants to support veteran themed projects such as the ‘Huey’ helicopter display in the Port Pirie Returned and Services League (RSL) military museum, the Macclesfield RSL, the War Memorial Garden and the new Anzac Memorial at Moseley Square, Glenelg.
Targets 2015–16
• Completion of the Anzac Centenary Memorial Garden Walk, which is the state’s flagship Anzac Centenary project, subject to co-contributions by the Commonwealth Government and Adelaide City Council.
• Work with SA Health to establish an improved healthcare pathway for the veteran community.
• Develop a regional engagement plan to help educate South Australians about their local military history.
• Work collaboratively to increase contemporary veterans’ engagement with existing ex-service organisations.
Treasury and Finance
2015–16 Agency Statements — Volume 4 175

Treasury and Finance
Statement of comprehensive income______________________________________________________________________________________________________________________________________________________________________________________________________________
2015–16Budget
$000
2014–15Estimated
Result
$000
2014–15Budget
$000
2013–14Actual
$000
Expenses
Employee benefit expenses Salaries, wages, annual and sick leave .........................................................................................................................................................................40 448 43 859 43 636 50 238 Long service leave .........................................................................................................................................................................1 192 1 139 1 410 1 692 Payroll tax .........................................................................................................................................................................1 597 1 801 1 949 2 867 Superannuation .........................................................................................................................................................................4 456 7 130 5 005 6 930 Other .........................................................................................................................................................................2 576 852 2 596 5 316Supplies and services General supplies and services ................................................................................................................................................................................26 139 28 614 31 118 34 938 Consultancy expenses ................................................................................................................................................................................1 788 4 217 1 455 1 577Depreciation and amortisation expenses .........................................................................................................................................................................3 194 2 102 4 092 1 237Borrowing costs .........................................................................................................................................................................404 404 404 —Grants and subsidies .........................................................................................................................................................................3 305 304 29 451Intra-government transfers .........................................................................................................................................................................10 694 10 159 — —Other expenses .........................................................................................................................................................................2 872 2 721 2 905 4 926
Total expenses 98 665 103 302 94 599 110 172
Income
Intra-government transfers ................................................................................................................................................................................184 180 272 307Fees, fines and penalties ................................................................................................................................................................................285 510 473 332Sales of goods and services ................................................................................................................................................................................40 983 39 696 37 573 37 858Interest revenues ................................................................................................................................................................................— 13 — 13Other income ................................................................................................................................................................................699 721 825 4 888
Total income 42 151 41 120 39 143 43 398
Net cost of providing services 56 514 62 182 55 456 66 774
Income from/expenses to state government
Income Appropriation ................................................................................................................................................................................55 722 55 104 49 379 61 265 Other income ................................................................................................................................................................................— 8 632 — 2 752Expenses Cash alignment ................................................................................................................................................................................— 2 737 — 6 108
Net income from/expenses to state government 55 722 60 999 49 379 57 909
Total comprehensive result -792 -1 183 -6 077 -8 865
Treasury and Finance
176 2015–16 Agency Statements — Volume 4

Treasury and Finance
Statement of financial position______________________________________________________________________________________________________________________________________________________________________________________________________________
2015–16Budget
$000
2014–15Estimated
Result
$000
2014–15Budget
$000
2013–14Actual
$000
Assets
Current assets
Cash and cash equivalents .......................................................................................................................................8 675 6 918 1 082 13 723Receivables .......................................................................................................................................4 112 4 063 5 237 4 014
Total current assets 12 787 10 981 6 319 17 737
Non current assets
Land and improvements .......................................................................................................................................285 30 3 —Plant and equipment .......................................................................................................................................2 569 2 038 1 313 1 475Intangible assets .......................................................................................................................................23 868 26 232 28 179 20 955Other non-current assets .......................................................................................................................................33 33 28 33
Total non-current assets 26 755 28 333 29 523 22 463
Total assets 39 542 39 314 35 842 40 200
Liabilities
Current liabilities
Payables .................................................................................................................................................................................8 716 8 645 5 778 8 604Employee benefits Salaries and wages .................................................................................................................................................................................549 353 392 157 Annual leave .................................................................................................................................................................................3 723 3 660 4 654 3 700 Long service leave .................................................................................................................................................................................1 877 1 858 2 026 1 839 Other .................................................................................................................................................................................231 231 318 231Short-term provisions .................................................................................................................................................................................210 205 302 200Other current liabilities .................................................................................................................................................................................140 140 — 140
Total current liabilities 15 446 15 092 13 470 14 871
Non current liabilities
Long-term employee benefits Long service leave ................................................................................................................................................................................11 663 11 017 15 047 10 961Long-term provisions ................................................................................................................................................................................752 732 951 712
Total non-current liabilities 12 415 11 749 15 998 11 673
Total liabilities 27 861 26 841 29 468 26 544
Net assets 11 681 12 473 6 374 13 656
Equity
Contributed capital .......................................................................................................................................547 547 547 547Retained earnings .......................................................................................................................................11 134 11 926 5 827 13 109
Total equity 11 681 12 473 6 374 13 656
Balances as at 30 June end of period.
Treasury and Finance
2015–16 Agency Statements — Volume 4 177

Treasury and Finance
Statement of cash flows______________________________________________________________________________________________________________________________________________________________________________________________________________
2015–16Budget
$000
2014–15Estimated
Result
$000
2014–15Budget
$000
2013–14Actual
$000
Operating activities
Cash outflows
Employee benefit payments ..............................................................................................................................................................................49 277 54 512 53 604 68 889Payments for supplies and services ..............................................................................................................................................................................27 927 32 830 32 573 33 796Interest paid ..............................................................................................................................................................................404 404 404 —Grants and subsidies ..............................................................................................................................................................................3 305 304 29 —GST paid ..............................................................................................................................................................................— — — 6 971Intra-government transfers ..............................................................................................................................................................................10 694 10 159 — —Other payments ..............................................................................................................................................................................2 746 2 599 2 782 4 661
Cash used in operations 94 353 100 808 89 392 114 317
Cash inflows
Intra-government transfers ..........................................................................................................................................................................184 180 272 —Fees, fines and penalties ..........................................................................................................................................................................285 510 473 —Sales of goods and services ..........................................................................................................................................................................40 913 39 627 37 504 39 903Interest received ..........................................................................................................................................................................— 13 — 13GST received ..........................................................................................................................................................................— — — 6 836Other receipts ..........................................................................................................................................................................622 646 750 4 888
Cash generated from operations 42 004 40 976 38 999 51 640
State government
Appropriation ..............................................................................................................................................................................55 722 55 104 49 379 61 265Other receipts ..............................................................................................................................................................................— 8 632 — 2 752Payments Cash alignment ..............................................................................................................................................................................— 2 737 — 6 108
Net cash provided by state government 55 722 60 999 49 379 57 909
Net cash provided by (+)/used in (-) operating activities 3 373 1 167 -1 014 -4 768
Investing activities
Cash outflows
Purchase of property, plant and equipment .......................................................................................................................................1 116 1 650 1 456 849Purchase of intangibles .......................................................................................................................................500 6 322 3 284 2 260
Cash used in investing activities 1 616 7 972 4 740 3 109
Net cash provided by (+)/used in (-) investing activities -1 616 -7 972 -4 740 -3 109
Net increase (+)/decrease (-) in cash equivalents 1 757 -6 805 -5 754 -7 877
Cash and cash equivalents at the start of the period 6 918 13 723 6 836 21 600
Cash and cash equivalents at the end of the period 8 675 6 918 1 082 13 723
Treasury and Finance
178 2015–16 Agency Statements — Volume 4
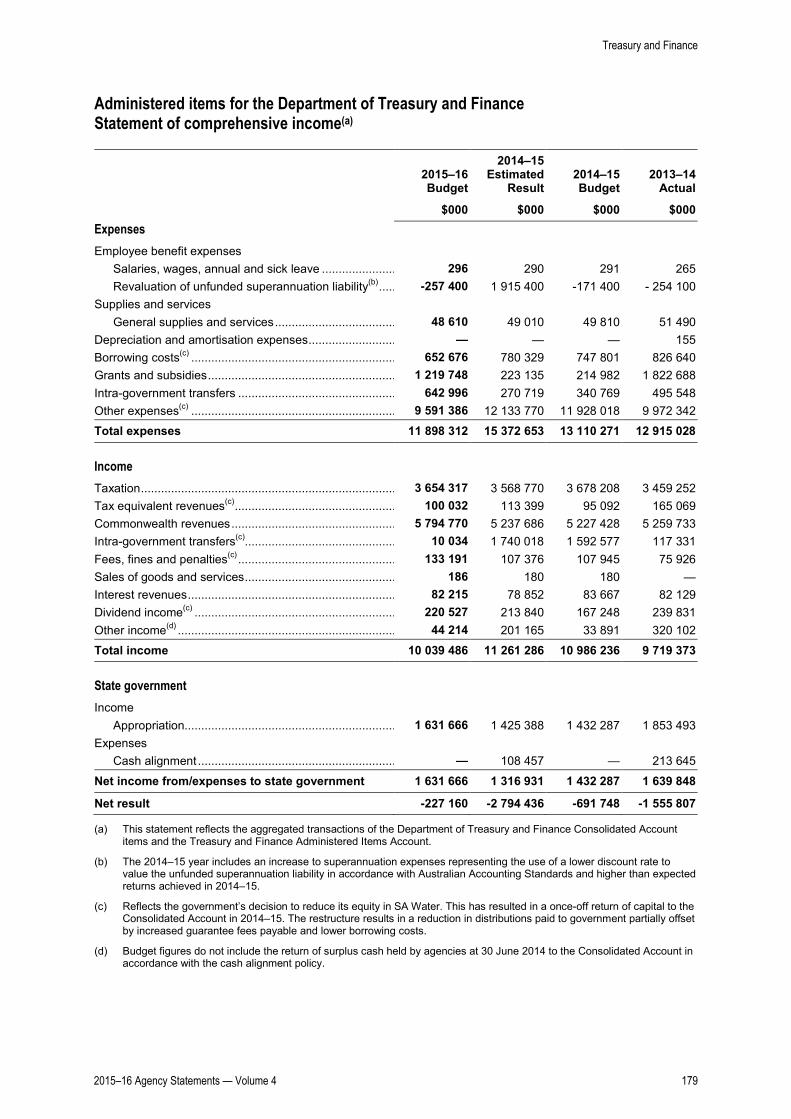
Administered items for the Department of Treasury and Finance Statement of comprehensive income(a)
2015–16 Budget
2014–15 Estimated
Result 2014–15 Budget
2013–14 Actual
$000 $000 $000 $000 Expenses Employee benefit expenses
Salaries, wages, annual and sick leave ...................... 296 290 291 265 Revaluation of unfunded superannuation liability(b) ..... -257 400 1 915 400 -171 400 - 254 100
Supplies and services General supplies and services .................................... 48 610 49 010 49 810 51 490
Depreciation and amortisation expenses .......................... — — — 155 Borrowing costs(c) ............................................................. 652 676 780 329 747 801 826 640 Grants and subsidies ........................................................ 1 219 748 223 135 214 982 1 822 688 Intra-government transfers ............................................... 642 996 270 719 340 769 495 548 Other expenses(c) ............................................................. 9 591 386 12 133 770 11 928 018 9 972 342
Total expenses 11 898 312 15 372 653 13 110 271 12 915 028
Income Taxation ............................................................................ 3 654 317 3 568 770 3 678 208 3 459 252 Tax equivalent revenues(c) ................................................ 100 032 113 399 95 092 165 069 Commonwealth revenues ................................................. 5 794 770 5 237 686 5 227 428 5 259 733 Intra-government transfers(c)............................................. 10 034 1 740 018 1 592 577 117 331 Fees, fines and penalties(c) ............................................... 133 191 107 376 107 945 75 926 Sales of goods and services ............................................. 186 180 180 — Interest revenues .............................................................. 82 215 78 852 83 667 82 129 Dividend income(c) ............................................................ 220 527 213 840 167 248 239 831 Other income(d) ................................................................. 44 214 201 165 33 891 320 102
Total income 10 039 486 11 261 286 10 986 236 9 719 373
State government Income
Appropriation............................................................... 1 631 666 1 425 388 1 432 287 1 853 493 Expenses
Cash alignment ........................................................... — 108 457 — 213 645
Net income from/expenses to state government 1 631 666 1 316 931 1 432 287 1 639 848
Net result -227 160 -2 794 436 -691 748 -1 555 807
(a) This statement reflects the aggregated transactions of the Department of Treasury and Finance Consolidated Account items and the Treasury and Finance Administered Items Account.
(b) The 2014–15 year includes an increase to superannuation expenses representing the use of a lower discount rate to value the unfunded superannuation liability in accordance with Australian Accounting Standards and higher than expected returns achieved in 2014–15.
(c) Reflects the government’s decision to reduce its equity in SA Water. This has resulted in a once-off return of capital to the Consolidated Account in 2014–15. The restructure results in a reduction in distributions paid to government partially offset by increased guarantee fees payable and lower borrowing costs.
(d) Budget figures do not include the return of surplus cash held by agencies at 30 June 2014 to the Consolidated Account in accordance with the cash alignment policy.
Treasury and Finance
2015–16 Agency Statements — Volume 4 179

Administered items for the Department of Treasury and Finance Statement of financial position(a)
2015–16 Budget
2014–15 Estimated
Result 2014–15 Budget
2013–14 Actual
$000 $000 $000 $000
Assets Current assets
Cash and cash equivalents .............................................. 303 196 303 196 350 494 303 196 Receivables ...................................................................... 240 711 235 179 297 783 251 339 Non-current assets held for sale ....................................... 557 557 — 557
Total current assets 544 464 538 932 648 277 555 092
Non-current assets
Financial assets(b) ............................................................. 5 954 111 5 425 377 2 728 833 5 163 963 Land and improvements ................................................... — — 3 708 —
Intangible assets ............................................................... 325 325 325 325
Total non-current assets 5 954 436 5 425 702 2 732 866 5 164 288
Total assets 6 498 900 5 964 634 3 381 143 5 719 380
Liabilities Current liabilities
Payables ........................................................................... 36 150 36 150 36 895 36 150 Short-term borrowings ...................................................... 5 110 355 4 246 505 3 887 153 2 912 266 Employee benefits
Superannuation........................................................... 430 400 413 900 433 300 416 600 Other current liabilities ...................................................... 30 153 30 153 30 145 —
Total current liabilities 5 607 058 4 726 708 4 387 493 3 365 016
Non-current liabilities
Long-term borrowings(b) .................................................... 5 094 643 4 919 577 5 398 803 7 877 060 Long-term employee benefits
Superannuation........................................................... 12 089 600 12 399 200 9 927 100 10 460 200
Total non-current liabilities 17 184 243 17 318 777 15 325 903 18 337 260
Total liabilities 22 791 301 22 045 485 19 713 396 21 702 276
Net assets -16 292 401 -16 080 851 -16 332 253 -15 982 896
Equity Retained earnings ............................................................ -16 292 401 -16 080 851 -16 332 253 -15 982 896
Total equity -16 292 401 -16 080 851 -16 332 253 -15 982 896
(a) This statement reflects the aggregated transactions of the Department of Treasury and Finance Consolidated Account Items and the Treasury and Finance Administered Items Account. The balances are reported as at 30 June end of period.
(b) Reflects the government’s decision to reduce its equity in SA Water. This has resulted in a once-off return of capital to the Consolidated Account in 2014–15. The return of capital results in a reduction in the Treasurer’s borrowing requirements and associated interest expense.
Treasury and Finance
180 2015–16 Agency Statements — Volume 4

Administered items for the Department of Treasury and Finance Consolidated Account items Statement of cash flows
2015–16 Budget
2014–15 Estimated
Result 2014–15 Budget
2013–14 Actual
$000 $000 $000 $000
Operating activities Cash inflows
Taxation Contribution from Casino Operations(a) .......................... 20 750 19 495 28 000 9 465 Contribution from SA Lotteries ....................................... 78 502 74 539 75 072 73 048 Land tax ......................................................................... 580 331 563 533 577 433 571 612 Commonwealth places mirror land tax(b) ........................ 1 400 1 400 1 400 1 381 Other taxes on property ................................................. — 102 10 42 Payroll tax ...................................................................... 1 418 278 1 341 851 1 396 341 1 300 805 Commonwealth places mirror payroll tax(b) .................... 24 800 23 400 24 400 22 756 Stamp duties .................................................................. 1 526 117 1 541 784 1 543 291 1 493 514 Commonwealth places mirror stamp duties(b) ................ 300 300 300 931 Transport Development Levy(c) ...................................... — — 29 159 —
Commonwealth receipts Commonwealth general purpose grants
GST revenue grants ................................................. 5 517 500 5 020 000 4 956 300 4 646 819 Commonwealth specific purpose grants
Council of Australian Governments funding arrangements(d) ........................................... 276 770 248 237 271 128 607 823 Natural disaster relief and recovery arrangements ........................................................... 500 3 149 — —
Interest receipts
Interest on investments .................................................. 78 959 76 587 79 953 70 800 Interest recoveries ......................................................... 3 256 2 265 3 714 6 904
Dividends and distributions Adelaide Convention Centre
Dividend ................................................................... — 920 — 1 094 Income tax equivalent .............................................. — 613 — 1 407
Adelaide Entertainment Centre Dividend ................................................................... — 5 000 — —
Arrangements with private electricity entities Local government rate equivalent ............................ 239 232 237 226
Department of Planning, Transport and Infrastructure
Income tax equivalent .............................................. 2 614 2 623 2 623 344 Local government rate equivalent ............................ 991 966 1 103 605
Flinders Ports Payment in lieu of other taxes .................................. 2 498 2 437 2 437 4 682
Funds SA Local government rate equivalent ............................ 221 215 215 210
HomeStart Finance Dividend ................................................................... 10 862 6 584 7 387 7 176 Income tax equivalent .............................................. 4 623 4 703 5 277 5 017
Treasury and Finance
2015–16 Agency Statements — Volume 4 181
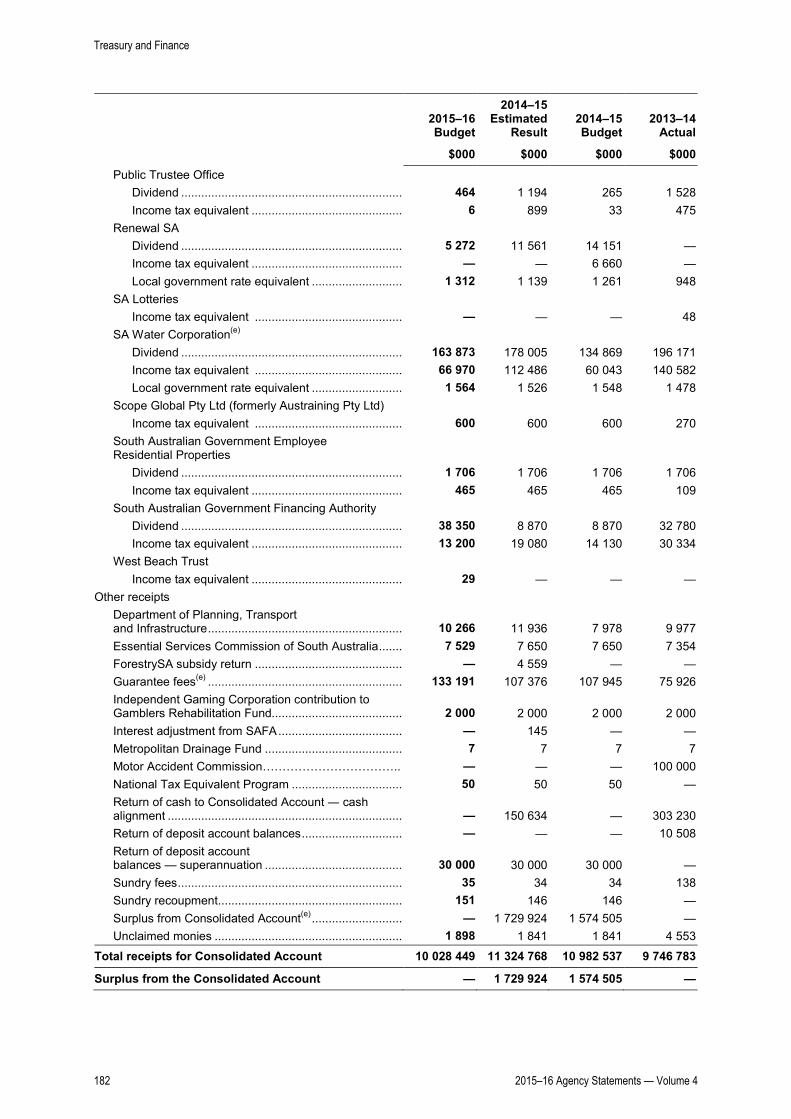
2015–16 Budget
2014–15 Estimated
Result 2014–15 Budget
2013–14 Actual
$000 $000 $000 $000 Public Trustee Office
Dividend ................................................................... 464 1 194 265 1 528 Income tax equivalent .............................................. 6 899 33 475
Renewal SA Dividend ................................................................... 5 272 11 561 14 151 — Income tax equivalent .............................................. — — 6 660 — Local government rate equivalent ............................ 1 312 1 139 1 261 948
SA Lotteries Income tax equivalent ............................................. — — — 48
SA Water Corporation(e) Dividend ................................................................... 163 873 178 005 134 869 196 171 Income tax equivalent ............................................. 66 970 112 486 60 043 140 582 Local government rate equivalent ............................ 1 564 1 526 1 548 1 478
Scope Global Pty Ltd (formerly Austraining Pty Ltd) Income tax equivalent ............................................. 600 600 600 270
South Australian Government Employee Residential Properties
Dividend ................................................................... 1 706 1 706 1 706 1 706 Income tax equivalent .............................................. 465 465 465 109
South Australian Government Financing Authority Dividend ................................................................... 38 350 8 870 8 870 32 780 Income tax equivalent .............................................. 13 200 19 080 14 130 30 334
West Beach Trust Income tax equivalent .............................................. 29 — — —
Other receipts Department of Planning, Transport and Infrastructure ........................................................... 10 266 11 936 7 978 9 977 Essential Services Commission of South Australia ........ 7 529 7 650 7 650 7 354 ForestrySA subsidy return ............................................. — 4 559 — — Guarantee fees(e) ........................................................... 133 191 107 376 107 945 75 926 Independent Gaming Corporation contribution to Gamblers Rehabilitation Fund........................................ 2 000 2 000 2 000 2 000 Interest adjustment from SAFA ...................................... — 145 — — Metropolitan Drainage Fund .......................................... 7 7 7 7 Motor Accident Commission…………………………….. — — — 100 000 National Tax Equivalent Program .................................. 50 50 50 — Return of cash to Consolidated Account ― cash alignment ....................................................................... — 150 634 — 303 230 Return of deposit account balances ............................... — — — 10 508 Return of deposit account balances — superannuation .......................................... 30 000 30 000 30 000 — Sundry fees .................................................................... 35 34 34 138 Sundry recoupment ........................................................ 151 146 146 — Surplus from Consolidated Account(e) ............................ — 1 729 924 1 574 505 — Unclaimed monies ......................................................... 1 898 1 841 1 841 4 553
Total receipts for Consolidated Account 10 028 449 11 324 768 10 982 537 9 746 783
Surplus from the Consolidated Account — 1 729 924 1 574 505 —
Treasury and Finance
182 2015–16 Agency Statements — Volume 4

2015–16 Budget
2014–15 Estimated
Result 2014–15 Budget
2013–14 Actual
$000 $000 $000 $000
Cash outflows
Employee benefit payments Minister's salary, electorate and expense allowance ..... 296 290 291 265
Grants, subsidies and transfers First Home Owner Grants .............................................. 38 833 44 441 39 804 72 554 Payments to fund Consolidated Account(e) .................... 1 040 693 — — 1 540 534
Total payments appropriated under various acts 39 129 44 731 40 095 72 819
Total payments funded by borrowings 1 040 693 — — 1 540 534
Investing activities
Cash inflows Repayment of advances
Administered items for the Department of Planning, Transport and Infrastructure .......................................... 209 209 209 255 Department for Health and Ageing ................................. 2 681 2 773 — 1 347 Department of Primary Industries and Regions ............. 3 300 12 650 3 726 5 790 Renmark Irrigation Trust ................................................ 75 205 72 — Royal Zoological Society of South Australia .................. 240 230 229 219 South Australian Housing Trust ..................................... — — — 109 702 Other recoveries ............................................................ — — 7 7
Return of capital HomeStart Finance ........................................................ 15 610 — — — SA Water Corporation .................................................... — 2 700 000 2 700 000 —
Total receipts for Consolidated Account 22 115 2 716 067 2 704 243 117 320
Financing activities
Cash inflows Borrowings
Borrowings to fund Consolidated Account(e) .................. 1 040 693 — — 1 540 534 Other
Deposits with South Australian Government Financing Authority ......................................................................... — — — 195 814 Deposits with Treasurer ................................................. 863 850 1 334 238 708 326 —
Total borrowings 1 040 693 — — 1 540 534
Total receipts re cash and deposits 863 850 1 334 238 708 326 195 814
Cash outflows
Repayment of borrowings South Australian Government Financing Authority(e) ..... — 1 729 924 1 574 505 —
Other payments Deposits with South Australian Government Financing Authority ......................................................................... 863 850 1 334 238 708 326 — Deposits with Treasurer ................................................. — — — 195 814
Total payments funded by Consolidated Account Surplus — 1 729 924 1 574 505 —
Treasury and Finance
2015–16 Agency Statements — Volume 4 183
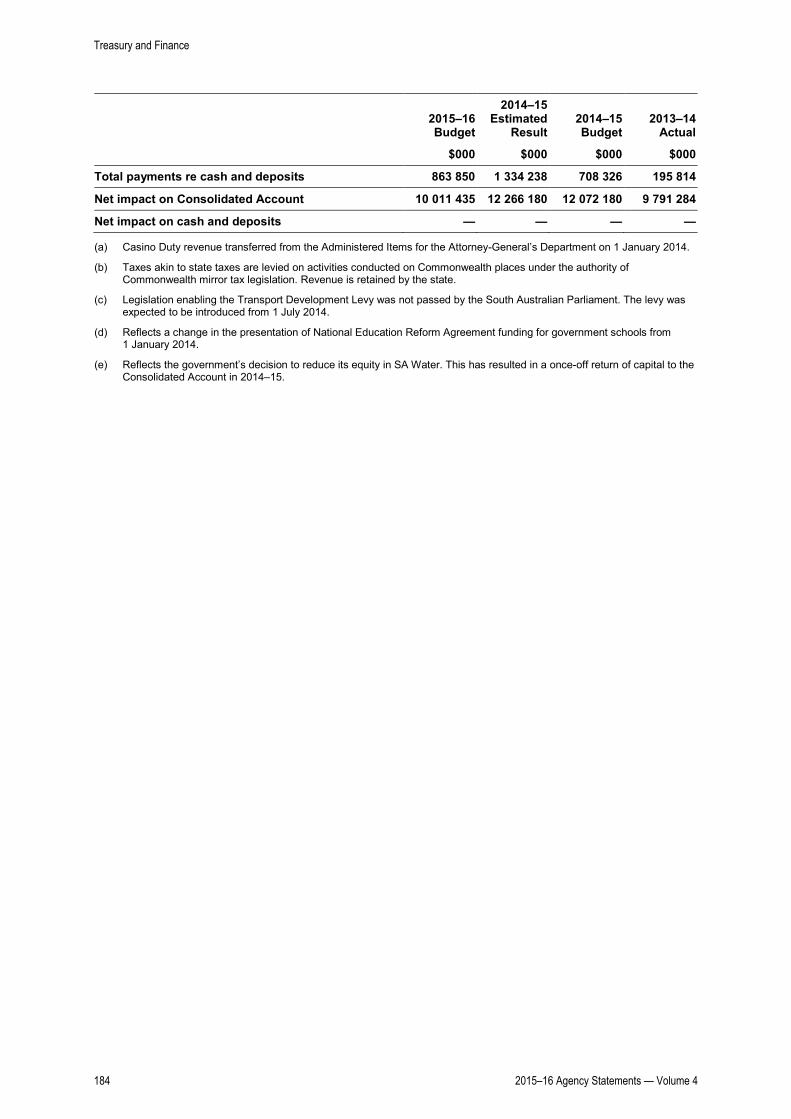
2015–16 Budget
2014–15 Estimated
Result 2014–15 Budget
2013–14 Actual
$000 $000 $000 $000
Total payments re cash and deposits 863 850 1 334 238 708 326 195 814
Net impact on Consolidated Account 10 011 435 12 266 180 12 072 180 9 791 284
Net impact on cash and deposits — — — —
(a) Casino Duty revenue transferred from the Administered Items for the Attorney-General’s Department on 1 January 2014.
(b) Taxes akin to state taxes are levied on activities conducted on Commonwealth places under the authority of Commonwealth mirror tax legislation. Revenue is retained by the state.
(c) Legislation enabling the Transport Development Levy was not passed by the South Australian Parliament. The levy was expected to be introduced from 1 July 2014.
(d) Reflects a change in the presentation of National Education Reform Agreement funding for government schools from 1 January 2014.
(e) Reflects the government’s decision to reduce its equity in SA Water. This has resulted in a once-off return of capital to the Consolidated Account in 2014–15.
Treasury and Finance
184 2015–16 Agency Statements — Volume 4

Administered items for the Department of Treasury and Finance Treasury and Finance Administered Items Account Statement of cash flows
2015–16 Budget
2014–15 Estimated
Result 2014–15 Budget
2013–14 Actual
$000 $000 $000 $000
Operating activities Cash outflows
Employee benefit payments Past service superannuation payments ......................... 413 900 416 600 416 600 422 100 Police superannuation, guaranteed minimum retirement benefit ........................................................... 1 000 1 000 1 000 —
Payments for supplies and services National Tax Equivalent Program .................................. 60 60 60 1 Repayment of unclaimed monies ................................... 350 350 350 458 State share of GST administration costs ........................ 48 200 48 600 49 400 51 030
Interest paid Interest paid on deposit accounts and other monies ...... 39 866 30 779 41 870 25 720 Interest on borrowings(a)................................................. 234 610 312 050 263 031 333 963
Grants, subsidies and transfers Adelaide Convention Centre .......................................... 18 108 13 604 13 222 9 158 Building Indemnity Insurance……………………………. 2 097 1 000 865 — Charitable and Social Welfare Fund .............................. 4 000 4 000 4 000 4 000 Community Development Fund...................................... 20 000 20 000 20 000 20 000 Community Support Grants……………………………… 150 150 150 70 Community Wastewater Management Schemes (benefits to households in goods and services) ............. 4 004 3 906 3 906 3 811 Consumer Advocacy and Research Fund ..................... 272 263 262 256 Contingency provisions — employee entitlements ......... 86 212 81 987 66 336 233 010 Contingency provisions — investing contingencies ....... 125 380 11 426 23 172 10 683 Contingency provisions — supplies and services .......... 306 991 59 915 138 867 36 474 Department for Communities and Social Inclusion ........ 3 845 3 845 3 845 3 845 Department of Environment, Water and Natural Resources ...................................................................... 162 158 158 155 Department for Manufacturing, Innovation, Trade, Resources and Energy(b)................................................ — — — 8 918 Department of State Development(b) .............................. 9 328 9 234 9 134 — Department of Treasury and Finance ............................ 279 272 272 266 Donation to New South Wales Bushfires Relief ............. — — — 250 Donation to Philippines Typhoon Appeal ....................... — — — 350 Donation to Zahra Foundation ....................................... — 60 — — Emergency Services Agencies Funding ........................ — — — 7 300 Emergency services levy — land and business regulations ...................................................... 269 262 262 255 Emergency services levy remissions ............................. 24 153 21 486 19 955 95 835 Essential Services Commission of South Australia ........ 330 384 346 234 Fire damage and insurance costs (SAICORP Fund No. 2) .................................................................... 7 000 — 7 000 — First Home Owners Bonus(c) .......................................... — — — 542 ForestrySA ..................................................................... 3 499 4 385 4 530 16 092
Treasury and Finance
2015–16 Agency Statements — Volume 4 185

2015–16 Budget
2014–15 Estimated
Result 2014–15 Budget
2013–14 Actual
$000 $000 $000 $000 Gamblers Rehabilitation Fund........................................ 2 000 2 000 2 000 2 000 Housing Construction Grant(c) ........................................ — 28 000 21 300 49 894 Industry Financial Assistance Account ........................... 700 700 7 25 340 Metropolitan drainage systems maintenance ................. 976 1 116 1 152 1 855 Ministerial council on gambling ...................................... — — — 50 Renewal SA .................................................................. 9 596 20 692 20 573 21 101 Residual electricity entities ............................................. 500 500 500 500 Riverbank Precinct Authority .......................................... 716 699 — — SA Lotteries ................................................................... 2 605 4 850 4 950 4 680 SA Water Corporation .................................................... 116 168 116 011 112 769 112 808 Seniors Housing Grant(d) ................................................ 4 200 640 7 000 — Small Business Payroll Tax Rebate ............................... 11 300 10 400 11 100 9 812 South Australian Motor Sport Board .............................. 11 785 11 181 10 991 9 707 Sport and Recreation Fund ............................................ 3 500 3 500 3 500 3 500 State Procurement Board .............................................. 439 428 428 418 Support services to parliamentarians ............................. 23 320 23 281 22 622 22 048 Treasurers Interest in the National Wine Centre ............ — 740 — —
Other payments Other payments ............................................................. 50 50 50 348 Overpayment of income tax equivalent .......................... — 901 — — Payments to the South Australian Superannuation Fund .................................................... 30 000 30 000 30 000 — Refunds and remissions ................................................ 118 14 653 118 88 909
Cash used in operations 1 572 038 1 316 118 1 337 653 1 637 746
State government Appropriation 1 592 537 1 380 657 1 392 192 1 780 673 Payments
Cash alignment .............................................................. — 108 457 — 213 645
Net cash provided by state government 1 592 537 1 272 200 1 392 192 1 567 028
Net cash provided by (+)/used in (-) operating activities 20 499 -43 918 54 539 -70 718
Investing activities Cash outflows Other payments Advances granted Department of Primary Industries and Regions ................. — 35 000 25 000 2 147 Equity capital contributions South Australian Housing Trust ......................................... 18 722 27 762 27 762 37 316
Cash used in investing activities 18 722 62 762 52 762 39 463
Net cash provided by (+)/used in (-) investing activities -18 722 -62 762 -52 762 -39 463
Treasury and Finance
186 2015–16 Agency Statements — Volume 4
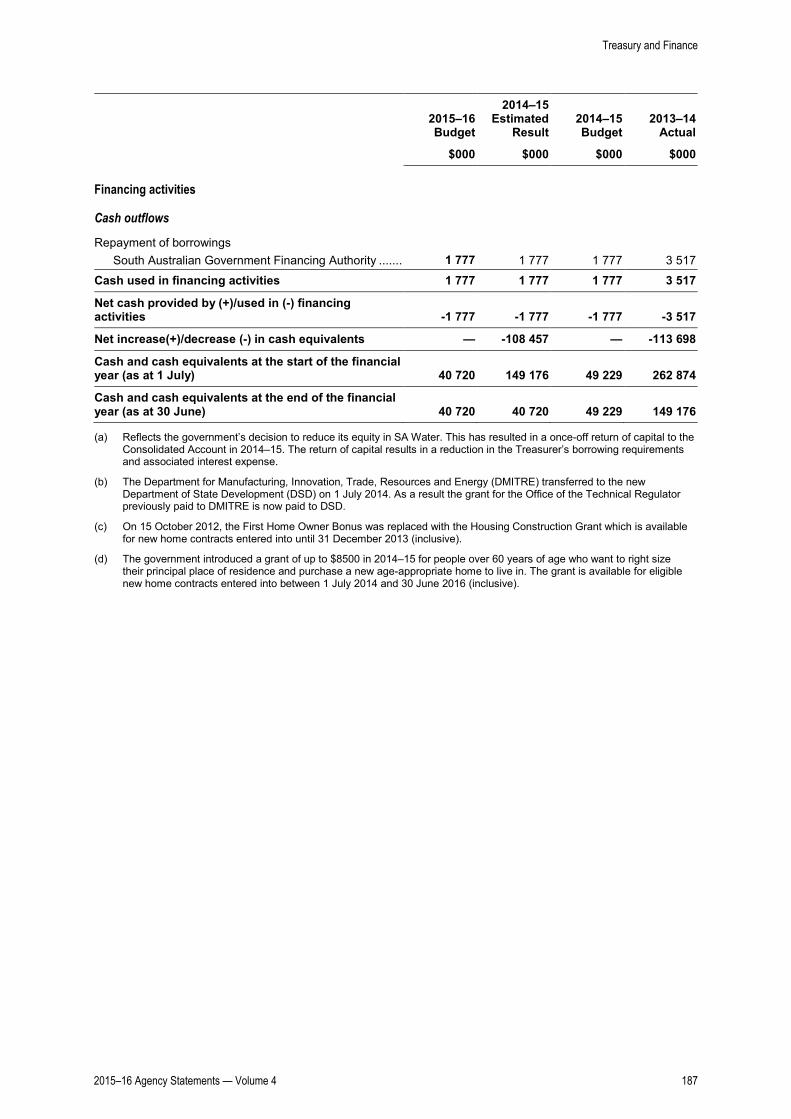
2015–16 Budget
2014–15 Estimated
Result 2014–15 Budget
2013–14 Actual
$000 $000 $000 $000
Financing activities
Cash outflows
Repayment of borrowings South Australian Government Financing Authority ........ 1 777 1 777 1 777 3 517
Cash used in financing activities 1 777 1 777 1 777 3 517
Net cash provided by (+)/used in (-) financing activities -1 777 -1 777 -1 777 -3 517
Net increase(+)/decrease (-) in cash equivalents — -108 457 — -113 698
Cash and cash equivalents at the start of the financial year (as at 1 July) 40 720 149 176 49 229 262 874
Cash and cash equivalents at the end of the financial year (as at 30 June) 40 720 40 720 49 229 149 176
(a) Reflects the government’s decision to reduce its equity in SA Water. This has resulted in a once-off return of capital to the Consolidated Account in 2014–15. The return of capital results in a reduction in the Treasurer’s borrowing requirements and associated interest expense.
(b) The Department for Manufacturing, Innovation, Trade, Resources and Energy (DMITRE) transferred to the new Department of State Development (DSD) on 1 July 2014. As a result the grant for the Office of the Technical Regulator previously paid to DMITRE is now paid to DSD.
(c) On 15 October 2012, the First Home Owner Bonus was replaced with the Housing Construction Grant which is available for new home contracts entered into until 31 December 2013 (inclusive).
(d) The government introduced a grant of up to $8500 in 2014–15 for people over 60 years of age who want to right size their principal place of residence and purchase a new age-appropriate home to live in. The grant is available for eligible new home contracts entered into between 1 July 2014 and 30 June 2016 (inclusive).
Treasury and Finance
2015–16 Agency Statements — Volume 4 187
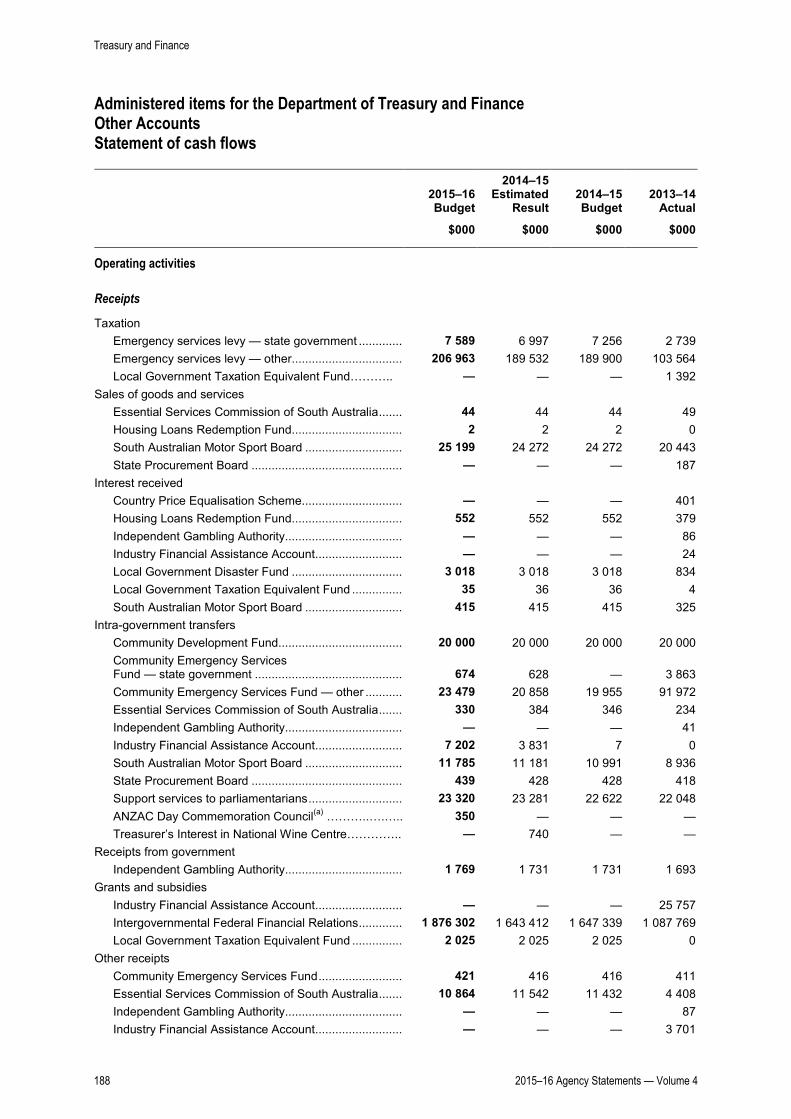
Administered items for the Department of Treasury and Finance Other Accounts Statement of cash flows
2015–16 Budget
2014–15 Estimated
Result 2014–15 Budget
2013–14 Actual
$000 $000 $000 $000
Operating activities
Receipts
Taxation Emergency services levy — state government .............. 7 589 6 997 7 256 2 739 Emergency services levy — other .................................. 206 963 189 532 189 900 103 564 Local Government Taxation Equivalent Fund……….. — — — 1 392
Sales of goods and services Essential Services Commission of South Australia ........ 44 44 44 49 Housing Loans Redemption Fund .................................. 2 2 2 0 South Australian Motor Sport Board .............................. 25 199 24 272 24 272 20 443 State Procurement Board .............................................. — — — 187
Interest received Country Price Equalisation Scheme ............................... — — — 401 Housing Loans Redemption Fund .................................. 552 552 552 379 Independent Gambling Authority .................................... — — — 86 Industry Financial Assistance Account ........................... — — — 24 Local Government Disaster Fund .................................. 3 018 3 018 3 018 834 Local Government Taxation Equivalent Fund ................ 35 36 36 4 South Australian Motor Sport Board .............................. 415 415 415 325
Intra-government transfers Community Development Fund...................................... 20 000 20 000 20 000 20 000 Community Emergency Services Fund — state government ............................................. 674 628 — 3 863 Community Emergency Services Fund — other ............ 23 479 20 858 19 955 91 972 Essential Services Commission of South Australia ........ 330 384 346 234 Independent Gambling Authority .................................... — — — 41 Industry Financial Assistance Account ........................... 7 202 3 831 7 0 South Australian Motor Sport Board .............................. 11 785 11 181 10 991 8 936 State Procurement Board .............................................. 439 428 428 418 Support services to parliamentarians ............................. 23 320 23 281 22 622 22 048 ANZAC Day Commemoration Council(a) ………..….….. 350 — — — Treasurer’s Interest in National Wine Centre………….. — 740 — —
Receipts from government Independent Gambling Authority .................................... 1 769 1 731 1 731 1 693
Grants and subsidies Industry Financial Assistance Account ........................... — — — 25 757 Intergovernmental Federal Financial Relations .............. 1 876 302 1 643 412 1 647 339 1 087 769 Local Government Taxation Equivalent Fund ................ 2 025 2 025 2 025 0
Other receipts Community Emergency Services Fund .......................... 421 416 416 411 Essential Services Commission of South Australia ........ 10 864 11 542 11 432 4 408 Independent Gambling Authority .................................... — — — 87 Industry Financial Assistance Account ........................... — — — 3 701
Treasury and Finance
188 2015–16 Agency Statements — Volume 4

2015–16 Budget
2014–15 Estimated
Result 2014–15 Budget
2013–14 Actual
$000 $000 $000 $000
South Australian Motor Sport Board .............................. — — — 1 367 Support services to parliamentarians ............................. — — — 26 Treasurer’s Interest in National Wine Centre ................. 4 3 3 25
Total receipts 2 222 781 1 965 328 1 962 790 1 403 183
Payments Employee benefit payments
Essential Services Commission of South Australia ........ 3 419 3 279 3 241 3 169 Independent Gambling Authority .................................... 974 955 955 936 South Australian Motor Sport Board .............................. 1 531 1 502 1 502 1 537 State Procurement Board .............................................. 40 39 39 67 Support services to parliamentarians ............................. 16 183 15 783 15 727 15 532
Payments for supplies and services Essential Services Commission of South Australia ........ 1 803 1 824 1 879 1 811 Housing Loans Redemption Fund .................................. 24 23 23 0 Independent Gambling Authority .................................... 787 768 768 598 South Australian Motor Sport Board .............................. 37 238 35 808 35 615 32 141 State Procurement Board .............................................. 392 383 383 639 Support services to parliamentarians ............................. 6 939 7 109 6 776 5 982 Treasurer’s Interest in National Wine Centre ................. 42 781 41 37 ANZAC Day Commemoration Council (a)………..….….. 10 — — —
Intra-government transfers Community Development Fund...................................... 20 000 20 000 20 000 20 000 Community Emergency Services Fund .......................... 239 126 218 429 217 527 202 548 Essential Services Commission of South Australia ........ 7 529 7 650 7 650 100 Intergovernmental Federal Financial Relations .............. 1 874 887 1 650 289 1 662 990 1 191 033
Grants and subsidies Independent Gambling Authority………..….…..…..….. — — — 14 Industry Financial Assistance Account ........................... 7 202 17 357 7 13 284 Local Government Disaster Fund .................................. 1 538 4 133 1 500 847 Local Government Taxation Equivalent Fund ................ 2 060 2 060 2 060 1 398 ANZAC Day Commemoration Council(a) ........................ 340 — — —
Payments to government Intergovernmental Federal Financial Relations .............. 24 584 39 553 31 704 —
Other payments Essential Services Commission of South Australia ........ 7 6 7 18 Independent Gambling Authority .................................... 8 8 8 7 Industry Financial Assistance Account ........................... — — — 2 715 Local Government Disaster Fund .................................. 145 145 145 — South Australian Motor Sport Board .............................. 38 32 37 334 State Procurement Board .............................................. 6 6 6 — Support services to parliamentarians ............................. 23 22 22 1
Total payments 2 246 875 2 027 944 2 010 612 1 494 748
Net cash provided by operating activities -24 094 -62 616 -47 822 -91 565
Treasury and Finance
2015–16 Agency Statements — Volume 4 189

2015–16 Budget
2014–15 Estimated
Result 2014–15 Budget
2013–14 Actual
$000 $000 $000 $000
Investing activities Receipts Proceeds from other financial assets
South Australian Motor Sport Board .............................. — — — 850 Sale of plant and equipment
South Australian Motor Sport Board ...................... — — — 5
Total receipts — — — 855
Payments Purchase of plant and equipment
Essential Services Commission of South Australia ........ 370 390 160 461 Independent Gambling Authority .................................... — 140 — 88 South Australian Motor Sport Board .............................. 350 670 350 511 Support services to parliamentarians ............................. — 772 230 83 Treasurer’s Interest in National Wine Centre ................. 0 772 230 83
— — — 7 Purchase of intangible assets
Essential Services Commission of South Australia ............................................... 370
— — — 41 Granted other financial assets
Industry Financial Assistance Account .................................................................. 370
0 0 0 41
— 1 000 — —
Total payments 720 2 972 740 1 191
Net cash provided by investing activities -720 -2 972 -740 -336 Financing activities Cash inflows Cash transfers from restructuring activities
ANZAC Day Commemoration Fund(a) ............................ 28 — — —
Cash generated from financing activities 28 — — —
Net increase (+)/decrease (-) in cash equivalents -24 786 -65 588 -48 562 -91 901
(a) The ANZAC Day Commemoration Council transferred from the Department of the Premier and Cabinet to the Department of Treasury and Finance on 1 July 2015.
Treasury and Finance
190 2015–16 Agency Statements — Volume 4
Summary of major variations
The following commentary relates to variations between the 2015–16 Budget and the 2014–15 Estimated Result.
Controlled items
Statement of comprehensive income — controlled
Expenses
The $4.6 million decrease in expenses is primarily due to:
• a reduction in expenditure relating to the CTP Insurance Market Reform project ($3.5 million)
• a reduction in expenditure relating to the RISTEC project ($2.1 million)
• a reduction in expenditure relating to the divestment of commercial properties in the Adelaide central business district, specifically the State Administration Precinct ($2.0 million)
• a reduction in expenditure relating to the Tax Reform Review project ($1.7 million)
• a reduction in expenditure relating to the Land Services Group project ($0.5 million)
partially offset by
• an increase in expenditure for the Anzac Centenary Memorial Garden Walk project ($3.0 million)
• a realignment of the depreciation expense charged for the useful life of fixed assets in 2014–15 ($1.0 million)
• an increase in expenditure for the Anzac Day Commemorative Council which was transferred from the Department of the Premier and Cabinet ($0.4 million).
Income
No major variations.
Statement of financial position — controlled
No major variations.
Statement of cash flows — controlled
The movements in cash outflows and inflows are generally consistent with the changes discussed above under the statement of comprehensive income and the statement of financial position.
Administered items
The administered items for the Department of Treasury and Finance include Consolidated Account items, special deposit accounts and the assets and liabilities held on behalf of the state by the Treasurer. The more significant assets and liabilities include cash and deposits at call, loans made to other government entities, past superannuation liabilities and borrowings. For presentation purposes, three cash flow statements have been prepared: Consolidated Account items, Treasury and Finance Administered Items Account, and Other Accounts. This format has been used to provide clarity given the volume of items administered by the department.
Treasury and Finance
2015–16 Agency Statements — Volume 4 191

The Consolidated Account items cash flow statement presents administered receipts collected on behalf of the government and paid to the Consolidated Account. The statement also includes administered payments that are funded by specific appropriation authorised in various Acts.
The Treasury and Finance Administered Items Account cash flow statement presents payments administered on behalf of the government and funded by appropriation authorised in the annual Appropriation Act.
The Other accounts cash flow statement presents the receipts and payments for the remaining special deposit accounts administered by the department.
Statement of Comprehensive Income
Expenses
Material variances arise from:
• lower employee benefit expenses in 2015–16 as the 2014–15 year included an increase to superannuation expenses representing the use of a lower discount rate to value the unfunded superannuation liability in accordance with Australian Accounting Standards and higher than expected returns achieved in 2014–15.
• lower than budgeted borrowing costs in 2015–16 due to a reduction in borrowings. This is the result of a once-off return of capital to the Consolidated Account in 2014–15 from SA Water. The return of capital results in a reduction in the Treasurer's borrowing requirements.
• increased grants and subsidies in 2015–16 compared to 2014–15. The 2014–15 result reflects a surplus in the Consolidated Account, arising largely from the $2.7 billion capital return to Consolidated Account from SA Water.
• lower other expenses in 2015–16 compared to 2014–15. Other expenses are higher in 2014–15 due to a once-off payment of a return of capital to the Consolidated Account in 2014–15.
Income
Material variances arise from:
• tax equivalent revenues — reflecting lower payments from SA Water resulting from a change in gearing.
• Commonwealth revenues — reflecting higher GST revenue grants in 2015–16 as a result of growth in the GST pool and South Australia’s grant share.
• higher intra-government transfers in 2014–15 reflecting a surplus to the Consolidated Account in 2014–15 arising as a consequence of the $2.7 billion return of capital from SA Water.
• higher fees, fines and penalties charges due to an increase in the guarantee fees as a result of increased borrowings by SA Water.
• increased dividend income due to a special dividend of $30 million which represents return of excess capital in the South Australian Government Financing Authority’s (SAFA’s) fleet business and treasury operations. It is also reflects an increased dividend from HomeStart Finance in 2015–16.
• other income reflecting a return of surplus cash held by agencies at 30 June 2014 to the Consolidated Account in 2014–15 in accordance with the cash alignment policy.
Treasury and Finance
192 2015–16 Agency Statements — Volume 4
Statement of financial position
Non-current assets
Material variances arise from:
• financial assets—increase in 2014–15 Estimated Result from 2014–15 Budget. The 2014–15 Budget incorrectly recognised the impact of the reduction in the Government’s share of the net assets of SA Water as a reduction to the financial assets of DTF Administered items. This asset is not considered to be administered by DTF. The reduction in the financial asset and equity in other public sector entities has been correctly included in the consolidated general government statement of financial position and the 2014–15 Estimated Result for DTF. The Administered Items has been adjusted accordingly.
Statement of cash flows — Consolidated Account
Operating activities
Material variances arise from:
• taxation measures, including:
– higher payroll tax collections—reflecting growth in taxable payrolls.
– higher land tax due to growth in site values.
– lower stamp duties reflecting tax reform measures introduced by the government in 2015–16.
• Commonwealth receipts arising from higher GST revenue grants in 2015–16 due to growth in the GST pool and South Australia’s grant share.
• dividends and distributions, including:
– higher distributions from SAFA in 2015–16 due to a special dividend of $30 million which represents return of excess capital in SAFA’s fleet business and treasury operations
– lower distributions from Renewal SA in 2015–16 due to the change in special dividends associated with the anticipated return of net proceeds from the sale of its commercial properties
– lower distributions from SA Water in 2015–16 due to higher borrowing and operating costs
– higher distributions from HomeStart Finance from an increased dividend payment in 2015–16
• other receipts, including:
– higher guarantee fees primarily as a result of increased borrowings by SA Water
– the return of cash to the Consolidated Account in 2014–15 in accordance with the cash alignment policy
– a surplus in the Consolidated Account, in 2014–15 arising largely as a result of the $2.7 billion return of capital from SA Water.
Investing activities
Material variances arise from the:
• return of capital — reflecting a once-off return of capital by HomeStart Finance in 2015–16 and a once-off return of capital by the SA Water Corporation in 2014–15.
Treasury and Finance
2015–16 Agency Statements — Volume 4 193

Statement of cash flows — Treasury and Finance Administered Item
Operating activities
Material variances arise from:
• employee benefit payments — past service superannuation payments reduce as a consequence of better than expected returns on fund assets in 2014–15
• interest on borrowings — lower interest payments on the Treasurer’s debt in 2015–16 reflecting a reduction in debt due to the return of capital by SA Water
• grants, subsidies and transfers, including:
– higher provisions — supplies and services and investing
– lower Housing Construction Grant — reflecting the expiration of the grant on 31 December 2013. Payments in 2014–15 reflect the processing of residual applications as there is a lag between a new home contract being entered into and the payment of the grant
– Seniors Housing Grant — reflects the introduction of the grant for new home contracts entered into between 1 July 2014 and 30 June 2016 (inclusive). The variation in the estimated result reflects revised expectations about the timing of grant payments
– lower community service obligation payments by Renewal SA associated with Tonsley Park development
– lower operational costs in SA Lotteries
– higher refunds and remissions in 2014–15 Estimated Result, reflecting a once-off ex-gratia tax relief.
Investing activities
Material variances arise from:
• other payments:
– higher payments to the Department of Primary Industries and Regions in the 2014–15 Estimated Result and 2014–15 Budget resulting from the Farm Finance Concessional Loan Scheme
• lower equity contributions to the South Australia Housing Trust in 2015–16 in line with Commonwealth revenues associated with the National Partnership Agreement for Remote Indigenous Housing.
Statement of cash flows — other accounts
Operating activities
Receipts
Material variances arise from:
• taxation — an increase in receipts is due to a higher funding requirement for emergency services in 2015–16 which are raised as part of the Emergency Services Levy
• grants and subsidies — an increase in receipts is due to increased payments from the Commonwealth for scheduled transport infrastructure (primarily the North-South Corridor).
Treasury and Finance
194 2015–16 Agency Statements — Volume 4

Payments
Material variances arise from:
• intra-government transfers — an increase in payments is due to increased payments for scheduled transport infrastructure (primarily related to the North-South Corridor)
• grants and subsidies — a decrease in payments due to the carryover of unspent funds from 2013–14 to 2014–15 for the Industry Financial Assistance Account
• payments to government — a decrease in payments due to a reclassification of the education funding from the Commonwealth Government for government schools.
Treasury and Finance
2015–16 Agency Statements — Volume 4 195

Treasury and Finance
196 2015–16 Agency Statements — Volume 4

Agency: Zero Waste SA
Minister for Sustainability, Environment and Conservation
2015–16 Agency Statements — Volume 4 197

Zero Waste
198 2015–16 Agency Statements — Volume 4
Contents
Overview ........................................................................................................................................ 200 Ministerial responsibilities .............................................................................................................. 200 Workforce summary ...................................................................................................................... 200 Program net cost of services summary ......................................................................................... 201 Program 1: Waste Reduction and Resource Recovery ............................................................. 202 Financial statements ..................................................................................................................... 205 Summary of major variations......................................................................................................... 208
Zero Waste
2015–16 Agency Statements — Volume 4 199

Overview
The Office of Zero Waste SA will cease to operate on 30 June 2015.
The Government of South Australia has committed to creating a new statutory corporation, Green Industries SA, from 1 July 2015.
Green Industries SA will build on the many successes of Zero Waste SA, with a focus on:
• leading the nation in waste management
• encouraging innovation and economic growth through the green economy
• helping businesses to find new overseas markets for their waste management knowledge and skills
• assisting businesses to reduce their costs through more efficient use of raw materials, water and energy
• administering grants to local government and industries to explore new technologies
• reporting against waste to landfill targets.
The first step towards establishing Green Industries SA is to create the Office of Green Industries SA through a proclamation to alter the title of the Office of Zero Waste SA under Section 26(b) of the Public Sector Act 2009. It is planned that the Office of Green Industries SA will be proclaimed by 1 July 2015.
Legislation will be drafted in 2015–16 to establish Green Industries SA as a statutory authority, governed by a skills-based board. The Board of Zero Waste SA will provide oversight and advice to the minister on Green Industries SA during the transition to the new legislative framework.
Budgetary information for Green Industries SA is not presented in the 2015–16 Agency Statements.
Ministerial responsibilities
Minister Programs Sub-programs
The Hon. IK Hunter Minister for Sustainability, Environment and Conservation
1. Waste Reduction and Resource Recovery
Nil
Statutes
The Department of the Premier and Cabinet maintains a list of statutes applicable to ministers.
Workforce summary
FTEs as at 30 June
Agency 2015–16 Budget
2014–15 Estimated
Result(a) 2013–14 Actual(b)
Zero Waste SA .................................................................................... — 15.8 18.4
Total — 15.8 18.4
(a) The 2015–16 Budget and 2014–15 Estimated Result reflect the established FTE caps.
(b) Data published by the Office for the Public Sector (Department of the Premier and Cabinet).
Zero Waste
200 2015–16 Agency Statements — Volume 4

Program net cost of services summary
Net cost of services
2015–16 Budget
2014–15 Estimated
Result 2014–15 Budget
2013–14 Actual
Program $000 $000 $000 $000
1. Waste Reduction and Resource Recovery ......... — -14 872 -14 611 -8 874
Total — -14 872 -14 611 -8 874
Zero Waste
2015–16 Agency Statements — Volume 4 201

Program 1: Waste Reduction and Resource Recovery
Description/objective
To eliminate waste or its consignment to landfill and advance the development of resource recovery and recycling based on an integrated strategy for the state.
Program summary — expenses, income and FTEs
2015–16 Budget
2014–15 Estimated
Result 2014–15 Budget
2013–14 Actual
$000 $000 $000 $000
Expenses Employee benefit expenses.......................................... — 2 385 2 766 4 254 Supplies and services ................................................... — 2 732 2 645 3 033 Depreciation and amortisation expenses ...................... — — — 79 Grants and subsidies .................................................... — 2 060 2 027 3 848 Intra-government transfers ........................................... — 7 7 75 Other expenses ............................................................ — 12 12 14
Total expenses — 7 196 7 457 11 303
Income Intra-government transfers ........................................... — 20 868 20 868 19 000 Other grants.................................................................. — — — 17 Interest revenue ............................................................ — 1 200 1 200 1 160
Total income — 22 068 22 068 20 177
Net cost of providing services — -14 872 -14 611 -8 874
FTEs as at 30 June (No.) — 15.8 23.8 18.4
Financial commentary
2014–15 Estimated Result/2014–15 Budget
The $0.3 million decrease in expenses is primarily due to:
• reduced employee expenses relating to decreased full-time equivalent staff as a result of targeted voluntary separation packages paid in 2013–14 ($0.9 million)
partially offset by
• carryover of expenditure for the Metropolitan Infrastructure and Regional Implementation grant programs from 2013–14 to 2014–15 ($0.5 million)
• increased expenditure relating to the dob in a litterer program election commitment in 2014–15 ($0.1 million).
2014–15 Estimated Result/2013–14 Actual
The $4.1 million decrease in expenses is primarily due to:
• a once-off reduction in the 2014–15 Budget ($1.5 million) and an increase in 2013–14 actual expenditure ($1.0 million) due to bringing forward the budgets for the Metropolitan Infrastructure and Regional Implementation grant programs from 2014–15 to 2013–14 (overall effect $2.5 million)
• once-off expenditure relating to targeted voluntary separation package payments in 2013–14 ($1.3 million)
Zero Waste
202 2015–16 Agency Statements — Volume 4

• reduced employee expenses in 2014–15 relating to decreased full-time equivalent staff as a result of targeted voluntary separation packages paid in 2013–14 ($0.9 million)
partially offset by
• carryover of expenditure for the Metropolitan Infrastructure and Regional Implementation grant programs ($0.5 million)
• increased expenditure relating to the dob-in-a-litterer program election commitment ($0.1 million).
The $1.9 million increase in income is primarily due to higher intra-government transfers from the Environment Protection Authority for higher solid waste levy receipts.
Highlights 2014–15
• Built on the findings from the review of South Australia’s Waste Strategy 2011–2015, and developed and released for public consultation a draft South Australia’s Waste Strategy 2015–2020 which aims to maximise and realise the economic potential from innovative new technology and the trend towards re-manufacturing to build a resource efficient economy in the state.
• Provided assistance and advice on resource efficiency and sustainability to 35 organisations including key industry partners, the South Australian Wine Industry Association and Australian Industry Group.
• Completed analysis of a survey of 28 Zero Waste SA industry program clients that indicated conservative (collective) annual savings of $3.4 million per year in reduced energy and landfill costs and an increase of over 1200 tonnes in materials being recycled as a result of participation in the Industry Program.
• Provided financial incentives of $294 000 to six metropolitan and 13 non-metropolitan councils to implement household food waste, co-mingled (dry) recyclables and organic recycling as part of council kerbside collection services.
• Allocated infrastructure grant funding of $774 000 to nine regional councils, five businesses and one not-for-profit organisation to enhance recycling and resource recovery of materials in country South Australia.
• Allocated infrastructure grant funding of $556 000 to five businesses, one council and one not-for-profit organisation in Adelaide, to increase recycling and resource recovery of materials and reduce the amount of waste sent to landfill.
• Undertook 12 household hazardous waste and farm chemicals events at the Dry Creek depot, and six drop-off events across four metropolitan and two regional council areas in South Australia.
• Obtained funding from the Commonwealth Government’s Natural Disaster Resilience Program to undertake a Phase One Scoping Study of the Disaster Waste Management Contingency Plans Project to assess and map waste profiles, management capacity, current practices and regulatory framework of large scale natural disaster waste management in the state for bushfire, earthquake, flood and severe storm.
• Released Share N Save website as an Open Source Software in December 2014, allowing a free license to anyone to use and adapt, as long as any improvements are made available for all users of the software.
• Provided incentive payments of $146 490 to increase the diversion of commercial food waste across metropolitan Adelaide through collection contractors. Around 4900 tonnes of commercial food waste from 642 sites across metropolitan Adelaide was sent to composting during 2014–15. This program is supported by a pilot program working with councils to trial food waste collection services for interested food outlets along two precincts.
Zero Waste
2015–16 Agency Statements — Volume 4 203

Performance indicators
2015–16
Target
2014–15 Estimated
Result 2014–15
Target 2013–14
Actual
Reduction of waste to landfill The decrease in tonnes reduction from the 2014–15 Target to the 2014–15 Estimated Result reflects a changing economy resulting in less waste generated by businesses and the community and concurrently a higher rate of recycling of waste materials. Note that tonnes shown excludes disposal of contaminated soil to landfill which is reported separately in the agency annual report.
— 15 000 tonnes
reduction
50 000 tonnes
reduction
2 000 tonnes
reduction
Zero Waste
204 2015–16 Agency Statements — Volume 4

Zero Waste SA
Statement of comprehensive income______________________________________________________________________________________________________________________________________________________________________________________________________________
2015–16Budget
$000
2014–15Estimated
Result
$000
2014–15Budget
$000
2013–14Actual
$000
Expenses
Employee benefit expenses Salaries, wages, annual and sick leave .........................................................................................................................................................................— 1 873 2 305 2 185 Long service leave .........................................................................................................................................................................— 48 57 430 Payroll tax .........................................................................................................................................................................— 113 125 152 Superannuation .........................................................................................................................................................................— 218 245 313 Other .........................................................................................................................................................................— 133 34 1 174Supplies and services General supplies and services ................................................................................................................................................................................— 2 598 2 511 2 930 Consultancy expenses ................................................................................................................................................................................— 134 134 103Depreciation and amortisation expenses .........................................................................................................................................................................— — — 79Grants and subsidies .........................................................................................................................................................................— 2 060 2 027 3 848Intra-government transfers .........................................................................................................................................................................— 7 7 75Other expenses .........................................................................................................................................................................— 12 12 14
Total expenses — 7 196 7 457 11 303
Income
Intra-government transfers ................................................................................................................................................................................— 20 868 20 868 19 000Sales of goods and services ................................................................................................................................................................................— — — 17Interest revenues ................................................................................................................................................................................— 1 200 1 200 1 160
Total income — 22 068 22 068 20 177
Net cost of providing services — -14 872 -14 611 -8 874
Income from/expenses to state government
Income Other income ................................................................................................................................................................................— — — 567
Net income from/expenses to state government — — — 567
Total comprehensive result — 14 872 14 611 9 441
Zero Waste
2015–16 Agency Statements — Volume 4 205

Zero Waste SA
Statement of financial position______________________________________________________________________________________________________________________________________________________________________________________________________________
2015–16Budget
$000
2014–15Estimated
Result
$000
2014–15Budget
$000
2013–14Actual
$000
Assets
Current assets
Cash and cash equivalents .......................................................................................................................................— 68 572 68 406 53 682Receivables .......................................................................................................................................— 104 118 104Other current assets .......................................................................................................................................— 19 9 19
Total current assets — 68 695 68 533 53 805
Non current assets
Plant and equipment .......................................................................................................................................— 286 365 286
Total non-current assets — 286 365 286
Total assets — 68 981 68 898 54 091
Liabilities
Current liabilities
Payables .................................................................................................................................................................................— 1 468 710 1 455Employee benefits Salaries and wages .................................................................................................................................................................................— 8 — 8 Annual leave .................................................................................................................................................................................— 182 260 176 Long service leave .................................................................................................................................................................................— 27 11 28 Other .................................................................................................................................................................................— 12 14 12Short-term provisions .................................................................................................................................................................................— 1 1 1
Total current liabilities — 1 698 996 1 680
Non current liabilities
Long-term employee benefits Long service leave ................................................................................................................................................................................— 601 887 601Long-term provisions ................................................................................................................................................................................— 3 4 3
Total non-current liabilities — 604 891 604
Total liabilities — 2 302 1 887 2 284
Net assets — 66 679 67 011 51 807
Equity
Retained earnings .......................................................................................................................................— 66 679 67 011 51 807
Total equity — 66 679 67 011 51 807
Balances as at 30 June end of period.
Zero Waste
206 2015–16 Agency Statements — Volume 4

Zero Waste SA
Statement of cash flows______________________________________________________________________________________________________________________________________________________________________________________________________________
2015–16Budget
$000
2014–15Estimated
Result
$000
2014–15Budget
$000
2013–14Actual
$000
Operating activities
Cash outflows
Employee benefit payments ..............................................................................................................................................................................— 2 380 2 761 4 616Payments for supplies and services ..............................................................................................................................................................................— 2 719 2 632 2 249Grants and subsidies ..............................................................................................................................................................................— 2 060 2 027 3 848Intra-government transfers ..............................................................................................................................................................................— 7 7 75Other payments ..............................................................................................................................................................................— 12 12 23
Cash used in operations — 7 178 7 439 10 811
Cash inflows
Intra-government transfers ..........................................................................................................................................................................— 20 868 20 868 19 000Sales of goods and services ..........................................................................................................................................................................— — — 18Interest received ..........................................................................................................................................................................— 1 200 1 200 1 156Other receipts ..........................................................................................................................................................................— — — 27
Cash generated from operations — 22 068 22 068 20 201
State government
Other receipts ..............................................................................................................................................................................— — — 567
Net cash provided by state government — — — 567
Net cash provided by (+)/used in (-) operating activities — 14 890 14 629 9 957
Net increase (+)/decrease (-) in cash equivalents — 14 890 14 629 9 957
Cash and cash equivalents at the start of the period — 53 682 53 777 43 725
Cash and cash equivalents at the end of the period — 68 572 68 406 53 682
Zero Waste
2015–16 Agency Statements — Volume 4 207
Summary of major variations
There is no 2015–16 Budget for the agency as it will cease to operate on 30 June 2015.
Zero Waste
208 2015–16 Agency Statements — Volume 4

Accounting standards
The financial statements included in the 2015–16 Agency Statements are special purpose financial statements.
Estimates in these financial statements have been prepared on a basis consistent with:
• Australian Accounting Standards, except where these notes indicate otherwise
• accounting policies expected to be used in preparing historically orientated general purpose financial statements for that year, and the same accounting policies have been used for the subsequent forecast years (forward estimates).
Reporting entities
The financial statements include all estimated assets, liabilities, incomes and expenses of individual agencies.
Consistent with Australian Accounting Standards, estimated transactions and balances that are controlled are budgeted for, and reported on, separately to estimated transactions and balances which are administered but not controlled by the agency.
Activities that are ‘controlled’ are those where the agency delivers services and governs the financial and operating policies so as to obtain benefits from these activities and assets in the pursuit of its objectives.
Generally, activities that are ‘administered’ are those where the agency provides a service or function on behalf of the Minister and has no discretion to alter the resources provided or determine how they are spent.
Basis of accounting and measurement
The estimated financial statements include a statement of comprehensive income, statement of financial position and a statement of cash flows.
The format of these estimated financial statements is consistent with the model financial statements (prepared by the Department of Treasury and Finance for statutory reporting requirements) and is consistent with the requirements of AASB 101 Presentation of Financial Statements and AASB 107 Statement of Cash Flows.
The accrual basis of accounting has been applied in the preparation of the estimated financial statements whereby estimated assets, liabilities, equity, incomes and expenses are recognised in the reporting period to which they relate, regardless of when cash is received or paid.
Assets Most government assets are valued at their written-down current cost. Otherwise agencies adopt one of the following measurement bases:
2015–16 Agency Statements — Volume 4 209

• fair value — is the price that would be received to sell an asset in an orderly transaction between market participants at measurement date.
• market value — amount that uses prices and other relevant information generated by market transactions involving identical or comparable assets.
• current cost — amount that would be required currently to replace the service capacity of an asset.
All non-current tangible assets, with a cost of acquisition greater than $1.0 million and a useful life of more than three years, are required to be valued at fair value unless excluded from the scope of Australian Accounting Standard AASB 116 Property, Plant and Equipment and/or an alternative valuation is specified by another accounting standard.
All intangible assets are measured at cost.
Depreciation and amortisation
All non-current assets having limited useful lives are systematically depreciated/amortised over their useful lives in a manner that reflects the consumption of their service potential. The most common method used for calculating depreciation expense is the straight line method.
Certain heritage assets have very long and indeterminate useful lives. Their service potential has not, in any material sense, been consumed during the reporting period. As such, no amount for depreciation has been recognised in respect of those assets.
Assets acquired under finance leases are amortised over the period during which the government is expected to benefit from use of the leased asset.
Employee benefits Employee benefits (including salaries and wages, annual leave, long service leave, skills and experience retention leave, sick leave and superannuation benefits) reflect those benefits accrued as a result of services provided by employees up to the reporting date.
Short-term employee benefits (expected to be settled within 12 months after the end of the reporting period in which the employee rendered the services) are measured at a nominal amount based on the remuneration rates an agency expects to pay. Examples of short-term employee benefits include salaries and wages and annual leave.
Long-term employee benefits (other than short-term) are measured at the present value of estimated future cash flows. An example of a long-term employee benefit is long service leave.
Sick leave
For the majority of agencies, no liability will be recognised for sick leave.
There is no liability for non-vesting sick leave (a non-vesting entitlement is that which does not constitute a legal obligation of the employing agency until a valid claim is made by an employee or an event has occurred) if, on average, sick leave taken is less than total entitlements accruing.
Vesting sick leave entitlements are rare for state government employees. Superannuation
For most state government controlled agencies, the Treasurer assumes the accrued superannuation liability in return for periodic payments from agencies. Therefore, unless there are contributions due but not yet paid at the reporting date, there is no superannuation liability recorded for the agency.
Accounting Standards
210 2015–16 Agency Statements — Volume 4

Two types of superannuation plans are in operation currently in the public sector: defined benefit plans and defined contribution plans. In a defined benefit plan, a member’s entitlement is determined by reference to a formula based on years of membership and/or salary levels. In a defined contribution plan, a member’s entitlement is determined by reference to accumulated contributions made to the plan together with investment earnings thereon.
Under existing arrangements, the Treasurer is liable for any net deficiency in assets for the defined benefits plans. Deficits in defined benefit superannuation plans are recognised as liabilities in the statement of financial position for the Treasurer. The deficits are measured as the excess of employees’ accrued benefits resulting from services up to the reporting date over the fair value of the plan’s assets as at the reporting date.
Income recognition
Wherever possible, income is recognised when the transaction or event giving rise to the income occurs. As a result, all items of income are normally reported in the statement of comprehensive income when an agency obtains control over the respective amounts. In circumstances where it is not possible to determine objectively when control over the asset passes to the agency, the amounts are recognised upon receipt.
Appropriation
The investment program requirements for agencies included in the agency statements may be funded through operating appropriation, operating receipts, the proceeds of asset sales, grants and through Commonwealth payments. Where the investment requirements of an agency are not funded from these sources, the state government funding of an agency’s investment program will generally be treated as an equity contribution from the government, as representative owner. These contributions are treated as contributions to equity rather than income in an agency.
Funds appropriated, but not required to meet current year cash outflows will be deposited with the Treasurer and will show as an asset in the agency’s statement of financial position.
Cash alignment policy
Where agencies have returned excess cash held to the Treasurer in accordance with the cash alignment policy, the payment is generally recorded as a ‘payment to government’ in the statement of comprehensive income. Some agencies have elected to repay debt or return contributed capital with excess cash balances. These transactions will be reflected in the statement of financial position.
Rounding
All estimated amounts in the financial statements have been rounded to the nearest thousand dollars, unless otherwise indicated.
Due to rounding, there may be instances where estimated financial statements and tables do not add correctly.
Accounting Standards
2015–16 Agency Statements — Volume 4 211

212 2015–16 Agency Statements — Volume 4

www.statebudget.sa.gov.au
www.statebudget.sa.gov.au
Department of Treasury and Finance
State Administration Centre 200 Victoria Square, Adelaide South Australia, 5000
GPO Box 1045, Adelaide South Australia, 5001
Telephone: +61 (08) 8226 9500 www.treasury.sa.gov.au