Embed Size (px)
Citation preview

SLIDE 0
2014 SECOND QUARTER
EARNINGS REVIEWJULY 24, 2014JULY 24, 2014JULY 24, 2014JULY 24, 2014
(PRELIMINARY RESULTS)(PRELIMINARY RESULTS)(PRELIMINARY RESULTS)(PRELIMINARY RESULTS)

SLIDE 1
OUR PLAN --
• Continue implementation of our global Plan:
− Aggressively restructure to operate profitably at the current demandand changing model mix
− Accelerate development of new products our customers want and value
− Finance our Plan and improve our balance sheet
− Work together effectively as one team -- leveraging our global assets
+ + =Asia Pacific
AfricaAsia Pacific
Africa
AmericasAmericas
Europe
SmallMediumMedium
Large
Profits & Cash
PROFITABLE GROWTH FOR ALL

SLIDE 2
2014 SECOND QUARTER SUMMARY*
* Business Unit records are since at least 2000 when we began reporting specific Business Unit results
• Company profitable for 20th consecutive quarter and best quarterly pre-tax profit since Second Quarter 2011; Automotive operating-related cash flow positive; strong liquidity
• Year-over-year decline of 1% in wholesale volume and Company revenue; market share higher in Asia Pacific, driven by record share in China
• All Automotive Business Units profitable and improved compared with a year ago, except South America
• Record quarterly profit in North America; Second Quarter record profit in Asia Pacific; first quarterly profit in Europe in three years
• Solid results from Ford Credit
• Global new product launches on track
• Reconfirming Company pre-tax profit, Automotive revenue, and operating margin guidance for Full Year; improving operating-related cash flow guidance
Strong Second Quarter Financial Results. Reconfirming Company Full Year Pre-Tax Profit Guidance Of $7 Billion To $8 Billion
* Excludes special items; Business Unit records are since at least 2000 when we began reporting specific Business Unit results

SLIDE 3
2014 SECOND QUARTER HIGHLIGHTS
• Ford and Lincoln made strong improvements in the J.D. Power 2014U.S. Initial Quality Study; F-150, Edge, and Lincoln MKX ranked highest in their segments for quality
• Globally revealed all-new 2015 Edge and Focus ST, all-new Escort in China, Ford Everest Concept in China, S-MAX Vignale Concept in Europe, andFord Lightweight Research Concept
• Launched Lincoln brand in China, including reveal of MKX Concept
• Began North America production of Transit from refurbished Kansas City plant, Lincoln MKC from Louisville, and increased Fiesta production in Cologne
• Ford Otosan joint venture began vehicle production from a new plant in Turkey; Changan Ford Automobile joint venture opened new transmission plant in China; Ford opened new engine plant in Brazil
• Reached agreement with German Works Council to improve flexibility and efficiency at our Cologne plant with production of next-generation Fiesta
• Currently implementing a share repurchase program for almost $2 billion

SLIDE 4
2014 SECOND QUARTER KEY FINANCIAL SUMMARY

SLIDE 5
2014 SECOND QUARTER PRE-TAX RESULTS
BY SECTOR*
* Excludes special items; see Appendix for detail and reconciliation to GAAP
Memo:B / (W) 2013 2Q $ 44 $ 66 $(22)B / (W) 2014 1Q 1,218 1,251 (33)
FinancialServices
Automotive
Millions
Company
$2,599
$2,170
$429
Ford Credit $434Other (5)

SLIDE 6
AUTOMOTIVE SECTOR
2014 SECOND QUARTER KEY METRICS
COMPARED WITH 2013*
* Excludes special items; see Appendix for detail, reconciliation to GAAP, and definition of wholesales** Automotive operating margin defined as Automotive pre-tax results, excluding special items and Other Automotive, divided by Automotive revenue
*** Based, in part, on estimated vehicle registrations; includes medium and heavy trucks
1,6611,678
20142013
Wholesales (000)
$35.3$36.0
20142013
Revenue (Bils.)
6.6%6.4%
20142013
OperatingMargin (Pct.)**
$2,170$2,104
20142013
Pre-TaxResults (Mils.)
Memo:First Half 3,175 3,250 $69.9 $69.2 5.8% 5.0% $3,747 $3,089
Second QuarterGlobal Industry SAAR (Mils.)*** 84.4 87.3Global Market Share*** 7.7% 7.5%

SLIDE 7
AUTOMOTIVE SECTOR
2014 SECOND QUARTER PRE-TAX RESULTS
COMPARED WITH 2013*
* Excludes special items; see Appendix for detail and reconciliation to GAAP** Cost changes are measured primarily at present-year exchange, and exclude special items and discontinued operations. In addition, costs that vary directly with volume, such as material,
freight, and warranty costs, are measured at present-year volume and mix
$2,170$2,104
20142Q
20132Q
Volume /Mix
NetPricing
OtherCost**
Exchange
Industry $ 430 Share (571)Stocks (281)Mix / Other 195
$(227) $(146) $(45)
$297 $357
$(170)
ContributionCost**
Structural Costs $(188)All Other 18
Millions
NetInterest /
Other
Market Factors Total Cost$66
Memo:B / (W) Than 2014 1Q $1,251 $962 $(6) $288 $(333) $365 $(25)
Pricing $ 910Incentives / Other (613)
Material Excl. Commod. $ 483Commodities 37Warranty / Freight (163)

SLIDE 8
AUTOMOTIVE SECTOR
2014 SECOND QUARTER PRE-TAX RESULTS
BY SEGMENT*
* Excludes special items; see Appendix for detail and reconciliation to GAAP
Millions
SouthAmerica
Total NorthAmerica
OtherAutomotive
AsiaPacific
Europe
Net Interest Expense $(166)
Fair Mkt. Value Adj. / Other (5)
$2,170
$2,440
$(295)
$14
$159
$(171)
Memo:B / (W) 2013 2Q $ 66 $119 $(446) $320 $ 10 $ 29 $34B / (W) 2014 1Q 1,251 940 215 208 (31) (132) 51
Middle East& Africa
$23

SLIDE 9
AUTOMOTIVE SECTOR -- NORTH AMERICA
2014 SECOND QUARTER KEY METRICS
COMPARED WITH 2013
Memo:First Half 1,537 1,477 $43.3 $41.6 10.9% 9.5% $4,713 $3,940
Second QuarterN.A. Industry SAAR (Mils.)* 18.9 20.2N.A. Market Share* 16.0% 14.8%U.S. Industry SAAR (Mils.)* 15.7 16.9U.S. Market Share* 16.5% 15.3%
760802
20142013
Wholesales (000)
$21.2$21.8
20142013
Revenue (Bils.)
11.6%10.6%
20142013
OperatingMargin (Pct.)
$2,440$2,321
20142013
Pre-TaxResults (Mils.)
* Based, in part, on estimated vehicle registrations; includes medium and heavy trucks

SLIDE 10
AUTOMOTIVE SECTOR -- NORTH AMERICA
2014 SECOND QUARTER PRE-TAX RESULTS
COMPARED WITH 2013Millions
20142Q
20132Q
Volume /Mix
NetPricing
OtherCost*
Industry $ 517Share (597)Stocks (300)Mix / Other 272
Exchange Other
$2,321
$(108)
$40
$(105)$(28)
$115
Memo:B / (W) Than 2014 1Q $940 $815 $15 $267 $(271) $(50) $164
$205
ContributionCost*
* Cost changes are measured primarily at present-year exchange, and exclude special items and discontinued operations. In addition, costs that vary directly with volume, such as material,freight, and warranty costs, are measured at present-year volume and mix
$2,440
$119
Material Excl. Commod. $ 288Commodities 32Warranty / Freight (115)
Parts & Accessories $62Other 53
Structural Costs $(153)All Other 48

SLIDE 11
AUTOMOTIVE SECTOR -- SOUTH AMERICA
2014 SECOND QUARTER KEY METRICS
COMPARED WITH 2013
114
147
20142013
Wholesales (000)
$2.1
$3.0
20142013
Revenue (Bils.)
(14.0)%
5.0%
20142013
OperatingMargin (Pct.)
$(295)
$151
20142013
Pre-TaxResults (Mils.)
* Based, in part, on estimated vehicle registrations; includes medium and heavy trucks
Memo:First Half 260 218 $5.3 $4.0 (1.3)% (20.1)% $(67) $(805)
Second Quarter S.A. Industry SAAR (Mils.)* 6.1 5.3S.A. Market Share* 9.1% 8.8%Brazil Industry SAAR (Mils.)* 3.9 3.6Brazil Market Share* 9.2% 9.1%

SLIDE 12
AUTOMOTIVE SECTOR -- SOUTH AMERICA
2014 SECOND QUARTER PRE-TAX RESULTS
COMPARED WITH 2013Millions
Industry $(215)Share 3Stocks (28)Mix / Other (81)
20142Q
20132Q
Volume /Mix
OtherCost*
Exchange Other
Memo:B / (W) Than 2014 1Q $215 $9 $30 $(67) $(59) $380 $(78)
NetPricing
ContributionCost*
$151
$(295) $(321)
$286
$(102)
$(190)
$(37)
* Cost changes are measured primarily at present-year exchange, and exclude special items and discontinued operations. In addition, costs that vary directly with volume, such as material,freight, and warranty costs, are measured at present-year volume and mix
$(82)
Pricing $369Incentives / Other (83)
$(446)
Structural Costs $(94)All Other (8)

SLIDE 13
AUTOMOTIVE SECTOR -- EUROPE
2014 SECOND QUARTER KEY METRICS
COMPARED WITH 2013
* Includes Ford brand vehicles sold by our unconsolidated affiliates in Turkey (totaling about 14,000 and 11,000 units in Second Quarter 2013 and 2014, respectively) and in Russia (totaling about 34,000and 9,000 units in Second Quarter 2013 and 2014, respectively); revenue does not include these sales
** Based, in part, on estimated vehicle registrations; includes medium and heavy trucks
376377
20142013
Wholesales (000)*
$8.0$7.3
20142013
Revenue (Bils.)
20142013
OperatingMargin (Pct.)
20142013
Pre-TaxResults (Mils.)
Memo:First Half 707 743 $13.9 $15.8 (5.2)% (1.1)% $(731) $(180)
Second Quarter Europe Industry SAAR (Mils.)** 18.0 18.2Europe Market Share** 7.5% 7.1%Europe 20 Industry SAAR (Mils.)** 13.7 14.4Europe 20 Market Share** 8.1% 7.9%
0.2%
(4.2)%
$14
$(306)

SLIDE 14
AUTOMOTIVE SECTOR -- EUROPE
2014 SECOND QUARTER PRE-TAX RESULTS
COMPARED WITH 2013
* Cost changes are measured primarily at present-year exchange, and exclude special items and discontinued operations. In addition, costs that vary directly with volume, such as material, freight, and warranty costs, are measured at present-year volume and mix
Millions
OtherExchangeOtherCost*
NetPricing
Volume /Mix
20132Q
Contrib.Cost*
20142Q
RestructuringCost
$(306)
$14 $1
$(23)
$265
$100 $101
Memo:B / (W) Than 2014 1Q $208 $90 $(65) $178 $107 $31 $(133) $66
$320
Industry $ 77Share (60)Stocks 115Mix / Other (131)
Material Excl. Commodities $194Commodities 89Warranty / Freight (18)
JV Profits / Royalties $(59)Parts & Accessories (41)Other (24)
$(124)
Memo:(Included in
cost columns)
$178
Structural Costs $116All Other (16)

SLIDE 15
AUTOMOTIVE SECTOR -- MIDDLE EAST & AFRICA
2014 SECOND QUARTER KEY METRICS
COMPARED WITH 2013
52 $1.249 $1.1
Revenue (Bils.)Wholesales (000)
20142013 20142013
$13
$23
Pre-Tax Results (Mils.)
20142013
1.1%
2.0%
OperatingMargin (Pct.)
20142013
Memo:First Half 106 100 $2.5 $2.3 2.4% 3.3% $60 $77
Second Quarter MEA Industry SAAR (Mils.)* 4.0 4.0MEA Market Share* 4.9% 4.7%
* Based, in part, on estimated vehicle registrations; includes medium and heavy trucks

SLIDE 16
AUTOMOTIVE SECTOR -- ASIA PACIFIC
2014 SECOND QUARTER KEY METRICS
COMPARED WITH 2013
* Includes Ford brand and Jiangling Motors Corporation (JMC) brand vehicles produced in China by unconsolidated affiliates (totaling about 213,000 and 269,000 units in Second Quarter 2013 and 2014, respectively); revenue does not include these sales
** Based, in part, on estimated vehicle registrations; includes medium and heavy trucks
300 $2.7
362
$2.9
Revenue (Bils.)Wholesales (000)*
$130
$159
Pre-Tax Results (Mils.)
4.9%
5.5%
OperatingMargin (Pct.)
Memo:First Half 565 712 $4.9 $5.5 2.1% 8.1% $102 $450
Second QuarterAP Industry SAAR (Mils.)** 37.4 39.6AP Market Share** 3.3% 3.7%China Industry SAAR (Mils.)** 21.8 24.0China Market Share** 4.3% 4.6%
20142013 20142013 2014201320142013
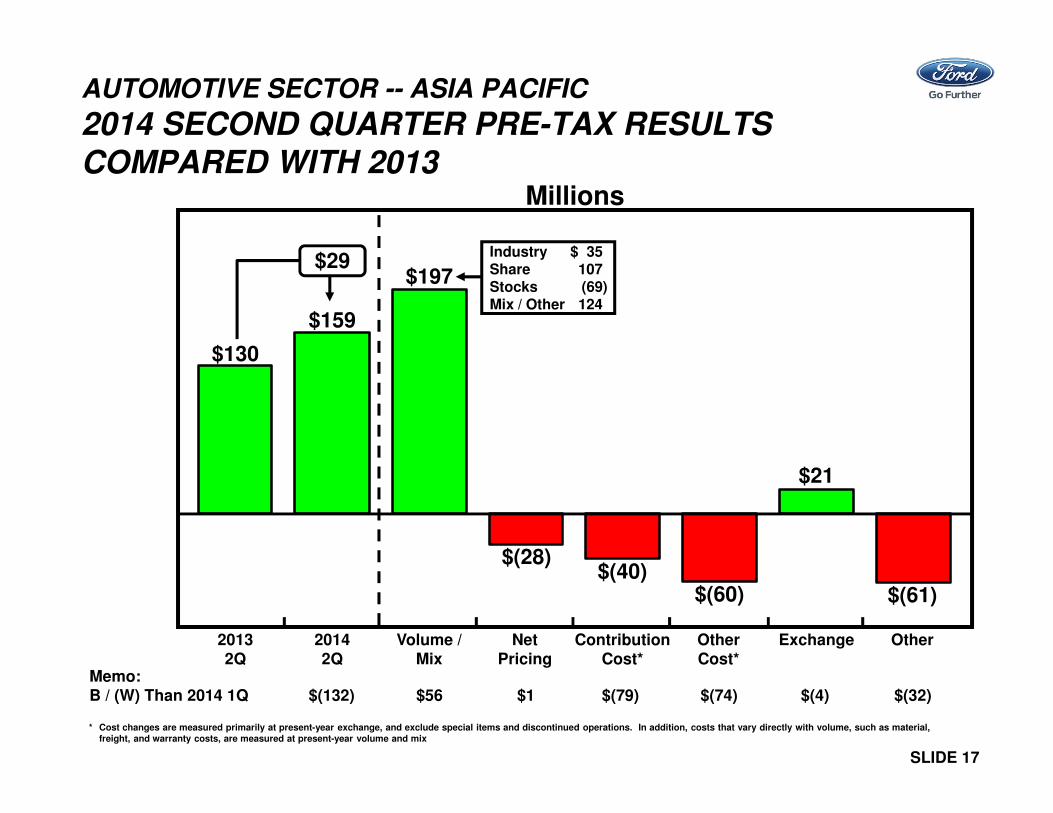
SLIDE 17
Millions
Memo:B / (W) Than 2014 1Q $(132) $56 $1 $(79) $(74) $(4) $(32)
$(60) $(61)
$130
$21
$159
20142Q
20132Q
Volume /Mix
OtherCost*
Exchange OtherNetPricing
ContributionCost*
$(40)
* Cost changes are measured primarily at present-year exchange, and exclude special items and discontinued operations. In addition, costs that vary directly with volume, such as material, freight, and warranty costs, are measured at present-year volume and mix
Industry $ 35Share 107 Stocks (69)Mix / Other 124
$(28)
$197
AUTOMOTIVE SECTOR -- ASIA PACIFIC
2014 SECOND QUARTER PRE-TAX RESULTS
COMPARED WITH 2013
$29

SLIDE 18
FORD CREDIT
2014 SECOND QUARTER PRE-TAX RESULTS
COMPARED WITH 2013
Memo:B / (W) 2014 1Q $ (65) $28 $1 $4 $(14) $(84)
Receivables (Bils.)Net * $93 $107Managed ** 96 111
* Net receivables reflect net finance receivables and net investment in operating leases reported on Ford Credit’s balance sheet. The prior period was revised to conform to the presentation in our 2013 10-K Report
** Managed receivables equal net receivables, excluding unearned interest supplements and residual support, allowance for credit losses, and other (primarily accumulated supplemental depreciation).The prior period was revised to conform to the presentation in our 2013 10-K Report
LeaseResidual
Volume20142Q
20132Q
CreditLoss
OtherFinancingMargin
$454 $434
$98
$(17) $(7)$(48) $(46)
Millions
$(20)

SLIDE 19
AUTOMOTIVE SECTOR
2014 CASH*

SLIDE 20
AUTOMOTIVE SECTOR
2014 AUTOMOTIVE FINANCIAL RESOURCES
Mar. 31, June 30,2014 2014
(Bils.) (Bils.)
Automotive gross cash* 25.2$ 25.8$
Less:
Long-term debt (13.6)$ (13.2)$
Debt payable within one year (2.1) (2.2)
Total debt (15.7)$ (15.4)$
Net cash** 9.5$ 10.4$
Memo: Liquidity*** 36.6$ 36.7$
* See Appendix for reconciliation to GAAP
** Net cash is calculated as Automotive gross cash net of Automotive debt
*** Total available committed Automotive credit lines (including local lines available to foreign affiliates) were $10.9 billion at June 30, 2014

SLIDE 21
2014 BUSINESS ENVIRONMENT OVERVIEW
2014 Global Economic Growth In The 2.5% To 3% Range
Global
• 2014 global economic growth of 2.5% - 3% range; global industry sales of 85 - 90 million units
Americas
• U.S. economic growth revised down to the 2% range after negative First Quarter data, with improving conditions expected for the balance of 2014
• South America remains challenging, with slowing growth andinflation pressures in Brazil and severe economic policy imbalances inArgentina and Venezuela
Europe
• Incoming data consistent with ongoing recovery, with 2014 growth in the 1% range for the Euro Area and 2.5% - 3% range for the U.K.
• European Central Bank eased monetary policy by cutting interest rates and announcing a new lending facility to spur growth and limit deflation risks
Asia Pacific
• China’s economic growth projected in the 7.5% range, with economy recently stabilizing
• India projected to be in the 5% range; more positive sentiment after elections

SLIDE 22
2014 KEY METRICS -- BUSINESS UNITS
Business Unit Guidance Deteriorated For South America;Improved For Ford Credit

SLIDE 23
2014 PLANNING ASSUMPTIONS AND KEY METRICS
Total Company Guidance Unchanged At $7 Billion To $8 Billion.2014 Is The Next Step In Delivering Profitable Growth For All

SLIDE 24
• Continue implementation of our global Plan:
− Aggressively restructure to operate profitably at the current demandand changing model mix
− Accelerate development of new products our customers want and value
− Finance our Plan and improve our balance sheet
− Work together effectively as one team -- leveraging our global assets
OUR PLAN --
+ + =Asia Pacific
Africa
Americas
Europe
SmallMedium
Large
Profits & Cash
PROFITABLE GROWTH FOR ALL

SLIDE 25
Statements included or incorporated by reference herein may constitute "forward-looking statements" within the meaning of the Private Securities Litigation Reform Act of 1995.
Forward-looking statements are based on expectations, forecasts, and assumptions by our management and involve a number of risks, uncertainties, and other factors that could
cause actual results to differ materially from those stated, including, without limitation:
• Decline in industry sales volume, particularly in the United States or Europe, due to financial crisis, recession, geopolitical events, or other factors;
• Decline in Ford's market share or failure to achieve growth;
• Lower-than-anticipated market acceptance of Ford's new or existing products;
• Market shift away from sales of larger, more profitable vehicles beyond Ford's current planning assumption, particularly in the United States;
• An increase in or continued volatility of fuel prices, or reduced availability of fuel;
• Continued or increased price competition resulting from industry excess capacity, currency fluctuations, or other factors;
• Fluctuations in foreign currency exchange rates, commodity prices, and interest rates;
• Adverse effects resulting from economic, geopolitical, or other events;
• Economic distress of suppliers that may require Ford to provide substantial financial support or take other measures to ensure supplies of components or materials and could
increase costs, affect liquidity, or cause production constraints or disruptions;
• Work stoppages at Ford or supplier facilities or other limitations on production (whether as a result of labor disputes, natural or man-made disasters, tight credit markets or other
financial distress, production constraints or difficulties, or other factors);
• Single-source supply of components or materials;
• Labor or other constraints on Ford's ability to maintain competitive cost structure;
• Substantial pension and postretirement health care and life insurance liabilities impairing our liquidity or financial condition;
• Worse-than-assumed economic and demographic experience for postretirement benefit plans (e.g., discount rates or investment returns);
• Restriction on use of tax attributes from tax law "ownership change;"
• The discovery of defects in vehicles resulting in delays in new model launches, recall campaigns, or increased warranty costs;
• Increased safety, emissions, fuel economy, or other regulations resulting in higher costs, cash expenditures, and / or sales restrictions;
• Unusual or significant litigation, governmental investigations, or adverse publicity arising out of alleged defects in products, perceived environmental impacts, or otherwise;
• A change in requirements under long-term supply arrangements committing Ford to purchase minimum or fixed quantities of certain parts, or to pay a minimum amount to the
seller ("take-or-pay" contracts);
• Adverse effects on results from a decrease in or cessation or clawback of government incentives related to investments;
• Inherent limitations of internal controls impacting financial statements and safeguarding of assets;
• Cybersecurity risks to operational systems, security systems, or infrastructure owned by Ford, Ford Credit, or a third-party vendor or supplier;
• Failure of financial institutions to fulfill commitments under committed credit and liquidity facilities;
• Inability of Ford Credit to access debt, securitization, or derivative markets around the world at competitive rates or in sufficient amounts, due to credit rating downgrades, market
volatility, market disruption, regulatory requirements, or other factors;
• Higher-than-expected credit losses, lower-than-anticipated residual values, or higher-than-expected return volumes for leased vehicles;
• Increased competition from banks or other financial institutions seeking to increase their share of financing Ford vehicles; and
• New or increased credit, consumer, or data protection or other regulations resulting in higher costs and / or additional financing restrictions.
We cannot be certain that any expectation, forecast, or assumption made in preparing forward-looking statements will prove accurate, or that any projection will be realized. It is to
be expected that there may be differences between projected and actual results. Our forward-looking statements speak only as of the date of their initial issuance, and we do not
undertake any obligation to update or revise publicly any forward-looking statement, whether as a result of new information, future events, or otherwise. For additional discussion,
see "Item 1A. Risk Factors" in our Annual Report on Form 10-K for the year ended December 31, 2013, as updated by our subsequent Quarterly Reports on Form 10-Q and
Current Reports on Form 8-K.
RISK FACTORS

SLIDE 26
APPENDIX

SLIDE 27
• Calculation of Earnings Per Share 1
• Income from Continuing Operations 2
• Special Items 3
• Preliminary Sector Income Statement 4
Automotive Sector
• Production Volumes 5
• Dealer Stocks and Definition of Wholesales 6
• Market Share 7
• Automotive Debt 8
Reconciliation to GAAP
Automotive Sector
• Net Interest 9
• Gross Cash 10
• Operating-Related Cash Flows 11
Slide
2014 SECOND QUARTER EARNINGS --
APPENDIX INDEX

SLIDE 28
2014 CALCULATION OF EARNINGS PER SHARE
APPENDIX 1

SLIDE 29
2014 INCOME FROM CONTINUING OPERATIONS
APPENDIX 2
Memo:
Full Year
2013 2014 2013 2014 2013
(Mils.) (Mils.) (Mils.) (Mils.) (Mils.)
Automotive
North America 2,321$ 2,440$ 4,713$ 3,940$ 8,809$
South America 151 (295) (67) (805) (33)
Europe (306) 14 (731) (180) (1,442)
Middle East & Africa 13 23 60 77 (69)
Asia Pacific 130 159 102 450 327
Other Automotive (205) (171) (330) (393) (656)
Total Automotive (excl. special items) 2,104$ 2,170$ 3,747$ 3,089$ 6,936$
Special items -- Automotive (736) (481) (759) (603) (1,568)
Total Automotive 1,368$ 1,689$ 2,988$ 2,486$ 5,368$
Financial Services
Ford Credit 454$ 434$ 961$ 933$ 1,756$
Other Financial Services (3) (5) (7) (42) (84)
Total Financial Services 451$ 429$ 954$ 891$ 1,672$
Company
Pre-tax results 1,819$ 2,118$ 3,942$ 3,377$ 7,040$
(Provision for) / Benefit from income taxes (585) (803) (1,096) (1,073) 135
Net income 1,234$ 1,315$ 2,846$ 2,304$ 7,175$
Less: Income attributable to non-controlling interests 1 4 2 4 (7)
Net income attributable to Ford 1,233$ 1,311$ 2,844$ 2,300$ 7,182$
Memo: Excluding special items
Pre-tax results 2,555$ 2,599$ 4,701$ 3,980$ 8,608$
(Provision for) / Benefit from income taxes (721) (965) (1,224) (1,327) (2,022)
Less: Income attributable to non-controlling interests 1 4 2 4 (7)
After-tax results 1,833$ 1,630$ 3,475$ 2,649$ 6,593$
Second Quarter First Half

SLIDE 30
SPECIAL ITEMS
APPENDIX 3

SLIDE 31
PRELIMINARY SECTOR INCOME STATEMENT DATA
APPENDIX 4
For the periods ended June 30 2013 2014 2013 2014
(unaudited) (Mils.) (Mils.) (Mils.) (Mils.)
AUTOMOTIVE
Revenues 36,079$ 35,365$ 69,937$ 69,241$
Costs and expenses
Cost of sales 32,524 31,247 62,529 62,268
Selling, administrative, and other expenses 2,488 2,551 4,969 5,027
Total costs and expenses 35,012 33,798 67,498 67,295
Interest expense 207 207 413 415
Interest income and other income / (loss), net 241 270 486 484
Equity in net income / (loss) of affiliated companies 267 59 476 471
Income before income taxes -- Automotive 1,368 1,689 2,988 2,486
FINANCIAL SERVICES
Revenues 1,844 2,046 3,635 4,046
Costs and expenses
Interest expense 705 683 1,411 1,361
Depreciation on vehicles subject to operating leases 558 742 1,041 1,448
Operating and other expenses 157 183 317 373
Provision for credit and insurance losses 53 104 93 143
Total costs and expenses 1,473 1,712 2,862 3,325
Other income / (loss), net 74 87 170 155
Equity in net income / (loss) of affiliated companies 6 8 11 15
Income before income taxes -- Financial Services 451 429 954 891
COMPANY
Income before income taxes 1,819 2,118 3,942 3,377
Provision for / (Benefit from) income taxes 585 803 1,096 1,073
Net income 1,234 1,315 2,846 2,304
Less: Income / (Loss) attributable to non-controlling interests 1 4 2 4
Net income attributable to Ford Motor Company 1,233$ 1,311$ 2,844$ 2,300$
Second Quarter First Half

SLIDE 32
AUTOMOTIVE SECTOR
PRODUCTION VOLUMES*
APPENDIX 5

SLIDE 33
SELECTED MARKETS
2014 SECOND QUARTER DEALER STOCKS AND
DEFINITION OF WHOLESALES*
APPENDIX 6

SLIDE 34
AUTOMOTIVE SECTOR
MARKET SHARE*
APPENDIX 7
2Q 3Q 4Q 1Q 2Q 1Q 2Q 2013 2014
(Pct.) (Pct.) (Pct.) (Pct.) (Pct.) (Pts.) (Pts.) (Pct.) (Pct.)
Total Share of Total Industry
North America
Total 16.0 14.6 14.6 14.7 14.8 (0.6) (1.2) 15.7 14.8
U.S. 16.5 14.9 15.4 15.3 15.3 (0.6) (1.2) 16.2 15.3
South America
Total 9.1 9.2 8.5 8.5 8.8 (0.3) (0.3) 9.0 8.6
Brazil 9.2 10.0 9.4 9.2 9.1 0.1 (0.1) 9.1 9.1
Europe
Total 7.5 7.3 7.1 7.2 7.1 - (0.4) 7.4 7.2
Europe 20 8.1 8.0 7.4 8.0 7.9 0.3 (0.2) 7.9 7.9
Middle East & Africa
Total 4.9 5.1 5.3 4.6 4.7 - (0.2) 4.8 4.7
Asia Pacific**
Total 3.3 3.4 3.6 3.4 3.7 0.7 0.4 3.0 3.5
China 4.3 4.3 4.4 4.5 4.6 0.9 0.3 3.9 4.6
Global 7.7 7.4 7.1 6.9 7.5 - (0.2) 7.3 7.2
Retail Share of Retail Industry
U.S.*** 13.7 13.2 13.7 13.5 12.9 (0.5) (0.8) 13.9 13.2
Europe**** 8.4 8.3 7.6 8.2 8.3 (0.2) (0.1) 8.4 8.3
* B ased , in part , on est imat ed vehicle reg ist rat io ns; includ es med ium and heavy t rucks; p r io r p er io ds revised t o ref lect p resent year A ut o mot ive segment st ruct ure
** A sia Paci f ic market share includes Ford brand and JM C brand vehicles prod uced in C hina by unconso lid at ed af f l iat es
*** Present quart er is est imat ed , p r io r quart ers are based o n last est Po lk dat a
**** Europ e p assenger car ret ail share o f ret ail indust ry ref lect s t he f ive major market s ( U .K., Germany, F rance, I t aly, and Sp ain) ; p resent quart er is est imat ed , p r io r
q uart ers are based on last est D at a Force dat a
2013 2014 2014 B / (W) 2013
Memo:
First Half

SLIDE 35
AUTOMOTIVE SECTOR
AUTOMOTIVE DEBT
APPENDIX 8

SLIDE 36
AUTOMOTIVE SECTOR
NET INTEREST RECONCILIATION TO GAAP
APPENDIX 9
Memo:
Full Year
2013 2014 2013 2014 2013
(Mils.) (Mils.) (Mils.) (Mils.) (Mils.)
Interest expense (GAAP) (207)$ (207)$ (413)$ (415)$ (829)$
Interest income (GAAP) 43 41 87 80 163
Interest income / (expense) on income taxes (GAAP) - 11 - 37 -
Subtotal (164)$ (155)$ (326)$ (298)$ (666)$
Adjusted for items included / excluded from net interest
Include: Gains / (Losses) on cash equiv. and marketable securities* (55) 17 (41) 30 (7)
Include: Gains / (Losses) on extinguishment of debt - - (18) (5) (18)
Other (28) (28) (51) (56) (110)
Net Interest (247)$ (166)$ (436)$ (329)$ (801)$
* Excludes mark-to-market adjustments of our investment in Mazda
Second Quarter First Half

SLIDE 37
AUTOMOTIVE SECTOR
GROSS CASH RECONCILIATION TO GAAP
APPENDIX 10
Dec. 31 Mar. 31 June 30
(Bils.) (Bils.) (Bils.) (Bils.)
Cash and cash equivalents 5.5$ 5.0$ 4.5$ 4.7$
Marketable securities 20.2 20.1 20.7 21.1
Total cash and marketable securities (GAAP) 25.7$ 25.1$ 25.2$ 25.8$
Securities in transit* - (0.3) - -
Gross cash 25.7$ 24.8$ 25.2$ 25.8$
* The purchase or sale of marketable securities for which the cash settlement was not made by period end and a payable or receivable was recorded on
the balance sheet
June 30
2013 2014

SLIDE 38
AUTOMOTIVE SECTOR
OPERATING-RELATED CASH FLOWS
RECONCILIATION TO GAAP
APPENDIX 11