Embed Size (px)
Citation preview

Northeast Utilities is now
2014 Annual Report
002CSN4A56
Eversou
rce En
ergy 2014
An
nu
al Rep
ort

2010 2011 2012 2013 2014
$1.57
Closing Share Price
Total Shareholder Return
Dividends Paid/Share
2010 2011 2012 2013 2014
$100
$150
$200
$250
2009 2010 2011 2012 2013 2014
Eversource Energy $100 $128 $150 $168 $188 $246EEI Index $100 $107 $128 $131 $148 $191S&P 500 $100 $115 $117 $136 $180 $205
$31.88$36.07
$39.08$42.39
$53.52
$1.025 $1.10
$1.323 $1.47
(Assumes $100 invested on December 31, 2009 with all dividends reinvested)
Shareholder Information
Shareholders
As of December 31, 2014, there were 45,568 shareholders of record of Eversource Energy holding an aggregate of 316,983,337 common shares.
Transfer Agent and Registrar
Computershare Investor ServicesP. O. Box 43078Providence, RI 02940-3078
1-800-999-7269
TDD for hearing impaired: 1-800-952-9245
Shareholders Account Access
We have partnered with Computershare to o�eryou online access to your important shareholder communications in a single secure place. You can manage your account online via the Investor Centre website, Computershare’s web-based tool forshareholders at www.computershare.com/investor. Through free, around-the-clock access to the Investor Centre website, you can view your account, accessforms and request a variety of account transactions.
Investor Relations
You may contact our Investor Relations Department:
Je�rey Kotkin 860-665-5154Barbara Nieman 860-665-3249John Moreira 781-441-8887John Gavin 781-441-8118
www.eversource.com/investors
Dividend Reinvestment Plan
Eversource o�ers a dividend reinvestment plan.This plan is sponsored by the company and not only o�ers the reinvestment of dividends but provides both registered shareholders and interested first-time investors an a�ordable alternative for buying and selling Eversource common shares. To request an enrollment package, please call 1-800-999-7269 or log in to:
www.computershare.com/investor.
Direct Deposit of Quarterly Dividends
Direct deposit provides the convenience of automatic and immediate access to your funds, while eliminating the possibility of mail delays and lost, stolen or destroyed checks. This service is free of charge to you. Please call 1-800-999-7269 to request an enrollment form.
Common Share Dividend Payment Dates
Last business day of March, June, September and December.
Common Share Information
The common shares of Eversource Energy are listed on the New York Stock Exchange. The ticker symbol is “ES.” The high and low daily prices and dividends paid for the past two years, by quarters, are shown in the table below.
Corporate Governance For information on Corporate Governance at Eversource, go to our website, www.eversource.com, and select “Investors” and then “Corporate Governance.”
Quarterly Dividend Year Quarter High Low per Share
2014 First $45.69 $41.28 $0.3925
Second $47.60 $44.28 $0.3925
Third $47.37 $41.92 $0.3925
Fourth $56.66 $44.37 $0.3925
2013 First $43.49 $38.60 $0.3675
Second $45.66 $39.35 $0.3675
Third $45.13 $40.01 $0.3675
Fourth $43.75 $40.60 $0.3675

Eversource Service Territory
Electric Gas Combined Electric and Gas
1
Selected Financial Data(Thousands of dollars, except share information and statistical data)
2014 2013
Operating Revenues $ 7,741,856 $ 7,301,204 Operating Income $ 1,632,849 $ 1,529,435 Net Income Attributable to NU Common Shares $ 819,546 $ 786,007 Diluted Earnings per Common Share (GAAP) $ 2.58 $ 2.49 Diluted Earnings per Common Share (Non-GAAP) (1) $ 2.65 $ 2.53Diluted Common Shares Outstanding (Weighted Average) 317,417,414 316,211,160 Dividends Paid per Share $ 1.57 $ 1.47 Sales of Electricity (Regulated Retail, KWH-millions) 54,442 55,331Electric Customers (As of Year End) 3,119,675 3,103,642Firm Sales of Natural Gas (million cubic feet) 99,500 94,083 Natural Gas Customers (As of Year End) 500,703 495,267Investments in Property, Plant and Equipment $ 1,603,744 $ 1,456,787Property, Plant and Equipment, Net (As of Year End) $ 18,647,041 $ 17,576,186Market Capitalization (As of Year End) $ 16,964,948 $ 13,364,446Share Price (As of Year End) $ 53.52 $ 42.39
(1) Diluted Earnings per Common Share (Non-GAAP) was adjusted to exclude integration- and merger-related costs. See Item 7, "Management's Discussion and Analysis of Financial Condition and Results of Operations," in the accompanying Form 10-K for a reconciliation to GAAP.
Company ProfileEversource Energy (NYSE:ES), a Fortune 500 and Standard & Poor’s 500 energy company based in Connecticut, Massachusetts and New Hampshire, operates New England’s largest energy delivery system. Eversource is committed to safety, reliability, environmental leadership and stewardship, and expanding energy options for its 3.6 million electricity and natural gas customers.
Dear Fellow Shareholder,
Our company truly established itselfas a leader in the New England energymarketplace and the overall industry in 2014, as we enhanced our high levels of customer service, operational reliability and financial strength. We are a company committed to always improving and always evaluating howwe can do things better for our customers, employees and shareholders.
I am eager to share details on our manyaccomplishments in 2014. But first and foremost I am proud to introduce Eversource Energy, our company’s new brand and one of the most significant initiatives we undertook in 2014.
In February 2015, Northeast Utilities and allits operating companies o�cially began doing business as Eversource Energy. Over the past three years, our company has carefully and thoughtfully worked to integrate ourorganization and implement best practices consistently across our operations, while meeting and exceeding our customers’ high expectations. With over 8,200 of us coming together and working as one company, the next natural step in our evolution was Eversource, a single brand across all three states and all three of our business areas.
The Eversource brand clearly states who we are in the New England market and gives us the opportunity to tell our customers whatwe stand for as a company. It represents our shared responsibility to meet our mission to deliver reliable energy and superior customer service all day, every day.
Eversource will be our brand in the energy and financial marketplace. On February 19, we changed our ticker symbol to “ES,” and at our
April 29, 2015 Annual Meeting of Shareholders, our shareholders will consider a proposal to change our legal name to Eversource Energy. We urge you, our shareholders, to support this important change when you vote your shares this spring.
In 2014, we reported recurring earnings of $2.65 per share, compared with recurring earnings of $2.53 in 2013. This trajectory is consistent with our goal of increasing earnings per share over the long term at a rate of six to eight percent annually. This projected long-term growth rate is among the most attractive across electric utilities in the United States. Consistent with our financial success, our share price hit all-time highs multiple times during 2014 before ending the year at $53.52, an increase of $11.13, or 26 percent, compared to the 2013 closing price of $42.39. This is the largest absolute annual price increase in our history.
We also raised our annual common dividend by 6.8 percentin 2014 to $1.57 per share. The combination of share price appreciation and dividends paid during the year provided shareholders with a total return of 30.5 percent in 2014, a performance that exceeded the 28.9 percent return for theEEI Index of our peers and is more than double the 13.7 percent return achieved by the S&P 500 in 2014.
Our total 2014 return also represents the sixth consecutive year of double-digit returns for shareholders, an achievement earned by just three other companies in the EEI Index. In addition, we have begun 2015 on a positive note with the announcement of another dividend increase, e�ective March 31, 2015, making the annualized common dividend level $1.67 per share. This is our sixteenth dividend increase over the past fifteen years.
As in previous years, our continued growth in earnings and compelling share price performance are a direct result of our operational success and future outlook. We have been diligently integrating our business, creating e�ciencies that generate cost savings, while also improving service to customers.
By standardizing, simplifying and improving work processes,our employees were able to safely meet or exceed our demanding reliability, call response and customer-focused performance targets. I am particularly proud of our electric reliability performance in 2014, as the average electric customer’s reliability has improved 29 percent since 2011. Overall, our reliability results were the best ever for the company and place us firmly in the first quartile for performance when compared against our industry peers.
There is no better example of our one company approach than our storm response. During the Thanksgiving holiday, a massive Nor’easter hit New England, wreaking havoc across our service territory, especially New Hampshire. Our talented employees from Connecticut, Massachusetts and New Hampshire worked side-by-side in a coordinated restoration e�ort that safely brought power back in just three days to over 300,000, or about
60 percent, of our New Hampshire customers. That record-setting restoration rate would not have occurred without our shared commitment to adopting common practices that benefit the customer—during storms, on blue sky days, and in all other aspects of our business.
We also take seriously our role in the regional energy marketplace as an active, committed advocate for our customers. There has been a clear regional shift to natural gas as the fuel of choice for heating and power production. Unfortunately, no substantial pipeline capacity has been built into New England from domestic supply regions since the 1990s, while gas demand continues to grow and non-gas fired generation capacity in our region continues to retire. About 1,400 megawatts came o� line in 2014 alone, and more than 1,500 additional megawatts of non-gas fired generation are slated to retire in 2017, further stripping the region of electric generation capacity and diversity.
When the New England electric market reached a crisis point during the bitterly cold winter of 2013-2014, these weaknesses inour marketplace were exposed and costs skyrocketed. Roughly 8,000 to 10,000 megawatts at more than a dozen of our region’s most e�cient power plants sat idle without gas supply because the pipeline capacity simply was not there. This is not a one-time problem, but an issue we will continue to face until it is addressed.
As New England’s leading utility, we have an obligation to develop innovative and meaningful solutions to these challenges. That is why we have forged an important partnership with Spectra Energy and National Grid on a new and unique project, Access Northeast, which will meet New England’s current challenges head on. Through Access Northeast, Spectra will upgrade its existing natural gas transmission pipelines in New England and expand gas capacity to our region by more than one billion cubic feet per day. This will help meet regional demands for additional natural gas for heating, while reducing costs for electricity customers throughout New England.
Access Northeast is one of two major projects that could provide significant, long-term diversity and cost savings to New England’s energy customers. Our Northern Pass Transmission Project is another one of those important solutions: a $1.4 billion transmission line that will bring clean hydropower from Canada to customers in our region. We continue to make solid progress with Northern Pass, working to obtain all federal and state permits needed to begin construction. We anticipate both projects will begin serving New England customers by late 2018. These projects will provide needed relief to the region, and our investment in them, which could approach $3 billion in total, should provide us with very attractive earnings growth through the end of the decade.
Additionally, natural gas expansion for heating customers remains a key growth area for our business. In tandem with our work to expand capacity, we continue to answer our customers’ demand to convert to natural gas. In 2014 we added another 10,600 natural gas heating customers and we expect to exceed this level over the next several years as legislation in Connecticut and Massachusetts encourages conversions. In conjunction with expansion, we are accelerating pipeline replacement, which will result in a more modern natural gas delivery system that is less costly to maintain.
Our company continues to support renewable energy investments and energy e�ciency programs for customers are a prominent component of our business. In 2014, we invested approximately $475 million in a variety of energy e�ciency programs. In the last two years we have also received regulatory approval for long-term contracts to purchase approximately 750 megawatts of energy from wind, solar and other renewable facilities in New England. We are pleased that an increasing number of portfolio managers in both the United States and abroad are recognizing Eversource as an attractive, sustainable investment and are including our shares in their funds.
In 2014, we also made progress with our Above and Beyond for Our Customers Initiative, a strategic, comprehensive look at all interactions with our customers at all levels of the company to enhance the overall customer experience. In fact, this initiative is already paying dividends: in 2014, Eversource Energy ranked among J.D. Power’s most improved brands in recent surveys.
Our commitment to customers and the communities where we live and work is also evident in our volunteer programs, charitable giving and signature partnerships with local organizations. For example, this year we joined forces with the Hartford Marathon Foundation to become their title sponsor. An event like the Hartford Marathon invigorates the community and stimulates the economy, providing over $14 million in economic support. It is an honor to support the marathon, as well as our other partners like Boston Children’s Hospital, the United Way and Special Olympics.
Through a determined, One Company focus on the customer, coupled with fiscal discipline, we solidified our position as New England’s premier energy provider, exceeding our shareholders’ and customers’ expectations. 2014 was an impressive and fruitful year, andI look forward to our ongoing success as Eversource Energy in the years to come.
2

Dear Fellow Shareholder,
Our company truly established itselfas a leader in the New England energymarketplace and the overall industry in 2014, as we enhanced our high levels of customer service, operational reliability and financial strength. We are a company committed to always improving and always evaluating howwe can do things better for our customers, employees and shareholders.
I am eager to share details on our manyaccomplishments in 2014. But first and foremost I am proud to introduce Eversource Energy, our company’s new brand and one of the most significant initiatives we undertook in 2014.
In February 2015, Northeast Utilities and allits operating companies o�cially began doing business as Eversource Energy. Over the past three years, our company has carefully and thoughtfully worked to integrate ourorganization and implement best practices consistently across our operations, while meeting and exceeding our customers’ high expectations. With over 8,200 of us coming together and working as one company, the next natural step in our evolution was Eversource, a single brand across all three states and all three of our business areas.
The Eversource brand clearly states who we are in the New England market and gives us the opportunity to tell our customers whatwe stand for as a company. It represents our shared responsibility to meet our mission to deliver reliable energy and superior customer service all day, every day.
Eversource will be our brand in the energy and financial marketplace. On February 19, we changed our ticker symbol to “ES,” and at our
April 29, 2015 Annual Meeting of Shareholders, our shareholders will consider a proposal to change our legal name to Eversource Energy. We urge you, our shareholders, to support this important change when you vote your shares this spring.
In 2014, we reported recurring earnings of $2.65 per share, compared with recurring earnings of $2.53 in 2013. This trajectory is consistent with our goal of increasing earnings per share over the long term at a rate of six to eight percent annually. This projected long-term growth rate is among the most attractive across electric utilities in the United States. Consistent with our financial success, our share price hit all-time highs multiple times during 2014 before ending the year at $53.52, an increase of $11.13, or 26 percent, compared to the 2013 closing price of $42.39. This is the largest absolute annual price increase in our history.
We also raised our annual common dividend by 6.8 percentin 2014 to $1.57 per share. The combination of share price appreciation and dividends paid during the year provided shareholders with a total return of 30.5 percent in 2014, a performance that exceeded the 28.9 percent return for theEEI Index of our peers and is more than double the 13.7 percent return achieved by the S&P 500 in 2014.
Our total 2014 return also represents the sixth consecutive year of double-digit returns for shareholders, an achievement earned by just three other companies in the EEI Index. In addition, we have begun 2015 on a positive note with the announcement of another dividend increase, e�ective March 31, 2015, making the annualized common dividend level $1.67 per share. This is our sixteenth dividend increase over the past fifteen years.
As in previous years, our continued growth in earnings and compelling share price performance are a direct result of our operational success and future outlook. We have been diligently integrating our business, creating e�ciencies that generate cost savings, while also improving service to customers.
By standardizing, simplifying and improving work processes,our employees were able to safely meet or exceed our demanding reliability, call response and customer-focused performance targets. I am particularly proud of our electric reliability performance in 2014, as the average electric customer’s reliability has improved 29 percent since 2011. Overall, our reliability results were the best ever for the company and place us firmly in the first quartile for performance when compared against our industry peers.
There is no better example of our one company approach than our storm response. During the Thanksgiving holiday, a massive Nor’easter hit New England, wreaking havoc across our service territory, especially New Hampshire. Our talented employees from Connecticut, Massachusetts and New Hampshire worked side-by-side in a coordinated restoration e�ort that safely brought power back in just three days to over 300,000, or about
60 percent, of our New Hampshire customers. That record-setting restoration rate would not have occurred without our shared commitment to adopting common practices that benefit the customer—during storms, on blue sky days, and in all other aspects of our business.
We also take seriously our role in the regional energy marketplace as an active, committed advocate for our customers. There has been a clear regional shift to natural gas as the fuel of choice for heating and power production. Unfortunately, no substantial pipeline capacity has been built into New England from domestic supply regions since the 1990s, while gas demand continues to grow and non-gas fired generation capacity in our region continues to retire. About 1,400 megawatts came o� line in 2014 alone, and more than 1,500 additional megawatts of non-gas fired generation are slated to retire in 2017, further stripping the region of electric generation capacity and diversity.
When the New England electric market reached a crisis point during the bitterly cold winter of 2013-2014, these weaknesses inour marketplace were exposed and costs skyrocketed. Roughly 8,000 to 10,000 megawatts at more than a dozen of our region’s most e�cient power plants sat idle without gas supply because the pipeline capacity simply was not there. This is not a one-time problem, but an issue we will continue to face until it is addressed.
As New England’s leading utility, we have an obligation to develop innovative and meaningful solutions to these challenges. That is why we have forged an important partnership with Spectra Energy and National Grid on a new and unique project, Access Northeast, which will meet New England’s current challenges head on. Through Access Northeast, Spectra will upgrade its existing natural gas transmission pipelines in New England and expand gas capacity to our region by more than one billion cubic feet per day. This will help meet regional demands for additional natural gas for heating, while reducing costs for electricity customers throughout New England.
Access Northeast is one of two major projects that could provide significant, long-term diversity and cost savings to New England’s energy customers. Our Northern Pass Transmission Project is another one of those important solutions: a $1.4 billion transmission line that will bring clean hydropower from Canada to customers in our region. We continue to make solid progress with Northern Pass, working to obtain all federal and state permits needed to begin construction. We anticipate both projects will begin serving New England customers by late 2018. These projects will provide needed relief to the region, and our investment in them, which could approach $3 billion in total, should provide us with very attractive earnings growth through the end of the decade.
Additionally, natural gas expansion for heating customers remains a key growth area for our business. In tandem with our work to expand capacity, we continue to answer our customers’ demand to convert to natural gas. In 2014 we added another 10,600 natural gas heating customers and we expect to exceed this level over the next several years as legislation in Connecticut and Massachusetts encourages conversions. In conjunction with expansion, we are accelerating pipeline replacement, which will result in a more modern natural gas delivery system that is less costly to maintain.
Our company continues to support renewable energy investments and energy e�ciency programs for customers are a prominent component of our business. In 2014, we invested approximately $475 million in a variety of energy e�ciency programs. In the last two years we have also received regulatory approval for long-term contracts to purchase approximately 750 megawatts of energy from wind, solar and other renewable facilities in New England. We are pleased that an increasing number of portfolio managers in both the United States and abroad are recognizing Eversource as an attractive, sustainable investment and are including our shares in their funds.
In 2014, we also made progress with our Above and Beyond for Our Customers Initiative, a strategic, comprehensive look at all interactions with our customers at all levels of the company to enhance the overall customer experience. In fact, this initiative is already paying dividends: in 2014, Eversource Energy ranked among J.D. Power’s most improved brands in recent surveys.
Our commitment to customers and the communities where we live and work is also evident in our volunteer programs, charitable giving and signature partnerships with local organizations. For example, this year we joined forces with the Hartford Marathon Foundation to become their title sponsor. An event like the Hartford Marathon invigorates the community and stimulates the economy, providing over $14 million in economic support. It is an honor to support the marathon, as well as our other partners like Boston Children’s Hospital, the United Way and Special Olympics.
Through a determined, One Company focus on the customer, coupled with fiscal discipline, we solidified our position as New England’s premier energy provider, exceeding our shareholders’ and customers’ expectations. 2014 was an impressive and fruitful year, andI look forward to our ongoing success as Eversource Energy in the years to come.
3

Dear Fellow Shareholder,
Our company truly established itselfas a leader in the New England energymarketplace and the overall industry in 2014, as we enhanced our high levels of customer service, operational reliability and financial strength. We are a company committed to always improving and always evaluating howwe can do things better for our customers, employees and shareholders.
I am eager to share details on our manyaccomplishments in 2014. But first and foremost I am proud to introduce Eversource Energy, our company’s new brand and one of the most significant initiatives we undertook in 2014.
In February 2015, Northeast Utilities and allits operating companies o�cially began doing business as Eversource Energy. Over the past three years, our company has carefully and thoughtfully worked to integrate ourorganization and implement best practices consistently across our operations, while meeting and exceeding our customers’ high expectations. With over 8,200 of us coming together and working as one company, the next natural step in our evolution was Eversource, a single brand across all three states and all three of our business areas.
The Eversource brand clearly states who we are in the New England market and gives us the opportunity to tell our customers whatwe stand for as a company. It represents our shared responsibility to meet our mission to deliver reliable energy and superior customer service all day, every day.
Eversource will be our brand in the energy and financial marketplace. On February 19, we changed our ticker symbol to “ES,” and at our
April 29, 2015 Annual Meeting of Shareholders, our shareholders will consider a proposal to change our legal name to Eversource Energy. We urge you, our shareholders, to support this important change when you vote your shares this spring.
In 2014, we reported recurring earnings of $2.65 per share, compared with recurring earnings of $2.53 in 2013. This trajectory is consistent with our goal of increasing earnings per share over the long term at a rate of six to eight percent annually. This projected long-term growth rate is among the most attractive across electric utilities in the United States. Consistent with our financial success, our share price hit all-time highs multiple times during 2014 before ending the year at $53.52, an increase of $11.13, or 26 percent, compared to the 2013 closing price of $42.39. This is the largest absolute annual price increase in our history.
We also raised our annual common dividend by 6.8 percentin 2014 to $1.57 per share. The combination of share price appreciation and dividends paid during the year provided shareholders with a total return of 30.5 percent in 2014, a performance that exceeded the 28.9 percent return for theEEI Index of our peers and is more than double the 13.7 percent return achieved by the S&P 500 in 2014.
Our total 2014 return also represents the sixth consecutive year of double-digit returns for shareholders, an achievement earned by just three other companies in the EEI Index. In addition, we have begun 2015 on a positive note with the announcement of another dividend increase, e�ective March 31, 2015, making the annualized common dividend level $1.67 per share. This is our sixteenth dividend increase over the past fifteen years.
As in previous years, our continued growth in earnings and compelling share price performance are a direct result of our operational success and future outlook. We have been diligently integrating our business, creating e�ciencies that generate cost savings, while also improving service to customers.
By standardizing, simplifying and improving work processes,our employees were able to safely meet or exceed our demanding reliability, call response and customer-focused performance targets. I am particularly proud of our electric reliability performance in 2014, as the average electric customer’s reliability has improved 29 percent since 2011. Overall, our reliability results were the best ever for the company and place us firmly in the first quartile for performance when compared against our industry peers.
There is no better example of our one company approach than our storm response. During the Thanksgiving holiday, a massive Nor’easter hit New England, wreaking havoc across our service territory, especially New Hampshire. Our talented employees from Connecticut, Massachusetts and New Hampshire worked side-by-side in a coordinated restoration e�ort that safely brought power back in just three days to over 300,000, or about
60 percent, of our New Hampshire customers. That record-setting restoration rate would not have occurred without our shared commitment to adopting common practices that benefit the customer—during storms, on blue sky days, and in all other aspects of our business.
We also take seriously our role in the regional energy marketplace as an active, committed advocate for our customers. There has been a clear regional shift to natural gas as the fuel of choice for heating and power production. Unfortunately, no substantial pipeline capacity has been built into New England from domestic supply regions since the 1990s, while gas demand continues to grow and non-gas fired generation capacity in our region continues to retire. About 1,400 megawatts came o� line in 2014 alone, and more than 1,500 additional megawatts of non-gas fired generation are slated to retire in 2017, further stripping the region of electric generation capacity and diversity.
When the New England electric market reached a crisis point during the bitterly cold winter of 2013-2014, these weaknesses inour marketplace were exposed and costs skyrocketed. Roughly 8,000 to 10,000 megawatts at more than a dozen of our region’s most e�cient power plants sat idle without gas supply because the pipeline capacity simply was not there. This is not a one-time problem, but an issue we will continue to face until it is addressed.
As New England’s leading utility, we have an obligation to develop innovative and meaningful solutions to these challenges. That is why we have forged an important partnership with Spectra Energy and National Grid on a new and unique project, Access Northeast, which will meet New England’s current challenges head on. Through Access Northeast, Spectra will upgrade its existing natural gas transmission pipelines in New England and expand gas capacity to our region by more than one billion cubic feet per day. This will help meet regional demands for additional natural gas for heating, while reducing costs for electricity customers throughout New England.
Access Northeast is one of two major projects that could provide significant, long-term diversity and cost savings to New England’s energy customers. Our Northern Pass Transmission Project is another one of those important solutions: a $1.4 billion transmission line that will bring clean hydropower from Canada to customers in our region. We continue to make solid progress with Northern Pass, working to obtain all federal and state permits needed to begin construction. We anticipate both projects will begin serving New England customers by late 2018. These projects will provide needed relief to the region, and our investment in them, which could approach $3 billion in total, should provide us with very attractive earnings growth through the end of the decade.
Additionally, natural gas expansion for heating customers remains a key growth area for our business. In tandem with our work to expand capacity, we continue to answer our customers’ demand to convert to natural gas. In 2014 we added another 10,600 natural gas heating customers and we expect to exceed this level over the next several years as legislation in Connecticut and Massachusetts encourages conversions. In conjunction with expansion, we are accelerating pipeline replacement, which will result in a more modern natural gas delivery system that is less costly to maintain.
Our company continues to support renewable energy investments and energy e�ciency programs for customers are a prominent component of our business. In 2014, we invested approximately $475 million in a variety of energy e�ciency programs. In the last two years we have also received regulatory approval for long-term contracts to purchase approximately 750 megawatts of energy from wind, solar and other renewable facilities in New England. We are pleased that an increasing number of portfolio managers in both the United States and abroad are recognizing Eversource as an attractive, sustainable investment and are including our shares in their funds.
In 2014, we also made progress with our Above and Beyond for Our Customers Initiative, a strategic, comprehensive look at all interactions with our customers at all levels of the company to enhance the overall customer experience. In fact, this initiative is already paying dividends: in 2014, Eversource Energy ranked among J.D. Power’s most improved brands in recent surveys.
Our commitment to customers and the communities where we live and work is also evident in our volunteer programs, charitable giving and signature partnerships with local organizations. For example, this year we joined forces with the Hartford Marathon Foundation to become their title sponsor. An event like the Hartford Marathon invigorates the community and stimulates the economy, providing over $14 million in economic support. It is an honor to support the marathon, as well as our other partners like Boston Children’s Hospital, the United Way and Special Olympics.
Through a determined, One Company focus on the customer, coupled with fiscal discipline, we solidified our position as New England’s premier energy provider, exceeding our shareholders’ and customers’ expectations. 2014 was an impressive and fruitful year, andI look forward to our ongoing success as Eversource Energy in the years to come.
4

UNITED STATES SECURITIES AND EXCHANGE COMMISSIONWASHINGTON, D.C. 20549
FORM 10-K
ANNUAL REPORT PURSUANT TO SECTION 13 OR 15(d) OF THE SECURITIES EXCHANGE ACT OF 1934
For the Fiscal Year Ended December 31, 2014
or
TRANSITION REPORT PURSUANT TO SECTION 13 OR 15(d) OF THE SECURITIES EXCHANGE ACT OF 1934
For the transition period from ____________ to ____________
CommissionFile Number
Registrant; State of Incorporation;Address; and Telephone Number
I.R.S. EmployerIdentification No.
1-5324 NORTHEAST UTILITIES(a Massachusetts voluntary association)300 Cadwell DriveSpringfield, Massachusetts 01104Telephone: (413) 785-5871
04-2147929
0-00404 THE CONNECTICUT LIGHT AND POWER COMPANY(a Connecticut corporation)107 Selden StreetBerlin, Connecticut 06037-1616 Telephone: (860) 665-5000
06-0303850
1-02301 NSTAR ELECTRIC COMPANY(a Massachusetts corporation)800 Boylston StreetBoston, Massachusetts 02199Telephone: (617) 424-2000
04-1278810
1-6392 PUBLIC SERVICE COMPANY OF NEW HAMPSHIRE(a New Hampshire corporation)Energy Park780 North Commercial StreetManchester, New Hampshire 03101-1134Telephone: (603) 669-4000
02-0181050
0-7624 WESTERN MASSACHUSETTS ELECTRIC COMPANY(a Massachusetts corporation)300 Cadwell DriveSpringfield, Massachusetts 01104Telephone: (413) 785-5871
04-1961130

Securities registered pursuant to Section 12(b) of the Act:
Registrant Title of Each ClassName of Each Exchange on Which Registered
Northeast Utilities Common Shares, $5.00 par value New York Stock Exchange, Inc.
Securities registered pursuant to Section 12(g) of the Act:
Registrant Title of Each Class
The Connecticut Light and Power Company Preferred Stock, par value $50.00 per share, issuable in series, of which the following series are outstanding:
$1.90 Series of 1947$2.00 Series of 1947$2.04 Series of 1949$2.20 Series of 1949
3.90% Series of 1949$2.06 Series E of 1954$2.09 Series F of 1955
4.50% Series of 19564.96% Series of 19584.50% Series of 19635.28% Series of 1967
$3.24 Series G of 19686.56% Series of 1968
NSTAR Electric Company Preferred Stock, par value $100.00 per share, issuable in series, of which the following series are outstanding:
4.25% Series4.78% Series
NSTAR Electric Company, Public Service Company of New Hampshire and Western Massachusetts Electric Company each meet the conditions set forth in General Instruction I(1)(a) and (b) of Form 10-K and each is therefore filing this Form 10-K with the reduced disclosure format specified in General Instruction I(2) to Form 10-K.
Indicate by check mark if the registrants are well-known seasoned issuers, as defined in Rule 405 of the Securities Act.
Yes No
Indicate by check mark if the registrants are not required to file reports pursuant to Section 13 or Section 15(d) of the Act.
Yes No
Indicate by check mark whether the registrants (1) have filed all reports required to be filed by Section 13 or 15(d) of the Securities Exchange Act of 1934 during the preceding 12 months (or for such shorter period that the registrants were required to file such reports), and (2) have been subject to such filing requirements for the past 90 days.
Yes No
Indicate by check mark whether the registrants have submitted electronically and posted on its corporate Web sites, if any, every Interactive Data File required to be submitted and posted pursuant to Rule 405 of Regulation S-T during the preceding 12 months (or for such shorter period that the registrant was required to submit and post such files).
Yes No

Indicate by check mark if disclosure of delinquent filers pursuant to Item 405 of Regulation S-K is not contained herein, and will not be contained, to the best of the registrants' knowledge, in definitive proxy or information statements incorporated by reference in Part III of this Form 10-K or any amendment to this Form 10-K.
Indicate by check mark whether the registrant is a large accelerated filer, an accelerated filer, or a non-accelerated filer. See definition of "accelerated filer" and "large accelerated filer" in Rule 12b-2 of the Exchange Act. (Check one):
LargeAccelerated Filer
AcceleratedFiler
Non-acceleratedFiler
Northeast Utilities The Connecticut Light and Power Company NSTAR Electric Company Public Service Company of New Hampshire Western Massachusetts Electric Company
Indicate by check mark whether the registrants are shell companies (as defined in Rule 12b-2 of the Exchange Act):
Yes No
Northeast Utilities The Connecticut Light and Power Company NSTAR Electric Company Public Service Company of New Hampshire Western Massachusetts Electric Company
The aggregate market value of Northeast Utilities' Common Shares, $5.00 par value, held by non-affiliates, computed by reference to the price at which the common equity was last sold, or the average bid and asked price of such common equity, as of the last business day of Northeast Utilities'most recently completed second fiscal quarter (June 30, 2014) was $14,947,688,864 based on a closing market price of $47.27 per share for the 316,219,354 common shares outstanding on June 30, 2014.
Indicate the number of shares outstanding of each of the issuers' classes of common stock, as of the latest practicable date:
Company - Class of Stock Outstanding as of January 31, 2015Northeast UtilitiesCommon shares, $5.00 par value 317,203,765 shares
The Connecticut Light and Power CompanyCommon stock, $10.00 par value
NSTAR Electric CompanyCommon Stock, $1.00 par value
6,035,205 shares
100 shares
Public Service Company of New HampshireCommon stock, $1.00 par value 301 shares
Western Massachusetts Electric CompanyCommon stock, $25.00 par value 434,653 shares
Northeast Utilities holds all of the 6,035,205 shares, 100 shares, 301 shares, and 434,653 shares of the outstanding common stock of The Connecticut Light and Power Company, NSTAR Electric Company, Public Service Company of New Hampshire and Western Massachusetts Electric Company, respectively.
Northeast Utilities, The Connecticut Light and Power Company, NSTAR Electric Company, Public Service Company of New Hampshire, and Western Massachusetts Electric Company each separately file this combined Form 10-K. Information contained herein relating to any individual registrant is filed by such registrant on its own behalf. Each registrant makes no representation as to information relating to the other registrants.
i
GLOSSARY OF TERMS
The following is a glossary of abbreviations or acronyms that are found in this report:
CURRENT OR FORMER NU COMPANIES, SEGMENTS OR INVESTMENTS:
CL&P The Connecticut Light and Power CompanyCYAPC Connecticut Yankee Atomic Power CompanyMYAPC Maine Yankee Atomic Power CompanyNPT Northern Pass Transmission LLCNSTAR Parent Company of NSTAR Electric, NSTAR Gas and other subsidiaries (prior to the merger with NU)NSTAR Electric NSTAR Electric CompanyNSTAR Electric & Gas NSTAR Electric & Gas Corporation, a former Northeast Utilities service company (effective January 1, 2014
merged into NUSCO)NSTAR Gas NSTAR Gas CompanyNU or the Company Northeast Utilities and subsidiaries, effective February 2, 2015, doing business as Eversource EnergyNU parent and other companies NU parent and other companies is comprised of NU parent, NUSCO and other subsidiaries, which primarily
include NU Enterprises, Inc. (the parent company of our unregulated businesses), HWP Company (formerly the Holyoke Water Power Company), The Rocky River Realty Company (a real estate subsidiary), and the consolidated operations of CYAPC and YAEC
NUSCO Northeast Utilities Service Company (effective January 1, 2014 includes the operations of NSTAR Electric & Gas)
EETV Eversource Energy Transmission Ventures, Inc., the parent company of NPT and Renewable Properties, Inc. (formerly Northeast Utilities Transmission Ventures, Inc.)
PSNH Public Service Company of New HampshireRegulated companies NU's Regulated companies, comprised of the electric distribution and transmission businesses of CL&P,
NSTAR Electric, PSNH, and WMECO, the natural gas distribution businesses of Yankee Gas and NSTAR Gas, the generation activities of PSNH and WMECO, and NPT
WMECO Western Massachusetts Electric CompanyYAEC Yankee Atomic Electric CompanyYankee Companies CYAPC, YAEC and MYAPCYankee Gas Yankee Gas Services CompanyREGULATORS:DEEP Connecticut Department of Energy and Environmental ProtectionDOE U.S. Department of EnergyDOER Massachusetts Department of Energy ResourcesDPU Massachusetts Department of Public UtilitiesEPA U.S. Environmental Protection AgencyFERC Federal Energy Regulatory CommissionISO-NE ISO New England, Inc., the New England Independent System OperatorMA DEP Massachusetts Department of Environmental ProtectionNHPUC New Hampshire Public Utilities CommissionPURA Connecticut Public Utilities Regulatory AuthoritySEC U.S. Securities and Exchange CommissionSJC Supreme Judicial Court of MassachusettsOTHER:AFUDC Allowance For Funds Used During ConstructionAOCI Accumulated Other Comprehensive Income/(Loss)ARO Asset Retirement ObligationC&LM Conservation and Load ManagementCfD Contract for DifferencesClean Air Project The construction of a wet flue gas desulphurization system, known as "scrubber technology," to reduce
mercury emissions of the Merrimack coal-fired generation station in Bow, New HampshireCO2 Carbon dioxide
CPSL Capital Projects Scheduling ListCTA Competitive Transition AssessmentCWIP Construction Work in ProgressEPS Earnings Per ShareERISA Employee Retirement Income Security Act of 1974ES Default Energy ServiceESOP Employee Stock Ownership PlanESPP Employee Share Purchase PlanFERC ALJ FERC Administrative Law JudgeFitch Fitch RatingsFMCC Federally Mandated Congestion ChargeFTR Financial Transmission RightsGAAP Accounting principles generally accepted in the United States of AmericaGSC Generation Service Charge

ii
GSRP Greater Springfield Reliability ProjectGWh Gigawatt-HoursHQ Hydro-Québec, a corporation wholly owned by the Québec government, including its divisions that produce,
transmit and distribute electricity in Québec, CanadaHVDC High voltage direct currentHydro Renewable Energy Hydro Renewable Energy, Inc., a wholly owned subsidiary of Hydro-QuébecIPP Independent Power ProducersISO-NE Tariff ISO-NE FERC Transmission, Markets and Services TariffkV KilovoltkW Kilowatt (equal to one thousand watts)kWh Kilowatt-Hours (the basic unit of electricity energy equal to one kilowatt of power supplied for one hour)LBR Lost Base RevenueLNG Liquefied natural gasLRS Supplier of last resort serviceMGP Manufactured Gas PlantMMBtu One million British thermal unitsMoody's Moody's Investors Services, Inc.MW MegawattMWh Megawatt-HoursNEEWS New England East-West SolutionNorthern Pass The high voltage direct current transmission line project from Canada into New HampshireNOx Nitrogen oxides
NU 2013 Form 10-K The Northeast Utilities and Subsidiaries 2013 combined Annual Report on Form 10-K as filed with the SECPAM Pension and PBOP Rate Adjustment MechanismPBOP Postretirement Benefits Other Than PensionPBOP Plan Postretirement Benefits Other Than Pension Plan that provides certain retiree health care benefits, primarily
medical and dental, and life insurance benefitsPCRBs Pollution Control Revenue BondsPension Plan Single uniform noncontributory defined benefit retirement planPPA Pension Protection ActRECs Renewable Energy CertificatesRegulatory ROE The average cost of capital method for calculating the return on equity related to the distribution and
generation business segment excluding the wholesale transmission segmentROE Return on EquityRRB Rate Reduction Bond or Rate Reduction CertificateRSUs Restricted share unitsS&P Standard & Poor's Financial Services LLCSBC Systems Benefits ChargeSCRC Stranded Cost Recovery ChargeSERP Supplemental Executive Retirement Plans and non-qualified defined benefit retirement plansSIP Simplified Incentive PlanSO2 Sulfur dioxide
SS Standard serviceTCAM Transmission Cost Adjustment MechanismTSA Transmission Service AgreementUI The United Illuminating Company

iii
NORTHEAST UTILITIES AND SUBSIDIARIESTHE CONNECTICUT LIGHT AND POWER COMPANYNSTAR ELECTRIC COMPANY AND SUBSIDIARYPUBLIC SERVICE COMPANY OF NEW HAMPSHIRE AND SUBSIDIARYWESTERN MASSACHUSETTS ELECTRIC COMPANY
2014 FORM 10-K ANNUAL REPORT
TABLE OF CONTENTS
Part I Page
Item 1. Business 2
Item 1A. Risk Factors 15
Item 1B. Unresolved Staff Comments 19
Item 2. Properties 20
Item 3. Legal Proceedings 22
Item 4. Mine Safety Disclosures 23
Part II
Item 5. Market for the Registrants' Common Equity, Related Stockholder Matters and Issuer Purchases of Equity Securities 24
Item 6. Selected Consolidated Financial Data 26
Item 7. Management's Discussion and Analysis of Financial Condition and Results of Operations 28
Item 7A. Quantitative and Qualitative Disclosures about Market Risk 50
Item 8. Financial Statements and Supplementary Data 51
Item 9. Changes in and Disagreements with Accountants on Accounting and Financial Disclosure 106
Item 9A. Controls and Procedures 106
Item 9B. Other Information 106
Part III
Item 10. Directors, Executive Officers and Corporate Governance 107
Item 11. Executive Compensation 107
Item 12. Security Ownership of Certain Beneficial Owners and Management and Related Stockholder Matters 107
Item 13. Certain Relationships and Related Transactions, and Director Independence 108
Item 14. Principal Accountant Fees and Services 108
Part IV
Item 15. Exhibits and Financial Statement Schedules 109
Signatures 110

1
NORTHEAST UTILITIES AND SUBSIDIARIESTHE CONNECTICUT LIGHT AND POWER COMPANY
NSTAR ELECTRIC COMPANY AND SUBSIDIARYPUBLIC SERVICE COMPANY OF NEW HAMPSHIRE AND SUBSIDIARY
WESTERN MASSACHUSETTS ELECTRIC COMPANY
SAFE HARBOR STATEMENT UNDER THE PRIVATE SECURITIESLITIGATION REFORM ACT OF 1995
References in this Annual Report on Form 10-K to "NU," "the Company," "we," "our," and "us" refer to Northeast Utilities and its subsidiaries. Effective February 2, 2015, the Company began doing business as Eversource Energy.
From time to time we make statements concerning our expectations, beliefs, plans, objectives, goals, strategies, assumptions of future events, future financial performance or growth and other statements that are not historical facts. These statements are "forward-looking statements" within the meaning of the Private Securities Litigation Reform Act of 1995. You can generally identify our forward-looking statements through the use of words or phrases such as "estimate," "expect," "anticipate," "intend," "plan," "project," "believe," "forecast," "should," "could," and other similar expressions. Forward-looking statements are based on the current expectations, estimates, assumptions or projections of management and are not guarantees of future performance. These expectations, estimates, assumptions or projections may vary materially from actual results. Accordingly, any such statements are qualified in their entirety by reference to, and are accompanied by, the following important factors that could cause our actual results to differ materially from those contained in our forward-looking statements, including, but not limited to:
cyber breaches, acts of war or terrorism, or grid disturbances, actions or inaction of local, state and federal regulatory, public policy and taxing bodies, changes in business and economic conditions, including their impact on interest rates, bad debt expense, and demand for our products and
services, which could include disruptive technology related to our current or future business model, fluctuations in weather patterns, changes in laws, regulations or regulatory policy, changes in levels or timing of capital expenditures, disruptions in the capital markets or other events that make our access to necessary capital more difficult or costly, developments in legal or public policy doctrines, technological developments, changes in accounting standards and financial reporting regulations, actions of rating agencies, and other presently unknown or unforeseen factors.
Other risk factors are detailed in our reports filed with the SEC and updated as necessary, and we encourage you to consult such disclosures.
All such factors are difficult to predict, contain uncertainties that may materially affect our actual results and are beyond our control. You should not place undue reliance on the forward-looking statements, each speaks only as of the date on which such statement is made, and we undertake no obligation to update any forward-looking statement or statements to reflect events or circumstances after the date on which such statement is made or to reflect the occurrence of unanticipated events. New factors emerge from time to time and it is not possible for us to predict all of such factors, nor can we assess the impact of each such factor on the business or the extent to which any factor, or combination of factors, may cause actual results to differ materially from those contained in any forward-looking statements. For more information, see Item 1A, Risk Factors, included in this combined Annual Report on Form 10-K. This Annual Report on Form 10-K also describes material contingencies and critical accounting policies in the accompanying Management's Discussion and Analysis of Financial Condition and Results of Operations and Combined Notes to Consolidated Financial Statements. We encourage you to review these items.

2
NORTHEAST UTILITIES AND SUBSIDIARIESTHE CONNECTICUT LIGHT AND POWER COMPANY
NSTAR ELECTRIC COMPANY AND SUBSIDIARYPUBLIC SERVICE COMPANY OF NEW HAMPSHIRE AND SUBSIDIARY
WESTERN MASSACHUSETTS ELECTRIC COMPANY
PART I
Item 1. Business
Please refer to the Glossary of Terms for definitions of defined terms and abbreviations used in this combined Annual Report on Form 10-K.
On February 2, 2015, NU and each of its wholly owned utility subsidiaries listed below commenced doing business as Eversource Energy. NU, headquartered in Boston, Massachusetts and Hartford, Connecticut, is a public utility holding company subject to regulation by FERC under the Public Utility Holding Company Act of 2005. We are engaged primarily in the energy delivery business through the following wholly owned utility subsidiaries:
The Connecticut Light and Power Company (CL&P), a regulated electric utility that serves residential, commercial and industrial customers in parts of Connecticut;
NSTAR Electric Company (NSTAR Electric), a regulated electric utility that serves residential, commercial and industrial customers in parts of Massachusetts;
Public Service Company of New Hampshire (PSNH), a regulated electric utility that serves residential, commercial and industrial customers in parts of New Hampshire and owns generation assets used to serve customers;
Western Massachusetts Electric Company (WMECO), a regulated electric utility that serves residential, commercial and industrial customers in parts of western Massachusetts and owns solar generating assets;
NSTAR Gas Company (NSTAR Gas), a regulated natural gas utility that serves residential, commercial and industrial customers in parts of Massachusetts; and
Yankee Gas Services Company (Yankee Gas), a regulated natural gas utility that serves residential, commercial and industrial customers in parts of Connecticut.
CL&P, NSTAR Electric, PSNH and WMECO also serve New England customers through NU's electric transmission business.
NU, CL&P, NSTAR Electric, PSNH and WMECO each report their financial results separately. We also include information in this report on a segment basis for NU. NU recognizes three reportable segments, which are electric distribution, electric transmission and natural gas distribution. NU's electric distribution segment includes the generation businesses of PSNH and WMECO. These three segments represented substantially all of NU's total consolidated revenues for the years ended December 31, 2014 and 2013. CL&P, NSTAR Electric, PSNH and WMECO do not report separate business segments.
ELECTRIC DISTRIBUTION SEGMENT
General
NU's electric distribution segment consists of the distribution businesses of CL&P, NSTAR Electric, PSNH and WMECO, which are engaged in the distribution of electricity to retail customers in Connecticut, eastern Massachusetts, New Hampshire and western Massachusetts, respectively, plus the regulated electric generation businesses of PSNH and WMECO.
The following table shows the sources of 2014 electric franchise retail revenues for NU's electric distribution companies, collectively, based on categories of customers:
(Thousands of Dollars, except percentages) 2014 % of Total
Residential $ 3,288,313 53
Commercial 2,471,440 40
Industrial 348,698 6
Other and Eliminations 125,830 1
Total Retail Electric Revenues $ 6,234,281 100%

3
A summary of our distribution companies' retail electric GWh sales volumes and percentage changes for 2014, as compared to 2013, is as follows:
2014 2013
Percentage
Change
Residential 21,317 21,896 (2.6)%
Commercial 27,449 27,787 (1.2)%
Industrial 5,676 5,648 0.5 %
Total 54,442 55,331 (1.6)%
Our 2014 consolidated retail electric sales volumes were lower, as compared to 2013, due primarily to cooler summer weather in 2014 as well as an increase in customer conservation efforts primarily by our residential customers, including the impact of energy efficiency programs sponsored by CL&P, NSTAR Electric and WMECO.
For WMECO and CL&P (effective December 1, 2014), fluctuations in retail electric sales volumes do not impact earnings due to the regulatory commission approved revenue decoupling mechanisms. Distribution revenues are decoupled from their customer sales volumes. CL&P and WMECO reconcile their annual base distribution rate recovery to pre-established levels of baseline distribution delivery service revenues. Any difference between the allowed level of distribution revenue and the actual amount incurred during a 12-month period is adjusted through rates in the following period. The decoupling mechanism effectively breaks the relationship between sales volumes and revenues recognized. Prior to December 1, 2014, CL&P recognized LBR related to reductions in sales volume as a result of successful energy efficiency programs. LBR was recovered from retail customers through the FMCC. Effective December 1, 2014, CL&P no longer recognizes LBR due to its revenue decoupling mechanism.
ELECTRIC DISTRIBUTION – CONNECTICUT
THE CONNECTICUT LIGHT AND POWER COMPANY
CL&P's distribution business consists primarily of the purchase, delivery and sale of electricity to its residential, commercial and industrial customers. As of December 31, 2014, CL&P furnished retail franchise electric service to approximately 1.2 million customers in 149 cities and towns in Connecticut, covering an area of 4,400 square miles. CL&P does not own any electric generation facilities.
The following table shows the sources of CL&P's 2014 electric franchise retail revenues based on categories of customers:
CL&P
(Thousands of Dollars, except percentages) 2014 % of Total
Residential $ 1,474,181 58
Commercial 879,343 35
Industrial 149,220 6
Other 43,050 1
Total Retail Electric Revenues $ 2,545,794 100%
A summary of CL&P's retail electric GWh sales volumes and percentage changes for 2014, as compared to 2013, is as follows:
2014 2013
Percentage
Change
Residential 10,026 10,314 (2.8)%
Commercial 9,643 9,770 (1.3)%
Industrial 2,377 2,320 2.5 %
Total 22,046 22,404 (1.6)%
Rates
CL&P is subject to regulation by PURA, which, among other things, has jurisdiction over rates, certain dispositions of property and plant, mergers and consolidations, issuances of long-term securities, standards of service and construction and operation of facilities. CL&P's present general rate structure consists of various rate and service classifications covering residential, commercial and industrial services. CL&P's retail rates include a delivery service component, which includes distribution, transmission, conservation, renewables, CTA, SBC and other charges that are assessed on all customers. Connecticut utilities are entitled under state law to charge rates that are sufficient to allow them an opportunity to recover their reasonable operating and capital costs, in order to attract needed capital and maintain their financial integrity, while also protecting relevant public interests.
Under Connecticut law, all of CL&P's customers are entitled to choose their energy suppliers, while CL&P remains their electric distribution company. For those customers who do not choose a competitive energy supplier, under SS rates for customers with less than 500 kilowatts of demand, and LRS rates for customers with 500 kilowatts or more of demand, CL&P purchases power under standard offer contracts and passes the cost of the power to customers through a combined GSC and FMCC charge on customers' bills.
CL&P continues to supply approximately 45 percent of its customer load at SS or LRS rates while the other 55 percent of its customer load has migrated to competitive energy suppliers. Because this customer migration is only for energy supply service, it has no impact on CL&P's electric distribution business or its operating income.

4
The rates established by the PURA for CL&P are comprised of the following:
An electric generation services charge (GSC), which recovers energy-related costs incurred as a result of providing electric generation service supply to all customers that have not migrated to competitive energy suppliers. The GSC is adjusted periodically and reconciled semi-annually in accordance with the directives of PURA.
A revenue decoupling adjustment (effective December 1, 2014) that reconciles the amounts recovered from customers, on an annual basis, to the distribution revenue requirement approved by the PURA in its last rate case, which currently is an annual amount of $1.041 billion.
A distribution charge, which includes a fixed customer charge and a demand and/or energy charge to collect the costs of building and expanding the infrastructure to deliver power to its destination, as well as ongoing operating costs to maintain the infrastructure.
A federally-mandated congestion charge (FMCC), which recovers any costs imposed by the FERC as part of the New England Standard Market Design, including locational marginal pricing, locational installed capacity payments, and any costs approved by PURA to reduce these charges. The FMCC also recovers costs associated with CL&P's system resiliency program. The FMCC is adjusted periodically and reconciled semi-annually in accordance with the directives of PURA.
A transmission charge that recovers the cost of transporting electricity over high voltage lines from generating plants to substations, including costs allocated by ISO-NE to maintain the wholesale electric market.
A competitive transition assessment charge (CTA), assessed to recover stranded costs associated with electric industry restructuring such as various IPP contracts. The CTA is reconciled annually to actual costs incurred and reviewed by PURA, with any difference refunded to, or recovered from, customers.
A systems benefits charge (SBC), established to fund expenses associated with: various hardship and low income programs; a program to compensate municipalities for losses in property tax revenue due to decreases in the value of electric generating facilities resulting directly from electric industry restructuring; and unfunded storage and disposal costs for spent nuclear fuel generated before 1983. The SBC is reconciled annually to actual costs incurred and reviewed by PURA, with any difference refunded to, or recovered from, customers.
A Clean Energy Fund charge, which is used to promote investment in renewable energy sources. Amounts collected by this charge are deposited into the Clean Energy Fund and administered by the Clean Energy Finance and Investment Authority. The Clean Energy Fund charge is set by statute and is currently 0.1 cent per kWh.
A conservation charge, comprised of a statutory rate established to implement cost-effective energy conservation programs and market transformation initiatives, plus a conservation adjustment mechanism charge to recover the residual energy efficiency spending associated with the expanded energy efficiency costs directed by the Comprehensive Energy Strategy Plan for Connecticut.
As required by regulation, CL&P, jointly with UI, entered into the following contracts whereby UI will share 20 percent and CL&P will share 80 percent of the costs and benefits (CL&P's portion of these costs are either recovered from, or refunded to, customers through the FMCC charge):
Four CfDs (totaling approximately 787 MW of capacity) with three electric generation units and one demand response project, which extend through 2026 and have terms of up to 15 years beginning in 2009. The capacity CfDs obligate both CL&P and UI to make or receive payments on a monthly basis to or from the project and generation owners based on the difference between a set capacity price and the capacity market prices that the project and generation owners receive in the ISO-NE capacity markets.
Three CfDs (totaling approximately 500 MW of peaking capacity) with three peaking generation units. The three peaker CfDs pay the generation owners the difference between capacity, forward reserve and energy market revenues and a cost-of service payment stream for30 years (including costs of plant operation and the prices that the generation owners receive for capacity and other products in the ISO-NE markets.
Long-term commitments to purchase approximately 250 MW of wind power from a Maine wind farm and 20 MW of solar power from a multi-site project in Connecticut. Both of these projects are expected to be operational by the end of 2016.
On December 17, 2014, PURA approved CL&P's application to amend customer rates, effective December 1, 2014, for a total distribution rate increase of $134 million, which includes an authorized ROE of 9.02 percent for the first twelve month period and 9.17 percent thereafter. The distribution rate increase included a revenue decoupling reconciliation mechanism effective December 1, 2014, and the recovery of 2011 and 2012 storm restoration costs and system resiliency costs. In addition, as part of the rate case, CL&P began recovering the 2013 storm costs and residual 2012 Storm Sandy costs over a seven-year period beginning December 1, 2014. As of December 31, 2014, all of CL&P's deferred storm costs have been addressed by regulatory proceedings.
Sources and Availability of Electric Power Supply
As noted above, CL&P does not own any generation assets and purchases energy supply to serve its SS and LRS loads from a variety of competitive sources through requests for proposals. CL&P periodically enters into full requirements contracts for the majority of SS loads for periods of up to one year for its residential customers and small and medium commercial and industrial customers. CL&P is authorized to supply the remainder of

5
the SS loads through a self-managed process that includes bilateral purchases and spot market purchases. CL&P typically enters into full requirements contracts for LRS for larger commercial and industrial customers every three months. Currently, CL&P has full requirements contracts in place for 80 percent of its SS loads for the first half of 2015 and has bilateral purchases in place to self-manage the remaining 20 percent. For the second half of 2015, CL&P has 50 percent of its SS load under full requirements contracts, intends to purchase an additional 20 to 30 percent of full requirements and will self-manage the remainder as needed. None of the SS load for 2016 has been procured. CL&P has full requirements contracts in place for its LRS loads through the second quarter of 2015 and intends to purchase 100 percent of full requirements for the third and fourth quarters of 2015.
ELECTRIC DISTRIBUTION – MASSACHUSETTS
NSTAR ELECTRIC COMPANY WESTERN MASSACHUSETTS ELECTRIC COMPANY
The electric distribution businesses of NSTAR Electric and WMECO consist primarily of the purchase, delivery and sale of electricity to residential, commercial and industrial customers within their respective franchise service territories. As of December 31, 2014, NSTAR Electric furnished retail franchise electric service to approximately 1.2 million customers in Boston and 80 surrounding cities and towns in Massachusetts, including Cape Cod and Martha's Vineyard, covering an area of approximately 1,700 square miles. WMECO provides retail franchise electric service to approximately 208,000 customers in 59 cities and towns in the western region of Massachusetts, covering an area of approximately 1,500 square miles. Neither NSTAR Electric nor WMECO owns any coal-fired, oil-fired, or hydro-electric generating facilities, and each purchases its respective energy requirements from competitive energy suppliers.
In 2009, WMECO was authorized by the DPU to install solar energy generation in its service territory. From 2010 through 2014, WMECO completed development of a total of 8 MW solar generation facilities on sites in Pittsfield, Springfield, and East Springfield, Massachusetts. WMECO will sell all energy and other products from its solar generation facilities into the ISO-NE market. NSTAR Electric does not own any solar generation facilities.
The following table shows the sources of the 2014 electric franchise retail revenues of NSTAR Electric and WMECO based on categories of customers:
NSTAR Electric WMECO
(Thousands of Dollars, except percentages) 2014 % of Total 2014 % of Total
Residential $ 1,101,704 46 $ 233,675 56
Commercial 1,161,466 49 131,093 31
Industrial 89,643 4 37,211 9
Other 29,765 1 15,470 4
Total Retail Electric Revenues $ 2,382,578 100% $ 417,449 100%
A summary of NSTAR Electric's and WMECO's retail electric GWh sales volumes and percentage changes for 2014, as compared to 2013, is as follows:
NSTAR Electric WMECO
2014 2013
Percentage
Change 2014 2013
Percentage
Change
Residential 6,625 6,831 (3.0)% 1,494 1,544 (3.2)%
Commercial 13,009 13,163 (1.2)% 1,466 1,496 (2.0)%
Industrial 1,291 1,312 (1.6)% 626 643 (2.5)%
Total 20,925 21,306 (1.8)% 3,586 3,683 (2.6)%
Rates
NSTAR Electric and WMECO are each subject to regulation by the DPU, which, among other things, has jurisdiction over rates, certain dispositions of property and plant, mergers and consolidations, issuances of long-term securities, acquisition of securities, standards of service and construction and operation of facilities. The present general rate structure for both NSTAR Electric and WMECO consists of various rate and service classifications covering residential, commercial and industrial services. Massachusetts utilities are entitled under state law to charge rates that are sufficient to allow them an opportunity to recover their reasonable operating and capital costs, in order to attract needed capital and maintain their financial integrity, while also protecting relevant public interests.
Under Massachusetts law, all customers of each of NSTAR Electric and WMECO are entitled to choose their energy suppliers, while NSTAR Electric or WMECO remains their electric distribution company. Both NSTAR Electric and WMECO purchase power from competitive suppliers on behalf of, and pass the related cost through to, their respective customers who do not choose a competitive energy supplier (basic service). Most of the residential and small commercial and industrial customers of NSTAR Electric and WMECO have continued to buy their power from NSTAR Electric or WMECO at basic service rates. Most large commercial and industrial customers have switched to a competitive energy supplier.
The Cape Light Compact, an inter-governmental organization consisting of the 21 towns and two counties on Cape Cod and Martha's Vineyard, serves 200,000 customers through the delivery of energy efficiency programs, effective consumer advocacy, competitive electricity supply and green power options. NSTAR Electric continues to provide electric service to these customers including the delivery of power, maintenance of infrastructure, capital investment, meter reading, billing, and customer service.

6
NSTAR Electric continues to supply approximately 44 percent of its customer load at basic service rates while the other 56 percent of its customer load has migrated to competitive energy suppliers. WMECO continues to supply approximately 51 percent of its customer load at basic service rates while the other 49 percent of its customer load has migrated to competitive energy suppliers. Because customer migration is limited to energy supply service, it has no impact on the delivery business or operating income of NSTAR and WMECO.
The rates established by the DPU for NSTAR Electric and WMECO are comprised of the following:
A basic service charge that represents the collection of energy costs, including costs related to charge-offs of uncollected energy costs from customers. Electric distribution companies in Massachusetts are required to obtain and resell power to retail customers through basic service for those who choose not to buy energy from a competitive energy supplier. Basic service rates are reset every six months (every three months for large commercial and industrial customers). Additionally, the DPU has authorized NSTAR Electric to recover the cost of its Dynamic Pricing Smart Grid Pilot Program through the basic service charge. Basic service costs are reconciled annually.
A distribution charge, which includes a fixed customer charge and a demand and/or energy charge to collect the costs of building and expanding the infrastructure to deliver power to its destination, as well as ongoing operating costs.
For WMECO, a revenue decoupling adjustment that reconciles distribution revenue, on an annual basis, to the amount of distribution revenue approved by the DPU in its last rate case in 2011. Currently, WMECO is allowed to collect $132.4 million annually.
A transmission charge that recovers the cost of transporting electricity over high voltage lines from generating plants to substations, including costs allocated by ISO-NE to maintain the wholesale electric market.
A transition charge that represents costs to be collected primarily from previously held investments in generating plants, costs related to existing above-market power contracts, and contract costs related to long-term power contract buy-outs.
An energy efficiency charge that represents a legislatively-mandated charge to collect costs for energy efficiency programs.
Reconciling adjustment charges that recover certain DPU-approved costs as follows: pension and PBOP benefits, low income customer discounts, lost revenue and credits associated with net-metering facilities installed by customers, storms, consultants retained by the attorney general, and energy efficiency programs and lost base revenue not recovered in the energy efficiency charge. In addition to these adjustments common to both NSTAR Electric and WMECO, NSTAR Electric has reconciling adjustment charges that collect costs associated with certain safety and reliability projects, a Smart Grid pilot program, and long-term renewable contracts. WMECO has a reconciling adjustment charge that recovers costs associated with certain solar projects owned and operated by WMECO.
As required by regulation, NSTAR Electric and WMECO, along with two other Massachusetts electric utilities, signed long-term commitments to purchase a combined estimated generating capacity of approximately 334 MW of wind power from two wind farms in Maine over 15 years. The projects are in various stages of permitting or development and are expected to begin operation in 2015 and 2016.
Pursuant to a 2008 DPU order, Massachusetts electric utilities must adopt rate structures that decouple the volume of energy sales from the utility's revenues in their next rate case. WMECO is currently decoupled and NSTAR Electric will propose decoupling in its next rate case.
NSTAR Electric and WMECO are each subject to service quality (SQ) metrics that measure safety, reliability and customer service, and could be required to pay to customers a SQ charge of up to 2.5 percent of annual transmission and distribution revenues for failing to meet such metrics. Neither NSTAR Electric nor WMECO will be required to pay a SQ charge for its 2014 performance as each company achieved results at or above target for all of its respective SQ metrics in 2014.
Sources and Availability of Electric Power Supply
As noted above, neither NSTAR Electric nor WMECO owns any generation assets (other than WMECO's solar generation), and both companies purchase their respective energy requirements from a variety of competitive sources through requests for proposals issued periodically, consistent with DPU regulations. NSTAR Electric and WMECO enter into supply contracts for basic service for 50 percent of their respective residential and small commercial and industrial customers twice per year for twelve month terms. Both NSTAR Electric and WMECO enter into supply contracts for basic service for 100 percent of large commercial and industrial customers every three months.
ELECTRIC DISTRIBUTION – NEW HAMPSHIRE
PUBLIC SERVICE COMPANY OF NEW HAMPSHIRE
PSNH's distribution business consists primarily of the generation, delivery and sale of electricity to its residential, commercial and industrial customers. As of December 31, 2014, PSNH furnished retail franchise electric service to approximately 504,000 retail customers in 211 cities and towns in New Hampshire, covering an area of approximately 5,630 square miles. PSNH also owns and operates approximately 1,200 MW of primarily coal- and oil-fired electricity generation plants. PSNH's distribution business includes the activities of its generation business.
The Clean Air Project, a wet flue gas desulphurization system (Scrubber), was constructed and placed in service by PSNH at its Merrimack Station in 2011. Tests to date indicate that the Scrubber reduces emissions of SO2 and mercury from Merrimack Station by over 90 percent, which is well in excess of state and federal requirements. PSNH is permitted to recover prudent Scrubber costs through its ES rates under New Hampshire law. In
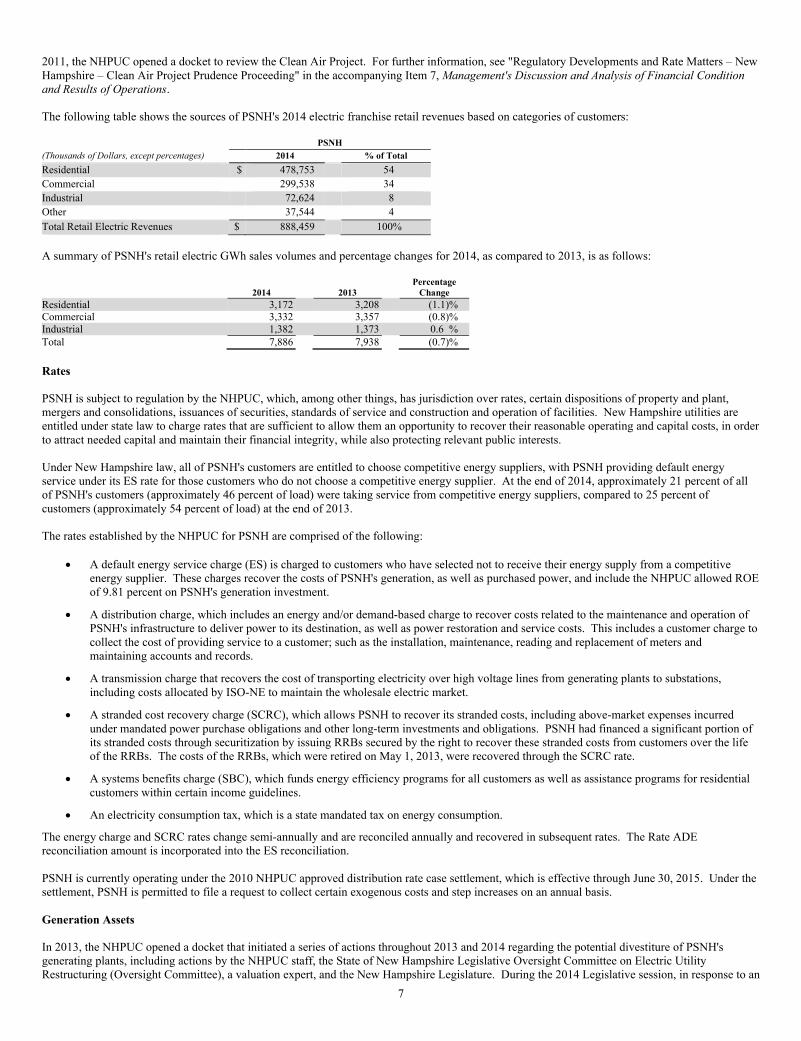
7
2011, the NHPUC opened a docket to review the Clean Air Project. For further information, see "Regulatory Developments and Rate Matters – New Hampshire – Clean Air Project Prudence Proceeding" in the accompanying Item 7, Management's Discussion and Analysis of Financial Condition and Results of Operations.
The following table shows the sources of PSNH's 2014 electric franchise retail revenues based on categories of customers:
PSNH
(Thousands of Dollars, except percentages) 2014 % of Total
Residential $ 478,753 54
Commercial 299,538 34
Industrial 72,624 8
Other 37,544 4
Total Retail Electric Revenues $ 888,459 100%
A summary of PSNH's retail electric GWh sales volumes and percentage changes for 2014, as compared to 2013, is as follows:
2014 2013Percentage
Change
Residential 3,172 3,208 (1.1)%Commercial 3,332 3,357 (0.8)%Industrial 1,382 1,373 0.6 %Total 7,886 7,938 (0.7)%
Rates
PSNH is subject to regulation by the NHPUC, which, among other things, has jurisdiction over rates, certain dispositions of property and plant, mergers and consolidations, issuances of securities, standards of service and construction and operation of facilities. New Hampshire utilities are entitled under state law to charge rates that are sufficient to allow them an opportunity to recover their reasonable operating and capital costs, in order to attract needed capital and maintain their financial integrity, while also protecting relevant public interests.
Under New Hampshire law, all of PSNH's customers are entitled to choose competitive energy suppliers, with PSNH providing default energy service under its ES rate for those customers who do not choose a competitive energy supplier. At the end of 2014, approximately 21 percent of all of PSNH's customers (approximately 46 percent of load) were taking service from competitive energy suppliers, compared to 25 percent of customers (approximately 54 percent of load) at the end of 2013.
The rates established by the NHPUC for PSNH are comprised of the following:
A default energy service charge (ES) is charged to customers who have selected not to receive their energy supply from a competitive energy supplier. These charges recover the costs of PSNH's generation, as well as purchased power, and include the NHPUC allowed ROE of 9.81 percent on PSNH's generation investment.
A distribution charge, which includes an energy and/or demand-based charge to recover costs related to the maintenance and operation of PSNH's infrastructure to deliver power to its destination, as well as power restoration and service costs. This includes a customer charge to collect the cost of providing service to a customer; such as the installation, maintenance, reading and replacement of meters and maintaining accounts and records.
A transmission charge that recovers the cost of transporting electricity over high voltage lines from generating plants to substations, including costs allocated by ISO-NE to maintain the wholesale electric market.
A stranded cost recovery charge (SCRC), which allows PSNH to recover its stranded costs, including above-market expenses incurred under mandated power purchase obligations and other long-term investments and obligations. PSNH had financed a significant portion of its stranded costs through securitization by issuing RRBs secured by the right to recover these stranded costs from customers over the life of the RRBs. The costs of the RRBs, which were retired on May 1, 2013, were recovered through the SCRC rate.
A systems benefits charge (SBC), which funds energy efficiency programs for all customers as well as assistance programs for residential customers within certain income guidelines.
An electricity consumption tax, which is a state mandated tax on energy consumption.
The energy charge and SCRC rates change semi-annually and are reconciled annually and recovered in subsequent rates. The Rate ADE reconciliation amount is incorporated into the ES reconciliation.
PSNH is currently operating under the 2010 NHPUC approved distribution rate case settlement, which is effective through June 30, 2015. Under the settlement, PSNH is permitted to file a request to collect certain exogenous costs and step increases on an annual basis.
Generation Assets
In 2013, the NHPUC opened a docket that initiated a series of actions throughout 2013 and 2014 regarding the potential divestiture of PSNH's generating plants, including actions by the NHPUC staff, the State of New Hampshire Legislative Oversight Committee on Electric Utility Restructuring (Oversight Committee), a valuation expert, and the New Hampshire Legislature. During the 2014 Legislative session, in response to an
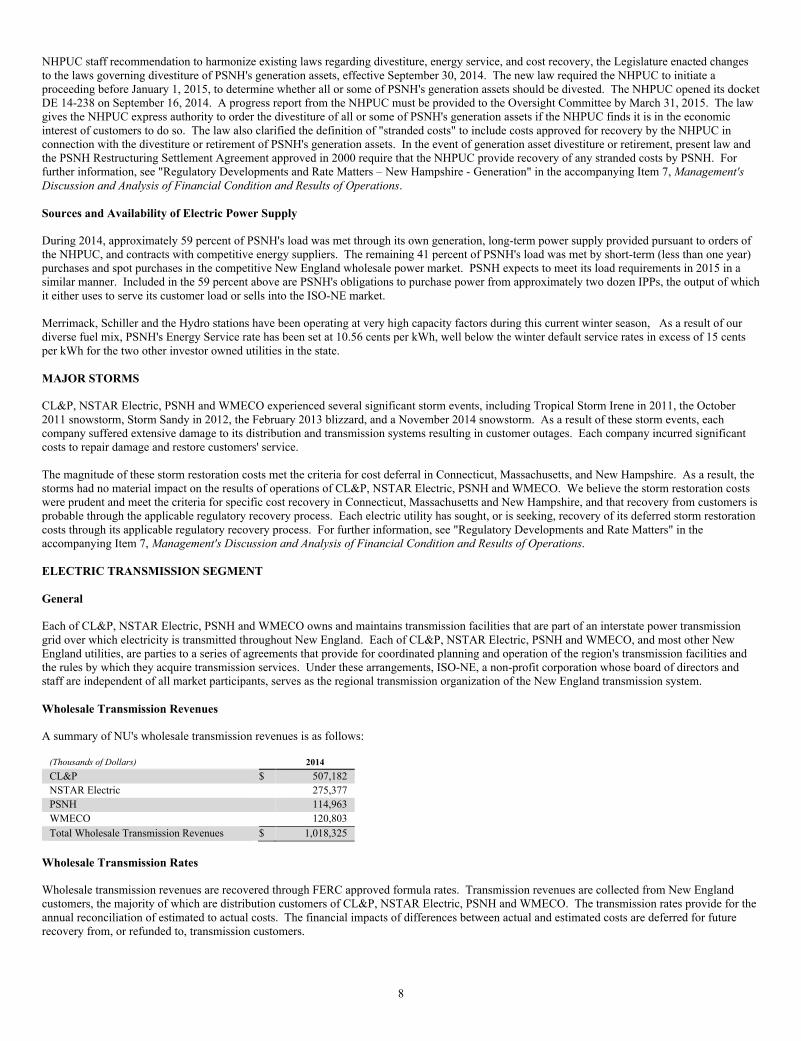
8
NHPUC staff recommendation to harmonize existing laws regarding divestiture, energy service, and cost recovery, the Legislature enacted changes to the laws governing divestiture of PSNH's generation assets, effective September 30, 2014. The new law required the NHPUC to initiate a proceeding before January 1, 2015, to determine whether all or some of PSNH's generation assets should be divested. The NHPUC opened its docket DE 14-238 on September 16, 2014. A progress report from the NHPUC must be provided to the Oversight Committee by March 31, 2015. The law gives the NHPUC express authority to order the divestiture of all or some of PSNH's generation assets if the NHPUC finds it is in the economic interest of customers to do so. The law also clarified the definition of "stranded costs" to include costs approved for recovery by the NHPUC in connection with the divestiture or retirement of PSNH's generation assets. In the event of generation asset divestiture or retirement, present law and the PSNH Restructuring Settlement Agreement approved in 2000 require that the NHPUC provide recovery of any stranded costs by PSNH. For further information, see "Regulatory Developments and Rate Matters – New Hampshire - Generation" in the accompanying Item 7, Management's Discussion and Analysis of Financial Condition and Results of Operations.
Sources and Availability of Electric Power Supply
During 2014, approximately 59 percent of PSNH's load was met through its own generation, long-term power supply provided pursuant to orders of the NHPUC, and contracts with competitive energy suppliers. The remaining 41 percent of PSNH's load was met by short-term (less than one year) purchases and spot purchases in the competitive New England wholesale power market. PSNH expects to meet its load requirements in 2015 in a similar manner. Included in the 59 percent above are PSNH's obligations to purchase power from approximately two dozen IPPs, the output of which it either uses to serve its customer load or sells into the ISO-NE market.
Merrimack, Schiller and the Hydro stations have been operating at very high capacity factors during this current winter season, As a result of our diverse fuel mix, PSNH's Energy Service rate has been set at 10.56 cents per kWh, well below the winter default service rates in excess of 15 cents per kWh for the two other investor owned utilities in the state.
MAJOR STORMS
CL&P, NSTAR Electric, PSNH and WMECO experienced several significant storm events, including Tropical Storm Irene in 2011, the October 2011 snowstorm, Storm Sandy in 2012, the February 2013 blizzard, and a November 2014 snowstorm. As a result of these storm events, each company suffered extensive damage to its distribution and transmission systems resulting in customer outages. Each company incurred significant costs to repair damage and restore customers' service.
The magnitude of these storm restoration costs met the criteria for cost deferral in Connecticut, Massachusetts, and New Hampshire. As a result, the storms had no material impact on the results of operations of CL&P, NSTAR Electric, PSNH and WMECO. We believe the storm restoration costs were prudent and meet the criteria for specific cost recovery in Connecticut, Massachusetts and New Hampshire, and that recovery from customers is probable through the applicable regulatory recovery process. Each electric utility has sought, or is seeking, recovery of its deferred storm restoration costs through its applicable regulatory recovery process. For further information, see "Regulatory Developments and Rate Matters" in the accompanying Item 7, Management's Discussion and Analysis of Financial Condition and Results of Operations.
ELECTRIC TRANSMISSION SEGMENT
General
Each of CL&P, NSTAR Electric, PSNH and WMECO owns and maintains transmission facilities that are part of an interstate power transmission grid over which electricity is transmitted throughout New England. Each of CL&P, NSTAR Electric, PSNH and WMECO, and most other New England utilities, are parties to a series of agreements that provide for coordinated planning and operation of the region's transmission facilities and the rules by which they acquire transmission services. Under these arrangements, ISO-NE, a non-profit corporation whose board of directors and staff are independent of all market participants, serves as the regional transmission organization of the New England transmission system.
Wholesale Transmission Revenues
A summary of NU's wholesale transmission revenues is as follows:
(Thousands of Dollars) 2014
CL&P $ 507,182
NSTAR Electric 275,377
PSNH 114,963
WMECO 120,803
Total Wholesale Transmission Revenues $ 1,018,325
Wholesale Transmission Rates
Wholesale transmission revenues are recovered through FERC approved formula rates. Transmission revenues are collected from New England customers, the majority of which are distribution customers of CL&P, NSTAR Electric, PSNH and WMECO. The transmission rates provide for the annual reconciliation of estimated to actual costs. The financial impacts of differences between actual and estimated costs are deferred for future recovery from, or refunded to, transmission customers.

9
FERC Base ROE Complaints
Beginning in 2011, several New England state attorneys general, state regulatory commissions, consumer advocates, consumer groups, municipal parties and other parties (the "Complainants") jointly filed three separate complaints at FERC. In the first complaint, filed in 2011, the Complainants alleged that the NETOs' base ROE of 11.14 percent that was utilized since 2006 was unjust and unreasonable, asserted that the rate was excessive due to changes in the capital markets, and sought an order to reduce it prospectively from the date of the final FERC order and for the 15-month period beginning October 1, 2011 to December 31, 2012 (the "first complaint refund period"). In the pursuant second and third complaints, filed in 2012 and 2014, respectively, the Complainants challenged the NETOs' base ROE and sought refunds for the 15-month periods beginning December 27, 2012 and July 31, 2014, respectively.
In 2014, the FERC determined that the base ROE should be set at 10.57 percent for the first complaint refund period and that a utility's total or maximum ROE should not exceed the top of the new zone of reasonableness (7.03 percent to 11.74 percent). The FERC ordered the NETOs to provide refunds to customers for the first complaint refund period and set the new base ROE of 10.57 percent prospectively from October 16, 2014. In late 2014, the NETOs made a compliance filing, and began refunding amounts from the first complaint period, inclusive of incentive ROE adders that exceeded the 11.74 percent as compared to the total company transmission ROE. Complainants have challenged the compliance filing.
As a result of the actions taken by the FERC and other developments in this matter, NU recorded reserves in 2013 and 2014 to recognize the potential financial impacts of the first and second complaints. The Company is unable to determine any amount related to the third complaint. The aggregate after-tax net charge to 2014 earnings resulting from the 2014 FERC orders totaled $22.4 million at NU. In 2013, the aggregate after-tax charge to earnings totaled $14.3 million at NU.
Although management is uncertain on the final outcome on the second and third complaints regarding the base ROE and the incentive ROE adder, management believes the current reserves established are appropriate to reflect probable and reasonably estimable refunds. For further information, see "FERC Regulatory Issues – FERC Base ROE Complaints" in the accompanying Item 7, Management's Discussion and Analysis of Financial Condition and Results of Operations.
FERC Order No. 1000
On August 15, 2014, the D.C. Circuit Court of Appeals upheld FERC's authority to order major changes to transmission planning and cost allocation in FERC Order No. 1000 and Order No. 1000-A, including transmission planning for public policy needs, and the requirement that utilities remove from their transmission tariffs their rights of first refusal to build transmission. FERC has not yet ruled on the comprehensive compliance filings made in November 2013 by the NETOs, including CL&P, NSTAR Electric, PSNH and WMECO. We cannot predict the final outcome or impact on us; however, implementation of FERC's goals in New England, including within our service territories, may expose us to competition for construction of transmission projects, additional regulatory considerations, and potential delay with respect to future transmission projects. While the FERC Orders may bring new challenges, we believe there are also opportunities for us to compete for transmission reliability projects outside of our service territories.
Transmission Projects
During 2014, we were involved in the planning, development and construction of a series of transmission projects, including the NEEWS family of projects, Northern Pass, which is NU's planned HVDC transmission line from the Québec-New Hampshire border to Franklin, New Hampshire and an associated alternating current radial transmission line between Franklin and Deerfield, New Hampshire, and Greater Boston Reliability Solutions, which are a series of new transmission projects over the next five years that will enhance system reliability and improve capacity. For further information, see "Business Development and Capital Expenditures – Transmission Business" in the accompanying Item 7, Management's Discussion and Analysis of Financial Condition and Results of Operations.
Transmission Rate Base
Under our FERC-approved tariff, and with the exception of transmission projects that received specific FERC approval to include CWIP in rate base, transmission projects generally enter rate base after they are placed in commercial operation. At the end of 2014, our estimated transmission rate base was approximately $4.9 billion, including approximately $2.4 billion at CL&P, $1.3 billion at NSTAR Electric, $535 million at PSNH, and $611 million at WMECO.

10
NATURAL GAS DISTRIBUTION SEGMENT
NSTAR Gas distributes natural gas to approximately 282,000 customers in 51 communities in central and eastern Massachusetts covering 1,067 square miles and Yankee Gas distributes natural gas to approximately 222,000 customers in 71 cities and towns in Connecticut covering 2,187 square miles. Total throughput (sales and transportation) in 2014 was approximately 60.5 Bcf for NSTAR Gas and 55 Bcf for Yankee Gas. Our natural gas businesses provide firm natural gas sales service to retail customers who require a continuous natural gas supply throughout the year, such as residential customers who rely on natural gas for heating, hot water and cooking needs, and commercial and industrial customers who choose to purchase natural gas from NU's natural gas distribution companies. A portion of the storage of natural gas supply for NSTAR Gas during the winter heating season is provided by Hopkinton LNG Corp., an indirect, wholly-owned subsidiary of NU. The facilities consist of an LNG liquefaction and vaporization plant and three above-ground cryogenic storage tanks in Hopkinton, Massachusetts having an aggregate capacity of 3.0 Bcf of liquefied natural gas. NSTAR Gas also has access to facilities in Acushnet, Massachusetts that include additional storage capacity of 0.5 Bcf and additional vaporization capacity. Yankee Gas owns a 1.2 Bcf LNG facility in Waterbury, Connecticut, which is used primarily to assist Yankee Gas in meeting its supplier-of-last-resort obligations and also enables it to provide economic supply and make economic refill of natural gas typically during periods of low demand.
NSTAR Gas and Yankee Gas generate revenues primarily through the sale and/or transportation of natural gas. Predominantly all residential customers in the NSTAR Gas service territory buy gas supply and delivery from NSTAR Gas while all customers may choose their gas suppliers. Retail natural gas service in Connecticut is partially unbundled: residential customers in Yankee Gas' service territory buy natural gas supply and delivery only from Yankee Gas while commercial and industrial customers may choose their natural gas suppliers. NSTAR Gas offers firm transportation service to all customers who purchase gas from sources other than NSTAR Gas while Yankee Gas offers firm transportation service to its commercial and industrial customers who purchase natural gas from sources other than Yankee Gas. In addition, both natural gas distribution companies offer interruptible transportation and interruptible natural gas sales service to those high volume commercial and industrial customers, generally during the colder months, that have the capability to switch from natural gas to an alternative fuel on short notice, for whom NSTAR Gas and Yankee Gas can interrupt service during peak demand periods or at any other time to maintain distribution system integrity.
The following table shows the sources of the 2014 total NU natural gas franchise retail revenues based on categories of customers:
(Thousands of Dollars, except percentages) 2014 % of Total
Residential $ 520,410 55
Commercial 332,414 35
Industrial 94,861 10
Total Retail Natural Gas Revenues $ 947,685 100%
A summary of our firm natural gas sales volumes in million cubic feet and percentage changes for 2014, as compared to 2013, is as follows:
Percentage2014 2013 Change
Residential 38,969 36,777 6.0%Commercial 42,977 40,215 6.9%Industrial 22,245 21,266 4.6%Total 104,191 98,258 6.0%Total, Net of Special Contracts (1) 99,500 94,083 5.8%
(1) Special contracts are unique to the customers who take service under such an arrangement and generally specify the amount of distribution revenue to be paid to Yankee Gas regardless of the customers' usage.
Our firm natural gas sales are subject to many of the same influences as our retail electric sales. In addition, they have benefited from favorable natural gas prices and customer growth across both operating companies. Our 2014 consolidated firm natural gas sales volumes, consisting of the firm natural gas sales volumes of Yankee Gas and NSTAR Gas, were higher, as compared to 2013, due primarily to colder weather in the first quarter of 2014, as compared to the same period in 2013, and increased customer growth in 2014, as compared to 2013. Weather-normalized NU consolidated firm natural gas sales volumes increased 2.9 percent in 2014, as compared to 2013.
Rates
NSTAR Gas and Yankee Gas are subject to regulation by the DPU and PURA, respectively, which, among other things, have jurisdiction over rates, certain dispositions of property and plant, mergers and consolidations, issuances of long-term securities, standards of service and construction and operation of facilities. Both of NU's natural gas companies are entitled under their respective state law to charge rates that are sufficient to allow them an opportunity to recover their reasonable operating and capital costs, in order to attract needed capital and maintain their financial integrity, while also protecting relevant public interests.
Retail natural gas delivery and supply rates are established by the DPU and PURA and are comprised of:
A distribution charge consisting of a fixed customer charge and a demand and/or energy charge that collects the costs of building and expanding the natural gas infrastructure to deliver natural gas supply to its customers. This also includes collection of ongoing operating costs;
A seasonal cost of gas adjustment clause (CGAC) at NSTAR Gas that collects natural gas supply costs, pipeline and storage capacity costs, costs related to charge-offs of uncollected energy costs and working capital related costs. The CGAC is reset semi-annually. In addition,

11
NSTAR Gas files interim changes to its CGAC factor when the actual costs of natural gas supply vary from projections by more than five percent; and
A local distribution adjustment clause (LDAC) at NSTAR Gas that collects energy efficiency program costs, environmental costs, pension and PBOP related costs, energy efficiency costs, attorney general consultant costs, and costs associated with low income customers. The LDAC is reset annually and provides for the recovery of certain costs applicable to both sales and transportation customers.
Purchased Gas Adjustment (PGA) clause, which allows Yankee Gas to recover the costs of the procurement of natural gas for its firm and seasonal customers. Differences between actual natural gas costs and collection amounts on August 31st of each year are deferred and then recovered from or refunded to customers during the following year. Carrying charges on outstanding balances are calculated using Yankee Gas' weighted average cost of capital in accordance with the directives of the PURA; and
Conservation Adjustment Mechanism (CAM) at Yankee Gas, which allows 100 percent recovery of conservation costs through this mechanism including program incentives to promote energy efficiency, as well as recovery of any lost revenues associated withimplementation of energy conservation measures. A reconciliation of CAM revenues to expenses is performed annually with any difference being recovered from or refunded to customers, with carrying charges, during the following year.
NSTAR Gas purchases financial contracts based on NYMEX natural gas futures in order to reduce cash flow variability associated with the purchase price for approximately one-third of its natural gas purchases. These purchases are made under a program approved by the DPU in 2006. This practice attempts to minimize the impact of fluctuations in natural gas prices to NSTAR Gas' firm natural gas customers. These financial contracts do not procure natural gas supply. All costs incurred or benefits realized when these contracts are settled are included in the CGAC.
NSTAR Gas is subject to SQ metrics that measure safety, reliability and customer service and could be required to pay to customers a SQ charge of up to 2.5 percent of annual distribution revenues for failing to meet such metrics. NSTAR Gas will not be required to pay a SQ charge for its 2014 performance as it achieved results at or above target for all of its SQ metrics in 2014.
On December 17, 2014, NSTAR Gas filed an application with the DPU requesting an increase in rates, effective January 1, 2016. NSTAR Gas requested an increase in base distribution rates of $33.9 million. Based on the current schedule, we expect a final decision in the fourth quarter of 2015.
In 2011, PURA approved Yankee Gas' rate proceeding. The final decision approved a regulatory ROE of 8.83 percent and allowed for a substantial increase in annual spending for bare steel and cast iron pipeline replacement.
Massachusetts Natural Gas Replacement and Expansion
On July 7, 2014, Massachusetts enacted "An Act Relative to Natural Gas Leaks" (the Act). The Act establishes a uniform natural gas leak classification standard for all Massachusetts natural gas utilities and a program that accelerates the replacement of aging natural gas infrastructure. The program will enable companies, including NSTAR Gas, to better manage the scheduling and costs of replacement. The Act also calls for the DPU to authorize natural gas utilities to design and offer programs to customers that will increase the availability, affordability and feasibility of natural gas service for new customers.
NSTAR Gas filed the Gas System Enhancement Program (GSEP) with the DPU on October 31, 2014. NSTAR Gas' program accelerates the replacement of certain natural gas distribution facilities in the system within 25 years. The GSEP includes a new tariff that provides NSTAR Gas an opportunity to collect the costs for the program on an annual basis through a newly designed reconciling factor to be approved by the DPU. We expect a decision on the program in April 2015.
Connecticut Natural Gas Expansion Plan
In 2013, in accordance with Connecticut law and regulation, PURA approved a comprehensive joint natural gas infrastructure expansion plan (expansion plan) filed by Yankee Gas and other Connecticut natural gas distribution companies. The expansion plan described how Yankee Gas expects to add approximately 82,000 new natural gas heating customers over the next 10 years. Yankee Gas estimates that its portion of the plan will cost approximately $700 million over 10 years. In January 2015, PURA approved a joint settlement agreement proposed by Yankee Gas and other Connecticut natural gas distribution companies and regulatory agencies that clarified the procedures and oversight criteria applicable to the expansion plan.
Sources and Availability of Natural Gas Supply
NSTAR Gas maintains a flexible resource portfolio consisting of natural gas supply contracts, transportation contracts on interstate pipelines, market area storage and peaking services. NSTAR Gas purchases transportation, storage, and balancing services from Tennessee Gas Pipeline Company and Algonquin Gas Transmission Company, as well as other upstream pipelines that transport gas from major producing regions in the U.S., including the Gulf Coast, Mid-continent region, and Appalachian Shale supplies to the final delivery points in the NSTAR Gas service area. NSTAR Gas purchases all of its natural gas supply under a firm portfolio management contract with a term of one year, which has a maximum quantity of approximately 154,700 MMBtu/day of firm flowing natural gas supplies and 76,700 MMBtu/day of firm natural gas storage supplies.
In addition to the firm transportation and natural gas supplies mentioned above, NSTAR Gas utilizes contracts for underground storage and LNG facilities to meet its winter peaking demands. The LNG facilities, described below, are located within NSTAR Gas' distribution system and are used to liquefy and store pipeline natural gas during the warmer months for vaporization and use during the heating season. During the summer injection

12
season, excess pipeline capacity and supplies are used to deliver and store natural gas in market area underground storage facilities located in the New York and Pennsylvania regions. Stored natural gas is withdrawn during the winter season to supplement flowing pipeline supplies in order to meet firm heating demand. NSTAR Gas has firm underground storage contracts and total storage capacity entitlements of approximately 6.6 Bcf.
A portion of the storage of natural gas supply for NSTAR Gas during the winter heating season is provided by Hopkinton LNG Corp., which owns anLNG liquefaction and vaporization plant and three above-ground cryogenic storage tanks having an aggregate capacity of 3.0 Bcf of liquefied natural gas. NSTAR Gas also has access to facilities that include additional storage capacity of 0.5 Bcf and additional vaporization capacity.
PURA requires that Yankee Gas meet the needs of its firm customers under all weather conditions. Specifically, Yankee Gas must structure its supply portfolio to meet firm customer needs under a design day scenario (defined as the coldest day in 30 years) and under a design year scenario (defined as the average of the four coldest years in the last 30 years). Yankee Gas' on-system stored LNG and underground storage supplies help to meet consumption needs during the coldest days of winter. Yankee Gas obtains its interstate capacity from the three interstate pipelines that directly serve Connecticut: the Algonquin, Tennessee and Iroquois Pipelines. Yankee Gas has long-term firm contracts for capacity on TransCanada Pipelines Limited Pipeline, Vector Pipeline, L.P., Tennessee Gas Pipeline, Iroquois Gas Transmission Pipeline, Algonquin Pipeline, Union Gas Limited, Dominion Transmission, Inc., National Fuel Gas Supply Corporation, Transcontinental Gas Pipeline Company, and Texas Eastern Transmission, L.P. pipelines.
Based on information currently available regarding projected growth in demand and estimates of availability of future supplies of pipeline natural gas, NSTAR Gas and Yankee Gas each believes that participation in planned and anticipated pipeline expansion projects will be required in order for it to meet current and future sales growth opportunities.
NATURAL GAS PIPELINE EXPANSION
On September 16, 2014, NU and Spectra Energy Corp announced Access Northeast, a natural gas pipeline expansion project. Access Northeast will enhance the Algonquin and Maritimes pipeline systems using existing routes and is expected to be capable of delivering approximately one billion cubic feet of natural gas per day to New England. NU and Spectra Energy Corp will have equal ownership interest in the project with the option of additional investors joining in the future. On February 18, 2015, NU, Spectra Energy Corp and National Grid announced the addition of National Grid as a co-developer in the project for a total ownership interest of 20 percent, with NU and Spectra Energy Corp each owning 40 percent. The total project cost, subject to FERC approval, is expected to be approximately $3 billion and has an anticipated in-service date of November 2018.
On December 8, 2014, NU and Spectra Energy Corp announced an alliance with Iroquois Gas Transmission for the Access Northeast project. This alliance will provide New England natural gas distribution companies and generators with additional access to natural gas supplies from multiple, diverse receipt points along the Algonquin pipeline system, including the Iroquois pipeline system.
PROJECTED CAPITAL EXPENDITURES
We project to make capital expenditures of approximately $8.4 billion from 2015 through 2018. Of the $8.4 billion, we expect to invest approximately $4.2 billion in our electric and natural gas distribution segments and $3.9 billion in our electric transmission segment. In addition, we project to invest approximately $360 million in information technology and facilities upgrades and enhancements. These projections do not include capital expenditures related to Access Northeast.
FINANCING
Our credit facilities and indentures require that NU parent and certain of its subsidiaries, including CL&P, NSTAR Electric, NSTAR Gas, PSNH, WMECO and Yankee Gas, comply with certain financial and non-financial covenants as are customarily included in such agreements, including maintaining a ratio of consolidated debt to total capitalization of no more than 65 percent. All of these companies currently are, and expect to remain, in compliance with these covenants.
As of December 31, 2014, a total of $216.7 million of NU's long-term debt will be paid in the next 12 months, consisting of $162 million for CL&P, $4.7 million for NSTAR Electric and $50 million or WMECO.
NUCLEAR FUEL STORAGE
CL&P, NSTAR Electric, PSNH, WMECO and several other New England electric utilities are stockholders in three inactive regional nuclear generation companies, CYAPC, MYAPC and YAEC (collectively, the Yankee Companies). The Yankee Companies have completed the physical decommissioning of their respective generation facilities and are now engaged in the long-term storage of their spent nuclear fuel. Each Yankee Company has completed its collection of decommissioning and closure costs through the proceeds from the spent nuclear fuel litigation against the DOE. These proceeds were used by the Yankee Companies to offset the decommissioning and closure cost receivables from their member companies or to decrease the wholesale FERC-approved rates charged under power purchase agreements with CL&P, NSTAR Electric, PSNH and WMECO and several other New England utilities. The decommissioning rates charged by the Yankee Companies have been eliminated. CL&P, NSTAR Electric, PSNH and WMECO can recover these costs from, or refund proceeds to, their customers through state regulatory commission-approved retail rates.
As a result of the merger with NSTAR, we consolidate the assets and obligations of CYAPC and YAEC on our consolidated balance sheet.
For information on the DOE proceeds received related to the spent nuclear fuel litigation, see Note 11C, “Commitments and Contingencies –Contractual Obligations – Yankee Companies,” in the accompanying Item 8, Financial Statements and Supplementary Data.

13
OTHER REGULATORY AND ENVIRONMENTAL MATTERS
General
We are regulated in virtually all aspects of our business by various federal and state agencies, including FERC, the SEC, and various state and/or local regulatory authorities with jurisdiction over the industry and the service areas in which each of our companies operates, including the PURA, which has jurisdiction over CL&P and Yankee Gas, the NHPUC, which has jurisdiction over PSNH, and the DPU, which has jurisdiction over NSTAR Electric, NSTAR Gas and WMECO.
Environmental Regulation
We are subject to various federal, state and local requirements with respect to water quality, air quality, toxic substances, hazardous waste and other environmental matters. Additionally, major generation and transmission facilities may not be constructed or significantly modified without a review of the environmental impact of the proposed construction or modification by the applicable federal or state agencies.
Water Quality Requirements
The Clean Water Act requires every "point source" discharger of pollutants into navigable waters to obtain a National Pollutant Discharge Elimination System (NPDES) permit from the EPA or state environmental agency specifying the allowable quantity and characteristics of its effluent. States may also require additional permits for discharges into state waters. We are in the process of maintaining or renewing all required NPDES or state discharge permits in effect for PSNH's generation facilities.
In 1997, PSNH filed in a timely manner for a renewal of the NPDES permit for the Merrimack Station. As a result, the existing permit was administratively continued. In 2011, the EPA issued a draft renewal NPDES permit for PSNH's Merrimack Station for public review and comment. The proposed permit contains many significant conditions to future operation. The proposed permit would require PSNH to install a closed-cycle cooling system (including cooling towers) at the station. The EPA estimated that the net present value cost to install this system and operate it over a 20-year period would be approximately $112 million. PSNH and other electric utility groups filed thousands of pages of comments contesting EPA's draft permit requirements. PSNH stated that the data and studies supplied to the EPA demonstrate the fact that a closed-cycle cooling system is not warranted. On April 18, 2014 EPA issued a revised section of the draft NPDES permit for Merrimack Station. The revised portion of the draft permit deals solely with the treatment of wastewater from the flue gas desulfurization system. On August 18, 2014 PSNH again submitted comments. The EPA does not have a set deadline to consider comments and to issue a final permit. Merrimack Station is permitted to continue to operate under its present permit pending issuance of the final permit and subsequent resolution of matters appealed by PSNH and other parties. Due to the site specific characteristics of PSNH's other coal- and oil-fired electric generating stations, we believe it is unlikely that they would face similar permitting determinations.
Air Quality Requirements
The Clean Air Act Amendments (CAAA), as well as New Hampshire law, impose stringent requirements on emissions of SO2 and NOX for the purpose of controlling acid rain and ground level ozone. In addition, the CAAA address the control of toxic air pollutants. Requirements for the installation of continuous emissions monitors and expanded permitting provisions also are included.
In 2011, the EPA finalized the Mercury and Air Toxic Standards (MATS) that require the reduction of emissions of hazardous air pollutants from new and existing coal- and oil-fired electric generating stations. Previously referred to as the Utility MACT (maximum achievable control technology) rules, it establishes emission limits for mercury, arsenic and other hazardous air pollutants from coal- and oil-fired electric generating stations. MATS is the first implementation of a nationwide emissions standard for hazardous air pollutants across all electric generating units and provides utility companies with up to five years to meet the requirements. PSNH owns and operates approximately 1,000 MW of coal- and oil-fired electric generating stations subject to MATS, including the two units at Merrimack Station, Newington Station and the two coal units at Schiller Station. We believe the Clean Air Project at our Merrimack Station, together with existing equipment, will enable the facility to meet the MATS requirements. At Schiller Station additional controls are being installed at the two coal-fired units, the cost of which is estimated to be approximately $2.5 million.
Each of the states in which we do business also has Renewable Portfolio Standards (RPS) requirements, which generally require fixed percentages of our energy supply to come from renewable energy sources such as solar, hydropower, landfill gas, fuel cells and other similar sources.
New Hampshire's RPS provision requires increasing percentages of the electricity sold to retail customers to have direct ties to renewable sources. In 2014, the total RPS obligation was 9.7 percent and it will ultimately reach 24.8 percent in 2025. Energy suppliers, like PSNH, purchase RECs from producers that generate energy from a qualifying resource and use them to satisfy the RPS requirements. PSNH also owns renewable sources and uses a portion of internally generated RECs to meet its RPS obligations. To the extent that PSNH is unable to purchase sufficient RECs, it makes up the difference between the RECs purchased and its total obligation by making an alternative compliance payment for each REC requirement for which PSNH is deficient. The costs of both the RECs and alternative compliance payments are recovered by PSNH through its ES rates charged to customers.
The RECs generated from PSNH's Northern Wood Power Project, a wood-burning facility, are typically sold to other energy suppliers or load carrying entities, and the net proceeds from the sale of these RECs are credited back to customers.

14
Similarly, Connecticut's RPS statute requires increasing percentages of the electricity sold to retail customers to have direct ties to renewable sources. In 2014, the total RPS obligation was 18 percent and will ultimately reach 27 percent in 2020. CL&P is permitted to recover any costs incurred in complying with RPS from its customers through its GSC rate.
Massachusetts' RPS program also requires electricity suppliers to meet renewable energy standards. For 2014, the requirement was 16.1 percent, and will ultimately reach 22.1 percent in 2020. NSTAR Electric and WMECO are permitted to recover any costs incurred in complying with RPS from its customers through rates. WMECO also owns renewable solar generation resources. The RECs generated from WMECO's solar units are sold to other energy suppliers, and the proceeds from these sales are credited back to customers.
Hazardous Materials Regulations
Prior to the last quarter of the 20th century, when environmental best practices laws and regulations were implemented, utility companies often disposed of residues from operations by depositing or burying them on-site or disposing of them at off-site landfills or other facilities. Typical materials disposed of include coal gasification byproducts, fuel oils, ash, and other materials that might contain polychlorinated biphenyls or that otherwise might be hazardous. It has since been determined that deposited or buried wastes, under certain circumstances, could cause groundwater contamination or create other environmental risks. We have recorded a liability for what we believe, based upon currently available information, is our reasonably estimable environmental investigation and/or remediation costs for waste disposal sites for which we have probable liability. We continue to evaluate the environmental impact of our former disposal practices. Under federal and state law, government agencies and private parties can attempt to impose liability on us for these practices. As of December 31, 2014, the liability recorded for our reasonably estimable and probable environmental remediation costs for known sites needing investigation and/or remediation, exclusive of recoveries from insurance or from third parties, was approximately $43.3 million, representing 65 sites. These costs could be significantly higher if remediation becomes necessary or when additional information as to the extent of contamination becomes available.
The most significant liabilities currently relate to future clean-up costs at former MGP facilities. These facilities were owned and operated by our predecessor companies from the mid-1800's to mid-1900's. By-products from the manufacture of gas using coal resulted in fuel oils, hydrocarbons, coal tar, purifier wastes, metals and other waste products that may pose risks to human health and the environment. We currently have partial or full ownership responsibilities at former MGP sites that have a reserve balance of $38.8 million of the total $43.3 million as of December 31, 2014. Predominantly all of these MGP costs are recoverable from customers through our rates.
Electric and Magnetic Fields
For more than twenty years, published reports have discussed the possibility of adverse health effects from electric and magnetic fields (EMF) associated with electric transmission and distribution facilities and appliances and wiring in buildings and homes. Although weak health risk associations reported in some epidemiology studies remain unexplained, most researchers, as well as numerous scientific review panels, considering all significant EMF epidemiology and laboratory studies, have concluded that the available body of scientific information does not support the conclusion that EMF affects human health.
In accordance with recommendations of various regulatory bodies and public health organizations, we reduce EMF associated with new transmission lines by the use of designs that can be implemented without additional cost or at a modest cost. We do not believe that other capital expenditures are appropriate to minimize unsubstantiated risks.
Global Climate Change and Greenhouse Gas Emission Issues
Global climate change and greenhouse gas emission issues have received an increased focus from state governments and the federal government. The EPA initiated a rulemaking addressing greenhouse gas emissions and, on December 7, 2009, issued a finding that concluded that greenhouse gas emissions are "air pollution" that endanger public health and welfare and should be regulated. The largest source of greenhouse gas emissions in the U.S. is the electricity generating sector. The EPA has mandated greenhouse gas emission reporting beginning in 2011 for emissions for certain aspects of our business including stationary combustion, volume of gas supplied to large customers and fugitive emissions of SF6 gas and methane.
We are continually evaluating the regulatory risks and regulatory uncertainty presented by climate change concerns. Such concerns could potentially lead to additional rules and regulations that impact how we operate our business, both in terms of the generating facilities we own and operate as well as general utility operations. These could include federal "cap and trade" laws, carbon taxes, fuel and energy taxes, or regulations requiring additional capital expenditures at our generating facilities. We expect that any costs of these rules and regulations would be recovered from customers.
Connecticut, New Hampshire and Massachusetts are each members of the Regional Greenhouse Gas Initiative (RGGI), a cooperative effort by nine northeastern and mid-Atlantic states, to develop a regional program for stabilizing and reducing CO2 emissions from coal- and oil-fired electric generating plants. Because CO2 allowances issued by any participating state are usable across all nine RGGI state programs, the individual state CO2
trading programs, in the aggregate, form one regional compliance market for CO2 emissions. A regulated power plant must hold CO2 allowances equal to its emissions to demonstrate compliance at the end of a three year compliance period that ended on December 31, 2014.
PSNH anticipates that its generating units will emit two million to three million tons of CO2 per year, depending on the capacity factor and the utilization of the respective generation plant, excluding emissions from the operation of PSNH's Northern Wood Power Project, which emissions are an offset. New Hampshire legislation provided up to 1.5 million banked CO2 allowances per year for PSNH's coal- and oil-fired electric generating plants during the 2012 through 2014 compliance period. PSNH satisfied its remaining RGGI requirements by purchasing CO2 allowances at auction or in the secondary market. The cost of complying with RGGI requirements is recoverable from PSNH customers. Current legislation provides that the portion of the RGGI auction proceeds in excess of $1 per allowance will be refunded to customers.

15
Because none of NU's other subsidiaries, CL&P, NSTAR Electric or WMECO, currently owns any generating assets (other than WMECO's solar photovoltaic facilities that do not emit CO2), none of them is required to acquire CO2 allowances. However, the CO2 allowance costs borne by the generating facilities that are utilized by wholesale energy suppliers to satisfy energy supply requirements to CL&P, NSTAR Electric and WMECO will likely be included in the overall wholesale rates charged, which costs are then recoverable from customers.
FERC Hydroelectric Project Licensing
Federal Power Act licenses may be issued for hydroelectric projects for terms of 30 to 50 years as determined by the FERC. Upon the expiration of an existing license, (i) the FERC may issue a new license to the existing licensee, (ii) the United States may take over the project, or (iii) the FERC may issue a new license to a new licensee, upon payment to the existing licensee of the lesser of the fair value or the net investment in the project, plus severance damages, less certain amounts earned by the licensee in excess of a reasonable rate of return.
PSNH owns nine hydroelectric generating stations with a current claimed capability representing winter rates of approximately 71 MW, eight of which are licensed by the FERC under long-term licenses that expire on varying dates from 2017 through 2047. PSNH and its hydroelectric projects are subject to conditions set forth in such licenses, the Federal Power Act and related FERC regulations, including provisions related to the condemnation of a project upon payment of just compensation, amortization of project investment from excess project earnings, possible takeover of a project after expiration of its license upon payment of net investment and severance damages and other matters. PSNH is currently in the early stages of relicensing its 6.5 MW Eastman Falls Hydro Station, the license for which expires in 2017.
EMPLOYEES
As of December 31, 2014, NU employed a total of 8,248 employees, excluding temporary employees, of which 1,548 were employed by CL&P, 1,717 were employed by NSTAR Electric 1,048 were employed by PSNH, and 310 were employed by WMECO. Approximately 51 percent of our employees are members of the International Brotherhood of Electrical Workers, the Utility Workers Union of America or The United Steelworkers, and are covered by 13 collective bargaining agreements.
INTERNET INFORMATION
Our website address is www.eversource.com. We make available through our website a link to the SEC's EDGAR website (http://www.sec.gov/edgar/searchedgar/companysearch.html), at which site NU's, CL&P's, NSTAR Electric's, PSNH's and WMECO's Annual Reports on Form 10-K, Quarterly Reports on Form 10-Q, Current Reports on Form 8-K and any amendments to those reports may be reviewed. Information contained on the Company's website or that can be accessed through the website is not incorporated into and does not constitute a part of this Annual Report on Form 10-K. Printed copies of these reports may be obtained free of charge by writing to our Investor Relations Department at Northeast Utilities, 107 Selden Street, Berlin, CT 06037.
Item 1A. Risk Factors
In addition to the matters set forth under "Safe Harbor Statement Under the Private Securities Litigation Reform Act of 1995" included immediately prior to Item 1, Business, above, we are subject to a variety of significant risks. Our susceptibility to certain risks, including those discussed in detail below, could exacerbate other risks. These risk factors should be considered carefully in evaluating our risk profile.
Cyber breaches, acts of war or terrorism, or grid disturbances could negatively impact our business.
Cyber breaches, acts of war or terrorism, physical attacks or grid disturbances resulting from internal or external sources could target our generation, transmission and distribution facilities or our information technology systems. Such actions could impair our ability to manage these facilities, operate our systems effectively, or properly manage our data, networks and programs, resulting in loss of service to customers.
Because our generation and transmission facilities are part of an interconnected regional grid, we face the risk of blackout due to a disruption on a neighboring interconnected system.
Any such cyber breaches, acts of war or terrorism, physical attacks or grid disturbances could result in a significant decrease in revenues, significant expense to repair system damage or security breaches, and liability claims, which could have a material adverse impact on our financial position, results of operations or cash flows.
The unauthorized access to and the misappropriation of confidential and proprietary customer, employee, financial or system operating information could adversely affect our business operations and adversely impact our reputation.
In the regular course of business we maintain sensitive customer, employee, financial and system operating information and are required by various federal and state laws to safeguard this information. Cyber intrusions, security breaches, theft or loss of this information by cyber crime or otherwise could lead to the release of critical operating information or confidential customer or employee information, which could adversely affect our business operations or adversely impact our reputation, and could result in significant costs, fines and litigation. We maintain adequate privacy protection liability insurance to cover damages and defense costs arising from unauthorized disclosure of, or failure to protect, private information as well as costs for notification to, or for credit card monitoring of, customers, employees and other persons in the event of a breach of private information. This insurance covers amounts paid to avert, prevent or stop a network attack or the disclosure of personal information, and costs of a qualified forensics firm to determine the cause, source and extent of a network attack or to investigate, examine and analyze our network to find the cause, source and extent of a data breach. While we have implemented measures designed to prevent cyber-attacks and mitigate their effects should

16
they occur, our systems are vulnerable to unauthorized access and cyber intrusions. We cannot determine the probability that a security breach may occur or quantify the potential impact of such an event.
The actions of regulators can significantly affect our earnings, liquidity and business activities.
The rates that our Regulated companies charge their customers are determined by their state utility commissions and by FERC. These commissions also regulate the companies' accounting, operations, the issuance of certain securities and certain other matters. FERC also regulates their transmission of electric energy, the sale of electric energy at wholesale, accounting, issuance of certain securities and certain other matters. The commissions' policies and regulatory actions could have a material impact on the Regulated companies' financial position, results of operations and cash flows.
Our transmission, distribution and generation systems may not operate as expected, and could require unplanned expenditures, which could adversely affect our financial position, results of operations and cash flows.
Our ability to properly operate our transmission, distribution and generation systems is critical to the financial performance of our business. Our transmission, distribution and generation businesses face several operational risks, including the breakdown or failure of or damage to equipment, including information technology equipment, or processes, especially due to age; labor disputes; disruptions in the delivery of electricity and natural gas, including impacts on us or our customers; increased capital expenditure requirements, including those due to environmental regulation; catastrophic events such as fires, explosions, or other similar occurrences; extreme weather conditions beyond equipment and plant design capacity; other unanticipated operations and maintenance expenses and liabilities; and potential claims for property damage or personal injuries beyond the scope of our insurance coverage. The failure of our transmission, distribution and generation systems to operate as planned may result in increased capital costs, reduced earnings or unplanned increases in operation and maintenance costs. As a result of our merger in 2012, we have implemented or expect to implement process and information technology system changes that are expected to provide significant improvements to our businesses. If these changes do not result in the improvements that we expect, regulators may determine that the costs for these improvements are not prudent and therefore not recoverable from customers, which may result in reduced earnings. At PSNH, outages at generating stations may be deemed imprudent by the NHPUC resulting in disallowance of replacement power and repair costs. Such costs that are not recoverable from our customers would have an adverse effect on our financial position, results of operations and cash flows.
We expect to invest in strategic development opportunities in both electric and natural gas transmission, but we may not be successful andprojects may not commence operation as scheduled or be completed within budget, which could have a material adverse effect on our business prospects.
We are pursuing broader strategic development investment opportunities related to the construction of electric and natural gas transmission facilities, interconnections to generating resources and other investment opportunities. The development, construction and expansion of electric transmission and natural gas transmission facilities involve numerous risks. Various factors could result in increased costs or result in delays or cancellation of these projects. Risks include regulatory approval processes, new legislation, economic events or factors, environmental and community concerns, design and siting issues, difficulties in obtaining required rights of way, competition from incumbent utilities and other entities, and actions of strategic partners. Should any of these factors result in such delays or cancellations, our financial position, results of operations, and cash flows could be adversely affected or our future growth opportunities may not be realized as anticipated.
Economic events or factors, changes in regulatory or legislative policy and/or regulatory decisions or construction of new generation may delay completion of or displace or result in the abandonment of our planned transmission projects or adversely affect our ability to recover our investments or result in lower than expected earnings.
Our transmission construction plans could be adversely affected by economic events or factors, new legislation, regulations, or judicial or regulatory interpretations of applicable law or regulations or regulatory decisions. Any of such events could cause delays in, or the inability to complete or abandonment of, economic or reliability related projects, which could adversely affect our ability to achieve forecasted earnings or to recover our investments or result in lower than expected rates of return. Recoverability of all such investments in rates may be subject to prudence review at the FERC. While we believe that all of such costs have been and will be prudently incurred, we cannot predict the outcome of future reviews should they occur.
In addition, our transmission projects may be delayed or displaced by new generation facilities, which could result in reduced transmission capital investments, reduced earnings, and limited future growth prospects.
Many of our transmission projects are expected to help alleviate identified reliability issues and reduce customers' costs. However, if, due to economic events or factors or further regulatory or other delays, the in-service date for one or more of these projects is delayed, there may be increased risk of failures in the electricity transmission system and supply interruptions or blackouts, which could have an adverse effect on our earnings.
The FERC has followed a policy of providing incentives designed to encourage the construction of new transmission facilities, including higher returns on equity and allowing facilities under construction to be placed in rate base. Our projected earnings and growth could be adversely affected were FERC to reduce these incentives in the future below the levels presently anticipated.

17
Increases in electric and gas prices and/or a weak economy, can lead to changes in legislative and regulatory policy promoting increased energy efficiency, conservation, and self-generation and/or a reduction in our customers' ability to pay their bills, which may adversely impact our business.
Energy consumption is significantly impacted by the general level of economic activity and cost of energy supply. Economic downturns or periods of high energy supply costs typically can lead to the development of legislative and regulatory policy designed to promote reductions in energy consumption and increased energy efficiency and self-generation by customers. This focus on conservation, energy efficiency and self-generation may result in a decline in electricity and natural gas sales in our service territories. If any such declines were to occur without corresponding adjustments in rates at our Regulated companies that do not currently have revenue decoupling, then our revenues would be reduced and our future growth prospects would be limited.
In addition, a period of prolonged economic weakness could impact customers' ability to pay bills in a timely manner and increase customer bankruptcies, which may lead to increased bad debt expenses or other adverse effects on our financial position, results of operations or cash flows.
Changes in regulatory and/or legislative policy could negatively impact our transmission planning and cost allocation rules.
The existing FERC-approved New England transmission tariff allocates the costs of transmission facilities that provide regional benefits to all customers of participating transmission-owning utilities. As new investment in regional transmission infrastructure occurs in any one state, its cost is shared across New England in accordance with a FERC approved formula found in the transmission tariff. All New England transmission owners'agreement to this regional cost allocation is set forth in the Transmission Operating Agreement. This agreement can be modified with the approval of a majority of the transmission owning utilities and approval by FERC. In addition, other parties, such as state regulators, may seek certain changes to the regional cost allocation formula, which could have adverse effects on the rates our distribution companies charge their retail customers.
FERC has issued rules requiring all regional transmission organizations and transmission owning utilities to make compliance changes to their tariffs and contracts in order to further encourage the construction of transmission for generation, including renewable generation. This compliance will require ISO-NE and New England transmission owners to develop methodologies that allow for regional planning and cost allocation for transmission projects chosen in the regional plan that are designed to meet public policy goals such as reducing greenhouse gas emissions or encouraging renewable generation. Such compliance may also allow non-incumbent utilities and other entities to participate in the planning and construction of new projects in our service area and regionally.
Changes in the Transmission Operating Agreement, the New England Transmission Tariff or legislative policy, or implementation of these new FERC planning rules, could adversely affect our transmission planning, our earnings and our prospects for growth.
Changes in regulatory or legislative policy or unfavorable outcomes in regulatory proceedings could jeopardize our full and/or timely recovery of costs incurred by our regulated distribution and generation businesses.
Under state law, our Regulated companies are entitled to charge rates that are sufficient to allow them an opportunity to recover their reasonable operating and capital costs, to attract needed capital and maintain their financial integrity, while also protecting relevant public interests. Each of these companies prepares and submits periodic rate filings with their respective state regulatory commissions for review and approval. There is no assurance that these state commissions will approve the recovery of all such costs incurred by our Regulated companies, such as for construction, operation and maintenance, as well as a return on investment on their respective regulated assets. The amount of costs incurred by the Regulated companies, coupled with increases in fuel and energy prices, could lead to consumer or regulatory resistance to the timely recovery of such costs, thereby adversely affecting our financial position, results of operations or cash flows.
Additionally, state legislators may enact laws that significantly impact our Regulated companies' revenues, including by mandating electric or gas rate relief and/or by requiring surcharges to customer bills to support state programs not related to the utilities or energy policy. Such increases could pressure overall rates to our customers and our routine requests to regulators for rate relief.
In addition, CL&P, NSTAR Electric and WMECO procure energy for a substantial portion of their customers' needs via requests for proposal on an annual, semi-annual or quarterly basis. CL&P, NSTAR Electric and WMECO receive approval to recover the costs of these contracts from the PURA and DPU, respectively. While both regulatory agencies have consistently approved the solicitation processes, results and recovery of costs, management cannot predict the outcome of future solicitation efforts or the regulatory proceedings related thereto.
PSNH meets most of its energy requirements through its own generation resources and fixed-price forward purchase contracts. PSNH's remaining energy needs are met primarily through spot market purchases. Unplanned forced outages of its generating plants could increase the level of energy purchases needed by PSNH and therefore increase the market risk associated with procuring the energy to meet its requirements. PSNH recovers these costs through its ES rate, subject to a prudence review by the NHPUC. We cannot predict the outcome of future regulatory proceedings related to recovery of these costs.
Our goodwill is valued and recorded at an amount that, if impaired and written down, could adversely affect our future operating results and total capitalization.
We have a significant amount of goodwill on our consolidated balance sheet. The carrying value of goodwill represents the fair value of an acquired business in excess of identifiable assets and liabilities as of the acquisition date. As of December 31, 2014, goodwill totaled $3.5 billion, of which $3.2 billion was attributable to the acquisition of NSTAR in April 2012. Total goodwill represented approximately 35 percent of our $10 billion of shareholders' equity and approximately 12 percent of our total assets of $29.8 billion. We test our goodwill balances for impairment on an annual basis or whenever events occur or circumstances change that would indicate a potential for impairment. A determination that goodwill is deemed to

18
be impaired would result in a non-cash charge that could materially adversely affect our results of operations and total capitalization. The annual goodwill impairment test in 2014 resulted in a conclusion that goodwill is not impaired.
Severe storms could cause significant damage to any of our facilities requiring extensive expenditures, the recovery for which is subject to approval by regulators.
Severe weather, such as ice and snow storms, hurricanes and other natural disasters, may cause outages and property damage, which may require us to incur additional costs that may not be recoverable from customers. The cost of repairing damage to our operating subsidiaries' facilities and the potential disruption of their operations due to storms, natural disasters or other catastrophic events could be substantial, particularly as customers demand better and quicker response times to outages. If, upon review, any of our state regulatory authorities finds that our actions were imprudent, some of those restoration costs may not be recoverable from customers. The inability to recover a significant amount of such costs could have an adverse effect on our financial position, results of operations and cash flows.
NU and its utility subsidiaries are exposed to significant reputational risks, which make them vulnerable to increased regulatory oversight or other sanctions.
Because utility companies, including our electric and natural gas utility subsidiaries, have large consumer customer bases, they are subject to adverse publicity focused on the reliability of their distribution services and the speed with which they are able to respond to electric outages, natural gas leaks and similar interruptions caused by storm damage or other unanticipated events. Adverse publicity of this nature could harm the reputations of NU and its subsidiaries, and may make state legislatures, utility commissions and other regulatory authorities less likely to view NU and its subsidiaries in a favorable light, and may cause NU and its subsidiaries to be subject to less favorable legislative and regulatory outcomes or increased regulatory oversight. Unfavorable regulatory outcomes can include more stringent laws and regulations governing our operations, such as reliability and customer service quality standards or vegetation management requirements, as well as fines, penalties or other sanctions or requirements. The imposition of any of the foregoing could have a material adverse effect on our business, results of operations, cash flow and financial condition of NU and each of its utility subsidiaries.
Limits on our access to and increases in the cost of capital may adversely impact our ability to execute our business plan.
We use short-term debt and the long-term capital markets as a significant source of liquidity and funding for capital requirements not obtained from our operating cash flow. If access to these sources of liquidity becomes constrained, our ability to implement our business strategy could be adversely affected. In addition, higher interest rates would increase our cost of borrowing, which could adversely impact our results of operations. A downgrade of our credit ratings or events beyond our control, such as a disruption in global capital and credit markets, could increase our cost of borrowing and cost of capital or restrict our ability to access the capital markets and negatively affect our ability to maintain and to expand our businesses.
Our counterparties may not meet their obligations to us or may elect to exercise their termination rights, which could adversely affect our earnings.
We are exposed to the risk that counterparties to various arrangements who owe us money, have contracted to supply us with energy, coal, or other commodities or services, or who work with us as strategic partners, including on significant capital projects, will not be able to perform their obligations, will terminate such arrangements or, with respect to our credit facilities, fail to honor their commitments. Should any of these counterparties fail to perform their obligations or terminate such arrangements, we might be forced to replace the underlying commitment at higher market prices and/or have to delay the completion of, or cancel a capital project. Should any lenders under our credit facilities fail to perform, the level of borrowing capacity under those arrangements could decrease. In any such events, our financial position, results of operations, or cash flows could be adversely affected.
Judicial or regulatory proceedings or changes in regulatory or legislative policy could jeopardize full recovery of costs incurred by PSNH in constructing the Clean Air Project.
Pursuant to New Hampshire law, PSNH placed the Clean Air Project in service at its Merrimack Station. PSNH's recovery of costs in constructing the project is subject to prudence review by the NHPUC. A material prudence disallowance could adversely affect PSNH's financial position, results of operations or cash flows. While we believe we have prudently incurred all expenditures to date, we cannot predict the outcome of any prudence reviews. Our projected earnings and growth could be adversely affected were the NHPUC to deny recovery of some or all of PSNH's investment in the project.
The loss of key personnel or the inability to hire and retain qualified employees could have an adverse effect on our business, financial position and results of operations.
Our operations depend on the continued efforts of our employees. Retaining key employees and maintaining the ability to attract new employees are important to both our operational and financial performance. We cannot guarantee that any member of our management or any key employee at the NU parent or subsidiary level will continue to serve in any capacity for any particular period of time. In addition, a significant portion of our workforce, including many workers with specialized skills maintaining and servicing the electrical infrastructure, will be eligible to retire over the next five to ten years. Such highly skilled individuals cannot be quickly replaced due to the technically complex work they perform. We have developed strategic workforce plans to identify key functions and proactively implement plans to assure a ready and qualified workforce, but cannot predict the impact of these plans on our ability to hire and retain key employees.

19
Market performance or changes in assumptions require us to make significant contributions to our pension and other postretirement benefit plans.
We provide a defined benefit pension plan and other postretirement benefits for a substantial number of employees, former employees and retirees.Our future pension obligations, costs and liabilities are highly dependent on a variety of factors beyond our control. These factors include estimated investment returns, interest rates, discount rates, health care cost trends, benefit changes, salary increases and the demographics of plan participants.If our assumptions prove to be inaccurate, our future costs could increase significantly. In 2014, NU made contributions to the Pension Plans totaling $171.6 million. We expect to make contributions in 2015 totaling $155 million. In addition, various factors, including underperformance of plan investments and changes in law or regulation, could increase the amount of contributions required to fund our pension plan in the future. Additional large funding requirements, when combined with the financing requirements of our construction program, could impact the timing and amount of future equity and debt financings and negatively affect our financial position, results of operations or cash flows.
Costs of compliance with environmental regulations, including climate change legislation, may increase and have an adverse effect on our business and results of operations.
Our subsidiaries' operations are subject to extensive federal, state and local environmental statutes, rules and regulations that govern, among other things, air emissions, water discharges and the management of hazardous and solid waste. Compliance with these requirements requires us to incur significant costs relating to environmental monitoring, installation of pollution control equipment, emission fees, maintenance and upgrading of facilities, remediation and permitting. The costs of compliance with existing legal requirements or legal requirements not yet adopted may increase in the future. An increase in such costs, unless promptly recovered, could have an adverse impact on our business and our financial position, results of operations or cash flows.
In addition, global climate change issues have received an increased focus from federal and state governments, including EPA's proposed draft carbon pollution emission guidelines for existing utility generating units, which could potentially lead to additional rules and regulations that impact how we operate our business, both in terms of the power plants we own and operate as well as general utility operations. Although we would expect that any costs of these rules and regulations would be recovered from customers, their impact on energy use by customers and the ultimate impact on our business would be dependent upon the specific rules and regulations adopted and cannot be determined at this time. The impact of these additional costs to customers could lead to a further reduction in energy consumption resulting in a decline in electricity and gas sales in our service territories, which would have an adverse impact on our business and financial position, results of operations or cash flows.
Any failure by us to comply with environmental laws and regulations, even if due to factors beyond our control, or reinterpretations of existing requirements, could also increase costs. Existing environmental laws and regulations may be revised or new laws and regulations seeking to protect the environment may be adopted or become applicable to us. Revised or additional laws could result in significant additional expense and operating restrictions on our facilities or increased compliance costs, which may not be fully recoverable in distribution company rates. The cost impact of any such laws, rules or regulations would be dependent upon the specific requirements adopted and cannot be determined at this time. For further information, see Item 1, Business - Other Regulatory and Environmental Matters, included in this Annual Report on Form 10-K.
As a holding company with no revenue-generating operations, NU parent's liquidity is dependent on dividends from its subsidiaries, primarily the Regulated companies, its commercial paper program, and its ability to access the long-term debt and equity capital markets.
NU parent is a holding company and as such, has no revenue-generating operations of its own. Its ability to meet its debt service obligations and to pay dividends on its common shares is largely dependent on the ability of its subsidiaries to pay dividends to or repay borrowings from NU parent, and/or NU parent's ability to access its commercial paper program or the long-term debt and equity capital markets. Prior to funding NU parent, the Regulated companies have financial obligations that must be satisfied, including among others, their operating expenses, debt service, preferred dividends (in the case of CL&P and NSTAR Electric), and obligations to trade creditors. Additionally, the Regulated companies could retain their free cash flow to fund their capital expenditures in lieu of receiving equity contributions from NU parent. Should the Regulated companies not be able to pay dividends or repay funds due to NU parent, or if NU parent cannot access its commercial paper programs or the long-term debt and equity capital markets, NU parent's ability to pay interest, dividends and its own debt obligations would be restricted.
Item 1B. Unresolved Staff Comments
We do not have any unresolved SEC staff comments.

20
Item 2. Properties
Transmission and Distribution System
As of December 31, 2014, NU and our electric operating subsidiaries owned the following:
Electric Electric
NU Distribution Transmission
Number of substations owned 513 63Transformer capacity (in kVa) 40,853,000 17,117,000Overhead lines (distribution in pole miles and transmission in circuit miles) 48,496 3,880Capacity range of overhead transmission lines (in kV) N/A 69 to 345Underground lines (distribution in conduit bank miles and transmission in cable miles) 16,770 408Capacity range of underground transmission lines (in kV) N/A 69 to 345
CL&P NSTAR Electric PSNH WMECO
Distribution Transmission Distribution Transmission Distribution Transmission Distribution Transmission
Number of substations owned 182 19 133 21 155 16 43 7Transformer capacity (in kVa) 19,082,000 3,117,000 11,381,000 10,065,000 5,218,000 3,868,000 5,172,000 67,000
Overhead lines (distribution in pole miles and transmission in circuit miles) 18,376 1,630 14,338 742 11,987 1,027 3,795 481Capacity range of overhead transmission lines (in kV) N/A 69 to 345 N/A 115 to 345 N/A 115 to 345 N/A 69 to 345
Underground lines (distribution in conduit bank miles and transmission in cable miles) 1,186 137 13,496 260 1,795 1 293 10Capacity range of underground transmission lines (in kV) N/A 69 to 345 N/A 115 to 345 N/A 115 N/A 115
NSTAR
NU CL&P Electric PSNH WMECO
Underground and overhead line transformers in service 622,104 287,641 123,997 167,703 42,763Aggregate capacity (in kVa) 35,196,926 15,118,641 10,828,218 7,122,928 2,127,139
Electric Generating Plants
As of December 31, 2014, PSNH owned the following electric generating plants:
Type of PlantNumber of Units
YearInstalled
Claimed Capability*(kilowatts)
Steam Plants 5 1952-74 935,343Hydro 20 1901-83 58,115Internal Combustion 5 1968-70 101,869Biomass 1 2006 42,594Total PSNH Generating Plant 31 1,137,921
* Claimed capability represents winter ratings as of December 31, 2014. The combined nameplate capacity of the generating plants is approximately 1,200 MW.
As of December 31, 2014, WMECO owned the following electric generating plants:
Type of PlantNumberof Sites
YearInstalled
Claimed Capability**(kilowatts)
Solar Fixed Tilt, Photovoltaic 3 2010-14 8,000
** Claimed capability represents the direct current nameplate capacity of the plant.
CL&P and NSTAR Electric do not own any electric generating plants.
Natural Gas Distribution System
As of December 31, 2014, Yankee Gas owned 28 active gate stations, 201 district regulator stations, and approximately 3,300 miles of natural gas main pipeline. Yankee Gas also owns a liquefaction and vaporization plant and above ground storage tank with a storage capacity equivalent of 1.2 Bcf of natural gas in Waterbury, Connecticut.
As of December 31, 2014, NSTAR Gas owned 20 active gate stations, 162 district regulator stations, and approximately 3,230 miles of natural gas main pipeline. Hopkinton, another subsidiary of NU, owns a satellite vaporization plant and above ground storage tanks in Acushnet, MA. In

21
addition, Hopkinton owns a liquefaction and vaporization plant with above ground storage tanks in Hopkinton, MA. Combined, the two plants' tanks have an aggregate storage capacity equivalent to 3.5 Bcf of natural gas that is provided to NSTAR Gas under contract.
Franchises
CL&P Subject to the power of alteration, amendment or repeal by the General Assembly of Connecticut and subject to certain approvals, permits and consents of public authority and others prescribed by statute, CL&P has, subject to certain exceptions not deemed material, valid franchises free from burdensome restrictions to provide electric transmission and distribution services in the respective areas in which it is now supplying such service.
In addition to the right to provide electric transmission and distribution services as set forth above, the franchises of CL&P include, among others, limited rights and powers, as set forth under Connecticut law and the special acts of the General Assembly constituting its charter, to manufacture, generate, purchase and/or sell electricity at retail, including to provide Standard Service, Supplier of Last Resort service and backup service, to sell electricity at wholesale and to erect and maintain certain facilities on public highways and grounds, all subject to such consents and approvals of public authority and others as may be required by law. The franchises of CL&P include the power of eminent domain. Connecticut law prohibits an electric distribution company from owning or operating generation assets. However, under "An Act Concerning Energy Independence," enacted in 2005, CL&P is permitted to own up to 200 MW of peaking facilities if the PURA determines that such facilities will be more cost effective than other options for mitigating FMCC and Locational Installed Capacity (LICAP) costs. In addition, under "An Act Concerning Electricity and Energy Efficiency," enacted in 2007, an electric distribution company, such as CL&P, is permitted to purchase an existing electric generating plant located in Connecticut that is offered for sale, subject to prior approval from the PURA and a determination by the PURA that such purchase is in the public interest. Finally, Connecticut law also allows CL&P to submit a proposal to the DEEP to build, own or operate one or more generation facilities up to 10 MWs using Class I renewable energy.
NSTAR Electric and NSTAR Gas Through their charters, which are unlimited in time, NSTAR Electric and NSTAR Gas have the right to engage in the business of delivering and selling electricity and natural gas within their respective service territories, and have powers incidental thereto and are entitled to all the rights and privileges of and subject to the duties imposed upon electric and natural gas companies under Massachusetts laws. The locations in public ways for electric transmission and distribution lines and natural gas distribution pipelines are obtained from municipal and other state authorities who, in granting these locations, act as agents for the state. In some cases the actions of these authorities are subject to appeal to the DPU. The rights to these locations are not limited in time and are subject to the action of these authorities and the legislature. Under Massachusetts law, with the exception of municipal-owned utilities, no other entity may provide electric or natural gas delivery service to retail customers within NSTAR's service territory without the written consent of NSTAR Electric and/or NSTAR Gas. This consent must be filed with the DPU and the municipality so affected.
The Massachusetts restructuring legislation defines service territories as those territories actually served on July 1, 1997 and following municipal boundaries to the extent possible. The restructuring legislation further provides that until terminated by law or otherwise, distribution companies shall have the exclusive obligation to serve all retail customers within their service territories and no other person shall provide distribution service within such service territories without the written consent of such distribution companies. Pursuant to the Massachusetts restructuring legislation, the DPU (then, the Department of Telecommunications and Energy) was required to define service territories for each distribution company, including NSTAR Electric. The DPU subsequently determined that there were advantages to the exclusivity of service territories and issued a report to the Massachusetts Legislature recommending against, in this regard, any changes to the restructuring legislation.
PSNH The NHPUC, pursuant to statutory requirements, has issued orders granting PSNH exclusive franchises to distribute electricity in the respective areas in which it is now supplying such service.
In addition to the right to distribute electricity as set forth above, the franchises of PSNH include, among others, rights and powers to manufacture, generate, purchase, and transmit electricity, to sell electricity at wholesale to other utility companies and municipalities and to erect and maintain certain facilities on certain public highways and grounds, all subject to such consents and approvals of public authority and others as may be required by law. PSNH's status as a public utility gives it the ability to petition the NHPUC for the right to exercise eminent domain for its transmission and distribution services in appropriate circumstances.
PSNH is also subject to certain regulatory oversight by the Maine Public Utilities Commission and the Vermont Public Service Board.
WMECO WMECO is authorized by its charter to conduct its electric business in the territories served by it, and has locations in the public highways for transmission and distribution lines. Such locations are granted pursuant to the laws of Massachusetts by the Department of Public Works of Massachusetts or local municipal authorities and are of unlimited duration, but the rights thereby granted are not vested. Such locations are for specific lines only and for extensions of lines in public highways. Further similar locations must be obtained from the Department of Public Works of Massachusetts or the local municipal authorities. In addition, WMECO has been granted easements for its lines in the Massachusetts Turnpike by the Massachusetts Turnpike Authority and pursuant to state laws, has the power of eminent domain.
The Massachusetts restructuring legislation applicable to NSTAR Electric (described above) is also applicable to WMECO.
Yankee Gas Yankee Gas holds valid franchises to sell natural gas in the areas in which Yankee Gas supplies natural gas service, which it acquired either directly or from its predecessors in interest. Generally, Yankee Gas holds franchises to serve customers in areas designated by those franchises as well as in most other areas throughout Connecticut so long as those areas are not occupied and served by another natural gas utility under a valid franchise of its own or are not subject to an exclusive franchise of another natural gas utility. Yankee Gas' franchises are perpetual but remain subject to the power of alteration, amendment or repeal by the General Assembly of the State of Connecticut, the power of revocation by the PURA and certain approvals, permits and consents of public authorities and others prescribed by statute. Generally, Yankee Gas' franchises include, among

22
other rights and powers, the right and power to manufacture, generate, purchase, transmit and distribute natural gas and to erect and maintain certain facilities on public highways and grounds, and the right of eminent domain, all subject to such consents and approvals of public authorities and others as may be required by law.
Item 3. Legal Proceedings
1. Yankee Companies v. U.S. Department of Energy
DOE Phase I Damages - In 1998, the Yankee Companies (CYAPC, YAEC and MYAPC) filed separate complaints against the DOE in the Court of Federal Claims seeking monetary damages resulting from the DOE's failure to begin accepting spent nuclear fuel for disposal by January 31, 1998 pursuant to the terms of the 1983 spent fuel and high level waste disposal contracts between the Yankee Companies and the DOE (DOE Phase I Damages). Phase I covered damages for the period 1998 through 2002. Following multiple appeals and cross-appeals in December 2012, the judgment awarding CYAPC $39.6 million, YAEC $38.3 million and MYAPC $81.7 million became final.
In January 2013, the proceeds from the DOE Phase I Damages Claim were received by the Yankee Companies and transferred to each Yankee Company's respective decommissioning trust.
In June 2013, FERC approved CYAPC, YAEC and MYAPC to reduce rates in their wholesale power contracts through the application of the DOE proceeds for the benefit of customers. Changes to the terms of the wholesale power contracts became effective on July 1, 2013. In accordance with the FERC order, CL&P, NSTAR Electric, PSNH and WMECO began receiving the benefit of the DOE proceeds, and the benefits have been passed on to customers.
On September 17, 2014, in accordance with the MYAPC refund plan, MYAPC returned a portion of the DOE Phase I Damages proceeds to the member companies, including CL&P, NSTAR Electric, PSNH, and WMECO, in the amount of $3.2 million, $1.1 million, $1.4 million and $0.8 million, respectively.
DOE Phase II Damages - In December 2007, the Yankee Companies each filed subsequent lawsuits against the DOE seeking recovery of actual damages incurred related to the alleged failure of the DOE to provide for a permanent facility to store spent nuclear fuel generated in years 2001 through 2008 for CYAPC and YAEC and from 2002 through 2008 for MYAPC (DOE Phase II Damages). In November 2013, the court issued a final judgment awarding CYAPC $126.3 million, YAEC $73.3 million, and MYAPC $35.8 million. On January 14, 2014, the Yankee Companies received a letter from the U.S. Department of Justice stating that the DOE will not appeal the court's final judgment.
In March and April 2014, CYAPC, YAEC and MYAPC received payment of $126.3 million, $73.3 million and $35.8 million, respectively, of the DOE Phase II Damages proceeds and made the required informational filing with FERC in accordance with the process and methodology outlined in the 2013 FERC order. The Yankee Companies returned the DOE Phase II Damages proceeds to the member companies, including CL&P, NSTAR Electric, PSNH, and WMECO, for the benefit of their respective customers, on June 1, 2014. Refunds to CL&P's, NSTAR Electric's, PSNH's and WMECO's customers for these DOE proceeds began in the third quarter of 2014.
DOE Phase III Damages - In August 2013, the Yankee Companies each filed subsequent lawsuits against the DOE seeking recovery of actual damages incurred in the years 2009 through 2012. The presiding judge issued a Pre-Trial Scheduling Order on September 3, 2014 that set the case for trial from June 30 to July 2, 2015. The Order also established January 5, 2015 for the close of fact discovery and March 30, 2015 as the close of expert discovery. Expert discovery is ongoing.
2. Conservation Law Foundation v. PSNH
On July 21, 2011, the Conservation Law Foundation (CLF) filed a citizens suit under the provisions of the federal Clean Air Act against PSNH alleging permitting violations at the company's Merrimack generating station. The suit alleges that PSNH failed to have proper permits for replacement of the Unit 2 turbine at Merrimack, installation of activated carbon injection equipment for the unit, and violated a permit condition concerning operation of the electrostatic precipitators at the station. On September 27, 2012, the federal court dismissed portions of CLF's suit pertaining to the installation of activated carbon injection and the electrostatic precipitators. CLF filed an amended complaint on May 28, 2013, related to routine maintenance of the boiler performed in 2008 and 2009. The suit seeks injunctive relief, civil penalties, and costs. CLF has pursued similar claims before the NHPUC, the N.H. Air Resources Council, and the N.H. Site Evaluation Committee, all of which have been denied. PSNH believes this suit is without merit and intends to defend it vigorously. The deadline for summary judgment is November 2015. Trial is scheduled for the spring of 2016.
3. Other Legal Proceedings
For further discussion of legal proceedings, see Item 1, Business: "- Electric Distribution Segment," "- Electric Transmission Segment," and "-Natural Gas Distribution Segment" for information about various state regulatory and rate proceedings, civil lawsuits related thereto, and information about proceedings relating to power, transmission and pricing issues; "- Nuclear Fuel Storage" for information related to high-level nuclear waste; and "- Other Regulatory and Environmental Matters" for information about proceedings involving surface water and air quality requirements, toxic substances and hazardous waste, electric and magnetic fields, licensing of hydroelectric projects, and other matters. In addition, see Item 1A, Risk Factors, for general information about several significant risks.

23
Item 4. Mine Safety Disclosures
Not applicable.
EXECUTIVE OFFICERS OF THE REGISTRANT
The following table sets forth the executive officers of NU as of February 18, 2015. All of the Company's officers serve terms of one year and until their successors are elected and qualified:
Name Age TitleJay S. Buth 45 Vice President, Controller and Chief Accounting Officer.Gregory B. Butler 57 Senior Vice President and General Counsel.Christine M. Carmody* 52 Senior Vice President-Human Resources of NUSCO.James J. Judge 59 Executive Vice President and Chief Financial Officer.Thomas J. May 67 Chairman of the Board, President and Chief Executive Officer.David R. McHale 54 Executive Vice President and Chief Administrative Officer.Joseph R. Nolan, Jr.* 51 Senior Vice President-Corporate Relations of NUSCO.Leon J. Olivier 66 Executive Vice President-Enterprise Energy Strategy and Business Development.Werner J. Schweiger 55 Executive Vice President and Chief Operating Officer.
* Deemed an executive officer of NU pursuant to Rule 3b-7 under the Securities Exchange Act of 1934.
Jay S. Buth. Mr. Buth has served as Vice President, Controller and Chief Accounting Officer of NU, CL&P, NSTAR Electric, NSTAR Gas, PSNH, WMECO, Yankee Gas and NUSCO since April 10, 2012. Previously, Mr. Buth served as Vice President-Accounting and Controller of NU, CL&P, PSNH, WMECO, Yankee Gas and NUSCO from June 2009 until April 10, 2012. From June 2006 through January 2009, Mr. Buth served as the Vice President and Controller for New Jersey Resources Corporation, an energy services holding company that provides natural gas and wholesale energy services, including transportation, distribution and asset management.
Gregory B. Butler. Mr. Butler has served as Senior Vice President and General Counsel of NU since May 1, 2014, of NSTAR Electric, and NSTAR Gas since April 10, 2012, and of CL&P, PSNH, WMECO, Yankee Gas and NUSCO since March 9, 2006. Mr. Butler has served as a Director of NSTAR Electric and NSTAR Gas since April 10, 2012, of NUSCO since November 27, 2012, and of CL&P, PSNH, WMECO and Yankee Gas since April 22, 2009. Mr. Butler previously served as Senior Vice President, General Counsel and Secretary of NU from April 10, 2012 until May 1, 2014, and as Senior Vice President and General Counsel of NU from December 1, 2005 to April 10, 2012. He has served as a Director of Eversource Energy Foundation, Inc. since December 1, 2002.
Christine M. Carmody. Ms. Carmody has served as Senior Vice President-Human Resources of NUSCO since April 10, 2012 and as a Director of NUSCO since November 27, 2012. Ms. Carmody previously served as Senior Vice President-Human Resources of CL&P, PSNH, WMECO and Yankee Gas from November 27, 2012 to September 29, 2014, and of NSTAR Electric and NSTAR Gas from August 1, 2008 to September 29, 2014, and as a Director of CL&P, PSNH, WMECO and Yankee Gas from April 10, 2012 to September 29, 2014 and of NSTAR Electric and NSTAR Gas from November 27, 2012 to September 29, 2014. Previously, Ms. Carmody served as Vice President-Organizational Effectiveness of NSTAR, NSTAR Electric and NSTAR Gas from June 2006 to August 2008. Ms. Carmody has served as a Director of Eversource Energy Foundation, Inc. since April 10, 2012. She has served as a Trustee of the NSTAR Foundation since August 1, 2008.
James J. Judge. Mr. Judge has served as Executive Vice President and Chief Financial Officer of NU, CL&P, NSTAR Electric, NSTAR Gas, PSNH, WMECO, Yankee Gas and NUSCO and as a Director of CL&P, PSNH, WMECO, Yankee Gas and NUSCO since April 10, 2012 and of NSTAR Electric and NSTAR Gas since September 27, 1999. Previously, Mr. Judge served as Senior Vice President and Chief Financial Officer of NSTAR, NSTAR Electric and NSTAR Gas from 1999 until April 2012. Mr. Judge has served as Treasurer and as a Director of Eversource Energy Foundation, Inc. since April 10, 2012. He has served as a Trustee of the NSTAR Foundation since December 12, 1995.
Thomas J. May. Mr. May has served as Chairman of the Board of NU since October 10, 2013, and as President and Chief Executive Officer and as a Trustee of NU; as Chairman and a Director of CL&P, NSTAR Electric, NSTAR Gas, PSNH, WMECO and Yankee Gas; and as Chairman, President and Chief Executive Officer and a Director of NUSCO since April 10, 2012. Mr. May has served as a Director of NSTAR Electric and NSTAR Gas since September 27, 1999. Mr. May previously served as Chairman, President and Chief Executive Officer and a Trustee of NSTAR, and as Chairman, President and Chief Executive Officer of NSTAR Electric and NSTAR Gas until April 10, 2012. He served as Chairman, Chief Executive Officer and a Trustee since NSTAR was formed in 1999, and was elected President in 2002. Mr. May has served as Chairman of the Board of Eversource Energy Foundation, Inc. since October 15, 2013, and as a Director of Eversource Energy Foundation, Inc. since April 10, 2012. He previously served as President of Eversource Energy Foundation, Inc. from October 15, 2013 to September 29, 2014. He has served as a Trustee of the NSTAR Foundation since August 18, 1987.
David R. McHale. Mr. McHale has served as Executive Vice President and Chief Administrative Officer of NU and NUSCO since April 10, 2012 and as a Director of NUSCO since January 1, 2005. Mr. McHale previously served as Executive Vice President and Chief Administrative Officer of CL&P, NSTAR Electric, NSTAR Gas, PSNH, WMECO and Yankee Gas from April 10, 2012 to September 29, 2014 and as a Director of NSTAR Electric and NSTAR Gas from November 27, 2012 to September 29, 2014, of PSNH, WMECO and Yankee Gas from January 1, 2005 to September 29, 2014, and of CL&P from January 15, 2007 to September 29, 2014. Previously, Mr. McHale served as Executive Vice President and Chief Financial Officer of NU, CL&P, PSNH, WMECO, Yankee Gas and NUSCO from January 2009 to April 2012, and as Senior Vice President and Chief Financial Officer of NU, CL&P, PSNH, WMECO, Yankee Gas and NUSCO from January 2005 to December 2008. He has served as a

24
Director of Eversource Energy Foundation, Inc. since January 1, 2005. Mr. McHale has served as a Trustee of the NSTAR Foundation since April 10, 2012.
Joseph R. Nolan, Jr. Mr. Nolan has served as Senior Vice President-Corporate Relations of NUSCO since April 10, 2012 and as a Director ofNUSCO since November 27, 2012. Mr. Nolan previously served as Senior Vice President-Corporate Relations of NSTAR Electric and NSTAR Gas from April 10, 2012 to September 29, 2014, and of CL&P, PSNH, WMECO and Yankee Gas from November 27, 2012 to September 29, 2014, as a Director of CL&P, PSNH, WMECO and Yankee Gas from April 10, 2012 to September 29, 2014 and of NSTAR Electric and NSTAR Gas from November 27, 2012 to September 29, 2014. Previously, Mr. Nolan served as Senior Vice President-Customer & Corporate Relations of NSTAR, NSTAR Electric and NSTAR Gas from 2006 until April 10, 2012. Mr. Nolan has served as a Director of Eversource Energy Foundation, Inc. since April 10, 2012, and has served as Executive Director of Eversource Energy Foundation, Inc. since October 15, 2013. He has served as a Trustee of the NSTAR Foundation since October 1, 2000.
Leon J. Olivier. Mr. Olivier has served as Executive Vice President-Enterprise Energy Strategy and Business Development of NU since September 2, 2014 and as a Director of NUSCO since January 17, 2005. Mr. Olivier previously served as Executive Vice President and Chief Operating Officer of NU and NUSCO from May 13, 2008 until September 2, 2014, and as Chief Executive Officer of NSTAR Electric and NSTAR Gas from April 10, 2012 until August 11, 2014, of CL&P, PSNH, WMECO and Yankee Gas from January 15, 2007 to September 29, 2014, and of CL&P from September 10, 2001 to September 29, 2014, and as a Director of NSTAR Electric and NSTAR Gas from November 27, 2012 to September 29, 2014, of PSNH, WMECO and Yankee Gas from January 17, 2005 to September 29, 2014, and of CL&P from September 10, 2001 to September 29, 2014. Previously, Mr. Olivier served as Executive Vice President-Operations of NU from February 13, 2007 to May 12, 2008. He has served as a Director of Eversource Energy Foundation, Inc. since April 1, 2006. Mr. Olivier has served as a Trustee of the NSTAR Foundation since April 10, 2012.
Werner J. Schweiger. Mr. Schweiger has served as Executive Vice President and Chief Operating Officer of NU since September 2, 2014 and of NUSCO since August 11, 2014, and as Chief Executive Officer of CL&P, NSTAR Electric, NSTAR Gas, PSNH, WMECO and Yankee Gas since August 11, 2014, and as a Director of NUSCO, NSTAR Gas and Yankee Gas since September 29, 2014 and of CL&P, PSNH, NSTAR Electric and WMECO since May 28, 2013. He previously served as President-Electric Distribution of NUSCO from January 16, 2013 until August 11, 2014 and as President of NSTAR Electric from April 10, 2012 until January 16, 2013 and as a Director of NSTAR Electric from November 27, 2012 to January 16, 2013. From February 27, 2002 until April 10, 2012, Mr. Schweiger was Senior Vice President-Operations of NSTAR Electric and NSTAR Gas. Mr. Schweiger has served as a Director of Eversource Energy Foundation, Inc. since September 29, 2014. He has served as a Trustee of the NSTAR Foundation since April 25, 2002.
PART II
Item 5. Market for the Registrants' Common Equity, Related Stockholder Matters and Issuer Purchases of Equity Securities
(a) Market Information and (c) Dividends
NU. Our common shares are listed on the New York Stock Exchange. Effective February 19, 2015, the ticker symbol is "ES." The high and low sales prices of our common shares and the dividends declared, for the past two years, by quarter, are shown below.
Year Quarter High LowDividendsDeclared
2014 First $ 45.69 $ 41.28 $ 0.393Second 47.60 44.28 0.393Third 47.37 41.92 0.393Fourth 56.66 44.37 0.393
2013 First $ 43.49 $ 38.60 $ 0.368Second 45.66 39.35 0.368Third 45.13 40.01 0.368Fourth 43.75 40.60 0.368
Information with respect to dividend restrictions for us, CL&P, NSTAR Electric, PSNH, and WMECO is contained in Item 7, Management's Discussion and Analysis of Financial Condition and Results of Operations, under the caption "Liquidity" and Item 8, Financial Statements and Supplementary Data, in the Combined Notes to Consolidated Financial Statements, within this Annual Report on Form 10-K.
There is no established public trading market for the common stock of CL&P, NSTAR Electric, PSNH and WMECO. All of the common stock of CL&P, NSTAR Electric, PSNH and WMECO is held solely by NU.

25
Common stock dividends approved and paid to NU during the year were as follows:
For the Years Ended December 31,
(Millions of Dollars) 2014 2013
CL&P $ 171.2 $ 152.0
NSTAR Electric 253.0 56.0
PSNH 66.0 68.0
WMECO 60.0 40.0
(b) Holders
As of January 31, 2015, there were 44,860 registered common shareholders of our company on record. As of the same date, there were a total of 317,203,765 common shares issued.
(d) Securities Authorized for Issuance Under Equity Compensation Plans
For information regarding securities authorized for issuance under equity compensation plans, see Item 12, Security Ownership of Certain Beneficial Owners and Management and Related Stockholder Matters, included in this Annual Report on Form 10-K.
(e) Performance Graph
The performance graph below illustrates a five-year comparison of cumulative total returns based on an initial investment of $100 in 2009 in Northeast Utilities common stock, as compared with the S&P 500 Stock Index and the EEI Index for the period 2010 through 2014, assuming all dividends are reinvested.

26
Purchases of Equity Securities by the Issuer and Affiliated Purchasers
The following table discloses purchases of our common shares made by us or on our behalf for the periods shown below. The common shares purchased consist of open market purchases made by the Company or an independent agent. These share transactions related to the Company's Long-Term Incentive Plans.
Period
Total Number of Shares
Purchased
Average Price Paid per Share
Total Number of Shares Purchased as
Part of Publicly Announced Plans or
Programs
Approximate DollarValue of Shares that
May Yet Be Purchased Under the Plans and
Programs (at month end)
October 1 - October 31, 2014 - $ - - -
November 1 - November 30, 2014 - - - - December 1 - December 31, 2014 62,976 50.91 - -
Total 62,976 $ 50.91 - -
Item 6. Selected Consolidated Financial Data
NU Selected Consolidated Financial Data (Unaudited)
(Thousands of Dollars, except percentages and common share information) 2014 2013 2012 (a) 2011 2010
Balance Sheet Data:Property, Plant and Equipment, Net $ 18,647,041 $ 17,576,186 $ 16,605,010 $ 10,403,065 $ 9,567,726Total Assets 29,777,975 27,795,537 28,302,824 15,647,066 14,472,601Total Capitalization (b) (c) 18,983,983 18,077,274 17,356,112 9,078,321 8,627,985Obligations Under Capital Leases (b) 9,434 10,744 11,071 12,358 12,236
Income Statement Data:Operating Revenues $ 7,741,856 $ 7,301,204 $ 6,273,787 $ 4,465,657 $ 4,898,167Net Income 827,065 793,689 533,077 400,513 394,107Net Income Attributable to Noncontrolling Interests 7,519 7,682 7,132 5,820 6,158
Net Income Attributable to Controlling Interest $ 819,546 $ 786,007 $ 525,945 $ 394,693 $ 387,949
Common Share Data:Net Income Attributable to Controlling Interest:
Basic Earnings Per Common Share $ 2.59 $ 2.49 $ 1.90 $ 2.22 $ 2.20
Diluted Earnings Per Common Share $ 2.58 $ 2.49 $ 1.89 $ 2.22 $ 2.19
Weighted Average Common Shares Outstanding:Basic 316,136,748 315,311,387 277,209,819 177,410,167 176,636,086Diluted 317,417,414 316,211,160 277,993,631 177,804,568 176,885,387
Dividends Declared Per Common Share $ 1.57 $ 1.47 $ 1.32 $ 1.10 $ 1.03Market Price - Closing (high) (d) $ 56.15 $ 45.33 $ 40.57 $ 36.31 $ 32.05Market Price - Closing (low) (d) $ 41.52 $ 38.67 $ 33.53 $ 30.46 $ 24.78Market Price - Closing (end of year) (d) $ 53.52 $ 42.39 $ 39.08 $ 36.07 $ 31.88Book Value Per Common Share (end of year) $ 31.47 $ 30.49 $ 29.41 $ 22.65 $ 21.60Tangible Book Value Per Common Share (end of year) (e) $ 20.37 $ 19.32 $ 18.21 $ 21.03 $ 19.97Rate of Return Earned on Average Common Equity (%) (f) 8.4 8.3 7.9 10.1 10.7Market-to-Book Ratio (end of year) (g) 1.7 1.4 1.3 1.6 1.5
Capitalization:Total Equity 53 % 53 % 53 % 44 % 44 %Preferred Stock, not subject to mandatory redemption 1 1 1 1 1Long-Term Debt (b) (c) 46 46 46 55 55
100 % 100 % 100 % 100 % 100 %
(a) The 2012 results include the operations of NSTAR beginning April 10, 2012.(b) Includes portions due within one year.(c) Excludes RRBs.(d) Market price information reflects closing prices as reflected by the New York Stock Exchange. (e) Common Shareholders' Equity adjusted for goodwill and intangibles divided by total common shares outstanding.(f) Net Income Attributable to Controlling Interest divided by average Common Shareholders' Equity. (g) The closing market price divided by the book value per share.

27
NU Selected Consolidated Sales Statistics2014 2013 2012 (a) 2011 2010
Revenues: (Thousands)Residential $ 3,288,313 $ 3,073,181 $ 2,731,951 $ 2,091,270 $ 2,336,078Commercial 2,471,440 2,387,535 1,604,661 1,236,374 1,346,228Industrial 348,698 339,917 753,974 252,878 268,598Wholesale 447,899 486,515 357,223 350,413 506,475Other and Eliminations 97,090 56,547 130,137 47,485 (29,878)
Total Electric 6,653,440 6,343,695 5,577,946 3,978,420 4,427,501Natural Gas 1,002,880 855,601 572,857 430,799 434,277
Total - Regulated Companies 7,656,320 7,199,296 6,150,803 4,409,219 4,861,778Other and Eliminations 85,536 101,908 122,984 56,438 36,389
Total $ 7,741,856 $ 7,301,204 $ 6,273,787 $ 4,465,657 $ 4,898,167
Regulated Companies - Sales: (GWh)Residential 21,317 21,896 19,719 14,766 14,913Commercial 27,449 27,787 24,537 14,628 14,836Industrial 5,676 5,648 5,462 4,418 4,481Wholesale 3,018 855 2,154 1,020 3,423
Total 57,460 56,186 51,872 34,832 37,653
Regulated Companies - Customers: (Average)Residential 2,734,047 2,718,727 2,711,407 1,710,342 1,704,197Commercial 373,511 371,897 370,389 199,240 198,558Industrial 8,016 8,109 8,279 7,083 7,150
Total Electric 3,115,574 3,098,733 3,090,075 1,916,665 1,909,905Natural Gas 499,186 493,563 483,770 207,753 205,885
Total 3,614,760 3,592,296 3,573,845 2,124,418 2,115,790
(a) The 2012 results include the operations of NSTAR beginning April 10, 2012.
CL&P Selected Financial Data (Unaudited) and CL&P Selected Sales Statistics have been omitted from this report but are set forth in the Annual Report on Form 10-K for 2014 filed with the SEC on a combined basis with NU on February 25, 2015. Such report is also available at the Investors section at www.eversource.com.

28
Item 7. Management's Discussion and Analysis of Financial Condition and Results of Operations
NORTHEAST UTILITIES AND SUBSIDIARIES
The following discussion and analysis should be read in conjunction with our consolidated financial statements and related combined notes included in this Annual Report on Form 10-K. References in this Annual Report on Form 10-K to "NU," the "Company," "we," "us," and "our" refer to Northeast Utilities and subsidiaries. Our merger was effective April 10, 2012, and all subsequent results of operations and cash flows include NSTAR and its subsidiaries throughout this Management's Discussion and Analysis of Financial Condition and Results of Operations. On February 2, 2015, NU, CL&P, NSTAR Electric, PSNH and WMECO commenced doing business as Eversource Energy.
All per share amounts are reported on a diluted basis. The consolidated financial statements of NU, NSTAR Electric and PSNH and the financial statements of CL&P and WMECO are herein collectively referred to as the "financial statements." Refer to the Glossary of Terms included in this combined Annual Report on Form 10-K for abbreviations and acronyms used throughout this Management's Discussion and Analysis of Financial Condition and Results of Operations.
The only common equity securities that are publicly traded are common shares of NU. The earnings and EPS of each business discussed below do not represent a direct legal interest in the assets and liabilities of such business but rather represent a direct interest in our assets and liabilities as a whole. EPS by business is a financial measure not recognized under GAAP that is calculated by dividing the Net Income Attributable to Controlling Interest of each business by the weighted average diluted NU common shares outstanding for the year. The discussion below also includes non-GAAP financial measures referencing our 2014, 2013 and 2012 earnings and EPS excluding certain integration and merger costs related to NU's merger with NSTAR. We use these non-GAAP financial measures to evaluate and to provide details of earnings by business and to more fully compare and explain our 2014, 2013 and 2012 results without including the impact of these items. Due to the nature and significance of these itemson Net Income Attributable to Controlling Interest, we believe that the non-GAAP presentation is more representative of our financial performance and provides additional and useful information to readers of this report in analyzing historical and future performance by business. These non-GAAP financial measures should not be considered as an alternative to reported Net Income Attributable to Controlling Interest or EPS determined in accordance with GAAP as an indicator of operating performance.
Reconciliations of the above non-GAAP financial measures to the most directly comparable GAAP measures of consolidated diluted EPS and Net Income Attributable to Controlling Interest are included under "Financial Condition and Business Analysis – Overview – Consolidated" and "Financial Condition and Business Analysis – Overview – Regulated Companies" in Management's Discussion and Analysis of Financial Condition and Results of Operations, herein.
Financial Condition and Business Analysis
Executive Summary
The following items in this executive summary are explained in more detail in this Management's Discussion and Analysis of Financial Condition and Results of Operations:
Results:
We earned $819.5 million, or $2.58 per share, in 2014, compared with $786 million, or $2.49 per share, in 2013. Excluding integration costs, we earned $841.6 million, or $2.65 per share, in 2014 and $799.8 million, or $2.53 per share, in 2013.
Our electric distribution segment, which includes generation, earned $462.4 million, or $1.45 per share, in 2014, compared with $427 million, or $1.35 per share, in 2013. Our transmission segment earned $295.4 million, or $0.93 per share, in 2014, compared with $287 million, or $0.91 per share, in 2013. Our natural gas distribution segment earned $72.3 million, or $0.23 per share, in 2014, compared with $60.9 million, or $0.19 per share, in 2013.
NU parent and other companies had a net loss of $10.6 million, or $0.03 per share, in 2014, compared with earnings of $11.1 million, or $0.04 per share, in 2013. The 2014 and 2013 results reflect $22.1 million, or $0.07 per share, and $13.8 million, or $0.04 per share, respectively, of integration costs.
Legislative, Regulatory, Policy and Other Items:
Pursuant to the FERC orders issued and other developments in the pending base ROE complaint proceedings further described in the "FERC Regulatory Issues – FERC Base ROE Complaints" section of this Management's Discussion and Analysis of Financial Condition and Results of Operations, the Company recorded reserves at its electric subsidiaries to recognize the potential financial impact of theserulings and developments in both 2014 and 2013. The net aggregate after-tax charge to earnings totaled $22.4 million and $14.3 million in 2014 and 2013, respectively.
On September 16, 2014, NU and Spectra Energy Corp announced Access Northeast, a natural gas pipeline expansion project. Access Northeast will enhance the Algonquin and Maritimes pipeline systems using existing routes. NU and Spectra Energy Corp will have equal ownership interest in the project. On February 18, 2015, NU, Spectra Energy Corp and National Grid announced the addition of National Grid as a co-developer in the project for a total ownership interest of 20 percent, with NU and Spectra Energy Corp each owning 40 percent. The total project cost, subject to FERC approval, is expected to be approximately $3 billion and has an anticipated in-service date of November 2018.

29
In September 2014, pursuant to legislation enacted in 2014, the NHPUC opened a docket that required them to commence and expedite a proceeding to determine whether all or some of PSNH's generation assets should be divested. An NHPUC progress report must be completed by March 31, 2015. In October 2014, the NHPUC concluded its hearings in the Clean Air Project prudence review to determine the prudent costs of PSNH's compliance with the law requiring scrubber installation. On December 26, 2014, PSNH requested that the NHPUC stay this proceeding in order to allow discussions to take place with other significant parties to determine whether a collaborative resolution of all issues was achievable. On January 15, 2015, the NHPUC issued an order granting the motion to stay in this proceeding,and settlement discussions have ensued.
On December 17, 2014, PURA issued a final decision in CL&P's rate case, effective December 1, 2014, for a total distribution rate increase of $134 million. The distribution rate increase included a revenue decoupling reconciliation mechanism, system resiliency costs, and, pursuant to a March 12, 2014 PURA order approving such costs, the recovery of 2011 and 2012 storm restoration costs over a six-year period. In addition, CL&P began recovering the 2013 storm costs and residual 2012 Storm Sandy costs over a seven-year period beginning December 1, 2014. Including the $65.4 million of DOE Phase II Damages proceeds CL&P was allowed to credit to its deferred storm costs, CL&P has now been approved to recover all of its previously deferred storm costs in distribution rates.
On December 31, 2014, NSTAR Electric, NSTAR Gas and the Massachusetts Attorney General filed a comprehensive settlement agreement with the DPU. The comprehensive settlement agreement included resolution of the outstanding NSTAR Electric CPSL program filings, the NSTAR Electric and NSTAR Gas PAM and energy efficiency-related customer billing adjustments reported in 2012, and the NSTAR Electric energy efficiency program filings regarding LBR. If approved by the DPU, NSTAR Electric and NSTAR Gas will berequired to refund a total of $44.7 million to their respective customers, which was included in our regulatory liabilities as of December 31, 2014. Upon the DPU's approval, we will adjust our regulatory liabilities, which we expect will result in an after-tax benefit of approximately $14 million. We expect a response from the DPU in the first quarter of 2015.
Liquidity:
Cash and cash equivalents totaled $38.7 million as of December 31, 2014, compared with $43.4 million as of December 31, 2013.
Investments in property, plant and equipment totaled $1.6 billion in 2014 and $1.5 billion in 2013.
Cash flows provided by operating activities totaled $1.64 billion in 2014, compared with $1.66 billion in 2013. As compared to 2013, the 2014 operating cash flows were favorably impacted by approximately $132 million in DOE Damages proceeds resulting from the spent nuclear fuel litigation received by CL&P, NSTAR Electric, PSNH and WMECO from the Yankee Companies, the absence of 2013 cash disbursements for major storm restoration costs, the decrease of approximately $130 million in Pension and PBOP Plan cash contributions, and changes in the timing of working capital items. These favorable impacts were more than offset by higher income tax payments in 2014 and the unfavorable cash flow impact resulting from lower recoveries from customers in 2014, as compared to 2013, relating to regulatory cost recovery tracking mechanisms.
In 2014, we issued $725 million of new long-term debt consisting of $100 million by Yankee Gas on January 2, 2014, $300 million by NSTAR Electric on March 7, 2014, $250 million by CL&P on April 24, 2014 and $75 million by PSNH on October 14, 2014. In 2014, we repaid $575 million of existing long-term debt consisting of $75 million by Yankee Gas on January 1, 2014, $300 million by NSTAR Electric on April 15, 2014, $50 million by PSNH on July 15, 2014, and $150 million by CL&P on September 15, 2014. On January 15, 2015, NU parent issued $450 million of new long-term debt.
In 2014, we had cash dividends on common shares of $475.2 million, compared with $462.7 million in 2013. On February 3, 2015, our Board of Trustees approved a common dividend payment of $0.4175 per share, payable on March 31, 2015 to shareholders of record as of March 2, 2015, which represents an increase of 6.4 percent over the dividend paid in December 2014, and is equivalent to a dividend on common shares of approximately $530 million on an annual basis.
We project to make capital expenditures of approximately $8.4 billion from 2015 through 2018. Of the $8.4 billion, we expect to invest approximately $4.2 billion in our electric and natural gas distribution segments and $3.9 billion in our electric transmission segment. In addition, we project to invest approximately $360 million in information technology and facilities upgrades and enhancements. These projections do not include capital expenditures related to Access Northeast.

30
Overview
Consolidated: A summary of our earnings by business, which also reconciles the non-GAAP financial measures of consolidated non-GAAP earnings and EPS, as well as EPS by business, to the most directly comparable GAAP measures of consolidated Net Income Attributable to Controlling Interest and diluted EPS, is as follows:
For the Years Ended December 31,2014 2013 2012 (1)
(Millions of Dollars, Except Per Share Amounts) Amount Per Share Amount Per Share Amount Per Share
Net Income Attributable to Controlling Interest (GAAP) $ 819.5 $ 2.58 $ 786.0 $ 2.49 $ 525.9 $ 1.89
Regulated Companies $ 830.1 $ 2.61 $ 774.9 $ 2.45 $ 626.0 $ 2.25NU Parent and Other Companies 11.5 0.04 24.9 0.08 7.5 0.03Non-GAAP Earnings 841.6 2.65 799.8 2.53 633.5 2.28Integration and Merger-Related Costs (after-tax) (22.1) (0.07) (13.8) (0.04) (107.6) (0.39)Net Income Attributable to Controlling Interest (GAAP) $ 819.5 $ 2.58 $ 786.0 $ 2.49 $ 525.9 $ 1.89
(1) Results include the operations of NSTAR beginning April 10, 2012.
Excluding the impact of integration costs, our 2014 earnings increased by $41.8 million, as compared to 2013. The increase was due primarily to lower operations and maintenance costs that impact earnings, which were primarily driven by lower labor and other employee-related costs, including approximately $30 million of non-tracked pension costs, and lower storm restoration costs, as well as higher firm natural gas sales volumes as a result of the colder weather in the first quarter of 2014, as compared to the first quarter of 2013. Partially offsetting this increase was the absence in 2014 of a favorable impact from the resolution of a state income tax audit in 2013, higher property taxes, higher depreciation expense at our regulated companies, and lower retail electric sales volumes as a result of cooler summer weather in 2014, as compared to the same period in 2013. Earnings were also unfavorably impacted by the 2014 after-tax net reserve of $22.4 million related to the 2014 FERC ROE orders, as compared to the 2013 after-tax reserve of $14.3 million related to the 2013 FERC ALJ initial decision in the FERC base ROE complaints. For further information, see "FERC Regulatory Issues – FERC Base ROE Complaints" in this Management's Discussion and Analysis of Financial Condition and Results of Operations.
The 2014 and 2013 integration costs consisted of costs incurred for employee severance in connection with ongoing integration. As of December 31, 2014, NU employed approximately 8,250 employees, compared to 8,700 as of December 31, 2013. In addition, the 2014 integration costs included costs associated with our rebranding efforts, as well as costs related to facility closures across our service territories.
Regulated Companies: Our Regulated companies consist of the electric distribution, transmission, and natural gas distribution segments. Generation activities of PSNH and WMECO are included in our electric distribution segment. A summary of our segment earnings and EPS is as follows:
For the Years Ended December 31,2014 2013 2012 (1)
(Millions of Dollars, Except Per Share Amounts) Amount Per Share Amount Per Share Amount Per Share
Net Income – Regulated Companies (GAAP) $ 830.1 $ 2.61 $ 774.9 $ 2.45 $ 572.8 $ 2.06
Electric Distribution $ 462.4 $ 1.45 $ 427.0 $ 1.35 $ 343.4 $ 1.24Transmission 295.4 0.93 287.0 0.91 249.7 0.89Natural Gas Distribution 72.3 0.23 60.9 0.19 32.9 0.12
Net Income – Regulated Companies (Non-GAAP) 830.1 2.61 774.9 2.45 626.0 2.25
Merger-Related Costs (after-tax) (2) - - - - (53.2) (0.19)
Net Income - Regulated Companies (GAAP) $ 830.1 $ 2.61 $ 774.9 $ 2.45 $ 572.8 $ 2.06
(1) Results include the operations of NSTAR beginning April 10, 2012. (2) Merger-related costs are attributable to the electric distribution segment ($51.1 million) and the natural gas distribution segment ($2.1 million).
Our electric distribution segment earnings increased $35.4 million in 2014, as compared to 2013, due primarily to lower operations and maintenance costs that impact earnings, which were primarily driven by lower labor and other employee-related costs, including pension costs, and lower storm restoration costs. Partially offsetting these favorable earnings impacts, as compared to 2013, were higher property taxes and depreciation expense, lower retail electric sales volumes as a result of cooler summer weather in 2014, and the absence in 2014 of regulatory interest income on stranded cost deferrals in 2013.
Our transmission segment earnings increased $8.4 million in 2014, as compared to 2013, due primarily to a decrease in transmission segment state income tax expense and a higher transmission rate base as a result of an increased investment in our transmission infrastructure. These favorable impacts were partially offset by the after-tax net reserve of $22.4 million related to the 2014 FERC ROE orders, as compared to the $14.3 million after-tax reserve related to the 2013 FERC ALJ initial decision in the FERC base ROE complaints.
Our natural gas distribution segment earnings increased $11.4 million in 2014, as compared to 2013, due primarily to higher firm natural gas sales volumes and peak demand revenues resulting from colder weather in the first quarter of 2014 and additional natural gas heating customers.

31
A summary of our retail electric GWh sales volumes and percentage changes, as well as percentage changes in CL&P, NSTAR Electric, PSNH and WMECO retail electric GWh sales volumes, is as follows:
For the Year Ended December 31, 2014 Compared to 2013
NU CL&P NSTAR Electric PSNH WMECO
Percentage Percentage Percentage
Sales Volumes (GWh) Increase/ Increase/ Percentage Increase/ Percentage
Electric 2014 2013 (Decrease) (Decrease) Decrease Decrease Decrease
Residential 21,317 21,896 (2.6)% (2.8)% (3.0)% (1.1)% (3.2)%
Commercial 27,449 27,787 (1.2)% (1.3)% (1.2)% (0.8)% (2.0)%
Industrial 5,676 5,648 0.5 % 2.5 % (1.6)% 0.6 % (2.5)%
Total 54,442 55,331 (1.6)% (1.6)% (1.8)% (0.7)% (2.6)%
A summary of our firm natural gas sales volumes in million cubic feet and percentage changes is as follows:
For the Year Ended December 31, 2014 Compared to 2013
NU
Sales Volumes (million cubic feet) Percentage
Firm Natural Gas 2014 2013 Increase
Residential 38,969 36,777 6.0%
Commercial 42,977 40,215 6.9%
Industrial 22,245 21,266 4.6%
Total 104,191 98,258 6.0%
Total, Net of Special Contracts (1) 99,500 94,083 5.8%
(1) Special contracts are unique to the customers who take service under such an arrangement and generally specify the amount of distribution revenue to be paid to Yankee Gas regardless of the customers' usage.
Weather, fluctuations in energy supply costs, conservation measures (including utility-sponsored energy efficiency programs), and economic conditions affect customer energy usage. Industrial sales are less sensitive to temperature variations than residential and commercial sales. In our service territories, weather impacts electric sales during the summer and electric and natural gas sales during the winter (natural gas sales are more sensitive to temperature variations than electric sales). Customer heating or cooling usage may not directly correlate with historical levels or with the level of degree-days that occur.
Our 2014 consolidated retail electric sales volumes were lower, as compared to 2013, due primarily to cooler summer weather in 2014. In 2014, cooling degree days were 13 percent lower in Connecticut and western Massachusetts, 17 percent lower in the Boston metropolitan area, and 23 percent lower in New Hampshire, as compared to 2013. Weather-normalized NU consolidated retail electric sales volumes decreased one percent in 2014, as compared to 2013. We believe the decrease was due primarily to an increase in customer conservation efforts primarily by our residential customers, including the impact of energy efficiency programs sponsored by CL&P, NSTAR Electric and WMECO.
For WMECO and CL&P (effective December 1, 2014), fluctuations in retail electric sales volumes do not impact earnings due to the regulatory commission approved revenue decoupling mechanisms. Distribution revenues are decoupled from their customer sales volumes. CL&P and WMECO reconcile their annual base distribution rate recovery to pre-established levels of baseline distribution delivery service revenues. Any difference between the allowed level of distribution revenue and the actual amount incurred during a 12-month period is adjusted through rates in the following period. The decoupling mechanism effectively breaks the relationship between sales volumes and revenues recognized. Prior to December 1, 2014, CL&P recognized LBR related to reductions in sales volume as a result of successful energy efficiency programs. LBR was recovered from retail customers through the FMCC. Effective December 1, 2014, CL&P no longer recognizes LBR due to its revenue decoupling mechanism. NSTAR Electric continues to recognize LBR through December 31, 2015 in accordance with the 2012 DPU-approved comprehensive merger settlement agreement with the Massachusetts Attorney General. For the year ended December 31, 2014, CL&P and NSTAR Electric recognized LBR of $5.3 million and $39.9 million, respectively.
Our firm natural gas sales are subject to many of the same influences as our retail electric sales. In addition, they have benefited from historically favorable natural gas prices and customer growth across both operating companies. Our 2014 consolidated firm natural gas sales volumes, consisting of the firm natural gas sales volumes of Yankee Gas and NSTAR Gas, were higher, as compared to 2013, due primarily to colder weather in the first quarter of 2014, as compared to the same period in 2013, and increased customer growth in 2014, as compared to 2013. Weather-normalized NU consolidated firm natural gas sales volumes increased 2.9 percent in 2014, as compared to 2013.
NU Parent and Other Companies: NU parent and other companies, which include our unregulated businesses, had a net loss of $10.6 million in 2014, compared with earnings of $11.1 million in 2013. Excluding the impact of integration costs, NU parent and other companies earned $11.5million in 2014, compared with $24.9 million in 2013. The earnings decrease in 2014 was due primarily to a higher effective tax rate and the absence in 2014 of the favorable impact from the resolution of the Connecticut state income tax audit.

32
Future Outlook
2015 EPS Guidance: We currently project 2015 earnings of between $2.75 per share and $2.90 per share, which excludes integration costs.
Liquidity
Consolidated: Cash and cash equivalents totaled $38.7 million as of December 31, 2014, compared with $43.4 million as of December 31, 2013.
On January 2, 2014, Yankee Gas issued $100 million of 4.82 percent Series L First Mortgage Bonds, due to mature in 2044. The proceeds, net of issuance costs, were used to repay the $75 million 4.80 percent Series G First Mortgage Bonds that matured on January 1, 2014 and to repay $25 million in short-term borrowings.
On March 7, 2014, NSTAR Electric issued $300 million of 4.40 percent debentures, due to mature in 2044. The proceeds, net of issuance costs, wereused to repay the $300 million of 4.875 percent debentures that matured on April 15, 2014.
On April 24, 2014, CL&P issued $250 million of 4.30 percent 2014 Series A First Mortgage Bonds, due to mature in 2044. The proceeds, net of issuance costs, were used to repay short-term borrowings.
On July 15, 2014, PSNH repaid at maturity the $50 million of 5.25 percent Series L First Mortgage Bonds using short-term borrowings.
On September 15, 2014, CL&P repaid at maturity the $150 million of 4.80 percent 2004 Series A First Mortgage Bonds using short-term borrowings.
On October 14, 2014, PSNH issued $75 million of first mortgage bonds at a yield of 3.144 percent, due to mature in 2023. The first mortgage bonds are part of the same series of PSNH's existing 3.50 percent Series S First Mortgage Bonds that were initially issued in November 2013. The proceeds, net of issuance costs, were used to repay short-term borrowings.
On January 15, 2015, NU parent issued $150 million of 1.60 percent Series G Senior Notes, due to mature in 2018 and $300 million of 3.15 percent Series H Senior Notes, due to mature in 2025. The proceeds, net of issuance costs, were used to repay short-term borrowings outstanding under the NU commercial paper program.
On August 27, 2014, PURA approved CL&P's request to extend the authorization period for issuance of up to $366.4 million in long-term debt from December 31, 2014 to December 31, 2015.
NU parent, CL&P, PSNH, WMECO, NSTAR Gas and Yankee Gas are parties to a five-year $1.45 billion revolving credit facility. The revolving credit facility is to be used primarily to backstop NU parent's $1.45 billion commercial paper program. The commercial paper program allows NU parent to issue commercial paper as a form of short-term debt. Effective July 23, 2014, NU parent, CL&P, PSNH, WMECO, NSTAR Gas and Yankee Gas extended the expiration date of their joint revolving credit facility for one additional year to September 6, 2019. CL&P has a borrowing sublimit of $600 million, and PSNH and WMECO each have borrowing sublimits of $300 million. As of December 31, 2014 and 2013, NU parent had approximately $1.1 billion and $1.01 billion, respectively, in short-term borrowings outstanding under its commercial paper program, leaving $348.9 million and $435.5 million of available borrowing capacity as of December 31, 2014 and 2013, respectively. The weighted-average interest rate on these borrowings as of December 31, 2014 and 2013 was 0.43 percent and 0.24 percent, respectively, which is generally based on A2/P2 rated commercial paper. As of December 31, 2014, there were intercompany loans from NU parent of $133.4 million to CL&P, $90.5 million to PSNH and $21.4 million to WMECO. As of December 31, 2013, there were intercompany loans from NU parent of $287.3 million to CL&P and $86.5 million to PSNH.
NSTAR Electric has a five-year $450 million revolving credit facility. This facility serves to backstop NSTAR Electric's existing $450 million commercial paper program. Effective July 23, 2014, NSTAR Electric extended the expiration date of its revolving credit facility for one additional year to September 6, 2019. As of December 31, 2014 and 2013, NSTAR Electric had $302 million and $103.5 million, respectively, in short-term borrowings outstanding under its commercial paper program, leaving $148 million and $346.5 million of available borrowing capacity as of December 31, 2014 and 2013, respectively. The weighted-average interest rate on these borrowings as of December 31, 2014 and 2013 was 0.27 percent and 0.13 percent, respectively, which is generally based on A2/P1 rated commercial paper.
Each of NU, CL&P, NSTAR Electric, PSNH and WMECO use its available capital resources to fund its respective construction expenditures, meet debt requirements, pay operating costs, including storm-related costs, pay dividends and fund other corporate obligations, such as pension contributions. The current growth in NU's construction expenditures utilizes a significant amount of cash for projects that have a long-term return on investment and recovery period. In addition, NU's Regulated companies recover their electric and natural gas distribution construction expenditures as the related project costs are depreciated over the life of the assets. This impacts the timing of the revenue stream designed to fully recover the total investment plus a return on the equity portion of the cost and related financing costs. These factors have resulted in current liabilities exceeding current assets by approximately $442 million, $177 million, $133 million and $24 million at NU, CL&P, NSTAR Electric and WMECO, respectively, as of December 31, 2014.
As of December 31, 2014, $216.7 million of NU's obligations classified as current liabilities relates to long-term debt that will be paid in the next 12 months, consisting of $162 million for CL&P, $4.7 million for NSTAR Electric and $50 million for WMECO. The remaining $28.9 million of NU's obligations classified as current liabilities relates to fair value adjustments from the merger that will be amortized in the next 12 months and have no cash flow impact. NU, with its strong credit ratings, has several options available in the financial markets to repay or refinance these maturities with the issuance of new long-term debt. NU, CL&P, NSTAR Electric, PSNH and WMECO will reduce their short-term borrowings with cash received from operating cash flows or with the issuance of new long-term debt, determined considering capital requirements and maintenance of NU's credit

33
rating and profile. Management expects the future operating cash flows of NU, CL&P, NSTAR Electric, PSNH and WMECO, along with the access to financial markets, will be sufficient to meet any future operating requirements and capital investment forecasted opportunities.
Cash flows provided by operating activities totaled $1.64 billion in 2014, compared with $1.66 billion in 2013 and $1.16 billion in 2012. The 2014 operating cash flows were favorably impacted by approximately $132 million in DOE Damages proceeds resulting from the spent nuclear fuel litigation received by CL&P, NSTAR Electric, PSNH and WMECO from the Yankee Companies, the absence of 2013 cash disbursements for major storm restoration costs, the decrease of approximately $130 million in Pension and PBOP Plan cash contributions and changes in the timing of working capital items. These favorable impacts were more than offset by higher income tax payments in 2014 and the unfavorable cash flow impact resulting from lower recoveries from customers in 2014, as compared to 2013, relating to regulatory cost recovery tracking mechanisms. For further information on the spent nuclear fuel litigation, see Note 11C, "Commitments and Contingencies – Contractual Obligations – Yankee Companies," in this combined Annual Report on Form 10-K. The improved operating cash flows in 2013, as compared to 2012, were due primarily to the addition of NSTAR, a decrease in cash disbursements for storm restoration, and the absence in 2013 of cash disbursements related to customer bill credits and merger-related payments made in 2012. Partially offsetting these favorable cash flow impacts was an increase in Pension Plan cash contributions, increases in fuel inventories, and changes in traditional working capital amounts due primarily to the timing of accounts receivable and accounts payable.
A summary of our corporate credit ratings and outlooks by Moody's, S&P and Fitch is as follows:
Moody's S&P Fitch
Current Outlook Current Outlook Current Outlook
NU Parent Baa1 Stable A- Positive BBB+ Stable
CL&P Baa1 Stable A- Positive BBB+ Stable
NSTAR Electric A2 Stable A- Positive A Stable
PSNH Baa1 Stable A- Positive BBB+ Stable
WMECO A3 Stable A- Positive BBB+ Stable
A summary of the current credit ratings and outlooks by Moody's, S&P and Fitch for senior unsecured debt of NU parent, NSTAR Electric, and WMECO and senior secured debt of CL&P and PSNH is as follows:
Moody's S&P Fitch
Current Outlook Current Outlook Current Outlook
NU Parent Baa1 Stable BBB+ Positive BBB+ Stable
CL&P A2 Stable A Positive A Stable
NSTAR Electric A2 Stable A- Positive A+ Stable
PSNH A2 Stable A Positive A Stable
WMECO A3 Stable A- Positive A- Stable
On January 31, 2014, Moody's upgraded corporate credit and securities ratings of NU, CL&P and PSNH by one level and WMECO by two levels. On April 7, 2014, Fitch affirmed the corporate credit ratings and outlook of NU, CL&P, NSTAR Electric, PSNH, WMECO and NSTAR Gas. On April 25, 2014, S&P affirmed the corporate credit ratings and revised the outlooks to positive from stable of NU, CL&P, NSTAR Electric, PSNH, WMECO, Yankee Gas and NSTAR Gas.
In 2014, we had cash dividends on common shares of $475.2 million, compared with $462.7 million in 2013. On December 31, 2014, we paid a common dividend of $0.3925 per share, which was approved by our Board of Trustees on December 3, 2014, to shareholders of record as of December 15, 2014. On February 3, 2015, our Board of Trustees approved a common dividend payment of $0.4175 per share, payable on March 31, 2015 to shareholders of record as of March 2, 2015. The dividend represented an increase of 6.4 percent over the dividend paid in December 2014.
In 2014, CL&P, NSTAR Electric, PSNH, and WMECO paid $171.2 million, $253 million, $66 million, and $60 million, respectively, in common dividends to NU parent.
Investments in Property, Plant and Equipment on the statements of cash flows do not include amounts incurred on capital projects but not yet paid, cost of removal, AFUDC related to equity funds, and the capitalized portions of pension expense. In 2014, investments for NU, CL&P, NSTAR Electric, PSNH, and WMECO were $1.6 billion, $515.7 million, $465 million, $256.2 million, and $116.2 million, respectively.
Business Development and Capital Expenditures
Consolidated: Our consolidated capital expenditures, including amounts incurred but not paid, cost of removal, AFUDC, and the capitalized portions of pension expense (all of which are non-cash factors), totaled $1.7 billion in 2014, $1.6 billion in 2013, and $1.5 billion in 2012. These amounts included $58.3 million in 2014, $44.7 million in 2013, and $43.1 million in 2012, related to information technology and facilities upgrades and enhancements, primarily at NUSCO and The Rocky River Realty Company.
Access Northeast: On September 16, 2014, NU and Spectra Energy Corp announced Access Northeast, a natural gas pipeline expansion project. Access Northeast will enhance the Algonquin and Maritimes pipeline systems using existing routes and is expected to be capable of delivering approximately one billion cubic feet of natural gas per day to New England. NU and Spectra Energy Corp will have equal ownership interest in the project with the option of additional investors joining in the future. On February 18, 2015, NU, Spectra Energy Corp and National Grid announced the addition of National Grid as a co-developer in the project for a total ownership interest of 20 percent, with NU and Spectra Energy Corp each
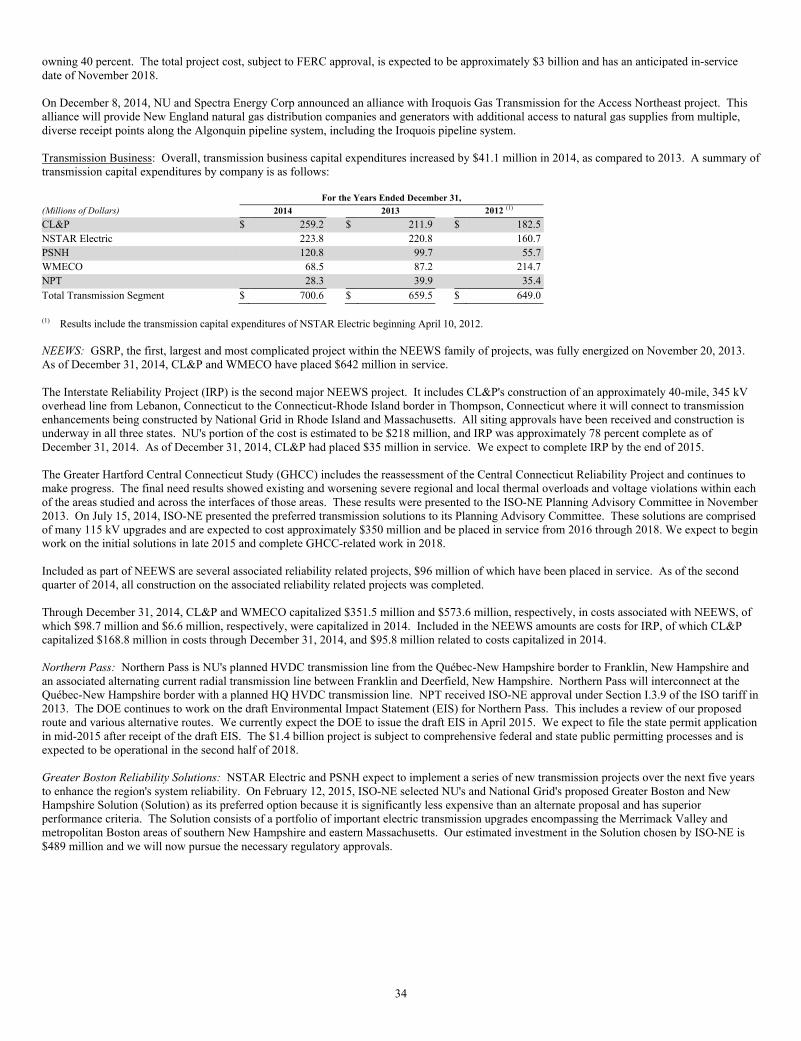
34
owning 40 percent. The total project cost, subject to FERC approval, is expected to be approximately $3 billion and has an anticipated in-service date of November 2018.
On December 8, 2014, NU and Spectra Energy Corp announced an alliance with Iroquois Gas Transmission for the Access Northeast project. This alliance will provide New England natural gas distribution companies and generators with additional access to natural gas supplies from multiple, diverse receipt points along the Algonquin pipeline system, including the Iroquois pipeline system.
Transmission Business: Overall, transmission business capital expenditures increased by $41.1 million in 2014, as compared to 2013. A summary of transmission capital expenditures by company is as follows:
For the Years Ended December 31,
(Millions of Dollars) 2014 2013 2012 (1)
CL&P $ 259.2 $ 211.9 $ 182.5
NSTAR Electric 223.8 220.8 160.7
PSNH 120.8 99.7 55.7
WMECO 68.5 87.2 214.7
NPT 28.3 39.9 35.4
Total Transmission Segment $ 700.6 $ 659.5 $ 649.0
(1) Results include the transmission capital expenditures of NSTAR Electric beginning April 10, 2012.
NEEWS: GSRP, the first, largest and most complicated project within the NEEWS family of projects, was fully energized on November 20, 2013. As of December 31, 2014, CL&P and WMECO have placed $642 million in service.
The Interstate Reliability Project (IRP) is the second major NEEWS project. It includes CL&P's construction of an approximately 40-mile, 345 kV overhead line from Lebanon, Connecticut to the Connecticut-Rhode Island border in Thompson, Connecticut where it will connect to transmission enhancements being constructed by National Grid in Rhode Island and Massachusetts. All siting approvals have been received and construction is underway in all three states. NU's portion of the cost is estimated to be $218 million, and IRP was approximately 78 percent complete as of December 31, 2014. As of December 31, 2014, CL&P had placed $35 million in service. We expect to complete IRP by the end of 2015.
The Greater Hartford Central Connecticut Study (GHCC) includes the reassessment of the Central Connecticut Reliability Project and continues to make progress. The final need results showed existing and worsening severe regional and local thermal overloads and voltage violations within each of the areas studied and across the interfaces of those areas. These results were presented to the ISO-NE Planning Advisory Committee in November 2013. On July 15, 2014, ISO-NE presented the preferred transmission solutions to its Planning Advisory Committee. These solutions are comprised of many 115 kV upgrades and are expected to cost approximately $350 million and be placed in service from 2016 through 2018. We expect to begin work on the initial solutions in late 2015 and complete GHCC-related work in 2018.
Included as part of NEEWS are several associated reliability related projects, $96 million of which have been placed in service. As of the second quarter of 2014, all construction on the associated reliability related projects was completed.
Through December 31, 2014, CL&P and WMECO capitalized $351.5 million and $573.6 million, respectively, in costs associated with NEEWS, of which $98.7 million and $6.6 million, respectively, were capitalized in 2014. Included in the NEEWS amounts are costs for IRP, of which CL&P capitalized $168.8 million in costs through December 31, 2014, and $95.8 million related to costs capitalized in 2014.
Northern Pass: Northern Pass is NU's planned HVDC transmission line from the Québec-New Hampshire border to Franklin, New Hampshire and an associated alternating current radial transmission line between Franklin and Deerfield, New Hampshire. Northern Pass will interconnect at the Québec-New Hampshire border with a planned HQ HVDC transmission line. NPT received ISO-NE approval under Section I.3.9 of the ISO tariff in 2013. The DOE continues to work on the draft Environmental Impact Statement (EIS) for Northern Pass. This includes a review of our proposed route and various alternative routes. We currently expect the DOE to issue the draft EIS in April 2015. We expect to file the state permit application in mid-2015 after receipt of the draft EIS. The $1.4 billion project is subject to comprehensive federal and state public permitting processes and is expected to be operational in the second half of 2018.
Greater Boston Reliability Solutions: NSTAR Electric and PSNH expect to implement a series of new transmission projects over the next five years to enhance the region's system reliability. On February 12, 2015, ISO-NE selected NU's and National Grid's proposed Greater Boston and New Hampshire Solution (Solution) as its preferred option because it is significantly less expensive than an alternate proposal and has superior performance criteria. The Solution consists of a portfolio of important electric transmission upgrades encompassing the Merrimack Valley and metropolitan Boston areas of southern New Hampshire and eastern Massachusetts. Our estimated investment in the Solution chosen by ISO-NE is $489 million and we will now pursue the necessary regulatory approvals.

35
Distribution Business: A summary of distribution capital expenditures by company is as follows:
For the Years Ended December 31,
(Millions of Dollars) 2014 2013 2012 (1)
CL&P:
Basic Business $ 120.2 $ 60.9 $ 69.2
Aging Infrastructure 118.0 160.7 177.8
Load Growth 66.3 76.9 65.8
Total CL&P 304.5 298.5 312.8
NSTAR Electric:
Basic Business 99.0 98.5 47.3
Aging Infrastructure 104.2 110.6 111.5
Load Growth 43.1 53.6 17.4
Total NSTAR Electric 246.3 262.7 176.2
PSNH:
Basic Business 62.1 22.7 25.3
Aging Infrastructure 45.3 50.5 50.2
Load Growth 27.1 29.3 20.2
Total PSNH 134.5 102.5 95.7
WMECO:
Basic Business 19.0 7.9 12.7
Aging Infrastructure 16.1 24.6 18.5
Load Growth 6.1 9.2 6.5
Total WMECO 41.2 41.7 37.7
Total - Electric Distribution (excluding Generation) 726.5 705.4 622.4
Other Distribution - 0.7 0.1
PSNH Generation 13.1 9.7 29.9
WMECO Generation 7.6 4.5 0.7
Total - Natural Gas 193.7 175.2 162.9
Total Distribution Segment $ 940.9 $ 895.5 $ 816.0
(1) Results include the electric and natural gas distribution capital expenditures of NSTAR beginning April 10, 2012.
For the electric distribution business, basic business includes the purchase of meters, tools, vehicles, information technology, transformer replacements, equipment facilities, and the relocation of plant. Aging infrastructure relates to reliability and the replacement of overhead lines, plant substations, underground cable replacement, and equipment failures. Load growth includes requests for new business and capacity additions on distribution lines and substation additions and expansions.
Natural Gas Business Expansion and Enhancement: In 2013, in accordance with Connecticut law and regulation, PURA approved a comprehensive joint natural gas infrastructure expansion plan (expansion plan) filed by Yankee Gas and other Connecticut natural gas distribution companies. The expansion plan described how Yankee Gas expects to add approximately 82,000 new natural gas heating customers over the next 10 years. Yankee Gas estimates that its portion of the plan will cost approximately $700 million over 10 years. In January 2015, PURA approved a joint settlement agreement proposed by Yankee Gas and other Connecticut natural gas distribution companies and regulatory agencies that clarified the procedures and oversight criteria applicable to the expansion plan.
On October 31, 2014, pursuant to new legislation, NSTAR Gas filed the Gas System Enhancement Program (GSEP) with the DPU. NSTAR Gas'program accelerates the replacement of certain natural gas distribution facilities in the system within 25 years. The GSEP includes a new tariff that provides NSTAR Gas an opportunity to collect the costs for the program on an annual basis through a newly designed reconciling factor to be approved by the DPU. We expect a decision on the program in April 2015. We have projected capital expenditures of approximately $200 million for the period 2015 through 2018 for the GSEP, which are consistent with our request in the NSTAR Gas rate case application currently before the DPU.

36
Projected Capital Expenditures: A summary of the projected capital expenditures for the Regulated companies' electric transmission and for the total electric distribution, generation, and natural gas distribution businesses for 2015 through 2018, including information technology and facilities upgrades and enhancements on behalf of the Regulated companies, is as follows:
Years
(Millions of Dollars) 2015 2016 2017 20182015-2018Total
CL&P Transmission $ 214 $ 241 $ 258 $ 158 $ 871NSTAR Electric Transmission 231 262 236 295 1,024PSNH Transmission 133 76 73 19 301WMECO Transmission 128 80 34 8 250NPT 34 309 620 466 1,429 Total Transmission $ 740 $ 968 $ 1,221 $ 946 $ 3,875Electric Distribution $ 755 $ 778 $ 758 $ 748 $ 3,039Generation 38 20 15 15 88Natural Gas 228 256 275 300 1,059 Total Distribution $ 1,021 $ 1,054 $ 1,048 $ 1,063 $ 4,186Information Technology and All Other $ 90 $ 92 $ 94 $ 83 $ 359Total $ 1,851 $ 2,114 $ 2,363 $ 2,092 $ 8,420
The projections do not include capital expenditures related to Access Northeast. Actual capital expenditures could vary from the projected amounts for the companies and years above.
FERC Regulatory Issues
FERC Base ROE Complaints:First Complaint: On September 30, 2011, a complaint was filed jointly at FERC under Sections 206 and 306 of the Federal Power Act (the "first complaint") by several New England state attorneys general, state regulatory commissions, consumer advocates and other parties (the "Complainants"). The Complainants alleged that the base ROE of 11.14 percent that has been utilized since 2006 in the calculation of formula rates for transmission service under the ISO-NE Open Access Transmission Tariff by NETOs, including CL&P, NSTAR Electric, PSNH and WMECO, was unjust and unreasonable and asserted that the rate was excessive due to changes in the capital markets. Complainants sought an order to reduce the base ROE prospectively from the date of a final FERC order, and for the 15-month period October 1, 2011 to December 31, 2012 (the "first complaint refund period"), and to require refunds. The FERC set the case for trial before a FERC ALJ after settlement negotiations were unsuccessful in August 2012.
On August 6, 2013, the FERC ALJ issued an initial decision on the first complaint finding that the base ROE in effect during the first complaint refund period was not reasonable and recommended separate base ROEs for the first complaint refund period of 10.6 percent and for the period beginning when FERC issues its final decision (the "prospective period") of 9.7 percent, leaving policy considerations and additional adjustments to the FERC. In 2013, the Company recorded reserves at its electric subsidiaries to recognize the potential financial impact from the FERC ALJ's initial decision for the first complaint refund period.
On June 19, 2014, FERC issued an order on the first complaint partially affirming and partially reversing the FERC ALJ's initial decision. FERC set a single tentative base ROE of 10.57 percent for the first complaint refund period and prospective period. FERC also modified its traditional methodology by adopting a two-step discounted cash flow analysis consistent with the method that it utilizes to determine the ROEs of both natural gas and oil pipeline projects. Using this methodology, FERC determined a new zone of reasonableness of 7.03 percent to 11.74 percent, and set thetentative base ROE halfway between the midpoint and the top of the zone of reasonableness. FERC also stated that a utility's "total ROE, inclusive of transmission incentive ROE adders" should not exceed the top of the new zone of reasonableness produced by this methodology. FERC instituted a paper hearing on the long-term growth rate portion of the methodology (the "paper hearing"). Rehearing requests on this new methodology were filed in July 2014, and briefs were filed in August and September 2014 by the parties on the appropriate long-term growth rate.
On October 16, 2014, the FERC issued an order in the paper hearing, which confirmed that the base ROE should be set at 10.57 percent and that a utility's total or maximum ROE should not exceed the top of the new zone of reasonableness (11.74 percent). The FERC ordered the NETOs to provide refunds to customers for the first complaint refund period, and set the prospective new base ROE at this time. In November 2014, the NETOs requested rehearing and clarification from FERC. In late 2014, the NETOs made a compliance filing, and began refunding amounts from the first complaint period, inclusive of incentive ROE adders that exceeded the 11.74 percent as compared to the total company transmission ROE. Complainants have challenged the compliance filing.
In 2014, the Company recorded additional reserves at its electric subsidiaries to recognize the potential financial impact from the FERC's orders.
Second Complaint: On December 27, 2012, a second complaint was filed jointly at FERC by several additional consumer groups and municipal parties (the "second complaint"), challenging the NETOs' existing base ROE, requesting FERC to reduce the NETOs' base ROE prospectively from the date of the final FERC order and seeking refunds for the 15-month period of December 27, 2012 to March 27, 2014 (the "second complaint refund period").
On June 19, 2014, FERC issued an order finding that the second complaint raised issues of material fact, and setting the complaint for settlement or hearing. On July 21, 2014, the NETOs filed a rehearing request in this proceeding. On October 24, 2014, the FERC assigned the case for trial before a FERC ALJ after settlement negotiations were unsuccessful. The FERC ALJ set a trial date beginning June 8, 2015, and indicated he could issue an initial decision on or before October 26, 2015. This schedule was subsequently modified by a November 24, 2014 order on the third complaint (see below). In 2014, the Company recorded reserves at its electric subsidiaries to recognize the potential financial impact from the FERC's June 19th
order for the second complaint refund period.

37
Third Complaint: On July 31, 2014, a third complaint was filed at FERC (the "third complaint") by most of the Complainants to the first and second complaints, claiming that the base ROE and incentive adders exceed the range of permissible ROEs, requesting FERC to reduce the NETOs' base ROE prospectively from the date of a final FERC order, and seeking refunds for the 15-month period of July 31, 2014 to October 31, 2015 (the "third complaint refund period"). On November 24, 2014, FERC issued an order finding that the third complaint raised issues of material fact and set the case for trial. In this order, FERC also consolidated the third complaint with the second complaint for purposes of hearing and decision. Due to the establishment of two refund periods, the FERC also stated that it is appropriate for the parties to litigate a separate ROE for each refund period. On December 24, 2014, the NETOs filed for rehearing of this order. The trial judge has set a hearing beginning June 23, 2015 for the two complaints. The trial judge's recommended initial decision is expected by November 30, 2015 with a FERC order issued by September 30, 2016.
Rehearing requests of NETOs that were filed in all three complaint proceedings have not yet been acted upon by FERC. At this time, the Company cannot determine the outcome of these rehearing requests.
Cumulative Reserves: The following is a summary of the cumulative pre-tax reserves (excluding interest) that the Company established in 2013 and 2014 to recognize the potential financial impacts of the first and second complaints. The Company is unable to determine any amount related to the third complaint.
NU
For the Years Ended December 31,
(Millions of Dollars) 2013 2014 Total
1st Complaint - Base ROE $ 23.7 $ 1.2 $ 24.92nd Complaint - Base ROE - 27.4 27.4Incentive ROE (1st and 2nd Complaint) - 8.4 8.4Cumulative Reserve $ 23.7 $ 37.0 $ 60.7
CL&P NSTAR Electric
For the Years Ended December 31, For the Years Ended December 31,
(Millions of Dollars) 2013 2014 Total 2013 2014 Total
1st Complaint - Base ROE $ 12.8 $ 0.5 $ 13.3 $ 5.7 $ 0.4 $ 6.12nd Complaint - Base ROE - 13.5 13.5 - 7.5 7.5Incentive ROE (1st and 2nd Complaint) - 6.7 6.7 - - -Cumulative Reserve $ 12.8 $ 20.7 $ 33.5 $ 5.7 $ 7.9 $ 13.6
PSNH WMECO
For the Years Ended December 31, For the Years Ended December 31,
(Millions of Dollars) 2013 2014 Total 2013 2014 Total
1st Complaint - Base ROE $ 2.3 $ 0.1 $ 2.4 $ 2.9 $ 0.2 $ 3.12nd Complaint - Base ROE - 2.7 2.7 - 3.7 3.7Incentive ROE (1st and 2nd Complaint) - - - - 1.7 1.7Cumulative Reserve $ 2.3 $ 2.8 $ 5.1 $ 2.9 $ 5.6 $ 8.5
As of December 31, 2014, the cumulative reserves above do not reflect refunds totaling $4.8 million at NU, $2.7 million at CL&P, $1 million at NSTAR Electric, $0.5 million at PSNH and $0.6 million at WMECO for the first complaint refund period.
In the fourth quarter of 2014, we finalized our reserve analysis based on the October FERC order and our subsequent refund filing. As a result, the net aggregate after-tax charge to 2014 earnings resulting from the June 19, 2014 and October 16, 2014 FERC orders totaled $22.4 million at NU, $12.4 million at CL&P, $4.9 million at NSTAR Electric, $1.7 million at PSNH and $3.4 million at WMECO. In 2013, the aggregate after-tax charge to earnings totaled $14.3 million at NU, $7.7 million at CL&P, $3.4 million at NSTAR Electric, $1.4 million at PSNH and $1.8 million at WMECO.
Regulatory Developments and Rate Matters
Electric and Natural Gas Base Distribution Rates:
Each NU utility subsidiary is subject to the regulatory jurisdiction of the state in which it operates: CL&P and Yankee Gas operate in Connecticut and are subject to PURA regulation; NSTAR Electric, WMECO and NSTAR Gas operate in Massachusetts and are subject to DPU regulation; and PSNH operates in New Hampshire and is subject to NHPUC regulation.
In Connecticut, CL&P distribution rates were established in a 2014 PURA approved rate case. See Connecticut – Distribution Rates in this Regulatory Developments and Rate Matters section for further information. Yankee Gas distribution rates were established in a 2011 PURA approved rate case.
In Massachusetts, electric utility companies are required to file at least one distribution rate case every five years and natural gas companies to file at least one distribution rate case every 10 years, and those companies are limited to one settlement agreement in any 10-year period. Pursuant to the April 2012 DPU-approved Massachusetts comprehensive merger settlement agreements, NSTAR Electric, WMECO and NSTAR Gas are subject toa base distribution rate freeze through December 31, 2015. On December 17, 2014, NSTAR Gas filed an application with the DPU to amend base distribution rates, effective January 1, 2016.
In New Hampshire, PSNH is currently operating under the 2010 NHPUC approved distribution rate case settlement, which is effective through June 30, 2015. Under the settlement, PSNH is permitted to file a request to collect certain exogenous costs and step increases on an annual basis. See New Hampshire - Distribution Rates in this Regulatory Developments and Rate Matters section for further information.

38
Major Storms:
CL&P, NSTAR Electric, PSNH and WMECO experienced several significant storm events, including Tropical Storm Irene in 2011, the October 2011 snowstorm, Storm Sandy in 2012, and the February 2013 blizzard. As a result of these storm events, each company suffered extensive damageto its distribution and transmission systems resulting in customer outages. Each company incurred significant costs to repair damage and restore customers' service. In addition, on November 26, 2014, a snowstorm caused damage to the electric delivery systems of PSNH and WMECO. This snowstorm resulted in estimated deferred storm restoration costs of approximately $23 million at PSNH and approximately $3 million at WMECO.
The magnitude of these storm restoration costs met the criteria for cost deferral in Connecticut, Massachusetts, and New Hampshire. As a result, the storms had no material impact on the results of operations of CL&P, NSTAR Electric, PSNH and WMECO. We believe the storm restoration costs were prudent and meet the criteria for specific cost recovery in Connecticut, Massachusetts and New Hampshire, and that recovery from customers is probable through the applicable regulatory recovery process. Each electric utility has sought, or is seeking, recovery of its deferred storm restoration costs through its applicable regulatory recovery process. As of December 31, 2014, all CL&P deferred storm costs have been reviewed and approved for recovery in distribution rates, NSTAR Electric received DPU approval for recovery of $34.2 million of deferred storm costs related to Tropical Storm Irene in 2011 and the October 2011 snowstorm, PSNH received an NHPUC audit report, which found no exception with storm costs from 2011 through March 2013, and WMECO received DPU approval to begin recovering the October 2011 snowstorm and 2012 Storm Sandy restoration costs, of which the DPU approved the majority of deferred storm costs through 2011.
DPU Storm Penalties: In December 2012, in separate orders issued by the DPU, the DPU ordered penalties of $4.1 million and $2 million for NSTAR Electric and WMECO, respectively, related to the electric utilities' responses to Tropical Storm Irene and the October 2011 snowstorm, which were refunded to their customers. In December 2012, NSTAR Electric and WMECO each filed appeals with the SJC arguing the DPU penalties should be vacated. On September 4, 2014, the SJC vacated $2 million of NSTAR Electric's $4.1 million penalties, as it did not believe that substantial evidence existed to support such penalties, while it upheld the WMECO penalties. Subsequently, the DPU reinstated approximately $0.4 million of NSTAR Electric storm penalties pursuant to a December 22, 2014 order.
Connecticut:
Distribution Rates: On June 9, 2014, CL&P filed an application with PURA to amend distribution rates, effective December 1, 2014. The application included an increase to base distribution rates, as well as increases for the recovery of previously approved 2011 and 2012 deferred storm restoration costs and previously approved electric system resiliency costs. After the legal briefing process, CL&P updated its requested increase to reflect a reduction to the storm cost recovery amounts. The reduction primarily related to applying the impact of the $65.4 million DOE Phase II Damages proceeds received on June 1, 2014 to the total deferred storm restoration costs of $365 million, as ordered by PURA on June 17, 2014.
On December 17, 2014, PURA issued a final order and approved a total distribution rate increase of $134 million, which includes an authorized ROE of 9.02 percent for the first twelve month period and 9.17 percent thereafter. The 2011 and 2012 storm costs were approved in their entirety, to be recovered over a six-year period, and adjustments to storm cost recovery and system resiliency cost recovery reflect the lower approved ROE. PURAgranted a re-opener to the rate application for further review of the appropriate treatment of deferred income taxes for rate base purposes. If PURA concludes that CL&P's treatment of its deferred taxes for rate base purposes is correct, it would result in an additional annual increase to total distribution rates of $22 million. CL&P is currently responding to information requests and has provided additional information with respect to the treatment of deferred income taxes for rate base purposes and expects a decision no later than the third quarter of 2015.
The PURA also approved the establishment of a revenue decoupling reconciliation mechanism, effective December 1, 2014, whereby actual base distribution rate recovery is reconciled with pre-established revenue requirement level on an annual basis. Any difference between the allowed level of distribution revenue and the actual amount incurred in a calendar year is adjusted through rates in the following year. The baseline allowed distribution revenue is $1.041 billion, which will remain constant until CL&P's next rate case. With the implementation of the decoupling mechanism, LBR will no longer be recognized effective December 1, 2014, and CL&P will not experience significant fluctuations to its base distribution revenues regardless of the impact of weather and energy efficiency by its customers.
The PURA also allowed CL&P recovery of $31.1 million in 2013 storm costs and residual 2012 Storm Sandy costs over a seven-year period beginning December 1, 2014.
CL&P 2014 Storm Order: On March 12, 2014, PURA approved recovery of $365 million of deferred storm restoration costs (with carrying charges) associated with five major storms that occurred in 2011 and 2012 and ordered CL&P to capitalize approximately $18 million of the deferred storm restoration costs as utility plant, which will be recovered through depreciation expense in future rate proceedings. On December 1, 2014, CL&P began recovering approximately $300 million in its distribution rates over a six-year period, which was net of $65.4 million of DOE Phase II Damages proceeds. The remaining costs were either disallowed or are probable of recovery from other sources. These costs did not have a material impact on CL&P's financial position or results of operations.
CL&P Standard Service and Last Resort Service Rates: CL&P's residential and small to intermediate commercial and industrial customers who do not choose competitive energy suppliers are served under SS rates, and large commercial and industrial customers who do not choose competitive energy suppliers are served under LRS rates. Effective January 1, 2015, the PURA approved an increase to CL&P's energy supply portion of the total average SS rate to 12.446 cents per kWh and the energy supply portion of the total average LRS rate to 17.714 cents per kWh. These changes were due primarily to the market conditions for the procurement of energy. The SS and LRS rates reflect CL&P's costs to procure energy for its customers. Adjustments to these rates do not impact earnings, as CL&P is fully recovering the costs of its SS and LRS services from customers.

39
CL&P CTA and SBC Reconciliation: CL&P filed its 2013 CTA and SBC reconciliation on March 31, 2014, which compared CTA and SBC billed revenues to revenue requirements, as required by PURA. The 2013 reconciliation filing produced net over recoveries of $16.9 million and $4.3 million for the CTA and SBC, respectively, and was approved by PURA.
CL&P FMCC Filing: CL&P files with PURA its FMCC filing, which reconciles actual FMCC revenues and charges and GSC revenues and expenses. The filing identifies a total net over or under recovery, which includes the remaining uncollected or non-refunded portions from previous filings. On February 3, 2014, CL&P filed with PURA its FMCC filing for the period July 1, 2013 through December 31, 2013. The filing identified a total net over recovery through December 31, 2013 of $24.1 million and was approved by PURA.
CL&P Conservation Adjustment Mechanism: In 2012, CL&P filed an application with PURA for the establishment of a CAM. The CAM would collect the costs associated with expanded energy efficiency programs beyond that already collected through the statutory charge and the revenues lost because of the expanded energy efficiency programs. In 2013, DEEP approved CL&P's request of an expanded conservation spending budget and reiterated that PURA is directed to approve a CAM to fund the expanded conservation budget. The PURA approved a CAM effective January 1, 2014 subject to a future review of its revenue and expense reconciliation filing to be submitted by CL&P. CL&P has continued its approved January 1, 2014 CAM rate through 2015.
Massachusetts:
Basic Service Rates: Electric distribution companies in Massachusetts are required to obtain and resell power to retail customers through Basic Service for those customers who choose not to buy energy from a competitive energy supplier. Basic Service rates are reset every six months (every three months for large commercial and industrial customers). NSTAR Electric and WMECO fully recover their energy costs through DPU-approved regulatory rate mechanisms.
2015 Annual Reconciliation Filing: In the fourth quarter of 2014, NSTAR Electric and WMECO filed separately their respective 2015 annual cost recovery mechanisms, including the mechanisms to collect the costs to provide retail transmission, energy supply and energy efficiency services to its customers as well as the costs related to pension and other post-retirement employee benefit costs. The reconciliation filings compared the total revenues to revenue requirements related to these services. In December 2014, the DPU issued a final decision approving the rates as filed, subject to future review and reconciliation.
Energy Efficiency Plans: In accordance with Massachusetts law passed in 2008 known as the Green Communities Act, natural gas and electric distribution companies must file three-year energy efficiency plans, which were initially filed by NSTAR Electric and WMECO, and approved by the DPU, in 2010 covering the period 2010 through 2012. The NSTAR Electric and WMECO three-year plans covering the period 2013 through 2015 were approved by the DPU in 2013. Distribution companies that do not yet have rate decoupling mechanisms in place, like NSTAR Electric, include LBR rate adjustment mechanisms in order to offset reduced distribution rate revenues as a result of successful energy efficiency programs. NSTAR Electric's LBR rate adjustment mechanism is in place through December 31, 2015.
DPU Safety and Reliability Programs (CPSL): The CPSL program allows NSTAR Electric to recover $15 million per year related to DPU approved safety and reliability programs, which are designed to mitigate stray voltage and repair and replace portions of the system to increase and enhance customer safety. This annual level of recovery was established by the 2012 DPU-approved comprehensive merger settlement agreement with the Massachusetts Attorney General. The CPSL program will expire on December 31, 2015.
2014 Comprehensive Settlement Agreement: On December 31, 2014, NSTAR Electric, NSTAR Gas and the Massachusetts Attorney General filed a comprehensive settlement agreement with the DPU. The comprehensive settlement agreement included resolution of the outstanding NSTAR Electric CPSL program filings for the periods 2006 through 2011, the NSTAR Electric and NSTAR Gas PAM and energy efficiency-related customer billing adjustments reported in 2012, and the NSTAR Electric energy efficiency program filings regarding LBR for the periods 2008 through 2011. If approved by the DPU, NSTAR Electric and NSTAR Gas will be required to refund a total of $44.7 million to their respective customers, which was included in our regulatory liabilities as of December 31, 2014. Upon the DPU's approval, we will adjust our regulatory liabilities, which we expect will result in an after-tax benefit of approximately $14 million. We expect a response from the DPU in the first quarter of 2015.
Basic Service Bad Debt Adder: In accordance with a generic 2005 DPU order, electric utilities in Massachusetts recover the energy-related portion of bad debt costs in their Basic Service rates. In 2007, NSTAR Electric filed its 2006 Basic Service reconciliation with the DPU proposing an adjustment related to the increase of its Basic Service bad debt charge-offs. The DPU issued an order approving the implementation of a revised Basic Service rate but instructed NSTAR Electric to reduce distribution rates by an amount equal to the increase in its Basic Service bad debt charge-offs. This adjustment to NSTAR Electric's distribution rates would eliminate the fully reconciling nature of the Basic Service bad debt adder.
In 2010, NSTAR Electric filed an appeal of the DPU's order with the SJC. NSTAR Electric's position was that it had fully removed the collection of energy-related bad debt costs from its distribution rates effective January 1, 2006. Therefore, no further adjustment to distribution rates was warranted. In 2012, the SJC vacated the DPU order and remanded the matter to the DPU for further review.
As of December 31, 2014, NSTAR Electric has a total deferred regulatory asset of approximately $33 million of costs associated with energy-related bad debt.
On January 7, 2015, the DPU issued an order on remand stating that NSTAR Electric had, in fact, removed energy-related bad debt costs from distribution rates effective January 1, 2006. The DPU order approved NSTAR Electric's 2005 and 2006 reconciliation filings and ordered NSTAR Electric and the Massachusetts Attorney General to collaborate on the submission of a proposal for the reconciliation of energy-related bad debt costs for the open years of 2007 through 2014 by April 7, 2015. Management expects to present a proposal to the Attorney General in the first quarter of 2015 with a decision from the DPU later in 2015.

40
Long-Term Wind Contracts: On January 6, 2015, NSTAR Electric terminated a 15-year renewable energy contract with Cape Wind Associates, LLC due to Cape Wind Associates, LLC's failure to fulfill obligations under the contract. Under this contract, NSTAR Electric would have purchased 129 MW of renewable energy from an offshore wind energy facility, which was scheduled to achieve commercial operation by December 2016. As a result, and in accordance with the 2012 DPU-approved comprehensive merger settlement agreement with the DOER, NSTAR Electric will issue a request for proposal (RFP) for new Massachusetts RPS Class I qualified renewable contracts with a term of at least 15 years, for approximately 2 percent of its electric load requirement. The RFP shall be issued no later than March 31, 2016 in accordance with the provisions of the procurement obligations of the Green Communities Act.
NSTAR Gas Distribution Rates: On December 17, 2014, NSTAR Gas filed an application with the DPU requesting an increase in rates, effective January 1, 2016. NSTAR Gas requested an increase in base distribution rates of $33.9 million. We expect a final decision in the fourth quarter of 2015.
New Hampshire:
Distribution Rates: In 2014, PSNH filed for a distribution rate decrease in accordance with the Earnings Sharing Agreement addressed in the 2010 NHPUC approved distribution rate case settlement. On June 27, 2014, the NHPUC approved a one year decrease to distribution rates of $1.3 million,effective July 1, 2014.
ES and SCRC Rates: On December 15, 2014, PSNH updated its request with the NHPUC to adjust its ES and SCRC rates effective January 1, 2015. PSNH's update proposed to increase the current ES and SCRC billing rates to reflect projected costs for 2015. On December 29, 2014, the NHPUC approved the request. The approved energy supply portion of the 2015 rate is 10.56 cents per kWh and the SCRC rate for 2015 is 0.110 cents per kWh.
Clean Air Project Prudence Proceeding: The Clean Air Project, which involved the installation of wet scrubber technology at PSNH's Merrimack coal-fired generation station in Bow, New Hampshire, pursuant to state law, was placed in service in September 2011. In November 2011, the NHPUC opened a docket to review the Clean Air Project, including the establishment of temporary rates for near-term recovery of Clean Air Project costs, a prudence review of PSNH's overall construction program, and establishment of permanent rates for recovery of prudently incurred Clean Air Project costs. In April 2012, the NHPUC issued an order authorizing temporary rates to recover a significant portion of the Clean Air Project costs. The docket remains open to conduct a comprehensive prudence review of the Clean Air Project and the establishment of permanent rates. The temporary rates will remain in effect until permanent rates allowing full recovery of all prudently incurred costs are approved. At that time, the NHPUC will reconcile recoveries collected under the temporary rates with approved permanent rates.
The NHPUC concluded its prudence hearings in October 2014. On December 26, 2014, PSNH requested that the NHPUC stay this proceeding in order to allow discussions to take place with other significant parties to determine whether a collaborative resolution of all issues was achievable. The New Hampshire Governor and Senate Majority Leader expressed support for this effort. On January 15, 2015, the NHPUC issued an order granting the motion to stay in this proceeding, and settlement discussions have ensued.
While we cannot predict with certainty the outcome of the Clean Air Project prudence review, we believe all costs were incurred appropriately and continue to remain probable of recovery.
Generation: In 2013, the NHPUC opened a docket to investigate market conditions affecting PSNH's ES rate, how PSNH will maintain just and reasonable rates in light of those conditions, and any impact of PSNH's generation ownership on the New Hampshire competitive electric market. The NHPUC accepted from the NHPUC Staff a "Report on Investigation into Market Conditions, Default Service Rate, Generation Ownership and Impact on the Competitive Electricity Market." The report recommended that the NHPUC examine whether default service rates remain sustainable on a going forward basis, define "just and reasonable" with respect to default service in the context of competitive retail markets, analyze the current and expected value of PSNH's generating units, and identify means to mitigate and address stranded cost recovery.
In 2013, the NHPUC issued a Request for Proposal to hire a valuation expert to determine the market value of PSNH's generation assets and entitlements. The State of New Hampshire Legislative Oversight Committee on Electric Utility Restructuring (Oversight Committee) requested that the NHPUC conduct an analysis to determine whether it is now in the economic interest of PSNH's retail customers for PSNH to divest its interest in generation plants. The Oversight Committee asked for a preliminary report on the findings by April 1, 2014 that would include at a minimum the NHPUC Staff's position, the analysis of the valuation expert, and any recommendations for legislation that may be needed concerning divestiture or otherwise related to this issue.
On April 1, 2014, the NHPUC staff issued a "Preliminary Status Report Addressing the Economic Interest of PSNH's Retail Customers as it Relates to the Potential Divestiture of PSNH's Generating Plants," which included a consultant's analysis of the fair market value of PSNH generating assets and long-term power purchase contracts. The consultant's analysis estimated the fair market value of PSNH's generation assets to be $225 million as of December 31, 2013 and compared that amount to a stated net book value of $660 million, implying potential "stranded costs" of approximately $435 million. NHPUC staff made three recommendations: (1) that any further actions relating to PSNH's generating assets await a final decision in the Clean Air Project (scrubber) prudence proceeding; (2) that existing laws regarding divestiture, energy service, and cost recovery be harmonized; and (3) that ISO-NE provide input on the economic and reliability consequences of retirement of PSNH's coal- and oil-fired electric generating plants.
During the 2014 Legislative session, in response to the NHPUC staff report, the Legislature enacted changes to the laws governing divestiture of PSNH's generation assets, effective September 30, 2014. The new law required the NHPUC to initiate a proceeding before January 1, 2015, to determine whether all or some of PSNH's generation assets should be divested. The NHPUC opened its docket DE 14-238 on September 16, 2014. A progress report from the NHPUC must be provided to the Oversight Committee by March 31, 2015. The law gives the NHPUC express authority

41
to order the divestiture of all or some of PSNH's generation assets if the NHPUC finds it is in the economic interest of customers to do so. The law also clarified the definition of "stranded costs" to include costs approved for recovery by the NHPUC in connection with the divestiture or retirement of PSNH's generation assets.
In the event of generation asset divestiture or retirement, present law and the PSNH Restructuring Settlement Agreement approved in 2000 require that the NHPUC provide recovery of any stranded costs by PSNH. We continue to believe generation investments and prudently-incurred costs remain probable of recovery.
Legislative and Policy Matters
Federal:
On December 19, 2014, the "Tax Increase Prevention Act of 2014" became law, which extended the accelerated deduction of depreciation to businesses through 2014. This extended stimulus provides NU with cash flow benefits of approximately $200 million (approximately $70 million at CL&P) in 2015.
Massachusetts:
On July 7, 2014, Massachusetts enacted "An Act Relative to Natural Gas Leaks" (the Act). The Act establishes a uniform natural gas leak classification standard for all Massachusetts natural gas utilities and a program that accelerates the replacement of aging natural gas infrastructure. The program will enable companies, including NSTAR Gas, to better manage the scheduling and costs of replacement. The Act also calls for the DPU to authorize natural gas utilities to design and offer programs to customers that will increase the availability, affordability and feasibility of natural gas service for new customers. On October 31, 2014, NSTAR Gas filed the GSEP with the DPU. We expect a decision on the program in April 2015.
Critical Accounting Policies
The preparation of financial statements in conformity with GAAP requires management to make estimates, assumptions and, at times, difficult, subjective or complex judgments. Changes in these estimates, assumptions and judgments, in and of themselves, could materially impact our financial position, results of operations or cash flows. Our management communicates to and discusses with the Audit Committee of our Board of Trustees significant matters relating to critical accounting policies. Our critical accounting policies are discussed below. See the combined notes to our financial statements for further information concerning the accounting policies, estimates and assumptions used in the preparation of our financial statements.
Regulatory Accounting: The accounting policies of the Regulated companies follow the application of accounting guidance for entities with rate-regulated operations and reflect the effects of the rate-making process.
The application of accounting guidance for rate-regulated enterprises results in recording regulatory assets and liabilities. Regulatory assets represent the deferral of incurred costs that are probable of future recovery in customer rates. Regulatory assets are amortized as the incurred costs are recovered through customer rates. In some cases, we record regulatory assets before approval for recovery has been received from the applicable regulatory commission. We must use judgment to conclude that costs deferred as regulatory assets are probable of future recovery. We base our conclusion on certain factors, including, but not limited to, regulatory precedent. Regulatory liabilities represent revenues received from customers to fund expected costs that have not yet been incurred or probable future refunds to customers.
We use our best judgment when recording regulatory assets and liabilities; however, regulatory commissions can reach different conclusions about the recovery of costs, and those conclusions could have a material impact on our financial statements. We believe it is probable that the Regulated companies will recover the regulatory assets that have been recorded. If we determined that we could no longer apply the accounting guidance applicable to rate-regulated enterprises to our operations, or that we could not conclude that it is probable that costs would be recovered fromcustomers in future rates, the costs would be charged to earnings in the period in which the determination is made.
Unbilled Revenues: The determination of retail energy sales to residential, commercial and industrial customers is based on the reading of meters, which occurs regularly throughout the month. Billed revenues are based on these meter readings, and the majority of recorded annual revenues is based on actual billings. Because customers are billed throughout the month based on pre-determined cycles rather than on a calendar month basis, an estimate of electricity or natural gas delivered to customers for which the customers have not yet been billed is calculated as of the balance sheet date.
Unbilled revenues represent an estimate of electricity or natural gas delivered to customers but not yet billed. Unbilled revenues are included in Operating Revenues on the statement of income and are assets on the balance sheet that are reclassified to Accounts Receivable in the following month as customers are billed. Such estimates are subject to adjustment when actual meter readings become available, when there is a change in estimates and under other circumstances.
The Regulated companies estimate unbilled sales monthly using the daily load cycle method. The daily load cycle method allocates billed sales to the current calendar month based on the daily load for each billing cycle. The billed sales are subtracted from total month load, net of delivery losses, to estimate unbilled sales. Unbilled revenues are estimated by first allocating unbilled sales to the respective customer classes, then applying an estimated rate by customer class to those sales. The estimate of unbilled revenues is sensitive to numerous factors, such as energy demands, weather and changes in the composition of customer classes that can significantly impact the amount of revenues recorded.

42
Pension and PBOP: We sponsor Pension and PBOP Plans to provide retirement benefits to our employees. Effective January 1, 2015, the two Pension Plans were merged into one Pension Plan, sponsored by NUSCO, and the PBOP Plans were merged into one PBOP Plan, sponsored by NUSCO. For each of these plans, several significant assumptions are used to determine the projected benefit obligation, funded status and net periodic benefit cost. These assumptions include the expected long-term rate of return on plan assets, discount rate, compensation/progression rate, mortality assumptions, and health care cost trend rates. We evaluate these assumptions at least annually and adjust them as necessary. Changes in these assumptions could have a material impact on our financial position, results of operations or cash flows.
Pre-tax net periodic benefit expense (excluding SERP) for the Pension Plans was $118.4 million, $236.3 million and $234.9 million for the years ended December 31, 2014, 2013 and 2012, respectively. The pre-tax net periodic benefit expense for the PBOP Plans was $8.1 million, $32.6 million and $72.3 million for the years ended December 31, 2014, 2013 and 2012, respectively. NSTAR Pension and PBOP expense was included in NU beginning April 10, 2012.
Expected Long-Term Rate of Return on Plan Assets: In developing this assumption, we consider historical and expected returns and input from our consultants. Our expected long-term rate of return on assets is based on assumptions regarding target asset allocations and corresponding expected rates of return for each asset class. We routinely review the actual asset allocations and periodically rebalance the investments to the targeted asset allocations when appropriate. For the year ended December 31, 2014, our aggregate expected long-term rate of return assumption of 8.25 percent was used to determine our Pension and PBOP expense. For the forecasted 2015 Pension and PBOP expense, our expected long-term rate of return of 8.25 percent for all plans was used reflecting our target asset allocations.
Discount Rate: Payment obligations related to the Pension and PBOP Plans are discounted at interest rates applicable to the expected timing of each plan's cash flows. The discount rate that is utilized in determining the Pension and PBOP obligations is based on a yield-curve approach. This approach is based on a population of bonds with an average rating of AA based on bond ratings by Moody's, S&P and Fitch, and uses bonds with above median yields within that population. As of December 31, 2014, the discount rates used to determine the funded status were 4.2 percent for the Pension Plans and 4.22 percent for the PBOP Plans. As of December 31, 2013, the discount rates used were 5.03 percent for the NUSCO Pension Plan, 4.85 percent for the NSTAR Pension Plan, 4.78 percent for the NUSCO PBOP Plans and 5.10 percent for the NSTAR PBOP Plan. As of December 31, 2014, the decreases in the discount rates resulted in an increase on NU’s funded status liability of approximately $530 million and $110 million for the Pension and PBOP Plans, respectively.
Compensation/Progression Rate: This assumption reflects the expected long-term salary growth rate, including consideration of the levels of increases built into collective bargaining agreements, and impacts the estimated benefits that Pension Plan participants receive in the future. As of December 31, 2014, the compensation/progression rate used to determine the funded status was 3.5 percent.
Mortality Assumptions: Assumptions as to mortality of the participants in our Pension and PBOP Plans are a key estimate in measuring the expected payments a participant may receive over their lifetime and the plan liability we need to record. During 2014, the Society of Actuaries released a series of updated mortality tables resulting from recent studies that measured mortality rates for various groups of individuals. The updated mortality tables released in 2014 reflect increased life expectancy of plan participants by 3 to 5 years and have the effect of increasing the estimate of benefits to be provided to plan participants. As of December 31, 2014, the impact of this adoption on NU’s funded status was an increase in the liability of approximately $340 million and $82 million for the Pension and PBOP Plans, respectively.
Actuarial Determination of Expense: Pension and PBOP expense is determined by our actuaries and consists of service cost and prior service cost, interest cost based on the discounting of the obligations, amortization of actuarial gains and losses and amortization of the net transition obligation (which was fully amortized in 2013), offset by the expected return on plan assets. Actuarial gains and losses represent differences between assumptions and actual information or updated assumptions.
Effective January 1, 2015, as a result of the merger of the NUSCO Pension and PBOP plans into the respective NSTAR plans, the NSTAR accounting policies became effective for the NUSCO plans. For the NSTAR Pension and PBOP plans, we apply a corridor approach to determine the potential actuarial gain or loss to be amortized in the Pension and PBOP net periodic benefit expense. This amortization approach is applied if the unrecognized actuarial gains or losses exceed 10 percent of the greater of the fair value of plan assets or the projected benefit obligation. This excess is amortized over the average remaining service period of active plan participants. In addition, for the NSTAR plans, the expected return on plan assets is determined by applying the assumed long-term rate of return to the Pension and PBOP Plan asset balances. This calculated expected return is compared to the actual return or loss on plan assets at the end of each year to determine the investment gains or losses to be immediately reflected in actuarial gains and losses. For the years ended December 31, 2014, 2013 and 2012, the NUSCO Pension and PBOP plans did not utilize the corridor approach, and the expected return on plan assets was determined by applying our assumed long-term rate of return to a four-year rolling average of plan asset fair values. This calculation recognized investment gains or losses over a four-year period from the years in which they occurred.
Forecasted Expenses and Expected Contributions: We estimate that the expense for the Pension and PBOP Plans will be approximately $130 million and $4 million, respectively, in 2015. Pension and PBOP expense for subsequent years will depend on future investment performance, changes in future discount rates and other assumptions, and various other factors related to the populations participating in the plans. Pension and PBOP expense charged to earnings is net of the amounts capitalized.
Our policy is to annually fund the Pension Plans in an amount at least equal to the amount that will satisfy federal requirements. We contributed $171.6 million to the Pension Plans in 2014, of which $101 million was contributed by NSTAR Electric. We currently estimate approximately $155 million of contributions to the Pension Plan in 2015.
For the PBOP Plans, it is our policy to annually fund the PBOP Plans up to the maximum tax-deductible level permitted. We contributed $40 million to the PBOP Plans in 2014. We currently estimate approximately $27 million in contributions to the PBOP Plan in 2015.

43
Sensitivity Analysis: The following represents the hypothetical increase to the Pension Plans' (excluding SERP) and PBOP Plans' reported annual cost as a result of a change in the following assumptions by 50 basis points:
Increase in Pension Plan Cost Increase in PBOP Plan Cost(Millions of Dollars) As of December 31,Assumption Change 2014 2013 2014 2013NU
Lower expected long-term rate of return $ 19.3 $ 17.2 $ 4.0 $ 3.4Lower discount rate $ 19.1 $ 22.3 $ 2.2 $ 6.8Higher compensation rate $ 10.2 $ 12.4 N/A N/A
Health Care Cost: As of December 31, 2014, the health care cost trend rate assumption used to determine the PBOP Plans' year end funded status was 6.5 percent, subsequently decreasing to an ultimate rate of 4.5 percent in 2023. The effect of a hypothetical increase in the health care cost trend rate by one percentage point would be an increase to the service and interest cost components of PBOP Plan expense by $5.3 million in 2014, and a $111.2 million increase to the PBOP obligation.
Goodwill: We have recorded approximately $3.5 billion of goodwill associated with previous mergers and acquisitions. We have identified our reporting units for purposes of allocating and testing goodwill as Electric Distribution, Electric Transmission and Natural Gas Distribution. These reporting units are consistent with our operating segments underlying our reportable segments. Electric Distribution and Electric Transmission reporting units include carrying values for the respective components of CL&P, NSTAR Electric, PSNH and WMECO. The Natural Gas Distribution reporting unit includes the carrying values of NSTAR Gas and Yankee Gas. As of December 31, 2014, goodwill was allocated to the reporting units as follows: $2.5 billion to Electric Distribution, $0.6 billion to Electric Transmission, and $0.4 billion to Natural Gas Distribution.
We are required to test goodwill balances for impairment at least annually by considering the fair values of the reporting units, which requires us to use estimates and judgments. We have selected October 1st of each year as the annual goodwill impairment testing date. Goodwill impairment is deemed to exist if the carrying value of a reporting unit exceeds its estimated fair value and if the implied fair value of goodwill based on the estimated fair values of the reporting units' assets and liabilities is less than the carrying amount of the goodwill. If goodwill were deemed to be impaired, it would be written down in the current period to the extent of the impairment.
We performed an impairment test of goodwill as of October 1, 2014 for the Electric Distribution, Electric Transmission and Natural Gas Distribution reporting units. This evaluation required the test of several factors that impact the fair value of the reporting units, including conditions and assumptions that affect the future cash flows of the reporting units. The 2014 goodwill impairment test resulted in a conclusion that goodwill is not impaired and none of the reporting units is at risk of a goodwill impairment.
Income Taxes: Income tax expense is estimated annually for each of the jurisdictions in which we operate. This process involves estimating current and deferred income tax expense or benefit and the impact of temporary differences resulting from differing treatment of items for financial reporting and income tax return reporting purposes. Such differences are the result of timing of the deduction for expenses, as well as any impact of permanent differences, non-tax deductible expenses, or other items, including items that directly impact our tax return as a result of a regulatory activity (flow-through items). The temporary differences and flow-through items result in deferred tax assets and liabilities that are included in the balance sheets. The income tax estimation process impacts all of our segments. We record income tax expense quarterly using an estimated annualized effective tax rate.
We also account for uncertainty in income taxes, which applies to all income tax positions previously filed in a tax return and income tax positions expected to be taken in a future tax return that have been reflected on our balance sheets. The determination of whether a tax position meets the recognition threshold under applicable accounting guidance is based on facts and circumstances available to us. Once a tax position meets the recognition threshold, the tax benefit is measured using a cumulative probability assessment. Assigning probabilities in measuring a recognized tax position and evaluating new information or events in subsequent periods requires significant judgment and could change previous conclusions used to measure the tax position estimate. New information or events may include tax examinations or appeals (including information gained from those examinations), developments in case law, settlements of tax positions, changes in tax law and regulations, rulings by taxing authorities and statute of limitation expirations. Such information or events may have a significant impact on our financial position, results of operations and cash flows.
Accounting for Environmental Reserves: Environmental reserves are accrued when assessments indicate it is probable that a liability has been incurred and an amount can be reasonably estimated. Adjustments made to estimates of environmental liabilities could have a significant impact on earnings. We estimate these liabilities based on findings through various phases of the assessment, considering the most likely action plan from a variety of available remediation options (ranging from no action required to full site remediation and long-term monitoring), current site information from our site assessments, remediation estimates from third party engineering and remediation contractors, and our prior experience in remediating contaminated sites. If a most likely action plan cannot yet be determined, we estimate the liability based on the low end of a range of possible action plans. Our estimates incorporate currently enacted state and federal environmental laws and regulations and data released by the EPA and other organizations. The estimates associated with each possible action plan are judgmental in nature partly because there are usually several different remediation options from which to choose. Our estimates are subject to revision in future periods based on actual costs or new information from other sources, including the level of contamination at the site, the extent of our responsibility or the extent of remediation required, recently enacted laws and regulations or a change in cost estimates due to certain economic factors.
Fair Value Measurements: We follow fair value measurement guidance that defines fair value as the price that would be received for the sale of an asset or paid to transfer a liability in an orderly transaction between market participants at the measurement date (an exit price). We have applied this guidance to our Company's derivative contracts that are not elected or designated as "normal purchases or normal sales" (normal), to marketable securities held in trusts, our valuations of investments in our Pension and PBOP Plans, and nonrecurring fair value measurements of nonfinancial assets such as goodwill and AROs.
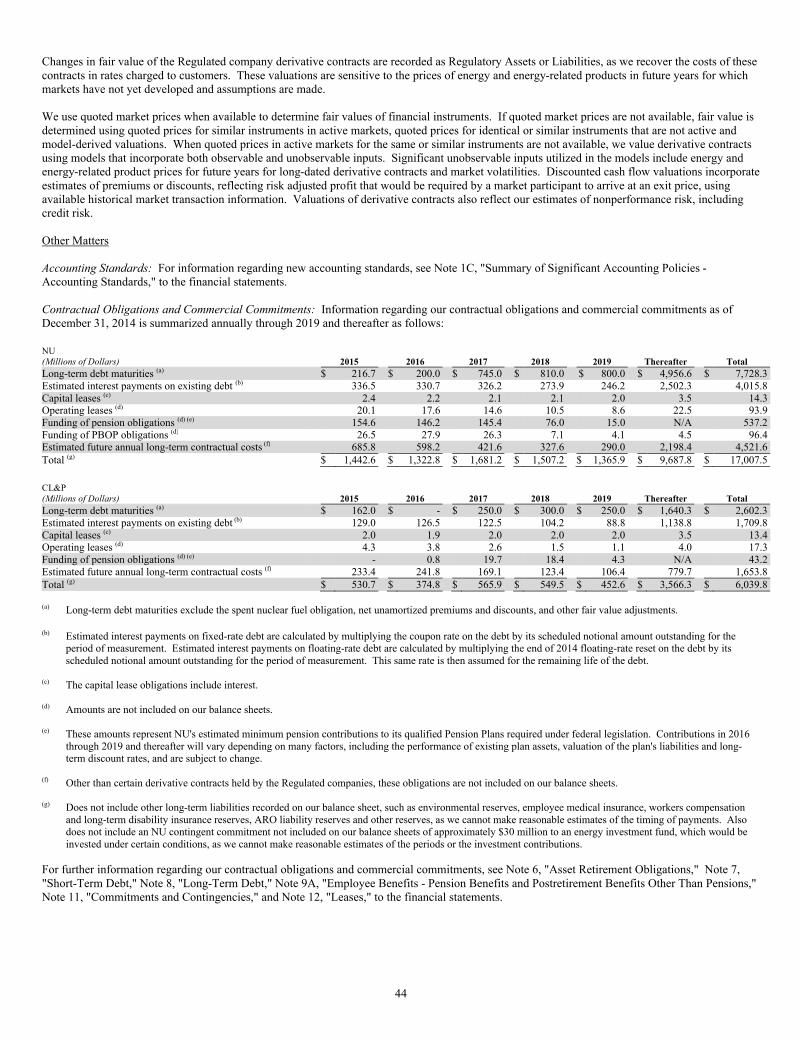
44
Changes in fair value of the Regulated company derivative contracts are recorded as Regulatory Assets or Liabilities, as we recover the costs of these contracts in rates charged to customers. These valuations are sensitive to the prices of energy and energy-related products in future years for which markets have not yet developed and assumptions are made.
We use quoted market prices when available to determine fair values of financial instruments. If quoted market prices are not available, fair value is determined using quoted prices for similar instruments in active markets, quoted prices for identical or similar instruments that are not active and model-derived valuations. When quoted prices in active markets for the same or similar instruments are not available, we value derivative contracts using models that incorporate both observable and unobservable inputs. Significant unobservable inputs utilized in the models include energy and energy-related product prices for future years for long-dated derivative contracts and market volatilities. Discounted cash flow valuations incorporate estimates of premiums or discounts, reflecting risk adjusted profit that would be required by a market participant to arrive at an exit price, using available historical market transaction information. Valuations of derivative contracts also reflect our estimates of nonperformance risk, including credit risk.
Other Matters
Accounting Standards: For information regarding new accounting standards, see Note 1C, "Summary of Significant Accounting Policies -Accounting Standards," to the financial statements.
Contractual Obligations and Commercial Commitments: Information regarding our contractual obligations and commercial commitments as of December 31, 2014 is summarized annually through 2019 and thereafter as follows:
NU(Millions of Dollars) 2015 2016 2017 2018 2019 Thereafter Total
Long-term debt maturities (a) $ 216.7 $ 200.0 $ 745.0 $ 810.0 $ 800.0 $ 4,956.6 $ 7,728.3Estimated interest payments on existing debt (b) 336.5 330.7 326.2 273.9 246.2 2,502.3 4,015.8Capital leases (c) 2.4 2.2 2.1 2.1 2.0 3.5 14.3Operating leases (d) 20.1 17.6 14.6 10.5 8.6 22.5 93.9Funding of pension obligations (d) (e) 154.6 146.2 145.4 76.0 15.0 N/A 537.2Funding of PBOP obligations (d) 26.5 27.9 26.3 7.1 4.1 4.5 96.4Estimated future annual long-term contractual costs (f) 685.8 598.2 421.6 327.6 290.0 2,198.4 4,521.6Total (g) $ 1,442.6 $ 1,322.8 $ 1,681.2 $ 1,507.2 $ 1,365.9 $ 9,687.8 $ 17,007.5
CL&P(Millions of Dollars) 2015 2016 2017 2018 2019 Thereafter Total
Long-term debt maturities (a) $ 162.0 $ - $ 250.0 $ 300.0 $ 250.0 $ 1,640.3 $ 2,602.3Estimated interest payments on existing debt (b) 129.0 126.5 122.5 104.2 88.8 1,138.8 1,709.8Capital leases (c) 2.0 1.9 2.0 2.0 2.0 3.5 13.4Operating leases (d) 4.3 3.8 2.6 1.5 1.1 4.0 17.3Funding of pension obligations (d) (e) - 0.8 19.7 18.4 4.3 N/A 43.2Estimated future annual long-term contractual costs (f) 233.4 241.8 169.1 123.4 106.4 779.7 1,653.8Total (g) $ 530.7 $ 374.8 $ 565.9 $ 549.5 $ 452.6 $ 3,566.3 $ 6,039.8
(a) Long-term debt maturities exclude the spent nuclear fuel obligation, net unamortized premiums and discounts, and other fair value adjustments.
(b) Estimated interest payments on fixed-rate debt are calculated by multiplying the coupon rate on the debt by its scheduled notional amount outstanding for the period of measurement. Estimated interest payments on floating-rate debt are calculated by multiplying the end of 2014 floating-rate reset on the debt by its scheduled notional amount outstanding for the period of measurement. This same rate is then assumed for the remaining life of the debt.
(c) The capital lease obligations include interest.
(d) Amounts are not included on our balance sheets.
(e) These amounts represent NU's estimated minimum pension contributions to its qualified Pension Plans required under federal legislation. Contributions in 2016 through 2019 and thereafter will vary depending on many factors, including the performance of existing plan assets, valuation of the plan's liabilities and long-term discount rates, and are subject to change.
(f) Other than certain derivative contracts held by the Regulated companies, these obligations are not included on our balance sheets.
(g) Does not include other long-term liabilities recorded on our balance sheet, such as environmental reserves, employee medical insurance, workers compensation and long-term disability insurance reserves, ARO liability reserves and other reserves, as we cannot make reasonable estimates of the timing of payments. Also does not include an NU contingent commitment not included on our balance sheets of approximately $30 million to an energy investment fund, which would be invested under certain conditions, as we cannot make reasonable estimates of the periods or the investment contributions.
For further information regarding our contractual obligations and commercial commitments, see Note 6, "Asset Retirement Obligations," Note 7, "Short-Term Debt," Note 8, "Long-Term Debt," Note 9A, "Employee Benefits - Pension Benefits and Postretirement Benefits Other Than Pensions," Note 11, "Commitments and Contingencies," and Note 12, "Leases," to the financial statements.

45
RESULTS OF OPERATIONS – NORTHEAST UTILITIES AND SUBSIDIARIES
The following provides the amounts and variances in operating revenues and expense line items in the statements of income for NU for the years ended December 31, 2014, 2013, and 2012 included in this Annual Report on Form 10-K. The year ended December 31, 2012 amounts include the operations of NSTAR beginning April 10, 2012.
Comparison of 2014 to 2013:
For the Years Ended December 31,
Increase/(Millions of Dollars) 2014 2013 (Decrease) Percent
Operating Revenues $ 7,741.9 $ 7,301.2 $ 440.7 6.0 %Operating Expenses:
Purchased Power, Fuel and Transmission 3,021.6 2,483.0 538.6 21.7Operations and Maintenance 1,427.6 1,515.0 (87.4) (5.8)Depreciation 614.7 610.8 3.9 0.6Amortization of Regulatory Assets, Net 10.7 206.3 (195.6) (94.8)Amortization of Rate Reduction Bonds - 42.6 (42.6) (100.0)Energy Efficiency Programs 473.1 401.9 71.2 17.7Taxes Other Than Income Taxes 561.4 512.2 49.2 9.6
Total Operating Expenses 6,109.1 5,771.8 337.3 5.8Operating Income 1,632.8 1,529.4 103.4 6.8Interest Expense 362.1 338.7 23.4 6.9Other Income, Net 24.6 29.9 (5.3) (17.7)Income Before Income Tax Expense 1,295.3 1,220.6 74.7 6.1Income Tax Expense 468.3 426.9 41.4 9.7Net Income 827.0 793.7 33.3 4.2Net Income Attributable to Noncontrolling Interests 7.5 7.7 (0.2) (2.6)Net Income Attributable to Controlling Interest $ 819.5 $ 786.0 $ 33.5 4.3 %
Operating RevenuesFor the Years Ended December 31,
Increase /
(Millions of Dollars) 2014 2013 (Decrease) Percent
Electric Distribution $ 5,663.4 $ 5,362.3 $ 301.1 5.6 %Natural Gas Distribution 1,007.3 855.8 151.5 17.7Transmission 1,018.2 978.7 39.5 4.0Other and Eliminations 53.0 104.4 (51.4) (49.2)Total Operating Revenues $ 7,741.9 $ 7,301.2 $ 440.7 6.0 %
A summary of our retail electric sales volumes and firm natural gas sales volumes were as follows:
For the Years Ended December 31,
Increase/2014 2013 (Decrease) Percent
Retail Electric Sales Volumes in GWh 54,442 55,331 (889) (1.6)%Firm Natural Gas Sales Volumes in Million Cubic Feet 104,191 98,258 5,933 6.0
Operating Revenues increased $440.7 million in 2014 compared to 2013.
The most significant factor in the increase in revenues relates to cost tracking mechanisms for the recovery of higher costs associated with the procurement of energy supply, which increased $506.8 million and $126.9 million for electric distribution and natural gas distribution, respectively. These costs were impacted by the overall New England wholesale energy supply market in which higher natural gas delivery costs had an adverse impact on the cost of electric energy purchased for our retail electric customers and the cost of natural gas purchased on behalf of our retail natural gas customers. Energy supply costs are recovered from customers in rates through cost tracking mechanisms and therefore have no impact on earnings. These costs and related recovery impacts were partially offset by decreases in transition cost recovery revenues, which are recovered through cost tracking mechanisms, reflecting the full collection in 2013 of previously deferred costs, as well as the full amortization of RRBs.
Firm base natural gas distribution revenues increased $26.3 million in 2014, as compared to 2013, which reflected a 6 percent increase in firm natural gas sales volumes. The increase in sales volumes was driven primarily by the colder winter weather experienced throughout our service territories in the first quarter of 2014. The weather conditions experienced were significantly colder than both normal and the same period last year throughout New England and our service territories in Connecticut and Massachusetts. Weather-normalized total firm natural gas sales volumes (based on 30-year average temperatures) increased 2.9 percent in 2014, as compared to 2013, due primarily to residential and commercial customer growth.
Base electric distribution revenues decreased $12.1 million in 2014 compared to 2013. This reflected the impact of a 1.6 percent decrease in retail electric sales volumes. The decrease in sales volumes was driven primarily by the cooler summer weather in 2014 compared to 2013, as well as the impact of our utility-sponsored energy efficiency programs. Weather-normalized retail electric sales volumes decreased 1 percent in 2014, as compared to 2013, reflecting the impact of our utility-sponsored energy efficiency programs. The negative sales volume impact was partially offset by the impact of CL&P's base distribution rate increase effective December 1, 2014.

46
CL&P and NSTAR Electric recognized lost base revenue (LBR) related to reductions in sales volume as a result of energy efficiency. LBR is recovered from retail distribution customers. Including the impact from the recognition of LBR, base distribution revenues increased in 2014, as compared to 2013. We recognized $45.2 million of LBR in 2014, compared to $20.3 million in 2013. Effective December 1, 2014, CL&P no longer recognizes LBR due to its revenue decoupling mechanism, which, similar to WMECO's revenue decoupling mechanism, provides a base amount of distribution revenues ($1.041 billion on an annual basis) that effectively breaks the relationship between revenues and customer electricity usage. The revenue decoupling mechanism is designed to allow each of CL&P and WMECO to encourage energy efficiency for its customers without negatively impacting its revenues.
Transmission revenues increased $39.5 million in 2014, as compared to 2013, due primarily to the recovery of higher revenue requirementsassociated with ongoing investments in our transmission infrastructure. This increase was partially offset by the impact of the $37 million net reserve recorded in 2014 as a result of the 2014 FERC ROE orders, compared to the $23.7 million reserve recorded in 2013 for the FERC ALJ initial decision in the FERC base ROE complaints.
Purchased Power, Fuel and Transmission expense includes costs associated with purchasing electricity and natural gas on behalf of our customers. These energy supply costs are recovered from customers in rates through reconciling cost tracking mechanisms, which have no impact on earnings (tracked costs). Purchased Power, Fuel and Transmission increased in 2014, as compared to 2013, due primarily to the following:
(Millions of Dollars) Increase/(Decrease)
Electric Distribution $ 458.2Natural Gas Distribution 104.1Transmission (2.8)Other and Eliminations (20.9)Total Purchased Power, Fuel and Transmission $ 538.6
The increase in purchased power, fuel and transmission at the electric and natural gas distribution businesses were driven by the higher costs associated with the procurement of energy supply. As a result of increases in the New England wholesale energy supply market for both electricity and natural gas, the costs incurred to purchase energy on behalf of our customers were significantly higher in 2014 compared to 2013. Our energy supply costs were impacted by higher natural gas delivery costs, which had an adverse impact on the cost of electric energy purchased for our retail electric customers and the cost of natural gas purchased on behalf of our retail natural gas customers.
Operations and Maintenance expense includes tracked costs and costs that are recovered through base electric and natural gas distribution rates,which therefore impact earnings (non-tracked costs). Operations and Maintenance decreased in 2014, as compared to 2013, due primarily to the following:
(Millions of Dollars) Increase/(Decrease)
Base Electric Distribution:
Labor and other employee-related costs, including pension costs $ (77.3)
Implementation of a new outage restoration program at CL&P 9.2
Storm restoration costs (11.4)
All other operations and maintenance (29.4)
Total Base Electric Distribution (108.9)
Total Base Natural Gas Distribution (0.9)
Total Tracked costs (Transmission and Electric and Natural Gas Distribution) 16.6
Total Distribution and Transmission (93.2)
Other and eliminations:
Integration and severance costs 13.3
All other (including eliminations) (7.5)
Total Operations and Maintenance $ (87.4)
Depreciation increased in 2014, as compared to 2013, due primarily to an increase related to higher utility plant balances resulting from completed construction projects placed into service ($34.5 million), partially offset by a decrease in the CYAPC and YAEC decommissioning costs, which do not impact earnings ($30.6 million).
Amortization of Regulatory Assets, Net, which are tracked costs, include certain regulatory-approved tracking mechanisms. Fluctuations in these costs are recovered from customers in rates and have no impact on earnings. Amortization of Regulatory Assets, Net, decreased in 2014, as compared to 2013, due primarily to the following:
(Millions of Dollars) Increase/(Decrease)
NSTAR Electric (primarily recovery of transition costs) $ (236.4)PSNH (primarily default energy service charge) (9.2)CL&P (primarily energy supply and energy-related costs) 54.4WMECO (primarily recovery of transition costs) (3.0)Other (1.4)Total Amortization of Regulatory Assets, Net $ (195.6)
Amortization of Rate Reduction Bonds decreased in 2014, as compared to 2013, due to the maturity in 2013 of RRBs of NSTAR Electric, PSNH and WMECO.

47
Energy Efficiency Programs, which are tracked costs, increased in 2014, as compared to 2013, due primarily to the expanded energy conservation programs at CL&P in 2014 as a result of 2013 legislative action, and an increase in energy efficiency costs in accordance with the three-year program guidelines established by the DPU at NSTAR Electric and WMECO, partially offset by a decrease in the amortization of previously deferred costs at NSTAR Electric.
Taxes Other Than Income Taxes increased in 2014, as compared to 2013, due primarily to an increase in property taxes as a result of both an increase in utility plant balances and property tax rates.
Interest Expense increased in 2014, as compared to 2013, due primarily to lower interest income related to a decrease in the recovery of previously deferred transition costs ($9.9 million), an increase in interest on long-term debt ($4 million) as a result of new debt issuances in 2014 and the absence in 2014 of the favorable impact from the resolution of a Connecticut state income tax audit in 2013.
Other Income, Net decreased in 2014, as compared to 2013, due primarily to lower unrealized gains on the assets supporting the deferred compensation plans ($13 million), and the absence in 2014 of an insurance policy claim received in 2013 ($1.5 million), partially offset by higher AFUDC related to equity funds ($6.6 million), and a net gain on the sale of land ($4.5 million).
Income Tax Expense increased in 2014, as compared to 2013, due primarily to higher pre-tax earnings ($26.1 million), and higher state taxes and various other impacts ($15.3 million). The higher state taxes include a net reduction in the valuation allowance for state tax positions, which is based on the most recent available data.
Comparison of 2013 to 2012:
Operating Revenues and ExpensesFor the Years Ended December 31,
(Millions of Dollars) 2013 2012 (a)Increase/
Percent(Decrease)
Operating Revenues $ 7,301.2 $ 6,273.8 $ 1,027.4 16.4 %Operating Expenses:
Purchased Power, Fuel and Transmission 2,483.0 2,084.4 398.6 19.1Operations and Maintenance 1,515.0 1,583.1 (68.1) (4.3)Depreciation 610.8 519.0 91.8 17.7Amortization of Regulatory Assets, Net 206.3 79.8 126.5 (b)Amortization of Rate Reduction Bonds 42.6 142.0 (99.4) (70.0)Energy Efficiency Programs 401.9 313.1 88.8 28.4Taxes Other Than Income Taxes 512.2 434.2 78.0 18.0
Total Operating Expenses 5,771.8 5,155.6 616.2 12.0Operating Income $ 1,529.4 $ 1,118.2 $ 411.2 36.8 %
(a) The 2012 results include the operations of NSTAR beginning April 10, 2012.
(b) Percent greater than 100 percent not shown as it is not meaningful.
Operating RevenuesFor the Years Ended December 31,
(Millions of Dollars) 2013 2012 (a)
Increase/
(Decrease) Percent
Electric Distribution $ 5,362.3 $ 4,716.5 $ 645.8 13.7 %
Natural Gas Distribution 855.8 572.9 282.9 49.4
Total Distribution 6,218.1 5,289.4 928.7 17.6
Transmission 978.7 861.5 117.2 13.6
Total Regulated Companies 7,196.8 6,150.9 1,045.9 17.0
Other and Eliminations 104.4 122.9 (18.5) (15.1)
Total Operating Revenues $ 7,301.2 $ 6,273.8 $ 1,027.4 16.4 %
(a) The 2012 results include the operations of NSTAR beginning April 10, 2012.
A summary of our retail electric sales and firm natural gas sales were as follows:
For the Years Ended December 31,
2013 2012 (a) Increase Percent
Retail Electric Sales in GWh 55,331 54,808 523 1.0 %
Firm Natural Gas Sales in Million Cubic Feet 98,258 87,527 10,731 12.3
(a) Results include retail electric sales of NSTAR Electric and the firm natural gas sales of NSTAR Gas from January 1, 2012 through December 31, 2012 for comparative purposes only.

48
Our Operating Revenues increased in 2013, as compared to 2012, due primarily to the addition of NSTAR's operations. During the first quarter of 2013, the former operating subsidiaries of NSTAR contributed approximately $800 million of operating revenues. Absent the first quarter 2013 NSTAR operating revenues, our Operating Revenues increased approximately $227 million, as compared to 2012, due primarily to:
A $62.5 million increase in transmission revenues, net of applicable eliminations, as a result of the recovery of higher transmission expenses and continuing investments in our transmission infrastructure. The increase was partially offset by the establishment of a reserve related to the FERC ALJ initial decision in the third quarter of 2013.
A $34.3 million increase in base electric distribution revenues, net of applicable eliminations, reflecting an increase of approximately 1 percent in retail electric sales. The increase in sales volumes was driven primarily by the colder winter weather experienced throughout our service territories in early and late 2013. In addition, the increase in revenues resulted from the NHPUC-approved distribution rate increases at PSNH effective July 1, 2012 and July 1, 2013 as a result of the 2010 distribution rate case settlement. These positive impacts on revenue were partially offset by the impact of our utility-sponsored energy efficiency programs.
A $28.8 million increase in firm natural gas distribution revenues. This increase was driven by the colder winter weather in early and late 2013, residential customer growth, an increase in natural gas conversions, the migration of interruptible customers switching to firm service rates and the addition of gas-fired distributed generation.
The remaining increase was due primarily to higher revenues from increases related to our fully reconciling cost recovery mechanisms(tracked costs) related to the recovery of energy supply, retail transmission and utility-sponsored energy efficiency programs. Revenues related to cost recovery mechanisms vary from period to period based on the timing of collections of the costs incurred. These revenues do not result in an impact on earnings.
Purchased Power, Fuel and Transmission increased in 2013, as compared to 2012, due primarily to the following:
(Millions of Dollars) Increase/(Decrease)
The addition of NSTAR's operations $ 321.4Transmission segment costs 70.8Firm natural gas sales related costs 42.0Partially offset by:Electric distribution segment fuel and energy supply costs (13.9)CfDs and capacity contracts (12.0)All other items (9.7)
$ 398.6
Operations and Maintenance decreased in 2013, as compared to 2012, due primarily to the following:
(Millions of Dollars) Increase/(Decrease)
The addition of NSTAR's operations $ 123.6Partially offset by: Integration, merger and settlement agreement costs (150.3) NU's unregulated contracting business costs (17.4) General and administrative costs (12.9) Transmission segment costs (5.2) Natural gas segment costs 10.5 Electric distribution segment costs 1.3 All other items (17.7)
$ (68.1)
Depreciation increased in 2013, as compared to 2012, due primarily to the addition of NSTAR ($54.2 million) and the consolidation of CYAPC and YAEC ($13.7 million). Excluding the impact of NSTAR and the consolidation of CYAPC and YAEC, depreciation increased due primarily to higher utility plant balances resulting from completed construction projects placed into service.
Amortization of Regulatory Assets, Net increased in 2013, as compared to 2012, due primarily to the following:
(Millions of Dollars) Increase/(Decrease)
The addition of NSTAR's operations $ 45.8Recovery of transition costs at NSTAR Electric 91.9Amortization related to CL&P's SBC and CTA (6.8)Other (4.4)
$ 126.5
Amortization of Rate Reduction Bonds decreased in 2013, as compared to 2012, due primarily to the maturity of NSTAR Electric's, PSNH's, and WMECO's RRBs in 2013, partially offset by the addition of NSTAR Electric's amortization ($15.1 million).
Energy Efficiency Programs increased in 2013, as compared to 2012, due primarily to the addition of NSTAR's operations ($68.6 million), as well as an increase in energy efficiency costs in accordance with the three-year program guidelines established by the DPU at NSTAR Electric and WMECO. All costs are fully recovered through DPU-approved tracking mechanisms and therefore do not impact earnings.

49
Taxes Other Than Income Taxes increased in 2013, as compared to 2012, due primarily to the addition of NSTAR's operations ($37.8 million). In addition, there was an increase in property taxes ($36.6 million) as a result of an increase in Property, Plant and Equipment and an increase in the property tax rates, and an increase in the Connecticut gross earnings tax ($9.1 million) attributable to an increase in gross earnings.
Interest Expense increased $8.8 million in 2013, as compared to 2012, due primarily to the addition of NSTAR's operations ($22 million) and lower interest income on deferred transition costs ($10.6 million), partially offset by a decrease in Other Interest due primarily to the favorable impact from the resolution of a state income tax audit in the first quarter of 2013, lower interest on short-term debt ($8.8 million) and lower interest on RRBs ($6.1 million).
Other Income, Net increased $10.2 million in 2013, as compared to 2012, due primarily to higher gains on the NU supplemental benefit trust ($6 million) and an increase related to officer insurance policies ($1.7 million).
Income Tax ExpenseFor the Years Ended December 31,
(Millions of Dollars) 2013 2012 (a) Increase Percent
Income Tax Expense $ 426.9 $ 274.9 $ 152.0 55.3 %
(a) The 2012 results include the operations of NSTAR beginning April 10, 2012.
Income Tax Expense increased in 2013, as compared to 2012, due primarily to higher pre-tax earnings ($81 million), the absence in 2013 of both prior year Connecticut and Massachusetts merger settlement agreement impacts ($41 million) and integration merger impacts ($23 million), along with various other items ($7 million).
Results of Operations for each of CL&P, NSTAR Electric, PSNH and WMECO have been omitted from this report but are set forth in the Annual Report on Form 10-K for 2014 filed with the SEC on a combined basis with NU on February 25, 2015. Such report is also available at the Investors section at www.eversource.com.

50
Item 7A. Quantitative and Qualitative Disclosures about Market Risk
Market Risk Information
Commodity Price Risk Management: Our Regulated companies enter into energy contracts to serve our customers and the economic impacts of those contracts are passed on to our customers. Accordingly, the Regulated companies have no exposure to loss of future earnings or fair values due to these market risk-sensitive instruments. NU's Energy Supply Risk Committee, comprised of senior officers, reviews and approves all large scale energy related transactions entered into by its Regulated companies.
Other Risk Management Activities
We have an Enterprise Risk Management (ERM) program for identifying the principal risks of the Company. Our ERM program involves the application of a well-defined, enterprise-wide methodology designed to allow our Risk Committee, comprised of our senior officers and directors of the Company, to identify, categorize, prioritize, and mitigate the principal risks to the Company. The ERM program is integrated with other assurance functions throughout the Company including Compliance, Auditing, and Insurance to ensure appropriate coverage of risks that could impact the Company. In addition to known risks, ERM identifies emerging risks to the Company, through participation in industry groups, discussions with management and in consultation with outside advisers. Our management then analyzes risks to determine materiality, likelihood, impact and develops mitigation strategies. Management broadly considers our business model, the utility industry, the global economy and the current environment to identify risks. The findings of this process are periodically discussed with the Finance Committee of our Board of Trustees, as well as with other Board Committees or the full Board of Trustees, as appropriate, including reporting on how these issues are being measured and managed. The Finance Committee is responsible for oversight of the Company's ERM program and enterprise-wide risks as well as specific risks associated with insurance, credit, financing, investments, pensions and overall system security including cyber security. However, there can be no assurances that the Enterprise Risk Management process will identify or manage every risk or event that could impact our financial position, results of operations or cash flows.
Interest Rate Risk Management: We manage our interest rate risk exposure in accordance with our written policies and procedures by maintaining a mix of fixed and variable rate long-term debt. As of December 31, 2014, approximately 91 percent of our long-term debt, including fees and interest due for spent nuclear fuel disposal costs, was at a fixed interest rate. The remaining long-term debt is at variable interest rates and is subject to interest rate risk that could result in earnings volatility. Assuming a one percentage point increase in our variable interest rates, annual interest expense would have increased by a pre-tax amount of $7.7 million.
Credit Risk Management: Credit risk relates to the risk of loss that we would incur as a result of non-performance by counterparties pursuant to the terms of our contractual obligations. We serve a wide variety of customers and transact with suppliers that include IPPs, industrial companies, natural gas and electric utilities, oil and gas producers, financial institutions, and other energy marketers. Margin accounts exist within this diverse group, and we realize interest receipts and payments related to balances outstanding in these margin accounts. This wide customer and supplier mix generates a need for a variety of contractual structures, products and terms that, in turn, require us to manage the portfolio of market risk inherent in those transactions in a manner consistent with the parameters established by our risk management process.
Our Regulated companies are subject to credit risk from certain long-term or high-volume supply contracts with energy marketing companies. Our Regulated companies manage the credit risk with these counterparties in accordance with established credit risk practices and monitor contracting risks, including credit risk. As of December 31, 2014, our Regulated companies held collateral from counterparties related to our standard service contracts. As of December 31, 2014, NU had cash posted with ISO-NE related to energy purchase transactions.
For further information on cash collateral deposited and posted with counterparties, see Note 1G, "Summary of Significant Accounting Policies -Restricted Cash and Other Deposits," and Note 4, "Derivative Instruments," to the financial statements.
If the respective unsecured debt ratings of NU or its subsidiaries were reduced to below investment grade by either Moody's or S&P, certain of NU's contracts would require additional collateral in the form of cash to be provided to counterparties and independent system operators. NU would have been and remains able to provide that collateral.

51
Item 8. Financial Statements and Supplementary Data
NUCompany Report on Internal Controls Over Financial ReportingReport of Independent Registered Public Accounting FirmConsolidated Financial Statements
Company Report on Internal Controls Over Financial Reporting
Northeast Utilities
Management is responsible for the preparation, integrity, and fair presentation of the accompanying consolidated financial statements of Northeast Utilities and subsidiaries (NU or the Company) and of other sections of this annual report. NU's internal controls over financial reporting were audited by Deloitte & Touche LLP.
Management is responsible for establishing and maintaining adequate internal controls over financial reporting. The Company's internal control framework and processes have been designed to provide reasonable assurance regarding the reliability of financial reporting and the preparation of financial statements for external purposes in accordance with accounting principles generally accepted in the United States of America. There are inherent limitations of internal controls over financial reporting that could allow material misstatements due to error or fraud to occur and not be prevented or detected on a timely basis by employees during the normal course of business. Additionally, internal controls over financial reporting may become inadequate in the future due to changes in the business environment.
Under the supervision and with the participation of the principal executive officer and principal financial officer, NU conducted an evaluation of the effectiveness of internal controls over financial reporting based on criteria established in Internal Control – Integrated Framework (2013) issued by the Committee of Sponsoring Organizations of the Treadway Commission (COSO). Based on this evaluation under the framework in COSO, management concluded that internal controls over financial reporting were effective as of December 31, 2014.
February 25, 2015

52
REPORT OF INDEPENDENT REGISTERED PUBLIC ACCOUNTING FIRM
To the Board of Trustees and Shareholders of Northeast Utilities:
We have audited the accompanying consolidated balance sheets of Northeast Utilities and subsidiaries (the "Company") as of December 31, 2014 and 2013, and the related consolidated statements of income, comprehensive income, common shareholders' equity, and cash flows for each of the three years in the period ended December 31, 2014. Our audits also included the financial statement schedules listed in the Index at Item 15 of Part IV. We also have audited the Company's internal control over financial reporting as of December 31, 2014, based on criteria established in Internal Control — Integrated Framework (2013) issued by the Committee of Sponsoring Organizations of the Treadway Commission. The Company's management is responsible for these financial statements and financial statement schedules, for maintaining effective internal control over financial reporting, and for its assessment of the effectiveness of internal control over financial reporting, included in the accompanying Company Report on Internal Controls Over Financial Reporting. Our responsibility is to express an opinion on these financial statements and financial statement schedules and an opinion on the Company's internal control over financial reporting based on our audits.
We conducted our audits in accordance with the standards of the Public Company Accounting Oversight Board (United States). Those standards require that we plan and perform the audit to obtain reasonable assurance about whether the financial statements are free of material misstatement and whether effective internal control over financial reporting was maintained in all material respects. Our audits of the financial statements included examining, on a test basis, evidence supporting the amounts and disclosures in the financial statements, assessing the accounting principles used and significant estimates made by management, and evaluating the overall financial statement presentation. Our audit of internal control over financial reporting included obtaining an understanding of internal control over financial reporting, assessing the risk that a material weakness exists, testing and evaluating the design and operating effectiveness of internal control based on the assessed risk. Our audits also included performing such other procedures as we considered necessary in the circumstances. We believe that our audits provide a reasonable basis for our opinions.
A company's internal control over financial reporting is a process designed by, or under the supervision of, the company's principal executive and principal financial officers, or persons performing similar functions, and effected by the company's board of directors, management, and other personnel to provide reasonable assurance regarding the reliability of financial reporting and the preparation of financial statements for external purposes in accordance with generally accepted accounting principles. A company's internal control over financial reporting includes those policies and procedures that (1) pertain to the maintenance of records that, in reasonable detail, accurately and fairly reflect the transactions and dispositions of the assets of the company; (2) provide reasonable assurance that transactions are recorded as necessary to permit preparation of financial statements in accordance with generally accepted accounting principles and that receipts and expenditures of the company are being made only in accordance with authorizations of management and directors of the company; and (3) provide reasonable assurance regarding prevention or timely detection of unauthorized acquisition, use, or disposition of the company's assets that could have a material effect on the financial statements.
Because of the inherent limitations of internal control over financial reporting, including the possibility of collusion or improper management override of controls, material misstatements due to error or fraud may not be prevented or detected on a timely basis. Also, projections of any evaluation of the effectiveness of the internal control over financial reporting to future periods are subject to the risk that the controls may become inadequate because of changes in conditions, or that the degree of compliance with the policies or procedures may deteriorate.
In our opinion, the consolidated financial statements referred to above present fairly, in all material respects, the financial position of Northeast Utilities and subsidiaries as of December 31, 2014 and 2013, and the results of their operations and their cash flows for each of the three years in the period ended December 31, 2014, in conformity with accounting principles generally accepted in the United States of America. Also, in our opinion, such financial statement schedules, when considered in relation to the basic consolidated financial statements taken as a whole, present fairly, in all material respects, the information set forth therein. Also, in our opinion, the Company maintained, in all material respects, effective internal control over financial reporting as of December 31, 2014, based on the criteria established in Internal Control — Integrated Framework (2013) issued by the Committee of Sponsoring Organizations of the Treadway Commission.
/s/ Deloitte & Touche LLP
Hartford, ConnecticutFebruary 25, 2015

53
NORTHEAST UTILITIES AND SUBSIDIARIESCONSOLIDATED BALANCE SHEETS
As of December 31,(Thousands of Dollars) 2014 2013
ASSETS
Current Assets:Cash and Cash Equivalents $ 38,703 $ 43,364Receivables, Net 856,346 765,391Unbilled Revenues 211,758 224,982Taxes Receivable 337,307 16,629Fuel, Materials and Supplies 349,664 303,233Regulatory Assets 672,493 535,791Prepayments and Other Current Assets 226,194 197,659
Total Current Assets 2,692,465 2,087,049
Property, Plant and Equipment, Net 18,647,041 17,576,186
Deferred Debits and Other Assets:Regulatory Assets 4,054,086 3,758,694Goodwill 3,519,401 3,519,401Marketable Securities 515,025 488,515Other Long-Term Assets 349,957 365,692
Total Deferred Debits and Other Assets 8,438,469 8,132,302
Total Assets $ 29,777,975 $ 27,795,537
LIABILITIES AND CAPITALIZATION
Current Liabilities: Notes Payable $ 956,825 $ 1,093,000 Long-Term Debt - Current Portion 245,583 533,346
Accounts Payable 868,231 742,251 Regulatory Liabilities 235,022 204,278 Other Current Liabilities 828,720 702,776Total Current Liabilities 3,134,381 3,275,651
Deferred Credits and Other Liabilities: Accumulated Deferred Income Taxes 4,467,473 4,029,026 Regulatory Liabilities 515,144 502,984 Derivative Liabilities 409,632 624,050 Accrued Pension, SERP and PBOP 1,638,558 896,844 Other Long-Term Liabilities 874,387 923,053Total Deferred Credits and Other Liabilities 7,905,194 6,975,957
Capitalization: Long-Term Debt 8,606,017 7,776,833
Noncontrolling Interest - Preferred Stock of Subsidiaries 155,568 155,568
Equity:Common Shareholders' Equity: Common Shares 1,666,796 1,665,351 Capital Surplus, Paid In 6,235,834 6,192,765
Retained Earnings 2,448,661 2,125,980 Accumulated Other Comprehensive Loss (74,009) (46,031) Treasury Stock (300,467) (326,537)
Common Shareholders' Equity 9,976,815 9,611,528Total Capitalization 18,738,400 17,543,929
Commitments and Contingencies (Note 11)
Total Liabilities and Capitalization $ 29,777,975 $ 27,795,537
The accompanying notes are an integral part of these consolidated financial statements.

54
NORTHEAST UTILITIES AND SUBSIDIARIESCONSOLIDATED STATEMENTS OF INCOME
For the Years Ended December 31,(Thousands of Dollars, Except Share Information) 2014 2013 2012
Operating Revenues $ 7,741,856 $ 7,301,204 $ 6,273,787
Operating Expenses:Purchased Power, Fuel and Transmission 3,021,550 2,482,954 2,084,364Operations and Maintenance 1,427,589 1,514,986 1,583,070Depreciation 614,657 610,777 519,010Amortization of Regulatory Assets, Net 10,704 206,322 79,762Amortization of Rate Reduction Bonds - 42,581 142,019Energy Efficiency Programs 473,127 401,919 313,149Taxes Other Than Income Taxes 561,380 512,230 434,207
Total Operating Expenses 6,109,007 5,771,769 5,155,581Operating Income 1,632,849 1,529,435 1,118,206
Interest Expense:Interest on Long-Term Debt 345,001 340,970 316,987Interest on Rate Reduction Bonds - 422 6,168Other Interest 17,105 (2,693) 6,790
Interest Expense 362,106 338,699 329,945Other Income, Net 24,619 29,894 19,742Income Before Income Tax Expense 1,295,362 1,220,630 808,003Income Tax Expense 468,297 426,941 274,926Net Income 827,065 793,689 533,077Net Income Attributable to Noncontrolling Interests 7,519 7,682 7,132Net Income Attributable to Controlling Interest $ 819,546 $ 786,007 $ 525,945
Basic Earnings Per Common Share $ 2.59 $ 2.49 $ 1.90
Diluted Earnings Per Common Share $ 2.58 $ 2.49 $ 1.89
Weighted Average Common Shares Outstanding:Basic 316,136,748 315,311,387 277,209,819
Diluted 317,417,414 316,211,160 277,993,631
The accompanying notes are an integral part of these consolidated financial statements.
CONSOLIDATED STATEMENTS OF COMPREHENSIVE INCOME
Net Income $ 827,065 $ 793,689 $ 533,077
Other Comprehensive Income/(Loss), Net of Tax:
Qualified Cash Flow Hedging Instruments 2,037 2,049 1,971Changes in Unrealized Gains/(Losses) on Other Securities 315 (940) 217Changes in Funded Status of Pension, SERP and PBOP Benefit Plans (30,330) 25,714 (4,356)
Other Comprehensive Income/(Loss), Net of Tax (27,978) 26,823 (2,168)Comprehensive Income Attributable to Noncontrolling Interests (7,519) (7,682) (7,132)Comprehensive Income Attributable to Controlling Interest $ 791,568 $ 812,830 $ 523,777
The accompanying notes are an integral part of these consolidated financial statements.

55
NORTHEAST UTILITIES AND SUBSIDIARIESCONSOLIDATED STATEMENTS OF COMMON SHAREHOLDERS' EQUITY
Accumulated TotalCapital Other Common
Common Shares Surplus, Retained Comprehensive Treasury Shareholders'
(Thousands of Dollars, Except Share Information) Shares Amount Paid In Earnings Income/(Loss) Stock EquityBalance as of January 1, 2012 177,158,692 $ 980,264 $ 1,797,884 $ 1,651,875 $ (70,686) $ (346,667) $ 4,012,670
Net Income 533,077 533,077Shares Issued in Connection with NSTAR Merger 136,048,595 680,243 4,358,027 5,038,270Other Equity Impacts of Merger with NSTAR 2,938 421 3,359Dividends on Common Shares - $1.32 Per Share (375,527) (375,527)Dividends on Preferred Stock (7,029) (7,029)Issuance of Common Shares, $5 Par Value 408,018 2,040 11,287 13,327Long-Term Incentive Plan Activity (3,897) (3,897)Issuance of Treasury Shares to Fund ESOP 438,329 8,454 8,043 16,497Other Changes in Shareholders' Equity 8,574 8,574Net Income Attributable to Noncontrolling Interests (103) (103)Other Comprehensive Loss (2,168) (2,168)
Balance as of December 31, 2012 314,053,634 1,662,547 6,183,267 1,802,714 (72,854) (338,624) 9,237,050Net Income 793,689 793,689Dividends on Common Shares - $1.47 Per Share (462,741) (462,741)Dividends on Preferred Stock (7,682) (7,682)Issuance of Common Shares, $5 Par Value 560,848 2,804 8,274 11,078Long-Term Incentive Plan Activity (10,748) (10,748)Issuance of Treasury Shares 659,077 17,381 12,087 29,468Other Changes in Shareholders' Equity (5,409) (5,409)Other Comprehensive Income 26,823 26,823
Balance as of December 31, 2013 315,273,559 1,665,351 6,192,765 2,125,980 (46,031) (326,537) 9,611,528Net Income 827,065 827,065Dividends on Common Shares - $1.57 Per Share (496,524) (496,524)Dividends on Preferred Stock (7,519) (7,519)Issuance of Common Shares, $5 Par Value 288,941 1,445 5,164 6,609Long-Term Incentive Plan Activity (9,569) (9,569)Issuance of Treasury Shares 1,420,837 37,817 26,070 63,887Other Changes in Shareholders' Equity 9,657 (341) 9,316Other Comprehensive Loss (27,978) (27,978)
Balance as of December 31, 2014 316,983,337 $ 1,666,796 $ 6,235,834 $ 2,448,661 $ (74,009) $ (300,467) $ 9,976,815
The accompanying notes are an integral part of these consolidated financial statements.

56
NORTHEAST UTILITIES AND SUBSIDIARIESCONSOLIDATED STATEMENTS OF CASH FLOWS
For the Years Ended December 31,(Thousands of Dollars) 2014 2013 2012
Operating Activities:Net Income $ 827,065 $ 793,689 $ 533,077Adjustments to Reconcile Net Income to Net Cash Flows
Provided by Operating Activities:Depreciation 614,657 610,777 519,010Deferred Income Taxes 443,259 431,413 292,000Pension, SERP and PBOP Expense 99,056 195,698 218,540Pension and PBOP Contributions (211,649) (342,184) (295,028)Regulatory Over/(Under) Recoveries, Net 6,853 (24,276) (259,853)Amortization of Regulatory Assets, Net 10,704 206,322 79,762Amortization of Rate Reduction Bonds - 42,581 142,019Proceeds from DOE Damages Claim, Net 132,138 - -Other 39,523 56,071 42,852
Changes in Current Assets and Liabilities:Receivables and Unbilled Revenues, Net (122,139) (163,549) (20,214)Fuel, Materials and Supplies (41,310) (14,811) 34,321Taxes Receivable/Accrued, Net (323,224) (50,950) (5,450)Accounts Payable 144,743 (54,619) (128,339)Other Current Assets and Liabilities, Net 15,797 (22,623) 8,532
Net Cash Flows Provided by Operating Activities 1,635,473 1,663,539 1,161,229
Investing Activities:Investments in Property, Plant and Equipment (1,603,744) (1,456,787) (1,472,272)Proceeds from Sales of Marketable Securities 488,789 627,532 317,294Purchases of Marketable Securities (491,220) (679,784) (348,629)Other Investing Activities 14,380 67,816 35,683
Net Cash Flows Used in Investing Activities (1,591,795) (1,441,223) (1,467,924)
Financing Activities:Cash Dividends on Common Shares (475,227) (462,741) (375,047)Cash Dividends on Preferred Stock (7,519) (7,682) (7,029)Increase/(Decrease) in Short-Term Debt 285,075 (397,000) 825,000Issuance of Long-Term Debt 725,000 1,680,000 850,000Retirements of Long-Term Debt (576,551) (929,885) (839,136)Retirements of Rate Reduction Bonds - (82,139) (114,433)Other Financing Activities 883 (25,253) 6,529
Net Cash Flows (Used in)/Provided by Financing Activities (48,339) (224,700) 345,884Net (Decrease)/Increase in Cash and Cash Equivalents (4,661) (2,384) 39,189Cash and Cash Equivalents - Beginning of Year 43,364 45,748 6,559Cash and Cash Equivalents - End of Year $ 38,703 $ 43,364 $ 45,748
The accompanying notes are an integral part of these consolidated financial statements.
The 2014 financial statements for CL&P, NSTAR Electric, PSNH and WMECO have been omitted from this report but are set forth in the Annual Report on Form 10-K for 2014 filed with the SEC on a combined basis with NU on February 25, 2015. Such report is also available at the Investors section at www.eversource.com.

57
NORTHEAST UTILITIES AND SUBSIDIARIESTHE CONNECTICUT LIGHT AND POWER COMPANY
NSTAR ELECTRIC COMPANY AND SUBSIDIARYPUBLIC SERVICE COMPANY OF NEW HAMPSHIRE AND SUBSIDIARY
WESTERN MASSACHUSETTS ELECTRIC COMPANY
COMBINED NOTES TO FINANCIAL STATEMENTS
Refer to the Glossary of Terms included in this combined Annual Report on Form 10-K for abbreviations and acronyms used throughout the combined notes to the financial statements.
1. SUMMARY OF SIGNIFICANT ACCOUNTING POLICIES
A. About NU, CL&P, NSTAR Electric, PSNH and WMECO NU Consolidated: NU is a public utility holding company primarily engaged through its wholly owned regulated utility subsidiaries in the energy delivery business. On April 10, 2012, NU acquired NSTAR and its subsidiaries. See Note 21, "Merger of NU and NSTAR," for further information regarding the merger. NU's wholly owned regulated utility subsidiaries consist of CL&P, NSTAR Electric, PSNH, WMECO, Yankee Gas and NSTAR Gas. NU provides energy delivery service to approximately 3.6 million electric and natural gas customers through these six regulated utilities in Connecticut, Massachusetts and New Hampshire. On February 2, 2015, NU, CL&P, NSTAR Electric, PSNH and WMECO commenced doing business as Eversource Energy.
NU, CL&P, NSTAR Electric, PSNH and WMECO are reporting companies under the Securities Exchange Act of 1934. NU is a public utility holding company under the Public Utility Holding Company Act of 2005. Arrangements among the regulated electric companies and other NU companies, outside agencies and other utilities covering interconnections, interchange of electric power and sales of utility property are subject to regulation by the FERC. The Regulated companies are subject to regulation of rates, accounting and other matters by the FERC and/or applicable state regulatory commissions (the PURA for CL&P and Yankee Gas, the DPU for NSTAR Electric, WMECO and NSTAR Gas, and the NHPUC for PSNH).
Regulated Companies: CL&P, NSTAR Electric, PSNH and WMECO furnish franchised retail electric service in Connecticut, Massachusetts and New Hampshire. Yankee Gas and NSTAR Gas are engaged in the distribution and sale of natural gas to customers within Connecticut and central and eastern Massachusetts, respectively. CL&P, NSTAR Electric, PSNH and WMECO's results include the operations of their respective distribution and transmission businesses. PSNH and WMECO's distribution results include the operations of their respective generation businesses. NU also has a regulated subsidiary, NPT, which was formed to construct, own and operate the Northern Pass line, a HVDC transmission line from Québec to New Hampshire under development that will interconnect with a new HVDC transmission line being developed by a transmission subsidiary of HQ.
Other: NUSCO, NU's service company, Rocky River Realty Company, a wholly-owned real estate subsidiary of NU, Renewable Properties, Inc., a wholly-owned subsidiary of EETV, and Properties, Inc., a wholly-owned subsidiary of PSNH, provide support services to NU, including its regulated companies. Harbor Electric Energy Company, a wholly-owned subsidiary of NSTAR Electric, provides distribution service and ongoing support to the Massachusetts Water Resources Authority. Hopkinton LNG Corp, an indirect, wholly-owned subsidiary of NU, provides natural gas liquefaction, vaporization, and storage services for NSTAR Gas.
B. Basis of Presentation The consolidated financial statements of NU, NSTAR Electric and PSNH include the accounts of each of their respective subsidiaries. Intercompany transactions have been eliminated in consolidation. The accompanying consolidated financial statements of NU, NSTAR Electric and PSNH and the financial statements of CL&P and WMECO are herein collectively referred to as the "financial statements."
The preparation of the financial statements in conformity with GAAP requires management to make estimates and assumptions that affect the reported amounts of assets and liabilities and disclosure of contingent liabilities as of the date of the financial statements and the reported amounts of revenues and expenses during the reporting period. Actual results could differ from those estimates.
NU's consolidated financial information includes NSTAR and its subsidiaries' results of operations beginning April 10, 2012. The information disclosed for the year ended December 31, 2012 for NSTAR Electric is presented on a comparable basis.
NU consolidates CYAPC and YAEC because CL&P's, NSTAR Electric's, PSNH's and WMECO's combined ownership interest in each of these entities is greater than 50 percent. Intercompany transactions between CL&P, NSTAR Electric, PSNH and WMECO and the CYAPC and YAEC companies have been eliminated in consolidation of the NU financial statements.
NU's utility subsidiaries are subject to the application of accounting guidance for entities with rate-regulated operations that considers the effect of regulation resulting from differences in the timing of the recognition of certain revenues and expenses from those of other businesses and industries. NU's utility subsidiaries' distribution, generation and transmission businesses and NPT are subject to rate-regulation that is based on cost recovery and meets the criteria for application of rate-regulated accounting. See Note 2, "Regulatory Accounting," for further information.
Certain reclassifications of prior year data were made in the accompanying balance sheets for NU, CL&P, NSTAR Electric and PSNH. These reclassifications were made to conform to the current year presentation.

58
In accordance with accounting guidance on noncontrolling interests in consolidated financial statements, the Preferred Stock of CL&P and the Preferred Stock of NSTAR Electric, which are not owned by NU or its consolidated subsidiaries and are not subject to mandatory redemption, have been presented as noncontrolling interests in the financial statements of NU. The Preferred Stock of CL&P and the Preferred Stock of NSTAR Electric are considered to be temporary equity and have been classified between liabilities and permanent shareholders' equity on the balance sheets of NU, CL&P and NSTAR Electric due to a provision in the preferred stock agreements of both CL&P and NSTAR Electric that grant preferred stockholders the right to elect a majority of the CL&P and NSTAR Electric Board of Directors, respectively, should certain conditions exist, such as if preferred dividends are in arrears for a specified amount of time. The Net Income reported in the statements of income and cash flows represents net income prior to apportionment to noncontrolling interests, which is represented by dividends on preferred stock of CL&P and NSTAR Electric.
As of December 31, 2014 and 2013, NU's carrying amount of goodwill was approximately $3.5 billion. NU performs an assessment for possible impairment of its goodwill at least annually. NU completed its annual goodwill impairment test for each of its reporting units as of October 1, 2014 and determined that no impairment exists. See Note 22, "Goodwill," for further information.
C. Accounting StandardsRecently Adopted Accounting Standards: On January 1, 2014, as required, NU prospectively adopted the Financial Accounting Standards Board's (FASB) final Accounting Standards Updates (ASU) that required presentation of certain unrecognized tax benefits as reductions to deferred tax assets. Implementation of this guidance had an immaterial impact on the balance sheets and no impact on the results of operations or cash flows of NU, CL&P, NSTAR Electric, PSNH and WMECO.
Accounting Standards Issued but not Yet Adopted: In May 2014, the FASB issued ASU 2014-09, Revenue from Contracts with Customers, effective January 1, 2017, which amends existing revenue recognition guidance and is required to be applied retrospectively (either to each reporting period presented or cumulatively at the date of initial application). Management is reviewing the requirements of the ASU. The ASU's impact is not expected to have a material impact on the financial statements of NU, CL&P, NSTAR Electric, PSNH and WMECO.
D. Cash and Cash EquivalentsCash and cash equivalents include cash on hand and short-term cash investments that are highly liquid in nature and have original maturities of three months or less. At the end of each reporting period, any overdraft amounts are reclassified from Cash and Cash Equivalents to Accounts Payable on the balance sheets.
E. Provision for Uncollectible AccountsNU, including CL&P, NSTAR Electric, PSNH and WMECO, presents its receivables at estimated net realizable value by maintaining a provision for uncollectible accounts. This provision is determined based upon a variety of judgments and factors, including the application of an estimated uncollectible percentage to each receivable aging category. The estimate is based upon historical collection and write-off experience and management's assessment of collectability from customers. Management continuously assesses the collectability of receivables and adjusts collectability estimates based on actual experience. Receivable balances are written off against the provision for uncollectible accounts when the accounts are terminated and these balances are deemed to be uncollectible.
The PURA allows CL&P and Yankee Gas to accelerate the recovery of accounts receivable balances attributable to qualified customers under financial or medical duress (uncollectible hardship accounts receivable) outstanding for greater than 90 days. The DPU allows WMECO to also recover in rates amounts associated with certain uncollectible hardship accounts receivable. Uncollectible customer account balances, which are expected to be recovered in rates, are included in Regulatory Assets or Other Long-Term Assets.
The total provision for uncollectible accounts and for uncollectible hardship accounts, which is included in the total provision, are included in Receivables, Net on the balance sheets, and were as follows:
Total Provision for Uncollectible Accounts Uncollectible Hardship
As of December 31, As of December 31,
(Millions of Dollars) 2014 2013 2014 2013
NU $ 175.3 $ 171.3 $ 91.5 $ 81.2CL&P 84.3 82.0 74.0 67.3NSTAR Electric 40.7 41.7 - - PSNH 7.7 7.4 - - WMECO 9.9 10.0 6.2 5.5
F. Fuel, Materials and Supplies and Allowance Inventory Fuel, Materials and Supplies include natural gas, coal, biomass and oil inventories as well as materials purchased primarily for construction or operation and maintenance purposes. Natural gas, coal, biomass and oil inventories are valued at their respective weighted average cost. Materials and supplies are valued at the lower of average cost or market. As of December 31, 2014, NU and PSNH had $164.3 million and $95.1 million, respectively, of fuel and $185.4 million and $53 million, respectively, of materials and supplies. As of December 31, 2013, NU and PSNH had $139.5 million and $74.2 million, respectively, of fuel and $163.7 million and $54.5 million, respectively, of materials and supplies.
Fuel, Materials and Supplies also include Renewable Energy Certificates (RECs), which are purchased from suppliers of renewable sources of generation. RECs are used to meet state mandated Renewable Portfolio Standards requirements. As of December 31, 2014 and 2013, NSTAR Electric had $25.1 million and $4.9 million, respectively, of RECs classified as Materials and Supplies on the balance sheets.
PSNH is subject to federal and state laws and regulations that regulate emissions of air pollutants, including SO2, CO2, and NOx related to its regulated generation units, and uses SO2, CO2, and NOx emissions allowances. At the end of each compliance period, PSNH is required to relinquish SO2, CO2, and NOx emissions allowances corresponding to the actual respective emissions emitted by its generating units over the compliance

59
period. SO2 and NOx emissions allowances are obtained through an annual allocation from the federal and state regulators that are granted at no cost and through purchases from third parties. CO2 emissions allowances are obtained through an annual allocation from the state regulator that are granted at no cost and are acquired through auctions and through purchases from third parties. SO2, CO2, and NOx emissions allowances are charged to expense based on their weighted average cost as they are utilized against emissions volumes at PSNH's generating units.
SO2, CO2, and NOx emissions allowances are recorded within Fuel, Materials and Supplies and are classified on the balance sheet as short-term or long-term depending on the period in which they are expected to be utilized against actual emissions. As of December 31, 2014 and 2013, PSNH had $20.1 million and $19.4 million, respectively, of long-term SO2 and CO2 emissions allowances classified as Other Long-Term Assets on the balance sheets.
G. Restricted Cash and Other DepositsAs of December 31, 2014, NU, CL&P and PSNH had $3.2 million, $2.1 million, and $1 million, respectively, of restricted cash relating to amounts held in escrow, which were included in Prepayments and Other Current Assets on the balance sheets. As of December 31, 2013, these amounts were $1.7 million and $1.4 million for NU and CL&P, respectively.
As of December 31, 2014, NU, CL&P and PSNH had $9.9 million, $1.2 million and $2.5 million, respectively, of cash collateral posted not subject to master netting agreements, primarily with ISO-NE, which were included in Prepayments and Other Current Assets on the balance sheets. As of December 31, 2013, these amounts were $17.9 million and $9 million for NU and NSTAR Electric, respectively.
H. Fair Value MeasurementsFair value measurement guidance is applied to derivative contracts that are not elected or designated as "normal purchases or normal sales" (normal) and to the marketable securities held in trusts. Fair value measurement guidance is also applied to valuations of the investments used to calculate the funded status of pension and PBOP plans and nonrecurring fair value measurements of nonfinancial assets such as goodwill and AROs, and is also used to estimate the fair value of preferred stock and long-term debt.
Fair Value Hierarchy: In measuring fair value, NU uses observable market data when available and minimizes the use of unobservable inputs. Inputs used in fair value measurements are categorized into three fair value hierarchy levels for disclosure purposes. The entire fair value measurement is categorized based on the lowest level of input that is significant to the fair value measurement. NU evaluates the classification of assets and liabilities measured at fair value on a quarterly basis, and NU's policy is to recognize transfers between levels of the fair value hierarchy as of the end of the reporting period. The three levels of the fair value hierarchy are described below:
Level 1 - Inputs are quoted prices (unadjusted) in active markets for identical assets or liabilities as of the reporting date. Active markets are those in which transactions for the asset or liability occur in sufficient frequency and volume to provide pricing information on an ongoing basis.
Level 2 - Inputs are quoted prices for similar instruments in active markets, quoted prices for identical or similar instruments in markets that are not active, and model-derived valuations in which all significant inputs are observable.
Level 3 - Quoted market prices are not available. Fair value is derived from valuation techniques in which one or more significant inputs or assumptions are unobservable. Where possible, valuation techniques incorporate observable market inputs that can be validated to external sources such as industry exchanges, including prices of energy and energy-related products.
Determination of Fair Value: The valuation techniques and inputs used in NU's fair value measurements are described in Note 4, "Derivative Instruments," Note 5, "Marketable Securities," Note 6, "Asset Retirement Obligations," Note 9A, "Employee Benefits – Pension Benefits and Postretirement Benefits Other Than Pensions," Note 13, "Fair Value of Financial Instruments," and Note 21, "Merger of NU and NSTAR," to the financial statements.
I. Derivative AccountingMany of the Regulated companies' contracts for the purchase and sale of energy or energy-related products are derivatives. The accounting treatment for energy contracts entered into varies and depends on the intended use of the particular contract and on whether or not the contract is a derivative. For the Regulated companies, regulatory assets or regulatory liabilities are recorded to offset the fair values of derivative contracts, as contract settlements are recovered from, or refunded to, customers in future rates.
The application of derivative accounting is complex and requires management judgment in the following respects: identification of derivatives and embedded derivatives, election and designation of the normal exception, and determination of the fair value of derivative contracts. All of these judgments can have a significant impact on the financial statements.
The judgment applied in the election of the normal exception (and resulting accrual accounting) includes the conclusion that it is probable at the inception of the contract and throughout its term that it will result in physical delivery of the underlying product and that the quantities will be used or sold by the business in the normal course of business. If facts and circumstances change and management can no longer support this conclusion, then the normal exception and accrual accounting is terminated, and fair value accounting is applied prospectively.
The fair value of derivative contracts is based upon the contract terms and conditions and the underlying market price or fair value per unit. When quantities are not specified in the contract, the Company determines whether the contract has a determinable quantity by using amounts referenced in default provisions and other relevant sections of the contract. The fair value of derivative assets and liabilities with the same counterparty are offset and recorded as a net derivative asset or liability on the balance sheets. Changes in the fair value of derivative contracts are recorded as regulatory assets or liabilities and do not impact net income.

60
For further information regarding derivative contracts, see Note 4, "Derivative Instruments," to the financial statements.
J. Equity Method InvestmentsRegional Decommissioned Nuclear Companies: CL&P, NSTAR Electric, PSNH and WMECO own common stock in three regional nuclear generation companies (CYAPC, YAEC and MYAPC, collectively referred to as the Yankee Companies), each of which owned a single nuclear generating facility that has been decommissioned. For CL&P, NSTAR Electric, PSNH and WMECO, the respective investments in CYAPC, YAECand MYAPC are accounted for under the equity method. NU consolidates CYAPC and YAEC because CL&P's, NSTAR Electric's, PSNH's and WMECO's combined ownership interest in each of these entities is greater than 50 percent. Intercompany transactions between CL&P, NSTAR Electric, PSNH and WMECO and the CYAPC and YAEC companies have been eliminated in consolidation of the NU financial statements.
Ownership interests in the Yankee Companies as of December 31, 2014 and 2013 were as follows:
(Percent) CYAPC YAEC MYAPC
CL&P 34.5 % 24.5 % 12.0 %NSTAR Electric 14.0 14.0 4.0PSNH 5.0 7.0 5.0WMECO 9.5 7.0 3.0
The total carrying values of CL&P's, NSTAR Electric's, PSNH's and WMECO's ownership interests in CYAPC, YAEC and MYAPC, which are included in Other Long-Term Assets on their respective balance sheets, were as follows:
As of December 31,
(Millions of Dollars) 2014 2013
CL&P $ 1.2 $ 1.2NSTAR Electric 0.5 0.5PSNH 0.3 0.3WMECO 0.3 0.3
For further information on the Yankee Companies, see Note 11C, "Commitments and Contingencies - Contractual Obligations - Yankee Companies,"to the financial statements.
Other Investments: As of December 31, 2014 and 2013, NU had an equity ownership interest in an energy investment fund of $17.8 million and $9.8 million, respectively.
Equity investments are included in Other Long-Term Assets on the balance sheets and net earnings related to these equity investments are included in Other Income, Net on the statements of income.
K. RevenuesRegulated Companies: The Regulated companies' retail revenues are based on rates approved by their respective state regulatory commissions. In general, rates can only be changed through formal proceedings with the state regulatory commissions. The Regulated companies' rates are designed to recover the costs to provide service to their customers, including a return on investment. The Regulated companies also utilize regulatory commission-approved tracking mechanisms to recover certain costs on a fully-reconciling basis. These tracking mechanisms require rates to be changed periodically to ensure recovery of actual costs incurred. WMECO and CL&P (effective December 1, 2014), each have a revenue decoupling mechanism to recover a pre-established level of baseline distribution delivery service revenues per year, independent of actual customer usage. Decoupling mechanisms effectively break the relationship between sales volumes and revenues recognized.
A significant portion of the Regulated companies' retail revenues relate to the recovery of costs incurred for the sale of electricity and natural gas purchased on behalf of customers. These energy supply costs are recovered from customers in rates through cost tracking mechanisms. Energy purchases are recorded in Purchased Power, Fuel and Transmission, and the sale of energy associated with these purchases are recorded in Operating Revenues.
Regulated Companies' Unbilled Revenues: Because customers are billed throughout the month based on pre-determined cycles rather than on a calendar month basis, an estimate of electricity or natural gas delivered to customers for which the customers have not yet been billed is calculated as of the balance sheet date. Unbilled revenues are included in Operating Revenues on the statements of income and are assets on the balance sheets. Actual amounts billed to customers when meter readings become available may vary from the estimated amount.
The Regulated companies estimate unbilled sales monthly using the daily load cycle method. The daily load cycle method allocates billed sales to the current calendar month based on the daily load for each billing cycle. The billed sales are subtracted from total month load, net of delivery losses, to estimate unbilled sales. Unbilled revenues are estimated by first allocating unbilled sales to the respective customer classes, then applying an estimated rate by customer class to those sales.
Regulated Companies' Transmission Revenues - Wholesale Rates: Wholesale transmission revenues are recovered through FERC approved formula rates. Wholesale transmission revenues for CL&P, NSTAR Electric, PSNH, and WMECO are collected under the ISO New England Inc. Transmission, Markets and Services Tariff (ISO-NE Tariff). The ISO-NE Tariff includes Regional Network Service (RNS), Schedule 21 - NU rate schedules, which recover the costs of transmission and other transmission-related services for CL&P, PSNH and WMECO, and Schedule 21 -NSTAR rate schedules, which recover costs of transmission and other transmission-related services for NSTAR Electric. The RNS rate, administered by ISO-NE and billed to all New England transmission load, including CL&P, NSTAR Electric, PSNH and WMECO's distribution businesses, is reset on June 1st of each year and recovers the revenue requirements associated with transmission facilities that benefit the entire New England region. Schedule 21 - NU and Schedule 21 - NSTAR rates, administered by NU, recovers the remainder of the transmission revenue requirements. The Schedule 21 - NU rate is reset on January 1st and June 1st of each year, while the Schedule 21 - NSTAR rate is reset on June 1st of

61
each year. The Schedule 21 - NU and Schedule 21 - NSTAR rate calculations recover total transmission revenue requirements net of revenues received from other sources (i.e., RNS, rentals, etc.), thereby ensuring that NU recovers all of CL&P's, NSTAR Electric's, PSNH's and WMECO's regional and local transmission revenue requirements in accordance with the ISO-NE Tariff. RNS, Schedule 21 - NU and Schedule 21 - NSTAR rates provide for the annual reconciliation and recovery or refund of estimated costs to actual costs. The financial impacts of differences between actual and estimated costs are deferred for future recovery from, or refunded to, transmission customers. See Note 11E, "Commitments and Contingencies – FERC Base ROE Complaints," for complaints filed at FERC relating to NU's base ROE.
Regulated Companies' Transmission Revenues - Retail Rates: A significant portion of the NU transmission segment revenue comes from ISO-NE charges to the distribution businesses of CL&P, NSTAR Electric, PSNH and WMECO, each of which recovers these costs through rates charged to their retail customers. CL&P, NSTAR Electric, PSNH and WMECO each have a retail transmission cost tracking mechanism as part of their rates, which allows the electric distribution companies to charge their retail customers for transmission costs on a timely basis.
L. Operating ExpensesCosts related to fuel and natural gas included in Purchased Power, Fuel and Transmission on the statements of income were as follows:
For the Years Ended December 31,
(Millions of Dollars) 2014 2013 2012
NU - Natural Gas and Fuel (1) $ 599.4 $ 466.5 $ 346.8PSNH – Fuel 113.4 104.8 103.4
(1) NSTAR Gas natural gas costs were included in NU beginning April 10, 2012.
M. Allowance for Funds Used During ConstructionAFUDC represents the cost of borrowed and equity funds used to finance construction and is included in the cost of the Regulated companies' utility plant. The portion of AFUDC attributable to borrowed funds is recorded as a reduction of Other Interest Expense, and the AFUDC related to equity funds is recorded as Other Income, Net on the statements of income. AFUDC costs are recovered from customers over the service life of the related plant in the form of increased revenue collected as a result of higher depreciation expense.
The Regulated companies' average AFUDC rate is based on a FERC-prescribed formula using the cost of a company's short-term financings and capitalization (preferred stock, long-term debt and common equity), as appropriate. The average rate is applied to average eligible CWIP amounts to calculate AFUDC.
NU For the Years Ended December 31,
(Millions of Dollars, except percentages) 2014 2013 2012 (1)
Borrowed Funds $ 5.8 $ 4.1 $ 5.3Equity Funds 13.7 7.1 6.8Total AFUDC $ 19.5 $ 11.2 $ 12.1Average AFUDC Rate 3.4% 2.7% 3.7%
(1) NSTAR amounts were included in NU beginning April 10, 2012.
For the Years Ended December 31,
2014 2013 2012(Millions of Dollars, NSTAR NSTAR NSTARexcept percentages) CL&P Electric PSNH WMECO CL&P Electric PSNH WMECO CL&P Electric PSNH WMECO
Borrowed Funds $ 1.9 $ 2.0 $ 0.6 $ 0.9 $ 2.2 $ 0.5 $ 0.5 $ 0.5 $ 2.5 $ 0.3 $ 1.6 $ 0.5Equity Funds 2.9 3.8 0.6 1.7 2.9 - 0.2 1.0 1.9 - 1.9 1.0Total AFUDC $ 4.8 $ 5.8 $ 1.2 $ 2.6 $ 5.1 $ 0.5 $ 0.7 $ 1.5 $ 4.4 $ 0.3 $ 3.5 $ 1.5Average AFUDC Rate 3.4% 2.5% 1.8% 5.6% 3.7% 0.5% 1.1% 6.1% 3.6% 0.4% 5.9% 6.8%
N. Other Income, NetItems included within Other Income, Net on the statements of income primarily consist of investment income/(loss), interest income, AFUDC related to equity funds, and equity in earnings. Investment income/(loss) primarily relates to debt and equity securities held in trust. For further information, see Note 5, "Marketable Securities," to the financial statements. For further information on AFUDC related to equity funds, see Note 1M, "Summary of Significant Accounting Policies – Allowance for Funds Used During Construction," to the financial statements.
O. Other TaxesGross receipts taxes levied by the state of Connecticut are collected by CL&P and Yankee Gas from their respective customers. These gross receipts taxes are shown on a gross basis with collections in Operating Revenues and payments in Taxes Other Than Income Taxes on the statements of income as follows:
For the Years Ended December 31,(Millions of Dollars) 2014 2013 2012
NU $ 148.2 $ 144.1 $ 135.0CL&P 127.9 128.2 120.7
Certain sales taxes are collected by NU's companies that serve customers in Connecticut and Massachusetts as agents for state and local governments and are recorded on a net basis with no impact on the statements of income.

62
P. Supplemental Cash Flow Information
NU As of and For the Years Ended December 31,
(Millions of Dollars) 2014 2013 2012 (1)
Cash Paid/(Received) During the Year for:Interest, Net of Amounts Capitalized $ 349.6 $ 343.3 $ 356.5Income Taxes 334.2 50.0 (12.8)
Non-Cash Investing Activities:Plant Additions Included in Accounts Payable (As of) 181.9 193.1 160.6
(1) NSTAR amounts were included in NU beginning April 10, 2012.
As of and For the Years Ended December 31,
2014 2013 2012
NSTAR NSTAR NSTAR(Millions of Dollars) CL&P Electric PSNH WMECO CL&P Electric PSNH WMECO CL&P Electric PSNH WMECO
Cash Paid/(Received) During the Year for: Interest, Net of Amounts Capitalized $ 144.1 $ 75.3 $ 41.1 $ 25.9 $ 131.6 $ 75.8 $ 43.3 $ 25.8 $ 129.4 $ 94.6 $ 49.8 $ 25.8Income Taxes 135.4 217.1 2.3 25.1 55.0 163.4 (30.1) (69.0) (42.0) 88.1 14.7 (8.4)
Non-Cash Investing Activities:Plant Additions Included in Accounts Payable (As of) 63.5 34.6 39.3 14.2 51.4 57.0 34.9 19.5 42.8 50.0 16.8 30.0
In 2014, as a result of damages awarded to the Yankee Companies for spent nuclear fuel lawsuits against the DOE described in Note 11C, "Commitments and Contingencies - Contractual Obligations - Yankee Companies," NU received total proceeds of $132.1 million, which were net of $80.6 million in proceeds CYAPC and YAEC returned to non-affiliated member companies.
The merger of NU with NSTAR on April 10, 2012 represented a significant non-cash transaction. Refer to Note 21, "Merger of NU and NSTAR," for further information.
Q. Related PartiesNUSCO, NU's service company, provides centralized accounting, administrative, engineering, financial, information technology, legal, operational, planning, purchasing, and other services to NU's companies. The Rocky River Realty Company, Renewable Properties, Inc. and Properties, Inc., three other NU subsidiaries, construct, acquire or lease some of the property and facilities used by NU's companies.
As of both December 31, 2014 and 2013, CL&P, PSNH and WMECO had long-term receivables from NUSCO in the amounts of $25 million, $3.8 million and $5.5 million, respectively, which were included in Other Long-Term Assets on the balance sheets. These amounts related to the funding of investments held in trust by NUSCO in connection with certain postretirement benefits for CL&P, PSNH and WMECO employees and have been eliminated in consolidation on the NU financial statements.
Included in the CL&P, NSTAR Electric, PSNH and WMECO balance sheets as of December 31, 2014 and 2013 were Accounts Receivable from Affiliated Companies and Accounts Payable to Affiliated Companies relating to transactions between CL&P, NSTAR Electric, PSNH and WMECO and other subsidiaries that are wholly-owned by NU. These amounts have been eliminated in consolidation on the NU financial statements.
R. Severance BenefitsFor the years ended December 31, 2014 and 2013, NU recorded severance benefit expenses of $15 million and $9.7 million, respectively, in connection with the partial outsourcing of information technology functions and facilities closures, as well as ongoing post-merger integration. As of December 31, 2014 and 2013, the severance accrual totaled $10.4 million and $14.7 million, respectively, and was included in Other Current Liabilities on the balance sheets.
2. REGULATORY ACCOUNTING
The rates charged to the customers of NU's Regulated companies are designed to collect each company's costs to provide service, including a return on investment. Therefore, the accounting policies of the Regulated companies follow the application of accounting guidance for entities with rate-regulated operations and reflect the effects of the rate-making process.
Management believes it is probable that each of the Regulated companies will recover their respective investments in long-lived assets, including regulatory assets. If management were to determine that it could no longer apply the accounting guidance applicable to rate-regulated enterprises to any of the Regulated companies' operations, or that management could not conclude it is probable that costs would be recovered from customers in future rates, the costs would be charged to net income in the period in which the determination is made.

63
Regulatory Assets: The components of regulatory assets are as follows:
NU As of December 31,
(Millions of Dollars) 2014 2013
Benefit Costs $ 2,016.0 $ 1,240.2Derivative Liabilities 425.5 638.0Income Taxes, Net 635.3 626.2Storm Restoration Costs 502.8 589.6Goodwill-related 505.4 525.9Regulatory Tracker Mechanisms 350.5 323.4Contractual Obligations - Yankee Companies 123.8 154.2Buy Out Agreements for Power Contracts 42.6 70.2Other Regulatory Assets 124.7 126.8Total Regulatory Assets 4,726.6 4,294.5Less: Current Portion 672.5 535.8Total Long-Term Regulatory Assets $ 4,054.1 $ 3,758.7
As of December 31,
2014 2013
NSTAR NSTAR(Millions of Dollars) CL&P Electric PSNH WMECO CL&P Electric PSNH WMECO
Benefit Costs $ 445.4 $ 515.9 $ 174.3 $ 85.0 $ 297.7 $ 496.7 $ 100.6 $ 57.3Derivative Liabilities 410.9 4.5 - - 630.4 7.7 - -Income Taxes, Net 437.7 83.7 38.0 35.5 415.5 84.0 40.3 43.7Storm Restoration Costs 319.6 103.7 47.7 31.8 397.8 109.3 43.7 38.8Goodwill-related - 433.9 - - - 451.5 - -Regulatory Tracker Mechanisms 16.1 141.4 103.5 33.0 8.0 169.5 83.3 32.6Buy Out Agreements for Power Contracts - 38.6 4.0 - - 64.7 5.5 -Other Regulatory Assets 66.1 56.1 37.3 12.9 64.6 55.9 38.1 16.7Total Regulatory Assets 1,695.8 1,377.8 404.8 198.2 1,814.0 1,439.3 311.5 189.1Less: Current Portion 220.3 198.7 111.7 51.9 150.9 204.1 92.2 43.0Total Long-Term Regulatory Assets $ 1,475.5 $ 1,179.1 $ 293.1 $ 146.3 $ 1,663.1 $ 1,235.2 $ 219.3 $ 146.1
Regulatory Costs in Other Long-Term Assets: The Regulated companies had $60.5 million ($1.3 million for CL&P, $33.2 million for NSTAR Electric, $0.9 million for PSNH, and $11 million for WMECO) and $65.1 million ($7.3 million for CL&P, $33.4 million for NSTAR Electric, and $10.1 million for WMECO) of additional regulatory costs as of December 31, 2014 and 2013, respectively, that were included in Other Long-Term Assets on the balance sheets. These amounts represent incurred costs for which recovery has not yet been specifically approved by the applicable regulatory agency. However, based on regulatory policies or past precedent on similar costs, management believes it is probable that these costs will ultimately be approved and recovered from customers in rates. The NSTAR Electric balance as of December 31, 2014 and 2013 primarily related to costs deferred in connection with the basic service bad debt adder. See Note 11G, "Commitments and Contingencies – Basic Service Bad Debt Adder," for further information.
Equity Return on Regulatory Assets: For rate-making purposes, the Regulated companies recover the carrying costs related to their regulatory assets. For certain regulatory assets, the carrying cost recovered includes an equity return component. This equity return, which is not recorded on the balance sheets, totaled $1.7 million and $1.9 million for CL&P and $43.3 million and $33.1 million for PSNH as of December 31, 2014 and 2013, respectively. These carrying costs will be recovered from customers in future rates.
Regulatory Assets - The following provides further information about regulatory assets:
Benefit Costs: NU's Pension, SERP and PBOP Plans are accounted for in accordance with accounting guidance on defined benefit pension and other PBOP plans. The liability recorded by the Regulated companies to recognize the funded status of their retiree benefit plans are offset by regulatory assets in lieu of a charge to Accumulated Other Comprehensive Income/(Loss), reflecting ultimate recovery from customers through rates. All amounts are remeasured annually. Regulatory accounting was also applied to the portions of NU's service company costs that support the Regulated companies, as these amounts are also recoverable. As these regulatory assets do not represent a cash outlay for the Regulated companies, no carrying charge is recovered from customers.
The increase in the funded status liability of the retiree benefit plans and the corresponding regulatory assets was primarily driven by a change in mortality assumptions, which increased the estimate of benefits to be provided to plan participants, and a decrease in the discount rate assumption. For further information on the funded status liability and related regulatory assets of the Pension, SERP and PBOP plans, see Note 9A, "Employee Benefits – Pension Benefits and Postretirement Benefits Other Than Pensions."
CL&P, NSTAR Electric, PSNH and WMECO recover benefit costs related to their distribution and transmission operations from customers in rates as allowed by their applicable regulatory commissions. NSTAR Electric and WMECO each recover their qualified pension and PBOP expenses related to distribution operations through rate reconciling mechanisms that fully track the change in net pension and PBOP expenses each year.
Derivative Liabilities: Regulatory assets recorded as an offset to derivative liabilities relate to the fair value of contracts used to purchase energy and energy-related products that will be recovered from customers in future rates. See Note 4, "Derivative Instruments," to the financial statements for further information. These assets are excluded from rate base and are being recovered as the actual settlements occur over the duration of the contracts.

64
Income Taxes, Net: The tax effect of temporary book-tax differences (differences between the periods in which transactions affect income in the financial statements and the periods in which they affect the determination of taxable income, including those differences relating to uncertain tax positions) is accounted for in accordance with the rate-making treatment of the applicable regulatory commissions and accounting guidance for income taxes. Differences in income taxes between the accounting guidance and the rate-making treatment of the applicable regulatory commissions are recorded as regulatory assets. As these assets are offset by deferred income tax liabilities, no carrying charge is collected. For further information regarding income taxes, see Note 10, "Income Taxes," to the financial statements.
Storm Restoration Costs: The storm restoration cost deferrals relate to costs incurred at CL&P, NSTAR Electric, PSNH and WMECO that each company expects to recover from customers. A storm must meet certain criteria to be declared a major storm with the criteria specific to each state jurisdiction and utility company. Once a storm is declared major, all qualifying expenses incurred during storm restoration efforts are deferred and recovered from customers. In addition to storm restoration costs, CL&P and PSNH are each allowed to recover storm pre-staging costs in accordance with applicable regulation.
CL&P, NSTAR Electric, PSNH and WMECO experienced several significant storm events, including Tropical Storm Irene in 2011, the October 2011 snowstorm, Storm Sandy in 2012 and the February 2013 blizzard. As a result of these storm events, each company suffered extensive damage to its distribution and transmission systems resulting in customer outages. Each company incurred significant costs to repair damage and restore customers' service. In addition, on November 26, 2014, a snowstorm caused damage to the electric delivery systems of PSNH and WMECO. This snowstorm resulted in estimated deferred storm restoration costs of approximately $23 million at PSNH and approximately $3 million at WMECO. The storm restoration cost regulatory asset balance at CL&P, NSTAR Electric, PSNH and WMECO reflects deferrable costs incurred for major storm events. Management believes the storm restoration costs were prudent and meet the criteria for specific cost recovery in Connecticut, Massachusetts and New Hampshire, and that recovery from customers is probable through the applicable regulatory recovery process.
Storm Filings: Each electric utility has sought, or is seeking, recovery of its deferred storm restoration costs through its applicable regulatory recovery process.
CL&P: As of December 31, 2014, all CL&P deferred storm costs have been reviewed and approved for recovery in distribution rates.On March 12, 2014, the PURA approved recovery of $365 million of deferred storm restoration costs (with carrying charges) associated with five major storms that occurred in 2011 and 2012 and ordered CL&P to capitalize approximately $18 million of the deferred storm restoration costs as utility plant, which will be recovered through depreciation expense in future rate proceedings. CL&P will recover the $365 million in its distribution rates over a six-year period that commenced on December 1, 2014. The remaining costs were either disallowed or are probable of recovery from other sources. These costs did not have a material impact on CL&P's financial position, results of operations or cash flows.
Effective June 1, 2014, CL&P received $65.4 million of DOE Phase II Damages proceeds. On June 17, 2014, the PURA ordered CL&P to refund these proceeds to customers by offsetting the deferred storm restoration costs regulatory asset. For further information on the DOE Phase II Damages proceeds received from the Yankee Companies, see Note 11C, "Commitments and Contingencies - Contractual Obligations - Yankee Companies," to the financial statements.
On December 17, 2014, as part of the distribution rate case decision, CL&P was also allowed recovery of the 2013 storm costs and residual 2012 Storm Sandy costs over a seven-year period that commenced on December 1, 2014.
NSTAR Electric: On December 30, 2013, the DPU approved recovery of $34.2 million of NSTAR Electric's storm restoration costs, plus carrying costs, related to Tropical Storm Irene in 2011 and the October 2011 snowstorm. NSTAR Electric is recovering these costs, plus carrying costs, in its distribution rates over a five-year period that commenced on January 1, 2014.
PSNH: On June 27, 2013, the NHPUC approved an increase to PSNH's distribution rates effective July 1, 2013, which included a $5 million increase to the level of funding for the major storm cost reserve. The major storm cost reserve is used to offset the storm restoration cost regulatory asset. On April 7, 2014, PSNH received an audit report from the NHPUC approving storm costs from 2011 through March 2013.
WMECO: On December 20, 2013, the DPU approved WMECO's 2013 Annual Storm Reserve Recovery Cost Adjustment filing to begin recovering the October 2011 snowstorm and 2012 Storm Sandy restoration costs, which commenced on January 1, 2014, subject to further review and reconciliation. On December 5, 2014, the DPU approved the majority of deferred storm costs through 2011.
Goodwill-related: The goodwill regulatory asset originated from the transaction that created NSTAR in 1999. This regulatory asset is currentlybeing amortized and recovered from customers in rates without a carrying charge over a 40-year period (as of December 31, 2014, there were 25years of amortization remaining).
Regulatory Tracker Mechanisms: The Regulated companies' approved rates are designed to recover their incurred costs to provide service to customers. The Regulated companies recover certain of their costs on a fully-reconciling basis through regulatory commission-approved tracking mechanisms. The difference between the costs incurred (or the rate recovery allowed) and the actual revenues is recorded as regulatory assets (for undercollections) or regulatory liabilities (for overcollections) to be included in future customer rates each year. Carrying charges are recorded on all material regulatory tracker mechanisms.
CL&P, NSTAR Electric, PSNH and WMECO each recover the costs associated with the procurement of energy, transmission related costs from FERC-approved transmission tariffs, energy efficiency programs, low income assistance programs, and restructuring and stranded costs as a result of deregulation, on a fully reconciling basis. Energy procurement costs at PSNH include the costs related to its generating stations.

65
WMECO's and CL&P's (effective December 1, 2014) distribution revenue is decoupled from their customer sales volume. CL&P and WMECO reconcile their annual base distribution rate recovery to a pre-established level of baseline distribution delivery service revenue. Any difference between the allowed level of distribution revenue and the actual amount incurred during a 12-month period is adjusted through rates in the following period.
Contractual Obligations - Yankee Companies: CL&P, NSTAR Electric, PSNH and WMECO are responsible for their proportionate share of the remaining costs of the CYAPC, YAEC and MYAPC nuclear facilities, including nuclear fuel storage. A portion of these amounts was recorded as a regulatory asset. Amounts for CL&P are earning a return and are being recovered through the CTA. Amounts for NSTAR Electric and WMECO are being recovered without a return through the transition charge. Amounts for PSNH were fully recovered in 2006. As a result of NU's consolidation of CYAPC and YAEC, NU's regulatory asset balance also includes the regulatory assets of CYAPC and YAEC, which totaled $97.8 million and $129.8 million as of December 31, 2014 and 2013, respectively. Intercompany transactions between CL&P, NSTAR Electric, PSNH and WMECO and the CYAPC and YAEC companies have been eliminated in consolidation of the NU financial statements.
Buy Out Agreements for Power Contracts: NSTAR Electric's balance represents the contract termination liability related to certain purchase power contract buy out agreements that were executed in 2004. The contracts' termination payments occur through September 2016 and are collected from customers through NSTAR Electric's transition charge over the same period. NSTAR Electric does not earn a return on this regulatory asset. PSNH's balance represents payments associated with the termination of various power purchase contracts that were recorded as regulatory assets and are amortized over the remaining life of the contracts.
Other Regulatory Assets: Other Regulatory Assets primarily include asset retirement obligations, environmental remediation costs, losses associated with the reacquisition or redemption of long-term debt and various other items, partially offset by purchase price adjustments recorded as Regulatory Assets in connection with the merger with NSTAR.
Regulatory Liabilities: The components of regulatory liabilities are as follows:
NU As of December 31,
(Millions of Dollars) 2014 2013
Cost of Removal $ 439.9 $ 435.1Regulatory Tracker Mechanisms 192.3 151.2AFUDC - Transmission 67.1 68.1Other Regulatory Liabilities 50.8 52.9Total Regulatory Liabilities 750.1 707.3Less: Current Portion 235.0 204.3Total Long-Term Regulatory Liabilities $ 515.1 $ 503.0
As of December 31,
2014 2013
NSTAR NSTAR(Millions of Dollars) CL&P Electric PSNH WMECO CL&P Electric PSNH WMECO
Cost of Removal $ 19.7 $ 258.3 $ 50.3 $ 1.1 $ 29.1 $ 250.0 $ 49.7 $ -Regulatory Tracker Mechanisms 122.6 20.7 14.2 22.3 95.6 21.9 21.6 21.1AFUDC – Transmission 53.6 4.4 - 9.1 54.7 4.1 - 9.3Other Regulatory Liabilities 10.1 28.9 2.9 0.8 8.4 31.1 1.0 3.4Total Regulatory Liabilities 206.0 312.3 67.4 33.3 187.8 307.1 72.3 33.8Less: Current Portion 124.7 49.6 16.0 22.5 94.0 54.0 20.6 19.9Total Long-Term Regulatory Liabilities $ 81.3 $ 262.7 $ 51.4 $ 10.8 $ 93.8 $ 253.1 $ 51.7 $ 13.9
Cost of Removal: NU's Regulated companies currently recover amounts in rates for future costs of removal of plant assets over the lives of the assets. The estimated cost to remove utility assets from service is recognized as a component of depreciation expense and the cumulative amounts collected from customers but not yet expended is recognized as a regulatory liability. Expended costs that exceed amounts collected from customers are recognized as regulatory assets, as they are probable of recovery in future rates.
AFUDC - Transmission: AFUDC was recorded by CL&P and WMECO for their NEEWS projects through May 31, 2011, all of which was reserved as a regulatory liability to reflect rate base recovery for 100 percent of the CWIP as a result of FERC-approved transmission incentives. Effective June 1, 2011, FERC approved changes to the ISO-NE Tariff in order to include 100 percent of the NEEWS CWIP in regional rate base. As a result, CL&P and WMECO no longer record AFUDC on NEEWS CWIP. NSTAR Electric recorded AFUDC on reliability-related projects over $5 million through December 31, 2014, 50 percent of which was recorded as a regulatory liability to reflect rate base recovery for 50 percent of the CWIP as a result of FERC-approved transmission incentives.
Other Regulatory Liabilities: Other Regulatory Liabilities primarily includes amounts that are subject to various rate reconciling mechanisms that, as of each period end date, would result in refunds to customers.
2014 Regulatory Developments: As a result of actions taken by the FERC and other developments in the pending base ROE complaint proceedings described in Note 11E, "Commitments and Contingencies – FERC Base ROE Complaints," in 2014 the Company recorded reserves at its electric subsidiaries to recognize the potential financial impact of the first and second complaints. As of December 31, 2014, the cumulative pre-tax reserves (excluding interest), which exclude refunds for the first complaint refund period, totaled $60.7 million at NU, $33.5 million at CL&P, $13.6 million at NSTAR Electric, $5.1 million at PSNH and $8.5 million at WMECO. As of December 31, 2013, as a result of the 2013 FERC ALJ initial decision, the Company had an aggregate pre-tax reserve (excluding interest) of $23.7 million at NU, $12.8 million at CL&P, $5.7 million at NSTAR
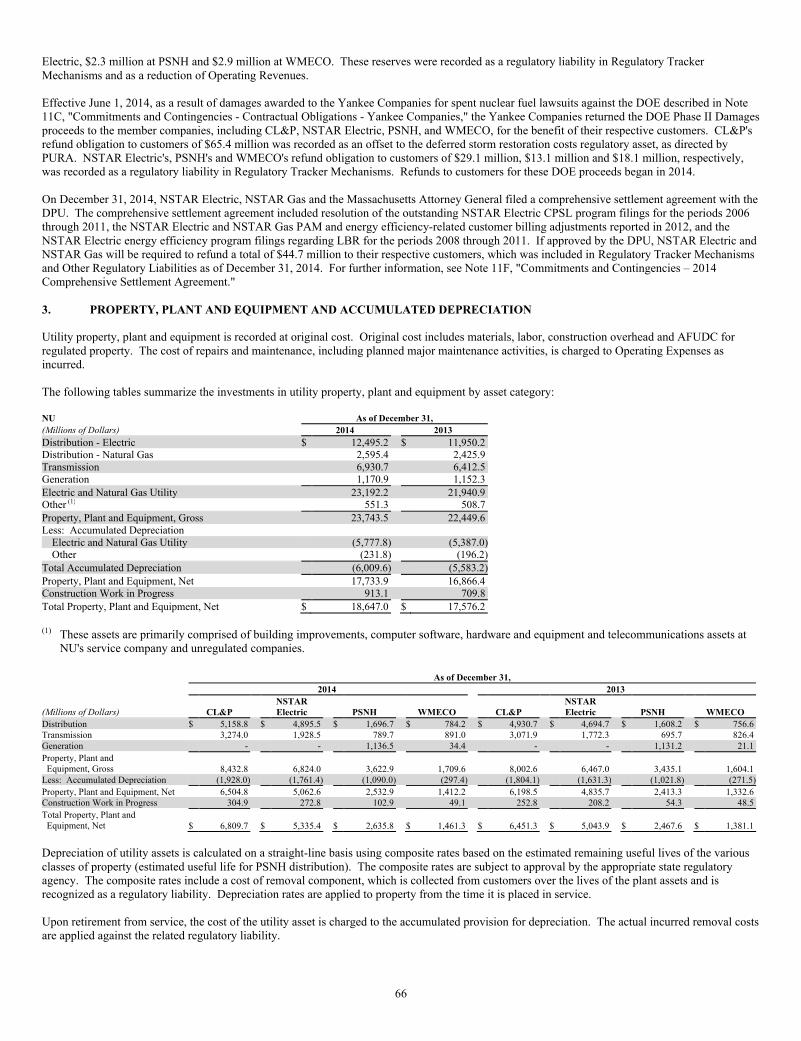
66
Electric, $2.3 million at PSNH and $2.9 million at WMECO. These reserves were recorded as a regulatory liability in Regulatory Tracker Mechanisms and as a reduction of Operating Revenues.
Effective June 1, 2014, as a result of damages awarded to the Yankee Companies for spent nuclear fuel lawsuits against the DOE described in Note 11C, "Commitments and Contingencies - Contractual Obligations - Yankee Companies," the Yankee Companies returned the DOE Phase II Damages proceeds to the member companies, including CL&P, NSTAR Electric, PSNH, and WMECO, for the benefit of their respective customers. CL&P's refund obligation to customers of $65.4 million was recorded as an offset to the deferred storm restoration costs regulatory asset, as directed by PURA. NSTAR Electric's, PSNH's and WMECO's refund obligation to customers of $29.1 million, $13.1 million and $18.1 million, respectively, was recorded as a regulatory liability in Regulatory Tracker Mechanisms. Refunds to customers for these DOE proceeds began in 2014.
On December 31, 2014, NSTAR Electric, NSTAR Gas and the Massachusetts Attorney General filed a comprehensive settlement agreement with the DPU. The comprehensive settlement agreement included resolution of the outstanding NSTAR Electric CPSL program filings for the periods 2006 through 2011, the NSTAR Electric and NSTAR Gas PAM and energy efficiency-related customer billing adjustments reported in 2012, and the NSTAR Electric energy efficiency program filings regarding LBR for the periods 2008 through 2011. If approved by the DPU, NSTAR Electric and NSTAR Gas will be required to refund a total of $44.7 million to their respective customers, which was included in Regulatory Tracker Mechanisms and Other Regulatory Liabilities as of December 31, 2014. For further information, see Note 11F, "Commitments and Contingencies – 2014 Comprehensive Settlement Agreement."
3. PROPERTY, PLANT AND EQUIPMENT AND ACCUMULATED DEPRECIATION
Utility property, plant and equipment is recorded at original cost. Original cost includes materials, labor, construction overhead and AFUDC for regulated property. The cost of repairs and maintenance, including planned major maintenance activities, is charged to Operating Expenses as incurred.
The following tables summarize the investments in utility property, plant and equipment by asset category:
NU As of December 31,
(Millions of Dollars) 2014 2013
Distribution - Electric $ 12,495.2 $ 11,950.2Distribution - Natural Gas 2,595.4 2,425.9Transmission 6,930.7 6,412.5Generation 1,170.9 1,152.3Electric and Natural Gas Utility 23,192.2 21,940.9Other (1) 551.3 508.7Property, Plant and Equipment, Gross 23,743.5 22,449.6Less: Accumulated Depreciation
Electric and Natural Gas Utility (5,777.8) (5,387.0)Other (231.8) (196.2)
Total Accumulated Depreciation (6,009.6) (5,583.2)Property, Plant and Equipment, Net 17,733.9 16,866.4Construction Work in Progress 913.1 709.8Total Property, Plant and Equipment, Net $ 18,647.0 $ 17,576.2
(1) These assets are primarily comprised of building improvements, computer software, hardware and equipment and telecommunications assets at NU's service company and unregulated companies.
As of December 31,
2014 2013
NSTAR NSTAR(Millions of Dollars) CL&P Electric PSNH WMECO CL&P Electric PSNH WMECO
Distribution $ 5,158.8 $ 4,895.5 $ 1,696.7 $ 784.2 $ 4,930.7 $ 4,694.7 $ 1,608.2 $ 756.6Transmission 3,274.0 1,928.5 789.7 891.0 3,071.9 1,772.3 695.7 826.4Generation - - 1,136.5 34.4 - - 1,131.2 21.1
Property, Plant and Equipment, Gross 8,432.8 6,824.0 3,622.9 1,709.6 8,002.6 6,467.0 3,435.1 1,604.1Less: Accumulated Depreciation (1,928.0) (1,761.4) (1,090.0) (297.4) (1,804.1) (1,631.3) (1,021.8) (271.5)
Property, Plant and Equipment, Net 6,504.8 5,062.6 2,532.9 1,412.2 6,198.5 4,835.7 2,413.3 1,332.6Construction Work in Progress 304.9 272.8 102.9 49.1 252.8 208.2 54.3 48.5
Total Property, Plant and Equipment, Net $ 6,809.7 $ 5,335.4 $ 2,635.8 $ 1,461.3 $ 6,451.3 $ 5,043.9 $ 2,467.6 $ 1,381.1
Depreciation of utility assets is calculated on a straight-line basis using composite rates based on the estimated remaining useful lives of the various classes of property (estimated useful life for PSNH distribution). The composite rates are subject to approval by the appropriate state regulatory agency. The composite rates include a cost of removal component, which is collected from customers over the lives of the plant assets and is recognized as a regulatory liability. Depreciation rates are applied to property from the time it is placed in service.
Upon retirement from service, the cost of the utility asset is charged to the accumulated provision for depreciation. The actual incurred removal costs are applied against the related regulatory liability.

67
The depreciation rates for the various classes of utility property, plant and equipment aggregate to composite rates as follows:
(Percent) 2014 2013 2012
NU 3.0 % 2.8 % 2.5 %CL&P 2.7 2.5 2.5NSTAR Electric 3.0 2.9 2.8PSNH 3.0 3.0 3.0WMECO 3.3 2.9 3.3
The following table summarizes average useful lives of depreciable assets:
Average Depreciable Life
(Years) NU CL&P NSTAR Electric PSNH WMECO
Distribution 34.9 37.5 32.3 32.3 30.9Transmission 42.5 39.8 44.0 43.7 49.9Generation 31.9 - - 32.1 25.0Other 14.2 - - - -
4. DERIVATIVE INSTRUMENTS
The Regulated companies purchase and procure energy and energy-related products, which are subject to price volatility, for their customers. The costs associated with supplying energy to customers are recoverable through customer rates. The Regulated companies manage the risks associated with the price volatility of energy and energy-related products through the use of derivative and nonderivative contracts.
Many of the derivative contracts meet the definition of, and are designated as, normal and qualify for accrual accounting under the applicable accounting guidance. The costs and benefits of derivative contracts that meet the definition of normal are recognized in Operating Expenses or Operating Revenues on the statements of income, as applicable, as electricity or natural gas is delivered.
Derivative contracts that are not designated as normal are recorded at fair value as current or long-term Derivative Assets or Derivative Liabilities on the balance sheets. For the Regulated companies, regulatory assets or regulatory liabilities are recorded to offset the fair values of derivatives, as contract settlements are recovered from, or refunded to, customers in their respective energy supply rates. For NU's unregulated wholesale marketing contracts that expired on December 31, 2013, changes in fair values of derivatives were included in Net Income.
The gross fair values of derivative assets and liabilities with the same counterparty are offset and reported as net Derivative Assets or Derivative Liabilities, with current and long-term portions, on the balance sheets. The following table presents the gross fair values of contracts categorized by risk type and the net amount recorded as current or long-term derivative asset or liability:
As of December 31,
2014 2013
Commodity Supply Net Amount Commodity Supply Net Amount and Price Risk Recorded as and Price Risk Recorded as
(Millions of Dollars) Management Netting (1) a Derivative Management Netting (1) a Derivative
Current Derivative Assets:Level 2:
NU $ - $ - $ - $ 1.9 $ (0.3) $ 1.6Level 3:
NU 16.2 (6.6) 9.6 18.4 (9.8) 8.6CL&P 16.1 (6.6) 9.5 17.1 (9.8) 7.3NSTAR Electric 0.1 - 0.1 1.2 - 1.2
Long-Term Derivative Assets:
Level 2:
NU $ - $ - $ - $ 0.2 $ - $ 0.2Level 3:
NU 93.5 (19.2) 74.3 116.2 (42.2) 74.0CL&P 93.5 (19.2) 74.3 113.6 (42.2) 71.4
Current Derivative Liabilities:Level 2:
NU $ (9.8) $ - $ (9.8) $ - $ - $ -Level 3:
NU (90.0) - (90.0) (93.7) - (93.7)CL&P (88.5) - (88.5) (92.2) - (92.2)NSTAR Electric (1.5) - (1.5) (1.5) - (1.5)
Level 2:NU $ (0.3) $ - $ (0.3) $ - $ - $ -
Level 3:NU (409.3) - (409.3) (624.1) - (624.1)CL&P (406.2) - (406.2) (617.1) - (617.1)NSTAR Electric (3.1) - (3.1) (7.0) - (7.0)
(1) Amounts represent derivative assets and liabilities that NU elected to record net on the balance sheets. These amounts are subject to master netting agreements or similar agreements for which the right of offset exists.

68
The business activities that result in the recognition of derivative assets also create exposure to various counterparties. As of December 31, 2014, NU and CL&P's derivative assets were exposed to counterparty credit risk. Of NU's and CL&P's derivative assets, $64 million was contracted with investment grade entities.
For further information on the fair value of derivative contracts, see Note 1H, "Summary of Significant Accounting Policies - Fair Value Measurements," and Note 1I, "Summary of Significant Accounting Policies - Derivative Accounting," to the financial statements.
Derivative Contracts At Fair Value with Offsetting Regulatory Amounts Commodity Supply and Price Risk Management: As required by regulation, CL&P, along with UI, has capacity-related contracts with generation facilities. CL&P has a sharing agreement with UI, with 80 percent of each contract allocated to CL&P and 20 percent allocated to UI. The combined capacity of these contracts is 787 MW. The capacity contracts extend through 2026 and obligate both CL&P and UI to make or receive payments on a monthly basis to or from the generation facilities based on the difference between a set capacity price and the capacity market price received in the ISO-NE capacity markets. In addition, CL&P has a contract to purchase 0.1 million MWh of energy per year through 2020.
NSTAR Electric has a renewable energy contract to purchase 0.1 million MWh of energy per year through 2018 and a capacity-related contract to purchase up to 35 MW per year through 2019.
As of December 31, 2014 and 2013, NU had NYMEX future contracts in order to reduce variability associated with the purchase price of approximately 8.8 million and 9.1 million MMBtu of natural gas, respectively.
The following table presents the current change in fair value, primarily recovered through rates from customers, associated with NU's derivative contracts:
Gain/(Loss) Recognized on Derivatives(Millions of Dollars) For the Years Ended December 31,
NU 2014 2013 2012
Balance Sheets:Regulatory Assets and Liabilities $ 134.4 $ 160.6 $ (29.0)
Statements of Income:Purchased Power, Fuel and Transmission - 1.0 (0.7)
Credit Risk Certain of NU's derivative contracts contain credit risk contingent features. These features require NU to maintain investment grade credit ratings from the major rating agencies and to post collateral for contracts in a net liability position over specified credit limits. As of December 31, 2014, NU had approximately $10 million of derivative contracts in a net liability position that were subject to credit risk contingent features and would have been required to post additional collateral of approximately $10 million if NU parent's unsecured debt credit ratings had been downgraded to below investment grade. As of December 31, 2013, there were no derivative contracts in a net liability position that were subject to credit risk contingent features.
Fair Value Measurements of Derivative InstrumentsDerivative contracts classified as Level 2 in the fair value hierarchy relate to the financial contracts for natural gas futures. Prices are obtained from broker quotes and are based on actual market activity. The contracts are valued using NYMEX natural gas prices. Valuations of these contracts also incorporate discount rates using the yield curve approach.
The fair value of derivative contracts classified as Level 3 utilizes significant unobservable inputs. The fair value is modeled using income techniques, such as discounted cash flow valuations adjusted for assumptions relating to exit price. Significant observable inputs for valuations of these contracts include energy and energy-related product prices in future years for which quoted prices in an active market exist. Fair value measurements categorized in Level 3 of the fair value hierarchy are prepared by individuals with expertise in valuation techniques, pricing of energy and energy-related products, and accounting requirements. The future power and capacity prices for periods that are not quoted in an active market or established at auction are based on available market data and are escalated based on estimates of inflation to address the full time period of the contract.
Valuations of derivative contracts using a discounted cash flow methodology include assumptions regarding the timing and likelihood of scheduled payments and also reflect non-performance risk, including credit, using the default probability approach based on the counterparty's credit rating for assets and the Company's credit rating for liabilities. Valuations incorporate estimates of premiums or discounts that would be required by a market participant to arrive at an exit price, using historical market transactions adjusted for the terms of the contract.

69
The following is a summary of NU's, including CL&P's and NSTAR Electric's, Level 3 derivative contracts and the range of the significant unobservable inputs utilized in the valuations over the duration of the contracts:
As of December 31,
2014 2013
Range Period Covered Range Period Covered
Energy Prices: NU $ 52 per MWh 2020 $ 49 - 77 per MWh 2018 - 2029 CL&P $ 52 per MWh 2020 $ 56 - 58 per MWh 2018 - 2029
Capacity Prices: NU $ 5.30 - 12.98 per kW-Month 2016 - 2026 $ 5.07 - 11.82 per kW-Month 2017 - 2029 CL&P $ 11.08 - 12.98 per kW-Month 2018 - 2026 $ 5.07 - 10.42 per kW-Month 2017 - 2026 NSTAR Electric $ 5.30 - 11.10 per kW-Month 2016 - 2019 $ 5.07 - 7.38 per kW-Month 2017 - 2019
Forward Reserve: NU, CL&P $ 5.80 - 9.50 per kW-Month 2015 - 2024 $ 3.30 per kW-Month 2014 - 2024
REC Prices: NU $ 38 - 56 per REC 2015 - 2018 $ 36 - 87 per REC 2014 - 2029 NSTAR Electric $ 38 - 56 per REC 2015 - 2018 $ 36 - 70 per REC 2014 - 2018
Exit price premiums of 7 percent through 24 percent are also applied on these contracts and reflect the most recent market activity available for similar type contracts.
Significant increases or decreases in future energy or capacity prices in isolation would decrease or increase, respectively, the fair value of the derivative liability. Any increases in the risk premiums would increase the fair value of the derivative liabilities. Changes in these fair values are recorded as a regulatory asset or liability and would not impact net income.
Valuations using significant unobservable inputs: The following tables present changes in the Level 3 category of derivative assets and derivative liabilities measured at fair value on a recurring basis. The derivative assets and liabilities are presented on a net basis.
(Millions of Dollars) NU CL&P NSTAR Electric
Derivatives, Net: Fair Value as of January 1, 2013 $ (878.6) $ (866.2) $ (14.9)Net Realized/Unrealized Gains Included in:
Net Income (1) 10.9 - -Regulatory Assets and Liabilities 158.3 148.9 3.5
Settlements 74.2 86.7 4.1Fair Value as of December 31, 2013 $ (635.2) $ (630.6) $ (7.3)Net Realized/Unrealized Gains Included in Regulatory Assets and Liabilities 141.3 139.7 4.3Settlements 78.5 80.0 (1.5)Fair Value as of December 31, 2014 $ (415.4) $ (410.9) $ (4.5)
(1) The Net Income impact for the year ended December 31, 2013 related to the unregulated wholesale marketing sales contract that was offset by the losses on the unregulated sourcing contracts classified as Level 2 in the fair value hierarchy, resulting in a total net gain of $1 million.
5. MARKETABLE SECURITIES
NU maintains trusts to fund certain non-qualified executive benefits and WMECO maintains a spent nuclear fuel trust to fund WMECO's prior periodspent nuclear fuel liability. These trusts hold marketable securities. These trusts are not subject to regulatory oversight by state or federal agencies. In addition, CYAPC and YAEC maintain legally restricted trusts, each of which holds marketable securities, for settling the decommissioning obligations of their nuclear power plants.
The Company elected to record mutual funds at fair value and certain other equity investments as trading securities, with the changes in fair values recorded in Other Income, Net on the statements of income. As of December 31, 2014 and 2013, the mutual funds and equity investments were classified as Level 1 in the fair value hierarchy and totaled $85.1 million and $57.2 million, respectively. For the years ended December 31, 2014, 2013 and 2012, net gains on these securities of $1.9 million, $10.2 million and $5.9 million, respectively, were recorded in Other Income, Net on the statements of income. Dividend income is recorded in Other Income, Net when dividends are declared. All other marketable securities are accounted for as available-for-sale.

70
Available-for-Sale Securities: The following is a summary of NU's and WMECO's available-for-sale securities. These securities are recorded at fair value and are included in current and long-term Marketable Securities on the balance sheets.
As of December 31,
2014 2013
Pre-Tax Pre-Tax Pre-Tax Pre-Tax Amortized Unrealized Unrealized Amortized Unrealized Unrealized
(Millions of Dollars) Cost Gains Losses Fair Value Cost Gains Losses Fair Value
NUDebt Securities (1) $ 313.0 $ 7.5 $ (0.3) $ 320.2 $ 299.2 $ 2.5 $ (2.1) $ 299.6Equity Securities (1) 160.6 73.3 - 233.9 163.6 60.5 - 224.1
WMECO Debt Securities (2) 58.2 - (0.1) 58.1 57.9 - - 57.9
(1) NU's amounts include CYAPC's and YAEC's marketable securities held in nuclear decommissioning trusts of $450.8 million and $424 million as of December 31, 2014 and 2013, respectively, which are legally restricted and can only be used for the costs of decommissioning of the nuclear power plants owned by these companies. Unrealized gains and losses for the nuclear decommissioning trusts are recorded in Marketable Securities with the corresponding offset to Other Long-Term Liabilities on the balance sheets, with no impact on the statements of income. All of the equity securities accounted for as available-for-sale securities are held in the CYAPC and YAEC trusts.
(2) Unrealized gains and losses on debt securities held by WMECO are recorded in Marketable Securities with the corresponding offset to Other Long-Term Assets on the balance sheets.
Unrealized Losses and Other-than-Temporary Impairment: There have been no significant unrealized losses, other-than-temporary impairments or credit losses for NU or WMECO. Factors considered in determining whether a credit loss exists include the duration and severity of the impairment, adverse conditions specifically affecting the issuer, and the payment history, ratings and rating changes of the security. For asset-backed debt securities, underlying collateral and expected future cash flows are also evaluated.
Realized Gains and Losses: Realized gains and losses on available-for-sale securities are recorded in Other Income, Net for NU's benefit trust, Other Long-Term Assets for WMECO, and offset in Other Long-Term Liabilities for CYAPC and YAEC. NU utilizes the specific identification basis method for the NU benefit trust and the average cost basis method for the WMECO trust and the CYAPC and YAEC nuclear decommissioning trusts to compute the realized gains and losses on the sale of available-for-sale securities.
Contractual Maturities: As of December 31, 2014, the contractual maturities of available-for-sale debt securities are as follows:
NU WMECO
Amortized Amortized(Millions of Dollars) Cost Fair Value Cost Fair Value
Less than one year (1) $ 55.0 $ 55.0 $ 28.7 $ 28.7One to five years 88.8 89.1 25.8 25.8Six to ten years 66.0 67.7 0.7 0.7Greater than ten years 103.2 108.4 3.0 2.9Total Debt Securities $ 313.0 $ 320.2 $ 58.2 $ 58.1
(1) Amounts in the Less than one year NU category include securities in the CYAPC and YAEC nuclear decommissioning trusts, which are restricted and are classified in long-term Marketable Securities on the balance sheets.
Fair Value Measurements: The following table presents the marketable securities recorded at fair value on a recurring basis by the level in which they are classified within the fair value hierarchy:
NU WMECO
As of December 31, As of December 31,
(Millions of Dollars) 2014 2013 2014 2013
Level 1: Mutual Funds and Equities $ 319.0 $ 281.3 $ - $ -Money Market Funds 24.9 32.9 4.3 10.9
Total Level 1 $ 343.9 $ 314.2 $ 4.3 $ 10.9Level 2:
U.S. Government Issued Debt Securities (Agency and Treasury) $ 51.3 $ 61.4 $ - $ 6.8Corporate Debt Securities 49.1 53.6 14.7 15.1Asset-Backed Debt Securities 54.1 30.4 14.5 9.0Municipal Bonds 116.3 105.5 13.0 11.2Other Fixed Income Securities 24.5 15.8 11.6 4.9
Total Level 2 $ 295.3 $ 266.7 $ 53.8 $ 47.0Total Marketable Securities $ 639.2 $ 580.9 $ 58.1 $ 57.9
U.S. government issued debt securities are valued using market approaches that incorporate transactions for the same or similar bonds and adjustments for yields and maturity dates. Corporate debt securities are valued using a market approach, utilizing recent trades of the same or similar instrument and also incorporating yield curves, credit spreads and specific bond terms and conditions. Asset-backed debt securities include collateralized mortgage obligations, commercial mortgage backed securities, and securities collateralized by auto loans, credit card loans or

71
receivables. Asset-backed debt securities are valued using recent trades of similar instruments, prepayment assumptions, yield curves, issuance and maturity dates, and tranche information. Municipal bonds are valued using a market approach that incorporates reported trades and benchmark yields. Other fixed income securities are valued using pricing models, quoted prices of securities with similar characteristics, and discounted cash flows.
6. ASSET RETIREMENT OBLIGATIONS
NU, including CL&P, NSTAR Electric, PSNH and WMECO, recognizes a liability for the fair value of an ARO on the obligation date if the liability's fair value can be reasonably estimated and is conditional on a future event. Settlement dates and future costs are reasonably estimated when sufficient information becomes available. Management has identified various categories of AROs, primarily certain assets containing asbestos and hazardous contamination and has performed fair value calculations, reflecting expected probabilities for settlement scenarios.
The fair value of an ARO is recorded as a liability in Other Long-Term Liabilities with a corresponding amount included in Property, Plant and Equipment, Net on the balance sheets. The ARO assets are depreciated, and the ARO liabilities are accreted over the estimated life of the obligation with corresponding credits recorded as accumulated depreciation and ARO liabilities, respectively. As the Regulated companies are rate-regulated on a cost-of-service basis, these companies apply regulatory accounting guidance and both the depreciation and accretion costs associated with the Regulated companies' AROs are recorded as increases to Regulatory Assets on the balance sheets.
A reconciliation of the beginning and ending carrying amounts of ARO liabilities are as follows:
NU As of December 31,
(Millions of Dollars) 2014 2013
Balance as of Beginning of Year $ 424.9 $ 412.2Liabilities Incurred During the Year 1.3 0.1Liabilities Settled During the Year (19.5) (13.8)Accretion 25.1 23.8Revisions in Estimated Cash Flows (5.5) 2.6Balance as of End of Year $ 426.3 $ 424.9
As of December 31,
2014 2013
NSTAR NSTAR(Millions of Dollars) CL&P Electric PSNH WMECO CL&P Electric PSNH WMECO
Balance as of Beginning of Year $ 35.0 $ 32.8 $ 19.5 $ 4.5 $ 33.6 $ 31.4 $ 18.4 $ 4.3Liabilities Incurred During the Year - - - 1.1 - - - - Liabilities Settled During the Year (1.1) - - - (0.7) (0.1) - - Accretion 1.9 1.5 1.1 0.3 2.2 1.5 1.2 0.3Revisions in Estimated Cash Flows (0.5) - - - (0.1) - (0.1) (0.1)Balance as of End of Year $ 35.3 $ 34.3 $ 20.6 $ 5.9 $ 35.0 $ 32.8 $ 19.5 $ 4.5
NU's amounts include CYAPC and YAEC's AROs of $317.3 million and $318.8 million as of December 31, 2014 and 2013, respectively. The fair value of the ARO for CYAPC and YAEC includes uncertainties of the fuel off-load dates related to the DOE's timing of performance regarding its obligation to dispose of the spent nuclear fuel and high level waste. The incremental asset recorded as an offset to the ARO liability was fully depreciated since the plants have no remaining useful life. Any changes in the assumptions used to calculate the fair value of the ARO liability are recorded with a corresponding offset to the related regulatory asset. The assets held in the CYAPC and YAEC nuclear decommissioning trusts are restricted for settling the ARO and all other decommissioning obligations. For further information on the assets held in the nuclear decommissioning trusts, see Note 5, "Marketable Securities," to the financial statements.
7. SHORT-TERM DEBT
Short-Term Borrowing Limits: The amount of short-term borrowings that may be incurred by CL&P, NSTAR Electric and WMECO is subject to periodic approval by the FERC. As a result of the NHPUC having jurisdiction over PSNH's short-term debt, PSNH is not currently required to obtain FERC approval for its short-term borrowings. On July 31, 2013, the FERC granted authorization to allow CL&P and WMECO to incur total short-term borrowings up to a maximum of $600 million and $300 million, respectively, effective January 1, 2014 through December 31, 2015. On June 11, 2014, the FERC granted authorization to allow NSTAR Electric to issue total short-term debt securities in an aggregate principal amount not to exceed $655 million outstanding at any one time, effective October 24, 2014 through October 23, 2016.
PSNH is authorized by regulation of the NHPUC to incur short-term borrowings up to 10 percent of net fixed plant plus an additional $60 million until further ordered by the NHPUC. As of December 31, 2014, PSNH's short-term debt authorization under the 10 percent of net fixed plant test plus $60 million totaled approximately $306 million.
CL&P's certificate of incorporation contains preferred stock provisions restricting the amount of unsecured debt that CL&P may incur, including limiting unsecured indebtedness with a maturity of less than 10 years to 10 percent of total capitalization. As of December 31, 2014, CL&P had $432.1 million of unsecured debt capacity available under this authorization.
Yankee Gas and NSTAR Gas are not required to obtain approval from any state or federal authority to incur short-term debt.
Credit Agreements and Commercial Paper Programs: NU parent, CL&P, PSNH, WMECO, NSTAR Gas and Yankee Gas are parties to a five-year $1.45 billion revolving credit facility. The revolving credit facility is to be used primarily to backstop NU parent's $1.45 billion commercial paper

72
program. The commercial paper program allows NU parent to issue commercial paper as a form of short-term debt. Effective July 23, 2014, NU parent, CL&P, PSNH, WMECO, NSTAR Gas and Yankee Gas extended the expiration date of their joint revolving credit facility for one additional year to September 6, 2019. CL&P has a borrowing sublimit of $600 million and PSNH and WMECO each have borrowing sublimits of $300 million. As of December 31, 2014 and 2013, NU had approximately $1.1 billion and $1.01 billion, respectively, in short-term borrowings outstanding under the NU parent commercial paper program, leaving $348.9 million and $435.5 million of available borrowing capacity as of December 31, 2014 and 2013, respectively. The weighted-average interest rate on these borrowings as of December 31, 2014 and 2013 was 0.43percent and 0.24 percent, respectively, which is generally based on A2/P2 rated commercial paper. As of December 31, 2014, there were intercompany loans from NU of $133.4 million to CL&P, $90.5 million to PSNH and $21.4 million to WMECO. As of December 31, 2013, there were intercompany loans from NU of $287.3 million to CL&P and $86.5 million to PSNH.
NSTAR Electric has a five-year $450 million revolving credit facility. This facility serves to backstop NSTAR Electric's existing $450 million commercial paper program. Effective July 23, 2014, NSTAR Electric extended the expiration date of its revolving credit facility for one additional year to September 6, 2019. As of December 31, 2014 and 2013, NSTAR Electric had $302 million and $103.5 million, respectively, in short-term borrowings outstanding under its commercial paper program, leaving $148 million and $346.5 million of available borrowing capacity as of December 31, 2014 and 2013, respectively. The weighted-average interest rate on these borrowings as of December 31, 2014 and 2013 was 0.27percent and 0.13 percent, respectively, which is generally based on A2/P1 rated commercial paper.
Except as described below, amounts outstanding under the commercial paper programs are included in Notes Payable for NU and NSTAR Electric and classified in current liabilities on the balance sheets as all borrowings are outstanding for no more than 364 days at one time. Intercompany loans from NU to CL&P, PSNH and WMECO are included in Notes Payable to NU Parent and classified in current liabilities on the balance sheets. Intercompany loans from NU to CL&P, PSNH and WMECO are eliminated in consolidation in NU's balance sheets.
On January 15, 2015, NU parent issued $150 million of 1.60 percent Series G Senior Notes due to mature in 2018 and $300 million of 3.15 percent Series H Senior Notes, due to mature in 2025. The proceeds, net of issuance costs, were used to repay short-term borrowings outstanding under the NU commercial paper program. As the debt issuances refinanced short-term debt, the short-term debt was classified as Long-Term Debt as of December 31, 2014. On January 2, 2014, Yankee Gas issued $100 million of Series L First Mortgage Bonds and $25 million of the proceeds was used to repay short-term borrowings outstanding under the NU commercial paper program. As the debt issuance refinanced short-term debt, these amounts were classified as Long-Term Debt on NU's balance sheet as of December 31, 2013. See Note 8, "Long-Term Debt" for further information on these debt issuances.
Under the credit facilities, NU and its subsidiaries must comply with certain financial and non-financial covenants, including a consolidated debt to total capitalization ratio. As of December 31, 2014 and 2013, NU and its subsidiaries were in compliance with these covenants. If NU or its subsidiaries were not in compliance with these covenants, an event of default would occur requiring all outstanding borrowings by such borrower to be repaid and additional borrowings by such borrower would not be permitted under its respective credit facility.
8. LONG-TERM DEBT
Details of long-term debt outstanding are as follows:
CL&P As of December 31,(Millions of Dollars) 2014 2013
First Mortgage Bonds:7.875% 1994 Series D due 2024 $ 139.8 $ 139.84.800% 2004 Series A due 2014 (1) - 150.05.750% 2004 Series B due 2034 130.0 130.05.000% 2005 Series A due 2015 100.0 100.05.625% 2005 Series B due 2035 100.0 100.06.350% 2006 Series A due 2036 250.0 250.05.375% 2007 Series A due 2017 150.0 150.05.750% 2007 Series B due 2037 150.0 150.05.750% 2007 Series C due 2017 100.0 100.06.375% 2007 Series D due 2037 100.0 100.05.650% 2008 Series A due 2018 300.0 300.05.500% 2009 Series A due 2019 250.0 250.02.500% 2013 Series A due 2023 400.0 400.04.300% 2014 Series A due 2044 (2) 250.0 -
Total First Mortgage Bonds 2,419.8 2,319.8Pollution Control Revenue Bonds:
4.375% Fixed Rate Tax Exempt due 2028 120.5 120.51.550% Fixed Rate Tax Exempt due 2031 (3) 62.0 62.0
Total Pollution Control Revenue Bonds 182.5 182.5Spent Nuclear Fuel Obligation 244.5 244.4Less Amounts due Within One Year (162.0) (150.0)Unamortized Premiums and Discounts, Net (4.8) (5.5)CL&P Long-Term Debt $ 2,680.0 $ 2,591.2

73
NSTAR Electric As of December 31,
(Millions of Dollars) 2014 2013
Debentures:
4.875% due 2014 (4) $ - $ 300.0
5.750% due 2036 200.0 200.05.625% due 2017 400.0 400.05.500% due 2040 300.0 300.02.375% due 2022 400.0 400.0Variable Rate due 2016 (5) 200.0 200.04.400% due 2044 (4) 300.0 -
Total Debentures 1,800.0 1,800.0Bonds:
7.375% Tax Exempt Sewage Facility Revenue Bonds, due 2015 4.7 6.4Total Bonds 4.7 6.4Less Amounts due Within One Year (4.7) (301.7)Unamortized Premiums and Discounts, Net (7.3) (5.3)NSTAR Electric Long-Term Debt $ 1,792.7 $ 1,499.4
PSNH As of December 31,
(Millions of Dollars) 2014 2013
First Mortgage Bonds:5.25% Series L due 2014 (6) $ - $ 50.05.60% Series M due 2035 50.0 50.06.15% Series N due 2017 70.0 70.0
6.00% Series O due 2018 110.0 110.0
4.50% Series P due 2019 150.0 150.0
4.05% Series Q due 2021 122.0 122.0
3.20% Series R due 2021 160.0 160.0
3.50% Series S due 2023 (7) 325.0 250.0
Total First Mortgage Bonds 987.0 962.0
Pollution Control Revenue Bonds:
Adjustable Rate Tax Exempt Series A due 2021 89.3 89.3
Total Pollution Control Revenue Bonds 89.3 89.3
Less Amounts due Within One Year - (50.0)
Unamortized Premiums and Discounts, Net - (2.3)
PSNH Long-Term Debt $ 1,076.3 $ 999.0
WMECO As of December 31,(Millions of Dollars) 2014 2013
Notes:5.90% Senior Notes Series B, due 2034 $ 50.0 $ 50.05.24% Senior Notes Series C, due 2015 50.0 50.06.70% Senior Notes Series D, due 2037 40.0 40.05.10% Senior Notes Series E, due 2020 95.0 95.03.50% Senior Notes Series F, due 2021 250.0 250.03.88% Senior Notes Series G, due 2023 80.0 80.0
Total Notes 565.0 565.0Spent Nuclear Fuel Obligation 57.4 57.3Less Amounts due Within One Year (50.0) - Unamortized Premiums and Discounts, Net 6.1 7.1WMECO Long-Term Debt $ 578.5 $ 629.4

74
OTHER As of December 31,
(Millions of Dollars) 2014 2013
Yankee Gas - First Mortgage Bonds:8.48% Series B due 2022 $ 20.0 $ 20.04.80% Series G due 2014 (8) - 75.05.26% Series H due 2019 50.0 50.05.35% Series I due 2035 50.0 50.06.90% Series J due 2018 100.0 100.04.87% Series K due 2020 50.0 50.04.82% Series L due 2044 (8) 100.0 -
Total First Mortgage Bonds 370.0 345.0Unamortized Premium 0.6 0.7Yankee Gas Long-Term Debt 370.6 345.7
NSTAR Gas - First Mortgage Bonds:9.95% Series J due 2020 25.0 25.07.11% Series K due 2033 35.0 35.07.04% Series M due 2017 25.0 25.04.46% Series N due 2020 125.0 125.0
NSTAR Gas Long-Term Debt 210.0 210.0
Other - Notes and Debentures:1.45% Senior Notes Series E due 2018 (NU Parent) 300.0 300.02.80% Senior Notes Series F due 2023 (NU Parent) 450.0 450.04.50% Debentures due 2019 (NU Parent) 350.0 350.0NU Commercial Paper Borrowings(8) (9) 446.3 25.0Spent Nuclear Fuel Obligation (CYAPC) 179.4 179.4
Total Other Notes and Debentures 1,725.7 1,304.4Fair Value Adjustment (10) 202.3 230.7Less Amounts due Within One Year - - Less Fair Value Adjustment - Current Portion (10) (28.9) (31.7)Unamortized Premiums and Discounts, Net (1.2) (1.3)Total Other Long-Term Debt $ 2,478.5 $ 2,057.8
Total NU Long-Term Debt $ 8,606.0 $ 7,776.8
(1) On September 15, 2014, CL&P repaid at maturity the $150 million of 4.80 percent 2004 Series A First Mortgage Bonds, using short-term borrowings.
(2) On April 24, 2014, CL&P issued $250 million of 4.30 percent 2014 Series A First Mortgage Bonds, due to mature in 2044. The proceeds, net of issuance costs, were used to repay short-term borrowings.
(3) On February 12, 2015, CL&P notified the trustee that it intends to purchase and cancel the bonds on April 1, 2015, after they have been tendered by the bondholders.
(4) On March 7, 2014, NSTAR Electric issued $300 million of 4.40 percent debentures, due to mature in 2044. The proceeds, net of issuance costs, were used to repay the $300 million of 4.875 percent debentures that matured on April 15, 2014.
(5) As of December 31, 2014 and 2013, the interest rate was 0.4721 percent and 0.478 percent, respectively.
(6) On July 15, 2014, PSNH repaid at maturity the $50 million of 5.25 percent Series L First Mortgage Bonds using short-term borrowings.
(7) On October 14, 2014, PSNH issued $75 million of first mortgage bonds at a yield of 3.144 percent due to mature in 2023. The first mortgage bonds are part of the same series of PSNH's existing 3.50 percent Series S First Mortgage Bonds that were initially issued in November 2013. The proceeds, net of issuance costs, were used to repay short-term borrowings.
(8) On January 2, 2014, Yankee Gas issued $100 million of 4.82 percent Series L First Mortgage Bonds, due to mature in 2044. The proceeds, net of issuance costs, were used to repay the $75 million 4.80 percent Series G First Mortgage Bonds that matured on January 1, 2014 and to pay $25 million in short-term borrowings. As the debt issuance refinanced short-term debt, these amounts were classified as Long-Term Debt on NU's balance sheet as of December 31, 2013.
(9) On January 15, 2015, NU parent issued $150 million of 1.60 percent Series G Senior Notes due to mature in 2018 and $300 million of 3.15 percent Series H Notes, due to mature in 2025. The proceeds, net of issuance costs, were used to repay short-term borrowings outstanding under the NU commercial paper program. As the debt issuances refinanced short-term debt, the short-term debt was classified as Long-Term Debt as of December 31, 2014.
(10) Amount relates to the purchase price adjustment required to record the NSTAR long-term debt at fair value on the date of the merger.

75
Long-term debt maturities, mandatory tender payments and cash sinking fund requirements on debt outstanding for the years 2015 through 2019 and thereafter are shown below. These amounts exclude the spent nuclear fuel obligation, net unamortized premiums and discounts, and other fair value adjustments as of December 31, 2014:
(Millions of Dollars) NU CL&P NSTAR Electric PSNH WMECO
2015 $ 216.7 $ 162.0 $ 4.7 $ - $ 50.02016 200.0 - 200.0 - - 2017 745.0 250.0 400.0 70.0 - 2018 810.0 300.0 - 110.0 - 2019 800.0 250.0 - 150.0 - Thereafter 4,956.6 1,640.3 1,200.0 746.3 515.0Total $ 7,728.3 $ 2,602.3 $ 1,804.7 $ 1,076.3 $ 565.0
The utility plant of CL&P, PSNH, Yankee Gas and NSTAR Gas is subject to the lien of each company's respective first mortgage bond indenture. The NSTAR Electric, WMECO and NU parent debt is unsecured.
CL&P's obligation to repay each series of PCRBs is secured by first mortgage bonds. Each such series of first mortgage bonds contains similar terms and provisions as the applicable series of PCRBs. If CL&P fails to meet its obligations under the first mortgage bonds, then the holder of the first mortgage bonds (the issuer of the PCRBs) would have rights under the first mortgage bonds. CL&P's $62 million tax-exempt PCRBs, which aresubject to mandatory tender for purchase on April 1, 2015 and carry a coupon rate of 1.55 percent during the current three-year fixed rate period, cannot be redeemed prior to its tender date. CL&P's $120.5 million tax-exempt PCRBs will be subject to redemption at par on or after September 1, 2021. All other long-term debt securities are subject to make-whole provisions.
PSNH's obligation to repay the PCRBs is secured by first mortgage bonds and bond insurance. The first mortgage bonds contain similar terms and provisions as the PCRBs. If PSNH fails to meet its obligations under the first mortgage bonds, then the holder of the first mortgage bonds (the issuer of the PCRBs) would have rights under the first mortgage bonds. The PSNH Series A tax-exempt PCRBs are currently callable at 100 percent of par. The PCRBs bear interest at a rate that is periodically set pursuant to auctions. PSNH is not obligated to purchase these PCRBs, which mature in 2021, from the remarketing agent. As of December 31, 2014 and 2013, the interest rate was 0.175 percent and 0.088 percent, respectively.
The long-term debt agreements provide that NU and certain of its subsidiaries must comply with certain covenants as are customarily included in such agreements, including a minimum equity requirement for NSTAR Gas. Under the minimum equity requirement, the outstanding long-term debt of NSTAR Gas must not exceed equity.
Yankee Gas has certain long-term debt agreements that contain cross-default provisions. No other debt issuances contain cross-default provisions as of December 31, 2014.
On August 27, 2014, PURA approved CL&P's request to extend the authorization period for issuance of up to $366.4 million in long-term debt from December 31, 2014 to December 31, 2015.
On October 3, 2014, FERC granted authorization to allow NPT to issue short-term and long-term debt securities in an aggregate amount not to exceed $500 million outstanding at any one time, effective December 31, 2014 through December 31, 2016.
On November 26, 2014, PURA approved Yankee Gas' request to extend the authorization period for issuance of up to $200 million in long-term debt from December 31, 2014 to December 31, 2015.
On January 12, 2015, NSTAR Gas filed an application with the DPU requesting authorization to issue up to $100 million in long-term debt for the period ending December 31, 2015.
Spent Nuclear Fuel Obligation: Under the Nuclear Waste Policy Act of 1982, CL&P and WMECO must pay the DOE for the costs of disposal of spent nuclear fuel and high-level radioactive waste for the period prior to the sale of their ownership shares in the Millstone nuclear power stations. The Millstone Nuclear Generating station was made up of Millstone 1, Millstone 2, and Millstone 3 and all three units were sold in March 2001.
The DOE is responsible for the selection and development of repositories for, and the disposal of, spent nuclear fuel and high-level radioactive waste. For nuclear fuel used to generate electricity prior to April 7, 1983 (Prior Period Spent Nuclear Fuel) for CL&P and WMECO, an accrual has been recorded for the full liability, and payment must be made by CL&P and WMECO to the DOE prior to the first delivery of spent fuel to the DOE. After the sale of Millstone, CL&P and WMECO remained responsible for their share of the disposal costs associated with the Prior Period Spent Nuclear Fuel. Until such payment to the DOE is made, the outstanding liability will continue to accrue interest at the 3-month Treasury bill yield rate. In addition, as a result of consolidating CYAPC, NU has consolidated $179.4 million in additional spent nuclear fuel obligations, including interest, as of both December 31, 2014 and 2013. The obligation due to the DOE for the disposal of CL&P's and WMECO's Prior Period Spent Nuclear Fuel and CYAPC's spent nuclear fuel obligation include accumulated interest costs of $350.4 million and $350.3 million ($178 million and $177.9 million for CL&P and $41.8 million and $41.7 million for WMECO) as of December 31, 2014 and 2013, respectively.
WMECO and CYAPC maintain trusts to fund amounts due to the DOE for the disposal of spent nuclear fuel. For further information on these trusts, see Note 5, "Marketable Securities," to the financial statements.

76
9. EMPLOYEE BENEFITS
A. Pension Benefits and Postretirement Benefits Other Than PensionsAs of December 31, 2014, NUSCO sponsored two defined benefit retirement plans that covered eligible employees, including employees of CL&P, NSTAR Electric, PSNH and WMECO (NUSCO Pension Plan and NSTAR Pension Plan). Effective January 1, 2015, the two plans were merged into one plan, sponsored by NUSCO. The NUSCO and NSTAR Pension Plans are subject to the provisions of ERISA, as amended by the PPA of 2006. NU's policy is to annually fund the Pension Plans in an amount at least equal to an amount that will satisfy federal requirements. In addition, NU maintains non-qualified defined benefit retirement plans sponsored by NUSCO (herein collectively referred to as the SERP Plans), which provide benefits in excess of Internal Revenue Code limitations to eligible current and retired participants.
As of December 31, 2014, NUSCO also sponsored defined benefit postretirement plans that provide certain retiree benefits, primarily medical, dental and life insurance, to retiring employees that meet certain age and service eligibility requirements (NUSCO PBOP Plans and NSTAR PBOP Plan). Effective January 1, 2015, the plans were merged into one plan, sponsored by NUSCO. Under certain circumstances, eligible retirees are required to contribute to the costs of postretirement benefits. The benefits provided under the PBOP Plans are not vested and the Company has the right to modify any benefit provision subject to applicable laws at that time.
Because the Regulated companies recover the retiree benefit costs from customers through rates, regulatory assets are recorded in lieu of an adjustment to Accumulated Other Comprehensive Income/(Loss) to record the funded status of the Pension, SERP and PBOP Plans. Regulatory accounting was also applied to the portions of the NUSCO costs that support the Regulated companies, as these costs are also recovered from customers. Adjustments to the Pension and PBOP funded status for the unregulated companies are recorded on an after-tax basis to Accumulated Other Comprehensive Income/(Loss). For further information, see Note 2, "Regulatory Accounting," and Note 14, "Accumulated Other Comprehensive Income/(Loss)," to the financial statements. The SERP Plans do not have plan assets.
For the years ended December 31, 2014 and 2013, the expected return on plan assets for the NUSCO Pension and PBOP Plans was calculated by applying the assumed rate of return to a four-year rolling average of plan asset fair values. This calculation recognized investment gains or losses over a four-year period from the years in which they occurred. Investment gains or losses for this purpose are the difference between the calculated expected return and the actual return. As investment gains and losses are reflected in the average plan asset fair values, they are subject to amortization with other unrecognized actuarial gains or losses. For the NSTAR Pension and PBOP Plans, the entire difference between the actual return and calculated expected return on plan assets is reflected as a component of unrecognized actuarial gain or loss. Unrecognized actuarial gains or losses are amortized as a component of Pension and PBOP expense over the estimated average future employee service period.
Pension and SERP Plans: As of December 31, 2013, the funded status of the NSTAR Pension Plan was recorded on NSTAR Electric's balance sheet, while the total SERP obligation was recorded on NSTAR Electric & Gas' balance sheet. As of December 31, 2013, all NSTAR employees were employed by NSTAR Electric & Gas. On January 1, 2014, NSTAR Electric & Gas was merged into NUSCO (service company merger) and, concurrently, all employees were transferred to the company they predominantly provide services for: NUSCO, NSTAR Electric or NSTAR Gas. As a result of the employee transfers, the pension and SERP assets and liabilities were attributed by participant and transferred to the applicable company's balance sheets. This change had no impact on the income statement or net assets of NSTAR Electric or NU. For the year ended December 31, 2014, the NUSCO and NSTAR pension and SERP plans are accounted for under the multiple-employer approach, with each company's balance sheet reflecting its share of the funded status of the plans. The following tables provide information on the Pension and SERP Plan benefit obligations, fair values of Pension Plan assets, and funded status:
Pension and SERP
NU As of December 31,
(Millions of Dollars) 2014 2013
Change in Benefit ObligationBenefit Obligation as of Beginning of Year $ (4,676.5) $ (5,022.8)Service Cost (79.9) (102.3)Interest Cost (225.7) (206.7)Actuarial Gain/(Loss) (739.6) 433.6Benefits Paid - Pension 230.3 216.6Benefits Paid - SERP 5.2 5.1
Benefit Obligation as of End of Year $ (5,486.2) $ (4,676.5)
Change in Pension Plan AssetsFair Value of Plan Assets as of Beginning of Year $ 3,985.9 $ 3,411.3Employer Contributions 171.6 284.7Actual Return on Plan Assets 199.3 506.5Benefits Paid (230.3) (216.6)
Fair Value of Plan Assets as of End of Year $ 4,126.5 $ 3,985.9Funded Status as of December 31st $ (1,359.7) $ (690.6)

77
Pension and SERP
As of December 31, 2014 As of December 31, 2013
NSTAR NSTAR(Millions of Dollars) CL&P Electric PSNH WMECO CL&P Electric (1) PSNH WMECO
Change in Benefit ObligationBenefit Obligation as of Beginning of Year $ (1,083.4) $ (1,353.3) $ (529.0) $ (223.9) $ (1,178.0) $ (1,430.0) $ (576.0) $ (243.1)Decrease due to transfer of employees 26.4 479.9 32.2 6.2 - - - - Service Cost (20.2) (13.6) (9.7) (3.5) (24.9) (33.1) (13.1) (4.7)Interest Cost (50.5) (41.3) (23.8) (10.3) (48.3) (58.0) (23.6) (10.0)Actuarial Gain/(Loss) (161.0) (107.0) (73.3) (29.8) 110.7 96.6 62.4 22.4Benefits Paid - Pension 58.3 52.4 22.8 11.9 56.6 71.2 21.1 11.5Benefits Paid - SERP 0.3 0.3 0.1 - 0.5 - 0.2 -
Benefit Obligation as of End of Year $ (1,230.1) $ (982.6) $ (580.7) $ (249.4) $ (1,083.4) $ (1,353.3) $ (529.0) $ (223.9)
Change in Pension Plan AssetsFair Value of Plan Assets as of Beginning of Year $ 1,016.3 $ 1,235.3 $ 528.6 $ 240.4 $ 937.6 $ 1,069.1 $ 386.6 $ 218.5Decrease due to transfer of employees (26.4) (441.4) (32.2) (6.2) - - - - Employer Contributions - 101.0 - - - 82.0 108.3 - Actual Return on Plan Assets 49.2 36.5 24.8 11.7 135.3 155.4 54.8 33.4Benefits Paid (58.3) (52.4) (22.8) (11.9) (56.6) (71.2) (21.1) (11.5)
Fair Value of Plan Assets as of End of Year $ 980.8 $ 879.0 $ 498.4 $ 234.0 $ 1,016.3 $ 1,235.3 $ 528.6 $ 240.4
Funded Status as of December 31st $ (249.3) $ (103.6) $ (82.3) $ (15.4) $ (67.1) $ (118.0) $ (0.4) $ 16.5
(1) NSTAR Electric amounts do not include benefit obligations of the NSTAR SERP Plan as of December 31, 2013.
During 2014, the Society of Actuaries released a series of updated mortality tables resulting from recent studies that measured mortality rates forvarious groups of individuals. The updated mortality tables released in 2014 increased life expectancy of plan participants by 3 to 5 years and have the effect of increasing the estimate of benefits to be provided to plan participants. The impact of this adoption on NU's funded status liability for the year ended December 31, 2014 was an increase of approximately $340 million. In addition, the decreases in the discount rates resulted in an increase on NU's funded status liability of approximately $530 million. Partially offsetting these increases are the impact of other actuarial assumptions.
As of December 31, 2013, prepaid pension assets for PSNH and WMECO were included in Other Long-Term Assets on their accompanying balance sheets. The pension and SERP benefits funded status includes the current portion of the SERP liability, which is included in Other Current Liabilities on the accompanying balance sheets. Although NU maintains marketable securities in a supplemental benefit trust, the SERP plan itself does not contain any assets. See Note 5, "Marketable Securities," to the financial statements.
The accumulated benefit obligation for the Pension and SERP Plans is as follows:
(Millions of Dollars) NU CL&P NSTAR Electric (1) PSNH WMECO
2014 $ 5,000.1 $ 1,101.4 $ 910.4 $ 524.5 $ 226.42013 4,538.8 1,058.0 1,280.6 520.1 220.6
(1) NSTAR Electric amounts do not include the accumulated benefit obligation for the SERP Plan as of December 31, 2013.
The following actuarial assumptions were used in calculating the Pension and SERP Plans' year end funded status:
Pension and SERP
As of December 31,
2014 2013
Discount Rate 4.20 % 4.85 % - 5.03 %Compensation/Progression Rate 3.50 % 3.50 % - 4.00 %
Pension and SERP Expense: NU charges net periodic pension expense to its subsidiaries based on the actual participant demographic data for each subsidiary's participants. Benefit payments to participants and contributions are also tracked for each subsidiary. The actual investment return in the trust is allocated to each of the subsidiaries annually in proportion to the investment return expected to be earned during the year. For the years ended December 31, 2013 and 2012 (prior to the service company merger), the net periodic pension expense recorded at NSTAR Electric represented the full cost of the plan with a portion of the costs allocated to affiliated companies based on participant demographic data.

78
The components of net periodic benefit expense for the Pension and SERP Plans are shown below. The net periodic benefit expense and the intercompany allocations less the capitalized portion of pension is included in Operations and Maintenance on the statements of income. Capitalized pension amounts relate to employees working on capital projects and are included in Property, Plant and Equipment, Net. Intercompany allocations are not included in the CL&P, NSTAR Electric, PSNH and WMECO net periodic benefit expense amounts. Pension and SERP expense reflected in the statements of cash flows for CL&P, NSTAR Electric, PSNH and WMECO does not include the intercompany allocations and the corresponding capitalized portion, as these amounts are cash settled on a short-term basis.
Pension and SERP
For the Year Ended December 31, 2014
NSTAR
(Millions of Dollars) NU CL&P Electric PSNH WMECO
Service Cost $ 79.9 $ 20.2 $ 13.6 $ 9.7 $ 3.5Interest Cost 225.7 50.5 41.3 23.8 10.3Expected Return on Plan Assets (310.8) (75.4) (63.0) (38.1) (17.9)Actuarial Loss 128.4 33.7 23.5 11.6 6.9Prior Service Cost 4.4 1.8 - 0.7 0.4Total Net Periodic Benefit Expense $ 127.6 $ 30.8 $ 15.4 $ 7.7 $ 3.2Intercompany Allocations N/A $ 26.7 $ 10.4 $ 7.6 $ 5.1Capitalized Pension Expense $ 35.2 $ 17.6 $ 7.9 $ 3.0 $ 2.4
Pension and SERP
For the Year Ended December 31, 2013
NSTAR(Millions of Dollars) NU CL&P Electric (1) PSNH WMECO
Service Cost $ 102.3 $ 24.9 $ 33.1 $ 13.1 $ 4.7Interest Cost 206.7 48.3 58.0 23.6 10.0Expected Return on Plan Assets (278.1) (73.8) (84.4) (35.4) (17.4)Actuarial Loss 210.5 55.9 58.1 21.6 11.8Prior Service Cost/(Credit) 4.0 1.8 (0.3) 0.7 0.4Total Net Periodic Benefit Expense $ 245.4 $ 57.1 $ 64.5 $ 23.6 $ 9.5Intercompany Allocations N/A $ 44.9 $ (8.4) $ 10.5 $ 8.0Capitalized Pension Expense $ 73.2 $ 28.0 $ 28.9 $ 7.3 $ 5.2
Pension and SERP
For the Year Ended December 31, 2012
NSTAR(Millions of Dollars) NU (2) CL&P Electric (1) PSNH WMECO
Service Cost $ 84.3 $ 21.8 $ 30.3 $ 11.8 $ 4.1Interest Cost 198.3 51.2 58.9 24.4 10.5Expected Return on Plan Assets (220.9) (70.6) (65.6)� (28.2) (16.4)Actuarial Loss 172.4 49.6 63.1 16.2 10.7Prior Service Cost/(Credit) 7.9 3.6 (0.6) 1.5 0.8Total Net Periodic Benefit Expense $ 242.0 $ 55.6 $ 86.1 $ 25.7 $ 9.7Curtailments and Settlements $ 2.2 $ - $ - $ - $ -Intercompany Allocations N/A $ 42.8 $ (12.3) $ 10.1 $ 8.1Capitalized Pension Expense $ 70.6 $ 26.8 $ 30.7 $ 7.9 $ 5.1
(1) NSTAR Electric's allocated expense associated with the NSTAR SERP was $3.2 million and $3.6 million for the years ended December 31, 2013 and 2012, respectively, and were not included in the NSTAR Electric amounts in the tables above. For the year ended December 31, 2014, the SERP amounts are now allocated to NSTAR Electric due to the service company merger.
(2) NSTAR amounts were included in NU beginning April 10, 2012.
The following actuarial assumptions were used to calculate Pension and SERP expense amounts:
Pension and SERP
For the Years Ended December 31,
2014 2013 2012
Discount Rate 4.85 % - 5.03 % 4.13 % - 4.24 % 4.52 % - 5.03 %Expected Long-Term Rate of Return 8.25 % 8.25 % 7.30 % - 8.25 %Compensation/Progression Rate 3.50 % - 4.00 % 3.50 % - 4.00 % 3.50 % - 4.00 %

79
The following is a summary of the changes in plan assets and benefit obligations recognized in Regulatory Assets and Other Comprehensive Income (OCI) as well as amounts in Regulatory Assets and OCI reclassified as net periodic benefit expense during the years presented:
Amounts Reclassified To/From
Regulatory Assets OCI
For the Years Ended December 31,
(Millions of Dollars) 2014 2013 2014 2013
Actuarial (Gains)/Losses Arising During the Year $ 797.3 $ (635.2) $ 55.9 $ (28.9)Actuarial Losses Reclassified as Net Periodic Benefit Expense (122.8) (201.2) (5.6) (9.4)Prior Service Cost Reclassified as Net Periodic Benefit Expense (4.2) (3.8) (0.2) (0.2)
The following is a summary of the remaining Regulatory Assets and Accumulated Other Comprehensive Loss amounts that have not been recognized as components of net periodic benefit expense as of December 31, 2014 and 2013, and the amounts that are expected to be recognized as components in 2015:
Regulatory Assets as of Expected AOCI as of ExpectedDecember 31, 2015 December 31, 2015
(Millions of Dollars) 2014 2013 Expense 2014 2013 Expense
Actuarial Loss $ 1,811.9 $ 1,137.4 $ 149.1 $ 93.5 $ 43.2 $ 6.4Prior Service Cost 13.2 17.4 3.5 0.8 1.0 0.2
PBOP Plans: As of December 31, 2013, the funded status of the NSTAR PBOP Plan was recorded on the NSTAR Electric & Gas balance sheet. As of December 31, 2013, all NSTAR employees were employed by NSTAR Electric & Gas. On January 1, 2014, concurrent with the service company merger, the PBOP assets and liabilities were attributed by participant and transferred to the applicable company's balance sheets. This change had no impact on the income statement or net assets of NSTAR Electric or NU. For the year ended December 31, 2014, the NUSCO and NSTAR PBOP Plans are accounted for under the multiple-employer approach, with each company's balance sheet reflecting its share of the funded status of the plans.
NU annually funds postretirement costs through tax deductible contributions to external trusts.
The following tables provide information on PBOP Plan benefit obligations, fair values of plan assets, and funded status:
PBOP
NU As of December 31,
(Millions of Dollars) 2014 2013
Change in Benefit ObligationBenefit Obligation as of Beginning of Year $ (1,038.0) $ (1,233.3)Service Cost (12.5) (16.9)Interest Cost (49.5) (47.2)Actuarial Gain/(Loss) (95.5) 200.9Benefits Paid 47.6 58.5
Benefit Obligation as of End of Year $ (1,147.9) $ (1,038.0)
Change in PBOP Plan AssetsFair Value of Plan Assets as of Beginning of Year $ 826.5 $ 709.1Actual Return on Plan Assets 43.7 118.3Employer Contributions 40.0 57.6Benefits Paid (47.6) (58.5)
Fair Value of Plan Assets as of End of Year $ 862.6 $ 826.5Funded Status as of December 31st $ (285.3) $ (211.5)
PBOP
As of December 31,
2014 2013
NSTAR (Millions of Dollars) CL&P Electric PSNH WMECO CL&P PSNH WMECO
Change in Benefit ObligationBenefit Obligation as of Beginning of Year $ (180.4) $ - $ (93.5) $ (38.7) $ (196.8) $ (100.2) $ (42.5)Decrease/(Increase) due to transfer of employees 3.7 (395.5) 4.3 1.0 - - - Service Cost (2.2) (3.1) (1.3) (0.4) (3.4) (2.3) (0.7)Interest Cost (8.1) (19.4) (4.3) (1.7) (7.9) (4.0) (1.7)Actuarial Gain/(Loss) 3.5 (68.6) (1.1) 1.3 13.3 7.2 3.3Benefits Paid 9.6 17.9 4.1 1.9 14.4 5.8 2.9
Benefit Obligation as of End of Year $ (173.9) $ (468.7) $ (91.8) $ (36.6) $ (180.4) $ (93.5) $ (38.7)
Change in PBOP Plan AssetsFair Value of Plan Assets as of Beginning of Year $ 151.3 $ - $ 81.8 $ 35.3 $ 132.2 $ 69.5 $ 31.0(Decrease)/Increase due to transfer of employees (3.2) 316.7 (3.1) (1.0) - - - Actual Return on Plan Assets 6.3 18.4 3.8 1.6 24.8 13.4 6.0Employer Contributions 4.2 19.3 2.5 0.4 8.7 4.7 1.2Benefits Paid (9.6) (17.9) (4.1) (1.9) (14.4) (5.8) (2.9)
Fair Value of Plan Assets as of End of Year $ 149.0 $ 336.5 $ 80.9 $ 34.4 $ 151.3 $ 81.8 $ 35.3
Funded Status as of December 31st $ (24.9) $ (132.2) $ (10.9) $ (2.2) $ (29.1) $ (11.7) $ (3.4)
During 2014, the Society of Actuaries released a series of updated mortality tables resulting from recent studies that measured mortality rates for various groups of individuals. The updated mortality tables released in 2014 increased life expectancy of plan participants by 3 to 5 years and have the effect of increasing the estimate of benefits to be provided to plan participants. The impact of this adoption on NU's funded status liability for the

80
year ended December 31, 2014 was an increase of approximately $82 million. In addition, the decreases in the discount rates resulted in an increase on NU's funded status liability of approximately $110 million. Partially offsetting these increases are the impact of other actuarial assumptions.
The following actuarial assumptions were used in calculating the PBOP Plans' year end funded status:
PBOP
As of December 31,
2014 2013
Discount Rate 4.22 % 4.78 % - 5.10 %Health Care Cost Trend Rate 6.50 % 7.00 %
PBOP Expense: NU charges net periodic postretirement benefits expense to its subsidiaries based on the actual participant demographic data for each subsidiary's participants. Benefit payments to participants and contributions are also tracked for each subsidiary. The actual investment return in the trust each year is allocated to each of the subsidiaries annually in proportion to the investment return expected to be earned during the year. For the years ended December 31, 2013 and 2012 (prior to the service company merger), the net periodic postretirement expense of the NSTAR PBOP Plan allocated to NSTAR Electric was $4.6 million and $34.1 million, respectively.
The components of net periodic benefit expense for the PBOP Plans are shown below. The net periodic benefit expense and the intercompany allocations less the capitalized portion of PBOP is included in Operations and Maintenance on the statements of income. Capitalized PBOP amounts relate to employees working on capital projects and are included in Property, Plant and Equipment, Net. Intercompany allocations are not included in the CL&P, NSTAR Electric, PSNH and WMECO net periodic benefit expense amounts. PBOP expense reflected in the statements of cash flows for CL&P, NSTAR Electric, PSNH and WMECO does not include the intercompany allocations and the corresponding capitalized portion, as these amounts are cash settled on a short-term basis.
PBOP
For the Year Ended December 31, 2014
NSTAR(Millions of Dollars) NU CL&P Electric PSNH WMECO
Service Cost $ 12.5 $ 2.2 $ 3.1 $ 1.3 $ 0.4Interest Cost 49.5 8.1 19.4 4.3 1.7Expected Return on Plan Assets (63.3) (10.5) (25.9) (5.4) (2.3)Actuarial Loss/(Gain) 12.2 4.2 (0.5) 2.2 0.5Prior Service Credit (2.8) - (1.9) - -Total Net Periodic Benefit Expense/(Income) $ 8.1 $ 4.0 $ (5.8) $ 2.4 $ 0.3Intercompany Allocations N/A $ 3.8 $ 0.8 $ 1.0 $ 0.7Capitalized PBOP Expense/(Income) $ 1.4 $ 1.8 $ (2.3) $ 0.8 $ 0.2
PBOP
For the Year Ended December 31, 2013
(Millions of Dollars) NU CL&P PSNH WMECO
Service Cost $ 16.9 $ 3.4 $ 2.3 $ 0.7Interest Cost 47.2 7.9 4.0 1.7Expected Return on Plan Assets (55.4) (10.1) (5.2) (2.3)Actuarial Loss 26.0 7.4 3.6 1.1Prior Service Credit (2.1) - - -Total Net Periodic Benefit Expense $ 32.6 $ 8.6 $ 4.7 $ 1.2Intercompany Allocations N/A $ 7.1 $ 1.6 $ 1.3Capitalized PBOP Expense $ 8.8 $ 3.9 $ 1.3 $ 0.6
PBOP
For the Year Ended December 31, 2012
(Millions of Dollars) NU (1) CL&P PSNH WMECO
Service Cost $ 15.7 $ 3.0 $ 2.0 $ 0.6Interest Cost 49.0 9.2 4.6 2.0Expected Return on Plan Assets (39.2) (9.1) (4.6) (2.1)Actuarial Loss 36.0 7.5 3.6 1.2Prior Service Credit (1.4) - - -Net Transition Obligation Cost 12.2 6.1 2.5 1.3Total Net Periodic Benefit Expense $ 72.3 $ 16.7 $ 8.1 $ 3.0Intercompany Allocations N/A $ 7.9 $ 2.0 $ 1.5Capitalized PBOP Expense $ 26.6 $ 8.2 $ 2.3 $ 1.6
(1) NSTAR amounts were included in NU beginning April 10, 2012.

81
The following actuarial assumptions were used to calculate PBOP expense amounts:
PBOP
For the Years Ended December 31,
2014 2013 2012
Discount Rate 4.78 % - 5.10 % 4.04 % - 4.35 % 4.58 % - 4.84 %Expected Long-Term Rate of Return 8.25 % 8.25 % 7.30 % - 8.25 %
As of December 31, 2014 and 2013, the health care cost trend rate assumption used to determine the PBOP Plans' funded status was 6.5 percent and7 percent, respectively, subsequently decreasing to an ultimate rate of 4.5 percent in 2023. The health care cost trend rate assumption used to calculate the PBOP expense amounts was 7 percent for the year ended December 31, 2014.
Assumed health care cost trend rates have a significant effect on the amounts reported for the health care plans. The effect of changing the assumed health care cost trend rate by one percentage point for the year ended December 31, 2014 would have the following effects:
One Percentage One Percentage(Millions of Dollars) Point Increase Point Decrease
Effect on PBOP Obligation $ 111.2 $ (88.4)Effect on Total Service and Interest Cost Components 5.3 (4.4)
The following is a summary of the changes in plan assets and benefit obligations recognized in Regulatory Assets and OCI as well as amounts in Regulatory Assets and OCI reclassified as net periodic benefit (expense)/income during the years presented:
Amounts Reclassified To/FromRegulatory Assets OCI
For the Years Ended December 31,
(Millions of Dollars) 2014 2013 2014 2013
Actuarial Losses/(Gains) Arising During the Year $ 115.1 $ (262.0) $ 0.4 $ (1.9)Actuarial Losses Reclassified as Net Periodic Benefit Expense (11.6) (24.9) (0.6) (1.1)Prior Service Credit Reclassified as Net Periodic Benefit Income 2.8 2.1 - -
The following is a summary of the remaining Regulatory Assets and Accumulated Other Comprehensive Loss amounts that have not been recognized as components of net periodic benefit expense as of December 31, 2014 and 2013, and the amounts that are expected to be recognized as components in 2015:
Regulatory Assets as of Expected AOCI as of ExpectedDecember 31, 2015 December 31, 2015
(Millions of Dollars) 2014 2013 Expense 2014 2013 Expense
Actuarial Loss $ 192.7 $ 89.2 $ 6.9 $ 6.0 $ 6.2 $ 0.3Prior Service Credit (1.8) (4.6) (0.5) - - -
Estimated Future Benefit Payments: The following benefit payments, which reflect expected future service, are expected to be paid by the Pension, SERP and PBOP Plans:
(Millions of Dollars) 2015 2016 2017 2018 2019 2020-2024
Pension and SERP $ 244.5 $ 253.6 $ 268.9 $ 273.4 $ 285.4 $ 1,591.1PBOP 58.7 59.7 60.6 61.3 62.0 318.8
Contributions: NU contributed $171.6 million to the Pension Plans in 2014, of which $101 million was contributed by NSTAR Electric. Based on the current status of the Pension Plans, NU expects to make contributions of approximately $155 million in 2015, of which $5 million will be contributed by NSTAR Electric and $1 million will be contributed by PSNH. The remaining $149 million is expected to be contributed by other NU subsidiaries, primarily NUSCO.
NU contributed $40 million to the PBOP Plans in 2014 and expects to make approximately $27 million in contributions in 2015. This amount will be funded into the 401(h) account and VEBAs up to the maximum tax-deductible level permitted.

82
Fair Value of Pension and PBOP Plan Assets: Pension and PBOP funds are held in external trusts. Trust assets, including accumulated earnings, must be used exclusively for Pension and PBOP payments. NU's investment strategy for its Pension and PBOP Plans is to maximize the long-term rates of return on these plans' assets within an acceptable level of risk. The investment strategy for each asset category includes a diversification of asset types, fund strategies and fund managers and establishes target asset allocations that are routinely reviewed and periodically rebalanced. PBOP assets are comprised of assets held in the PBOP Plans as well as specific assets within the defined benefit pension plan trust (401(h) assets). The investment policy and strategy of the 401(h) assets is consistent with those of the defined benefit pension plans. NU's expected long-term rates of return on Pension and PBOP Plan assets are based on target asset allocation assumptions and related expected long-term rates of return. In developing its expected long-term rate of return assumptions for the Pension and PBOP Plans, NU evaluated input from consultants, as well as long-term inflation assumptions and historical returns. For the year ended December 31, 2014, management has assumed long-term rates of return of 8.25 percent for the Pension and PBOP Plan assets. These long-term rates of return are based on the assumed rates of return for the target asset allocations as follows:
As of December 31, 2014 and 2013
Pension and Tax-Exempt PBOP Plans
Target Asset Allocation Assumed Rate of Return
Equity Securities:United States 24% 9%International 10% 9%Emerging Markets 6% 10%Private Equity 10% 13%
Debt Securities:Fixed Income 15% 5%High Yield Fixed Income 9% 7.5%Emerging Markets Debt 6% 7.5%
Real Estate and Other Assets 9% 7.5%Hedge Funds 11% 7%
The Taxable PBOP Plans have a target asset allocation of 70 percent equity securities and 30 percent fixed income securities.
The following table presents, by asset category, the Pension and PBOP Plan assets recorded at fair value on a recurring basis by the level in which they are classified within the fair value hierarchy:
NU Pension Plans Fair Value Measurements as of December 31,
(Millions of Dollars) 2014 2013
Asset Category: Level 1 Level 2 Level 3 Total Level 1 Level 2 Level 3 Total
Equity Securities (1) $ 414.7 $ 1,035.0 $ 292.2 $ 1,741.9 $ 326.8 $ 1,172.1 $ 255.5 $ 1,754.4Private Equity 18.8 - 367.9 386.7 96.4 - 300.3 396.7Fixed Income (2) 10.2 561.4 722.0 1,293.6 11.6 605.1 589.5 1,206.2Real Estate and Other Assets - 132.0 265.8 397.8 - 88.2 288.5 376.7Hedge Funds - 20.0 475.0 495.0 - - 416.9 416.9Total Master Trust Assets $ 443.7 $ 1,748.4 $ 2,122.9 $ 4,315.0 $ 434.8 $ 1,865.4 $ 1,850.7 $ 4,150.9
Less: 401(h) PBOP Assets (3) (188.5) (165.0)
Total Pension Assets $ 4,126.5 $ 3,985.9
NU PBOP Plans Fair Value Measurements as of December 31,
(Millions of Dollars) 2014 2013
Asset Category: Level 1 Level 2 Level 3 Total Level 1 Level 2 Level 3 Total
Cash and Cash Equivalents $ - $ - $ - $ - $ 11.1 $ - $ - $ 11.1Equity Securities (1) 104.1 172.8 75.1 352.0 110.3 176.8 69.1 356.2Private Equity - - 24.9 24.9 - - 17.9 17.9Fixed Income (2) 16.1 110.0 78.3 204.4 - 119.7 51.5 171.2Real Estate and Other Assets 19.4 15.0 34.4 - 14.2 33.9 48.1Hedge Funds - 58.4 58.4 - - 57.0 57.0Total $ 120.2 $ 302.2 $ 251.7 $ 674.1 $ 121.4 $ 310.7 $ 229.4 $ 661.5
Add: 401(h) PBOP Assets (3) 188.5 165.0Total PBOP Assets $ 862.6 $ 826.5
(1) United States, International and Emerging Markets equity securities classified as Level 2 include investments in commingled funds. Level 3 investments include hedge funds that are overlayed with equity index swaps and futures contracts and funds invested in equities that have redemption restrictions.
(2) Fixed Income investments classified as Level 3 investments include fixed income funds that invest in a variety of opportunistic fixed income strategies, and hedge funds that are overlayed with fixed income futures.
(3) The assets of the Pension Plans include a 401(h) account that has been allocated to provide health and welfare postretirement benefits under the PBOP Plans.
Effective January 1, 2013, the NSTAR Pension Plan assets were transferred into the NUSCO Pension Plan master trust. The NUSCO Pension Plan is entitled to approximately 66 percent of each asset category in the master trust, the NSTAR Pension Plan is entitled to approximately 30 percent of each asset category in the master trust and the 401(h) plans are entitled to approximately four percent of each asset category in the master trust. For the years ended December 31, 2014 and 2013 the NUSCO Pension Plan was entitled to $2,803.6 million and $2,750.4 million respectively and the
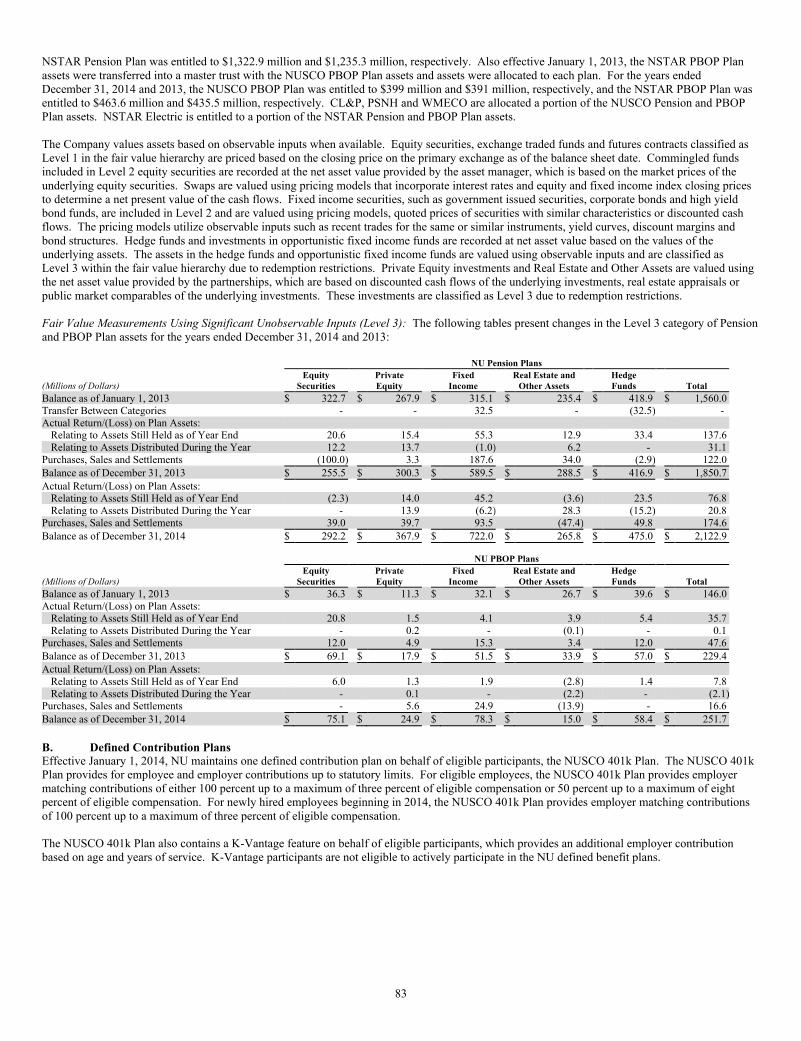
83
NSTAR Pension Plan was entitled to $1,322.9 million and $1,235.3 million, respectively. Also effective January 1, 2013, the NSTAR PBOP Plan assets were transferred into a master trust with the NUSCO PBOP Plan assets and assets were allocated to each plan. For the years ended December 31, 2014 and 2013, the NUSCO PBOP Plan was entitled to $399 million and $391 million, respectively, and the NSTAR PBOP Plan was entitled to $463.6 million and $435.5 million, respectively. CL&P, PSNH and WMECO are allocated a portion of the NUSCO Pension and PBOP Plan assets. NSTAR Electric is entitled to a portion of the NSTAR Pension and PBOP Plan assets.
The Company values assets based on observable inputs when available. Equity securities, exchange traded funds and futures contracts classified as Level 1 in the fair value hierarchy are priced based on the closing price on the primary exchange as of the balance sheet date. Commingled funds included in Level 2 equity securities are recorded at the net asset value provided by the asset manager, which is based on the market prices of the underlying equity securities. Swaps are valued using pricing models that incorporate interest rates and equity and fixed income index closing prices to determine a net present value of the cash flows. Fixed income securities, such as government issued securities, corporate bonds and high yield bond funds, are included in Level 2 and are valued using pricing models, quoted prices of securities with similar characteristics or discounted cash flows. The pricing models utilize observable inputs such as recent trades for the same or similar instruments, yield curves, discount margins and bond structures. Hedge funds and investments in opportunistic fixed income funds are recorded at net asset value based on the values of the underlying assets. The assets in the hedge funds and opportunistic fixed income funds are valued using observable inputs and are classified as Level 3 within the fair value hierarchy due to redemption restrictions. Private Equity investments and Real Estate and Other Assets are valued using the net asset value provided by the partnerships, which are based on discounted cash flows of the underlying investments, real estate appraisals or public market comparables of the underlying investments. These investments are classified as Level 3 due to redemption restrictions.
Fair Value Measurements Using Significant Unobservable Inputs (Level 3): The following tables present changes in the Level 3 category of Pension and PBOP Plan assets for the years ended December 31, 2014 and 2013:
NU Pension Plans
Equity Private Fixed Real Estate and Hedge(Millions of Dollars) Securities Equity Income Other Assets Funds Total
Balance as of January 1, 2013 $ 322.7 $ 267.9 $ 315.1 $ 235.4 $ 418.9 $ 1,560.0Transfer Between Categories - - 32.5 - (32.5) - Actual Return/(Loss) on Plan Assets:
Relating to Assets Still Held as of Year End 20.6 15.4 55.3 12.9 33.4 137.6Relating to Assets Distributed During the Year 12.2 13.7 (1.0) 6.2 - 31.1
Purchases, Sales and Settlements (100.0) 3.3 187.6 34.0 (2.9) 122.0Balance as of December 31, 2013 $ 255.5 $ 300.3 $ 589.5 $ 288.5 $ 416.9 $ 1,850.7Actual Return/(Loss) on Plan Assets:
Relating to Assets Still Held as of Year End (2.3) 14.0 45.2 (3.6) 23.5 76.8Relating to Assets Distributed During the Year - 13.9 (6.2) 28.3 (15.2) 20.8
Purchases, Sales and Settlements 39.0 39.7 93.5 (47.4) 49.8 174.6Balance as of December 31, 2014 $ 292.2 $ 367.9 $ 722.0 $ 265.8 $ 475.0 $ 2,122.9
NU PBOP Plans
Equity Private Fixed Real Estate and Hedge(Millions of Dollars) Securities Equity Income Other Assets Funds Total
Balance as of January 1, 2013 $ 36.3 $ 11.3 $ 32.1 $ 26.7 $ 39.6 $ 146.0Actual Return/(Loss) on Plan Assets:
Relating to Assets Still Held as of Year End 20.8 1.5 4.1 3.9 5.4 35.7Relating to Assets Distributed During the Year - 0.2 - (0.1) - 0.1
Purchases, Sales and Settlements 12.0 4.9 15.3 3.4 12.0 47.6Balance as of December 31, 2013 $ 69.1 $ 17.9 $ 51.5 $ 33.9 $ 57.0 $ 229.4Actual Return/(Loss) on Plan Assets:
Relating to Assets Still Held as of Year End 6.0 1.3 1.9 (2.8) 1.4 7.8Relating to Assets Distributed During the Year - 0.1 - (2.2) - (2.1)
Purchases, Sales and Settlements - 5.6 24.9 (13.9) - 16.6Balance as of December 31, 2014 $ 75.1 $ 24.9 $ 78.3 $ 15.0 $ 58.4 $ 251.7
B. Defined Contribution PlansEffective January 1, 2014, NU maintains one defined contribution plan on behalf of eligible participants, the NUSCO 401k Plan. The NUSCO 401k Plan provides for employee and employer contributions up to statutory limits. For eligible employees, the NUSCO 401k Plan provides employer matching contributions of either 100 percent up to a maximum of three percent of eligible compensation or 50 percent up to a maximum of eight percent of eligible compensation. For newly hired employees beginning in 2014, the NUSCO 401k Plan provides employer matching contributions of 100 percent up to a maximum of three percent of eligible compensation.
The NUSCO 401k Plan also contains a K-Vantage feature on behalf of eligible participants, which provides an additional employer contribution based on age and years of service. K-Vantage participants are not eligible to actively participate in the NU defined benefit plans.

84
The total defined contribution plan employer matching contributions, including the K-Vantage program contributions, were as follows:
NSTAR
(Millions of Dollars) NU (1) CL&P Electric PSNH WMECO
2014 $ 29.7 $ 5.0 $ 6.3 $ 3.2 $ 1.02013 37.0 5.1 8.5 3.3 1.02012 25.7 4.8 9.0 3.3 0.9
(1) NSTAR amounts were included in NU beginning April 10, 2012.
Allocations of NU common shares were made from NU treasury shares to satisfy the NUSCO 401k Plan obligation to provide 100 percent of the matching contribution in NU common shares. For treasury shares used to satisfy the NUSCO 401k Plan employer matching contributions, compensation expense is recognized equal to the fair value of shares that have been allocated to participants. Any difference between the fair value and the average cost of the allocated treasury shares is charged or credited to Capital Surplus, Paid In. For the years ended December 31, 2014, 2013 and 2012, NU recognized $22 million, $9.1 million and $8.9 million, respectively, of compensation expense related to treasury shares used to satisfy the matching contribution.
C. Share-Based Payments Share-based compensation awards are recorded using a fair-value-based method at the date of grant. NU, CL&P, NSTAR Electric, PSNH and WMECO record compensation expense related to these awards, as applicable, for shares issued or sold to their respective employees and officers, as well as the allocation of costs associated with shares issued or sold to NU's service company employees and officers that support CL&P, NSTAR Electric, PSNH and WMECO.
Upon consummation of the merger with NSTAR, the NSTAR 1997 Share Incentive Plan and the NSTAR 2007 Long-Term Incentive Plan were assumed by NU. Share-based awards granted under the NSTAR Plans and held by NSTAR employees and officers were generally converted into outstanding NU share-based compensation awards with an estimated fair value of $53.2 million. Refer to Note 21, "Merger of NU and NSTAR," for further information regarding the merger transaction. Specifically, as of the merger closing, and as adjusted by the exchange ratio, NU converted (1) outstanding NSTAR stock options into 2,664,894 NU stock options valued at $30.5 million, (2) NSTAR deferred shares and NSTAR performance shares into 421,775 NU RSU's valued at $15.5 million, and (3) NSTAR RSU retention awards into 195,619 NU RSU retention awards valued at $7.2 million.
NU Incentive Plans: NU maintains long-term equity-based incentive plans in which NU, CL&P, NSTAR Electric, PSNH and WMECO employees, officers and board members are eligible to participate. The incentive plans authorize NU to grant up to 8,000,000 new shares for various types of awards, including RSUs and performance shares, to eligible employees, officers, and board members. As of December 31, 2014 and 2013, NU had3,112,020 and 3,440,590 common shares, respectively, available for issuance under these plans. NU also maintains an ESPP for eligible employees.
NU accounts for its various share-based plans as follows:
RSUs - NU records compensation expense, net of estimated forfeitures, on a straight-line basis over the requisite service period based upon the fair value of NU's common shares at the date of grant. The par value of RSUs is reclassified to Common Stock from APIC as RSUs become issued as common shares.
Performance Shares - NU records compensation expense, net of estimated forfeitures, on a straight-line basis over the requisite service period. Performance shares vest based upon the extent to which Company goals are achieved. Vesting of outstanding performance shares is based upon both the Company's EPS growth over the requisite service period and the total shareholder return as compared to the Edison Electric Institute (EEI) Index during the requisite service period. The fair value of performance shares is determined at the date of grant using a lattice model.
Stock Options - Stock options issued under the NSTAR Incentive Plan that were outstanding immediately prior to the completion of the merger with NSTAR converted into fully vested options to acquire NU common shares, as adjusted by the exchange ratio. The fair value of these awards on the merger date was included in the purchase price as it represented consideration transferred in the merger. Accordingly, no compensation expense was recorded for these stock options.
ESPP Shares - For shares sold under the ESPP, no compensation expense was recorded as the ESPP qualifies as a non-compensatory plan.

85
RSUs: NU granted RSUs under the annual long-term incentive programs that are subject to three-year graded vesting schedules for employees, and one-year graded vesting schedules, or immediate vesting, for board members. RSUs are paid in shares, reduced by amounts sufficient to satisfy withholdings for income taxes, subsequent to vesting. A summary of RSU transactions is as follows:
Weighted AverageRSUs Grant-Date
(Units) Fair Value
Outstanding as of January 1, 2012 959,920 $ 26.36Granted 614,930 $ 33.04Converted NSTAR Awards upon Merger 617,394 $ 36.79Converted from NU Performance Shares upon Merger 451,358 $ 34.32Shares issued (363,779) $ 29.05Forfeited (96,504) $ 34.97
Outstanding as of December 31, 2012 2,183,319 $ 31.99Granted 373,939 $ 39.56Shares issued (891,129) $ 32.15Forfeited (29,689) $ 33.75
Outstanding as of December 31, 2013 1,636,440 $ 33.61Granted 338,576 $ 42.27Shares issued (567,209) $ 33.48Forfeited (27,060) $ 39.62
Outstanding as of December 31, 2014 1,380,747 $ 35.67
As of December 31, 2014 and 2013, the number and weighted average grant-date fair value of unvested RSUs was 1,024,729 and $38.14 per share, and 1,162,216 and $36.58 per share, respectively. The number and weighted average grant-date fair value of RSUs vested and either paid or deferredduring 2014 was 437,887 and $37.36 per share, respectively. As of December 31, 2014, 356,018 RSUs were fully vested and deferred and an additional 973,493 are expected to vest.
Performance Shares: NU granted performance shares under the annual long-term incentive programs that vest based upon the extent to whichCompany goals are achieved at the end of three-year performance measurement periods. Performance shares are paid in shares, after the performance measurement period. A summary of performance share transactions is as follows:
Performance Weighted AverageShares Grant-Date(Units) Fair Value
Outstanding as of January 1, 2012 483,133 $ 29.18Granted 225,935 $ 35.09Converted to RSUs upon Merger (451,358) $ 34.32Shares issued (106,773) $ 24.52
Outstanding as of December 31, 2012 150,937 $ 25.04Granted 191,961 $ 40.96Shares issued (150,944) $ 25.04Forfeited (1,526) $ 40.93Outstanding as of December 31, 2013 190,428 $ 40.96Granted 193,396 $ 43.40Shares issued (2,009) $ 41.46Forfeited (6,171) $ 42.02
Outstanding as of December 31, 2014 375,644 $ 42.20
Upon closing of the merger with NSTAR, 451,358 performance shares under the NU 2011 and 2012 Long-Term Incentive Programs converted to RSUs according to the terms of these programs. Performance shares under the NU 2010 Incentive Program were measured based upon a modified performance period through the date of the merger, in accordance with the terms of the program, and were fully distributed in 2013.
The total compensation expense and associated future income tax benefit recognized by NU, CL&P, NSTAR Electric, PSNH and WMECO for share-based compensation awards are as follows:
NU For the Years Ended December 31,
(Millions of Dollars) 2014 2013 2012 (1)
Compensation Expense $ 24.6 $ 27.0 $ 25.8Future Income Tax Benefit 10.3 10.7 10.2
For the Years Ended December 31,
2014 2013 2012
NSTAR NSTAR NSTAR(Millions of Dollars) CL&P Electric PSNH WMECO CL&P Electric PSNH WMECO CL&P Electric PSNH WMECO
Compensation Expense $ 8.1 $ 7.4 $ 3.0 $ 1.3 $ 6.8 $ 7.5 $ 2.3 $ 1.3 $ 4.8 $ 7.4 $ 1.8 $ 1.0Future Income Tax Benefit 3.4 3.1 1.3 0.5 2.7 3.0 0.9 0.5 1.9 2.9 0.7 0.4
(1) NSTAR amounts were included in NU beginning April 10, 2012.

86
As of December 31, 2014, there was $15.7 million of total unrecognized compensation expense related to nonvested share-based awards for NU, $6.1million for CL&P, $4.3 million for NSTAR Electric, $2 million for PSNH and $1 million for WMECO. This cost is expected to be recognized ratably over a weighted-average period of 1.65 years for NU, 1.68 years for CL&P, 1.69 years for NSTAR Electric, 1.71 years for PSNH and 1.68years for WMECO.
For the years ended December 31, 2014 and 2012, additional tax benefits totaling $9.5 million and $8.5 million increased cash flows from financing activities. For the year ended December 31, 2013, additional tax benefits totaling $5.5 million decreased cash flows from financing activities.
Stock Options: Stock options were granted under the NU and NSTAR incentive plans. Options currently outstanding expire ten years from the date of grant and are fully vested. The weighted average remaining contractual lives for the options outstanding as of December 31, 2014 is 4.3 years. A summary of stock option transactions is as follows:
Weighted Average Intrinsic ValueOptions Exercise Price (Millions)
Outstanding and Exercisable - January 1, 2012 47,374 $ 18.78Converted NSTAR Options upon Merger 2,664,894 $ 23.99Exercised (1,166,511) $ 22.53 $ 18.7
Outstanding and Exercisable - December 31, 2012 1,545,757 $ 24.92Exercised (324,382) $ 20.97 $ 6.7
Outstanding and Exercisable - December 31, 2013 1,221,375 $ 25.97Exercised (869,759) $ 25.68 $ 16.4Outstanding and Exercisable - December 31, 2014 351,616 $ 26.69 $ 9.4
Cash received for options exercised during the year ended December 31, 2014 totaled $22.3 million. The tax benefit realized from stock options exercised totaled $6.6 million for the year ended December 31, 2014.
Employee Share Purchase Plan: NU maintains an ESPP for eligible employees, which allows for NU common shares to be purchased by employees at the end of successive six-month offering periods at 95 percent of the closing market price on the last day of each six-month period. Employees are permitted to purchase shares having a value not exceeding 25 percent of their compensation as of the beginning of the offering period up to a specified limit. The ESPP qualifies as a non-compensatory plan under accounting guidance for share-based payments, and no compensation expense is recorded for ESPP purchases.
During 2014, employees purchased 40,779 shares at discounted prices of $41.61 and $41.71. Employees purchased 39,526 shares in 2013 at discounted prices of $38.69 and $42.19. As of December 31, 2014 and 2013, 776,975 and 817,754 shares, respectively, remained available for future issuance under the ESPP.
An income tax rate of 40 percent is used to estimate the tax effect on total share-based payments determined under the fair value-based method for all awards. The Company generally settles stock option exercises and fully vested RSUs and performance shares with either the issuance of new common shares or the issuance of common shares purchased in the open market.
D. Other Retirement BenefitsNU provides benefits for retirement and other benefits for certain current and past company officers of NU, including CL&P, PSNH and WMECO. These benefits are accounted for on an accrual basis and expensed over the service lives of the employees. The actuarially-determined liability for these benefits, which is included in Other Long-Term Liabilities on the balance sheets, as well as the related expense, are as follows:
NU For the Years Ended December 31,
(Millions of Dollars) 2014 2013 2012
Actuarially-Determined Liability $ 57.5 $ 51.3 $ 54.6Other Retirement Benefits Expense 4.5 4.4 4.7
For the Years Ended December 31,
2014 2013 2012
(Millions of Dollars) CL&PNSTAR Electric PSNH WMECO CL&P PSNH WMECO CL&P PSNH WMECO
Actuarially-Determined Liability $ 0.4 $ - $ 2.6 $ 0.2 $ 0.4 $ 2.3 $ 0.1 $ 0.4 $ 2.5 $ 0.2
Other Retirement Benefits Expense 2.1 0.3 0.9 0.4 2.5 1.0 0.5 2.6 1.0 0.5

87
10. INCOME TAXES
The components of income tax expense are as follows:
NU For the Years Ended December 31,
(Millions of Dollars) 2014 2013 2012 (1)
Current Income Taxes: Federal $ 4.4 $ 8.8 $ (30.9) State 24.5 (9.4) 17.6Total Current 28.9 (0.6) (13.3)Deferred Income Taxes, Net: Federal 406.8 386.2 291.3 State 36.5 45.4 0.8Total Deferred 443.3 431.6 292.1Investment Tax Credits, Net (3.9) (4.1) (3.9)Income Tax Expense $ 468.3 $ 426.9 $ 274.9
(1) NSTAR amounts were included in NU beginning April 10, 2012.
For the Years Ended December 31,
2014 2013 2012
NSTAR NSTAR NSTAR(Millions of Dollars) CL&P Electric PSNH WMECO CL&P Electric PSNH WMECO CL&P Electric PSNH WMECO
Current Income Taxes:Federal $ (0.2) $ 75.0 $ (22.6) $ 1.9 $ 20.1 $ 95.8 $ (8.2) $ (53.4) $ (47.8) $ 93.5 $ (0.9) $ (24.7)State 4.3 20.2 (0.1) 1.8 (6.7) 29.6 3.6 4.2 3.1 27.6 3.4 3.4
Total Current 4.1 95.2 (22.7) 3.7 13.4 125.4 (4.6) (49.2) (44.7) 121.1 2.5 (21.3)Deferred Income Taxes, Net:
Federal 138.0 88.0 79.6 28.1 114.9 49.8 64.5 84.7 141.5 11.4 46.5 51.2State (7.1) 20.1 15.2 6.0 15.1 (1.0) 11.2 2.3 (0.5) (7.1) 12.0 2.7
Total Deferred 130.9 108.1 94.8 34.1 130.0 48.8 75.7 87.0 141.0 4.3 58.5 53.9Investment Tax Credits, Net (1.5) (1.3) - (0.5) (1.7) (1.3) - (0.4) (1.9) (1.4) - (0.5)Income Tax Expense $ 133.5 $ 202.0 $ 72.1 $ 37.3 $ 141.7 $ 172.9 $ 71.1 $ 37.4 $ 94.4 $ 124.0 $ 61.0 $ 32.1
A reconciliation between income tax expense and the expected tax expense at the statutory rate is as follows:
NU For the Years Ended December 31,
(Millions of Dollars, except percentages) 2014 2013 2012 (1)
Income Before Income Tax Expense $ 1,295.4 $ 1,220.6 $ 808.0
Statutory Federal Income Tax Expense at 35% 453.4 427.2 282.8Tax Effect of Differences:
Depreciation (5.6) (7.4) (10.8)Investment Tax Credit Amortization (3.9) (4.1) (3.9)Other Federal Tax Credits (3.5) (3.7) (3.8)State Income Taxes, Net of Federal Impact 42.5 27.6 4.4Dividends on ESOP (8.0) (8.0) (6.4)Tax Asset Valuation Allowance/Reserve Adjustments (2.9) (4.3) 7.6Other, Net (3.7) (0.4) 5.0
Income Tax Expense $ 468.3 $ 426.9 $ 274.9Effective Tax Rate 36.2% 35.0% 34.0%
(1) NSTAR amounts were included in NU beginning April 10, 2012.
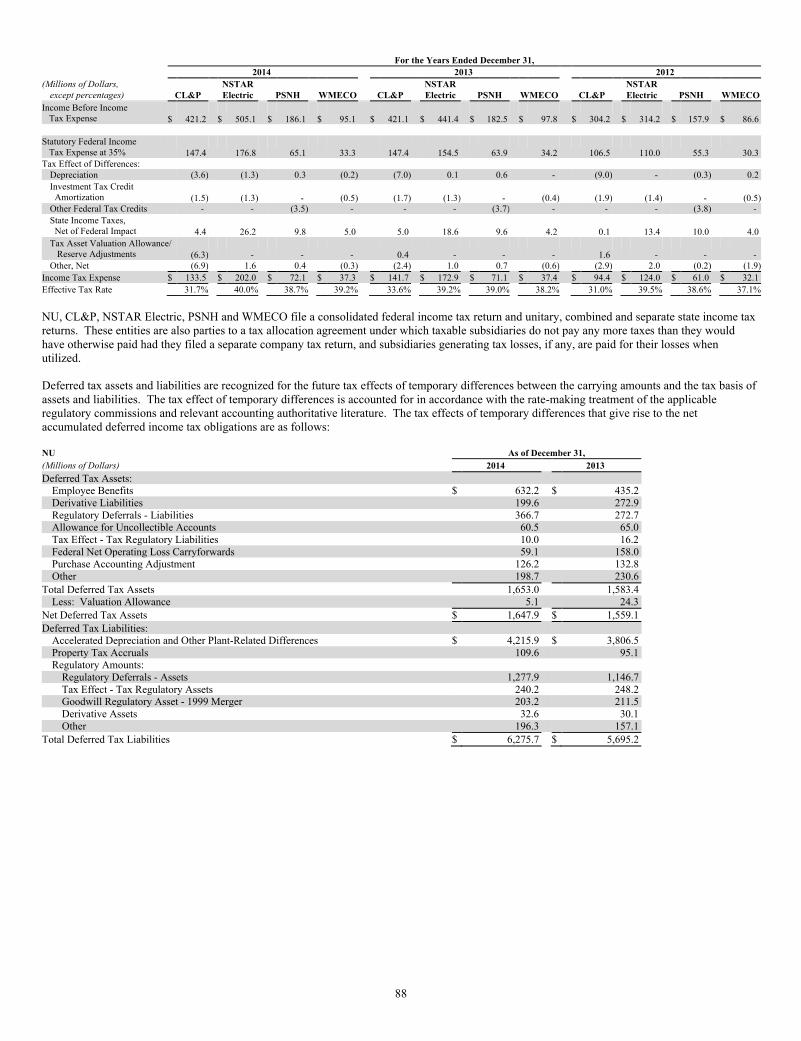
88
For the Years Ended December 31,
2014 2013 2012
(Millions of Dollars, NSTAR NSTAR NSTARexcept percentages) CL&P Electric PSNH WMECO CL&P Electric PSNH WMECO CL&P Electric PSNH WMECO
Income Before Income Tax Expense $ 421.2 $ 505.1 $ 186.1 $ 95.1 $ 421.1 $ 441.4 $ 182.5 $ 97.8 $ 304.2 $ 314.2 $ 157.9 $ 86.6
Statutory Federal Income Tax Expense at 35% 147.4 176.8 65.1 33.3 147.4 154.5 63.9 34.2 106.5 110.0 55.3 30.3Tax Effect of Differences:
Depreciation (3.6) (1.3) 0.3 (0.2) (7.0) 0.1 0.6 - (9.0) - (0.3) 0.2
Investment Tax Credit Amortization (1.5) (1.3) - (0.5) (1.7) (1.3) - (0.4) (1.9) (1.4) - (0.5)Other Federal Tax Credits - - (3.5) - - - (3.7) - - - (3.8) -
State Income Taxes, Net of Federal Impact 4.4 26.2 9.8 5.0 5.0 18.6 9.6 4.2 0.1 13.4 10.0 4.0Tax Asset Valuation Allowance/ Reserve Adjustments (6.3) - - - 0.4 - - - 1.6 - - - Other, Net (6.9) 1.6 0.4 (0.3) (2.4) 1.0 0.7 (0.6) (2.9) 2.0 (0.2) (1.9)
Income Tax Expense $ 133.5 $ 202.0 $ 72.1 $ 37.3 $ 141.7 $ 172.9 $ 71.1 $ 37.4 $ 94.4 $ 124.0 $ 61.0 $ 32.1
Effective Tax Rate 31.7% 40.0% 38.7% 39.2% 33.6% 39.2% 39.0% 38.2% 31.0% 39.5% 38.6% 37.1%
NU, CL&P, NSTAR Electric, PSNH and WMECO file a consolidated federal income tax return and unitary, combined and separate state income tax returns. These entities are also parties to a tax allocation agreement under which taxable subsidiaries do not pay any more taxes than they would have otherwise paid had they filed a separate company tax return, and subsidiaries generating tax losses, if any, are paid for their losses when utilized.
Deferred tax assets and liabilities are recognized for the future tax effects of temporary differences between the carrying amounts and the tax basis of assets and liabilities. The tax effect of temporary differences is accounted for in accordance with the rate-making treatment of the applicable regulatory commissions and relevant accounting authoritative literature. The tax effects of temporary differences that give rise to the net accumulated deferred income tax obligations are as follows:
NU As of December 31,
(Millions of Dollars) 2014 2013
Deferred Tax Assets:Employee Benefits $ 632.2 $ 435.2Derivative Liabilities 199.6 272.9Regulatory Deferrals - Liabilities 366.7 272.7Allowance for Uncollectible Accounts 60.5 65.0Tax Effect - Tax Regulatory Liabilities 10.0 16.2Federal Net Operating Loss Carryforwards 59.1 158.0Purchase Accounting Adjustment 126.2 132.8Other 198.7 230.6
Total Deferred Tax Assets 1,653.0 1,583.4Less: Valuation Allowance 5.1 24.3
Net Deferred Tax Assets $ 1,647.9 $ 1,559.1Deferred Tax Liabilities:
Accelerated Depreciation and Other Plant-Related Differences $ 4,215.9 $ 3,806.5Property Tax Accruals 109.6 95.1Regulatory Amounts:
Regulatory Deferrals - Assets 1,277.9 1,146.7Tax Effect - Tax Regulatory Assets 240.2 248.2Goodwill Regulatory Asset - 1999 Merger 203.2 211.5Derivative Assets 32.6 30.1Other 196.3 157.1
Total Deferred Tax Liabilities $ 6,275.7 $ 5,695.2

89
As of December 31,
2014 2013
NSTAR NSTAR(Millions of Dollars) CL&P Electric PSNH WMECO CL&P Electric PSNH WMECO
Deferred Tax Assets:Employee Benefits $ 129.0 $ 39.9 $ 46.8 $ 9.2 $ 56.0 $ 38.3 $ 15.5 $ (1.8)Derivative Liabilities 193.0 1.8 - - 272.4 3.3 - (2.9)Regulatory Deferrals - Liabilities 73.9 181.3 46.5 11.4 61.5 114.7 40.9 1.0Allowance for Uncollectible Accounts 32.3 13.8 3.2 3.8 31.2 15.4 3.1 3.3Tax Effect - Tax Regulatory Liabilities 3.1 1.8 2.1 2.5 4.7 5.4 2.1 1.6Federal Net Operating Loss Carryforwards - - 32.1 4.5 51.0 - 56.6 18.6Other 53.8 19.9 48.9 4.9 75.3 31.3 40.3 8.3
Total Deferred Tax Assets 485.1 258.5 179.6 36.3 552.1 208.4 158.5 28.1Less: Valuation Allowance 4.0 - - - 23.1 - - -
Net Deferred Tax Assets $ 481.1 $ 258.5 $ 179.6 $ 36.3 $ 529.0 $ 208.4 $ 158.5 $ 28.1Deferred Tax Liabilities:
Accelerated Depreciation and Other Plant-Related Differences $ 1,378.6 $ 1,296.9 $ 596.6 $ 385.8 $ 1,238.1 $ 1,179.4 $ 526.6 $ 361.1Property Tax Accruals 58.1 25.0 7.4 12.8 49.3 25.3 7.1 5.9Regulatory Amounts:
Regulatory Deferrals - Assets 502.3 276.0 147.6 60.4 550.4 276.2 109.3 49.3Tax Effect - Tax Regulatory Assets 166.9 35.5 15.9 9.3 160.1 36.0 16.3 18.2Goodwill Regulatory Asset - 1999 Merger - 174.4 - - - 181.6 - - Derivative Assets 32.6 - - - 29.0 0.5 - - Other 19.4 33.5 35.6 2.8 20.6 26.4 28.0 3.6
Total Deferred Tax Liabilities $ 2,157.9 $ 1,841.3 $ 803.1 $ 471.1 $ 2,047.5 $ 1,725.4 $ 687.3 $ 438.1
Carryforwards: The following tables provide the amounts and expiration dates of state tax credit and loss carryforwards and federal tax credit and net operating loss carryforwards:
As of December 31, 2014
NSTAR (Millions of Dollars) NU CL&P Electric PSNH WMECO Expiration Range
Federal Net Operating Loss $ 168.8 $ - $ - $ 91.8 $ 12.7 2031 - 2032Federal Tax Credit 16.3 0.1 0.2 11.1 - 2031 - 2034Federal Charitable Contribution 19.4 - - - - 2016 - 2018State Tax Credit 99.7 71.0 - - - 2014 - 2019State Loss Carryforwards 40.6 - - - - 2014 - 2034State Charitable Contribution 2.1 - - - - 2015 - 2018
As of December 31, 2013
NSTAR (Millions of Dollars) NU CL&P Electric PSNH WMECO Expiration Range
Federal Net Operating Loss $ 451.3 $ 145.8 $ - $ 161.8 $ 53.3 2031 - 2032Federal Tax Credit 8.0 - - 7.6 - 2031 - 2033Federal Charitable Contribution 33.7 - - - - 2015 - 2017State Tax Credit 104.7 86.8 - - - 2013 - 2018State Loss Carryforwards 12.1 - - - - 2013 - 2015State Charitable Contribution 1.0 - - - - 2015
In 2014, the Company recorded a reduction to its state credit carryforwards of $11 million (CL&P $10.1 million), net of tax, as a result of an update to reflect the amounts expired. Further, the Company decreased its valuation allowance reserve for state credits by $19.2 million at CL&P, net of tax, to reflect an update for expired state credits and latest estimate of usage.
For 2014, state credit and state loss carryforwards have been partially reserved by a valuation allowance of $4.4 million (net of federal income tax). For 2013, state credit and state loss carryforwards have been partially reserved by a valuation allowance of $23.7 million (net of federal income tax).

90
(Millions of Dollars) NU CL&P
Balance as of January 1, 2012 $ 73.5 $ 46.5Gross Increases - Current Year 10.3 2.5Gross Increases - Prior Year 0.1 -Gross Decreases - Prior Year (0.8) -
Balance as of December 31, 2012 83.1 49.0Gross Increases - Current Year 8.2 2.1Gross Decreases - Prior Year (1.1) (0.3)Settlements (49.8) (39.4)Lapse of Statute of Limitations (2.2) -
Balance as of December 31, 2013 38.2 11.4Gross Increases - Current Year 9.3 2.7Gross Increases - Prior Year 0.3 0.2Lapse of Statute of Limitations (1.6) -
Balance as of December 31, 2014 $ 46.2 $ 14.3
Interest and Penalties: Interest on uncertain tax positions is recorded and generally classified as a component of Other Interest Expense on the statements of income. However, when resolution of uncertainties results in the Company receiving interest income, any related interest benefit is recorded in Other Income, Net on the statements of income. No penalties have been recorded. The amount of interest expense/(income) on uncertain tax positions recognized and the related accrued interest payable/(receivable) are as follows:
Other Interest For the Years Ended December 31, Accrued Interest As of December 31,
Expense/(Income) 2014 2013 2012 Expense 2014 2013
(Millions of Dollars) (Millions of Dollars)
NU (1) $ 0.4 $ (8.6) $ 3.1 NU $ 1.9 $ 1.5CL&P - (4.0) 1.3 CL&P - -
(1) NSTAR amounts were included in NU beginning April 10, 2012.
Tax Positions: During 2014, NU did not resolve any of its uncertain tax positions.
During 2013, NU received a Final Determination from the Connecticut Department of Revenue Services (DRS) that concluded its audit of NU's Connecticut income tax returns for the years 2005 through 2008. The DRS Determination resulted in total NU and CL&P after-tax benefits of $13.6 million and $6.9 million, respectively, that included a reduction in NU and CL&P pre-tax interest expense of $8.7 million and $4 million, or $5.2 million and $2.4 million after-tax, respectively. Further, the income tax expense impact resulted in a tax benefit to NU and CL&P of $8.4 million and $4.5 million after-tax, respectively.
Open Tax Years: The following table summarizes NU, CL&P, NSTAR Electric, PSNH and WMECO's tax years that remain subject to examination by major tax jurisdictions as of December 31, 2014:
Description Tax Years
Federal 2014Connecticut 2011 – 2014Massachusetts 2011 – 2014New Hampshire 2011 – 2014
NU estimates that during the next twelve months, differences of a non-timing nature could be resolved, resulting in a zero to $2 million decrease in unrecognized tax benefits by NU. These estimated changes are not expected to have a material impact on the earnings of NU. Other companies'impacts are not expected to be material.
2014 Federal Legislation: On December 19, 2014, the "Tax Increase Prevention Act of 2014" became law, which extended the accelerated deduction of depreciation to businesses through 2014. This extended stimulus provides NU with cash flow benefits of approximately $200 million (approximately $70 million at CL&P, $50 million at NSTAR Electric, $35 million at PSNH, and $15 million at WMECO) in 2015.
2013 Federal Legislation: On January 2, 2013, the "American Taxpayer Relief Act of 2012" became law, which extended the accelerated deduction of depreciation to businesses through 2013. This extended stimulus provided NU with cash flow benefits of approximately $300 million (approximately $95 million at CL&P, $85 million at NSTAR Electric, $35 million at PSNH, and $50 million at WMECO).
On September 13, 2013, the Internal Revenue Service issued final Tangible Property regulations that are meant to simplify, clarify and make more administrable previously issued guidance. NU is in compliance with the new regulations, but continues to evaluate several new potential elections.
2013 Massachusetts: On July 24, 2013, Massachusetts enacted a law that changed the income tax rate applicable to utility companies effective January 1, 2014, from 6.5 percent to 8 percent. The tax law change required NU to remeasure its accumulated deferred income taxes and resulted in NU increasing its deferred tax liability with an offsetting regulatory asset of approximately $61 million at its utility companies ($46.3 million at NSTAR Electric and $9.8 million at WMECO).
Unrecognized Tax Benefits: A reconciliation of the activity in unrecognized tax benefits, all of which would impact the effective tax rate if recognized, is as follows:
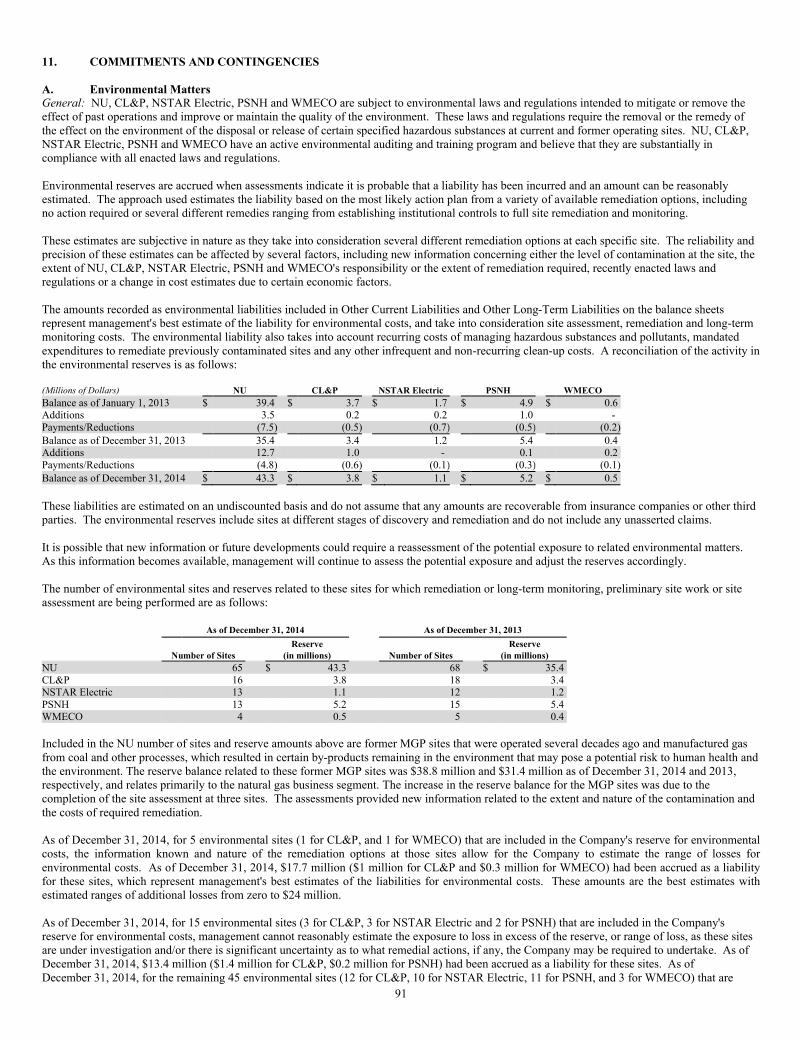
91
11. COMMITMENTS AND CONTINGENCIES
A. Environmental Matters General: NU, CL&P, NSTAR Electric, PSNH and WMECO are subject to environmental laws and regulations intended to mitigate or remove the effect of past operations and improve or maintain the quality of the environment. These laws and regulations require the removal or the remedy of the effect on the environment of the disposal or release of certain specified hazardous substances at current and former operating sites. NU, CL&P, NSTAR Electric, PSNH and WMECO have an active environmental auditing and training program and believe that they are substantially in compliance with all enacted laws and regulations.
Environmental reserves are accrued when assessments indicate it is probable that a liability has been incurred and an amount can be reasonably estimated. The approach used estimates the liability based on the most likely action plan from a variety of available remediation options, including no action required or several different remedies ranging from establishing institutional controls to full site remediation and monitoring.
These estimates are subjective in nature as they take into consideration several different remediation options at each specific site. The reliability and precision of these estimates can be affected by several factors, including new information concerning either the level of contamination at the site, the extent of NU, CL&P, NSTAR Electric, PSNH and WMECO's responsibility or the extent of remediation required, recently enacted laws and regulations or a change in cost estimates due to certain economic factors.
The amounts recorded as environmental liabilities included in Other Current Liabilities and Other Long-Term Liabilities on the balance sheets represent management's best estimate of the liability for environmental costs, and take into consideration site assessment, remediation and long-term monitoring costs. The environmental liability also takes into account recurring costs of managing hazardous substances and pollutants, mandated expenditures to remediate previously contaminated sites and any other infrequent and non-recurring clean-up costs. A reconciliation of the activity in the environmental reserves is as follows:
(Millions of Dollars) NU CL&P NSTAR Electric PSNH WMECO
Balance as of January 1, 2013 $ 39.4 $ 3.7 $ 1.7 $ 4.9 $ 0.6Additions 3.5 0.2 0.2 1.0 - Payments/Reductions (7.5) (0.5) (0.7) (0.5) (0.2)Balance as of December 31, 2013 35.4 3.4 1.2 5.4 0.4Additions 12.7 1.0 - 0.1 0.2Payments/Reductions (4.8) (0.6) (0.1) (0.3) (0.1)Balance as of December 31, 2014 $ 43.3 $ 3.8 $ 1.1 $ 5.2 $ 0.5
These liabilities are estimated on an undiscounted basis and do not assume that any amounts are recoverable from insurance companies or other third parties. The environmental reserves include sites at different stages of discovery and remediation and do not include any unasserted claims.
It is possible that new information or future developments could require a reassessment of the potential exposure to related environmental matters. As this information becomes available, management will continue to assess the potential exposure and adjust the reserves accordingly.
The number of environmental sites and reserves related to these sites for which remediation or long-term monitoring, preliminary site work or site assessment are being performed are as follows:
As of December 31, 2014 As of December 31, 2013
Reserve ReserveNumber of Sites (in millions) Number of Sites (in millions)
NU 65 $ 43.3 68 $ 35.4CL&P 16 3.8 18 3.4NSTAR Electric 13 1.1 12 1.2PSNH 13 5.2 15 5.4WMECO 4 0.5 5 0.4
Included in the NU number of sites and reserve amounts above are former MGP sites that were operated several decades ago and manufactured gas from coal and other processes, which resulted in certain by-products remaining in the environment that may pose a potential risk to human health and the environment. The reserve balance related to these former MGP sites was $38.8 million and $31.4 million as of December 31, 2014 and 2013, respectively, and relates primarily to the natural gas business segment. The increase in the reserve balance for the MGP sites was due to the completion of the site assessment at three sites. The assessments provided new information related to the extent and nature of the contamination and the costs of required remediation.
As of December 31, 2014, for 5 environmental sites (1 for CL&P, and 1 for WMECO) that are included in the Company's reserve for environmental costs, the information known and nature of the remediation options at those sites allow for the Company to estimate the range of losses for environmental costs. As of December 31, 2014, $17.7 million ($1 million for CL&P and $0.3 million for WMECO) had been accrued as a liability for these sites, which represent management's best estimates of the liabilities for environmental costs. These amounts are the best estimates with estimated ranges of additional losses from zero to $24 million.
As of December 31, 2014, for 15 environmental sites (3 for CL&P, 3 for NSTAR Electric and 2 for PSNH) that are included in the Company's reserve for environmental costs, management cannot reasonably estimate the exposure to loss in excess of the reserve, or range of loss, as these sites are under investigation and/or there is significant uncertainty as to what remedial actions, if any, the Company may be required to undertake. As of December 31, 2014, $13.4 million ($1.4 million for CL&P, $0.2 million for PSNH) had been accrued as a liability for these sites. As of December 31, 2014, for the remaining 45 environmental sites (12 for CL&P, 10 for NSTAR Electric, 11 for PSNH, and 3 for WMECO) that are

92
included in the Company's reserve for environmental costs, the $12.2 million accrual ($1.4 million for CL&P, $1.1 million for NSTAR Electric, $5million for PSNH, and $0.2 million for WMECO) represents management's best estimate of the liability and no additional loss is anticipated.
CERCLA: Of the total environmental sites, 9 sites (1 for CL&P, 3 for NSTAR Electric and 3 for PSNH) are superfund sites under the federal Comprehensive Environmental Response, Compensation and Liability Act of 1980 (CERCLA) and its amendments or state equivalents for which the Company has been notified that it is a potentially responsible party but for which the site assessment and remediation are not being managed by the Company. As of December 31, 2014, a liability of $0.7 million accrued on these sites represents management's best estimate of its potential remediation costs with respect to these superfund sites.
Environmental Rate Recovery: PSNH, NSTAR Gas and Yankee Gas have rate recovery mechanisms for MGP related environmental costs. CL&P recovers a certain level of environmental costs currently in rates but does not have an environmental cost recovery tracking mechanism. Accordingly, changes in CL&P's environmental reserves impact CL&P's Net Income. NSTAR Electric and WMECO do not have a separate regulatory mechanism to recover environmental costs from its customers, and changes in NSTAR Electric's and WMECO's environmental reserves impact Net Income.
B. Long-Term Contractual ArrangementsEstimated Future Annual Costs: The estimated future annual costs of significant long-term contractual arrangements as of December 31, 2014 are as follows:
NU(Millions of Dollars) 2015 2016 2017 2018 2019 Thereafter Total
Supply and Stranded Cost $ 196.6 $ 169.2 $ 101.9 $ 65.3 $ 38.1 $ 82.4 $ 653.5Renewable Energy 204.3 240.5 239.6 204.2 202.9 1,994.6 3,086.1Peaker CfDs 26.3 25.4 10.5 - - - 62.2Natural Gas Procurement 133.7 116.3 45.6 31.9 25.8 85.1 438.4Coal, Wood and Other 99.0 25.2 5.0 5.0 1.9 15.0 151.1Transmission Support Commitments 25.9 21.6 19.0 21.2 21.3 21.3 130.3Total $ 685.8 $ 598.2 $ 421.6 $ 327.6 $ 290.0 $ 2,198.4 $ 4,521.6
CL&P
(Millions of Dollars) 2015 2016 2017 2018 2019 Thereafter Total
Supply and Stranded Cost $ 134.3 $ 136.8 $ 79.0 $ 42.0 $ 25.0 $ 43.6 $ 460.7Renewable Energy 61.2 70.3 71.3 72.1 72.1 715.9 1,062.9Peaker CfDs 26.3 25.4 10.5 - - - 62.2Transmission Support Commitments 10.2 8.5 7.5 8.4 8.4 8.4 51.4Yankee Billings 1.4 0.8 0.8 0.9 0.9 11.8 16.6Total $ 233.4 $ 241.8 $ 169.1 $ 123.4 $ 106.4 $ 779.7 $ 1,653.8
NSTAR Electric
(Millions of Dollars) 2015 2016 2017 2018 2019 Thereafter Total
Supply and Stranded Cost $ 34.3 $ 14.1 $ 4.8 $ 5.5 $ 5.5 $ 31.4 $ 95.6Renewable Energy 85.4 99.9 96.9 59.6 57.7 319.8 719.3Transmission Support Commitments 8.1 6.7 5.9 6.6 6.6 6.6 40.5Yankee Billings 0.5 0.3 0.3 0.3 0.3 4.0 5.7Total $ 128.3 $ 121.0 $ 107.9 $ 72.0 $ 70.1 $ 361.8 $ 861.1
PSNH
(Millions of Dollars) 2015 2016 2017 2018 2019 Thereafter Total
Supply and Stranded Cost $ 28.0 $ 18.3 $ 18.1 $ 17.8 $ 7.6 $ 7.4 $ 97.2Renewable Energy 57.7 67.9 69.0 70.1 70.7 932.4 1,267.8Coal, Wood and Other 99.0 25.2 5.0 5.0 1.9 15.0 151.1Transmission Support Commitments 5.5 4.6 4.0 4.5 4.5 4.5 27.6Yankee Billings 0.4 0.3 0.3 0.3 0.3 4.7 6.3Total $ 190.6 $ 116.3 $ 96.4 $ 97.7 $ 85.0 $ 964.0 $ 1,550.0
WMECO
(Millions of Dollars) 2015 2016 2017 2018 2019 Thereafter Total
Renewable Energy $ - $ 2.4 $ 2.4 $ 2.4 $ 2.4 $ 26.5 $ 36.1Transmission Support Commitments 2.1 1.8 1.6 1.7 1.8 1.8 10.8Yankee Billings 0.3 0.2 0.2 0.2 0.2 3.0 4.1Total $ 2.4 $ 4.4 $ 4.2 $ 4.3 $ 4.4 $ 31.3 $ 51.0
Supply and Stranded Cost: CL&P, NSTAR Electric and PSNH have various IPP contracts or purchase obligations for electricity, including payment obligations resulting from the buydown of electricity purchase contracts. Such contracts extend through 2024 for CL&P, 2030 for NSTAR Electric and 2023 for PSNH.
In addition, CL&P, along with UI, has four capacity CfDs for a total of approximately 787 MW of capacity consisting of three generation projects and one demand response project. The capacity CfDs extend through 2026 and obligate both CL&P and UI to make or receive payments on a monthly basis to or from the generation facilities based on the difference between a set capacity price and the capacity market prices received by the generation facilities in the ISO-NE capacity markets. CL&P has a sharing agreement with UI, whereby UI will share 20 percent of the costs and benefits of these contracts. CL&P's portion of the costs and benefits of these contracts will be paid by or refunded to CL&P's customers.

93
The contractual obligations table does not include CL&P's SS or LRS, or NSTAR Electric's or WMECO's default service contracts, the amounts of which vary with customers' energy needs. The contractual obligations table also does not include PSNH's short-term power supply management.
Renewable Energy: Renewable energy contracts include non-cancellable commitments under contracts of CL&P, NSTAR Electric, PSNH, and WMECO for the purchase of energy and capacity from renewable energy facilities. Such contracts extend through 2035 for CL&P, 2030 for NSTAR Electric, 2033 for PSNH and 2030 for WMECO.
The contractual obligations table does not include long-term commitments signed by CL&P, NSTAR Electric and WMECO, as required by the PURA and DPU, for the purchase of renewable energy and related products that are contingent on the future construction of energy facilities.
Peaker CfDs: In 2008, CL&P entered into three CfDs with developers of peaking generation units approved by the PURA (Peaker CfDs). These units have a total of approximately 500 MW of peaking capacity. As directed by the PURA, CL&P and UI have entered into a sharing agreement, whereby CL&P is responsible for 80 percent and UI for 20 percent of the net costs or benefits of these CfDs. The Peaker CfDs pay the generation facility owner the difference between capacity, forward reserve and energy market revenues and a cost-of-service payment stream for 30 years. The ultimate cost or benefit to CL&P under these contracts will depend on the costs of plant operation and the prices that the projects receive for capacity and other products in the ISO-NE markets. CL&P's portion of the amounts paid or received under the Peaker CfDs will be recoverable from or refunded to CL&P's customers.
Natural Gas Procurement: NU's natural gas distribution businesses have long-term contracts for the purchase, transportation and storage of natural gas in the normal course of business as part of its portfolio of supplies. These contracts extend through 2029.
Coal, Wood and Other: PSNH has entered into various arrangements for the purchase of coal, wood and the transportation services for fuel supply for its electric generating assets. Also included in the table above is a contract for capacity on the Portland Natural Gas Transmission System (PNGTS) pipeline that extends through 2018. The costs on this contract of $11.4 million are not recoverable from customers.
Transmission Support Commitments: Along with other New England utilities, CL&P, NSTAR Electric, PSNH and WMECO entered into agreements in 1985 to support transmission and terminal facilities that were built to import electricity from the Hydro-Québec system in Canada. CL&P, NSTAR Electric, PSNH and WMECO are obligated to pay, over a 30-year period ending in 2020, their proportionate shares of the annual operation and maintenance expenses and capital costs of those facilities.
The total costs incurred under these agreements were as follows:
NU For the Years Ended December 31,
(Millions of Dollars) 2014 2013 2012 (1)
Supply and Stranded Cost $ 99.2 $ 141.0 $ 216.8Renewable Energy 114.4 91.3 48.7Peaker CfDs 18.1 51.9 59.3Natural Gas Procurement 482.5 349.8 243.1Coal, Wood and Other 120.5 112.6 105.2Transmission Support Commitments 25.0 24.9 24.8
For the Years Ended December 31,
2014 2013 2012
NSTAR NSTAR NSTAR(Millions of Dollars) CL&P Electric PSNH WMECO CL&P Electric PSNH WMECO CL&P Electric PSNH WMECO
Supply and Stranded Cost $ 63.0 $ 7.0 $ 26.0 $ 3.2 $ 77.6 $ 32.4 $ 29.0 $ 2.0 $ 158.2 $ 36.3 $ 30.5 $ 0.9Renewable Energy 0.7 87.4 26.3 - - 84.9 6.4 - - 60.2 4.1 - Peaker CfDs 18.1 - - - 51.9 - - - 59.3 - - - Coal, Wood and Other - - 120.5 - - - 112.6 - - - 105.2 -
Transmission Support Commitments 9.9 7.7 5.3 2.1 9.8 7.7 5.3 2.1 9.6 7.6 5.2 2.0
(1) NSTAR amounts were included in NU beginning April 10, 2012.
C. Contractual Obligations - Yankee CompaniesCL&P, NSTAR Electric, PSNH and WMECO have decommissioning and plant closure cost obligations to the Yankee Companies, which have each completed the physical decommissioning of their respective nuclear facilities and are now engaged in the long-term storage of their spent fuel. The Yankee Companies collect decommissioning and closure costs through wholesale, FERC-approved rates charged under power purchase agreements with several New England utilities, including CL&P, NSTAR Electric, PSNH and WMECO. These companies in turn recover these costs from their customers through state regulatory commission-approved retail rates.
CL&P, NSTAR Electric, PSNH and WMECO's percentage share of the obligations to support the Yankee Companies under FERC-approved rate tariffs is the same as their respective ownership percentages in the Yankee Companies. For further information on the ownership percentages, see Note 1J, "Summary of Significant Accounting Policies - Equity Method Investments," to the financial statements.
The Yankee Companies have collected or are currently collecting amounts that management believes are adequate to recover the remaining decommissioning and closure cost estimates for the respective plants. Management believes CL&P, NSTAR Electric and WMECO will recover their shares of these decommissioning and closure obligations from their customers. PSNH has already recovered its share of these costs from its customers.

94
Spent Nuclear Fuel Litigation: DOE Phase I Damages – In 1998, the Yankee Companies filed separate complaints against the DOE in the Court of Federal Claims seeking monetary damages resulting from the DOE's failure to begin accepting spent nuclear fuel for disposal by January 31, 1998 pursuant to the terms of the 1983 spent fuel and high level waste disposal contracts between the Yankee Companies and the DOE (DOE Phase I Damages). Phase I covered damages for the period 1998 through 2002. Following multiple appeals and cross-appeals, in December 2012, the judgment awarding CYAPC $39.6 million, YAEC $38.3 million and MYAPC $81.7 million became final.
In January 2013, the proceeds from the DOE Phase I Damages Claim were received by the Yankee Companies and transferred to each Yankee Company's respective decommissioning trust. As a result of NU's consolidation of CYAPC and YAEC, the financial statements reflected an increase of $77.9 million in marketable securities for CYAPC and YAEC's Phase I Damage awards that were invested in the nuclear decommissioning trusts in 2013.
In June 2013, FERC approved CYAPC, YAEC and MYAPC to reduce rates in their wholesale power contracts through the application of the DOE proceeds for the benefit of customers. Changes to the terms of the wholesale power contracts became effective on July 1, 2013. In accordance with the FERC order, CL&P, NSTAR Electric, PSNH and WMECO began receiving the benefit of the DOE proceeds, and the benefits have been passed on to customers.
On September 17, 2014, in accordance with the MYAPC refund plan, MYAPC returned a portion of the DOE Phase I Damages proceeds to the member companies, including CL&P, NSTAR Electric, PSNH, and WMECO, in the amount of $3.2 million, $1.1 million, $1.4 million and $0.8 million, respectively. These amounts reduced receivables at CL&P, NSTAR Electric, PSNH and WMECO.
DOE Phase II Damages - In December 2007, the Yankee Companies each filed subsequent lawsuits against the DOE seeking recovery of actual damages incurred related to the alleged failure of the DOE to provide for a permanent facility to store spent nuclear fuel generated in years 2001through 2008 for CYAPC and YAEC and from 2002 through 2008 for MYAPC (DOE Phase II Damages). In November 2013, the court issued a final judgment awarding CYAPC $126.3 million, YAEC $73.3 million, and MYAPC $35.8 million. On January 14, 2014, the Yankee Companies received a letter from the U.S. Department of Justice stating that the DOE will not appeal the court's final judgment.
In March and April 2014, CYAPC, YAEC and MYAPC received payment of $126.3 million, $73.3 million and $35.8 million, respectively, of the DOE Phase II Damages proceeds and made the required informational filing with FERC in accordance with the process and methodology outlined in the 2013 FERC order. The Yankee Companies returned the DOE Phase II Damages proceeds to the member companies, including CL&P, NSTAR Electric, PSNH, and WMECO, for the benefit of their respective customers, on June 1, 2014.
As of December 31, 2014, CL&P's refund obligation to customers of $65.4 million was recorded as an offset to the deferred storm restoration costs regulatory asset, as directed by PURA. NSTAR Electric's, PSNH's and WMECO's refund obligation to customers of $29.1 million, $13.1 million and $18.1 million, respectively, was recorded as a regulatory liability in each company's respective regulatory tracker mechanisms. Refunds to customers for these DOE proceeds began in the third quarter of 2014. For further information, see Note 2, "Regulatory Accounting," to the financial statements.
DOE Phase III Damages – In August 2013, the Yankee Companies each filed subsequent lawsuits against the DOE seeking recovery of actual damages incurred in the years 2009 through 2012. The presiding judge issued a Pre-Trial Scheduling Order on September 3, 2014 that set the case for trial from June 30 to July 2, 2015.
D. Guarantees and Indemnifications NU parent provides credit assurances on behalf of its subsidiaries, including CL&P, NSTAR Electric, PSNH and WMECO, in the form of guarantees in the normal course of business.
NU provided guarantees and various indemnifications on behalf of external parties as a result of the sales of former subsidiaries of NU Enterprises and the termination of an unregulated business, with maximum exposures either not specified or not material.
NU also issued a guaranty under which, beginning at the time the Northern Pass Transmission line goes into commercial operation, NU will guarantee the financial obligations of NPT under the TSA in an amount not to exceed $25 million. NU's obligations under the guaranty expire upon the full, final and indefeasible payment of the guaranteed obligations.
Management does not anticipate a material impact to Net Income as a result of these various guarantees and indemnifications.
The following table summarizes NU's guarantees of its subsidiaries, including CL&P, NSTAR Electric, PSNH and WMECO, as of December 31, 2014:
Maximum Exposure
Subsidiary Description (in millions) Expiration Dates
Various Surety Bonds (1) $ 60.0 2015 - 2016
NUSCO and Rocky River Realty Company Lease Payments for Vehicles and Real Estate $ 14.4 2019 and 2024
(1) Surety bond expiration dates reflect termination dates, the majority of which will be renewed or extended. Certain surety bonds contain credit ratings triggers that would require NU parent to post collateral in the event that the unsecured debt credit ratings of NU are downgraded.

95
E. FERC Base ROE ComplaintsBeginning in 2011, several New England state attorneys general, state regulatory commissions, consumer advocates, consumer groups, municipal parties and other parties (the "Complainants") jointly filed three separate complaints at FERC. In the first complaint, filed in 2011, the Complainants alleged that the NETOs' base ROE of 11.14 percent that was utilized since 2006 was unjust and unreasonable, asserted that the rate was excessive due to changes in the capital markets, and sought an order to reduce it prospectively from the date of the final FERC order and for the 15-month period beginning October 1, 2011 to December 31, 2012 (the "first complaint refund period"). In the pursuant second and third complaints, filed in 2012 and 2014, respectively, the Complainants challenged the NETOs' base ROE and sought refunds for the 15-month periods beginning December 27, 2012 and July 31, 2014, respectively.
In 2014, the FERC determined that the base ROE should be set at 10.57 percent for the first complaint refund period and that a utility's total or maximum ROE should not exceed the top of the new zone of reasonableness (7.03 percent to 11.74 percent). The FERC ordered the NETOs to provide refunds to customers for the first complaint refund period and set the new base ROE of 10.57 percent prospectively from October 16, 2014. In late 2014, the NETOs made a compliance filing, and began refunding amounts from the first complaint period, inclusive of incentive ROE adders that exceeded the 11.74 percent as compared to the total company transmission ROE. Complainants have challenged the compliance filing.
As a result of the actions taken by the FERC and other developments in this matter, NU recorded reserves in 2013 and 2014 to recognize the potential financial impacts of the first and second complaints. The Company is unable to determine any amount related to the third complaint. The following is a summary of the cumulative pre-tax reserves (excluding interest) established by the Company in 2013 and 2014:
NU
For the Years Ended December 31,
(Millions of Dollars) 2013 2014 Total
1st Complaint - Base ROE $ 23.7 $ 1.2 $ 24.92nd Complaint - Base ROE - 27.4 27.4Incentive ROE (1st and 2nd Complaint) - 8.4 8.4Cumulative Reserve $ 23.7 $ 37.0 $ 60.7
CL&P NSTAR Electric
For the Years Ended December 31, For the Years Ended December 31,
(Millions of Dollars) 2013 2014 Total 2013 2014 Total
1st Complaint - Base ROE $ 12.8 $ 0.5 $ 13.3 $ 5.7 $ 0.4 $ 6.12nd Complaint - Base ROE - 13.5 13.5 - 7.5 7.5Incentive ROE (1st and 2nd Complaint) - 6.7 6.7 - - -Cumulative Reserve $ 12.8 $ 20.7 $ 33.5 $ 5.7 $ 7.9 $ 13.6
PSNH WMECO
For the Years Ended December 31, For the Years Ended December 31,
(Millions of Dollars) 2013 2014 Total 2013 2014 Total
1st Complaint - Base ROE $ 2.3 $ 0.1 $ 2.4 $ 2.9 $ 0.2 $ 3.12nd Complaint - Base ROE - 2.7 2.7 - 3.7 3.7Incentive ROE (1st and 2nd Complaint) - - - - 1.7 1.7Cumulative Reserve $ 2.3 $ 2.8 $ 5.1 $ 2.9 $ 5.6 $ 8.5
As of December 31, 2014, the cumulative reserves above do not reflect refunds totaling $4.8 million at NU, $2.7 million at CL&P, $1 million at NSTAR Electric, $0.5 million at PSNH and $0.6 million at WMECO for the first complaint refund period.
The aggregate after-tax net charge to 2014 earnings resulting from the 2014 FERC orders totaled $22.4 million at NU, $12.4 million at CL&P, $4.9 million at NSTAR Electric, $1.7 million at PSNH and $3.4 million at WMECO. In 2013, the aggregate after-tax charge to earnings totaled $14.3 million at NU, $7.7 million at CL&P, $3.4 million at NSTAR Electric, $1.4 million at PSNH and $1.8 million at WMECO.
Although management is uncertain on the final outcome on the second and third complaints regarding the base ROE and the incentive ROE adder, management believes the current reserves established are appropriate to reflect probable and reasonably estimable refunds.
F. 2014 Comprehensive Settlement AgreementOn December 31, 2014, NSTAR Electric, NSTAR Gas and the Massachusetts Attorney General filed a comprehensive settlement agreement with the DPU. The comprehensive settlement agreement included resolution of the outstanding NSTAR Electric CPSL program filings for the periods 2006 through 2011, the NSTAR Electric and NSTAR Gas PAM and energy efficiency-related customer billing adjustments reported in 2012, and the NSTAR Electric energy efficiency program filings regarding LBR for the periods 2008 through 2011. If approved by the DPU, NSTAR Electric and NSTAR Gas will be required to refund a total of $44.7 million to their respective customers, which was included in regulatory liabilities as of December 31, 2014. Upon the DPU's approval, NSTAR Electric will adjust its regulatory liabilities, which it expects will result in a benefit of $23 million in the first quarter of 2015. Management expects a response from the DPU in the first quarter of 2015.
G. Basic Service Bad Debt AdderIn accordance with a generic 2005 DPU order, electric utilities in Massachusetts recover the energy-related portion of bad debt costs in their Basic Service rates. In 2007, NSTAR Electric filed its 2006 Basic Service reconciliation with the DPU proposing an adjustment related to the increase of its Basic Service bad debt charge-offs. The DPU issued an order approving the implementation of a revised Basic Service rate but instructed NSTAR Electric to reduce distribution rates by an amount equal to the increase in its Basic Service bad debt charge-offs. This adjustment to NSTAR Electric's distribution rates would eliminate the fully reconciling nature of the Basic Service bad debt adder.

96
In 2010, NSTAR Electric filed an appeal of the DPU's order with the SJC. NSTAR Electric's position was that it had fully removed the collection of energy-related bad debt costs from its distribution rates effective January 1, 2006. Therefore, no further adjustment to distribution rates was warranted. In 2012, the SJC vacated the DPU order and remanded the matter to the DPU for further review.
As of December 31, 2014, NSTAR Electric has a total deferred regulatory asset of approximately $33 million of costs associated with energy-related bad debt.
On January 7, 2015, the DPU issued an order on remand stating that NSTAR Electric had, in fact, removed energy-related bad debt costs from distribution rates effective January 1, 2006. The DPU order approved NSTAR Electric's 2005 and 2006 reconciliation filings and ordered NSTAR Electric and the Massachusetts Attorney General to collaborate on the submission of a proposal for the reconciliation of energy-related bad debt costs for the open years of 2007 through 2014 by April 7, 2015. Management expects to present a proposal to the Attorney General in the first quarter of 2015 with a decision from the DPU later in 2015.
H. Litigation and Legal Proceedings NU, including CL&P, NSTAR Electric, PSNH and WMECO, are involved in legal, tax and regulatory proceedings regarding matters arising in the ordinary course of business, which involve management's assessment to determine the probability of whether a loss will occur and, if probable, its best estimate of probable loss. The Company records and discloses losses when these losses are probable and reasonably estimable, and discloses matters when losses are probable but not estimable or when losses are reasonably possible. Legal costs related to the defense of loss contingencies are expensed as incurred.
12. LEASES
NU, including CL&P, NSTAR Electric, PSNH and WMECO, has entered into lease agreements, some of which are capital leases, for the use of data processing and office equipment, vehicles, service centers, and office space. In addition, CL&P, NSTAR Electric, PSNH and WMECO incur costs associated with leases entered into by NUSCO and Rocky River Realty Company, which are included below in their respective operating lease rental expenses and future minimum rental payments. These intercompany lease amounts are eliminated on an NU consolidated basis. The provisions of the NU, CL&P, NSTAR Electric, PSNH, and WMECO lease agreements generally contain renewal options. Certain lease agreements contain payments impacted by the commercial paper rate plus a credit spread or the consumer price index.
Operating lease rental payments charged to expense are as follows:
NSTAR(Millions of Dollars) NU (1) CL&P Electric PSNH WMECO
2014 $ 14.3 $ 6.0 $ 7.8 $ 1.5 $ 1.22013 16.3 8.1 6.7 1.7 2.92012 14.8 8.2 6.2 2.5 3.0
(1) NSTAR amounts were included in NU beginning April 10, 2012.
Future minimum rental payments, excluding executory costs, such as property taxes, state use taxes, insurance, and maintenance, under long-term noncancelable leases, as of December 31, 2014 are as follows:
Operating Leases NSTAR(Millions of Dollars) NU CL&P Electric PSNH WMECO
2015 $ 20.1 $ 4.3 $ 10.0 $ 1.1 $ 1.22016 17.6 3.8 8.8 1.0 1.02017 14.6 2.6 7.7 0.8 0.82018 10.5 1.5 5.8 0.6 0.62019 8.6 1.1 4.7 0.5 0.6Thereafter 22.5 4.0 10.4 1.5 2.5Future minimum lease payments $ 93.9 $ 17.3 $ 47.4 $ 5.5 $ 6.7
Capital Leases(Millions of Dollars) NU CL&P PSNH
2015 $ 2.4 $ 2.0 $ 0.42016 2.2 1.9 0.32017 2.1 2.0 0.12018 2.1 2.0 0.12019 2.0 2.0 -Thereafter 3.5 3.5 -Future minimum lease payments 14.3 13.4 0.9Less amount representing interest 4.9 5.0 -Present value of future minimum lease payments $ 9.4 $ 8.4 $ 0.9
CL&P entered into certain contracts for the purchase of energy that qualify as leases. These contracts do not have minimum lease payments and therefore are not included in the tables above. However, such contracts have been included in the contractual obligations table in Note 11B, "Commitments and Contingencies - Long-Term Contractual Arrangements," to the financial statements.

97
13. FAIR VALUE OF FINANCIAL INSTRUMENTS
The following methods and assumptions were used to estimate the fair value of each of the following financial instruments:
Preferred Stock and Long-Term Debt: The fair value of CL&P's and NSTAR Electric's preferred stock is based upon pricing models that incorporate interest rates and other market factors, valuations or trades of similar securities and cash flow projections. The fair value of long-term debt securities is based upon pricing models that incorporate quoted market prices for those issues or similar issues adjusted for market conditions, credit ratings of the respective companies and treasury benchmark yields. The fair values provided in the tables below are classified as Level 2 within the fair value hierarchy. Carrying amounts and estimated fair values are as follows:
As of December 31,
2014 2013
NU Carrying Fair Carrying Fair(Millions of Dollars) Amount Value Amount Value
Preferred Stock Not Subject to Mandatory Redemption $ 155.6 $ 153.6 $ 155.6 $ 152.7Long-Term Debt 8,851.6 9,451.2 8,310.2 8,443.1
As of December 31, 2014
CL&P NSTAR Electric PSNH WMECO
Carrying Fair Carrying Fair Carrying Fair Carrying Fair(Millions of Dollars) Amount Value Amount Value Amount Value Amount Value
Preferred Stock Not Subject to Mandatory Redemption $ 116.2 $ 112.0 $ 43.0 $ 41.6 $ - $ - $ - $ -Long-Term Debt 2,842.0 3,214.5 1,797.4 1,993.5 1,076.3 1,137.9 628.5 689.4
As of December 31, 2013
CL&P NSTAR Electric PSNH WMECO
Carrying Fair Carrying Fair Carrying Fair Carrying Fair(Millions of Dollars) Amount Value Amount Value Amount Value Amount Value
Preferred Stock Not Subject to Mandatory Redemption $ 116.2 $ 110.5 $ 43.0 $ 42.2 $ - $ - $ - $ -Long-Term Debt 2,741.2 2,952.8 1,801.1 1,888.0 1,049.0 1,073.9 629.4 640.1
Derivative Instruments: Derivative instruments are carried at fair value. For further information, see Note 4, "Derivative Instruments," to the financial statements.
Other Financial Instruments: Investments in marketable securities are carried at fair value. For further information, see Note 5, "Marketable Securities," to the financial statements. The carrying value of other financial instruments included in current assets and current liabilities, including cash and cash equivalents and special deposits, approximates their fair value due to the short-term nature of these instruments.
See Note 1H, "Summary of Significant Accounting Policies - Fair Value Measurements," for the fair value measurement policy and the fair value hierarchy.
14. ACCUMULATED OTHER COMPREHENSIVE INCOME/(LOSS)
The changes in accumulated other comprehensive income/(loss) by component, net of tax effect, is as follows:
For the Year Ended December 31, 2014 For the Year Ended December 31, 2013
Qualified Unrealized Qualified Unrealized Cash Flow Gains/(Losses) Defined Cash Flow Gains/(Losses) DefinedHedging on Marketable Benefit Hedging on Marketable Benefit
(Millions of Dollars) Instruments Securities Plans Total Instruments Securities Plans Total
AOCI as of January 1st $ (14.4) $ 0.4 $ (32.0) $ (46.0) $ (16.4) $ 1.3 $ (57.8) $ (72.9)
OCI Before Reclassifications - 0.3 (34.2) (33.9) - (0.9) 19.4 18.5Amounts Reclassified from AOCI 2.0 - 3.9 5.9 2.0 - 6.4 8.4Net OCI 2.0 0.3 (30.3) (28.0) 2.0 (0.9) 25.8 26.9AOCI as of December 31st $ (12.4) $ 0.7 $ (62.3) $ (74.0) $ (14.4) $ 0.4 $ (32.0) $ (46.0)
NU's qualified cash flow hedging instruments represent interest rate swap agreements on debt issuances that were settled in prior years. The settlement amount was recorded in AOCI and is being amortized into Net Income over the term of the underlying debt instrument. CL&P, PSNH and WMECO continue to amortize interest rate swaps settled in prior years from AOCI into Interest Expense over the remaining life of the associated long-term debt, which are not material to their respective financial statements.
The tax effects of Defined Benefit Plan OCI amounts before reclassifications, which relate to actuarial gains and losses that arose during 2014, 2013and 2012 were recognized in AOCI as net deferred tax assets of $22.3 million and $6.2 million in 2014 and 2012, respectively, and net deferred tax liabilities of $11.4 million in 2013.

98
The following table sets forth the amounts reclassified from AOCI by component and the impacted line item on the statements of income:
For the Years Ended December 31,
2014 2013 2012
Amounts Reclassified Amounts Reclassified Amounts Reclassified Statements of Income(Millions of Dollars) from AOCI from AOCI from AOCI Line Item Impacted
Qualified Cash Flow Hedging Instruments $ (3.4) $ (3.4) $ (3.3) Interest ExpenseTax Effect 1.4 1.4 1.3 Income Tax ExpenseQualified Cash Flow Hedging Instruments, Net of Tax $ (2.0) $ (2.0) $ (2.0)
Defined Benefit Plan Costs: Amortization of Actuarial Losses $ (6.2) $ (10.5) $ (8.9) Operations and Maintenance (1)
Amortization of Prior Service Cost (0.2) (0.2) (0.2) Operations and Maintenance (1)
Amortization of Transition Obligation - - (0.2) Operations and Maintenance (1)
Total Defined Benefit Plan Costs (6.4) (10.7) (9.3)Tax Effect 2.5 4.3 3.5 Income Tax ExpenseDefined Benefit Plan Costs, Net of Tax $ (3.9) $ (6.4) $ (5.8)
Total Amounts Reclassified from AOCI, Net of Tax $ (5.9) $ (8.4) $ (7.8)
(1) These amounts are included in the computation of net periodic Pension, SERP and PBOP costs. See Note 9A, "Employee Benefits - Pension Benefits and Postretirement Benefits Other Than Pensions," for further information.
As of December 31, 2014, it is estimated that a pre-tax amount of $3.5 million ($0.7 million for CL&P, $2 million for PSNH and $0.6 million for WMECO) will be reclassified from AOCI as a decrease to Net Income over the next 12 months as a result of the amortization of the interest rate swap agreements, which have been settled. In addition, it is estimated that a pre-tax amount of $6.9 million will be reclassified from AOCI as a decrease to Net Income over the next 12 months as a result of the amortization of Pension, SERP and PBOP costs.
15. DIVIDEND RESTRICTIONS
NU parent's ability to pay dividends may be affected by certain state statutes, the ability of its subsidiaries to pay common dividends and the leverage restriction tied to its consolidated total debt to total capitalization ratio requirement in its revolving credit agreement.
CL&P, NSTAR Electric, PSNH and WMECO are subject to Section 305 of the Federal Power Act that makes it unlawful for a public utility to make or pay a dividend from any funds "properly included in its capital account." Management believes that this Federal Power Act restriction, as applied to CL&P, NSTAR Electric, PSNH and WMECO, would not be construed or applied by the FERC to prohibit the payment of dividends for lawful and legitimate business purposes from retained earnings. In addition, certain state statutes may impose additional limitations on such companies and on Yankee Gas and NSTAR Gas. Such state law restrictions do not restrict payment of dividends from retained earnings or net income. Pursuant to the joint revolving credit agreement of NU, CL&P, PSNH, WMECO, Yankee Gas and NSTAR Gas, and the NSTAR Electric revolving credit agreement, each company is required to maintain consolidated total debt to total capitalization ratio of no greater than 65 percent at all times. As of December 31, 2014, all companies were in compliance with such covenant. The Retained Earnings balances subject to these restrictions were $2.4billion for NU, $1.1 billion for CL&P, $1.5 billion for NSTAR Electric, $486.5 million for PSNH and $178.8 million for WMECO as of December 31, 2014. As of December 31, 2014, NU, CL&P, NSTAR Electric, PSNH, WMECO, Yankee Gas and NSTAR Gas were in compliance with all such provisions of the revolving credit agreements that may restrict the payment of dividends. PSNH is further required to reserve an additional amount under its FERC hydroelectric license conditions. As of December 31, 2014, $13 million of PSNH's Retained Earnings was subject to restriction under its FERC hydroelectric license conditions and PSNH was in compliance with this provision.
16. COMMON SHARES
The following table sets forth the NU common shares and the shares of common stock of CL&P, NSTAR Electric, PSNH and WMECO that were authorized and issued and the respective per share par values:
Shares
Authorized IssuedPer Share as of December 31, as of December 31,
Par Value 2014 and 2013 2014 2013
NU $ 5 380,000,000 333,359,172 333,113,492CL&P $ 10 24,500,000 6,035,205 6,035,205NSTAR Electric $ 1 100,000,000 100 100PSNH $ 1 100,000,000 301 301WMECO $ 25 1,072,471 434,653 434,653
As of December 31, 2014 and 2013, there were 16,375,835 and 17,796,672 NU common shares held as treasury shares, respectively. As of December 31, 2014 and 2013, NU common shares outstanding were 316,983,337 and 315,273,559, respectively.

99
17. PREFERRED STOCK NOT SUBJECT TO MANDATORY REDEMPTION
The CL&P and NSTAR Electric preferred stock is not subject to mandatory redemption and is presented as a noncontrolling interest of a subsidiary in NU's financial statements.
CL&P Preferred Stock: CL&P's charter authorizes it to issue up to 9 million shares of preferred stock ($50 par value per share). The issuance of additional preferred shares would be subject to PURA approval. Preferred stockholders have liquidation rights equal to the par value of the preferred stock, which they would receive in preference to any distributions to any junior stock. Were there to be a shortfall, all preferred stockholders would share ratably in available liquidation assets.
NSTAR Electric Preferred Stock: NSTAR Electric is authorized to issue 2,890,000 shares ($100 par value per share). NSTAR Electric has two outstanding series of cumulative preferred stock. Upon liquidation, holders of cumulative preferred stock are entitled to receive a liquidation preference before any distribution to holders of common stock. The liquidation preference for each outstanding series of cumulative preferred stock is equal to the par value, plus accrued and unpaid dividends. Were there to be a shortfall, holders of cumulative preferred stock would share ratably in available liquidation assets.
Details of preferred stock not subject to mandatory redemption are as follows (in millions except in redemption price and shares):
Redemption Price Shares Outstanding as of As of December 31,
Series Per Share December 31, 2014 and 2013 2014 2013
CL&P
$ 1.90 Series of 1947 $ 52.50 163,912 $ 8.2 $ 8.2$ 2.00 Series of 1947 $ 54.00 336,088 16.8 16.8$ 2.04 Series of 1949 $ 52.00 100,000 5.0 5.0$ 2.20 Series of 1949 $ 52.50 200,000 10.0 10.0 3.90 % Series of 1949 $ 50.50 160,000 8.0 8.0$ 2.06 Series E of 1954 $ 51.00 200,000 10.0 10.0$ 2.09 Series F of 1955 $ 51.00 100,000 5.0 5.0 4.50 % Series of 1956 $ 50.75 104,000 5.2 5.2
4.96 % Series of 1958 $ 50.50 100,000 5.0 5.04.50 % Series of 1963 $ 50.50 160,000 8.0 8.05.28 % Series of 1967 $ 51.43 200,000 10.0 10.0
$ 3.24 Series G of 1968 $ 51.84 300,000 15.0 15.06.56 % Series of 1968 $ 51.44 200,000 10.0 10.0
Total CL&P 2,324,000 $ 116.2 $ 116.2
NSTAR Electric
4.25 % Series $ 103.625 180,000 $ 18.0 $ 18.04.78 % Series $ 102.80 250,000 25.0 25.0
Total NSTAR Electric 430,000 $ 43.0 $ 43.0Fair Value Adjustment due to Merger with NSTAR (3.6) (3.6)
Total NU - Preferred Stock of Subsidiaries $ 155.6 $ 155.6

100
18. COMMON SHAREHOLDERS' EQUITY AND NONCONTROLLING INTERESTS
A summary of the changes in Common Shareholders' Equity and Noncontrolling Interests of NU is as follows:
NoncontrollingCommon Interest -
Shareholders' Noncontrolling Total Preferred Stock(Millions of Dollars) Equity Interest Equity of Subsidiaries
Balance as of January 1, 2012 $ 4,012.7 $ 3.0 $ 4,015.7 $ 116.2Net Income 533.1 - 533.1 - Purchase Price of NSTAR (1) 5,038.3 - 5,038.3 - Other Equity Impacts of Merger with NSTAR (2) 3.4 (3.4) - 39.4Dividends on Common Shares (375.5) - (375.5) - Dividends on Preferred Stock (7.0) - (7.0) (7.0)Issuance of Common Shares 13.3 - 13.3 - Contributions to NPT - 0.3 0.3 - Other Transactions, Net 21.1 - 21.1 - Net Income Attributable to Noncontrolling Interests (0.1) 0.1 - 7.0Other Comprehensive Loss (2.2) - (2.2) -
Balance as of December 31, 2012 $ 9,237.1 $ - $ 9,237.1 $ 155.6Net Income 793.7 - 793.7 - Dividends on Common Shares (462.7) - (462.7) - Dividends on Preferred Stock (7.7) - (7.7) (7.7)Issuance of Common Shares 11.1 - 11.1 - Other Transactions, Net 13.2 - 13.2 - Net Income Attributable to Noncontrolling Interests - - - 7.7Other Comprehensive Income 26.8 - 26.8 -
Balance as of December 31, 2013 $ 9,611.5 $ - $ 9,611.5 $ 155.6Net Income 827.1 - 827.1 - Dividends on Common Shares (496.5) - (496.5) - Dividends on Preferred Stock (7.5) - (7.5) (7.5)Issuance of Common Shares 6.6 - 6.6 - Other Transactions, Net 63.6 - 63.6 - Net Income Attributable to Noncontrolling Interests - - - 7.5Other Comprehensive Loss (28.0) - (28.0) -
Balance as of December 31, 2014 $ 9,976.8 $ - $ 9,976.8 $ 155.6
(1) On April 10, 2012, NU issued approximately 136 million common shares to the NSTAR shareholders in connection with the merger. See Note 21, "Merger of NU and NSTAR," for further information.
(2) The preferred stock of NSTAR Electric is not subject to mandatory redemption and has been presented as a noncontrolling interest in NSTAR Electric in NU's financial statements. In addition, upon completion of the merger, an NSTAR subsidiary that held 25 percent of NPT was merged into EETV, resulting in EETV owning 100 percent of NPT. Accordingly, the noncontrolling interest balance was eliminated and 100 percent ownership of NPT was reflected in Common Shareholders' Equity.
For the years ended December 31, 2014, 2013 and 2012, there was no change in ownership of the common equity of CL&P and NSTAR Electric.
19. EARNINGS PER SHARE
Basic EPS is computed based upon the weighted average number of common shares outstanding during each period. Diluted EPS is computed on the basis of the weighted average number of common shares outstanding plus the potential dilutive effect of certain share-based compensation awards as if they were converted into common shares. For the years ended December 31, 2014, 2013 and 2012, there were 3,643, 1,575 and 4,266, respectively, antidilutive share awards excluded from the computation.
The following table sets forth the components of basic and diluted EPS:
For the Years Ended December 31,(Millions of Dollars, except share information) 2014 2013 2012
Net Income Attributable to Controlling Interest $ 819.5 $ 786.0 $ 525.9
Weighted Average Common Shares Outstanding:Basic 316,136,748 315,311,387 277,209,819Dilutive Effect 1,280,666 899,773 783,812Diluted 317,417,414 316,211,160 277,993,631
Basic EPS $ 2.59 $ 2.49 $ 1.90Diluted EPS $ 2.58 $ 2.49 $ 1.89
On April 10, 2012, NU issued approximately 136 million common shares as a result of the merger with NSTAR, which are reflected in the weighted average common shares outstanding.

101
RSUs and performance shares are included in basic weighted average common shares outstanding as of the date that all necessary vesting conditions have been satisfied. The dilutive effect of unvested RSUs and performance shares is calculated using the treasury stock method. Assumed proceeds of these units under the treasury stock method consist of the remaining compensation cost to be recognized and a theoretical tax benefit. The theoretical tax benefit is calculated as the tax impact of the intrinsic value of the units (the difference between the market value of the average units outstanding for the period, using the average market price during the period, and the grant date market value).
The dilutive effect of stock options to purchase common shares is also calculated using the treasury stock method. Assumed proceeds for stock options consist of cash proceeds that would be received upon exercise, and a theoretical tax benefit. The theoretical tax benefit is calculated as the tax impact of the intrinsic value of the stock options (the difference between the market value of the average stock options outstanding for the period, using the average market price during the period, and the exercise price).
20. SEGMENT INFORMATION
Presentation: NU is organized between the Electric Distribution, Electric Transmission and Natural Gas Distribution reportable segments and Other based on a combination of factors, including the characteristics of each segments' products and services, the sources of operating revenues and expenses and the regulatory environment in which each segment operates. These reportable segments represented substantially all of NU's total consolidated revenues for the years ended December 31, 2014, 2013 and 2012. Revenues from the sale of electricity and natural gas primarily are derived from residential, commercial and industrial customers and are not dependent on any single customer. The Electric Distribution reportable segment includes the generation activities of PSNH and WMECO.
The remainder of NU's operations is presented as Other in the tables below and primarily consists of 1) the equity in earnings of NU parent from its subsidiaries and intercompany interest income, both of which are eliminated in consolidation, and interest expense related to the debt of NU parent, 2) the revenues and expenses of NU's service company, most of which are eliminated in consolidation, 3) the operations of CYAPC and YAEC, and 4) the results of other non-regulated subsidiaries, which are not part of its core business.
Cash flows used for investments in plant included in the segment information below are cash capital expenditures that do not include amounts incurred but not paid, cost of removal, AFUDC related to equity funds, and the capitalized portions of pension expense.
NU's reportable segments are determined based upon the level at which NU's chief operating decision maker assesses performance and makes decisions about the allocation of company resources. Each of NU's subsidiaries, including CL&P, NSTAR Electric, PSNH and WMECO, has one reportable segment. NU's operating segments and reporting units are consistent with its reportable business segments.
NSTAR amounts were included in NU beginning April 10, 2012.

102
NU's segment information is as follows:
For the Year Ended December 31, 2014
Electric Natural Gas(Millions of Dollars) Distribution Distribution Transmission Other Eliminations Total
Operating Revenues $ 5,663.4 $ 1,007.3 $ 1,018.2 $ 790.9 $ (737.9) $ 7,741.9Depreciation and Amortization (384.6) (68.1) (150.5) (42.1) 19.9 (625.4)Other Operating Expenses (4,366.2) (786.7) (302.1) (748.0) 719.3 (5,483.7)Operating Income 912.6 152.5 565.6 0.8 1.3 1,632.8Interest Expense (191.6) (34.0) (104.1) (36.6) 4.2 (362.1)Interest Income 5.1 - 0.9 3.6 (3.6) 6.0Other Income, Net 10.7 0.2 10.3 916.0 (918.6) 18.6Income Tax (Expense)/Benefit (269.7) (46.4) (174.5) 22.3 - (468.3)Net Income 467.1 72.3 298.2 906.1 (916.7) 827.0Net Income Attributable to Noncontrolling Interests (4.7) - (2.8) - - (7.5)Net Income Attributable to Controlling Interest $ 462.4 $ 72.3 $ 295.4 $ 906.1 $ (916.7) $ 819.5Total Assets (as of) $ 17,563.4 $ 3,030.9 $ 7,625.6 $ 12,682.5 $ (11,124.4) $ 29,778.0Cash Flows Used for Investments in Plant $ 645.2 $ 176.7 $ 731.6 $ 50.2 $ - $ 1,603.7
For the Year Ended December 31, 2013
Electric Natural Gas(Millions of Dollars) Distribution Distribution Transmission Other Eliminations Total
Operating Revenues $ 5,362.3 $ 855.8 $ 978.7 $ 777.5 $ (673.1) $ 7,301.2Depreciation and Amortization (604.8) (66.7) (136.2) (62.2) 10.2 (859.7)Other Operating Expenses (3,927.7) (659.4) (281.8) (715.0) 671.8 (4,912.1)Operating Income 829.8 129.7 560.7 0.3 8.9 1,529.4Interest Expense (175.0) (33.1) (100.3) (35.5) 5.2 (338.7)Interest Income 4.1 - 0.7 5.4 (5.6) 4.6Other Income, Net 12.9 0.8 10.9 858.9 (858.2) 25.3Income Tax (Expense)/Benefit (240.0) (36.5) (182.1) 31.9 (0.2) (426.9)Net Income 431.8 60.9 289.9 861.0 (849.9) 793.7Net Income Attributable to Noncontrolling Interests (4.8) - (2.9) - - (7.7)Net Income Attributable to Controlling Interest $ 427.0 $ 60.9 $ 287.0 $ 861.0 $ (849.9) $ 786.0Total Assets (as of) $ 17,260.0 $ 2,759.7 $ 6,745.8 $ 11,842.4 $ (10,812.4) $ 27,795.5Cash Flows Used for Investments in Plant $ 639.0 $ 168.1 $ 618.5 $ 31.2 $ - $ 1,456.8
For the Year Ended December 31, 2012
Electric Natural Gas(Millions of Dollars) Distribution Distribution Transmission Other Eliminations Total
Operating Revenues $ 4,716.5 $ 572.9 $ 861.5 $ 803.8 $ (680.9) $ 6,273.8Depreciation and Amortization (530.3) (49.1) (109.2) (56.4) 4.2 (740.8)Other Operating Expenses (3,585.4) (445.2) (251.6) (817.0) 684.4 (4,414.8)Operating Income/(Loss) 600.8 78.6 500.7 (69.6) 7.7 1,118.2Interest Expense (165.6) (31.3) (96.7) (43.6) 7.3 (329.9)Interest Income 2.8 - 0.4 7.1 (7.1) 3.2Other Income, Net 8.9 0.4 7.3 795.0 (795.1) 16.5Income Tax (Expense)/Benefit (150.2) (16.9) (159.2) 55.5 (4.1) (274.9)Net Income 296.7 30.8 252.5 744.4 (791.3) 533.1Net Income Attributable to Noncontrolling Interests (4.4) - (2.8) - - (7.2)Net Income Attributable to Controlling Interest $ 292.3 $ 30.8 $ 249.7 $ 744.4 $ (791.3) $ 525.9Cash Flows Used for Investments in Plant $ 611.7 $ 148.7 $ 663.6 $ 48.3 $ - $ 1,472.3
21. MERGER OF NU AND NSTAR
On April 10, 2012, NU acquired 100 percent of the outstanding common shares of NSTAR. Pursuant to the terms and conditions of the Agreement and Plan of Merger, as amended, (the "Merger Agreement,") NSTAR and its subsidiaries became wholly-owned subsidiaries of NU.
NSTAR was a holding company engaged through its subsidiaries in the energy delivery business serving electric and natural gas distribution customers in Massachusetts. As part of the merger, NSTAR shareholders received 1.312 NU common shares for each NSTAR common share owned (the "exchange ratio") as of the acquisition date. NU issued approximately 136 million common shares to the NSTAR shareholders as a result of the merger.
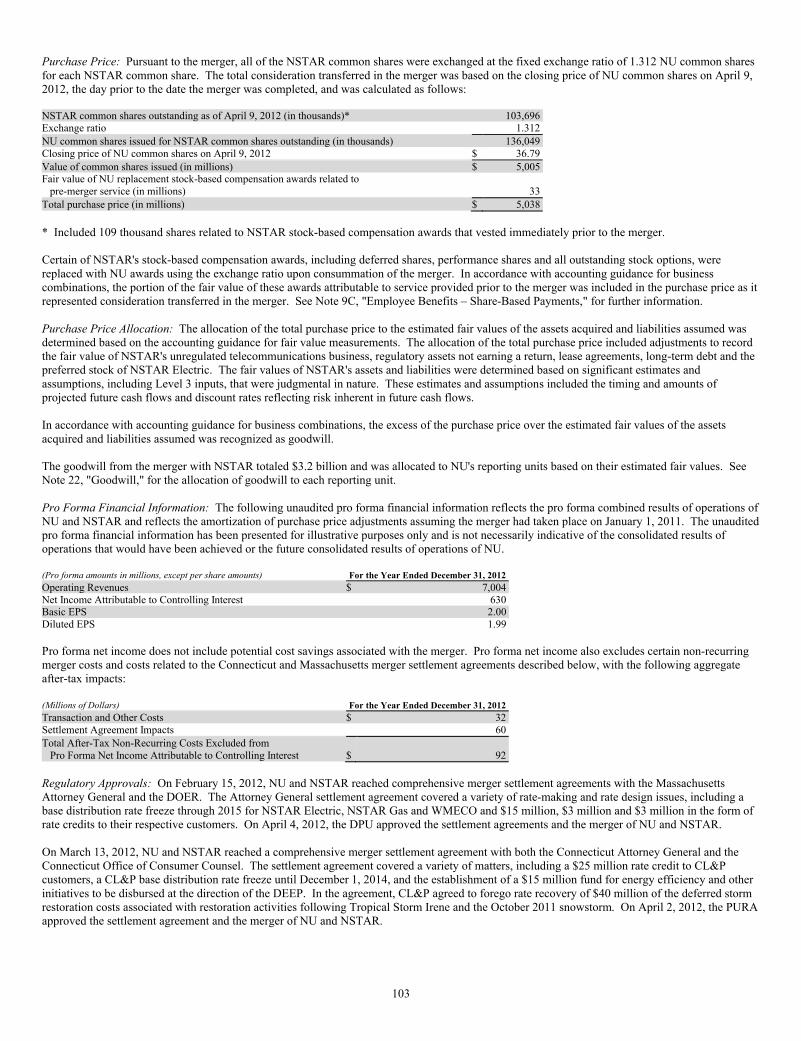
103
Purchase Price: Pursuant to the merger, all of the NSTAR common shares were exchanged at the fixed exchange ratio of 1.312 NU common shares for each NSTAR common share. The total consideration transferred in the merger was based on the closing price of NU common shares on April 9, 2012, the day prior to the date the merger was completed, and was calculated as follows:
NSTAR common shares outstanding as of April 9, 2012 (in thousands)* 103,696Exchange ratio 1.312NU common shares issued for NSTAR common shares outstanding (in thousands) 136,049Closing price of NU common shares on April 9, 2012 $ 36.79Value of common shares issued (in millions) $ 5,005Fair value of NU replacement stock-based compensation awards related to pre-merger service (in millions) 33Total purchase price (in millions) $ 5,038
* Included 109 thousand shares related to NSTAR stock-based compensation awards that vested immediately prior to the merger.
Certain of NSTAR's stock-based compensation awards, including deferred shares, performance shares and all outstanding stock options, were replaced with NU awards using the exchange ratio upon consummation of the merger. In accordance with accounting guidance for business combinations, the portion of the fair value of these awards attributable to service provided prior to the merger was included in the purchase price as it represented consideration transferred in the merger. See Note 9C, "Employee Benefits – Share-Based Payments," for further information.
Purchase Price Allocation: The allocation of the total purchase price to the estimated fair values of the assets acquired and liabilities assumed was determined based on the accounting guidance for fair value measurements. The allocation of the total purchase price included adjustments to record the fair value of NSTAR's unregulated telecommunications business, regulatory assets not earning a return, lease agreements, long-term debt and the preferred stock of NSTAR Electric. The fair values of NSTAR's assets and liabilities were determined based on significant estimates and assumptions, including Level 3 inputs, that were judgmental in nature. These estimates and assumptions included the timing and amounts of projected future cash flows and discount rates reflecting risk inherent in future cash flows.
In accordance with accounting guidance for business combinations, the excess of the purchase price over the estimated fair values of the assets acquired and liabilities assumed was recognized as goodwill.
The goodwill from the merger with NSTAR totaled $3.2 billion and was allocated to NU's reporting units based on their estimated fair values. See Note 22, "Goodwill," for the allocation of goodwill to each reporting unit.
Pro Forma Financial Information: The following unaudited pro forma financial information reflects the pro forma combined results of operations of NU and NSTAR and reflects the amortization of purchase price adjustments assuming the merger had taken place on January 1, 2011. The unaudited pro forma financial information has been presented for illustrative purposes only and is not necessarily indicative of the consolidated results of operations that would have been achieved or the future consolidated results of operations of NU.
(Pro forma amounts in millions, except per share amounts) For the Year Ended December 31, 2012
Operating Revenues $ 7,004Net Income Attributable to Controlling Interest 630Basic EPS 2.00Diluted EPS 1.99
Pro forma net income does not include potential cost savings associated with the merger. Pro forma net income also excludes certain non-recurring merger costs and costs related to the Connecticut and Massachusetts merger settlement agreements described below, with the following aggregate after-tax impacts:
(Millions of Dollars) For the Year Ended December 31, 2012
Transaction and Other Costs $ 32Settlement Agreement Impacts 60Total After-Tax Non-Recurring Costs Excluded from Pro Forma Net Income Attributable to Controlling Interest $ 92
Regulatory Approvals: On February 15, 2012, NU and NSTAR reached comprehensive merger settlement agreements with the Massachusetts Attorney General and the DOER. The Attorney General settlement agreement covered a variety of rate-making and rate design issues, including a base distribution rate freeze through 2015 for NSTAR Electric, NSTAR Gas and WMECO and $15 million, $3 million and $3 million in the form of rate credits to their respective customers. On April 4, 2012, the DPU approved the settlement agreements and the merger of NU and NSTAR.
On March 13, 2012, NU and NSTAR reached a comprehensive merger settlement agreement with both the Connecticut Attorney General and the Connecticut Office of Consumer Counsel. The settlement agreement covered a variety of matters, including a $25 million rate credit to CL&P customers, a CL&P base distribution rate freeze until December 1, 2014, and the establishment of a $15 million fund for energy efficiency and other initiatives to be disbursed at the direction of the DEEP. In the agreement, CL&P agreed to forego rate recovery of $40 million of the deferred storm restoration costs associated with restoration activities following Tropical Storm Irene and the October 2011 snowstorm. On April 2, 2012, the PURA approved the settlement agreement and the merger of NU and NSTAR.

104
The pre-tax financial impacts of the Connecticut and Massachusetts merger settlement agreements that were recognized in 2012 by NU, CL&P, NSTAR Electric, and WMECO are summarized as follows:
(Millions of Dollars) NU CL&P NSTAR Electric WMECO
Customer Rate Credits $ 46 $ 25 $ 15 $ 3Storm Costs Deferral Reduction 40 40 - - Establishment of Energy Efficiency Fund 15 - - - Total Pre-Tax Settlement Agreement Impacts $ 101 $ 65 $ 15 $ 3
22. GOODWILL
In accordance with the accounting standards, goodwill is not subject to amortization. However, goodwill is subject to fair value-based rules for measuring impairment, and resulting write-downs, if any, are charged to Operating Expenses. These accounting standards require that goodwill be reviewed at least annually for impairment and whenever facts or circumstances indicate that there may be an impairment. NU uses October 1st as the annual goodwill impairment testing date.
On April 10, 2012, upon consummation of the merger with NSTAR, NU recorded approximately $3.2 billion of goodwill. With the completion of the merger, NU reviewed its management structure and determined that the reporting units for the purpose of testing goodwill for impairment are Electric Distribution, Electric Transmission and Natural Gas Distribution. NU's reporting units are consistent with the operating segments underlying the reportable segments identified in Note 20, "Segment Information," to the financial statements. Accordingly, the goodwill resulting from the merger was allocated to the Electric Distribution, Electric Transmission and Natural Gas Distribution reporting units based on the estimated fair values of the reporting units as of the merger date.
Prior to the merger with NSTAR, the only reporting unit that maintained goodwill was the Natural Gas Distribution reportable segment related to the acquisition of the parent of Yankee Gas in 2000. This goodwill was recorded at Yankee Gas. The goodwill balance at Yankee Gas as of December 31, 2014 and 2013 was $0.3 billion.
NU completed its annual goodwill impairment test for each of its reporting units as of October 1, 2014 and determined that no impairment exists. There were no events subsequent to October 1, 2014 that indicated impairment of goodwill.
There were no changes to the goodwill balance or the allocation of goodwill as of December 31, 2014 or 2013. The allocation of goodwill to NU's reporting units as of both December 31, 2014 and 2013 was as follows:
Electric Electric Natural Gas
(Billions of Dollars) Distribution Transmission Distribution Total
Goodwill Allocation $ 2.5 $ 0.6 $ 0.4 $ 3.5
23. VARIABLE INTEREST ENTITIES
The Company's variable interests outside of the consolidated group are not material and consist of contracts that are required by regulation and provide for regulatory recovery of contract costs and benefits through customer rates. NU, CL&P and NSTAR Electric hold variable interests in variable interest entities (VIEs) through agreements with certain entities that own single renewable energy or peaking generation power plants and with other independent power producers. NU, CL&P and NSTAR Electric do not control the activities that are economically significant to these VIEs or provide financial or other support to these VIEs. Therefore, NU, CL&P and NSTAR Electric do not consolidate any power plant VIEs.
24. QUARTERLY FINANCIAL DATA (UNAUDITED)
NU Consolidated Statements of Quarterly Financial Data Quarter Ended
(Millions of Dollars, except per share information) March 31, June 30, September 30, December 31,
2014
Operating Revenues $ 2,290.6 $ 1,677.6 $ 1,892.5 $ 1,881.2 Operating Income 467.7 294.0 440.9 430.2 Net Income 237.8 129.2 236.5 223.6 Net Income Attributable to Controlling Interest 236.0 127.4 234.6 221.5 Basic EPS (a) $ 0.75 $ 0.40 $ 0.74 $ 0.69 Diluted EPS (a) $ 0.74 $ 0.40 $ 0.74 $ 0.69
2013
Operating Revenues $ 1,995.0 $ 1,635.9 $ 1,892.6 $ 1,777.7 Operating Income 418.9 350.6 399.3 360.6 Net Income 230.0 173.1 211.4 179.2 Net Income Attributable to Controlling Interest 228.1 171.0 209.5 177.4 Basic and Diluted EPS (a) $ 0.72 $ 0.54 $ 0.66 $ 0.56
(a) The summation of quarterly EPS data may not equal annual data due to rounding.

105
Statements of Quarterly Financial Data Quarter Ended
(Millions of Dollars) March 31, June 30, September 30, December 31,
CL&P2014
Operating Revenues $ 734.6 $ 587.3 $ 695.6 $ 675.1 Operating Income 158.0 92.1 146.2 159.0 Net Income 79.3 37.4 83.9 87.2
2013
Operating Revenues $ 624.1 $ 569.3 $ 648.4 $ 600.5 Operating Income 149.7 136.8 133.9 119.2 Net Income 85.0 67.9 66.3 60.2
NSTAR Electric2014
Operating Revenues $ 666.2 $ 561.5 $ 727.9 $ 581.1 Operating Income 118.4 121.5 206.6 132.0 Net Income 58.1 60.1 115.6 69.3
2013
Operating Revenues $ 592.3 $ 570.4 $ 753.9 $ 576.9 Operating Income 94.5 112.5 192.0 109.2 Net Income 48.1 58.0 107.0 55.4
PSNH 2014
Operating Revenues $ 299.8 $ 211.6 $ 223.7 $ 224.4 Operating Income 64.0 49.0 56.4 60.0 Net Income 32.6 24.1 28.2 29.0
2013
Operating Revenues $ 273.8 $ 216.1 $ 218.6 $ 226.9 Operating Income 58.1 54.3 56.6 56.2 Net Income 29.0 27.2 28.4 26.8
WMECO2014
Operating Revenues $ 137.4 $ 108.3 $ 118.1 $ 129.6 Operating Income 34.7 17.7 31.2 34.0 Net Income 18.1 7.0 14.7 18.0
2013
Operating Revenues $ 125.0 $ 115.0 $ 121.8 $ 110.9 Operating Income 35.6 32.4 28.9 22.4 Net Income 18.6 16.4 15.0 10.4

106
Item 9. Changes in and Disagreements with Accountants on Accounting and Financial Disclosure
No events that would be described in response to this item have occurred with respect to NU, CL&P, NSTAR Electric, PSNH or WMECO.
Item 9A. Controls and Procedures
Management, on behalf of NU, CL&P, NSTAR Electric, PSNH and WMECO, is responsible for the preparation, integrity, and fair presentation of the accompanying Consolidated Financial Statements and other sections of this combined Annual Report on Form 10-K. NU's internal controls over financial reporting were audited by Deloitte & Touche LLP.
Management, on behalf of NU, CL&P, NSTAR Electric, PSNH and WMECO, is responsible for establishing and maintaining adequate internal controls over financial reporting. The internal control framework and processes have been designed to provide reasonable assurance regarding the reliability of financial reporting and the preparation of financial statements for external purposes in accordance with GAAP. There are inherent limitations of internal controls over financial reporting that could allow material misstatements due to error or fraud to occur and not be prevented or detected on a timely basis by employees during the normal course of business. Additionally, internal controls over financial reporting may become inadequate in the future due to changes in the business environment. Under the supervision and with the participation of the principal executive officer and principal financial officer, an evaluation of the effectiveness of internal controls over financial reporting was conducted based on criteria established in Internal Control - Integrated Framework (2013) issued by the Committee of Sponsoring Organizations of the Treadway Commission (COSO). Based on this evaluation under the framework in COSO, management concluded that internal controls over financial reporting at NU, CL&P, NSTAR Electric, PSNH and WMECO were effective as of December 31, 2014.
Management, on behalf of NU, CL&P, NSTAR Electric, PSNH and WMECO, evaluated the design and operation of the disclosure controls and procedures as of December 31, 2014 to determine whether they are effective in ensuring that the disclosure of required information is made timely and in accordance with the Securities Exchange Act of 1934 and the rules and regulations of the SEC. This evaluation was made under management's supervision and with management's participation, including the principal executive officer and principal financial officer as of the end of the period covered by this Annual Report on Form 10-K. There are inherent limitations of disclosure controls and procedures, including the possibility of human error and the circumventing or overriding of the controls and procedures. Accordingly, even effective disclosure controls and procedures can only provide reasonable assurance of achieving their control objectives. The principal executive officer and principal financial officer have concluded, based on their review, that the disclosure controls and procedures of NU, CL&P, NSTAR Electric, PSNH and WMECO are effective to ensure that information required to be disclosed by us in reports filed under the Securities Exchange Act of 1934 (i) is recorded, processed, summarized, and reported within the time periods specified in SEC rules and regulations and (ii) is accumulated and communicated to management, including the principal executive officer and principal financial officer, as appropriate to allow timely decisions regarding required disclosures.
During the third quarter of 2014, we implemented a new general ledger system resulting in a material change in internal controls over financial reporting. This new system, which went live effective August 1, 2014, standardized the financial systems for the merged companies and allows for a common set of accounting processes, practices and data structures across all operating companies. Pre-implementation testing and post-implementation reviews were conducted by management to ensure that internal controls surrounding the system implementation process, the applications, and the closing process were properly designed to prevent material financial statement errors. Such procedures included the review of required documents, user acceptance testing, change management procedures, access controls, data migration strategies and reconciliations, application interface testing and other standard application controls.
There have been no other changes in internal controls over financial reporting for NU, CL&P, NSTAR Electric, PSNH and WMECO during the quarter ended December 31, 2014 that have materially affected, or are reasonably likely to materially affect, internal controls over financial reporting.
Item 9B. Other Information
No information is required to be disclosed under this item as of December 31, 2014, as this information has been previously disclosed in applicable reports on Form 8-K during the fourth quarter of 2014.

107
PART III
Item 10. Directors, Executive Officers and Corporate Governance
The information in Item 10 is provided as of February 18, 2015, except where otherwise indicated.
Certain information required by this Item 10 is omitted for NSTAR Electric, PSNH and WMECO pursuant to Instruction I(2)(c) to Form 10-K, Omission of Information by Certain Wholly Owned Subsidiaries.
NU
In addition to the information provided below concerning the executive officers of NU, incorporated herein by reference is the information to be contained in the sections captioned "Election of Trustees," "Governance of Northeast Utilities" and the related subsections, "Selection of Trustees," and "Section 16(a) Beneficial Ownership Reporting Compliance" of NU's definitive proxy statement for solicitation of proxies, expected to be filed with the SEC on or about March 13, 2015.
CL&P
The information required by this Item 10 for CL&P has been omitted from this report but is set forth in the Annual Report on Form 10-K for 2014 filed with the SEC on a combined basis with NU on February 25, 2015. Such report is also available at the Investors section at www.eversource.com.
Item 11. Executive Compensation
NU
The information required by this Item 11 for NU is incorporated herein by reference to certain information contained in NU's definitive proxy statement for solicitation of proxies, which is expected to be filed with the SEC on or about March 13, 2015, under the sections captioned "Compensation Discussion and Analysis," plus related subsections, and "Compensation Committee Report," plus related subsections following such Report.
NSTAR ELECTRIC, PSNH and WMECO
Certain information required by this Item 11 has been omitted for NSTAR Electric, PSNH and WMECO pursuant to Instruction I(2)(c) to Form 10-K, Omission of Information by Certain Wholly Owned Subsidiaries.
CL&P
The information required by this Item 11 for CL&P has been omitted from this report but is set forth in the Annual Report on Form 10-K for 2014 filed with the SEC on a combined basis with NU on February 25, 2015. Such report is also available at the Investors section at www.eversource.com.
Item 12. Security Ownership of Certain Beneficial Owners and Management and Related Stockholder Matters
NU
In addition to the information below under "Securities Authorized for Issuance Under Equity Compensation Plans," incorporated herein by reference is the information contained in the sections "Common Share Ownership of Certain Beneficial Owners" and "Common Share Ownership of Trustees and Management" of NU’s definitive proxy statement for solicitation of proxies, expected to be filed with the SEC on or about March 13, 2015.
NSTAR ELECTRIC, PSNH and WMECO
Certain information required by this Item 12 has been omitted for NSTAR Electric, PSNH and WMECO pursuant to Instruction I(2)(c) to Form 10-K, Omission of Information by Certain Wholly-Owned Subsidiaries.
CL&P
The information required by this Item 12 for CL&P has been omitted from this report but is set forth in the Annual Report on Form 10-K for 2014 filed with the SEC on a combined basis with NU on February 25, 2015. Such report is also available at the Investors section at www.eversource.com.

108
SECURITIES AUTHORIZED FOR ISSUANCE UNDER EQUITY COMPENSATION PLANS
The following table sets forth the number of NU common shares issuable under NU equity compensation plans, as well as their weighted exercise price, as of December 31, 2014, in accordance with the rules of the SEC:
Plan Category
Number of securities to be
issued upon exercise of
outstanding options,
warrants and rights
(a)
Weighted-average exercise
price of outstanding
options, warrants and
rights
(b)
Number of securities remaining
available for future issuance
under equity compensation
plans (excluding securities
reflected in column (a))
(c)
Equity compensation plans
approved by security holders 2,108,007 $26.69 3,888,995
Equity compensation plans not
approved by security holders (d) — — —
Total 2,108,007 $26.69 3,888,995
(a) Includes 351,616 common shares to be issued upon exercise of options, 1,380,747 common shares for distribution of restricted share units, and 375,644 performance shares issuable at target, all pursuant to the terms of our Incentive Plans.
(b) The weighted-average exercise price in Column (b) does not take into account restricted share units or performance shares, which have no exercise price.
(c) Includes 776,975 common shares issuable under our Employee Share Purchase Plan II.(d) All of our current compensation plans under which equity securities of NU are authorized for issuance have been approved by shareholders of
NU or the former shareholders of NSTAR.
Item 13. Certain Relationships and Related Transactions, and Director Independence
NU
Incorporated herein by reference is the information contained in the sections captioned "Trustee Independence" and "Certain Relationships and Related Transactions" of NU's definitive proxy statement for solicitation of proxies, expected to be filed with the SEC on or about March 13, 2015.
NSTAR ELECTRIC, PSNH and WMECO
Certain information required by this Item 13 has been omitted for NSTAR Electric, PSNH and WMECO pursuant to Instruction I(2)(c) to Form 10-K, Omission of Information by Certain Wholly-Owned Subsidiaries.
CL&P
The information required by this Item 13 for CL&P has been omitted from this report but is set forth in the Annual Report on Form 10-K for 2014 filed with the SEC on a combined basis with NU on February 25, 2015. Such report is also available at the Investors section at www.eversource.com.
Item 14. Principal Accountant Fees and Services
NU
Incorporated herein by reference is the information contained in the section "Relationship with Independent Auditors" of NU's definitive proxy statement for solicitation of proxies, expected to be filed with the SEC on or about March 13, 2015.
CL&P, NSTAR ELECTRIC, PSNH and WMECO
The information required by this Item 14 for CL&P, NSTAR Electric, PSNH and WMECO has been omitted from this report but is set forth in the Annual Report on Form 10-K for 2014 filed with the SEC on a combined basis with NU on February 25, 2015. Such report is also available at the Investors section at www.eversource.com.

109
PART IV
Item 15. Exhibits and Financial Statement Schedules
(a) 1. Financial Statements:
The financial statements filed as part of this Annual Report on Form 10-K are set forth under Item 8, "Financial Statements and Supplementary Data."
2. Schedules
I. Financial Information of Registrant:Northeast Utilities (Parent) Balance Sheets as of December 31, 2014 and 2013 *
Northeast Utilities (Parent) Statements of Income for the Years EndedDecember 31, 2014, 2013 and 2012 *
Northeast Utilities (Parent) Statements of Comprehensive Income for the Years Ended December 31, 2014, 2013 and 2012 *
Northeast Utilities (Parent) Statements of Cash Flows for the Years EndedDecember 31, 2014, 2013 and 2012 *
II. Valuation and Qualifying Accounts and Reserves for NU, CL&P, NSTAR Electric, PSNH and WMECO for 2014, 2013 and 2012 *
All other schedules of the companies for which inclusion is required in the applicable regulations of the SEC are permitted to be omitted under the related instructions or are not applicable, and therefore have been omitted.
3. Exhibit Index E-1
* The schedules have been omitted from this report because they are not required. They are set forth in the Annual Report on Form 10-K for 2014 filed with the SEC on a combined basis with NU on February 25, 2015. Such report is also available at the Investors section at www.eversource.com.

110
NORTHEAST UTILITIES
SIGNATURES
Pursuant to the requirements of Section 13 or 15(d) of the Securities Exchange Act of 1934, the Registrant has duly caused this report to be signed on its behalf by the undersigned, thereunto duly authorized.
NORTHEAST UTILITIES
February 25, 2015 By: /s/ Jay S. ButhJay S. ButhVice President, Controller and Chief Accounting Officer
Pursuant to the requirements of the Securities Exchange Act of 1934, this report has been signed below by the following persons on behalf of the Registrant and in the capacities and on the dates indicated.
POWER OF ATTORNEY
Each person whose signature appears below constitutes and appoints Gregory B. Butler, James J. Judge and Jay S. Buth and each of them, his or her true and lawful attorneys-in-fact and agents, with full power of substitution and resubstitution, for him or her and in his or her name, place and stead, in any and all capacities, to sign any and all amendments to this Annual Report on Form 10-K, and to file the same, with all exhibits thereto, and other documents in connection therewith, with the Securities and Exchange Commission, granting unto said attorneys-in-fact and agents, and each of them, full power and authority to do and perform each and every act and thing requisite and necessary to be done, as fully to all intents and purposes as he or she might or could do in person, hereby ratifying and confirming all that said attorneys-in-fact and agents or any of them, or their or his or her substitute or substitutes, may lawfully do or cause to be done by virtue hereof.
Signature Title Date
/s/ Thomas J. May Chairman, President and February 25, 2015Thomas J. May Chief Executive Officer, and a Trustee
(Principal Executive Officer)
/s/ James J. Judge Executive Vice President and February 25, 2015James J Judge Chief Financial Officer
(Principal Financial Officer)
/s/ Jay S. Buth Vice President, Controller February 25, 2015Jay S. Buth and Chief Accounting Officer
/s/ Richard H. Booth Trustee February 25, 2015Richard H. Booth
/s/ John S. Clarkeson Trustee February 25, 2015John S. Clarkeson
/s/ Cotton M. Cleveland Trustee February 25, 2015Cotton M. Cleveland
/s/ Sanford Cloud, Jr. Trustee February 25, 2015Sanford Cloud, Jr.
/s/ James S. DiStasio Trustee February 25, 2015James S. DiStasio
/s/ Francis A. Doyle Trustee February 25, 2015Francis A. Doyle

111
/s/ Charles K. Gifford Trustee February 25, 2015Charles K. Gifford
/s/ Paul A. La Camera Trustee February 25, 2015Paul A. La Camera
/s/ Kenneth R. Leibler Trustee February 25, 2015Kenneth R. Leibler
/s/ William C. Van Faasen Trustee February 25, 2015William C. Van Faasen
/s/ Frederica M. Williams Trustee February 25, 2015Frederica M. Williams
/s/ Dennis R. Wraase Trustee February 25, 2015Dennis R. Wraase

E-1
EXHIBIT INDEX
Each document described below is incorporated by reference by the registrant(s) listed to the files identified, unless designated with a (*), which exhibits are filed herewith. Management contracts and compensation plans or arrangements are designated with a (+).
The portion of the Exhibit Index listing exhibits of CL&P, NSTAR Electric, PSNH and WMECO has been omitted from this report but is set forth in the Annual Report on Form 10-K for 2014 filed with the SEC on a combined basis with NU on February 25, 2015. Such report is also available at the Investors section at www.eversource.com.
ExhibitNumber Description
3. Articles of Incorporation and By-Laws
3.1 Declaration of Trust of NU, as amended through May 10, 2005 (Exhibit A.1, NU Form U-1 filed June 23, 2005, File No. 70-10315)
4. Instruments defining the rights of security holders, including indentures
4.1 Indenture between NU and The Bank of New York as Trustee dated as of April 1, 2002 (Exhibit A-3, NU 35-CERT filed April 16, 2002, File No. 070-09535)
4.1.1 Fifth Supplemental Indenture between NU and The Bank of New York Trust Company N.A., as Trustee, dated as of May 1, 2013, relating to $300 million of Senior Notes, Series E, due 2018 and $400 million of Senior Notes, Series F, due 2023 (Exhibit 4.1, NU Current Report on Form 8-K filed May 16, 2013, File No. 001-05324)
4.1.2 Sixth Supplemental Indenture between NU and The Bank of New York Trust Company N.A., as Trustee, dated as of January 1, 2015, relating to $150 million of Senior Notes, Series G, due 2018 and $300 million of Senior Notes, Series H, due 2025 (Exhibit 4.1, NU Current Report on Form 8-K filed January 21, 2015, File No. 001-05324)
4.2 Indenture dated as of January 12, 2000, between NU, as successor to NSTAR LLC, as successor to NSTAR, and Bank One Trust Company N.A. (Exhibit 4.1 to NSTAR Registration Statement on Form S-3, File No. 333-94735)
4.2.1 Form of 4.50% Debenture Due 2019 (Exhibit 99.2, NSTAR Form 8-K filed November 16, 2009, File No. 001-14768)
4.3 Credit Agreement, dated July 25, 2012, by and among NU, CL&P, NSTAR Gas, NSTAR LLC, PSNH, WMECO, Yankee Gas Services Company and the Banks named therein, pursuant to which Bank of America, N.A. serves as Administrative Agent (Exhibit 4.1, NU Form 10-Q for the Quarter Ended September 30, 2012, filed November 7, 2012, File No. 001-05324)
4.3.1 First Amendment to Credit Agreement, dated September 6, 2013, by and among NU, CL&P, NSTAR Gas, NSTAR LLC, PSNH, WMECO, Yankee Gas Services Company and the Banks named therein, pursuant to which Bank of America, N.A. serves as Administrative Agent (Exhibit 4.1, NU Current Report on Form 8-K filed September 12, 2013, File No. 001-05324)
10. Material Contracts
(A) NU
10.1 Lease between The Rocky River Realty Company and Northeast Utilities Service Company dated as of April 14, 1992 with respect to the Berlin, Connecticut headquarters (Exhibit 10.29.1, 1992 NU Form 10-K, File No. 001-05324)
10.2 Amended and Restated Indenture of Mortgage and Deed of Trust between Yankee Gas Services Company and the Bank of New York Mellon Trust company, N.A. formerly Connecticut National Bank, as Trustee, dated July 1, 1989, (Composite including all amendments effective January 1, 2014) (included as Exhibit B to the Eleventh Supplemental Indenture filed as Exhibit 10, NU Form 10-Q for the Quarter Ended March 31, 2014 filed May 2, 2014, File No. 001-05324)
10.2.1 First Supplemental Indenture of Mortgage and Deed of Trust between Yankee Gas Services Company and The Connecticut National Bank, as Trustee, dated April 1, 1992 (Yankee Energy System, Inc. Registration Statement on Form S-3, dated October 2, 1992, File No. 33-52750
10.2.2 Sixth Supplemental Indenture of Mortgage and Deed of Trust between Yankee Gas Services Company and The Bank of New York, as Successor Trustee to Fleet Bank (formerly The Connecticut National Bank) dated January 1, 2004 (Exhibit 10.5.6, 2004 NU Form 10-K filed March 17, 2005, File No. 001-05324)

E-2
10.2.3 Seventh Supplemental Indenture of Mortgage and Deed of Trust between Yankee Gas Services Company and The Bank of New York, as Successor Trustee to Fleet Bank (formerly The Connecticut National Bank) dated November 1, 2004 (Exhibit 10.5.7, 2004 NU Form 10-K filed March 17, 2005, File No. 001-05324)
10.2.4 Eighth Supplemental Indenture of Mortgage and Deed of Trust between Yankee Gas Services Company and The Bank of New York, as Successor Trustee to Fleet Bank (formerly the Connecticut National Bank) dated July 1, 2005 (Exhibit 10.5.8, NU Form 10-Q for the Quarter Ended June 30, 2005 filed August 8, 2005, File No. 001-05324)
10.2.5 Ninth Supplemental Indenture of Mortgage and Deed of Trust between Yankee Gas Services Company and The Bank of New York Mellon Trust Company, N.A., successor as Trustee to The Bank of New York, as successor to Fleet National Bank (formerly known as The Connecticut National Bank) dated as of October 1, 2008 (Exhibit 10-1, NU Form 10-Q for the Quarter Ended September 30, 2008 filed November 10, 2008, File No. 001-05324)
10.2.6 Tenth Supplemental Indenture of Mortgage and Deed of Trust between Yankee Gas Services Company and The Bank of New York Mellon Trust Company, N.A., successor as Trustee to The Bank of New York, as successor to Fleet National Bank (formerly known as The Connecticut National Bank), dated as of April 1, 2010 (Exhibit 10, NU Form 10-Q for the Quarter Ended March 31, 2010 filed May 7, 2010, File No. 001-05324)
10.2.7 Eleventh Supplemental Indenture of Mortgage and Deed of Trust between Yankee Gas Services Company and The Bank of New York Mellon Trust Company, N.A., successor as Trustee to The Bank of New York, as successor to Fleet National Bank (formerly known as The Connecticut National Bank), dated as of January 1, 2014 (Exhibit 10, NU Form 10-Q for the Quarter Ended March 31, 2014 filed May 2, 2014, File No. 001-05324)
* +10.3 Northeast Utilities Board of Trustees' Compensation Arrangement Summary
+10.4 Amended and Restated Northeast Utilities Deferred Compensation Plan for Trustees, effective January 1, 2009 (Exhibit 10.6, NU Form 10-Q for the Quarter Ended September 30, 2008 filed November 10, 2008, File No. 001-05324)
10.5 Composite Transmission Service Agreement, by and between Northern Pass Transmission LLC, as Owner and H.Q. Hydro Renewable Energy, Inc., as Purchaser dated October 4, 2010 and effective February 14, 2014
(B) NU, CL&P, PSNH and WMECO
10.1 Amended and Restated Form of Service Contract between each of NU, CL&P and WMECO and Northeast Utilities Service Company (NUSCO) dated as of January 1, 2014. (Exhibit 10.1, NU Form 10-K filed on February 25, 2014, File No. 001-05324)
10.2 Agreements among New England Utilities with respect to the Hydro-Quebec interconnection projects (Exhibits 10(u) and 10(v); 10(w), 10(x), and 10(y), 1990 and 1988, respectively, Form 10-K of New England Electric System, File No. 001-03446)
10.3 Transmission Operating Agreement between the Initial Participating Transmission Owners, Additional Participating Transmission Owners and ISO New England, Inc. dated as of February 1, 2005 (Exhibit 10.29, 2004 NU Form 10-K filed March 17, 2005, File No. 001-05324)
10.3.1 Rate Design and Funds Disbursement Agreement among the Initial Participating Transmission Owners, Additional Participating Transmission Owners and ISO New England, Inc., effective June 30, 2006 (Exhibit 10.22.1, 2006 NU Form 10-K filed March 1, 2007, File No. 001-05324)
10.4 Northeast Utilities Service Company Transmission and Ancillary Service Wholesale Revenue Allocation Methodology among The Connecticut Light and Power Company, Western Massachusetts Electric Company, Public Service Company of New Hampshire, Holyoke Water Power Company and Holyoke Power and Electric Company Trustee dated as of January 1, 2008 (Exhibit 10.1, NU Form 10-Q for the Quarter Ended March 31, 2008 filed May 9, 2008, File No. 001-05324)
+10.5 Amended and Restated Employment Agreement with Gregory B. Butler, effective January 1, 2009 (Exhibit 10.7, 2008 NU Form 10-K filed February 27, 2009, File No. 001-05324)
+10.6 Amended and Restated Employment Agreement with David R. McHale, effective January 1, 2009 (Exhibit 10.8, 2008 NU Form 10-K filed February 27, 2009, File No. 001-05324)
+10.7 Amended and Restated Memorandum Agreement between Northeast Utilities and Leon J. Olivier effective January 1, 2009 (Exhibit 10.9, 2008 NU Form 10-K filed February 27, 2009, File No. 001-05324)
+10.8 Amended and Restated Incentive Plan Effective January 1, 2009 (Exhibit 10.3, NU Form 10-Q for the Quarter Ended September 30, 2008 filed November 10, 2008, File No. 001-05324)
+10.9 Amended and Restated Supplemental Executive Retirement Plan for Officers of Northeast Utilities System Company effective January 1, 2009 (Exhibit 10.5, NU Form 10-Q for the Quarter Ended September 30, 2008 filed November 10, 2008, File No. 001-05324)

E-3
+10.10 Trust under Supplemental Executive Retirement Plan dated May 2, 1994 (Exhibit 10.33, 2002 NU Form 10-K filed March 21, 2003, File No. 001-05324)
+10.10.1 First Amendment to Trust Under Supplemental Executive Retirement Plan, effective as of December 10, 2002 (Exhibit 10 (B) 10.19.1, 2003 NU Form 10-K filed March 12, 2004, File No. 001-05324)
+10.10.2 Second Amendment to Trust Under Supplemental Executive Retirement Plan , effective as of November 12, 2008 (Exhibit 10.12.2, 2008 NU Form 10-K filed February 27, 2009, File No. 001-05324)
+10.11 Special Severance Program for Officers of NU System Companies as of January 1, 2009 (Exhibit 10.2, NU Form 10-Q for the Quarter Ended September 30, 2008 filed November 10, 2008, File No. 001-05324)
+10.12 Amended and Restated Northeast Utilities Deferred Compensation Plan for Executives effective as of January 1, 2009 (Exhibit 10.4 NU Form 10-Q for Quarter Ended September 30, 2008 filed November 10, 2008, File No. 001-05324)
+10.13 Northeast Utilities Retention Agreement (Exhibit 10.1, NU Registration Statement on Form S-4, filed November 22, 2010, File No. 333-170754)
10.14 Northeast Utilities System's Third Amended and Restated Tax Allocation Agreement dated as of April 10, 2012, (Exhibit 10.1 NU Form 10-Q for Quarter Ended June 30, 2012 filed August 7, 2012, File No. 001-05324)
(C) NU and CL&P
10.1 CL&P Agreement Re: Connecticut NEEWS Projects by and between CL&P and The United Illuminating Company dated July 14, 2010 (Exhibit 10, CL&P Form 10-Q for the Quarter Ended June 30, 2010 filed August 6, 2010, File No. 000-00404)
(D) NU and NSTAR Electric
10.1 NSTAR Electric Company Restructuring Settlement Agreement dated July 1997, (Exhibit 10.12, Boston Edison 1997 Form 10-K filed March 30, 1998, File No. 001-02301)
10.2 Amended and Restated Power Purchase Agreement (NEA A PPA), dated August 19, 2004, by and between Boston Edison and Northeast Energy Associates L.P. (Exhibit 10.18, 2005 NSTAR Form 10-K filed February 21, 2006, File No. 001-14768)
10.3 Amended and Restated Power Purchase Agreement (NEA B PPA), dated August 19, 2004, by and between ComElectric and Northeast Energy Associates L. P. (Exhibit 10.19, 2005 NSTAR Form 10-K filed February 21, 2006, File No. 001-14768)
10.4 Amended and Restated Power Purchase Agreement (CECO 1 PPA), dated August 19, 2004 by and between ComElectric and Northeast Energy Associates L. P. (Exhibit 10.20, 2005 NSTAR Form 10-K filed February 21, 2006, File No. 001-14768)
10.5 Amended and Restated Power Purchase Agreement (CECO 2 PPA), dated August 19, 2004 by and between ComElectric and Northeast Energy Associates L. P. (Exhibit 10.21, 2005 NSTAR Form 10-K filed February 21, 2006, File No. 001-14768)
10.6 The Bellingham Execution Agreement, dated August 19, 2004 between Boston Edison, ComElectric and Northeast Energy Associates L. P. (Exhibit 10.22, 2005 NSTAR Form 10-K filed February 21, 2006, File No. 001-14768)
10.7 Second Restated NEPOOL Agreement among NSTAR Electric and various other electric utilities operating in New England, dated August 16, 2004 (Exhibit 10.2.1.1, 2005 NSTAR Form 10-K filed February 21, 2006, File No. 001-14768)
10.8 Transmission Operating Agreement among NSTAR Electric and various electric transmission providers in New England and ISO New England Inc., dated February 1, 2005 (Exhibit 10.2.1.2, 2005 NSTAR Form 10-K filed February 21, 2006, File No. 001-14768)
10.9 Market Participants Service Agreement among NSTAR Electric and various other electric utilities operating in New England, NEPOOL and ISO New England Inc., dated February 1, 2005 (Exhibit 10.2.1.3, 2005 NSTAR Form 10-K filed February 21, 2006, File No. 001-14768)
10.10 Rate Design and Funds Disbursement Agreement among NSTAR Electric and various other electric transmission providers in New England, dated February 1, 2005 (Exhibit 10.2.1.4, 2005 NSTAR Form 10-K filed February 21, 2006, File No. 001-14768)
10.11 Participants Agreement among NSTAR Electric, various electric utilities operating in New England, NEPOOL and ISO-New England, Inc., dated February 1, 2005 (Exhibit 10.2.1.4, 2006 NSTAR Form 10-K filed February 16, 2007, File No. 001-14768)
+10.12 NSTAR Excess Benefit Plan, effective August 25, 1999 (Exhibit 10.1 1999 NSTAR Form 10-K/A filed September 29, 2000, File No. 001-14768)

E-4
+10.12.1 NSTAR Excess Benefit Plan, incorporating the NSTAR 409A Excess Benefit Plan, as amended and restated effective January 1, 2008, dated December 24, 2008 (Exhibit 10.1.1 2008 NSTAR Form 10-K filed February 9, 2009, File No. 001-14768)
+10.13 NSTAR Supplemental Executive Retirement Plan, effective August 25, 1999 (Exhibit 10.2,1999 NSTAR Form 10-K/A filed September 29, 2000, File No. 001-14768)
+10.13.1 NSTAR Supplemental Executive Retirement Plan, incorporating the NSTAR 409A Supplemental Executive Retirement Plan, as amended and restated effective January 1, 2008, dated December 24, 2008 (Exhibit 10.2.1, 2008 NSTAR Form 10-K filed February 9, 2009, File No. 001-14768)
+10.14 Special Supplemental Executive Retirement Agreement between Boston Edison Company and Thomas J. May dated March 13, 1999, regarding Key Executive Benefit Plan and Supplemental Executive Retirement Plan (Exhibit 10.3, 1999 NSTAR Form 10-K/A filed September 9, 2000, File No. 001-14768)
+10.15 Amended and Restated Change in Control Agreement by and between NSTAR and Thomas J. May dated November 15, 2007 (Exhibit 10.5, 2007 NSTAR Form 10-K filed February 11, 2008, File No. 001-14768)
+10.16 NSTAR Deferred Compensation Plan, (Restated Effective August 25, 1999) (Exhibit 10.10, 1999 NSTAR Form 10-K/A filed September 29, 2000, File No. 001-14768)
+10.16.1 NSTAR Deferred Compensation Plan, incorporating the NSTAR 409A Deferred Compensation Plan, as amended and restated effective January 1, 2008, dated December 24, 2008 (Exhibit 10.6.1, 2008 NSTAR Form 10-K filed February 9, 2009, File No. 001-14768)
+10.17 NSTAR 2007 Long Term Incentive Plan, effective May 3, 2007 (Exhibit 10.2, NU Registration Statement on Form S-8 filed on May 8, 2012)
+10.17.1 Deferred Common Share/Dividend Equivalent Award, Stock Option Grant, Option Certificate and Performance Share Award/Dividend Equivalent Award Agreement Under the NSTAR 2007 Long Term Incentive Plan, by and between NSTAR and Thomas J. May, dated January 24, 2008 (Exhibit 10.8.1, 2007 NSTAR Form 10-K filed February 11, 2008, File No. 001-14768)
+10.17.2 Deferred Common Share/Dividend Equivalent Award, Stock Option Grant, Option Certificate and Performance Share Award/Dividend Equivalent Award Agreement Under the NSTAR 2007 Long Term Incentive Plan, by and between NSTAR and James J. Judge, dated January 24, 2008 (Exhibit 10.8.2, 2007 NSTAR Form 10-K filed February 11, 2008, File No. 001-14768)
+10.17.3 Deferred Common Share/Dividend Equivalent Award, Stock Option Grant, Option Certificate and Performance Share Award/Dividend Equivalent Award Agreement Under the NSTAR 2007 Long Term Incentive Plan by and between NSTAR and NSTAR’s other Senior Vice Presidents and Vice Presidents, dated January 24, 2008 (in form) (Exhibit 10.8.6, 2007 NSTAR Form 10-K filed February 11, 2008, File No. 001-14768)
+10.18 Amended and Restated Change in Control Agreement by and between James J. Judge and NSTAR, dated November 15, 2007 (Exhibit 10.9, 2007 NSTAR Form 10-K filed February 11, 2008, File No. 001-14768)
+10.19 NSTAR Trustees’ Deferred Plan (Restated Effective August 25, 1999), dated October 20, 2000 (Exhibit 10.4, NSTAR Form 10-Q for the quarter ended September 30, 2000 filed November 14, 2000, File No. 001-14768)
10.20.1 NSTAR Trustees’ Deferred Plan, incorporating the 409A Trustees’ Deferred Plan, effective January 1, 2008, dated December 24, 2008 (Exhibit 10.10.1, 2008 NSTAR Form 10-K filed February 9, 2009, File No. 001-14768)
+10.20 Master Trust Agreement between NSTAR and State Street Bank and Trust Company (Rabbi Trust), effective August 25, 1999 (Exhibit 10.5, NSTAR Form 10-Q for the Quarter Ended September 30, 2000 filed November 14, 2000, File No. 001-14768)
+10.21 Amended and Restated Change in Control Agreement by and between NSTAR’s other Senior Vice Presidents and NSTAR (in form), dated November 15, 2007 (Exhibit 10.15, 2007 NSTAR Form 10-K filed February 11, 2008, File No. 001-14768)
+10.22 Amended and Restated Change in Control Agreement between NSTAR’s Vice Presidents and NSTAR (in form), dated November 15, 2007 (Exhibit 10.16, 2007 NSTAR Form 10-K filed February 11, 2008, File No. 001-14768)
+10.23 Currently effective Change in Control Agreement between NSTAR’s Vice Presidents and NSTAR (in form) (Exhibit 10.17, 2009 NSTAR Form 10-K filed February 25, 2010, File No. 001-14768)
+10.24 Executive Retention Award Agreement, dated November 19, 2010, by and between NSTAR and James J. Judge (Exhibit 99.2, NSTAR Current Report on Form 8-K filed November 22, 2010, File No. 001-14768)

E-5
10.25 MDTE Order approving Rate Settlement Agreement dated December 31, 2005 (Exhibit 99.2, NSTAR Current Report on Form 8-K filed January 4, 2006, File No. 001-14768)
(E) NU and WMECO
10.1 Lease and Agreement by and between WMECO and Bank of New England, N.A., with BNE Realty Leasing Corporation of North Carolina dated as of December 15, 1988 (Exhibit 10.63, 1988 NU Form 10-K, File No. 001-05324)
*12. Ratio of Earnings to Fixed Charges
*21. Subsidiaries of the Registrant
*23. Consents of Independent Registered Public Accounting Firm
*31. Rule 13a – 14(a)/15 d – 14(a) Certifications
31 Certification of Thomas J. May, Chairman, President and Chief Executive Officer of NU required by Rule 13a – 14(a)/15d –14(a) of the Securities Exchange Act of 1934, as amended, as adopted pursuant to Section 302 of the Sarbanes-Oxley Act of 2002, dated February 25, 2015
31.1 Certification of James J. Judge, Executive Vice President and Chief Financial Officer of NU required by Rule 13a –14(a)/15d – 14(a) of the Securities Exchange Act of 1934, as amended, as adopted pursuant to Section 302 of the Sarbanes-Oxley Act of 2002, dated February 25, 2015
*32 18 U.S.C. Section 1350 Certifications
32 Certification of Thomas J. May, Chairman, President and Chief Executive Officer of Northeast Utilities and James J. Judge, Executive Vice President and Chief Financial Officer of Northeast Utilities, pursuant to 18 U.S.C. Section 1350 as adopted pursuant to Section 906 of the Sarbanes-Oxley Act of 2002, dated February 25, 2015
*101.INS XBRL Instance Document
*101.SCH XBRL Taxonomy Extension Schema
*101.CAL XBRL Taxonomy Extension Calculation
*101.DEF XBRL Taxonomy Extension Definition
*101.LAB XBRL Taxonomy Extension Labels
*101.PRE XBRL Taxonomy Extension Presentation

Exhibit 31
CERTIFICATION PURSUANT TOSECTION 302 OF THE SARBANES-OXLEY ACT OF 2002
I, Thomas J. May, certify that:
1. I have reviewed this Annual Report on Form 10-K of Northeast Utilities (the registrant);
2. Based on my knowledge, this report does not contain any untrue statement of a material fact or omit to state a material fact necessary to make the statements made, in light of the circumstances under which such statements were made, not misleading with respect to the period covered by this report;
3. Based on my knowledge, the financial statements, and other financial information included in this report, fairly present in all material respects the financial condition, results of operations and cash flows of the registrant as of, and for, the periods presented in this report;
4. The registrant's other certifying officer and I are responsible for establishing and maintaining disclosure controls and procedures (as defined in Exchange Act Rules 13a-15(e) and 15d-15(e)) and internal control over financial reporting (as defined in Exchange Act Rules 13a-15(f) and 15d-15(f)) for the registrant and have:
(a) Designed such disclosure controls and procedures, or caused such disclosure controls and procedures to be designed under our supervision, to ensure that material information relating to the registrant, including its consolidated subsidiaries, is made known to us by others within those entities, particularly during the period in which this report is being prepared;
(b) Designed such internal control over financial reporting, or caused such internal control over financial reporting to be designed under our supervision, to provide reasonable assurance regarding the reliability of financial reporting and the preparation of financial statements for external purposes in accordance with generally accepted accounting principles;
(c) Evaluated the effectiveness of the registrant's disclosure controls and procedures and presented in this report our conclusions about the effectiveness of the disclosure controls and procedures, as of the end of the period covered by this report based on such evaluation; and
(d) Disclosed in this report any change in the registrant's internal control over financial reporting that occurred during the registrant's most recent fiscal quarter (the registrant's fourth fiscal quarter in the case of an annual report) that has materially affected, or is reasonably likely to materially affect, the registrant's internal control over financial reporting; and
5. The registrant's other certifying officer and I have disclosed, based on our most recent evaluation of internal control over financial reporting, to the registrant's auditors and the audit committee of the registrant's board of directors (or persons performing the equivalent functions):
(a) All significant deficiencies and material weaknesses in the design or operation of internal control over financial reporting which are reasonably likely to adversely affect the registrant's ability to record, process, summarize and report financial information; and
(b) Any fraud, whether or not material, that involves management or other employees who have a significant role in the registrant's internal control over financial reporting.
Date: February 25, 2015
/s/ Thomas J. MayThomas J. MayChairman, President and Chief Executive Officer(Principal Executive Officer)

Exhibit 31.1
CERTIFICATION PURSUANT TOSECTION 302 OF THE SARBANES-OXLEY ACT OF 2002
I, James J. Judge, certify that:
1. I have reviewed this Annual Report on Form 10-K of Northeast Utilities (the registrant);
2. Based on my knowledge, this report does not contain any untrue statement of a material fact or omit to state a material fact necessary to make the statements made, in light of the circumstances under which such statements were made, not misleading with respect to the period covered by this report;
3. Based on my knowledge, the financial statements, and other financial information included in this report, fairly present in all material respects the financial condition, results of operations and cash flows of the registrant as of, and for, the periods presented in this report;
4. The registrant's other certifying officer and I are responsible for establishing and maintaining disclosure controls and procedures (as defined in Exchange Act Rules 13a-15(e) and 15d-15(e)) and internal control over financial reporting (as defined in Exchange Act Rules 13a-15(f) and 15d-15(f)) for the registrant and have:
(a) Designed such disclosure controls and procedures, or caused such disclosure controls and procedures to be designed under our supervision, to ensure that material information relating to the registrant, including its consolidated subsidiaries, is made known to us by others within those entities, particularly during the period in which this report is being prepared;
(b) Designed such internal control over financial reporting, or caused such internal control over financial reporting to be designed under our supervision, to provide reasonable assurance regarding the reliability of financial reporting and the preparation of financial statements for external purposes in accordance with generally accepted accounting principles;
(c) Evaluated the effectiveness of the registrant's disclosure controls and procedures and presented in this report our conclusions about the effectiveness of the disclosure controls and procedures, as of the end of the period covered by this report based on such evaluation; and
(d) Disclosed in this report any change in the registrant's internal control over financial reporting that occurred during the registrant's most recent fiscal quarter (the registrant's fourth fiscal quarter in the case of an annual report) that has materially affected, or is reasonably likely to materially affect, the registrant's internal control over financial reporting; and
5. The registrant's other certifying officer and I have disclosed, based on our most recent evaluation of internal control over financial reporting, to the registrant's auditors and the audit committee of the registrant's board of directors (or persons performing the equivalent functions):
(a) All significant deficiencies and material weaknesses in the design or operation of internal control over financial reporting which are reasonably likely to adversely affect the registrant's ability to record, process, summarize and report financial information; and
(b) Any fraud, whether or not material, that involves management or other employees who have a significant role in the registrant's internal control over financial reporting.
Date: February 25, 2015
/s/ James J. JudgeJames J. JudgeExecutive Vice President and Chief Financial Officer(Principal Financial Officer)

Exhibit 32
CERTIFICATION PURSUANT TO18 U.S.C. SECTION 1350
AS ADOPTED PURSUANT TOSECTION 906 OF THE SARBANES-OXLEY ACT OF 2002
In connection with this Annual Report on Form 10-K of Northeast Utilities (the registrant) for the period ending December 31, 2014 as filed with the Securities and Exchange Commission (the Report), we, Thomas J. May, Chairman, President and Chief Executive Officer of the registrant, and James J. Judge, Executive Vice President and Chief Financial Officer of the registrant, certify, pursuant to 18 U.S.C. Sec. 1350, as adopted pursuant to Sec. 906 of the Sarbanes-Oxley Act of 2002, that:
1) The Report fully complies with the requirements of section 13(a) or 15(d) of the Securities Exchange Act of 1934; and
2) The information contained in the Report fairly presents, in all material respects, the financial condition and results of operations of the registrant.
/s/ Thomas J. MayThomas J. MayChairman, President and Chief Executive Officer
/s/ James J. JudgeJames J. JudgeExecutive Vice President and Chief Financial Officer
Date: February 25, 2015
A signed original of this written statement required by Section 906, or other document authenticating, acknowledging, or otherwise adopting the signature that appears in typed form within the electronic version of this written statement required by Section 906, has been provided to the registrant and will be retained by the registrant and furnished to the Securities and Exchange Commission or its staff upon request.

[THIS PAGE LEFT BLANK INTENTIONALLY.]

[THIS PAGE LEFT BLANK INTENTIONALLY.]

Eversource Energy Trustees Eversource Energy Executive O�cers
Thomas J. MayChairman of the Board,President and Chief Executive O�cer,Eversource Energy
Richard H. BoothSenior Advisor,Century Capital Management, LLC
John S. ClarkesonChairman Emeritus,The Boston Consulting Group, Inc.
Cotton M. ClevelandPresident,Mather Associates
Sanford Cloud, Jr.*Chairman and Chief Executive O�cer,The Cloud Company, LLC
James S. DiStasioRetired Senior Vice Chairmanand Americas Chief Operating O�cer,Ernst & Young
Francis A. Doyle
Charles K. Gi�ord
President and Chief Executive O�cer,Connell Limited Partnership
Chairman Emeritus,Bank of America Corporation
Paul A. La CameraAdministrator of Public Radio,WBUR, National Public Radio Station in Boston
Kenneth R. LeiblerFounding Partner and Former Chairman,Boston Options Exchange
William C. Van FaasenChairman Emeritus,Blue Cross Blue Shield of Massachusetts, Inc.
Frederica M. WilliamsPresident and Chief Executive O�cer,Whittier Street Health Center
Dennis R. WraaseRetired Chairman of the Boardand Chief Executive O�cer,Pepco Holdings, Inc.
*Lead Trustee
Thomas J. MayChairman of the Board,President and Chief Executive O�cer
James J. JudgeExecutive Vice Presidentand Chief Financial O�cer
David R. McHaleExecutive Vice Presidentand Chief Administrative O�cer
Leon J. OlivierExecutive Vice President –Enterprise Energy Strategy andBusiness Development
Werner J. SchweigerExecutive Vice Presidentand Chief Operating O�cer
Gregory B. ButlerSenior Vice President and General Counsel
Christine M. CarmodySenior Vice President – Human Resources
Joseph R. Nolan, Jr.Senior Vice President – Corporate Relations
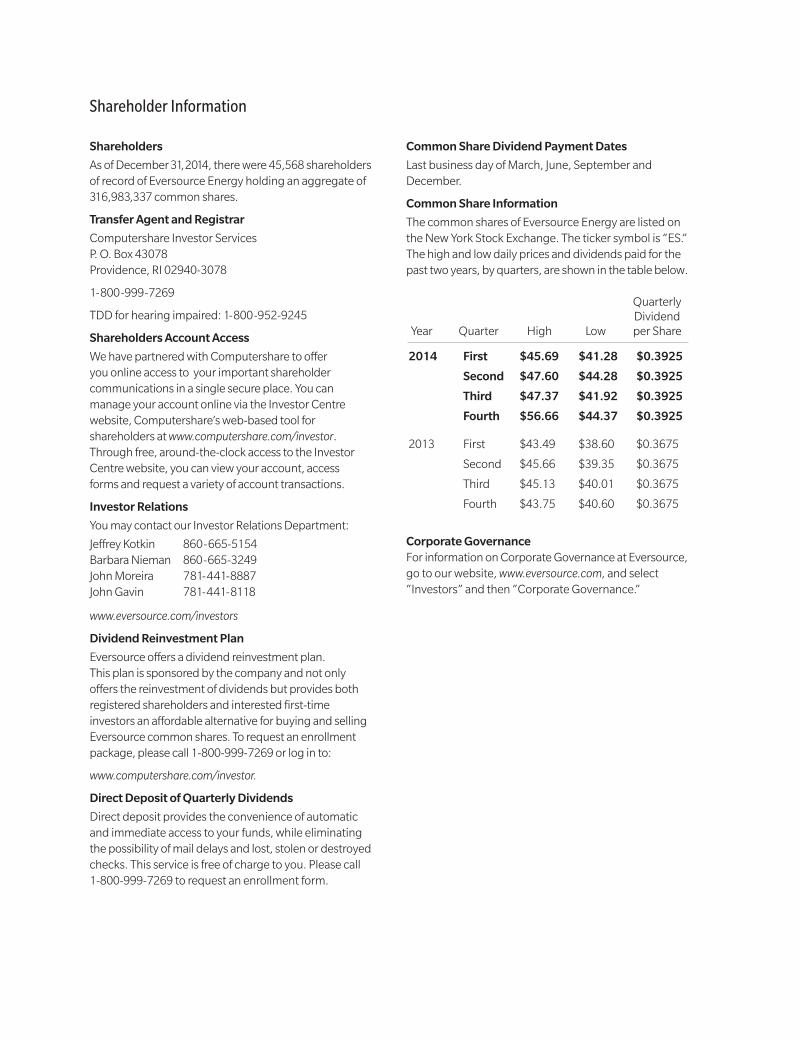
2010 2011 2012 2013 2014
$1.57
Closing Share Price
Total Shareholder Return
Dividends Paid/Share
2010 2011 2012 2013 2014
$100
$150
$200
$250
2009 2010 2011 2012 2013 2014
Eversource Energy $100 $128 $150 $168 $188 $246EEI Index $100 $107 $128 $131 $148 $191S&P 500 $100 $115 $117 $136 $180 $205
$31.88$36.07
$39.08$42.39
$53.52
$1.025 $1.10
$1.323 $1.47
(Assumes $100 invested on December 31, 2009 with all dividends reinvested)
Shareholder Information
Shareholders
As of December 31, 2014, there were 45,568 shareholders of record of Eversource Energy holding an aggregate of 316,983,337 common shares.
Transfer Agent and Registrar
Computershare Investor ServicesP. O. Box 43078Providence, RI 02940-3078
1-800-999-7269
TDD for hearing impaired: 1-800-952-9245
Shareholders Account Access
We have partnered with Computershare to o�eryou online access to your important shareholder communications in a single secure place. You can manage your account online via the Investor Centre website, Computershare’s web-based tool forshareholders at www.computershare.com/investor. Through free, around-the-clock access to the Investor Centre website, you can view your account, accessforms and request a variety of account transactions.
Investor Relations
You may contact our Investor Relations Department:
Je�rey Kotkin 860-665-5154Barbara Nieman 860-665-3249John Moreira 781-441-8887John Gavin 781-441-8118
www.eversource.com/investors
Dividend Reinvestment Plan
Eversource o�ers a dividend reinvestment plan.This plan is sponsored by the company and not only o�ers the reinvestment of dividends but provides both registered shareholders and interested first-time investors an a�ordable alternative for buying and selling Eversource common shares. To request an enrollment package, please call 1-800-999-7269 or log in to:
www.computershare.com/investor.
Direct Deposit of Quarterly Dividends
Direct deposit provides the convenience of automatic and immediate access to your funds, while eliminating the possibility of mail delays and lost, stolen or destroyed checks. This service is free of charge to you. Please call 1-800-999-7269 to request an enrollment form.
Common Share Dividend Payment Dates
Last business day of March, June, September and December.
Common Share Information
The common shares of Eversource Energy are listed on the New York Stock Exchange. The ticker symbol is “ES.” The high and low daily prices and dividends paid for the past two years, by quarters, are shown in the table below.
Corporate Governance For information on Corporate Governance at Eversource, go to our website, www.eversource.com, and select “Investors” and then “Corporate Governance.”
Quarterly Dividend Year Quarter High Low per Share
2014 First $45.69 $41.28 $0.3925
Second $47.60 $44.28 $0.3925
Third $47.37 $41.92 $0.3925
Fourth $56.66 $44.37 $0.3925
2013 First $43.49 $38.60 $0.3675
Second $45.66 $39.35 $0.3675
Third $45.13 $40.01 $0.3675
Fourth $43.75 $40.60 $0.3675

Northeast Utilities is now
2014 Annual Report
002CSN4A56
Eversou
rce En
ergy 2014
An
nu
al Rep
ort