Embed Size (px)
Citation preview

2014 Annual Report

contents
the yeAR in bRief
Letter to the Shareholders 4
Facts and Figures 5
Information for Investors 7
gRoup RepoRt
Strategy and Results 10
Performance by Product 17
Performance by Region 20
Global Network 23
Industry Know-How 24
Compliance 29
Employees 30
Information Technology 32
Security 33
Quality 34
Health and Safety 35
Environment 37
Social Commitments 40
coRpoRAte goveRnAnce RepoRt
Corporate Governance Report 42
compensAtion RepoRt
Compensation Report 54
finAnciAl RepoRt
Consolidated Financial Statements 71
Annual Financial Statements 145

the yeAR
inbRief
contents
Letter to the Shareholders 4
Facts and Figures 5
Information for Investors 7

Panalpina Annual Report 2014
4Letter to the Shareholders
letteR to the shAReholdeRs
Dear Shareholders,
This past year was decisive for Panalpina: in 2014, we delivered solid results and more than doubled our overall profitability. The strategic priorities set in 2013 are delivering the right results. In a challenging market environment, the company achieved an EBIT of CHF 116.7 million and a consolidated profit of CHF 86.5 million. While Air Freight grew slightly ahead of the market, Ocean Freight outperformed the market, enabling us to retain our position among the top five global players.
The restructuring undertaken in 2014 has borne fruit and we made significant progress in the turnaround of the loss-making units. This was particularly noticeable in Logistics, where the reduction of losses meant that the turnaround is clearly ahead of schedule.
The newly established Middle East/Africa/CIS (MEAC) region achieved substantial growth in an unsteady economic climate. Panalpina set up two new country organizations in Kenya and Morocco (officially opened in January 2015) and plans to further enlarge its footprint in Africa.
In September, Panalpina merged its Panprojects and Oil and Gas activities to form Energy Solutions, a specialized service that designs tailor-made solutions for the energy sector. With a combined global team of some 2,200 people operating from 90 strategic offices in 50 countries, Panalpina is now in a better position to help customers mitigate the impact of the current low oil prices by helping them to control costs, reduce inventory and improve their supply chains. Although the current consolidation in the energy market may delay or cancel projects, it also creates opportunities for reengineering and outsourcing.
Our ambitious global Operations Transformation Project (OTP), including a key objective of implementing an integrated platform based on SAP TM, is progressing well. Major milestones in 2014 include the global implementation of PanLink, the new HR information system; the successful implementation of the pilot site for our ERP system; the integration of our business service center in Wuhan, China; and the expansion of our business service center in Prague, Czech Republic. The current year will be critical as we will begin the main implementation phase of the SAP TM project, rolling this system out in several key countries.
On the Executive Board, we welcomed Karsten Breum as Chief Human Resources Officer, replacing Alastair Robertson who decided to take on a new challenge outside the industry.
We remain very focused on executing our strategy in 2015: implementing SAP TM and streamlining Ocean Freight operations to improve productivity will be crucial steps to ensure we have a solid platform for future growth. Since the currently strong Swiss franc and the low oil prices will likely impact our financial performance, it is even more important to carefully manage our costs.
Based on the results of 2014 fiscal year, the Board of Directors proposes a dividend payment of CHF 2.75 to be declared at the Annual General Meeting in May 2015.
Once again, we would like to thank all our employees for their outstanding contributions to our company, our customers and suppliers for their continued cooperation and loyalty and our shareholders for their trust throughout the year. We look forward to another promising year for Panalpina in 2015.
Basel, Switzerland, March 2015
Rudolf W. hug peter ulberChairman of the Board of Directors Chief Executive Officer

Panalpina Annual Report 2014
5Facts and Figures
fActs And figuRes
Key FiguresNet forwarding revenue of CHF 6,707 million Gross profit of CHF 1,586 million Adjusted EBIT of CHF 117 million Consolidated profit of CHF 87 million
gross profit by product2014
40 %Air Freight
29 %Logistics
31 %Ocean Freight
gross profit by region2014
21 %APAC
31 %Americas
9 %MEAC
39 %Europe
forwarding volumes in Air freightThousand tons
900
750
600
450
300
150
0
2010
892
2011
848
2012
801
20142013
858825
forwarding volumes in ocean freightThousand TEU
1,800
1,500
1,200
900
600
300
0
2010
1,241
2011
1,310
2012
1,388
20142013
1,6071,495

Panalpina Annual Report 2014
6Facts and Figures
five-yeAR development
gross profitMillion CHF
1,900
1,750
1,600
1,450
1,300
1,150
1,000
2010 2011 2012 2013 2014
1,480 1,477 1,465
1,5861,561
net forwarding revenue Million CHF
7,500
6,250
5,000
3,750
2,500
1,250
0
2010
7,164
2011
6,500
2012
6,617
20142013
6,7076,758
five-yeAR development
* Prior year’s figures have been restated due to the application of IAS 19 (as revised in 2011) retrospective
total equityMillion CHF
900
750
600
450
300
150
0
709743*
928*
812
2010 2011 2012 20142013
consolidated profitMillion CHF
120
80
40
0
–40
–80
–120
87
12
–72*
127
–26
2010 2011 2012 20142013
ebitdAMillion CHF
300
250
200
150
100
50
0
120
174
34
212
62
2010 2011 2012 20142013
ebitMillion CHF
160
120
80
40
0
–40
–80
117
48
–40*
174
15
2010 2011 2012 20142013
733
Panalpina Annual Report 2014
7
infoRmAtion foR investoRs
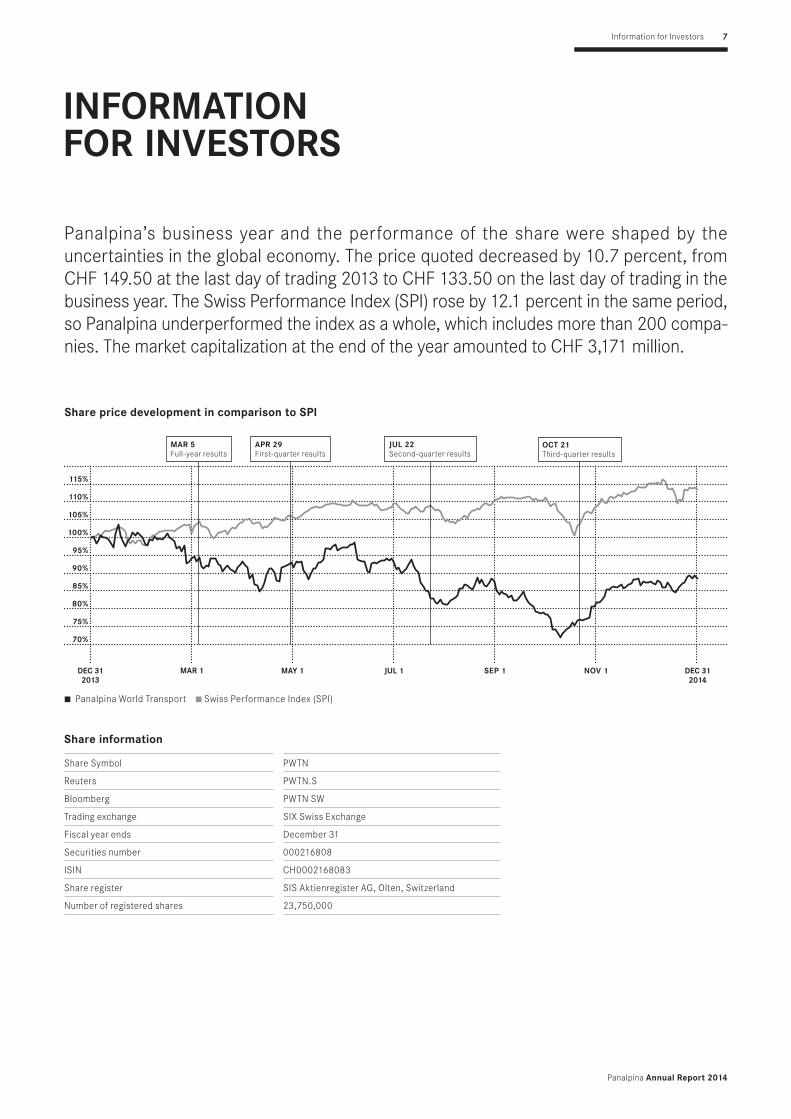
Panalpina’s business year and the performance of the share were shaped by the uncertainties in the global economy. The price quoted decreased by 10.7 percent, from CHF 149.50 at the last day of trading 2013 to CHF 133.50 on the last day of trading in the business year. The Swiss Performance Index (SPI) rose by 12.1 percent in the same period, so Panalpina underperformed the index as a whole, which includes more than 200 compa-nies. The market capitalization at the end of the year amounted to CHF 3,171 million.
Information for Investors
Panalpina World Transport Swiss Performance Index (SPI)
share price development in comparison to spi
115%
110%
105%
100%
95%
90%
85%
80%
75%
70%
mAR 5Full-year results
ApR 29First-quarter results
Jul 22Second-quarter results
oct 21Third-quarter results
dec 31 2013
mAR 1 mAy 1 Jul 1 sep 1 nov 1 dec 31 2014
Share Symbol PWTN
Reuters PWTN.S
Bloomberg PWTN SW
Trading exchange SIX Swiss Exchange
Fiscal year ends December 31
Securities number 000216808
ISIN CH0002168083
Share register SIS Aktienregister AG, Olten, Switzerland
Number of registered shares 23,750,000
share information

Panalpina Annual Report 2014
8
2010 2011 2012 2013 2014
Last day of trading previous year CHF 64.47 118.06 94.25 92.85 149.50
High CHF 125.90 128.94 107.28 151.80 154.20
Low CHF 65.79 71.87 77.30 82.40 134.90
Last day of trading current year CHF 118.06 94.25 92.85 149.50 133.50
Average trading volume CHF 77,022 51,764 40,917 33,306 19,807
Total shareholder return % 83.1 –20.2 2.7 63.2 –9.2
Market capitalization as per Dec 31 million CHF 2,952 2,356 2, 205 3,551 3,171
Earnings per share CHF 1.16 5.34 -3.05 0.5 3.68
* Restated due to the return of capital (CHF 1.90 per share) in 2012
share price development*
2010 2011 2012 2013 2014
Amount million CHF 0.0 47.0 47.3 52.2 65.3
Per share CHF 0.00 2.00 2.00 2.20 2.75**
Return of capital per share CHF 1.9
Outstanding shares as per Dec 31 25,000,000 25,000,000 23,750,000 23,750,000 23,750,000
** Proposal to the Annual General Meeting.
ordinary gross dividend payments
Information for Investors
April 22 First-quarter results
May 12 Annual General Meeting
May 15 Dividend ex-date
May 20 Dividend payment day
July 23 Second-quarter results
October 20 Third-quarter results
financial calender

gRoup RepoRt
contents
Strategy and Results 10
Performance by Product 17
Performance by Region 20
Global Network 23
Industry Know-How 24
Compliance 29
Employees 30
Information Technology 32
Security 33
Quality 34
Health and Safety 35
Environment 37
Social Commitments 40

Panalpina Annual Report 2014
10Strategy and Results
stRAtegy And Results
mARket development
Geopolitical tensions in many parts of the world, combined with a weak first half of 2014, resulted in a disappointing overall recovery of the global economy. In its January 2015 World Economic Outlook Update, the International Monetary Fund (IMF) revised its 2014 world output downwards to 3.3 percent and world trade volume to 3.1 percent. While financial markets were initially optimistic, this did not translate into a pickup in investment, particularly in advanced economies. Various events in the United States, the Euro area, Japan, Russia, Brazil and China all contributed to the lackluster growth.
While the global ocean freight market grew by a predictable 4 to 5 percent, it showed signs of supply-and-demand imbalance, which was driven by overcapacity. The global air freight market showed cautious signs of recovery with a growth of approximately 3.5 percent, due to stabilized load factors and yields as well as increased capacity and demand. The logistics market remained strong, while the energy market came under pressure due to political instability and a sharp drop in oil prices.
business stRAtegy
Panalpina’s aim is to outperform the market in all segments and be one of the top five global players in freight forwarding. During 2014, Panalpina successfully executed on the corporate priorities it set out in 2013. This ambitious strategy is based on four dimensions to target stable and sustainable growth while working toward a lean and efficient cost structure.
product mixPanalpina’s core competencies in Air and Ocean Freight are the foundation of the company’s business and continue to drive the growth that will enable Panalpina to retain its position among the global top five freight forwarders.
For Air Freight, continuing to expand both its commercial and controlled air freight business was key in 2014, as well as expanding its end-to-end offering. For Ocean Freight, Managed Solutions made a substantial contribution and growing the portfolio in both Full Container Load (FCL) and Less than Container Load (LCL) remained a priority. A major milestone was achieved with the operation of 485 dedicated weekly services for Panalpina’s global LCL network. Logistics continued to strengthen its position as a differentiator by expanding Panalpina’s value-added services and end-to-end offering for international customers, especially in the technology and fashion sectors.
Panalpina merged its oil and gas and project businesses to create Panalpina Energy Solutions, which increases the specialty offering for customers in the energy sector, as well as in the mining and engineering industries. The new combined team of experts is able to better serve customers throughout the entire energy project life cycle: from exploration, construction and production to final decommissioning.
geographic coverageThe creation of a fourth region to expand the company’s geographic presence in the Middle East, Africa and the CIS (MEAC) achieved significant growth. While Africa shows good potential for freight forwarders and Panalpina has now established new country organiza-tions in Morocco and Kenya (opened January 1, 2015), other parts of this region have suffered due to geopolitical unrest and fal ling oil prices. Although Panalpina continues to strengthen its position in key European markets — particularly in the United Kingdom, the Netherlands, France and Italy — the overall economic conditions in many European countries have remained challenging. Even though the overall market environment in the Americas remained soft, with Canada, Mexico and Brazil growing modestly, the United States gained steam in the second half of the year. Despite a downward correction of GDP forecast in Asia, demand improved in both Air Freight and Ocean Freight across the region.
Panalpina continued to deliver stronger results with improved overall profitability and operating margins, despite uncertainties in the global economy. An increased focus on improving productivity and stabilizing performance translated into a substantial improvement in EBIT, which highlights the headway Panalpina made in executing its strategy and its ability to improve performance and streamline operations.

Panalpina Annual Report 2014
11Strategy and Results
customersIn 2014, Panalpina focused on rebalancing its portfolio to focus more on companies with international cargo flows, allowing it to strengthen its global account structure and offer customers more solutions specific to their industry and particular needs.
Using its expertise to provide technology and automotive customers with bespoke solutions for their entire supply chain, Panalpina main-tained steady growth overall. For automotive the strongest growth regions were Asia Pacific and Mexico, while for technology the focus was on helping customers expand their presence in Latin America and Africa.
The company has increased its focus on investment in healthcare, consumer and retail, manufacturing and fashion industry verticals, producing sturdy results. The healthcare sector had an especially successful year, showing double digit growth. The fashion sector con-tinued to outperform the market and the consumer and retail sector showed strong growth in Logistics.
Panalpina’s IT capabilities provided sophisticated analytics and advanced customer-facing information systems. Panalpina’s new online sailing schedule gave LCL customers more visibility over the entire LCL network, allowing them to decide on the sailings that best suit their needs.
growth modelThe implementation of the Operations Transformation Program (OTP), which ramped up in 2013, is progressing well and is expected to increase productivity significantly by streamlining business processes and simplifying the current IT landscape. The foremost corner-stone of this program is SAP Transportation Management (TM). In 2015, the target is to process 60 percent of all shipments using this system by the end of the year, as it is rolled out in several key countries.
An important milestone in 2014 included the global implementation of PanLink, the new HR information system. This system provides all employees with a single interface for performance review, career development, talent management and succession planning, recruiting and compensation review.
As part of its Global Business Services (GBS) model, the company also integrated the business service center in Wuhan, China, into the GBS model and expanded the business service center in Prague, Czech Republic.
While the company’s short-term goal is to continue to grow volumes organically, in the longer term, Panalpina’s objective is to become fit for acquisitions. Successfully implementing SAP TM is a prerequisite for successful integrations of target companies.
The financial transparency measures implemented in 2013 enabled the company to identify a number of underperforming operations and business activities. Most of these operations have now been successfully turned around and the focus during 2015 will be to streamline the remaining operations to improve productivity.
outlook
The IMF forecasts global growth at 3.5 percent, a downward revision of 0.3 percent from the October 2014 World Economic Outlook. The IMF also revised world trade volumes downward to 3.8 percent after reassessing prospects in China, Russia, the Euro zone and Japan. The steep drop in oil prices will also impact a number of large oil exporters.
In Air Freight, Panalpina anticipates the market to grow by 3 to 4 percent. In Ocean Freight, market growth is expected to remain at 4 to 5 percent. In Logistics, the outlook is positive, while in the energy market, commodity oil prices are expected to remain low, only stabiliz-ing in the second half of 2015.
In North America, the company expects the highly competitive market environment to continue. The negative outlook for Brazil and the unstable economies in Argentina and Venezuela will only be partially compensated by the positive developments in Columbia, Peru and Mexico, the latter benefiting from near-shoring manufacturing from Asia. Panalpina anticipates volume in Asia to grow in both the air and ocean freight markets across the region, with demand varying by trade lane. The logistics and freight-forwarding market in Europe is expected to start off the year slowly. The focus remains on continuing to strengthen its position in the key European markets and to improve overall profitability. For the MEAC region, Panalpina plans to continue enlarging its footprint and focus on expanding into Logistics Manufacturing Services (LMS).

Panalpina Annual Report 2014
12Strategy and Results
net foRWARding Revenue (nfR)
Net forwarding revenue in 2014 amounted to CHF 6,707 million, a decrease of 1 percent compared to the CHF 6,758 million the year before. The translation of foreign currencies into the reporting currency (CHF) had a negative impact on the Group’s NFR to the amount of CHF 226 million or 3 percent, organic growth amounted to 3 percent. The Group did not undertake any acquisitions during the reporting year.
At the regional level, net forwarding revenue in Europe — the Group’s largest region in terms of turnover — decreased slightly from CHF 2,607 million to CHF 2,597 million in 2013. In North, Central and South America (Americas), NFR decreased by 3 percent from CHF 2,310 million to CHF 2,251 million. Compared to 2013, Panalpina’s NFR in 2014 in Asia Pacific (APAC) increased 5 percent from CHF 1,266 million to CHF 1,327 million. The Middle East, Africa and CIS (MEAC) saw a decrease in NFR of 8 percent from CHF 574 million to CHF 531 million.
In 2014, the Panalpina Group generated 39 percent of its net forwarding revenue in Europe, 33 percent in the Americas, 20 percent in APAC and 8 percent in MEAC.
On a product level, net forwarding revenue in Air Freight increased 3 percent from CHF 3,056 million in 2013 to CHF 3,142 million in 2014. Likewise, in Ocean Freight, the company increased its NFR by 2 percent from CHF 2,781 million to CHF 2,835 million. In Logistics, NFR saw a decrease of 21 percent from CHF 921 million to CHF 730 million.
In 2014, the Panalpina Group generated 47 percent of its net forwarding revenue with Air Freight, 42 percent with Ocean Freight and 11 percent with Logistics.
net forwarding revenue by product2014
47 %Air Freight
11 %Logistics
42 %Ocean Freight
net forwarding revenue by productMillion CHF
3,500
3,000
2,500
2,000
1,500
1,000
500
0
2013 2014
Logistics
921730
Ocean Freight
2,781 2,835
Air Freight
3,056 3,142
net forwarding revenue by region2014
20 %APAC
33%Americas
8 %MEAC
39 %Europe
net forwarding revenue by regionMillion CHF
3,500
3,000
2,500
2,000
1,500
1,000
500
0
Americas
2,310 2,251
APAC
1,266 1,327
MEAC
574 531
Europe
2,607 2,597
2013 2014

Panalpina Annual Report 2014
13
gross profit by product2014
40 %Air Freight
29 %Logistics
31 %Ocean Freight
gross profit by productMillion CHF
800
700
600
500
400
300
200
100
0
Air Freight
631 636
492 491
Ocean Freight
438 458
Logistics
2013 2014
Strategy and Results
gRoss pRofit (gp)
In the forwarding industry gross profit is considered a better measure of sales performance than net forwarding revenue as GP is less distorted by external factors such as movements in carrier freight rates and oil prices, which can materially inflate or deflate revenues.
Gross profit of the Group increased by 2 percent to CHF 1,586 million in 2014 (2013: CHF 1,561 million). The translation of foreign currencies into Swiss francs had a negative impact on the Group’s GP in the amount of CHF 51 million or 3 percent, hence organic growth amounted to 5 percent.
With respect to regional performance, Europe remains the most important region for Panalpina in terms of gross profit generation. In 2014, while gross profit in Europe decreased by 5 percent to CHF 614 million from CHF 644 million in the previous year, in Americas, gross profit grew by 3 percent from CHF 473 million to CHF 486 million, APAC increased in gross profit of 9 percent from CHF 311 million to CHF 340 million, in the MEAC, gross profit grew by 11 percent from CHF 132 million to CHF 147 million.
In 2014, the Panalpina Group generated 39 percent of its gross profit in Europe, 31 percent in Americas, 21 percent in APAC and the remaining 9 percent in MEAC.
In Air Freight, Panalpina increased its tonnage by 4 percent or roughly 33,000 tons to a total of approximately 857,800 tons (2013: 825,100 tons), hence grew slightly ahead of the market. Increasing competitive pressure led to gross profit per ton of air freight decreasing by approximately 3 percent. In total, gross profit realized through Air Freight services posted a small increase of 1 percent from CHF 631 million in 2013 to CHF 636 million in 2014.
gross profit by region2014
21 %APAC
31 %Americas
9 %MEAC
39 %Europe
gross profit by regionMillion CHF
800
700
600
500
400
300
200
100
0
2013 2014
MEAC
132 147
APAC
311340
Americas
473 486
Europe
644614

Panalpina Annual Report 2014
14Strategy and Results
In Ocean Freight, Panalpina’s volumes grew by 7 percent — well ahead of the market which grew by about 4 to 5 percent — to reach a new all-time high of approximately 1,606,500 twenty-foot equivalent units or TEU (2013: 1,495,400 TEU). Gross profit per TEU came in below previous year’s level and decreased by 7 percent. Gross profit generated through Ocean Freight services was CHF 491 million versus 492 million in 2013.
Gross profit in Logistics saw growth of 5 percent from CHF 438 million in 2013 to reach a total of CHF 458 million in 2014. The improved GP result was driven by a strong expansion of value-added logistics services. Furthermore, Logistics is in the middle of its portfolio transition and phased out nonstrategic locations.
In 2014, the Panalpina Group generated 40 percent of its gross profit with Air Freight, 31 percent with Ocean Freight and 29 percent with Logistics.
eARnings befoRe inteRest And tAXes (ebit)
Management considers earnings before interest and taxes (EBIT) a key performance indicator for assessing the Group’s operating performance. The Group’s EBIT in 2014 amounted to CHF 117 million (2013: CHF 48 million). Panalpina achieved an EBIT/GP margin of 7.4 percent (2013: 3.1 percent).
The two main items included in operating expenses — personnel expenses and other operating expenses — developed as follows:- Personnel expenses amounted to CHF 977 million in 2014 and showed an increase of 2 percent from previous year (2013: CHF 960
million). The small increase was mainly a result of restructuring costs.- Other operating expenses amounted to CHF 435 million in 2014 and thus came in approximately 1 percent lower compared to the
previous year (2013: CHF 440 million).
Depreciation and amortization charges changed from CHF 53 million in 2013 to CHF 57 million in 2014. The increase of CHF 4 million was mainly related to the amortization of previously capitalized costs in connection with the SAP TM project. The SAP TM rollout in 2015 will increase expenses further.
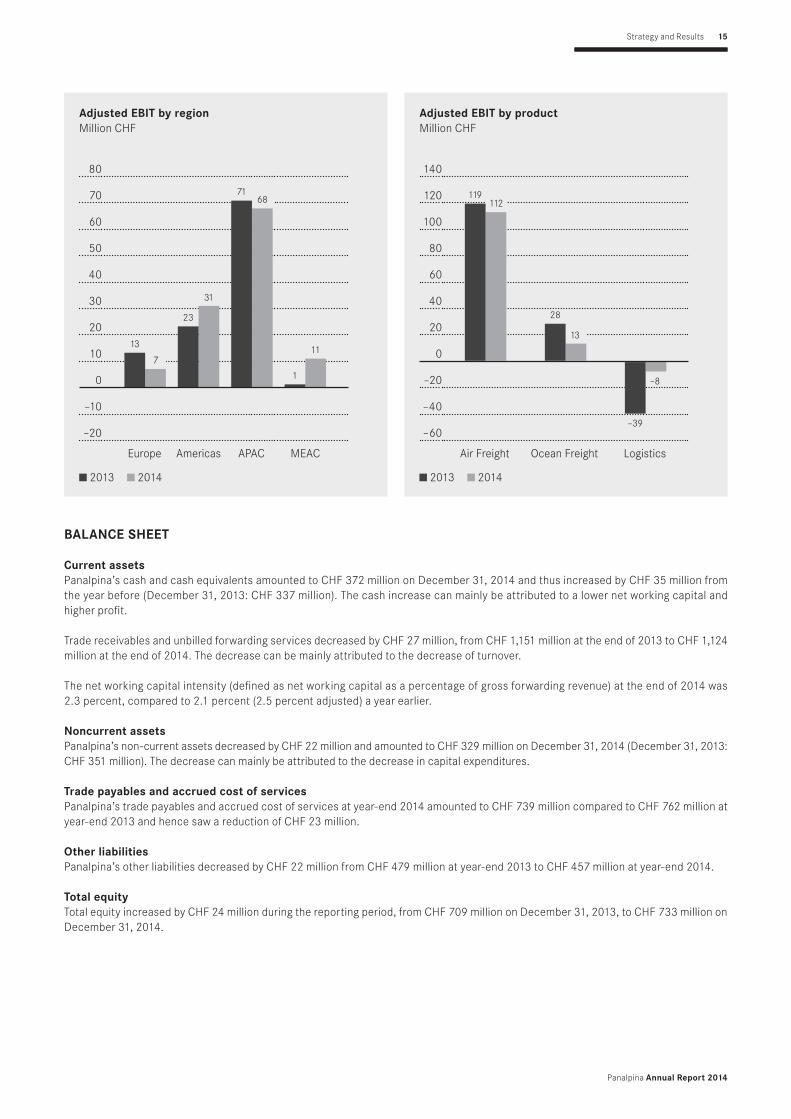
With respect to regional EBIT performance, EBIT in Europe decreased from CHF 13 million in 2013 to CHF 7 million in 2014. EBIT in the Americas turned from CHF 23 million in 2013 to CHF 31 million in 2014. The largest contribution to Group EBIT comes from APAC with CHF 68 million in 2014 (2013: CHF 71 million). In MEAC, EBIT improved from CHF 1 million in 2013 to a positive result of CHF 11 million in 2014.
In the products, Air Freight delivered the highest EBIT with CHF 112 million, a decrease compared to the CHF 119 million achieved in the previous year. In Ocean Freight, EBIT decreased from CHF 28 million in 2013 to CHF 13 million in 2014. In Logistics, the EBIT result improved from a loss of CHF 39 million in 2013 to a loss of CHF 8 million in 2014.
overall developmentMillion CHF
120
100
80
60
40
20
0
EBIT EBIT excl. nonrecurring items
2013*
48
108117117
2014
9.0%
7.5%
6.0%
4.5%
3.0%
1.5%
0.0%
EBIT/GP margin EBIT/GP margin excl. nonrecurring items
2013 2014
6.9
3.1
7.47.4
*In 2013, Group's reported EBIT of CHF 48 million included 60 million non recurring items for fines (CHF 40.9 million) and goodwill impairment (CHF 19.1 million).
Panalpina Annual Report 2014
15
bAlAnce sheet
current assetsPanalpina’s cash and cash equivalents amounted to CHF 372 million on December 31, 2014 and thus increased by CHF 35 million from the year before (December 31, 2013: CHF 337 million). The cash increase can mainly be attributed to a lower net working capital and higher profit.
Trade receivables and unbilled forwarding services decreased by CHF 27 million, from CHF 1,151 million at the end of 2013 to CHF 1,124 million at the end of 2014. The decrease can be mainly attributed to the decrease of turnover.
The net working capital intensity (defined as net working capital as a percentage of gross forwarding revenue) at the end of 2014 was 2.3 percent, compared to 2.1 percent (2.5 percent adjusted) a year earlier.
noncurrent assetsPanalpina’s non-current assets decreased by CHF 22 million and amounted to CHF 329 million on December 31, 2014 (December 31, 2013: CHF 351 million). The decrease can mainly be attributed to the decrease in capital expenditures.
trade payables and accrued cost of services Panalpina’s trade payables and accrued cost of services at year-end 2014 amounted to CHF 739 million compared to CHF 762 million at year-end 2013 and hence saw a reduction of CHF 23 million.
other liabilitiesPanalpina’s other liabilities decreased by CHF 22 million from CHF 479 million at year-end 2013 to CHF 457 million at year-end 2014.
total equityTotal equity increased by CHF 24 million during the reporting period, from CHF 709 million on December 31, 2013, to CHF 733 million on December 31, 2014.
Strategy and Results
Adjusted ebit by productMillion CHF
140
120
100
80
60
40
20
0
–20
–40
–60
Air Freight
119112
28
13
Ocean Freight
–39
–8
Logistics
2013 2014
Adjusted ebit by regionMillion CHF
80
70
60
50
40
30
20
10
0
–10
–20
2013 2014
MEACAPACAmericasEurope
11
1
6871
31
23
7
13

Panalpina Annual Report 2014
16Strategy and Results
cAsh floW
net cash from operating activitiesPanalpina’s net cash from operating activities in the reporting period amounted to CHF 123 million (2013: CHF 42 million). Major contrib-utor to this development were the improvement of the net result for the period.
cash flow from investing activitiesExpenditures on property, plant and equipment decreased to CHF 19 million (2013: CHF 29 million). Capital expenditures in 2014 amounted to 0.7 percent of net forwarding revenue (2013: 0.8 percent), a figure which is in line with the company’s long-term average. Overall, the net cash outflow from investing activities decreased from CHF 48 million in 2013 to CHF 36 million in 2014.
cash flow from financing activitiesThe company paid an ordinary dividend amounting to CHF 52 million in 2014. The net cash used in financing activities thus increased from CHF 41 million in 2013 to CHF 55 million in 2014.
net cash
Million CHFdec 31
2013dec 31
2014diffeRence
%
Cash and cash equivalents 336.9 372.0 10
Other current financial assets 5.5 0.0 – 100
Short-term debt – 3.1 – 0.5 – 83
Long-term debt – 0.2 – 0.1 – 36
Net cash 339.1 371.4 10
Net cash increased by CHF 32 million during the year under review to CHF 371 million on December 31, 2014 (December 31, 2013: 339 million).
total assetsMillion CHF
2,000
1,800
1,600
1,400
1,200
1,000
800
600
400
200
0
Noncurrent assets Other current assets Trade receivables and unbilled forwarding services Cash and cash equivalents
2013 2014
337 372
1,151 1,124
111 104
351 329
total liabilities and equityMillion CHF
2,000
1,800
1,600
1,400
1,200
1,000
800
600
400
200
0
Equity Other liabilities Trade payables and accrued cost of services
762
479
709
739
457
733
2013 2014

Panalpina Annual Report 2014
17Performance by Product
peRfoRmAnce by pRoduct
AiR fReight
market situationIn 2014, the global air freight market grew by approximately 3.5 percent, compared to 1 percent in 2013. There was increased optimism in the market, as the air freight industry showed cautious signs of recovery. Load factors and yields stabilized and capacity and demand both grew. A significant part of the market growth can be attributed to the Asia Pacific region. From an industry perspective, the main growth drivers were technology and perishables. Major trunk lanes, such as the transatlantic trade lane, experienced a revival, whereas the growth of secondary lanes such as Asia to Latin America slowed down. Middle Eastern carriers steadily increased their market share. Due to the growing belly capacity of aircraft, the freighter share of global air cargo continued to decrease. Fuel prices were increasingly volatile.
highlights- Panalpina’s Air Freight business grew slightly ahead of the market.- Panalpina’s PanFresh service for perishables saw increased growth in 2014 from South America to Europe and on Europe an outbound
lanes. Part of the perishables cargo, such as asparagus and blueberries, is transported on their controlled air freight network, particularly from Mexico to Europe.
- The PanCool service for temperature-sensitive goods contributed significantly to Panalpina’s Air Freight growth in the healthcare industry.- Several PanBasic services with competitive rates were launched, notably from Europe to Asia.- Air Freight achieved significant business wins in the industrial consumables sector in the Americas with major agricultural and
automotive products companies.- Panalpina received top honors for air freight from Lloyd’s Global Freight Awards. Panalpina was acknowledged as Air Freight Provider of
the Year 2014, recognizing the company’s end-to-end capabilities. outlookFor 2015, Panalpina expects the air freight market to grow by 3 to 4 percent. Technology, perishables and industrial consumables are expected to drive growth in 2015. Airline rates are expected to stay the same or even increase in selected trade lanes, even though there is pressure on rates due to increasing belly capacity. Panalpina will continue to use its procurement power and leverage their controlled network, which provides access to freighter capacity when needed. Digitization will continue to improve productivity, with Panalpina leading the way in e-freight initiatives to reduce paperwork in air freight. Middle Eastern and Asian airlines will continue to accumulate market share, a trend from which Panalpina is well positioned to benefit, thanks to existing business and double-digit growth rates with these carriers.
oceAn fReight
market situationIn 2014, the global market for ocean freight grew by 4 to 5 percent. The market continued to show a supply-and-demand imbalance, driven by overcapacities due to carriers injecting larger container ship capacities into global trade lanes. The resulting rate volatility increased, in terms of fluctuation and frequency. Overall freight rates settled at a higher baseline. The introduction of four new mega alliances enabled carriers to further optimize their networks, which had an impact on overall lead times. Continuous focus on strategic partnerships with core carriers remains a priority in this volatile market environment.
highlights- Panalpina’s Ocean Freight business grew by 7 percent.- Managed Solutions and freight management made the biggest contribution to Panalpina’s growth in ocean freight. The investments
Globally integrated supply chain solutions — Panalpina builds on its core products of Air Freight and Ocean Freight, together with value-added Logistics, to offer door-to-door supply chain solutions. In September 2014, Panalpina merged its Panprojects and Oil and Gas activities to create Energy Solutions, a specialized service for the energy sector.

Panalpina Annual Report 2014
18Performance by Product
initiated in 2013 started to bear fruit and enabled Panalpina to win significant contracts in the automotive and retail industries. - Panalpina strategically invested in the temperature-controlled segment with a specific focus on healthcare customers, expanding its
Reefer-container services.- In order to counteract port congestions and land infrastructure challenges, Panalpina has expanded its global intermodal capabilities.- The continued focus on niche markets such as recycled materials paid off, notably on the Far East eastbound trade lane from Europe to
Asia and resulted in overproportional growth versus the market development.- Another milestone was reached in the development of Panalpina’s global Less than Container Load (LCL) network, which is now
operating 485 dedicated weekly services worldwide. Visibility is a key contributor to this success story and the introduction of the LCL Sailing Schedule provided customers with instant and up-to-date network visibility.
outlookIn 2015, overcapacity and rate volatility are likely to persist. Global ocean freight market growth is expected to be 4 to 5 percent, with stronger growth in North America and a slightly softer performance by the European trade lanes. Panalpina is well positioned to manage the ever-changing ocean carrier environment, as well as the infrastructure challenges.
logistics
market situationIn 2014, the market for Logistics remained strong. The trend is toward two segments: first for contract logistics warehousing ser vices, which are becoming highly commoditized and competitive and second for customized solutions and specialist value-added services. Customers are increasingly looking for innovative partners who can be integrated into their supply chains, offer solutions that shorten lead times and help with inventory management and positioning.
highlights- The focus in 2014 was on turning Logistics around. Panalpina eliminated some of the legacy loss-making operations and contracts. - Panalpina continued to focus on developing industry-specific solutions and reinforced the Logistics team with manufacturing professionals.- Logistics Manufacturing Services (LMS) was further developed and expanded. As an extension to LMS, Panalpina introduced its first
in-house electronic repair and diagnostic services.- Panalpina’s Logistics Excellence program LOGEX was accredited by Cardiff University’s Lean Competence System (LCS). LOGEX has
generated over 1,000 continuous improvement projects in Logistics globally.- Panalpina opened a LEED (Leadership in Energy and Environmental Design) Platinum-certified hub near Tokyo, the highest rating for
energy, water and environmental efficiency.- Panalpina opened a 26,000 sqm facility in Singapore, combining five facilities into one.- An Integrated Data Logistics Platform (IDLP) was created, enabling advanced information management services.- Inventory forecasting techniques and data analytics were piloted in 2014, a direct outcome of Panalpina’s research program with
Cardiff University. The program is based on Demand-Driven Inventory Dispositioning (D2ID) and was started in 2012. In collaboration with Cardiff University, a research paper on redistributed manufacturing and Panalpina’s LMS offering was delivered at the Cambridge University Global Manufacturing Symposium.
outlookThe outlook for 2015 is positive. While Panalpina Logistics will continue to focus on optimizing costs of existing operations, it will put more emphasis on improving margins and on the product mix. LMS will gather momentum within the technology industry, notably around Semi-Knocked-Down (SKD) assembly, returns, repair and aftermarket services. Panalpina also plans to build on its fashion capabilities, offering together with Air Freight an end-to-end service for fashion companies.
Redistributed manufacturing, growing e-commerce and product customization, coupled with technology developments such as big data, the Internet of Things (IoT) and 3-D printing, will continue to influence Panalpina’s service offering.

Panalpina Annual Report 2014
19
eneRgy solutions
A new entityPanalpina merged its Panprojects and Oil and Gas activities to create Energy Solutions. With more than 2,200 people in 50 countries, Panalpina has built the largest global team of industry specialists to serve customers better along the entire energy project life cycle: from exploration, construction and production to final decommissioning, Panalpina has established itself as a trusted advisor and partner to energy and extraction companies, EPC contractors, manufacturers and service companies.
The services of Energy Solutions are not only tailored to the energy industry; its experts serve customer groups across all industries wherever their specialized skills in noncontainerized, out-of-gauge and heavy-lift moves, project management, marine chartering and transport engineering are required.
market situationIn 2014, energy exploration and production were under strong pressure. Geopolitics, instability in the Middle East and Northern Africa followed by the Ukraine crisis, international sanctions on Russia, a gas glut in the US and a drop in commodity prices and an unprece-dented 50 percent dive in oil prices within less than six months were the main drivers. Customers continued to seek support to lower their direct spend and optimize their supply chains. At the same time, the market expects safe and compliant fulfillment and delivery as planned — with zero defects. Final investment decisions for certain mega projects, with up to 150 billion US dollars at stake, were put back on hold by oil and mining companies.
Ongoing key projects in the North Sea, Central Asia, Africa and Australia together with a strong performance from oil service companies secured a sound result for Panalpina Energy Solutions, despite the challenges in the drilling and deep water sector in the second half of 2014.
highlights- Successful merger of Panprojects and the Oil and Gas division, as energy companies have started to merge exploration, production,
operations and capital projects.- Panalpina received top honors for heavy-lift forwarding from Lloyd’s Global Freight Awards. Panalpina Energy Solutions was
acknowledged as Project/Heavy-Lift Forwarder of the Year 2014, for demonstrating logistics excellence on some of the world’s most challenging projects.
- In 2014, Panalpina was active in more than 90 energy projects globally. One notable example was moving out-of-gauge oil platform equipment for a global energy giant. The job took place in South Korea and involved the transport of a 500 ton drilling derrick, standing upright, with the use of a 1,200 tons capacity floating crane, from Goije Island to Ulsan — in the midst of snow showers and strong winds. For its role in the project, Panalpina received the Project Forwarding Award of the British International Freight Association (BIFA).
- Panalpina won business from one of the top global oil field services companies, a major existing customer, to handle exports for them to the UK, Saudi Arabia, Russia and various Asian and Latin American countries. Satisfaction with past performance, active performance management, data management and on-time delivery were the customer’s main reasons for selecting Panalpina.
- Panalpina saw strong development in the Middle East, despite challenging market conditions. Customers from the energy sector benefit from Panalpina’s increased footprint in Africa with new offices in Kenya and Morocco (opening January 1, 2015).
outlookCommodity and oil and gas prices are expected to remain low, slowing down exploration and production, drilling and oil field services in the first half of 2015. Prices should stabilize by the second half of the year, albeit on a low level. Customers will count on Panalpina Energy Solutions to help them mitigate the impact of the low oil prices, control costs, reduce inventory and improve the supply chain to eliminate waste.
While Panalpina expects these developments to affect Energy Solutions, the customers’ focus on costs will also create opportunities in reengineering supply chains end-to-end, outsourcing and shift of transport modes. Projects are likely to be delayed or canceled on short notice. Opportunities for growth exist in the Middle East, Kenya and Morocco.
Performance by Product

Panalpina Annual Report 2014
20Performance by Region
peRfoRmAnce by Region
AmeRicAs
market situationThe overall market environment in the Americas region was soft. The Gross Domestic Product (GDP) of key countries such as Canada, Mexico and Brazil grew only modestly. However, the US economy gathered steam in the third quarter of 2014, with a GDP growth of 3.9 percent. In the first quarter of 2014, Panalpina’s business with telecoms and consumer electronics customers benefited from the FIFA World Cup. The positive effect of this event on Brazil’s overall economy ended in the second quarter of 2014. For the rest of the year, Brazil moved toward a recession, a trend that is likely to continue in 2015.
highlights- The Energy Solutions organization was successfully launched in the region, integrating Panprojects and Oil and Gas.- Panalpina US completed a major outsourcing project for a luxury fashion customer, implementing wholesale, retail and e-commerce
logistics solutions in Secaucus, New Jersey. Panalpina now manages the entire warehousing and distribution of luxury clothes and accessories for the customer in the US, across multiple retail channels.
- Panalpina won a major customer in the agricultural industry in Brazil. Panalpina will conduct customs brokerage for the customer and handle air freight for them on the US — Latin America route.
- The Logistics activities in the Americas were successfully turned-around.- In the US, Ocean Freight operations were centralized in shared Business Service Centers in Charleston, Miami and Houston: The result
was faster and more efficient operations, improving Ocean Freight’s productivity.
outlookIn 2015, growing and increasing gross profit is still the main challenge. The overall market environment will continue to be highly competitive and complex. Potential stumbling blocks are the US West Coast port gridlock, which will impede Transpacific development, the negative economic outlook in Brazil, the huge drop in oil prices softening Energy Solutions growth and unstable economies in Argentina and Venezuela. However, positive developments in Columbia, Peru and Mexico, benefiting from near-shorting manufacturing from Asia to Mexico, as well as GDP growth in the US, are expected to partly offset these challenges.
Key opportunities for 2015 include: enlarging Energy Solutions’ footprint in Mexico, Brazil, Colombia, Peru and the US, expanding the controlled air freight network, developing a perishables segment and focusing on value-added logistics services such as Logistics Manu facturing Services (LMS) so as to better leverage the fashion hub in New York.
AsiA pAcific
market situationThe general expectations of higher growth in 2014 in the major economies in the region — China, India, Japan and Singapore — did not materialize. GDP forecasts in these countries have contracted year-on-year in the wake of a weak global economy, political tensions and reduced consumer spending.
Despite the downward correction of GDP forecasts, the market conditions for freight forwarding and logistics in Asia Pacific remained positive. For Air Freight, 2014 was a year of recovery, as demand improved across major geographies in Asia, in particular in Greater China and Korea. While demand increased, supply of air cargo capacity was tighter than in the previous year. Many legacy carriers continued to reduce capacity, resulting in a general rate increase. The air freight end-of-year peak season in 2014 was much stronger than in 2013. In addition to the usual seasonality effect, the Transpacific route was affected by the conversion from Ocean Freight to Air Freight due to port congestion in Manila and the US West Coast. The Ocean Freight volume in 2014 was above expectation, due to inventory restocking in the technology, consumer and retail industries in the EU and the US.
Focus on growth and reduce complexity — Panalpina’s operating structure is divided into four regional units. The regional set up is geared toward expanding into growth economies and increasing market share in established economies.

Panalpina Annual Report 2014
21Performance by Region
The market for contract logistics in Asia Pacific evolved, supporting trends such as growing e-commerce and multichannel retailing. These trends compelled manufacturers, distributors and retailers to focus on supply chain management and improve product availability and fulfillment across different sales channels, with the support of their logistics service providers.
highlights- Air and Ocean Freight volumes grew above market.- Panalpina Asia Pacific invested in structures and capabilities, laying the foundation for future growth: in Singapore, a trade management
team with trade lane specialists was established to ensure efficient Ocean Freight operations and to manage market volatilities more efficiently.
- Charter flights out of Hong Kong were added to the Air Freight portfolio to alleviate the strong peak season of the Transpacific route.- Ocean Freight continued to develop its end-to-end service proposition in China, across Southeast Asia and Oceania and further
expanded its Managed Solutions offering.- In Singapore, Panalpina opened two logistics hubs: a 26,000 sqm fashion logistics facility serving a variety of distribution channels and
a regional distribution center for a telecoms manufacturer. The hubs provide a suite of value-added logistics services. Additionally Panalpina has extended several long-term contracts with medical equipment, engineering and manufacturing customers.
- Panalpina achieved excellence in operational logistics in China, Singapore and Vietnam, based on its proprietary LOGEX (Logistics’ Excellence) methodology.
- A new hub in Auckland, New Zealand, was opened, strengthening Panalpina’s end-to-end solutions proposition in the region including consolidation, deconsolidation and value-added services. The hub paves the way for increasing the number of LCL services to and from New Zealand.
- Energy Solutions activities were successful, particularly in Australia and Korea.
outlookFor 2015, Panalpina anticipates volume growth in both Air and Ocean Freight. However, the demand for Air Freight will vary by trade lane, with weak economic conditions in Europe negatively affecting the Far East Westbound trade lane. The Transpacific trade lane looks more promising, with an expected recovery in demand. General airline cost recovery will put pressure on margins. Air Freight will continue to focus on increasing volumes and market share on the intra-Asia trade lane.
In Ocean Freight, the supply and demand imbalance will remain an issue. Growth is expected in Managed Solutions and improved trade management capabilities.
The geographic spread of Logistics hubs in the region will continue to evolve and new hubs will be developed closer to customers in China, Southeast Asia and Australia. Logistics expects profitability improvements due to stabilized operations and implemented LOGEX (Logistics’ Excellence) initiatives.
euRope
market situationIn 2014, the overall economic conditions in many European countries remained challenging, with very little organic growth from Panalpina’s existing customer base. Due to the imbalance between supply and demand, Air and Ocean Freight rates continued to be extremely volatile. Panalpina’s competitive environment remained fragmented with continued pressure on margins. To succeed in this context, Panalpina focused on turning around loss-making entities and on offering value-added services for customers, such as Managed Solutions in Ocean Freight.
highlights- The Perishables Industry Vertical was launched successfully in a number of countries.- A number of documentation activities were transferred to Panalpina’s Business Service Centers in Prague and Wuhan.- Within Ocean Freight, the Managed Solutions offering was further enhanced, with an active sales pipeline and new customer wins,
particularly in the consumer, retail and fashion industries.- Ocean Freight ramped up the Reefer business, offering temperature-controlled transport of goods for the healthcare sector.- The overland activities were streamlined across Europe.- Logistics improved its bottom line by turning around loss-making facilities.

Panalpina Annual Report 2014
22Performance by Region
outlookThe logistics and freight-forwarding market in Europe is expected to grow by around 4 percent in 2015, with a slow start at the beginning of the year. Controlling cost and growing the business will remain important priorities. Air Freight aims to improve profitability and will further promote the controlled network in the region.
Supply and demand imbalance, as well as rate volatility, will continue to be key issues in Ocean Freight. Key priorities in Europe for 2015 include the turnaround of a number of Ocean Freight organizations. The new set-up will promote profitable growth. Focusing on key coun-tries, Ocean Freight plans to grow the Transatlantic, Middle East and Far East trade lanes. Developing value-added solutions, such as introducing Logistics Manufacturing Services (LMS), will be the objective of Logistics.
middle eAst, AfRicA And cis
market situationMarket conditions continued to be mixed across Middle East, Africa and CIS (MEAC) in 2014. While Africa remained a continent with great opportunities for logistics providers, regional conflicts and falling oil prices slowed down business in some areas in MEAC. The low oil price and global sanctions imposed on Russia led to a sharp fall of the ruble, impacting importers and putting pressure on profit margins.
The economy in the United Arab Emirates (UAE) improved, triggered by confirmation as host of the 2020 EXPO and the consequential increase in property prices and construction. Dubai continued to show its competitive advantage as a strategic logistics hub. Shipping lines increased their capacity for African countries and regional airlines expanded wide-body and freighter services into Africa.
highlights- A number of loss-making countries were turned around.- Panalpina set up legal entities in Morocco and Kenya (opening January 1, 2015) to support the growth strategy for this region. In both
economies, opportunities for growth exist predominantly in the energy and infrastructure sectors.- The warehousing, distribution and overland products developed well, capitalizing on emerging markets in Africa and Turkey and on the
favorable geographic location of Panalpina’s Dubai hub.- Panalpina’s Dubai Logistics center introduced value-added services, including repair services and reverse logistics for hi-tech products
and semi-knocked-down (SKD) assembly for the telecoms industry.- Panalpina introduced a number of LCL services, bringing the total to 24 LCL services in the region.- The automotive, manufacturing and technology sectors showed double digit growth. The consumer, retail and fashion vertical won
significant new business in Turkey, where Panalpina manages quality control services for its customers as part of its value-added logistics portfolio.
outlookPanalpina plans to enlarge its footprint in Africa and further expand in Saudi Arabia. In established countries growth is expected to continue. In Ocean Freight, Panalpina will focus on the trade lanes from Asia and Europe and further rollout its Managed Solutions capabilities. Air Freight’s objectives in the region for 2015 are to develop the charter business and the perishables sector, end-to-end solutions and the controlled network. MEAC Logistics activities will further expand into Logistics Manufacturing Services (LMS) and the fashion industry and grow the warehousing, distribution and overland business in Africa.
Panalpina Annual Report 2014
23Global Network
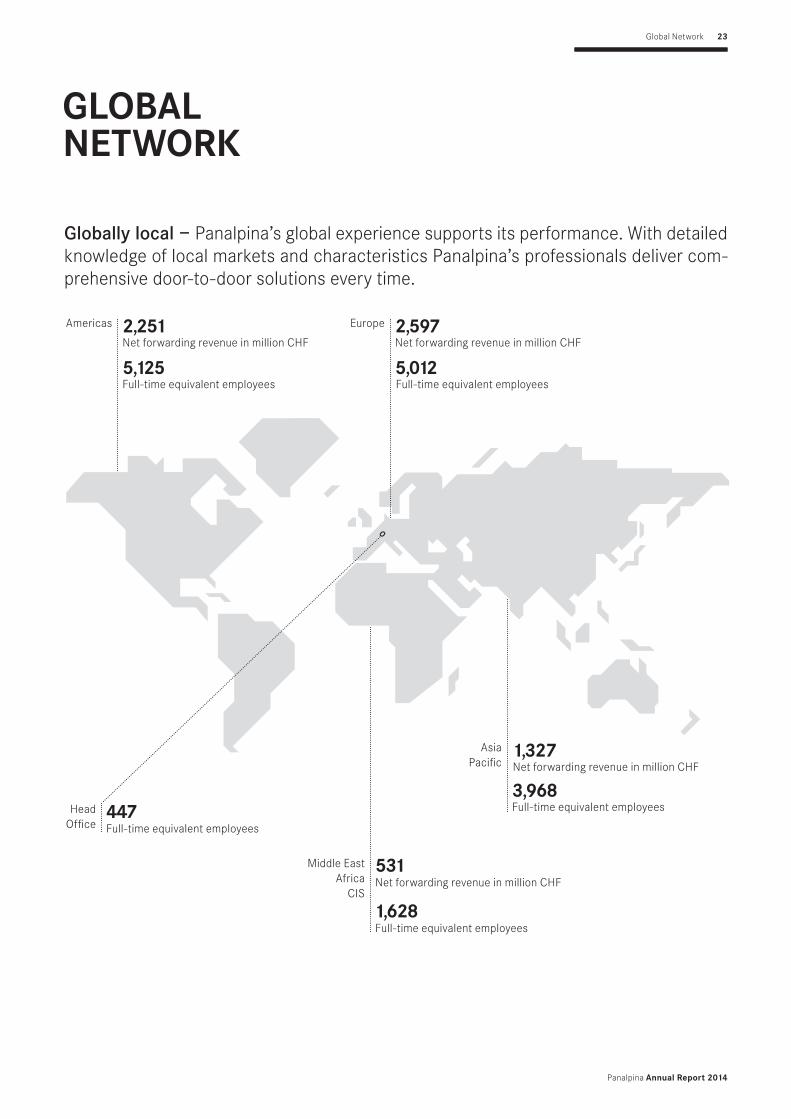
globAl netWoRk
Globally local — Panalpina’s global experience supports its performance. With detailed knowledge of local markets and characteristics Panalpina’s professionals deliver com-prehensive door-to-door solutions every time.
Europe
5,012
2,597Net forwarding revenue in million CHF
Full-time equivalent employees
Middle EastAfrica
CIS
531Net forwarding revenue in million CHF
Americas
Full-time equivalent employees5,125Net forwarding revenue in million CHF2,251
Head Office
447Full-time equivalent employees
AsiaPacific
3,968
1,327Net forwarding revenue in million CHF
Full-time equivalent employees
Full-time equivalent employees1,628

Panalpina Annual Report 2014
24Industry Know-How
industRy knoW-hoW
telecom
market situationThe rapid development of mobile communication and the Internet is a global phenomenon. Growth is fastest in China and India. Due to falling prices for handhelds, better usability and improved network coverage, mobile communication technology will soon be available to the majority of the world’s population. Ericsson predicts that by 2020, 90 percent of the population over six years old will have a mobile phone and subscriptions will top 6.1 billion. Mobile video traffic will constitute 55 percent of all mobile data traffic.
Networks are becoming ever stronger, faster and more reliable. Telecom providers continue to invest in network infrastructure to support hyperconnected communities as well as develop the Internet of Things (IoT), where objects have unique identifiers and are capable of communicating with other objects via data transfer.
highlightsPanalpina is well positioned to support these telecom investments, working closely with major network equipment manufacturers to facilitate their geographical expansion in Asia, Latin America and Africa. Our expertise is reflected in unique and custom-tailored solutions which make Panalpina a trusted partner to the industry. From cables to routers to big antennas, Panalpina moves the whole array of tele-com equipment — even in remote and difficult terrain with challenging geography and infrastructure, for example in the Peruvian highlands. Panalpina has established itself as a strong link in the value chain, supporting the industry-trend for near-shoring. When customers move the assembly of equipment into regions where demand is growing, they seek to reduce costs and risks and to improve service quality and customer satisfaction. Panalpina supports such moves with its in-country Logistics Manufacturing Services (LMS). These services typically include: inbound shipment of materials, inventory management, assembly, distribution and after-market services. Thanks to strong interest in and demand for this value-added concept, Panalpina has embarked on further expanding its services, in partnership with customers. In Latin America, Panalpina added LMS to its operations for a large telecoms company. Panalpina not only executes the final assembly of base stations, but takes full ownership of the whole process — from planning to quality control.
hi-tech
market situationThe technology for wireless communication and high-speed data exchange is increasingly available in more markets, with high growth in developing countries in Latin America, Africa and Asia. 4G and Long Term Evolution (LTE) standards have triggered the demand for more 4G-enabled smartphones and tablets. These devices will follow the usual hi-tech market mechanism: volumes will rise and prices fall, with Asian manufacturers at the forefront. Meanwhile, the system foundations for 5G mobile and wireless communications are being laid, to support the expected surge in mobile data traffic and in the number of connected devices.
Customer focus and value-adding solutions — Panalpina provides logistics services tailor-made to each industry vertical. In 2014, Panalpina’s industry experts focused on value-adding solutions. Putting the voice of the customer center stage, regular strate-gic engagement with customers was pivotal to industry-specific logistics solution design. In September 2014, Oil and Gas and Panprojects were merged to form Energy Solutions. For the performance of the Oil and Gas sector, please refer to Energy Solu-tions on page 19.
Panalpina will increase its footprint in two additional growth sectors, Perishables and Government and Defense in 2015. Bundling and building on existing capabilities, Panalpina will target these sectors as specialty industry verticals. Across all industry verticals, the focus will be primarily on the top 100 customers per industry, to increase Panalpina’s share-of-wallet and profitability per customer.

Panalpina Annual Report 2014
25Industry Know-How
A new wave of innovation is expected in the PC market: about 600 million PCs are more than four years old and are expected to be replaced soon. New PCs will be equipped with technology such as 3-D cameras with sensory input software that can recognize human faces. It is expected that these new devices will change the way computers are used. In the best case for PCs, there would be a signifi-cant wave of replacements, as users who spent on phones and tablets in recent years decide that they need to update their PC. The new features like touch or convertibility, as well as Windows 10, could make systems more versatile and appealing, along with lower prices. Going forward, as younger generations become more mobile and web oriented and emerging regions in particular prioritize converged devices, the PC market will continue to face tough competition and be more focused on replacements, with limited potential for growth, according to IDC.
For forwarders, the market conditions in 2014 remained tough: dimensions and weight continued to decrease in all product categories, from components to servers, meaning smaller and lighter cargo. Therefore offering efficient end-to-end logistics services that add value to customers’ supply chains is becoming ever more important.
highlightsIn 2014, Panalpina’s customer-focused services were used by global hi-tech companies in search of innovative solutions, reliability and visibility. From delivering high-value tablets from China’s hinterland to the high street and transporting heavy equipment to semiconductor plants, to shipping components from Singapore to Brazil’s assembly lines, customers always know the whereabouts of their goods.
Panalpina continued to build relationships with hi-tech companies of different sizes: the company is the supplier of choice, not only for major brands but also for makers of parts, accessories, manufacturers and traders.
Demonstrating its passion for solutions, Panalpina solved challenging situations, together with customers: for example, when an existing customer, a major PC manufacturer, encountered problems in one of its Chinese factories, leading to dispatch bottlenecks and the risk of losing sales, they asked Panalpina for assistance. Panalpina responded swiftly by placing a dedicated team on site to mitigate errors and to ensure speed of execution, quickly bringing the operation back to normal. Not a single shipment was held up and end-user satis-faction was maintained.
customer focusRegular engagement with hi-tech customers on all levels helped both sides to understand logistics needs in the common thrive for continuous improvement. Requirements discussed related to sales and operational planning accuracy, inventory levels, customs clearing processes and security. According to customers, competitive rates and good service are important, but a deep understanding of the customer’s supply chain, business and culture is vital to build trust and a strong partnership. 2014 was another year in which customers awarded Panalpina as “Best Service Provider,” acknowledging its top position as partner of tech industry’s key players. Reasons for giving the award included Panalpina’s ability to establish a strategic partnership based on innovation, its dedication, reliability and customer service.
heAlthcARe
market situationIn developed economies, healthcare markets were flat or grew by only 2 to 5 percent. In emerging markets, healthcare grew between 10 and 20 percent, fueled by an aging and growing population and by better access to medicines.
Pharmaceutical and medical device companies saw a wave of mergers and acquisitions. Expiring drug patents led to fiercer generic competition, increasing the cost pressure on drug manufacturers. Efficient end-to-end logistics solutions continue to become more and more important.
highlightsIn this changing market environment, Panalpina’s healthcare operations grew substantially in gross profit and in net forwarding revenue. Panalpina won the biggest contract in its healthcare industry history to date and became the top logistics provider for a global healthcare company, managing almost 50 percent of their air and ocean freight volume. Panalpina also expanded its supply chain control services for its customers in this industry.
In line with the trend of shifting from air to ocean freight to reduce logistics spend, Panalpina won major ocean freight contracts and developed a Less than Container Load (LCL) multicountry reefer solution specific to the pharma industry, expected to go live in April 2015.

Panalpina Annual Report 2014
26Industry Know-How
chemicAls
market situationFueled by reduced feedstock costs and global GDP growth, the chemical industry is poised to continue its growth trend. Demand for both basic and specialty chemical products has increased as has the demand in the key industries they supply, namely agriculture, automotive, construction, consumer products, manufacturing, mining, pharmaceuticals, technology and textiles.
While still a price sensitive industry, demand for reliable, compliant and sustainable services has driven a value component through the chemical sector that extends well beyond transportation rates.
Supply management difficulties, such as port congestions (Manila and Hong Kong) and industrial strikes (US West Coast, Sydney, Manila) have increased demand for innovative logistics solutions, particularly in the chemicals industry. In addition, regional shifts in consump-tion, as well as in manufacturing, have companies reviewing their logistics and distribution strategies. As a result, the industry is placing increased value on global providers who can deliver unique solutions and end-to-end visibility. Included in this need are transportation services (with air/sea options), warehousing and managed third-party logistics provider (3PL) solutions.
highlightsIn line with heightened demand, Panalpina’s Air Freight business for the chemicals industry grew in Asia, in both volume flown and gross profit. Additionally, inquiries for chemical warehousing were also on the rise, particularly in Singapore. Another highlight was the further development of Panalpina’s door-to-door downstream lubricants supply chain offering. Ocean Freight’s Managed Solutions were well received by chemicals companies, which need a logistics provider who can manage their high-volume container flow and improve visibil-ity while keeping costs under control.
Panalpina has invested in its Chemicals’ infrastructure, expertise and manpower with a renewed commitment to become a leader in chemical logistics. With this investment, Panalpina expects the Chemicals industry vertical to grow in 2015, both in gross profit and market share.
customer focusTo achieve the projected growth in the Chemicals industry vertical, Panalpina is focused on delivering customer-specific Managed Solutions to its customer base. In support of this aim, customer-facing personnel have been trained to collaborate with customers to identify pain points and develop customized solutions to address these needs. Through ongoing reviews of supply chain performance measurements, the dedicated team will work with the customer to increase customer service levels, while addressing total costs through continuous improvement measures.
mAnufActuRing
market situationPanalpina’s industry experts work together with manufacturing companies to streamline manufacturing supply chains, making them more efficient and responsive to changes in demand.
In 2014, the manufacturing industry’s growth regions were Asia-Pacific and Mexico. Within the Asia-Pacific region, production is shifting to Southeast Asia, namely to Malaysia, Thailand and Vietnam. On account of increasing wages in China, North American manufacturers are relocating production from China to Mexico. As a result, they are boosting Mexico’s economy and role as a trading partner. These shifts open up growth opportunities for forwarders such as Panalpina.
highlightsThe manufacturing industry continues to mimic logistics best practices from the automotive industry — to Panalpina’s advantage. The expertise and experience gained in the automotive industry helps Panalpina to meet the manufacturers’ demand for freight management and end-to-end logistics solutions. The demand for these “one-stop shopping” solutions from one logistics service provider — encompassing forwarding, warehousing, production and visibility tools — is rising sharply. This is due to the fact that manufacturers face cost pressures and aim to focus on their core competencies.
The 2014 highlights of Panalpina’s manufacturing operations included the fast and profitable launch and growth of a global mining and machinery account. In addition, Panalpina has successfully developed a global cluster around agricultural companies to generate

Panalpina Annual Report 2014
27Industry Know-How
benefits for its customers. Internally, the restructuring of the manufacturing as well as the automotive organization has been completed, positioning Panalpina for new business opportunities in 2015.
Automotive
market situationThe automotive industry’s supply systems are complex: logistics service providers must carefully coordinate the delivery of components from suppliers across the globe to ensure a smooth manufacturing and assembly process. Panalpina offers automotive-specific logistics services covering the entire supply chain, from inbound production material to complete vehicles and aftermarket parts.
highlightsPanalpina’s automotive activities have maintained a slow but steady growth globally in 2014. As in manufacturing, the growth regions were Asia-Pacific and Mexico. Panalpina continued to focus on solutions selling, based on customer needs. Highlights were the launch of Panalpina’s first large-scale freight management project for a global automotive supplier and the retention and growth of Panalpina’s largest automotive customer. Furthermore, the growth in new customer accounts in the Asia-Pacific region is developing into the backbone of many of Panalpina’s country organizations.
customer focusIn line with the focus on solutions selling and in order to increase customer satisfaction, strategic performance reviews formed part of the quarterly business reviews for major customers. By the same token, Panalpina held a workshop with six major automotive suppliers in Shanghai. The workshop helped Panalpina’s industry experts better understand and support the suppliers’ current and future logistics requirements and to customize responses closer to their needs. Customer-specific supply chain analyses added value to quotations, a service much appreciated by customers.
consumeR And RetAil
market situationThe consumer today is faced with more options than ever in a multichannel environment. In line with shifts in consumption patterns, e-commerce and innovations, the consumer and retail industry has to adapt to changing market conditions.
highlightsFor Panalpina it is important to meet the market trends and allow the voice of the customer to determine what value to deliver. During the last two years, several global consumer goods companies selected Panalpina as main supplier of air and ocean freight. Not only did they choose Panalpina because of its execution and transportation ability, but also because of the added value provided to customers. Two examples:
Supply chain optimization for one of the largest consumer corporations in the world: In 2013, Panalpina was awarded with global air freight for this customer, amounting to around 20,000 tons of air freight per year. The contract was given to Panalpina not only because of the ability to transport the customers’ goods, but also because Panalpina was able to deliver an optimization program: alternatives to priority air freight are made available, if the volume exceeds a certain threshold. Combined with visibility regarding predetermined milestones, the optimization program ensures a cost-efficient air freight supply chain and enables the customer to make decisions early and to optimize their orders.
Order management for one of the largest do-it-yourself retailers in Scandinavia: the customer awarded Panalpina with inbound ocean freight volumes to Scandinavia, because Panalpina provides order management visibility and exception reporting on predetermined milestones. Thus, the customer is able to consolidate goods between vendors in Asia and to take upstream and quality supply chain decisions. At destination, enhanced visibility also allows planning for inbound freight.
Following a very successful 2013, Panalpina grew its consumer and retail air freight and ocean freight volume despite a challenging market environment in 2014. Growth was achieved, especially in Logistics and as a result of success stories in Asia-Pacific in particular. Overall, the focus on five selected strategic global accounts paid off.

Panalpina Annual Report 2014
28Industry Know-How
customer focusTo maintain the positive growth trend, a training program for the consumer and retail sales organization was launched, starting in the Americas region. The program is divided into strategy awareness and industry awareness, including customer participation with interac-tive sessions on customers’ requirements for logistics solutions. Combined with roundtable discussions with customers, this initiative puts the voice of the customer at center stage, ensuring that Panalpina’s solutions meet customers’ needs.
Panalpina will continue to provide value-added solutions to consumer and retail companies in 2015 and 2016. In the consumer industry, the ambition is to become market leader for global freight management solutions. In the retail industry, Panalpina aims to be market leader for order management and buyers’ consolidation solutions on strategic trade lanes.
fAshion
market situationMultichannel retailing, e-commerce and erratic consumer behavior make for a challenging environment for fashion companies, pressuring them to render supply chains more efficient. Fashion is a “fresh” market where goods need to arrive at the right time, in the right quantity, at the right place and at the right quality.
highlightsThe fashion industry is ever changing with increased global consumption, new brands in the market and new shopping channels. Trends are short-lived and preferences vacillate. To support customers as they navigate this multichannel environment, Panalpina offers upstream visibility solutions. Visibility allows customers to plan for urgent demand and to optimize deliveries to store shelves and other sales channels to reach consumers in time.
For example, Panalpina supplies one of the largest high-end fashion brands with an innovative end-to-end radio-frequency identification (RFID) solution: RFID enhances visibility, so that shippers can trace clothes and accessories at carton or item level. The solution also improves security — a major concern for high-value fashion labels — by making it possible to trace losses with high accuracy and thus also ensuring protection against loss of intellectual property. Maybe most importantly, RFID allows quick handling at destination, optimizing deliveries to stores and to consumers.
In 2014, Panalpina continued to grow in the fashion industry, outperforming the market by generating business from existing relationships with fashion brands and by providing value-added solutions.
customer focusPanalpina organized several roundtable discussions with fashion companies in 2014, leading to deepened relationships and value creation for the customers participating. Panalpina’s fashion team will continue to invest in fashion roundtables, since they match future industry trends with logistics solutions development, for both the customers’ and Panalpina’s benefit.
In 2015 and 2016 Panalpina will continue its value-added approach to become a true end-to-end value provider in fashion logistics, while at the same time maintaining local competencies and customer care. To connect the dots between critical fashion markets and between production and consumption, Panalpina is developing strategic hubs for fashion competence.

Panalpina Annual Report 2014
29Compliance
compliAnce
The essence of Panalpina’s ethics is captured in its Code of Conduct. This document, which is updated regularly, is the company’s guide to doing business with integrity which, together with business-specific policies and local laws and regulations, acts as a compass helping the Panalpina team navigate the sometimes difficult choices faced in daily business.
panalpina’s code of conductAll Panalpina employees are subject to the Code of Conduct and each is expected to understand and follow the Code. The Code itself outlines the philosophy of the company, the expectations of the management team, how violations of the Code are to be handled and the protections afforded to people who identify potential problems that require addressing.
Topics covered in the Code of Conduct include: - Fostering a positive work environment, including issues of diversity, discrimination, fair employment practices and health and safety- Conflicts of interest. Including outside employment and family and personal relationships- Conducting business with integrity, including bribery, gifts, contributions and sponsorships, competition and antitrust and other compliance issues- Financial integrity, including record keeping, responsibility of senior officers, insider trading and money laundering- Protecting company assets and information, including physical assets, intellectual property and privacy- Environmental protection, including compliance and proactive efforts to avoid undue impacts
combating corruptionThe commitment to core values extends throughout the business. Panalpina takes compliance with all applicable laws and regulations seriously. The company always seeks to avoid infractions and when issues are uncovered, takes steps to identify the root causes for such infractions. Corruption is not taken lightly. Panalpina has major operations in all parts of the world, including some where corruption is common and thus continuously monitors globally for ethics- and compliance-related issues and risks. Specific operational units and areas where Panalpina operates are regularly assessed for risks related to potential corruption using a comprehensive risk analysis methodology. Particular focus is given to geographical areas where risk exposure is deemed to be high. In 2014, on-site reviews were performed at Panalpina facilities in 30 countries and more than 300 subcontractors were subjected to detailed reviews of their business practices relating to ethics- and compliance-relevant issues.
Resources and trainings for complianceComprehensive training on corruption-related issues is provided to Panalpina employees, via an e-learning platform. In addition to web-based learning, on-site training programs are organized for the management teams. Panalpina’s commitment to rooting out the causes and influence of corruption includes its nonengagement with political campaigns and referendums; as a matter of policy, Panalpina does not participate or contribute to political campaigns, candidates, or political parties.
Performance, integrity and professionalism — Panalpina’s core values are more than just words: they form the core of how the company conducts its daily business. Panalpina’s challenge is to live these values every day.

Panalpina Annual Report 2014
30Employees
employees
In 2014, Panalpina welcomed a new Chief Human Resources Officer to the company while continuing its consolidation of the human resources (HR) organization and processes to reflect the changing business landscape and the corresponding need for a well-trained and committed workforce.
strong foundations for human resources managementFour strategic priorities form the core of Panalpina’s approach to human resources management: - Identify, attract, manage and deploy required talent- Propagate a sustainable high-performance organisation and workforce- Develop leadership and other capability and competence requirements- Design, implement and optimize HR processes.
These strategic priorities guide several key initiatives that are designed to strengthen the foundations upon which Panalpina’s human resources management is based.
In 2014, the global deployment of an integrated human resources information technology platform was completed. The PanLink system creates one global and centralized HR system to
- improve data availability, quality and consistency throughout the enterprise- to introduce greater transparency into people processes worldwide- to provide the ability to quickly analyze data in order to improve business decision making.
PanLink will enhance the ability for Panalpina to manage its human resources functions strategically, by having the proper tools in place across all business units and geographies and will provide the management team with a global tool for executing the company strategy through objectives while also increasing efficiency by eliminating manual processes.
The human resources organization also continued key consolidation efforts to better support the new regional structure and the matrix organization. Four regional heads of human resources were installed, providing for an effective business partner structure at the regional and country levels and allowing for efficient and localized management of key human resource processes.
panalpina’s commitments to its teamA committed and engaged employee is one that is respected by management and peers, compensated fairly according to applicable laws and market norms and is given the opportunity for continued development and advancement during their tenure in the company. In return for these, an employee, regardless of rank or tenure is expected to carry oneself with integrity and honesty. Panalpina’s Code of Conduct outlines the expectations that the company has of its employees. All Panalpina employees are subject to this Code of Conduct and all are expected to understand and follow this Code and all applicable laws in their daily work.
At the same time, Panalpina’s employees can expect to be treated fairly and with respect. For example, this extends to issues of discrim-ination, fair labor practicesand collective bargaining. As approximately 25 percent of Panalpina’s employees are covered under collective bargaining agreements, the company complies with all applicable local laws and regulations regarding notice of operational changes at our facilities. Processes for employees to express concerns and/or file formal complaints are established and available for use. Typically, employees will first make their concerns known at the local facility level. If they cannot be resolved locally, they are then escalated to regional and ultimately corporate level. In 2014 there were 23 complaints about labor practices or discrimination that were brought to the attention of Panalpina’s senior management and satisfactorily resolved.
Fostering and developing talent — Sustainable success for Panalpina as a company is ensured by the talent and dedication of its employees. Training and development are the basis for continued improvement and robust management and IT systems and processes are the essential foundations upon which the system is able to work as an integrated whole.

Panalpina Annual Report 2014
31
Another factor that contributes to a high-performing workforce is that it recognizes issues regarding gender balance and equal treatment in the workplace. On the whole, Panalpina has a rather balanced representation of men and women, 53 percent male versus 47 percent female globally, balanced relatively equally across age groups. While there is certainly geographic variability in the gender representa-tion, these figures reflect the opportunities that the company provides to its employees regardless of gender.
A critical element of Panalpina’s commitment to fairness and transparency extends to how it recognizes and rewards performance. All employees are given regular performance reviews and in 2014, a global grading system was rolled out to ensure consistency and fairness of compensation. Salary ranges and a bonus target policy have been made available and the company is working to have them implemented in all countries in the midterm.
Workforce development and trainingTraining and development are critical cornerstones for Panalpina’s success. In order to succeed in a highly dynamic, demanding business environment, employees must be equipped with the latest information and skills. Panalpina has a long-standing commitment to providing extensive training and development opportunities to its employees at all levels in the organization. As a clear example of this, Panalpina is an organization that is organized according to the principles of a “matrix” organization. This enables the company to further its strategic goal of joint decision making between the products and geographies. In 2014, the company rolled out training specifically to address these objectives to the top managers to ensure that this information is shared throughout the organization.
Other training programs in 2014 included 29 employees participating in Navigating our Future, Panalpina’s global talent program for high potential employees in mid senior positions who are willing to consider international careers. 440 employees participated in over 2,000 training hours across the Middle Management programs covering subjects of communications, empowerment, performance management and leadership. Over 200 participants attended Basics of Finance which was redesigned to reflect the new financial reporting system that was implemented in 2014. A new suite of programs titled “the Art of Delivery” in collaboration with the Royal Academy of Dramatic Arts and The Storyboard Approach were piloted to help employees hone their business presentation skills.
The Sales Academy continued rollout across the regions with a focus on consultative and value selling in order improve the skills of Panalpina’s front-line sales team to drive greater value for its customers. In 2014, PanAcademy Online, Panalpina’s e-learning platform, remained the main source of virtual learning for over 15,500 employees with 60 learning units offered in more than 15 languages. These learning units cover subjects such as the company’s strategic environmental PanGreen initiative as well as operations, air, ocean and logistics competence, compliance and refresher courses on the Code of Conduct and anticorruption. Additionally, 2014 saw the expansion of PanFilms, the company’s in-house portal to disseminate key strategic messages and product information across the globe.
The company also worked to recognize the potential of employees for future success by conducting “Talent Reviews” to calibrate the performance and potential of employees, to identify talent and to agree on succession plans and development actions for senior management. Such reviews have been conducted on all organizational layers. In addition to this, through a collaboration with an external partner, Panalpina conducted fourteen leadership assessments to identify potential replacements in senior management positions.
looking aheadIn 2015, Panalpina will continue to build a stronger talent pipeline, with a high focus on young graduates, professional at early stages of their careers and exchange program and by intensifying collaboration with business schools and other talent suppliers. The PanLink rollout will continue, focusing on establishing an effective support structure, building strong data quality and basic analytics and include the deployment of additional modules such as learning management and time management. In 2015, the next employee engagement survey will be conducted to acquire data regarding the attitudes of employees and to understand better where opportunities for improve-ment lie. Efforts will be made to upgrade the skill set of human resource managers to support the transformation towards partnering on all organizational layers and supporting organizational changes. Lastly, the company aspires to building a strong “employer brand” to increase employee attraction through various methods, including leveraging social media activities for proactive recruiting of potential employee candidates.
Employees

Panalpina Annual Report 2014
32Information Technology
infoRmAtion technology
Information technology provides the foundation to deliver exceptional service to customers and to operate businesses efficiently. This is accomplished by building efficient infrastructure and providing tools that foster information exchange, productivity and innovation across all operations. An example of this is the globally rolled-out human resources platform PanLink, which provides new connectivity and data availability across the organization. Also in 2014, a new greenhouse gas calculator was deployed, allowing Panalpina in its PanGreen program to quickly and efficiently provide customers with information about the greenhouse gases emitted as a result of shipments made on their behalf.
upgrading transportation management systemsThe continued deployment of the transportation management system (SAP TM), which is part of Panalpina’s larger Operations Trans-formation Program (OTP), is on track and expected to be completed in 2016. The new system will streamline and make Panalpina’s freight-forwarding infrastructure more efficient, supporting the OTP’s overall goal of increased efficiency and improved bottom-line performance. The pilot of the new, SAP-based global finance system was successfully deployed in Switzerland and the project is on track for deploying it further to the next wave of countries in early 2015.
World-class supply chain solutionsFurther investment was made in Panalpina’s customer systems’ visibility (inventories, freight invoices) and execution (e.g. e-booking, e-bil ling) capabilities which not only provide the customers with value, but also help drive internal productivity. With the add-on myPanalpina+ we have complemented myPanalpina with two external tools from JDA and LOG-NET. These strategic partnerships are enabling us to deliver a comprehensive suite of powerful modules. Both software companies are market leaders and offer enhanced capabilities for advanced supply chain solutions from purchase order and freight management to system-based transport optimization, network modeling and reporting and analytics.
security and privacyInformation security, privacy and data system resilience are topics of utmost importance to Panalpina. In recent years, the IT infrastruc-ture has been strengthened by replacing and upgrading security technology and by updating the Panalpina Information Security Policy, which outlines to employees the expectations and requirements that the company has regarding the security of IT assets. Awareness campaigns and mandatory e-learning modules support these efforts. 2014 saw the completion of investment in the strategic upgrading of Panalpina’s datacenter facilities to significantly improve resilience and disaster recovery capabilities.
sustainable information technologyThe IT infrastructure also contributes to Panalpina’s overall sustainability efforts, as efficient equipment has enabled Panalpina to continue to reduce the energy and greenhouse gas footprint of its IT data centers. Furthermore, virtualization of servers has helped to significantly reduce the power consumption.
The information technology team continues to improve customer-facing systems to handle information and data efficiently. Sustainable practices such as e-billing and e-booking and paperless shipments, made possible by the advanced IT infrastructure, benefit both customers and employees by reducing the volume of paper usage. These initiatives ensure the alignment of IT with overall business goals and a commitment to sustainability.
Drivers for excellence — The ability to collect, process, analyze and present informa-tion quickly and accurately enables Panalpina to maximize revenue, reduce costs and provide a world-class service to the customers.

Panalpina Annual Report 2014
33Security
secuRity
In 2014, Panalpina continued to add value for its customers through a variety of new and ongoing initiatives that provide enhanced security solutions throughout the world. Safeguarding customer assets during transportation is a priority that has recently been improved by real-time third-party shipment monitoring in Europe and Latin America and the use of security escorts and armored transports in South Africa and Latin America. These services reduce the threat of compromised shipments and better enable the recovery of stolen goods.
enhanced security systemsPanalpina improved the integrity of its own security processes by upgrading its internal Security Risk Assessment tool to more efficiently record security data from facilities, identify anomalies and implement additional security measures throughout the supply chain network. The implementation of a new global incident management system streamlines processes, increases transparency and achieves synergies between operations, products and supporting services.
sharing experiences in trainingsTo align Security with other operational processes, Panalpina has developed a two-hour training curriculum for sales personnel, which incorporates security concepts and takes measurements during customer interfacing to support the organization’s goals. Further support was provided to the organization’s marketing, sales and account management efforts by using the Security team’s structure, expertise and initiatives to add value for our customers and to differentiate our organization from that of our competitors. This includes devising effective and customized security solutions for specific countries, markets and operational setups by aligning them with inher-ent security risks and threats (per country, region, etc.).
cooperation with subcontractorsThis commitment to security mindfulness has also been exemplified by the development of a program for our subcontractors to raise awareness of the dangers drivers face during transport. Created in 2013, the Drivers Security Awareness Program positively reinforces vigilance among our subcontractors. This integration of Security’s presence has allowed Panalpina to further distinguish itself from other providers.
Dedication to security — Panalpina Security provides strategies that help identify, respond to and mitigate security risks throughout complex global supply chains. Panalpina works closely with customers to produce the proactive security solutions that are necessary to manage risks in today’s ever-evolving logistics world.

Panalpina Annual Report 2014
34Quality
QuAlity
Panalpina’s approach to quality management is based on its comprehensive Integrated Management System (IMS). This system, which includes global certifications according to ISO 9001, 14001 and OHSAS 18001 frameworks, supports the improvements in quality and sustainability services and helps ensure that Panalpina employees take ownership for the overall satisfaction of customers. Moreover, the management system complies with and supports, a range of international certifications and specific national or international legal requirements, such as C-TPAT, CSI /AMS and Aviation Security legislation.
good distribution practicesIn 2014, Panalpina made the decision to invest in global e-learning training and certification regarding Good Distribution Practices (GDP), a framework particularly important to customers from the pharmaceutical industry. The GDP guidelines specify requirements for how medicinal products within the healthcare global supply chain are transported, stored and ultimately distributed. In 2015, 1,500 employ-ees will participate in an e-learning training concept and modules in order to ensure that Panalpina adheres to the new GDP rules.
Regular audits and root cause analysisPanalpina’s Integrated Management System is regularly reviewed by senior management to ensure optimal alignment with overall corporate goals and strategies and to improve the quality of the system itself, as well as the quality of products and services provided to customers. The internal audit function at the company independently, systematically and regularly reviews the management system. It also compares all the instructions defined in the system to the processes as they are performed in the day-to-day business of Panalpina and all its associated organizations. In addition to the efforts of the internal audit team, in 2014 much emphasis was placed on the find-ings and corresponding corrective actions based upon an audit by an external consultant. To ensure ongoing compliance with all applica-ble rules and regulations, Panalpina facilities were subjected to 117 audits by external inspectors and 131 audits by internal audit teams.
When incidents occur, Panalpina has a clearly defined set of processes to handle and analyze the incidents and to ensure that similar issues do not arise in the future. In 2014, Panalpina placed great emphasis on training and deployment of root cause analysis and Cor-rective and Preventive Action (CAPA) processes. When nonconforming incidents do occur, these must be reported in the Panalpina global Incident Handling Tool (IHT). This tool supports the incident-solving process and allows automatic action triggering and notification by the concerned parties. The appropriate teams then perform a thorough root cause analysis and CAPA process, to be able to identify potential weaknesses in the system and initiate corrective actions at the appropriate scale.
continuous improvementAnother key quality-focused program at Panalpina is the Continuous Improvement Program (PanCIP). PanCIP is the embodiment of the approach and commitment to continuous improvement of the quality of all processes, products and services. The framework helps structure the daily task of checking operational processes, identifying problems and making improvements. The objectives of the program are to improve the level of quality and customer satisfaction throughout the whole Panalpina Group, by increasing overall competence and efficiency. It also creates transparency and enables the team to actively manage processes and shift from emergency planning to longer-term, more strategic activities.
Part of the approach to continuous improvement at Panalpina includes a focus on loss prevention and streamlined claims handling. In 2014, Panalpina sought to improve upon reporting incidents of theft, cargo damage and/or misrouting through the IHT system by identifying and correcting the causes and working the customers to resolve such claims efficiently. Metrics regarding such claims are monitored regularly; by crosschecking any claims with Panalpina’s legal team, conducting corrective and preventative actions where appropriate, Panalpina can drive future improvements in performance.
improving project management — panpmThe PanPM program aims to further improve and professionalize project management within Panalpina. It is designed to improve the management and delivery of services to customers through well-trained PanPM champions deployed in every area and at every corporate level of Panalpina. The PanPM champions help to improve the management of projects and thus the quality, in a lasting and sustainable manner. The group of PanPM champions form an expert network in the company, empowering members of the staff and implementing guiding standard procedures, including usage of the software platform AtTask, for project management.
Ensure excellence — Panalpina has a singular focus on understanding the needs of its customers and delivering the highest quality service. The company continuously evaluates customer’s needs and satisfaction levels and constantly adjusts its portfolio of products to meet their requirements.

Panalpina Annual Report 2014
35
heAlth And sAfety
taking our role seriouslyPanalpina’s commitment to the highest level of health and safety performance is demonstrated by its global certification to the standards of OHSAS18001. One of the first major logistics companies to receive such certification globally, this demonstrates that the company has adopted the strong risk-based and data-driven management systems needed to identify and control health and safety risks, reduce the potential for accidents and proactively improve overall health and safety performance, year over year.
health and safety performanceIn 2014, Panalpina saw across-the-board improvements in its health and safety performance. Incidents that required any kind of medical treatment or resulted in missed work days decreased appreciably. Reported near misses increased, as did violations of health and safety requirements by subcontractors. However, much of that can be attributed to ongoing efforts to increase reporting of such incidents, rather than increases in their occurrence. Inspections increased significantly in 2014, indicating again the increased vigilance Panalpina is giving to the health and safety of its workplaces.
As an example of the successes enjoyed in 2014, Panalpina was the main contractor in the ATLAS project, an intensive effort to move an entire airport in Qatar, most of which within an 18-hour time window. Despite the complexity of the move and the short time window for the move, the team was able to execute the project without a single injury or incident relevant to health and safety.
Workplace health and safetyIn Germany, programs were offered to employees regarding stress management, smoking cessation and ergonomics. Health and safety campaigns in Poland focused on workplace safety in warehouses, training regarding wellness and the safe transport of cargo. In the Netherlands there was an awareness campaign for staff on how to recognize a stroke or heart attack. In addition to regular training programs, Panalpina’s Ghana facility introduced “Monthly Safety Moments,” an e-mail campaign aimed at briefing the staff on basic health and safety tips within and outside the workplace. This past year, in the United States, Panalpina health and safety teams received training in federal OSHA rules and guidelines and implemented new programs on blood-borne pathogens and lock-out/tag-out techniques.
A culture of safety Safety in Panalpina’s storage facilities is not only to protect the physical well-being of employees and contractors, but it is also to adhere to various laws and regulations regarding workplace safety. The International Air Transport Association (IATA) and the International Marine Organization (IMO) are just two of the many organizations whose standards Panalpina must comply with. For example, only qual-ified workers are allowed to lift, shelve and store cargo in Panalpina’s or subcontractors’ warehouses using state-of-the-art equipment.
Employee behavior and an openness to acknowledging issues as they arise also has a strong impact on occupational health and safety. Panalpina’s long-running program called O.O.P.S. (Observation of Performance Standard) encourages staff to freely report any concerns or incidents regarding health and safety or compliance with workplace safety standards and regulations. Panalpina can quickly identify any potentially systemic safety issues and through its Safety Alerts System, notify all facilities globally, to prevent similar incidents from occurring elsewhere.
training and preparednessSome of the work that Panalpina performs around the world has the potential to be quite dangerous if not executed carefully and with the proper equipment and training. Only qualified and competent personnel are allowed to perform tasks, all Panalpina employees are informed about the hazards of the work they are asked to do and they are provided with the highest quality safety equipment necessary. In the case unexpected events do occur, Panalpina has comprehensive emergency readiness and emergency response plans in place. In 2014, Panalpina implemented a program where all health and safety managers will be trained according to the standards set by the Institute for Occupational Safety and Health. This rigorous program, hosted by the British Safety Council, covered a comprehensive range of health- and safety-related subjects including risk assessment, identifying hazards and measuring performance. Participants were required to develop a risk assessment plan and take a final examination. Panalpina is one of the only logistics providers to
Safe and successful — No single issue has a greater impact on performance and Panalpina is committed to giving the highest level of attention to health and safety awareness and training. Last year Panalpina was successful in achieving all of its 2014 health and safety performance targets.
Health and Safety

Panalpina Annual Report 2014
36
implement such a systemic and standardized level of training in workplace health and safety, which ensures a consistently high level of organizational competence among the health and safety team.
good housekeepingPanalpina utilizes a data-driven approach to identify opportunities to proactively improve upon its health and safety performance. For example, this past year a “Good Housekeeping” campaign was carried out at its offices and warehouses. Staff were shown the benefits of a clean and orderly workplace and how through proper maintenance and organization, many common yet easily preventable workplace accidents could be avoided.
In the logistics industry, a common source of accidents and injuries relates to the use of forklifts. In 2014, Panalpina implemented a forklift safety campaign, which included a comprehensive presentation from the health and safety management team, to ensure that all operators of forklifts are properly trained and that the equipment was being adequately maintained. As an added incentive, Panalpina provided a donation to UNICEF for each inspection performed, further motivating the employees to participate and widening the interest in the campaign to staff not normally engaged with forklift-related issues. In one 24-hour period, almost 1,000 equipment inspections were performed worldwide at Panalpina facilities, with results being displayed in real time on the Panalpina intranet.
health campaignsPanalpina’s health campaigns are always well-received and popular morale boosters among the employees. Campaigns are offered at Panalpina facilities around the world and cover a variety of topics, with information and trainings about issues such as ergonomics, cardiovascular health, hygiene, physical activities, weight management, etc. Vendors are frequently invited to come on site and showcase their services including massage, dentistry, health clubs, weight loss, biometric screenings, chiropractors, acupuncture and dermatology screenings for skin cancer, etc.
Health and Safety

Panalpina Annual Report 2014
37Environment
EnviRonmEnt
Commitment to improvementEffective environmental management systems provide a framework for constant awareness of impacts and enable an organization to recognize opportunities for improvement, even in the context of unknown circumstances and a rapidly changing business landscape. Since the introduction of PanGreen and even before, Panalpina has had comprehensive management systems (including ISO14001) in place that have allowed them to maintain a coordinated overview of the company’s impacts and the opportunities to make improvements.
An indicator of these improvements is the steady increase in scores that Panalpina has received from the Carbon Disclosure Project (CDP), the world’s leading platform for disclosures of corporate greenhouse gas inventories and management approaches. Starting in 2008, when Panalpina first participated in the CDP, it has steadily improved upon the scores it has received each year. This recognizes improvements in disclosures of emissions and increased transparency regarding the systems and processes designed to impact green-house gas emissions.
Another demonstration of improvement in environmental performance is the 2014 opening of a new warehouse, GLP Misato III, in the Saitama Prefecture, Japan. This facility is certified at the highest platinum level of the LEED (Leadership for Energy and Environmental Design) rating system. The five-story, state-of-the-art logistics facility in Greater Tokyo includes 94,718 square meters of floor space and is equipped with dual ramps allowing service vehicles to drive up to each floor — demonstrating the effectiveness of land use in a country where land is limited. Business continuity and environmental awareness are also key features for GLP Misato III. The property is equipped with seismic isolators that absorb 75 percent of all shock caused by earthquakes and other amenities including LED lighting, solar panels, green parking spaces and emergency sewage systems that ensure business continuity in case of natural disasters, while also creating a comfortable working environment for the Panalpina team. The facility was the first logistics facility in Japan to be awarded LEED Platinum.
Working with stakeholdersIncreasingly, Panalpina’s customers are asking for the company’s cooperation and collaboration in helping them understand the impacts of the shipping and logistics services that Panalpina provides on their behalf. In 2014, the company began automatically calculating customers’ greenhouse gas emissions from the transport services they use based on the reporting standard EN 16258. This recently introduced European standard includes upstream emissions from fuel production, other greenhouse gases besides CO2 and energy consumption. Panalpina’s state-of-the-art tool will run more accurate reports for customers so they can develop effective strategies to reduce the environmental impact of their global transport chains.
Panalpina’s system calculates emissions for each shipment including pre- and on-carriage movements based on distance, weight, transport mode and the type of vessel or aircraft. The latter can usually be derived from flight numbers. For air freight, the actual routing — this can involve several airports — is used. For ocean freight, the ship size and speed reductions are considered. Distances are calculat-ed using comprehensive GIS (Geographic Information System) data. Besides worldwide up-to-date road networks, this database also contains the geographic coordinates of over 100,000 airports and ports.
Engaging employeesIn 2014, Panalpina organized its first Global Environment Day, a company-wide day for the entire Panalpina organization to celebrate the company’s achievements in environmental stewardship and to provide opportunities for the Panalpina team to participate in environ-mental initiatives at the local facilities and in the communities where they operate.
Global Environment Day took many different forms at each Panalpina facility. Some Panalpina teams planted trees, while Panalpina Canada organized an entire environmental week celebration with environmental film viewings, e-mail campaigns and the distribution of LED light bulbs. In Ecuador, employees calculated their environmental footprint and learned about ways that they could minimize their environmental impacts in their daily lives. The Panalpina teams in Congo and Qatar organized photography contests and the team in Ghana learned about the potential savings from shutting off unused electronic devices. India held a salad-making contest and the Indonesia facility worked with its vendors to help them identify opportunities for energy savings.
Environmental performance — Panalpina’s environmental programs are coordinated under the umbrella of its PanGreen programs. Started in 2013, PanGreen consists of a comprehensive portfolio of programs to monitor, improve and communicate Panalpina’s commitment to environmental protection to its stakeholders.

Panalpina Annual Report 2014
38Environment
Other activities that engaged the Panalpina team across the company in 2014 included the “Thinking Green Awards” in Brazil, battery collection efforts in France and Mexico and water reduction efforts in many facilities including the United States, Mexico and the Czech Republic.
metrics for 2014In general, environmental metrics for 2014 showed across the board improvements relative to 2013. Total electricity consumption across the company decreased slightly and the energy used for heating Panalpina facilities decreased more significantly by 14 percent. The decrease in heating energy was primarily due to climatic conditions in several key locations where winter temperatures were more moderate than usual. Vehicle fuel consumption decreased slightly by 6 percent. Overall CO2 emissions decreased by 8 percent, with most of that decrease attributable to a stricter travel policy that limited air travel, which thus reduced air-travel-associated emis-sions. Scope 2 emissions from indirect energy usage decreased slightly between 2013 and 2014. In 2014, there were 3.7 tons of CO2 equivalent emissions per full-time equivalent employee versus 4.1 tons per FTE in 2013, a reduction of 9 percent.
Other environmental indicators routinely collected include paper consumption, which decreased by 8 percent despite increased business activities and water consumption, which decreased by 9 percent primarily due to weather and climatic conditions in the areas of key Panalpina facilities.
The table on the next page gives an overview of the environmental performance figures collected in 2014 across Panalpina’s global internal operations.

Panalpina Annual Report 2014
39Environment
energy balance by energy categoryTerajoule
300
250
200
150
100
50
0
Electricity
229
14
Heating
10
0.3
94
Owned vehicles
162
Indirect renewable energy Indirect energy Direct energy Direct renewable energy
co2 emission by scope and activityTons of CO2 equivalent
35,000
30,000
25,000
20,000
15,000
10,000
5,000
0
Indirect CO2 emission Direct CO2 emission
32,062
Electricity
1,286
5,400
Heating
11,779
8,267
Owned vehicles
Business flights
Activities 1 peRfoRmAnce indicAtoR unit 2013 2014
eneRgy And co2
Electricity Consumption Terajoule 248 244
Heating Overall consumption Terajoule 121 104
District heating District heat Terajoule 15 10
Vehicle fuel Consumption 1 (Panalpina-owned and lease vehicles only) Terajoule 174 163
CO2 emissions 2 Total emissions Tons 63,398 58,793
- Direct (Scope 1) Tons 18,654 17,179
- Indirect (Scope 2) Tons 34,267 33,348
- Indirect (Scope 3, business air travel 3) Tons 10,478 8,267
- Relative emissions per FTE Tons/FTE 4.0 3.7
mAteRiAls
Paper Consumption Tons 1,055 967
Water Consumption m3/1000 431 394
1 Panalpina-owned and lease vehicles only2 CO2 emissions were calculated according to guidelines of the Greenhouse Gas Protocol. Emission factors for direct emissions were taken from IPCC, 2006. Emission factors for indirect emissions were taken from the International Energy Agency (IEA) and from the UK Department for Environment, Food and Rural Affairs (Defra).3 Indirect emissions from subcontracted transportation are also significant. Yet, calculation of these emissions has only started in 2014. In addition, CO2 emissions from subcontracted transportation are driven primarily by customer demand and requirements whereas emissions from business travel may be influenced by travel policies. Therefore only the latter is presented here.

Panalpina Annual Report 2014
40Social Commitments
sociAl commitments
flight for unicefOne of the charitable activities in 2014 included a collaboration with the United Nations Children’s Fund (UNICEF) to support the fight against the global Ebola crisis. On December 16, a donated Panalpina flight departed from Luxembourg to deliver nearly 80 tons of vital supplies to community centers in Sierra Leone. Relief goods such as masks, clothing, tents, food and medicine will greatly benefit patients and malnourished children in this heavily affected region.
supporting community healthIn Thailand, Panalpina employees conducted a drive to collect scrap aluminum to support the donation of an artificial leg to a person in need. The Panalpina team in Peru participated in a bottle collection drive to raise funds for a school to be able to provide breakfast for its students and promote healthier eating habits.
educational programsIn 2014, Panalpina employees in Brazil developed a campaign to collect the e-waste produced by Panalpina and its staff when computers and network equipment are replaced. More than 270 pieces of equipment were collected and donated to Oxigenio, an organization that uses the electronics to teach local youth about the computer maintenance profession. The recycled equipment collected was then distributed to public schools.
environmental improvementVarious Panalpina teams participated in landscaping activities in hopes of building a sustainable future for the children of tomorrow. In Japan, more than 200 books were collected and donated to a charity organization to raise money to plant trees locally. In conjunction with the Garden City Fund charity, Panalpina Singapore employees planted 22 trees. Panalpina Prague also co-organized an event with Sázíme Stromy to plant trees on the premises of an elementary school to help create a healthy environment for students and neighbor-hood residents. This also contributed to the ecological awareness of children attending the school. These trees were marked with a sign indicating they had been planted by Panalpina volunteers.
In Malaysia, the Panalpina team participated in a beach cleaning and volunteered at the Padang Kemunting Turtle Conservation Center, where they helped clean the hatching area for baby turtles and also collected a sizable cash donation to support the operations of the facility.
A responsible community approach — Panalpina is committed to making positive impacts in the communities where it operates. In 2014, Panalpina flew UNICEF relief goods to Sierra Leone. Panalpina’s regional business units were involved in many local projects and support various programs that further educational opportunities for local residents or improve the surrounding environments.

CORPORATE GOVERNANCE
REPORT
Panalpina Annual Report 2014
Corporate Governance 41

Corporate GovernanCe
Panalpina is committed to a transparent management structure that is governed by in-ternational principles. This Corporate Governance Report complies with the Directive of the SIX Swiss Exchange and therefore provides investors with the corresponding key information.
Panalpina annual report 2014
Corporate Governance 42
board of direCtors
Executive Board + Executive Committee (ExCom)
* ExCom member as of January 1, 2015. Sven Hoemmken, Head of Sales, served as ExCom member until December 31, 2014.
Chief finanCial offiCerRoBERT ERnI
Chief human resourCes offiCerkaRSTEn BREum
Chief leGal offiCer CHRISToPH HESS
Chief information offiCer RoDERICk anGwIn
Chief CommerCial offiCerkaRl wEyEnETH
Chief exeCutive offiCerPETER ulBER
Corporate auditDanIEl TREfzER
europeVolkER BöHRInGER
ameriCasfERDInanD kuRT
asia paCifiCSTEfan kaRlEn
middle east ⁄ afriCa ⁄ CisPETER TRIEBEl
air freiGhtluCaS kuEHnER
oCean freiGhtfRank HERCkSEn
loGistiCsmIkE wIlSon
enerGy solutionsHanS ToGGwEIlER
ComplianCemaRkuS HEyER
Corporate developmentRafIC mECaTTaf
Group manaGement struCture
Global operationsanDy wEBER*

1 GROUP STRUCTURE AND SHAREHOLDERS 1.1 GROUP STRUCTURE 1.1.1 Operational group structure
Panalpina’s business activities are primarily regionally oriented. The operating structure is divided into the following four regional segments:
– Americas (North, Central and South America) – Asia Pacific – Europe – MEAC (Middle East, Africa and CIS)
Secondary, the business activities are subdivided into the following business segments: – Air Freight – Ocean Freight – Logistics (value-added services, distribution solutions)
Supplementary information can be taken from the segmental reporting section of the Consolidated Financial Statements (pages 71 – 144).
1.1.2 Listed companies within the scope of consolidationPanalpina World Transport (Holding) Ltd. (PWT), the ultimate holding company of the Panalpina Group, is the only listed company within the scope of consolidation. PWT has its registered office in Basel, Switzerland. The PWT shares are exclusively listed on the SIX Swiss Exchange. The market capitalization on the closing date amounted to CHF 3.17 billion (23,750,000 registered shares at CHF 133.50 per share).
The PWT shares are traded under Valor no. 216808, ISIN CH0002168083, symbol PWTN.
1.1.3 Nonlisted companies within the scope of consolidation The main subsidiaries and associated companies are disclosed in the Consolidated Financial Statements (pages 71 – 144) item-ized by registered office, nominal capital, equity interest in percent, investment and method of consolidation.
1.2 SIGNIFICANT SHAREHOLDERS On December 31, 2014 the Ernst Göhner Foundation, Zug, Switzerland, is the main shareholder of PWT, with an equity participa-tion of 45.9 percent.
Cevian Capital II Master Fund LP held a share capital of 12.3 percent on closing date. Other significant shareholders according to their most recent disclosure notices are Artisan Partners Limited Partnership (≥10 percent) and Janus Capital Group (≥5 per-cent). During the reporting year the following disclosure notices (listed by shareholders and transaction date) were filed on the SIX online publication platform:
Artisan Partners17.03.2014 change in group composition (9.27 percent)26.09.2014 increase of share ownership to 10.05 percent
Janus Capital Group21.10.2014 increase of share ownership to 5.04 percent
1.3 CROSS-SHAREHOLDINGS No cross-shareholdings exist between PWT and any other company.
Panalpina Annual Report 2014
Corporate Governance 43

2 CAPITAL STRUCTURE 2.1 CAPITAL
On the closing date, the ordinary share capital of PWT amounted to CHF 2,375,000 and is divided into 23,750,000 registered shares, with a nominal value of CHF 0.10 each.
2.2 AUTHORIZED AND CONDITIONAL SHARE CAPITAL The extraordinary Shareholders’ Meeting of PWT held on August 23, 2005 agreed with the Board of Directors’ proposal to create an authorized share capital up to a maximum aggregate amount of CHF 6,000,000 by issuing a maximum of 3,000,000 regis-tered shares with a nominal value of CHF 2.00 each. At the Shareholders’ Meeting of May 10, 2011 the authorized share capital was renewed at the same value until May 2013. At the Shareholders’ Meeting of May 8, 2012, the authorized share capital was reduced in conjunction with the reduction of the share capital (see section 2.3 below) to a maximum aggregate amount of CHF 300,000 by issuing a maximum of 3,000,000 registered shares with a nominal value of CHF 0.10 each. At the Shareholders’ Meeting of May 15, 2013, the authorized share capital was renewed at the same value until May 15, 2015.
The Board of Directors is authorized to exclude the preemptive rights of shareholders and to convey them to third parties, pro-vided that such new shares are to be used for the takeover of entire enterprises, divisions or assets of enterprises or participations or for the financing of such transactions. The Board of Directors has not yet made use of this authorization.
No decision has been made regarding the creation of conditional capital.
2.3 CHANGE IN CAPITAL OVER THE PAST THREE YEARS At the Annual General Meeting of May 8, 2012, the share capital was reduced from CHF 50,000,000 to CHF 2,375,000 by way of cancellation of the repurchased 1,250,000 shares and further reduction of the nominal value per share from CHF 2.00 to CHF 0.10 each. No changes were made during the reporting year.
2.4 SHARES AND PARTICIPATION CERTIFICATES On the closing date, 23,750,000 fully paid-in PWT registered shares with a nominal value of CHF 0.10 each were issued. On this date, no participation certificates were issued.
2.5 DIVIDEND-RIGHT CERTIFICATES On the closing date, no dividend-right certificates had been issued.
2.6 LIMITATIONS ON TRANSFERABILITY AND NOMINEE REGISTRATIONS 2.6.1 Limitations on transferability for each share category; indication of statutory group
clauses and rules for granting exceptions Acquirers of PWT shares are entered into the share register as shareholders with voting rights upon provision of proof of the acquisition of the shares and provided that they expressly declare that they hold the shares in their own name and for their own account.
The Articles of PWT specify that any shareholder may exercise voting rights to a maximum of 5 percent of the total number of shares recorded in the commercial register. This limitation for registration in the share register shall also apply to persons who hold shares fully or in part through nominees within the meaning of the Articles. Furthermore, this limitation for registration in the share register also applies to registered shares that are acquired through the exercising of preemptive rights, warrants and conversion rights. The Board of Directors is empowered to allow exemptions from the limitation for registration in the share reg-ister in particular cases.
The Articles make provision for group clauses.
The limitations on transferability do not apply to the shares held by the Ernst Göhner Foundation because it held PWT shares prior to the implementation of the limitations (so-called grandfathering).
Panalpina Annual Report 2014
Corporate Governance 44
2.6.2 Reasons for granting exceptions in the year under review No exceptions were granted during the reporting year.
2.6.3 Admissibility of nominee registrations; indication of any percent clauses and registration conditions The Articles of PWT specify that the Board of Directors may register nominees with voting rights in the share register up to a max-imum of 2 percent of the share capital recorded in the commercial register. Nominees are persons who do not expressly declare in their application that they hold the shares for their own account and with whom the company has entered into an agreement to this effect.
The Board of Directors is empowered to register nominees with voting rights exceeding 2 percent of the share capital recorded in the commercial register as long as the respective nominees inform PWT of the names, addresses, nationalities (registered office in the case of legal entities) and the shareholdings of those persons for whose account they hold 2 percent or more of the share capital recorded in the commercial register.
The Articles make provision for group clauses.
2.6.4 Procedure and conditions for cancelling statutory privileges and limitations on transferability A resolution of the General Shareholders Meeting of PWT on which at least two-thirds of the voting shares represented agree is required for any abolition or change of the provisions relating to transfer limitations.
2.7 CONVERTIBLE BONDS, WARRANTS AND OPTIONS There were no convertible bonds outstanding on the closing date.
The only issued options relate to the share and option participation program (Management Incentive Plan, MIP) and are for cur-rently 747 senior managers of Panalpina. As of 2009, the Board of Directors and the Executive Board have been excluded from participation in this program. As of 2011, the options under the MIP program have been replaced by a free share ratio scheme. Please refer to page 58 – 69 of the Compensation Report.
3 BOARD OF DIRECTORS 3.1 MEMBERS OF THE BOARD OF DIRECTORS
At the Annual General Meeting of May 9, 2014, Rudolf W. Hug, Beat Walti, Ilias Läber, Chris E. Muntwyler, Roger Schmid, Hans- Peter Strodel and Knud Elmholdt Stubkjær were reelected to the Board of Directors for a one-year term.
On the closing date, the Board was composed of seven persons.
Three members of the Board of Directors (Rudolf W. Hug, Roger Schmid and Beat Walti) are also members of the Board of Trust-ees (Stiftungsrat) of PWT’s main shareholder, the Ernst Göhner Foundation.
Ilias Läber is a member of the Board of Directors of Cevian Capital AG, the Swiss office of PWT’s second largest shareholder. The biographies of the members are as follows:
Rudolf W. Hug, Chairman. Swiss citizen. Born in 1944. Reelected in 2014 (until 2015).
Rudolf W. Hug holds a PhD in law from the University of Zurich and a MBA from INSEAD, Fontainebleau (France). In 1985, he par-ticipated in the Executive Program of the Graduate School of Business at Stanford University. From 1977 to 1997, he worked in several positions for Schweizerische Kreditanstalt (today Credit Suisse). During the period from 1987 to 1997, he ran the inter-national division and served as a member of the Executive Board of Credit Suisse and Credit Suisse First Boston. Since 1998, Rudolf W. Hug has been active as an independent management consultant.
Rudolf W. Hug has been a member of the Board of Directors since 2005 and was appointed Chairman of the Board of Directors on May 15, 2007 following the retirement of his predecessor.
Panalpina Annual Report 2014
Corporate Governance 45

Beat Walti, Member of the Board of Directors since 2010. Swiss citizen. Born in 1968. Reelected in 2014 (until 2015).
Beat Walti holds a PhD in law from the University of Zurich. From 1998 to 2001 he was working as a consultant and engagement manager with McKinsey & Company in Zurich. In 2001, he was a co-founder and project manager of a start-up company in the healthcare sector. Since 2002, Beat Walti is a lawyer with Wenger & Vieli in Zurich specializing in corporate, commercial, con-tract, competition and antitrust law. He became partner with Wenger & Vieli in 2007 and used to be the firm’s managing partner from 2012 to 2014.
Ilias Läber, Member of the Board of Directors since 2013. Swiss citizen. Born in 1974. Reelected in 2014 (until 2015).
Ilias Läber holds a Master of Science from ETH Zurich and a PhD in Finance from the University of Zurich. From 2001 to 2008, Ilias Läber worked at McKinsey & Company, ultimately as an Associate Principal. During this time he was responsible for projects in the area of operational improvement and corporate finance for midsized and multinational companies in Europe, the US and South America. In 2008 he joined Cevian Capital AG. In his role as Partner and Managing Director he is responsible for Cevian’s Swiss office and investments in Switzerland and England.
Chris E. Muntwyler, Member of the Board of Directors since 2010. Swiss citizen. Born in 1952. Reelected in 2014 (until 2015).
Chris E. Muntwyler attended the School of Commerce in Zurich and completed various executive programs at Harvard Univer-sity, IMD in Lausanne and at the Wharton University. From 1972 to 1999 he held several positions at Swissair, until 1981 in various leadership functions in the Marketing Division, in 1982 as General Manager Marketing and Sales Scandinavia and from 1986 for North America. In 1990, he took over the responsibility for the global Price and Distribution Policy and was then leading the development and introduction of the new Group IT strategy. Before leaving Swissair at the beginning of 1999, he was Vice President Global Distribution. From 1999 to 2008, Chris E. Muntwyler held several executive positions at DHL Express, in 1999 as Managing Director Switzerland, in 2002 as Managing Director Germany, in 2003 as Chief Executive Central Europe, and in 2005 as Chief Executive United Kingdom.
Today Chris E. Muntwyler is President and CEO of the management consulting company Conlogic AG.
Roger Schmid, Member of the Board of Directors since 2003. Swiss citizen. Born in 1959. Reelected in 2014 (until 2015).
Roger Schmid holds a university degree in law as well as a PhD in law from the University of Zurich. From 1991 to 1995, he was Legal Counsel and Director at Bank Leu (today Credit Suisse). Roger Schmid works as an Executive Director of the Ernst Göhner Foundation.
Hans-Peter Strodel, Member of the Board of Directors since 2010. Swiss citizen. Born in 1943. Reelected in 2014 (until 2015).
Hans-Peter Strodel holds a PhD in economics from the University of St. Gallen. From 1969 until 1974 he was an executive assis-tant at Maschinenfabrik Benninger und Heberlein AG. From 1975 until 1994, he held several positions at the Oerlikon-Bührle Group, in 1975 as Head of Planning and Marketing in Italy, and from 1980 as Head of Finance at Werkzeugmaschinenfabrik Oerlikon-Bührle AG and Oerlikon-Contraves. From 1995 until 2008, Hans-Peter Strodel was CFO at Schweizerische Post.
Knud Elmholdt Stubkjær, Member of the Board of Directors since 2011. Danish citizen. Born in 1956. Reelected in 2014 (until 2015).
Knud Elmholdt Stubkjær holds a shipping degree from the Mærsk International Shipping Academy, supplemented with various executive programs, e.g. from IMD and INSEAD. From 1977 through 2007, he held various positions within the A.P. Møller-Mærsk Group, including a number of postings in Asian and European countries. This included positions as Head of Mærsk Line United Kingdom, President of Mærsk K.K. Japan, CEO A.P. Møller-Mærsk Singapore and Regional Manager A.P. Møller Group Asia / Oce-ania / Middle East. In 1999, he became Head of Mærsk container business worldwide, based in Copenhagen, and the same year became one of five partners in the A.P. Møller-Mærsk Group. In 2008, he became partner in the E.R. Capital Holding Group in Hamburg, serving as CEO of one of its subsidiaries, E.R. Schiffahrt GmbH, a leading maritime service provider within container, bulk and offshore shipping. Since July 30, 2012, Knud Elmholdt Stubkjær is acting as CEO and CSO of Carrix Inc., Seattle, Washington.
Panalpina Annual Report 2014
Corporate Governance 46

All the members of the Board are non-executive members and do not actively perform any managerial functions at PWT or any of the Group companies. Nor have they held any executive positions within the past three years prior to this reporting year. None of the members of the Board of Directors has a substantial business relationship with PWT or any of its group companies.
3.2 OTHER ACTIVITIES AND VESTED INTERESTS Rudolf W. Hug, Member of the Board of Trustees (Stiftungsrat) of the Ernst Göhner Foundation, Zug (Switzerland), Vice Chair-man of the Board of Directors of Deutsche Bank (Schweiz) AG, Geneva (Switzerland) and Member of the Board of Trustees of the Ernst von Siemens Musikstiftung, Zug (Switzerland).
Beat Walti, Chairman of the Board of Trustees of the Ernst Göhner Foundation, Zug (Switzerland) and a member of the National Council (Swiss Federal Parliament).
Ilias Läber, Managing Director of Cevian Capital AG, Pfäffikon (Switzerland).
Chris E. Muntwyler, Member of the Board of Directors of Austrian Post in Vienna (Austria) and of National Express Group PLC, London (United Kingdom).
Roger Schmid, Member of the Board of Trustees and Executive Director of the Ernst Göhner Foundation, Zug (Switzerland).
Hans-Peter Strodel, Member of the Board of Directors of Skyguide, Meyrin (Switzerland).
Knud Elmholdt Stubkjær, Member of the Board of Directors of various Carrix, Inc.-related entities.
Other than these, the members of the Board of Directors do not hold other material offices, nor do they carry out any other prin-cipal activities that affect the Group.
3.3 ELECTIONS AND TERMS OF OFFICE 3.3.1 Principles of the election procedure and limitations on the terms of office
The Articles of PWT do not make provision for the general renewal of office for the Board of Directors. The members of the Board of Directors are elected at each General Meeting of Shareholders with a one-year period of office. They may be reelected at any time. The Organizational Regulations of PWT specify an age limit of 72 years for the members of the Board of Directors.
3.3.2 The first election and remaining term of office for each member of the Board of Directors The timing of the first election and the remaining term of office for each member of the Board of Directors is specified under section 3.1.
3.4 INTERNAL ORGANIZATIONAL STRUCTURE The Board of Directors is responsible for the ultimate management of the company and monitoring of the Executive Board. It rep-resents the company externally and is responsible for all matters which have not been transferred to another executive body of the company by the Swiss Code of Obligations or the Articles. In line with the Articles, the Board of Directors has established Organizational Regulations that transfer certain management responsibilities to the Executive Board.
3.4.1 Allocation of tasks within the Board of Directors The Chairman of the Board of Directors is elected at each General Meeting of Shareholders with a one-year period of office. The Vice Chairman is appointed by the Board of Directors. The Chairman (in his absence the Vice Chairman) directly supervises the business affairs and activities of the Executive Board and is entitled to regularly attend Executive Board meetings. The Corporate Auditor as well as the Corporate Secretary, in his capacity as secretary to the Board of Directors, are directly subordinated to the Chairman of the Board of Directors.
3.4.2 Member list, tasks and areas of responsibility for each committee of the Board of Directors Three committees exist under the Board of Directors.
The Audit Committee consists of the following members of the Board of Directors: Hans-Peter Strodel (Chairman), Ilias Läber and Roger Schmid. The Audit Committee supports the Board of Directors with the review of the company’s financial statements, the supervision of the financial accounting standards and reporting, the review of the effectiveness of the Internal Control System
Panalpina Annual Report 2014
Corporate Governance 47
and with the efficiency of external and internal audit procedures, including risk management. The Audit Committee reviews the consolidated annual financial statements as well as the published interim financial statements and submits an application to the Board of Directors for approval. It regularly maintains contact with the Group Auditors and the Corporate Auditor. On this basis, it adopts the detailed reports of the Group Auditors and semiannual reports of Corporate Audit. It is therefore in the position to audit the quality, effectiveness and interaction between the control systems, to determine the audit priorities, to introduce pro-posed measures and to monitor their implementation. The Audit Committee determines the organization of Corporate Audit, adopts the internal audit charter and approves the annual planning and scope of internal audit.
In the field of risk management, the Audit Committee approves the detailed and weighted risk map of the Executive Board, adopts the necessary measures for risk control and risk mitigation and reports the respective outcome to the Board of Directors on a yearly basis. The risk map itself covers any strategic, financial, operational, legal and compliance risks that could signifi-cantly impact the company’s ability to achieve its business goals and financial targets. Identified risks are weighted and prioritized by the Executive Board according to their significance and likelihood of occurrence. For each risk, specific risk miti-gation measures – including their current status – are defined and responsibilities are allocated. The risk map, which is compiled by the Risk Review Committee, chaired by the Corporate Secretary, for review by the Executive Board and subsequent approval by the Audit Committee, contains risks identified and assessed by the respective corporate functions, Regional Management, Corporate Audit and the Group Auditors. The Group’s key risks are annually reported to the Board of Directors.
During the reporting year the Audit Committee held five half day meetings. During Audit Committee meetings, direct discussions took place with representatives of the Group Auditors and Corporate Audit. Representatives from the Group Auditors were pres-ent at three of these meetings and the Corporate Auditor (being a permanent participant at the Audit Committee Meeting since August 2010) attended all of the above-mentioned meetings. At these meetings, the Executive Board was regularly represented by the CEO, the CFO and the Corporate Secretary.
The Compensation and Nomination Committee consists of the following members of the Board of Directors: Rudolf W. Hug (Chairman), Chris E. Muntwyler and Knud Elmholdt Stubkjær. The members of the Committee are elected at each General Meet-ing of Shareholders with a one-year period of office. It monitors the selection process for members of the Board of Directors, the Executive Board and other selected senior management positions, determines the overall remuneration and terms of employ-ment for members of the Board of Directors and the Executive Board as well as remuneration bands for highly compensated employees. Regarding the compensation of the members of the Executive Board, the Committee makes a decision subject to the final approval of the Board of Directors; applications for the compensation of the Board members are decided by the Committee and shared with the Board of Directors. Each year the Committee decides on the bonus compensation for the CEO and the other members of the Executive Board for the previous year, based on recommendations of the Chairman (for the CEO) and the CEO (for other Executive Board members). Furthermore, the Committee regularly reviews the Board Stock Award Plan, the Executive Board Mid-Term and Long-Term Incentive Plans and the Group’s Management Incentive Plan and submits proposals for final approval to the Board of Directors. Moreover, it approves concepts and policies for the Group’s management performance assessment, succession planning and expat programs.
During the reporting year, the Compensation and Nomination Committee held four meetings of approximately two hours each. The Executive Board was regularly represented at these meetings by the CEO, the Chief HR Officer and the Corporate Secretary.
The Ethics and Compliance Committee consists of the following members of the Board of Directors: Rudolf W. Hug (Chairman), Roger Schmid and Beat Walti. It oversees the company’s Business Ethics Program. It has also monitored Panalpina’s adherence to the Administrative Agreement with the US Department of the Air Force which has expired in the reporting year. It further mon-itors the handling of major legal matters, including the pending antitrust investigations and related proceedings as well as the development of the company’s compliance policies and procedures.
During the reporting year, the Committee has held three meetings. The Executive Board was represented at these meetings by the CEO and the Corporate Secretary.
The Committees generally meet prior to Board of Directors meetings. The chairmen of the committees inform and update the Board of Directors on the topics discussed and decisions made during such meetings. They submit proposals for approval related to decisions that fall within the scope of the Board of Directors.
Panalpina Annual Report 2014
Corporate Governance 48

Objectives, organization, duties and the cooperation with the Board of Directors are defined in the Terms of Reference of the respective committees which are reviewed and adopted by the Board of Directors.
The overall responsibility of the Board of Directors is not affected by these committees.
3.4.3 Working methods of the Board of Directors and its committees During the reporting year, the Board of Directors held four full-day meetings. The Executive Board was represented by all its members at these meetings. In urgent cases, telephone conferences are organized in order for decisions to be taken.
At every meeting, the Executive Board updates the Board of Directors on business and key financial developments and main regional and segment developments. On a quarterly basis, detailed consolidated financial statements on the Group, regional and business segment levels are reported to the Board of Directors in accordance with International Financial Reporting Standards (IFRS). The Board of Directors is furnished in time with an agenda, detailed meeting documentation related to topics on the agenda and minutes.
3.5 DEFINITION OF AREAS OF RESPONSIBILITY In line with the law and the Articles, the Board of Directors has transferred the responsibility to develop and implement the Group strategy, as well as the responsibility to supervise business and financial development of the Group’s subsidiaries, to the Execu-tive Board.
The Organizational Regulations adopted by the Board of Directors govern the cooperation between the Board of Directors, the Chairman and the Executive Board. They contain a detailed catalogue of duties and competencies which determine the financial thresholds within which the Board of Directors and the Executive Board can efficiently execute their daily business. The Organi-zational Regulations which also contain the Group’s Approval Matrix with the related decision-making powers of the various bodies on Corporate and Regional level are accessible on Panalpina’s website.
The main responsibilities of the Board of Directors on Group level include the determination of the business strategy on the basis of applications filed by the Executive Board, the approval of major Group policies and organizational structures, including topics related to Corporate Governance and Compliance, the approval of the annual operational and investment budgets, the approval of any extraordinary additional investment applications as well as financial planning. Further responsibilities include decisions regarding mergers and acquisitions and major management staff and remuneration decisions following recommendations and preparatory work of its Compensation and Nomination Committee.
3.6 INFORMATION AND CONTROL INSTRUMENTS VIS-À-VIS THE SENIOR MANAGEMENT The Executive Board informs the Board of Directors in a written format on a monthly basis on the current course of business, cov-ering the Group’s consolidated monthly and year-to-date income statements, including deviation to budget and preceding year, regional- and product income statements, functional costs / FTE development, financial position, statements on cash flows and net working capital development.
A detailed update is provided at each Board of Directors meeting.
On a quarterly basis, the reporting covers the condensed consolidated interim financial statements including key developments, income statement, statement of comprehensive income, statement of financial position, statement of changes in equity, state-ment of cash flows and explanatory notes, IR presentations and media release.
Further information regarding personnel and organizational changes, extraordinary events and the activities of analysts, inves-tors and competitors form part of the regular reporting. Moreover, the Board of Directors annually reviews and approves the Group’s targets for the individual regions and business segments and adopts the respective report of the Executive Board.
During the reporting year, the Chairman of the Board of Directors attended two Executive Board meetings and regularly receives the minutes of the Executive Board meetings. The members of the Executive Board regularly join meetings of the Board of Direc-tors. In addition, individual senior executives attended specific topic discussions pertaining to their particular field of expertise. Furthermore, specific meetings of the Board of Directors are dedicated to a detailed review of major markets, business segments and the Group’s strategy according to predefined schedule. For further details please refer to sections 3.4.2 and 3.4.3.
Panalpina Annual Report 2014
Corporate Governance 49

The Audit Committee of the Board of Directors monitors and assesses the activities of the Corporate Auditor as well as his coop-eration with the Group Auditors.
The Audit Committee receives the Corporate Auditor’s half-year reports and also adopts the comprehensive annual risk map of the Executive Board. The Audit Committee approves the proposed risk control and risk mitigation measures as well as the annual planning and scope of the internal audit, which is also based on the Risk Map. For further details please refer to section 3.4.2.
4 EXECUTIVE BOARD 4.1 MEMBERS OF THE EXECUTIVE BOARD
On the closing date, the Executive Board was composed of five persons.
Peter Ulber, President and Chief Executive Officer since June 2013, German citizen. Born in 1960.
Following his studies at the International School of Logistics in Hamburg, Peter Ulber held various management positions from 1985 to 2011 at Kuehne + Nagel in Europe, as well as North and South America. During his tenure, Peter Ulber was responsible for both ocean freight and airfreight, had overall responsibility for the global sales organization and joined the management board in 2008. As a result of a series of strategic acquisitions by Kuehne + Nagel, Peter Ulber was also heavily involved in the company’s expansion in Europe, Asia and America.
At the end of 2011 he co-founded Charleston Enterprise Group LLC, a strategic management consultancy that offers consulting, management and investment strategies for international logistics companies as well as private equity firms with a primary focus on mergers and acquisitions as well as growth strategies.
Robert Erni, Chief Financial Officer since January 2013, Swiss citizen. Born in 1966.
Robert Erni has worked in various finance positions at Kuehne + Nagel for more than 19 years. Prior to the head office functions such as Head of Corporate Controlling (2009 to 2012) and Head of Accounting and Treasury (2004 to 2009), he gained profound finance and managerial expertise through several senior postings in Asia Pacific (Hong Kong and India), in South America (Argen-tina) and in the USA. Robert Erni holds a degree in Economics and Business Administration of the University of Economics and Business Administration, Lucerne (Switzerland).
Christoph Hess, Chief Legal Officer and Corporate Secretary, Swiss citizen. Born in 1955. Member of the Executive Board since October 2006. Responsible for Corporate Legal Services and Insurance.
Christoph Hess joined the Group’s head office in 1994 as Secretary of the Board of Directors and the Executive Board. In this capacity he also manages both the Group’s Legal and Insurance departments. He also managed Corporate Communications until August 2008. Christoph Hess holds a degree in law from the University of Basel and has been admitted to the bar in Switzerland.
Karl Weyeneth, Chief Commercial Officer, Swiss citizen. Born in 1964. Member of the Executive Board since April 2008, Chief Operating Officer until December 2013. Responsible for Marketing and Communication, Sales, QHSE, Security and Operations Transformation.
Karl Weyeneth joined the Group in 2007 as Regional CEO for North America, where he was responsible for the development and results of the subsidiaries in USA and Canada. He is a professional with profound leadership and management experience in logistics, including freight management, 3PL and contract logistics. Before joining Panalpina, he was President and CEO Ameri-cas of Hellmann Worldwide Logistics, Inc. (USA) and prior to this he was Executive Vice President and CFO of Danzas Management Latin America (USA), where he attained profound experience in all finance matters. He holds a Bachelor in Econom-ics and Business Administration from the University of Berne, Switzerland.
Alastair Robertson, Chief Human Resources Officer, British citizen. Born in 1960. Member of the Executive Board since April 2008. Responsible for Human Resources. He has left the company in June 2014.
Panalpina Annual Report 2014
Corporate Governance 50

Alastair Robertson joined the Group in 2007 as Head of Global Human Resources. Before joining Panalpina, he had been a Vice President at Tetra Pak since 1996, where he held various positions in the field of Human Resources: between 1999 and 2001 as Vice President Human Resources Americas and from 2002 to 2004 as Vice President Human Resources Europe and Africa. From 1992 to 1996, he worked for W.H. Smith in the field of Personnel, Development and Training and between 1989 and 1992 he was with Graham Builders Merchants as Manager Human Resources Management, Training and Development. He previously served in the military, where he attained the rank of acting major and served in numerous countries. Alastair Robertson is a Fellow of the Chartered Institute of Personnel and Development, holds an MBA in Strategy and Marketing from the University of Huddersfield, Bradford (United Kingdom). He also attended the Royal School of Military Engineering and the Royal Military Academy in the United Kingdom.
Karsten Breum, Chief Human Resources Officer, Danish citizen. Born in 1972. He has joined the company in November 2014. Responsible for Human Resources.
Karsten Breum, a Danish citizen, joined Panalpina’s Executive Board in 2014 as the company’s Chief Human Resources Officer.After receiving a Masters in economics and business administration from Aarhus School of Business, Denmark in 1998, Karsten Breum spent a decade working in various human resources positions at A.P. Møller-Mærsk in Copenhagen, Antwerp and Singa-pore. In 2008, Breum was appointed Vice President Global Head of Human Resources for Damco; during his time at the company he was a member of the Global Executive Leadership Team and, in addition, completed his MBA at the University of Chicago’s Booth School of Business. He was appointed Vice President Regional CEO of Damco in 2013, responsible and accountable for operational, as well as commercial activities in Asia Pacific.
Karsten Breum brings a wealth of expertise and knowledge to his role at Panalpina, gained from spending more than 14 years working internationally in all areas of human resources.
Roderick Angwin, Chief Information Officer, British Citizen. Born in 1959. Member of the Executive Board as of January 1, 2014. Responsible for Information Technology
Roderick Angwin joined Panalpina in 2012 as Chief Information Officer. He has extensive experience gained across a number of sectors and a broad range of international companies. His previous roles include five years as Group CIO for Wolseley plc, the international building materials distributor, and as IT Director on the Board of B&Q, part of the Kingfisher retail group. Other roles include ten years in various positions with Mars Inc., and as Group IT Director for Meyer plc, subsequently part of St. Gobain. Roderick Angwin holds a degree in Marine and Freshwater Biology from Stirling University Scotland.
4.2 OTHER ACTIVITIES AND VESTED INTERESTSPeter Ulber: Managing partner and co-founder of Charleston Enterprise Group LLC, Charleston, USA.
4.3 MANAGEMENT CONTRACTS No management contracts exist with any third party outside the Group.
5 COMPENSATION, SHAREHOLDINGS AND LOANS 5.1 CONTENT AND METHOD OF DETERMINING THE COMPENSATION AND THE
SHARE-OWNERSHIP PROGRAMS Please refer to the Compensation Report on page 54 – 69.
6 SHAREHOLDERS’ PARTICIPATION 6.1 VOTING RIGHTS AND REPRESENTATION RESTRICTIONS
Each share carries one vote at the General Meeting of Shareholders. The Articles state that when exercising voting rights, no shareholder may directly or indirectly represent more than 5 percent of the total shares issued by the company for own and represented shares.
The Articles provide for group clauses.
Panalpina Annual Report 2014
Corporate Governance 51

The voting right restrictions are not applicable to representatives of the independent proxy holder of voting rights (unabhängiger Stimmrechtsvertreter).
The voting restrictions do not apply to the shares held by the Ernst Göhner Foundation, because it held PWT shares prior to the introduction of the voting restrictions (grandfathering).
Any abolition or change of the provisions relating to the restrictions on voting rights requires a resolution of the General Meeting of Shareholders on which at least two-thirds of the voting shares represented agree.
A written proxy entitles a shareholder to be represented at the General Meeting of Shareholders by his or her legal representa-tive, or by another shareholder with the right to vote, or by the independent proxy holder of voting rights (unabhängiger Stimm- rechtsvertreter).
6.2 STATUTORY QUORUMS In principle, the legal rules on quorums apply. Supplementary to the quorums legally listed, a two-thirds majority of the shares represented at the General Meeting of Shareholders is required for the following resolutions:
– any abolition or change of the provisions relating to transfer restrictions; – any abolition or change of the provisions relating to the restriction of voting rights; – the transformation of registered shares into bearer shares; – the dissolution of the company by way of liquidation; – the removal of two or more members of the Board of Directors; – the abolition of the respective provision in the Articles as well as the repeal or relief of the stated quorum. A resolution to increase the quorum as set forth in the Articles must be based on the consent of the increased quorum.
6.3 CONVOCATION OF THE GENERAL MEETING OF SHAREHOLDERS There are no provisions deviating from the law.
6.4 AGENDA Shareholders who individually or together with other shareholders represent shares in the nominal value of CHF 1 million may request that an item be placed on the agenda. Such a request must be made in writing to PWT at least 60 days prior to the Gen-eral Meeting of Shareholders.
6.5 INSCRIPTIONS INTO THE SHARE REGISTERRegistered shares can only be represented by shareholders (or nominees) who have been entered into the PWT share register. Shareholders (or registered nominees) who cannot personally attend the General Meeting of Shareholders are entitled to nomi-nate a representative according to the provisions in the Articles, who represents them by written proxy.
For the purpose of determining voting rights, the share register is closed for registration from the date upon which the General Meeting of Shareholders has been called (date of invitation) until the day after the General Meeting of Shareholders has taken place.
7 CHANGES OF CONTROL AND DEFENSE MEASURES 7.1 DUTY TO MAKE AN OFFER
No opting-out or opting-up provisions exist.
7.2 CLAUSES ON CHANGES OF CONTROL Neither the contracts of the members of the Board of Directors nor of the Executive Board have a change-of-control clause.
Panalpina Annual Report 2014
Corporate Governance 52

8 AUDITORS 8.1 DURATION OF THE MANDATE AND TERM OF OFFICE OF THE LEAD AUDITOR
The mandate to act as statutory and Group Auditors is assumed by KPMG, Zurich on a yearly basis. Marc Ziegler replaced his pre-decessor Regula Wallimann as auditor in charge starting with the business year 2014.
8.2 AUDITING FEES According to financial accounting, invoices for auditing fees for the financial year amounted to CHF 2.3 million.
8.3 ADDITIONAL FEES The auditors KPMG were compensated with an additional amount of CHF 1.2 million for further services rendered in the financial year.
8.4 INFORMATIONAL INSTRUMENTS PERTAINING TO THE EXTERNAL AUDIT The Group Auditors are supervised and controlled by the Audit Committee. The Group Auditors report to the Audit Committee and periodically the lead auditor participates in the meetings. During these meetings, the Group Auditors present a detailed audit plan for the current year including risk-based audit priorities, the audit scope, proposals regarding audit fees, organization and timing as well as updates and status of the results of the Internal Control System. In subsequent meetings they present interim audit findings with respective statements and recommendations later followed by a detailed audit report. Presentations also con-tain references to upcoming changes in legislation and IFRS. The main criteria for the selection of Group Auditors include independence, network capabilities, industry and IT experience of the audit team, a risk-based audit approach, a central process management as well as the integration of Corporate Audit and risk management functions. The Audit Committee annually assesses the performance of the Group Auditors and determines the audit fees (refer to section 3.5).
9 INFORMATION POLICY Panalpina regularly updates its website at www.panalpina.com, informing the public of any major events, organizational changes and (quarterly) financial results. Press releases are accessible to all visitors to the website; alternatively, subscriptions can be made so that the latest press releases are automatically forwarded via e-mail. Furthermore, all publications such as the Annual Report (including the Corporate Governance and Compensation Report), customer magazine and sales brochures are available online. The dates of the General Meeting of Shareholders as well as dates of publication of the quarterly financial results are pub-lished in the Annual Report and appear in the Financial Calendar on the website (under Investor Relations). The minutes of shareholder meetings are available online.
Panalpina Annual Report 2014
Corporate Governance 53

COMPENSATIONREPORT
54
Panalpina Annual Report 2014

COMPENSATION REPORT
The Compensation Report describes the remuneration philosophy and principles, as well as the governance framework related to the compensation of the Board of Direc-tors and the Executive Board of Panalpina. The report also provides details around the different compensation programs and the remuneration related to the 2014 perfor-mance year.The Compensation Report is based on sections 3.5 and 5 of the annex to the Corporate Governance Directive issued by SIX Swiss Exchange and Art. 13 to 16 of the Ordinance against Excessive Compensation in Listed Stock Companies (OaEC).
COMPENSATION GOVERNANCE
Compensation and Nomination CommitteeThe Compensation and Nomination Committee (CNC) consists of two or more members of the Board of Directors who are independent, insofar as they do not hold any executive position, nor act as consultant for the company and its subsidiaries. At the Annual General Meeting of Shareholders of May 9, 2014 the following members of the Board of Directors were reelected as members of the Compen-sation and Nomination Committee for a one-year term: Rudolf W. Hug, Chris E. Muntwyler and Knud Elmholdt Stubkjær. Rudolf W. Hug continued to act as the Chairman of the CNC.
With the exception of the election of the Chairman of the CNC by the Board of Directors, the CNC is self-constituting. It designates the secretary, who need not be a member of the CNC. If the CNC is not fully constituted, the Board of Directors appoints the missing mem-bers for the remaining term in office.
The CNC’s main duties comprise the development and regular review of compensation policy and principles and performance criteria of the Panalpina Group and the regular review of their implementation including the presentation of motions and recommendations to the Board of Directors. Further they cover the preparation of all relevant decisions of the Board of Directors in relation to the compen-sation of the members of the Board of Directors and the Executive Board and the presentation of respective motions and recommendations to the Board of Directors.
In particular the CNC monitors the selection process for members of the Board of Directors, the Executive Board and other selected senior management positions. The Committee also determines the overall remuneration and terms of employment for members of the Board of Directors and the Executive Board as well as remuneration bands for highly compensated employees, and submits the relevant proposals to the Board of Directors for final approval. Furthermore, the Committee regularly reviews the compensation policy, includ-ing the incentive plans (such as the Board of Directors Restricted Stock Award Plan, the Executive Board Mid-Term and Long-Term Incentive Plans or the Performance Share Unit Plan and the Group’s Management Incentive Plan) and submits proposals for final approval to the Board of Directors.
55
Panalpina Annual Report 2014
Compensation Report
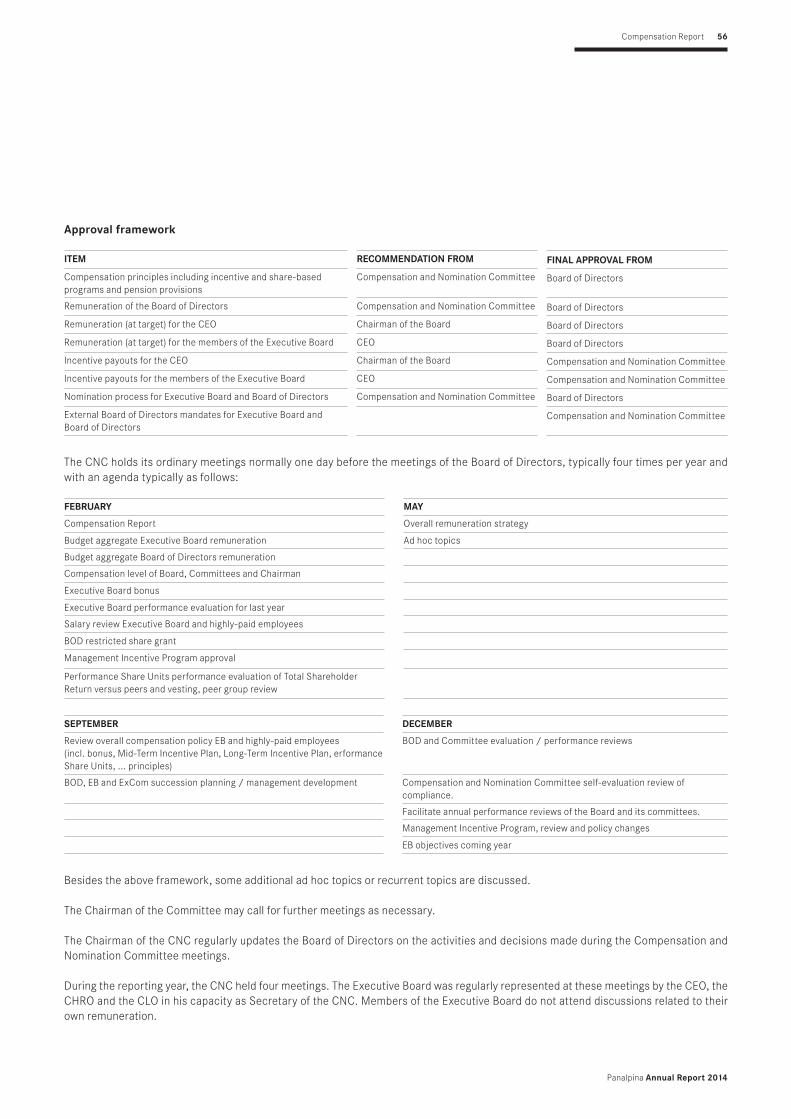
Approval framework
ITEM RECOMMENDATION FROM FINAL APPROVAL FROM
Compensation principles including incentive and share-based programs and pension provisions
Compensation and Nomination Committee Board of Directors
Remuneration of the Board of Directors Compensation and Nomination Committee Board of Directors
Remuneration (at target) for the CEO Chairman of the Board Board of Directors
Remuneration (at target) for the members of the Executive Board CEO Board of Directors
Incentive payouts for the CEO Chairman of the Board Compensation and Nomination Committee
Incentive payouts for the members of the Executive Board CEO Compensation and Nomination Committee
Nomination process for Executive Board and Board of Directors Compensation and Nomination Committee Board of Directors
External Board of Directors mandates for Executive Board and Board of Directors
Compensation and Nomination Committee
The CNC holds its ordinary meetings normally one day before the meetings of the Board of Directors, typically four times per year and with an agenda typically as follows:
FEBRUARY MAY
Compensation Report Overall remuneration strategy
Budget aggregate Executive Board remuneration Ad hoc topics
Budget aggregate Board of Directors remuneration
Compensation level of Board, Committees and Chairman
Executive Board bonus
Executive Board performance evaluation for last year
Salary review Executive Board and highly-paid employees
BOD restricted share grant
Management Incentive Program approval
Performance Share Units performance evaluation of Total Shareholder Return versus peers and vesting, peer group review
SEPTEMBER DECEMBER
Review overall compensation policy EB and highly-paid employees (incl. bonus, Mid-Term Incentive Plan, Long-Term Incentive Plan, erformance Share Units, ... principles)
BOD and Committee evaluation / performance reviews
BOD, EB and ExCom succession planning / management development Compensation and Nomination Committee self-evaluation review of compliance.
Facilitate annual performance reviews of the Board and its committees.
Management Incentive Program, review and policy changes
EB objectives coming year
Besides the above framework, some additional ad hoc topics or recurrent topics are discussed.
The Chairman of the Committee may call for further meetings as necessary.
The Chairman of the CNC regularly updates the Board of Directors on the activities and decisions made during the Compensation and Nomination Committee meetings.
During the reporting year, the CNC held four meetings. The Executive Board was regularly represented at these meetings by the CEO, the CHRO and the CLO in his capacity as Secretary of the CNC. Members of the Executive Board do not attend discussions related to their own remuneration.
56
Panalpina Annual Report 2014
Compensation Report

The Annual Shareholders’ Meeting votes separately each year on the approval of motions from the Board of Directors concerning the aggregate amount of compensation for the Board of Directors until the following ordinary Shareholder’s Meeting; and for the Executive Board for the following financial year. The Board of Directors may subdivide the relevant maximum aggregate amount into an amount for fixed compensation and an amount for variable compensation and present the corresponding motions to the Annual Shareholders’ Meeting separately for approval. If the Shareholders’ Meeting refuses to grant its approval, the Board of Directors may present a new motion or call an extraordinary Shareholders’ Meeting. According to the Company’s Articles of Association an additional amount is available to the maximum aggregate amount for the compensation of Executive Board members who are appointed after the Sharehol-ders’ Meeting has approved the relevant maximum aggregate amount. Such additional amount is 40 percent for the CEO and 25 percent for each new member of the Executive Board respectively.
Method of determination of compensationThe remuneration of the Executive Board members is reviewed yearly in order to ensure market competitiveness, internal fairness and pay-for-performance. The remuneration of the Executive Board members is benchmarked using the Switzerland Executive Compensa- tion Survey published by Mercer. This survey includes compensation data of multinational companies in the general industry sector in Switzerland. No specific peer group is created, however Panalpina’s role is evaluated using the Mercer job evaluation methodology, in order to compare with the relevant benchmark, e.g. roles of comparable size, scope and level of responsibilities. The median of the benchmark data is considered relevant for measuring compensation competitiveness.
On the basis of the external benchmark information, combined with internal peer comparisons, the Compensation and Nomination Com-mittee defines the level of remuneration (at target) and the mix between fixed and variable compensation (at target) for the CEO and for the other members of the Executive Board, and submits its proposal to the Board of Directors for final approval.
In addition to fixed compensation, members of the Executive Board may be paid a variable compensation.
Variable compensation may contain short- to long-term compensation elements and may be made dependent upon the achievement of one or more performance criteria. Performance criteria may include personal targets or targets relating to the Panalpina Group, the market or benchmarks with peer groups, taking account of the function and level of responsibility of the relevant member of the Board of Directors or the Executive Board. The CNC sets the applicable performance criteria and their weighting and ascertains whether they have been achieved.
If compensation is provided in the form of shares, the Board of Directors or, if so delegated, the CNC determines the relevant conditions and prerequisites in one or more plans / regulations, including the date of allocation, fair valuation, holding, vesting and exercise periods (including acceleration, curtailment or annulment thereof in the event of predefined occurrences such as a change of control or the ter-mination of an employment relationship) and any clawback mechanisms.
The compensation effectively paid out for a given business year depends on the actual company and individual performance. The perfor-mance is assessed through the annual performance management process, where individual objectives are determined and agreed upon at the beginning of the reporting year, and finally assessed by February of the following year. The performance assessment includes the achievement of individual objectives as well as an evaluation of the individual’s behaviors, which are combined into an overall perfor-mance rating. The performance management process, including the determination of individual objectives at the beginning of the year and the performance assessment at year-end, is conducted by the Chairman of the Board of Directors for the CEO and by the CEO for the other members of the Executive Board. Individual objectives and performance assessment for the CEO and the other members of the Executive Board are subject to the approval of the Compensation and Nomination Committee.
COMPENSATION AND BENEFITS PRINCIPLES AND POLICY
In the volatile economy and the challenging business context in which Panalpina operates, it is critical to recruit, retain and develop a dedicated and capable team of employees with excellent skills, integrity and high ethical standards.
The remuneration model at Panalpina supports this fundamental objective. It also ensures that employees are rewarded for achieving results in line with the business objectives and are encouraged to demonstrate behaviors that are consistent with Panalpina’s values.
57
Panalpina Annual Report 2014
Compensation Report

Remuneration principles - To provide a competitive remuneration package compared to the relevant talent market - To create alignment to shareholders’ interests, especially in terms of long-term value creation for the company and its stakeholders - To drive a performance-oriented culture aligned with the achievement of the company’s strategic objectives - To encourage behaviors that are consistent with Panalpina’s values and high ethical standards - To be fair and transparent, and applied consistently throughout the company
The remuneration programs are designed to seek an appropriate balance between fixed and variable pay, as well as between short-term, mid-term and long-term rewards. They also provide a fair link between pay and performance from an operational perspective, from a shareholders’ value creation perspective and from an external and relative peer performance perspective.
In order to achieve the above, the remuneration system has been reviewed and the first changes to the compensation programs were implemented as of January 1, 2014, through the introduction of a Performance Share Unit plan, replacing the previous Long-Term Incen-tive program and further enhancements are being considered for future years. The nature of those changes is described further below.
PRINCIPLES OF REMUNERATION OF THE BOARD OF DIRECTORS
The members of the Board of Directors receive a fixed annual compensation, which consists of a Board membership fee of CHF 150,000 - which already includes Committee membership - , an attendance fee of CHF 500 per meeting and a potential grant of free shares of the company in the amount of CHF 50,000 based on a decision within the discretion of the Compensation and Nomination Committee eva-luating the Group’s annual overall situation.
The Chairman of the Board of Directors receives a Board chairmanship fee of CHF 450,000, an attendance fee of CHF 500 per meeting and a grant of shares of CHF 50,000 under the same conditions as the other Board members as defined above.
The Board membership / chairmanship fee and the attendance fee are paid out in cash in June and December for the compensation period from AGM to AGM. The shares are granted for the previous business year based on the share’s closing price on the SIX Swiss Exchange on April 30. The shares are blocked from trading during a restriction period of one year, except in case of change of control or liquidation, death or disability, where the shares are unblocked immediately. The shares remain blocked in all other instances.
The members of the Board of Directors do not participate in Panalpina’s employee benefit or incentive plans, except for social security where applicable.
Remuneration model for the Board of Directors
IN CHF CHAIRMAN BOARD MEMBER
Annual board membership fee (cash) 450,000 150,000
Annual grant of shares 50,000 50,000
Meeting fee (per meeting) 500 500
PRINCIPLES OF REMUNERATION FOR THE EXECUTIVE BOARD
The remuneration of the members of the Executive Board consists of the following elements: - Fixed compensation: annual base salary - Variable compensation: annual bonus, mid-term incentive and long-term incentive (through Performance Share Units) - Benefits: pension, insurances and benefits in kind
58
Panalpina Annual Report 2014
Compensation Report

Remuneration model for the Executive Board
PURPOSE INSTRUMENT
Fixed compensationAnnual base salary
Recognize market value of role and individu-al skills, experience and performance
Monthly cash payments
Variable compensationAnnual bonus
Drive and reward short-term performance over 1 year
Annual cash incentive
Mid-term incentive (MTIP)Align short-term and long-term rewards through co-investment
Compulsory deferral of 40 % of annual bonus into blocked shares, with free mat-ching shares (1:1) after a one-year period
Long-term incentive (LTIP)Drive and reward long-term performance (TSR) over 3 years versus peer group
Performance Share Unit Plan
BenefitsPension benefits
Provide competitive retirement benefits and reward seniority and loyalty
Pension fund and insurances
PerquisitesProvide competitive and cost-effective be-nefits by leveraging company’s size
Perquisites and benefits in kind
Every year, the remuneration of the Executive Board members is benchmarked against the market, with the objective to provide a level of remuneration that is approximately in line with the median of the relevant benchmark and to allow for above-median compensation for sustained superior performance.
Annual base salary The annual base salary takes into consideration the scope and responsibilities of the role, its market value and the skills, experience and performance of the individual in the role. The compensation policy is to pay annual base salaries that are in line with the median of the benchmark for a comparable role. The annual base salaries of the members of the Executive Board are reviewed every year, taking into consideration the company’s financial situation, the economic environment, the benchmark information and the individual performance.
Annual bonusThe annual bonus rewards company and individual performance over a period of one year. The company performance weight has been increased in 2014 from 60 to 70 percent of the annual bonus. The 70 percent is measured by 3 components, Group Earnings Before Inte-rest and Tax (EBIT) for 90 percent, the Days of Sales Outstanding (DSO) for 5 percent, and the Days of Payable Outstanding (DPO) for another 5 percent. For each of those objectives, a minimum and a maximum level of performance are defined: the threshold, below which no bonus is paid out and the ceiling, above which the bonus payout is capped at 150 percent. For the EBIT target, the threshold achieve-ment level was increased in 2014 from 50 to 60 percent and the achievement ceiling to obtain maximum payout was decreased from 150 to 140 percent. For the DSO and DPO objectives, the threshold is set at 90 percent achievement and the ceiling at 110 percent achieve-ment. The payout curve is linear between the threshold and the target, and between the target and the ceiling.
The individual performance weights for 30 percent of the annual bonus and is assessed through the formal performance management process, whereas individual objectives are determined and agreed upon at the beginning of the reporting year, and individual perfor-mance is assessed after year-end. For 2014, the individual objectives include Key Performance Indicators (KPIs) related to the operational business. The performance assessment includes the achievement of the individual objectives as well as an evaluation of the individual’s behaviors that are consistent with Panalpina’s values, which are combined into an overall performance rating, the Performance Evalua-tion Assessment Review (PEAR) rating. The PEAR rating translates into a payout percentage for the individual portion of the annual incentive, which can range from 0 percent to 120 percent of target.
Overview of performance objectives, their weighting and levels of performance
WEIGHT THRESHOLD PERFORMANCE
MAX PERFORMANCE
MAX PAYOUT
Group objectives Group EBIT 63 % 60 % 140 % 150 %
Days of sales outstanding 3.5 % 90 % 110 % 150 %
Days of payables outstanding 3.5 % 90 % 110 % 150 %
Individual objectives Individual key performance indicators 30 % rating rating 120 %
59
Panalpina Annual Report 2014
Compensation Report

The annual bonus target is expressed as a percentage of annual base salary and amounts to 100 percent for the CEO, and between 67 percent and 80 percent for the other members of the Executive Board depending on their function. The actual bonus payout may range from 0 percent to 141 percent for the members of the Executive Board, depending on the effective performance achievement. The annual bonus payout is subject to the approval of the Compensation and Nomination Committee.
Mid-term incentiveThe Mid-Term Incentive Plan (MTIP) was created in 2009 in order to encourage contributions to the long-term success and prosperity of the company through co-investment into the company. In addition, the MTIP creates a strong alignment with shareholders interest and facilitates the retention of the executives. Under the MTIP, a portion of the annual bonus is converted into Panalpina (PWTN) shares with a one-year restriction period. At the end of the restriction period and subject to continuous employment with the company, the deferred bonus shares are matched with additional free shares. The free matching shares are subject to a blockage period of one year.
The applicable share price for determining the number of deferred bonus shares related to the bonus paid in 2014 (performance year 2013) was defined for a three-year cycle (from 2012 to 2014) as the PWTN closing price on April 30, 2012, which amounted to CHF 88.50.
The applicable share price for determining the number of deferred bonus shares related to the bonus paid in 2015 (performance year 2014) will be defined for a new three-year cycle (from 2015 to 2017) as the PWTN closing price on April 30, 2015.
The intention of fixing the purchase price of the shares for a three-year cycle was to reward the participants for a positive share price development, while a negative share price evolution reduces the value of the award.
For the members of the Executive Board, 60 percent of the annual bonus is payable in cash and 40 percent is converted into PWTN sha-res that are matched with one free matching share each at the end of the one-year restriction period. The free matching shares are subject to a blockage period of one year. In case of voluntary resignation or termination for cause, the free matching shares will forfeit. The vesting may be accelerated in case of termination without cause, retirement, death and disability. In case of change of control or liquidation, the Compensation and Nomination Committee reserves the right to determine any appropriate measure with regard to the unvested free matching shares.
Timeline of the MTIP
ANNUAL BONUS UNBLOCK/VESTING CONVERTED PWTN SHARES
UNBLOCK/VESTING MATCHING PWTN FREE SHARES IN FREE SHARES
GRANT ANNUAL BONUS 40 % CONVERTED IN PWTN SHARES (MTIP)
GRANT MATCHING PWTN FREE SHARES (MTIP)
ANNUAL BONUS 60 % IN CASH
ANNUAL BASE SALARY
2014 2015 2016 2017
60
Panalpina Annual Report 2014
Compensation Report

Long-term incentive in form of Performance Share UnitsAs of January 1, 2014, the members of the Executive Board participate in a new Long-Term Incentive Plan in form of Performance Share Units (PSU).
The purpose of the PSU plan is to motivate executives to contribute to the long term success and prosperity of the company and to encourage them to create shareholder value and at the same time to facilitate the retention of the executives.
The PSUs will be delivered through an annual rolling grant with a cliff vesting after 3 years, dependent on the achievement of the cumu-lative Total Shareholder Return (TSR) which will be measured against a peer group of companies in our industry.
The performance period related to the 2014 PSU grant, started on January 1, 2014, and ends on December 31, 2016. The cumulative Total Shareholder Return over the full three-year performance period will be measured.
The relative position versus the external peer group serves as basis for the vesting determination. Vesting of the PSUs in case the Total Shareholder Return performance ranks below Q1 (25th percentile) versus the external peer group is 0 percent. Between Q1 and Q3 (75th percentile), a linear vesting from 25 percent up to the maximum of 100 percent vesting is applied.
The external reference (peer group) consists of a balanced selection of companies within our industry taking into consideration, amongst other factors, market capitalization, turnover and geographic distribution.
120%
100%
80%
60%
40%
20%
0%
100% =Q475% =Q325% =Q10% 50% =MEDIAN
PSU Vesting Curve
Vesting in % of Target Payout
TSR vs. External Reference
61
Panalpina Annual Report 2014
Compensation Report

PEER GROUP FOR TSR MEASUREMENT: NAME OF COMPANY
Panalpina World Transport (Holding) AG
United Parcel Service, Inc. Class B
Deutsche Post AG
FedEx Corporation
Kuehne & Nagel International AG
C.H. Robinson Worldwide, Inc.
Expeditors International of Washington, Inc.
Nippon Yusen Kabushiki Kaisha
Nippon Express Co., Ltd.
DSV A / S
Toll Holdings Limited
Agility Public Warehousing Co. K.S.C.
Con-way Inc.
Kawasaki Kisen Kaisha, Ltd.
UTi Worldwide Inc.
Hitachi Transport System,Ltd.
Hub Group, Inc. Class A
Kintetsu World Express, Inc.
Forward Air Corporation
Sinotrans Air Transportation Development Co. Ltd. Class A
Aramex PJSC
Norbert Dentressangle SA
SITC International Holdings Co., Ltd.
Hanjin Shipping Co., Ltd
CWT Limited
In the circumstances of retirement, disability and death, prorated vesting applies at the end of the plan performance period. The Com-pensation and Nomination Committee has the right to apply discretion for special circumstances.
Overview of compensation schedule for the CEO and Executive Board members
LONG-TERM INCENTIVE(PSU GRANT)
PSU performance period January 1, 2014 – December 31, 2016
PSU 2014 VESTING
ANNUAL BONUS/MTIP UNBLOCK/VESTING CONVERTED PWTN SHARES
UNBLOCK/VESTING MATCHING PWTN FREE SHARES IN FREE SHARES
GRANT ANNUAL BONUS 40 % CONVERTED IN PWTN SHARES (MTIP)
GRANT MATCHING PWTN FREE SHARES (MTIP)
ANNUAL BONUS 60 % IN CASH
ANNUAL BASE SALARY
2014 2015 2017 2018
62
Panalpina Annual Report 2014
Compensation Report
All previous Long-Term Incentive Plans never paid out in the past and have been closed as per December 31, 2013, but some vested rights were frozen at this date and will still need to be paid in the future. The carrying aggregate amount for these frozen vested rights for the Executive Board members (2 current members) amounts to CHF 565,000, which is subject to a potential payout beginning 2018 and to the condition that the respective employee is still employed with Panalpina.
BenefitsExecutive Board members participate in the regular employee pension plans of the country where they have their employment contract. For Executive Board members employed in Switzerland, the company pension fund covers their annual base salary and the actual bonus up to an overall amount of CHF 846,000. Pension fund contributions are equally split between employer and employee for insured income up to CHF 400,000. In the supplemental scheme covering income between CHF 400,000 and CHF 846,000 (current maximum under Swiss law), contributions are paid by the company. The benefits provided under the pension fund exceed the legal requirements of the Swiss Federal Law on Occupational Retirement, Survivors and Disability Pension Plans (BVG) and are in line with typical market practice of other multinational companies in Switzerland.
Certain Executive Board members participate in a non-Swiss pension fund scheme whose benefits and contributions are equivalent to these of the Swiss pension plan.
Members of the Executive Board do not receive any executive benefits. They are entitled to a company car allowance and a general expense allowance, in accordance to the expense rules applicable to all employees at management levels in Panalpina Switzerland.
Employment contractsEmployment agreements with Executive Board members stipulate a notice period of twelve months. They do not contain any “golden parachutes” in case of a change of control, nor any severance provisions in case of termination of employment.
Change in the compensation model for the Executive Board for 2015The compensation model for the members of the Executive Board is under constant review and assessment through the CNC, but no fun-damental changes are planned for 2015, besides a planned change to the bonus scheme based on the following principles:
- A direct EBIT sharing model with only 1 financial KPI: EBIT (DSO and DPO not part anymore of financial bonus) - Ability to adapt the EBIT ranges to reflect the actual market and potential (a threshold, target and maximum EBIT target will be deter-mined by the CNC)
- More aggressive upside to motivate and reward overperformance: - 150 percent to 200 percent for financial KPI (EBIT) - 120 percent to 150 percent for individual performance
- Objective setting: “managing performance” and focus / cascade objectives better
The new scheme will set a direct percentage of EBIT between threshold and target and a direct percentage of EBIT above target up to the maximum. This will represent still 70 percent of the bonus potential and the remaining 30 percent continues to be measured through individual objectives, behavior and KPI. The maximum bonus potential will therefore increase from 141 percent of the target bonus to 185 percent. At target performance the new scheme, at conversion on January 1, 2015, will be equivalent to the current target bonuses.
63
Panalpina Annual Report 2014
Compensation Report

Overview of future bonus structure
Financial objective THRESHOLD TARGET MAXIMUM WEIGHT
EBIT Threshold Target Maximum 70 %
Distribution as % of EBIT X % + Y %
OBJECTIVE MEASUREMENT TARGET PERFORMANCE(INDICATIVE)
WEIGHT
Individual objectives 1 Reduction of overhead expenses
CHF Reduce by 10 % 20 %
2
3
4
5
Leadership competencies 1 Managing across matric boundaries – builds and uses networks 10 %
2 Achieving customer and operational excellence – makes customer service a core value
3 Ensuring execution – translating strategy into operational plans
Remark: The above objectives and competencies are only examples as illustration.
64
Panalpina Annual Report 2014
Compensation Report

Remuneration of the Board of Directors and the Executive Board for 2014
2014 IN THOUSAND CHF
ANNUAL REMUNER-
ATION
MEETING ATTEN-DANCE
FEES
OTHER LONG-TERM
BENEFITS
TERMI- NATION
BENEFITS
SHARE- BASED
PAYMENTS
SOCIAL SECURITY
CONTRI- BUTIONS1
TOTAL COMPEN-
SATION 2014
Board of Directors
Rudolf W. Hug, Chairman 450 4 50 58 562
Beat Walti, Vice Chairman 150 2 50 24 226
Ilias Läber, Member 150 5 50 24 229
Chris E. Muntwyler, Member 150 4 50 24 228
Roger Schmid, Member* 150 4 50 12 216
Hans-Peter Strodel, Member 150 4 50 20 224
Knud Elmholdt Stubkjær, Member 150 3 50 203
Board of Directors leaving 0 0 0 0 0 0 0
Total remuneration of Board of Directors 1,350 25 0 0 350 163 1,888
Executive Board
Peter Ulber, Chief Executive Officer 1,828 946 264 3,039
Members of the Executive Board 4,111 1,936 830 6,878
Executive Management leaving 368 126 494
Total remuneration of Executive Board 6,308 0 0 0 2,883 1,221 10,411
Total remuneration of keymanagement personnel 7,658 25 0 0 3,233 1,384 12,299
1 Employer contributions to social security and retirement benefits* Remuneration and shares have been transferred to Ernst Göhner Stiftung (employer of respective board member)
The reward table 2014 has slightly been amended versus 2013 as follows: - a separate column for attendance fees has been created for the BOD - share-based programs include now besides the MTIP, the new PSU plan (which is reported in full at grant using IFRS valuation meth odology).
- social security (which was in 2013 part of the column short-term employee benefits) is now together with retirement contributions in a separate column. The social security and retirement contributions included are the actual contributions paid in 2014 for reward already earned.
65
Panalpina Annual Report 2014
Compensation Report

Remuneration of the Board of Directors and the Executive Board for 2013
2013 IN THOUSAND CHF
SHORT- TERM EM-
PLOYMENT BENEFITS
POST-EM-PLOYMENT
BENEFITS
OTHER LONG-TERM
BENEFITS
TERMI- NATION
BENEFITS
SHARE- BASED
PAYMENT3
TOTAL COMPEN-
SATION 2013
Board of Directors
Rudolf W. Hug, Chairman 508 50 558
Beat Walti, Vice Chairman 176 50 226
Ilias Läber, Member 90 50 140
Chris E. Muntwyler, Member 178 50 228
Roger Schmid, Member* 168 50 218
Hans-Peter Strodel, Member 173 50 223
Knud Elmholdt Stubkjær, Member 155 50 205
Board of Directors leaving
Lars Förberg, Member 88 88
Total remuneration of Board of Directors 1,536 0 0 0 350 1,886
Executive Board
Peter Ulber, Chief Executive Officer 1,194 83 1,277
Members of the Executive Board 3,240 373 965 4,578
Executive Management leaving 1,484 174 360 2,018
Total remuneration of Executive Board 5,918 1,278 0 0 1,325 7,873
Total remuneration of key management personnel 7,454 1,278 0 0 1,675 9,759
* Remuneration and shares have been transferred to Ernst Göhner Stiftung (employer of respective board member)
2014 versus 2013 Remuneration of the Board of Directors and the Executive BoardBoard of DirectorsNo changes have been made to the structure of remuneration of the Board of Directors. The overall level of remuneration remained sta-ble compared to 2013.
For 2014 the PWTN share value per April 30, 2014, amounted to CHF 138, therefore the amount of CHF 50,000 to be distributed, divided by a share price of CHF 138, translated in 362 restricted share grants. The effective grant date was May 14, 2014, at a fair market value of CHF 136.10 which gave a fair market value at grant of CHF 49,268.20. These restricted shares are blocked for one year as from the date of grant.
Executive BoardOverall comments affecting base salary evolution and other componentsAlthough the remuneration levels for the members did not fundamentally change in 2014 versus 2013, besides the introduction of a new PSU plan replacing the old LTIP plan - which was closed end 2013 - the end picture is very mixed and shows an increase which might lead to the wrong conclusions.
This increase is to be seen in the following light:
1. The CEO was employed a full year in 2014 as opposed to 7.5 months in 2013, which is reflected in total paid base, bonus and pension contributions. In 2014 the CEO also participates for the first time in the MTIP and PSU grants.
66
Panalpina Annual Report 2014
Compensation Report

2. The other members of the Executive Board were subject to a new composition. 2.1. The CIO joined the Executive Board as per January 1, 2014, and was not a member before. 2.2. The new CHRO joined the company and the Executive Board per November 1, 2014.
3. Executive management leaving: the previous CHRO left the company on July 31, 2014.
4. Reporting for share-based paymentsThe share-based payments as from 2014 include the MTIP and the PSU grants. In 2013 the PSU did not exist, The previous LTIP plan did never pay out and was therefore rather a cash- and not share-related plan. This year experienced a significant increase because the PSU value is now reported as the present theoretical value (IFRS model – CHF 101.35 per PSU) assuming median TSR performance versus peer group and a fair market value of the underlying share at grant date of CHF 139.80. This is theoretical though as per December 31, 2014, the TSR ranked below the 25th percentile of the peer group, so based on the first-year performance, no vesting would occur and the actual vesting will only be known at the end of the three-year performance cycle (December 31, 2016).
The amounts shown in the 2014 reward table for the Executive Board above include: 4.1. Value of the deferred bonus shares to be granted in May 2015 for performance year 2014 (40 percent of the total bonus) 4.2. Matching free shares offered on May 14, 2014 – to be granted on May 14, 2015 (matching of deferred bonus shares
granted in 2014 for performance year 2013) 4.3. The PSU present IFRS value granted on May 9, 2014. Had the PSU been fully earned and vested an extra social-security
contribution would be due on PSU of CHF 89,000.
Annual bonusThe annual bonus payout amounts to 72 percent on average for the members of the Executive Board and 142 percent for the CEO. The bonus included in the 2014 reward table above is related to the cash bonus paid out in 2015, which related to the performance year 2014. The financial and individual objectives have been achieved as follows:
2014 annual bonus outcomes
MEASURES WEIGHT OUTCOMES RELATIVE TO PLAN
Company performance 70 % Threshold Target Maximum
Earnings before interest and tax 63 % Days sales outstanding 3.5 %
Days payable outstanding 3.5 %
Individual performance 30 % Threshold Target Maximum
Key performance indicators 30 % Overall outcome
MTIP (part of share-based payments in the reward tables above)Executive Board members receive 40 percent of their annual bonus (paid in 2015 for performance 2014) in Company shares with a restriction period of one year. The number of shares to be received is based on the share’s closing price on April 30, 2015. This deferral value is included in the reward table.
On May 14, 2014, 6065 deferred bonus shares were granted in aggregate to the Executive Board at a fair market value of CHF 136.10. The CEO was not part of this grant in 2014. This relates to the bonus paid in 2014, performance in 2013. Based on the Executive Board members in service per December 31, 2014, 4943 free matching shares will be granted on May 14, 2015. These free matching shares are included in the 2014 reward table.
For transparency and reconciliation purposes only: on May 13, 2014, 1733 free matching shares were granted in aggregate to the Exe-cutive Board at a fair market value of CHF 135.60. This relates to the bonus paid in 2013, performance in 2012. The CEO was not part of this grant in 2014.
67
Panalpina Annual Report 2014
Compensation Report

PSU (part of share-based payments in the reward tables above)On May 9, 2014, 4000 PSUs were granted to the CEO and 7650 PSUs to other Executive Board members. The present theoretical value (IFRS model) included in the reward table per PSU amounts to CHF 101.35 assuming median TSR performance versus peer group and a fair market value of the underlying share at grant date of CHF 139.80. This is theoretical though as per December 31, 2014, the TSR ranked below the 25th percentile of the peer group, so based on the first-year performance, no vesting would occur.
OTHER SHARE-BASED OR LONG-TERM INCENTIVE COMPENSATION PLANS FOR SENIOR MANAGEMENT
Other top executives – MTIP, LTIP and PSUSome executives of the core business functions (8 executives in 2014), who are not a member of the Executive Board, do participate in a Long-Term Incentive Plan (PSU) and in the Mid-Term Incentive Plan (MTIP) as described above for the Executive Board but with the fol-lowing amendments:
MTIP: For these executives, 80 percent of the annual bonus is payable in cash and 20 percent is converted into PWTN shares that are matched with one free matching share each at the end of the one-year restriction period. All other plan features are the same as for the Executive Board as described above.
MTIP grants in 2014 for these executivesOn May 14, 2014, 2928 deferred bonus shares were granted in aggregate to these executives at a fair market value of CHF 136.10. This relates to the bonus paid in 2014, performance in 2013. Based on the top executives in service per December 31, 2014, 2928 free mat-ching shares will be granted on May 14, 2015.
On May 13, 2014, 1506 free matching shares were granted in aggregate to these executives at a fair market value of CHF 135.60. This relates to the bonus paid in 2013, performance in 2012.
LTIP: All previous Long-Term Incentive Plans never paid out and have been closed as per December 31, 2013, and some vested rights fro-zen at this date. The aggregated value for vested rights of the LTIP for these executives (3 executives) amounts to CHF 565,000, which is subject to a potential payout beginning 2018 and to the condition that the respective employee is still employed with Panalpina.
PSU: Similar as for the Executive Board, and effective as of the business year 2014, Performance Share Units (PSU) were introduced replacing the previous LTIP. The new plan provides for an annual grant of PSU with a three-year cliff vesting. The vesting is conditional upon the relative Total Shareholder Return (TSR) performance compared to a peer group of companies.
On May 9, 2014, 9800 PSUs were granted to these executives. The present theoretical value (IFRS model) per PSU amounts to CHF 101.35 assuming median TSR performance versus peer group and a fair market value of the underlying share at grant date of CHF 139.80. This is theoretical though as per December 31, 2014, the TSR ranked below the 25th percentile of the peer group, so based on the first year performance, no vesting would occur.
Senior management – MIP (Management Incentive Program)Within this old plan the senior management had the option (voluntary) to invest part of their annual bonus in Panalpina shares with a dis-counted share price of 25 percent versus the moment of grant. These shares were blocked for 1 year. As a consequence Panalpina was matching these shares with stock options which had a vesting period of 3 years (1/3 after 1 year, 1/3 after 2 years and the last 3rd after 3 years). The total duration of the options amounts to 6 years from the date of grant. For senior management for the years 2009 and 2010 there are still outstanding stock options on December 31, 2014, as per the table below. All options from previous years are expired.
68
Panalpina Annual Report 2014
Compensation Report

Management incentive plan (option plan)
YEAR
NUMBER OF PARTI-CIPANTS DISCOUNT
NUMBER OF SHARES PURCHASED
OPTIONS GRANTED
EXERCISE PRICE
EXERCISE PRICE FOR US PARTICIPANTS
OPTIONS VESTED BUT NOT EXER-CISED YET
EXPIRY DATE
2009 166 25 % 71,053 71,053 61.25 81.35 6,352 14.06.2015
2010 51 25 % 13,453 13,453 95.65 87.75 1,874 14.06.2016
This plan was changed in 2011 replacing the stock options with matching free shares. Within this plan the senior management had the option (voluntary) to invest part of their annual bonus in Panalpina shares with a discounted share price of 10 percent versus the moment of grant. These shares are blocked for 1 year. As a consequence Panalpina is matching these shares with free share grants based on a ratio of 1 free share matched for 4 shares bought by the participant (for the 2011, 2012 and 2013 plans) and based on a ratio of 1 free share matched for 3 shares bought by the participant (for the 2014 plan). These free shares have a vesting period of 3 years (1/3 rd after 1 year, 1/3 after 2 years and the last 3rd after 3 years). For senior management positions for the years 2011, 2012, 2013 and 2014 the grants are summarized on December 31, 2014, as per the table below.
Management incentive plan (free share plan)
YEAR
NUMBER OF PARTI-CIPANTS DISCOUNT
NRUMBER OF SHARES PURCHASED
FREE SHARE RATIO
MATCHING SHARES GRANTED
VESTED FREE SHARES
FORFEITED FREE SHARES
NON-VESTED FREE SHARE
2011 87 10 % 28,444 1 to 4 7,124 6,423 701 0
2012 38 10 % 11,242 1 to 4 2,816 1,793 299 724
2013 30 10 % 6,768 1 to 4 1,698 610 50 1,038
2014 51 10 % 9,995 1 to 4 3,342 74 0 3,268
The members of the EB and the top executives who participate in the MTIP, LTIP or PSU plans are not eligible for the MIP plan as de scribed above to avoid overlaps.
As per end 2014, 747 senior managers are potentially eligible to the MIP.
Credits, loans or other monetary allowancesNo contributions or other monetary allowances have been made to closely related parties of current or former members of the Board of Directors and Executive Board respectively.
Credits or loans in favor of members of the Board of Directors or Executive Board do not exist.
69
Panalpina Annual Report 2014
Compensation Report

REPORT OF THE STATUTORY AUDITOR TO THE GENERAL MEETING OF PANALPINA WORLD TRANSPORT (HOLDING) LTD, BASELWe have audited the accompanying remuneration report dated December 31, 2014, of Panalpina World Transport (Holding) Ltd for the year ended December 31, 2014. The audit was limited to the information according to articles 14 – 16 of the Ordinance against Exces-sive compensation in Stock Exchange Listed Companies contained in the table Remuneration of the Board of Directors and the Executive Board for 2014 on page 65 of the Compensation Report.
Responsibility of the Board of DirectorsThe Board of Directors is responsible for the preparation and overall fair presentation of the remuneration report in accordance with Swiss law and the Ordinance against Excessive Compensation in Stock Exchange Listed Companies (Ordinance). The Board of Direc-tors is also responsible for designing the remuneration system and defining individual remuneration packages.
Auditor’s ResponsibilityOur responsibility is to express an opinion on the accompanying remuneration report. We conducted our audit in accordance with Swiss auditing standards. Those standards require that we comply with ethical requirements and plan and perform the audit to obtain reason-able assurance about whether the remuneration report complies with Swiss law and articles 14 – 16 of the Ordinance.
An audit involves performing procedures to obtain audit evidence on the disclosures made in the remuneration report with regard to compensation, loans and credits in accordance with articles 14 – 16 of the Ordinance. The procedures selected depend on the audi-tor’s judgment, including the assessment of the risks of material misstatements in the remuneration report, whether due to fraud or error. This audit also includes evaluating the reasonableness of the methods applied to value components of remuneration, as well as assessing the overall presentation of the remuneration report.
We believe that the audit evidence we have obtained is sufficient and appropriate to provide a basis for our opinion.
OpinionIn our opinion, the remuneration report for the year ended December 31, 2014, of Panalpina World Transport (Holding) Ltd complies with Swiss law and articles 14 – 16 of the Ordinance.
KPMG AG
Marc Ziegler Martin RohrbachLicensed Audit Expert Licensed Audit ExpertAuditor in Charge
Zurich, March 2, 2015
70
Panalpina Annual Report 2014
Compensation Report

CONSOLIDATED FINANCIAL
STATEMENTS
Consolidated Income Statement
Consolidated Statement of Comprehensive Income
Consolidated Statement of Financial Position
Consolidated Statement of Changes in Equity
Consolidated Statement of Cash Flows
Notes to the Consolidated Financial Statements
Report of the Statutory Auditor
Key Figures in CHF (five-year review)
Consolidated Statement of Financial Position in CHF (five-year review)
72
73
74
75
77
78
141
142
144
Panalpina Annual Report 2014
Consolidated Financial Statements 71
CONTENTS
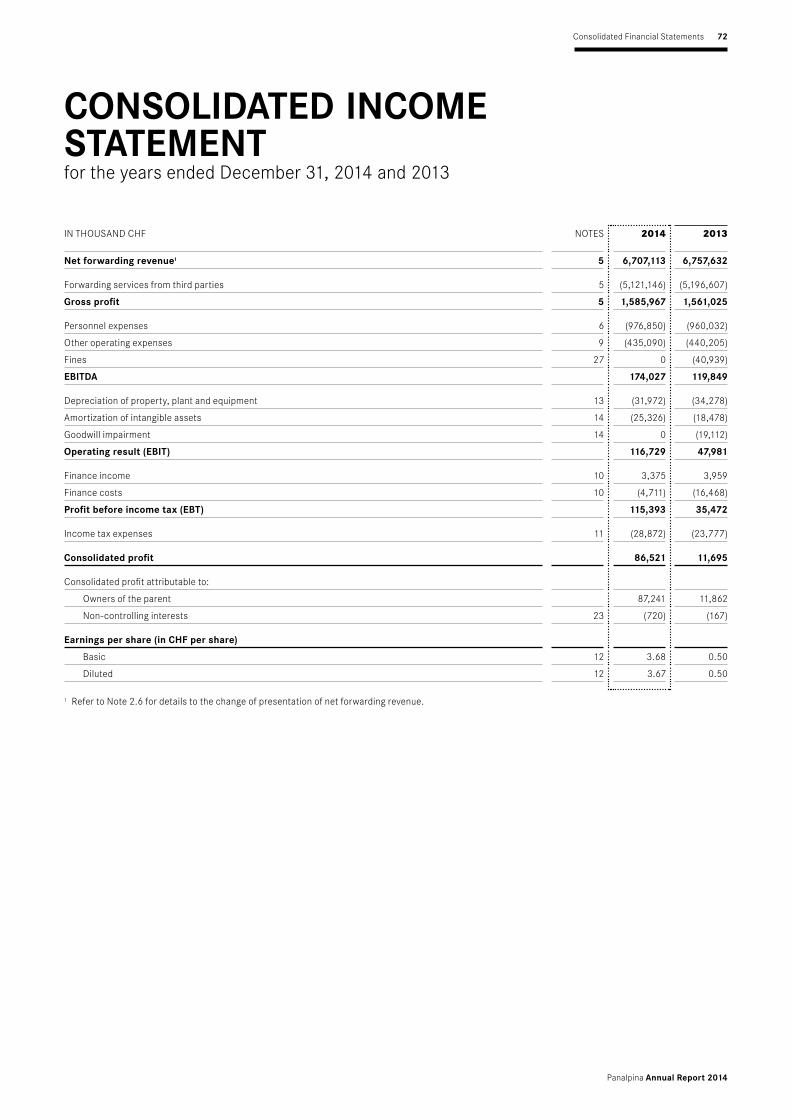
IN THOUSAND CHF NOTES 2014 2013
Net forwarding revenue1 5 6,707,113 6,757,632
Forwarding services from third parties 5 (5,121,146) (5,196,607)
Gross profit 5 1,585,967 1,561,025
Personnel expenses 6 (976,850) (960,032)
Other operating expenses 9 (435,090) (440,205)
Fines 27 0 (40,939)
EBITDA 174,027 119,849
Depreciation of property, plant and equipment 13 (31,972) (34,278)
Amortization of intangible assets 14 (25,326) (18,478)
Goodwill impairment 14 0 (19,112)
Operating result (EBIT) 116,729 47,981
Finance income 10 3,375 3,959
Finance costs 10 (4,711) (16,468)
Profit before income tax (EBT) 115,393 35,472
Income tax expenses 11 (28,872) (23,777)
Consolidated profit 86,521 11,695
Consolidated profit attributable to:
Owners of the parent 87,241 11,862
Non-controlling interests 23 (720) (167)
Earnings per share (in CHF per share)
Basic 12 3.68 0.50
Diluted 12 3.67 0.50
1 Refer to Note 2.6 for details to the change of presentation of net forwarding revenue.
CONSOLIDATED INCOME STATEMENT for the years ended December 31, 2014 and 2013
Panalpina Annual Report 2014
Consolidated Financial Statements 72

IN THOUSAND CHF NOTES 2014 2013
Consolidated profit 86,521 11,695
Other comprehensive income
Items that will not be reclassified to profit or loss:
Remeasurement of the net defined benefit asset / (liability) 7 (20,470) 26,293
Income taxes on this component of other comprehensive income 11 5,099 (6,349)
Subtotal, net of tax (15,371) 19,944
Items that may be reclassified subsequently to profit or loss:
Available-for-sale financial assets 15 0 349
Exchange difference on translations of foreign operations 2,442 (23,159)
Income tax on these components of other comprehensive income 11 0 (116)
Subtotal, net of tax 2,442 (22,926)
Other comprehensive income for the period, net of tax (12,929) (2,982)
Total comprehensive income for the period 73,592 8,713
Attributable to owners of the parent 73,020 9,051
Attributable to non-controlling interests 23 572 (338)
CONSOLIDATED STATEMENT OF COMPREHENSIVE INCOMEfor the years ended December 31, 2014 and 2013
Panalpina Annual Report 2014
Consolidated Financial Statements 73

CONSOLIDATED STATEMENT OF FINANCIAL POSITIONas at December 31, 2014 and 2013
IN THOUSAND CHF NOTES 2014 2013
ASSETSNon-current assets
Property, plant and equipment 13 104,283 118,908
Intangible assets 14 122,029 118,093
Investments 15 28,269 28,349
Post-employment benefit assets 7 6,862 19,905
Deferred income tax assets 26 67,962 65,457
Total non-current assets 329,405 350,712
Current assets
Other receivables and other current assets 18 101,191 102,671
Unbilled forwarding services 111,486 91,192
Trade receivables 19 1,012,647 1,059,582
Derivative financial instruments 20 2,960 2,905
Other current financial assets 15/21 0 5,472
Cash and cash equivalents 21 372,043 336,923
Total current assets 1,600,327 1,598,745
Total assets 1,929,732 1,949,457
EQUITY AND LIABILITIESEquity
Share capital 22 2,375 2,375
Treasury shares 22 (2,089) (3,339)
Retained earnings and reserves 720,618 698,472
Total equity attributable to owners of the parent 720,904 697,508
Non-controlling interests 23 12,245 11,673
Total equity 733,149 709,181
Non-current liabilities
Borrowings 24 132 208
Provisions and other liabilities 25 76,518 77,617
Post-employment benefit liabilities 7 57,069 49,674
Deferred income tax liabilities 26 11,074 16,533
Total non-current liabilities 144,793 144,032
Current liabilities
Trade payables 533,693 577,205
Other payables and accruals 158,229 152,017
Accrued cost of services 205,612 184,479
Borrowings 24 520 3,053
Derivative financial instruments 20 7,988 1,710
Provisions and other liabilities 27 120,212 155,366
Current income tax liabilities 25,536 22,414
Total current liabilities 1,051,790 1,096,244
Total liabilities 1,196,583 1,240,276
Total equity and liabilities 1,929,732 1,949,457
Panalpina Annual Report 2014
Consolidated Financial Statements 74

CONSOLIDATED STATEMENT OF CHANGES IN EQUITYfor the year ended December 31, 2014
ATTRIBUTABLE TO THE OWNERS OF THE PARENT
NON- CON-
TROLLING INTERESTS
TOTAL EQUITY
IN THOUSAND CHF NOTESSHARE
CAPITALTREASURY
SHARES
TRANS- LATION
RESERVERETAINED EARNINGS
TOTAL
Balance on January 1, 2014 2,375 (3,339) (187,798) 886,270 697,508 11,673 709,181
Consolidated profit 87,241 87,241 (720) 86,521
Other comprehensive income 1,150 (15,371) (14,221) 1,292 (12,929)
Total comprehensive income for the period 0 0 1,150 71,870 73,020 572 73,592
Dividends paid 22, 23 (52,185) (52,185) (52,185)
Share-based payments employee share plan 8 1,937 1,937 1,937
Changes in treasury shares, net 22 1,251 (627) 624 624
Balance on December 31, 2014 2,375 (2,088) (186,648) 907,265 720,904 12,245 733,149
Panalpina Annual Report 2014
Consolidated Financial Statements 75

CONSOLIDATED STATEMENT OF CHANGES IN EQUITYfor the year ended December 31, 2013
ATTRIBUTABLE TO THE OWNERS OF THE PARENT
NON- CON-
TROLLING INTERESTS
TOTAL EQUITY
IN THOUSAND CHF NOTESSHARE
CAPITALTREASURY
SHARES
TRANS- LATION
RESERVERETAINED EARNINGS
TOTAL
Balance on January 1, 2013 2,375 (10,018) (164,810) 905,965 733,512 9,241 742,753
Consolidated profit 11,862 11,862 (167) 11,695
Other comprehensive income (22,988) 20,177 (2,811) (171) (2,982)
Total comprehensive income for the period 0 0 (22,988) 32,039 9,051 (338) 8,713
Dividends paid 22, 23 (47,343) (47,343) (171) (47,514)
Share-based payments employee share plan 8 780 780 780
Share-based payments option plan 8 (79) (79) (79)
Changes in treasury shares, net 22 6,679 (2,151) 4,528 4,528
Other changes in non-controlling interests 23 186 186 (186) 0
Reclassification of non-controlling interests to parent shareholders 23 (3,127) (3,127) 3,127 0
Balance on December 31, 2013 2,375 (3,339) (187,798) 886,270 697,508 11,673 709,181
Panalpina Annual Report 2014
Consolidated Financial Statements 76

CONSOLIDATED STATEMENT OF CASH FLOWS for the years ended December 31, 2014 and 2013
IN THOUSAND CHF NOTES 2014 2013
Consolidated profit 86,521 11,695
Income tax expenses 11 28,872 23,777
Depreciation of property, plant and equipment 13 31,972 34,278
Amortization of intangible assets 14 25,326 18,478
Goodwill impairment 14 0 19,112
Impairment of financial assets 10 3 0
Interest income and dividend on available-for-sale financial assets 10 (2,186) (3,205)
Interest expenses 10 1,112 1,497
Exchange differences 10 (1,035) 10,584
Loss / (gain) on sales of property, plant and equipment 9 513 (980)
Share-based payment transactions 6 / 8 1,937 701
Other non-cash (income) and expenses (2,853) (2,395)
170,182 113,542
Working capital adjustments:
(Increase) / decrease receivables and other current assets 55,027 (121,615)
Increase / (decrease) payables and accruals incl. accrued cost of service (32,918) 49,595
(Decrease) / increase long-term provisions and other liabilities (2,672) 2,869
(Decrease) / increase short-term provisions and other liabilities (36,713) 29,404
Cash generated from operations 152,906 73,795
Interest paid (1,472) (1,497)
Income taxes paid (28,403) (29,831)
Net cash from operating activities 123,031 42,467
Interest received 2,184 2,700
Dividends received 10 141 510
Proceeds from sales of property, plant and equipment and Intangible 2,968 2,427
Proceeds from investments 968 2,685
Repayments of loans and long-term receivables 5,855 3,763
Proceeds from sales of other financial assets 6,102 952
Purchase of property, plant and equipment (19,467) (28,618)
Purchase of intangible assets and other assets (28,612) (22,294)
Purchase of investments (102) (179)
Purchase of other financial assets (6,067) (9,914)
Net cash used in investing activities (36,030) (47,968)
Free cash flow 87,001 (5,501)
Proceeds from short- and long-term borrowings 208 1,633
Repayment of short- and long-term borrowings (2,775) (48)
Dividends paid (52,185) (47,343)
Dividends paid to non-controlling interests 23 0 (171)
Purchase of treasury shares 22 (2,762) 0
Sale of treasury shares 22 2,040 4,529
Net cash used in financing activities (55,474) (41,400)
Effect of exchange rate changes on cash and cash equivalents 3,593 (9,237)
Net increase (decrease) in cash and cash equivalents 35,120 (56,138)
Cash and cash equivalents at the beginning of the year 21 336,923 393,061
Cash and cash equivalents at the end of the year 21 372,043 336,923
Panalpina Annual Report 2014
Consolidated Financial Statements 77
NOTES TO THE CONSOLIDATED FINANCIAL STATEMENTS
1 GENERAL INFORMATIONPanalpina World Transport (Holding) Ltd. (referred to hereafter as the company) and its subsidiaries (collectively the “Group” and individually “Group Companies”) is one of the world’s leading providers of supply chain solutions. The company combines its core products of Air Freight, Ocean Freight and Logistics to deliver globally integrated, tailor-made end-to-end solutions. Draw-ing on in-depth industry knowledge and customized IT systems, Panalpina manages the needs of its customers’ supply chains, no matter how demanding they might be.
Panalpina World Transport (Holding) Ltd. is a limited company incorporated and domiciled in Basel. The registered address is Viadukt-strasse 42, 4002 Basel, Switzerland. The company shares are publicly traded and are listed on the SIX Swiss Exchange in Zurich.
The consolidated financial statements for the year ending December 31, 2014, were authorized for issuance in accordance with a resolution by the Board of Directors on February 27, 2015.
2 SUMMARY OF SIGNIFICANT ACCOUNTING POLICIESThe principal accounting policies applied in the preparation of these consolidated financial statements are set out below. These policies have been consistently applied to all the years presented, unless otherwise stated.
2.1 BASIS OF PREPARATIONThe consolidated financial statements are based on the accounts of the individual subsidiaries on December 31, which have been drawn up according to uniform Group accounting principles.
2.2 STATEMENT OF COMPLIANCEThe consolidated accounts have been prepared in accordance with International Financial Reporting Standards (IFRS) and com-ply with Swiss law.
2.3 BASIS OF MEASUREMENTThe consolidated financial statements have been prepared under the historical cost basis, except for available-for-sale financial assets, financial assets and financial liabilities (including derivative instruments) at fair value through profit and loss and liabili-ties for cash-settled share-based payment arrangements that have been measured at fair value. Net defined benefit liabilities (assets) are recognized at the difference in fair value of the plan assets and the present value of the defined benefit obligation.
2.4 PRESENTATION CURRENCYThe consolidated financial statements are presented in Swiss francs (CHF), which is the functional currency of the company and all values are rounded to the nearest thousand except where otherwise indicated.
2.5 USE OF ESTIMATES AND JUDGMENTSThe preparation of the consolidated financial statements in conformity with IFRS requires management to make judgments, esti-mates and assumptions that affect application of accounting policies and the reported amounts of assets, liabilities, income and expenses. It requires management to exercise its judgments and assumptions in the process of applying the Group’s accounting policies. Actual results may differ from these estimates.
Estimates and underlying assumptions are reviewed on an ongoing basis. Deviations from estimates are recognized in the period in which the estimates are revised and in any future periods affected.
The areas involving a higher degree of judgment or complexity, or areas in which assumptions and estimates are significant to the consoli dated financial statements, are disclosed in note 4.
A number of the Group’s accounting policies and disclosures require the measurement of fair values, for both financial and non- financial assets and liabilities. When measuring the fair value of an asset or a liability, the Group uses market observable data as far as possible. Fair values are categorised into different levels in a fair value hierarchy based on the inputs used in the valuation techniques as described in note 17. The Group recognizes transfers between levels of the fair value hierarchy, if any, at the end of the reporting period during which the change has occurred. The methods used to measure fair values are discussed further in note 3. Further information about the assumptions made in measuring fair values is included in note 17.
Panalpina Annual Report 2014
Consolidated Financial Statements 78
2.6 RESTATEMENTInconsistent to IAS 1, in the past Panalpina presented in the consolidated income statement in addition to the net forwarding rev-enue the invoiced forwarding services and the customs, duties and taxes separately. The correction of the presentation has beenchanged in these consolidated financial statements in accordance with IAS 8. This change does not affect the consolidated profit or loss. The development of the invoiced forwarding services as well as the customs, duties and taxes are newly integrated in the segment reporting.
In addition, the Group has made a minor presentational change to the disclosure of key management personnel compensation in note 28 to increase the understandability of the information provided.
3 SIGNIFICANT ACCOUNTING POLICIESThe accounting policies set out below have been applied consistently to all periods presented in these consolidated financial statements and have been applied consistently by Group entities, unless otherwise stated. If necessary, comparative amounts have been re-represented to conform with the current year’s presentation.
The following new or revised standards, amendments to existing standards and interpretations have been adopted in 2014, effec-tive from January 1, 2014: Amendments to IFRS 10, IFRS 11 and IAS 27 “Investment Entities”, Amendments to IAS 39 “Novation of Derivatives and Continuation of Hedge Accounting”, IFRIC 21 “Levies” and certain amendments to various standards from “Annual Improvements to IFRS 2010-2012 Cycle” issued by the IASB. These do not have a material impact on the Group’s over-all results and financial position as well as related disclosures.
The following new or revised standards, amendments to existings standards and interpretations have been issued, but are notyet effective:
– Annual Improvements to IFRS 2010-2012 Cycle (effective date July 1, 2014) – Annual Improvements to IFRS 2011-2013 Cycle (effective date July 1, 2014) – Annual Improvements to IFRS 2012-2014 Cycle (effective date January 1, 2016) – IFRS 14 - Regulatory Deferral Accounts (effective date January 1, 2016) – Amendments to IAS 1 - Disclosure Initiative (effective date January 1, 2016) – Amendments to IFRS 10, IFRS 12 and IAS 28 - Investment Entities: Applying the Consolidation Exception (effective date January 1, 2016) – IFRS 9 - Financial Instruments (effective date January 1, 2018) – IFRS 15 – Revenue from Contracts with Customers (effective date January 1, 2017) – Amendments to IFRS 11- Accounting for Acquisitions of Interests in Joint Operations (effective date January 1, 2016) – Amendments to IAS 16 and IAS 38 - Clarification of Acceptable Methods of Depreciation and Amortization (effective date January 1, 2016) – Amendments to IAS 16 and IAS 41 - Bearer Plants (effective date January 1, 2016) – Amendments to IAS 27 - Equity Method in Separate Financial Statements (effective date January 1, 2016) – Amendments to IFRS 10 and IAS 28 - Sale or Contribution of Assets between an Investor and its Associate or Joint Venture (effective date January 1, 2016)
The Group is currently analyzing in detail the changes to the accounting policies and the impact on the Group’s overall results and financial position.
3.1 BASIS OF CONSOLIDATION3.1.1 Consolidation policy
The subsidiaries are those companies controlled, directly or indirectly, by Panalpina World Transport (Holding) Ltd. The Group controls an entity when it is exposed to, or has rights to, variable returns from its involvement with the entity and has the abil-ity to affect those returns through its power over the entity. This control is normally evidenced when the Group owns, either directly or indirectly, more than one half of the voting rights. The Group also assesses existence of control where it does not have more than 50 percent of the voting power but is able to govern the financial and operating policies by de-facto control.
De-facto control may arise in circumstances where the size of the Group’s voting rights relative to the size and dispersion of hold-ings of other shareholders give the Group the power to govern the financial and operating policies.
Subsidiaries are fully consolidated from the date on which control is transferred to the Group and they are de-consolidated from the date that control ceases.
Panalpina Annual Report 2014
Consolidated Financial Statements 79

The Group applies the acquisition method of accounting to account for business combinations. The consideration transferred for the acquisition of a subsidiary is the fair value of the assets transferred, the liabilities incurred to the former owners of the acquiree and the equity interests issued by the Group. The consideration transferred includes the fair value of any asset or liabil-ity resulting from a contingent consideration arrangement. Identifiable assets acquired and liabilities and contingent liabilities assumed in a business combination are measured initially at fair values at the acquisition date. The Group recognizes any non-controlling interest in the acquiree on an acquisition-by-acquisition basis, at fair value of the recognized amounts of the acquiree’s identifiable net assets.
Acquisition-related costs are expensed as incurred.
If the business combination is achieved in stages, the acquisition date carrying value of the acquirer’s previously held equity interest in the acquiree is remeasured to fair value at the acquisition date, any gains or losses arising from such remeasurement are recognized in profit or loss.
Any contingent consideration to be transferred by the Group is recognized at fair value at the acquisition date. Subsequent changes to the fair value of the contingent consideration that is deemed to be an asset or liability is recognized in accordance with IAS 39 in profit or loss. Contingent consideration that is classified as equity is not remeasured and its subsequent settle-ment is accounted for within equity.
Goodwill is initially measured as the excess of the aggregate of the consideration transferred and the fair value of non-controlling interest over the net identifiable assets acquired and liabilities assumed. If this consideration is lower than the fair value of the net assets of the subsidiary acquired, the difference is recognized in profit or loss.
Intercompany transactions, balances, income and expenses on transactions between Group companies are eliminated. Unreal-ized losses are eliminated in the same way as unrealized gains, but only to the extent that there is no evidence of impairment.
Changes in ownership interest in subsidiaries without change of controlTransactions with non-controlling interests that do not result in loss of control are accounted for as equity transactions - that is, as transactions with the owners in their capacity as owners. The difference between fair value of any consideration paid and the relevant share acquired of the carrying value of net assets of the subsidiary is recorded in equity. Gains or losses on disposals to non-controlling interests are also recorded in equity.
Disposal of subsidiariesWhen the Group ceases to have control, any retained interest in the entity is remeasured to its fair value at the date when con-trol is lost, with the change in carrying amount recognized in profit or loss. The fair value is the initial carrying amount for the purposes of subsequent accounting for the retained interest as an associate, joint venture or financial asset. In addition, any amounts previously recognized in other comprehensive income in respect of that entity are accounted for as if the Group had directly disposed of the related assets or liabilities. Amounts previously recognized in other comprehensive income are reclassi-fied to profit or loss.
3.1.2 Operating segment informationManagement has determined the operating segments based on the reports reviewed by the Executive Board that are used to make strategic decisions. The Executive Board considers the business from a geographic perspective as the Group’s operations are predominately managed by geographical location. Headquarter activities are not separately reported but included in the respective results of each segment in the segment information. The Executive Board assesses performance of the operating seg-ments based on a measure of adjusted operating result (Segment EBIT). This measurement basis excludes the effects on non-recurring expenditure from the operating segments.
Transfer prices between operating segments are set out at arm’s-length basis. Operating assets and liabilities consist of prop-erty, plant and equipment, goodwill and intangible assets, trade receivables / payables, other assets and liabilities such as provisions and current income taxes, which can be reasonably attributed to the reported operating segments. Non-operating assets and liabilities mainly include deferred income tax balances, post-employment benefit assets / liabilities and financial assets / liabilities such as marketable securities and investments.
Panalpina Annual Report 2014
Consolidated Financial Statements 80

3.2 FOREIGN CURRENCY3.2.1 Functional currency
Most Group companies use their local currency as their functional currency. Certain Group companies use other currencies (such as US dollars or Euros) as their functional currency where this is the currency of the primary economic environment in which the entity or branch operates.
3.2.2 Transactions and balancesLocal transactions in other currencies are initially reported using the exchange rate at the date of the transaction or reporting date. Gains and losses from the settlement of such transactions and gains and losses on transactions of monetary assets and liabilities denominated in other currencies are included in the income statement, except when they arise on monetary items that, in substance, form part of the Group’s net investment in a foreign entity. In such cases, the gains and losses are deferred into other comprehensive income.
Non-monetary items that are measured in terms of historical cost in foreign currency are translated using the exchange rate as of the dates of the initial transaction. Non-monetary items measured at fair value in a foreign currency are translated using the exchange rates on the date on which the fair value is determined.
Changes in fair value of debt securities denominated in foreign currency classified as available-for-sale are split into components resulting from changes in the amortized cost of the security and other changes in the carrying amount of the security. Foreign exchange remeasurement differences related to changes in amortized cost are recognized in profit or loss and other changes in the carrying amount are recognized in other comprehensive income.
3.2.3 Presentation currencyOn consolidation, assets and liabilities of Group companies using functional currency other than Swiss francs are translated into Swiss francs using a year-end rate of exchange. Income, expenses and net income and cash flows are translated at the average rates of exchange for the year. Translation differences due to the changes in exchange rates between the beginning and the end of the year and the difference between net incomes translated at the average and year-end exchange rates are recognized as a separate component of other comprehensive income.
On disposal of a foreign entity, the identified cumulative currency translation differences within equity relating to that foreign entity are recognized in the income statement as part of the gain or loss on divestment.
Any goodwill arising on the acquisition is treated as an asset of the foreign operation and translated at the closing rate.
The most important exchange rates used in the reported financial statements are:
2014 2013
STATEMENT OF FINANCIAL
POSITION1 INCOME STATEMENT2
STATEMENT OF FINANCIAL POSITION1 INCOME STATEMENT2
EUR 1.20270 1.21459 EUR 1.22625 1.23048
USD 0.89793 0.91551 USD 0.89014 0.92682
HKD 0.12734 0.11806 HKD 0.11479 0.11949
CNY 0.15923 0.14859 CNY 0.14722 0.15074
CAD 0.85033 0.82903 CAD 0.83088 0.90004
GBP 1.53662 1.50706 GBP 1.46709 1.44952
BRL 0.37165 0.38954 BRL 0.38207 0.43150
1 Year-end rate 2 Average rate
Panalpina Annual Report 2014
Consolidated Financial Statements 81

3.3 REVENUE RECOGNITIONNet forwarding revenue includes amounts received, receivables and unbilled services for forwarding and logistics services per-formed for customers after deducting trade discounts and volume rebates and excluding sales taxes and value-added taxes less charges for customs and duty.
Trade discounts and volume rebates are recorded on an accrual basis consistent with recognition of the related revenue recorded as a deduction for accounts receivable or as accrued liabilities. Such estimates are based on analyses of existing contractual obligations, historical trends and the Group’s experience.
Net forwarding revenue is recognized at the time the services are performed. Logistics projects with a longer period of deliv-ery are recognized at the stage of completion of the services on the reporting date. The stage of completion is assessed with reference to completion of the specific transaction assessed on the basis of the actual service provided as a proportion of the total services to be provided. Where necessary, single transactions are split into separately identifiable components to reflect the substance of the transaction. Conversely, two or more transactions may be considered together for revenue recognition pur-poses, where the commercial effect cannot be understood without reference to the series of transactions as a whole.
Gross profit includes net forwarding revenue from services rendered less related expenses for services provided by third par-ties net of customs, duty and taxes.
Interest income is recognized as interest accrued using the effective interest method. Interest income is included in finance income in the income statement.
Dividends are recognized when the Group’s right to receive the payment is established.
3.4 FORWARDING SERVICES FROM THIRD PARTIESForwarding services from third parties include the corresponding direct services costs and related services costs rendered by a third party. Trade discounts and volume rebates are recorded on an accrual basis consistent with the recognition of the related services.
3.5 EMPLOYEE BENEFITS Wages, salaries, social security contributions, paid annual leave, sick leave and other benefits are paid or accrued undiscounted in the year in which the associated services are rendered by employees of the Group. Legal or constructive obligations such as bonus or profit-sharing plans are recognized for the amount expected to be paid in the year in which the services are provided and are presented under current provisions and other liabilities.
Termination benefits are expensed at the earlier of when the Group can no longer withdraw the offer of those benefits and when the Group recognizes costs for a restructuring. If benefits are payable more than 12 months after the reporting date, then they are discounted to their present value.
3.5.1 Pension obligationGroup companies operate various pension schemes. The schemes are generally funded through payments to insurance compa-nies or trustee-administered funds, determined by periodic actuarial calculations. The Group has both defined benefit and defined contribution plans. A defined contribution plan is a pension plan under which the Group pays fixed contributions into a separate entity. The Group has no legal or contractual obligations to pay further contributions if the fund does not hold sufficient assets to pay all employees the benefits relating to employee service in the current and prior periods. A defined benefit plan is a pension plan that is not a defined contribution plan.
Typically defined benefit plans define an amount of pension benefit that an employee will receive on retirement, usually depen-dent on one or more factors such as age, years of service and compensation.
The net defined benefit liability / asset recognized in the balance sheet in respect of defined benefit pension plans is the present value of the defined benefit obligation at the end of the reporting period less the fair value of plan assets. The defined benefit obligation is calculated annually by independent actuaries using the projected unit credit method. The present value of the defined benefit obligation is determined by discounting the estimated future cash outflows using interest rate of high- quality cor-
Panalpina Annual Report 2014
Consolidated Financial Statements 82

porate bonds that are denominated in the currency in which the benefits will be paid and that have terms to maturity approximating to the terms of the related pension obligation. In countries where there is no deep market in such bonds, the mar-ket rates on government bonds are used.
When the calculation results in a potential asset for the Group, the recognized asset is limited to the present value of economic benefits available in the form of any future refunds from the plan or reduction in future contributions to the plan. To calculate the present value of economic benefits, consideration is given to any applicable minimum funding requirements.
Remeasurements of the net defined benefit liability / asset which comprise actuarial gains and losses arising from changes in actuarial assumptions (both demographic and financial) and experience adjustments, the return of plan assets (excluding inter-est) and the effect of the asset ceiling (if any, excluding interest), are charged or credited immediately to equity in other comprehensive income. The Group determines the net interest expense on the net defined benefit liability / asset at the begin-ning of the annual period by applying the discount rate used to measure the defined benefit obligation at the beginning of the annual period to the net defined benefit liability / asset, taking into account any changes in the net defined benefit liability / asset during the period as a result of contributions and benefit payments. Net interest expense and other expenses related to defined benefit plans are recognized in the income statement under “Personnel expenses”.
When the benefits of a defined benefit plan are changed or amended or when a defined benefit plan is curtailed, the resulting change in benefit that relates to past service or the gain or loss on curtailment is recognized immediately in the income state-ment. The Group recognizes gains and losses on the settlement of a defined benefit plan when the settlement occurs.
The Group applies the practical expedient and recognizes contributions from employees that are independent of the number of years of service (including those that are a fixed percentage of an employee’s salary and are dependent on an employee’s age) as a reduction of the service cost in the period in which the related service is rendered (IAS 19 paragraph 93 [b]).
For defined contribution plans, the Group pays contributions to publicly or privately administered pension insurance plans on a mandatory, contractual or voluntary basis. The Group has no further payment obligations once the contributions have been paid. The contributions are recognized as employee benefit expense when they are due. Prepaid contributions are recognized as an asset to the extent that a cash refund or a reduction in the future payments is available.
3.5.2 Other long-term employee benefitsNet obligation in regard to long-term employee benefits other than pension plans is the amount of future benefits that employ-ees have earned in return for their service in the current and / or prior periods. Benefits are discounted to determine their present value and the fair value of any related asset is deducted. This net amount is presented in non-current provisions and other liabilities in the balance sheet. The expected costs of these benefits are accrued over the period of employment using the same method of valuation that is used for defined benefit pension plans. Any actuarial gains or losses that consist of differences between assumptions and actual experiences and the effects of changes in actuarial assumptions are recognized in the income statement in the period in which they arise.
3.5.3 Share-based compensationThe Group operates a number of equity-settled share-based compensation plans under which the entity receives services from employees as consideration for equity or equity instruments (options) of the Group. The fair value of the employee services received in exchange for the granting of the options and the discount on the shares granted is estimated at the grant date and recorded as an expense over the vesting period. The expense is recognized as other employee benefits in the income statement. For equity-settled plans, an increase in equity is recorded for this expense and any subsequent cash flows from exercises of vested awards are recorded as changes in equity. For cash-settled plans, a liability is recorded that is measured at fair value at each reporting date with any movements in fair value being recorded in the income statement. Any subsequent cash flows from exercise of vested awards are recorded as a reduction of the liability.
3.6 OTHER OPERATING EXPENSESOther operating expenses primarily include administrative expenses, communication expenses, rent and utilities expenses, travel and promotion expenses, insurance expenses and claims, changes in provisions from impairments of trade receivables and collection expenses and other operating expenses necessary to render forwarding revenue to third parties. The expenses are recognized when the expenses recorded on an accrual basis have been incurred.
Panalpina Annual Report 2014
Consolidated Financial Statements 83

3.7 FINANCE INCOME AND COSTSFinance income comprises interest income on funds invested, dividend income from investments, cash discounts, gains on dis-posals of available-for-sale financial assets, changes in the fair value of financial assets at fair value through profit or loss and gains on derivatives that are recognized in profit or loss. Interest income is recognized as it accrues in profit or loss using the effective interest method.
Finance costs comprise interest expense on borrowings, unwinding of the discount on provisions, cash discounts, changes in the fair value of financial assets at fair value through profit or loss, impairment losses recognized on financial assets, losses on hedging instruments that are recog nized in profit or loss, bank charges and bank guarantee fees. All borrowing costs are recog-nized in profit or loss using the effective interest method.
3.8 CURRENT AND DEFERRED INCOME TAX EXPENSESThe tax expense for the period comprises current and deferred tax. Tax is recognized in the income statement, except to the extent that it relates to items recognized in other comprehensive income or directly in equity. In this case, the tax is also recog-nized in other comprehensive income or directly in equity, respectively.
The current income tax charge is calculated on the basis of the tax laws enacted or substantively enacted at the balance sheet date in the countries where the company and its subsidiaries operate and generate taxable income. Management periodically evaluates positions taken in tax returns with respect to situations in which applicable tax regulation is subject to interpretation. It establishes provisions where appropriate on the basis of amounts expected to be paid to the tax authorities.
Deferred income tax is recognized, using the liability method, on temporary differences arising between the tax bases of assets and liabilities and their carrying amounts in the consolidated financial statements. However, deferred tax liabilities are not rec-ognized if they arise from the initial recognition of goodwill; deferred income tax is not accounted for if it arises from initial recognition of an asset or liability in a transaction other than a business combination that at the time of the transaction affects neither accounting nor taxable profit or loss. Deferred income tax is determined using tax rates that have been enacted or sub-stantively enacted by the balance sheet date and are expected to apply when the related deferred income tax asset is realized or the deferred income tax liability is settled.
Deferred income tax assets are recognized only to the extent that it is probable that future taxable profit will be available against which the temporary differences can be utilized.
Deferred income tax is provided on temporary differences arising on investments in subsidiaries and associates, except for deferred income tax liability where the timing of the reversal of the temporary difference is controlled by the Group and it is prob-able that the temporary difference will not reverse in the foreseeable future.
Deferred income tax assets and liabilities are offset when the income taxes are levied by the same taxation authority and when there is a legally enforceable right to offset them.
3.9 PROPERTY, PLANT AND EQUIPMENTProperty, plant and equipment are measured at cost, net of accumulated depreciation and/or accumulated impairment losses, if any. Initially property, plant and equipment are recorded at cost of purchase or construction and include all costs directly attributable to bringing the asset to the location and condition necessary for it to be capable of operating in the manner intended by management. Interest and other borrowing costs for long-term construction projects are capitalized and included in the car-rying value of the assets. All other repair and maintenance costs of the day-to-day servicing are recognized in the income statement as incurred. The present value of the expected cost for the decommissioning of the asset after its use is included in the cost of the respective asset if the recognition criteria for a provision are met. When components of an item of property, plant and equipment have different useful lives, they are accounted for as separate items of property, plant and equipment.
Gains and losses on a disposal of an item of property, plant and equipment are determined by comparing the proceeds from dis-posal with the carrying amount of property, plant and equipment and are recognized net within other operating expenses in the income statement.
Panalpina Annual Report 2014
Consolidated Financial Statements 84

Depreciation is recognized in the income statement on a straight-line basis over the estimated useful lives of each part of an item of property, plant and equipment. Leased assets are depreciated over the shorter of the lease term and their useful lives unless it is reasonably certain that the Group will obtain ownership by the end of the lease term. Land and construction in progress are not depreciated.
The estimated useful lives for the current and comparative periods are as follows:
YEARS
Warehouse and office buildings 25 – 40
Warehouse and transportation equipment 3 – 10
Office furnishings and equipment 5 – 10
EDP hardware 3
Trucks, trailers and special vehicles 3 – 10
Automobiles 3 – 5
The assets’ residual value and estimated useful lives are regularly reviewed and adjusted. If appropriate, the future depreciation charge is accelerated.
3.10 LEASESWhere the Group is the lessee, leases of property, plant and equipment where the Group has substantially all of the risks and rewards of ownership are classified as finance leases. Financial leases are capitalized at the start of the lease at fair value or the present value of the minimum lease payments, if lower. Assets acquired under finance leases are depreciated in accordance with the Group’s policy on property, plant and equipment. If there is no reasonable certainty that the Group will obtain ownership by the end of the lease term, the asset is depreciated over the shorter of the lease term and useful life. The corresponding leasing obligations, net of finance charges, are included in borrowings. The interest element of the finance cost is charged to the income statement over the lease period in order to produce a constant periodic rate of interest on the remaining balance of the liability for each period. Leases where substantially all of the risks and rewards of ownership are not transferred to the Group are classi-fied as operating leases. Payments made under operating leases are charged against the income statement on a straight-line basis over the period of the lease.
3.11 INTANGIBLE ASSETS3.11.1 Business combination and goodwill
Business combinations are accounted for using the acquisition method of accounting. The consideration transferred in a busi-ness combination is measured at fair value at the date of acquisition and includes the cash paid plus the fair value at the date of exchange of assets given, liabilities incurred or assumed and equity instruments issued by the Group. The fair value of the con-sideration transferred also includes contingent consideration arrangements at fair value. Directly attributable acquisition- related costs are expensed in the income statement. At the date of acquisition the Group recognizes the identifiable assets acquired and the liabilities assumed at fair value. Where the Group does not acquire 100 percent ownership of the acquired business, non-con-trolling interests are recorded as the proportion of the fair value of the acquired net assets attributable to non- controlling interest. Goodwill is recorded as the surplus of the consideration transferred over the Group’s interest in the fair value of acquired net assets. Any goodwill and fair value adjustments are recorded as assets and liabilities of the acquired business in the functional currency of that business. If the initial accounting for a business combination is incomplete at the end of a reporting period, provisional amounts are used. During the measurement period, the provisional amounts are retrospec tively adjusted and additional assets and liabilities may be recognized, to reflect new information obtained about the amounts recognized at acqui-sition date, had they been known. Goodwill is not amortized but assessed for possible impairment at each reporting date and is additionally tested annually for impairment. For the purpose of impairment testing, goodwill acquired in a business combination is allocated to each of the Group’s cash-generating units that are expected to benefit from the synergies of the combination, irre-spective of whether other assets or liabilities of the acquiree are assigned to those units. Changes in ownership interest in subsidiaries are accounted for as equity transactions if they occur after control has already been obtained and if they do not result in a loss of control.
Panalpina Annual Report 2014
Consolidated Financial Statements 85

3.11.2 BrandsSeparately acquired brands are shown at historical cost. Brands acquired in a business combination are recognized at fair value at the acquisition date. Brands have a finite useful life and are carried at cost less accumulated amortization and accumulated impairment losses. Amortization is calculated using the straight-line method to allocate the cost of brands over their estimated useful lives of five to ten years.
3.11.3 Customer listsCustomer lists acquired in a business combination are recognized at fair value at the acquisition date. Customer lists have a finite useful life and are carried at cost less accumulated amortization and accumulated impairment losses. Amortization is calculated using the straight-line method over the expected life of the customer lists of three to five years.
3.11.4 Computer softwareDevelopment costs that are directly attributable to the design and testing of identifiable and unique software products controlled by the Group are recognized as intangible assets when the following criteria are met:
– it is technically feasible to complete the software product so that it will be available for use; – management intends to complete the software product and use or sell it; – there is an ability to use or sell the software product; – it can be demonstrated how the software product will generate probable future economic benefits; – adequate technical, financial and other resources to complete the development and to use or sell the software product are available; and
– the expenditure attributable to the software product during its development can be reliably measured.
Directly attributable costs that are capitalized as part of the software product include software development costs, employee costs and an appropriate portion of relevant overhead costs. Other development expenditures that do not meet these criteria are recognized as an expense as incurred. Development costs previously recognized as expenses are not recognized as an asset in a subsequent period. Costs associated with maintaining computer software programs are recognized as an expense as incurred. Computer software development costs recognized as assets are amortized over their estimated useful life, which does not exceed three to eight years.
3.11.5 Other intangible assetsOther intangible assets that are acquired by the Group that have finite useful lives are measured at cost less accumulated amor-tization and accumulated impairment losses.
3.12 IMPAIRMENT OF PROPERTY, PLANT AND EQUIPMENT AND INTANGIBLE ASSETS (EXCL. GOODWILL)An impairment assessment is carried out when there is evidence that an asset may be impaired. In addition, intangible assets that are not yet available for use are tested for impairment annually. If any such indication exists, or when annual impairment test-ing for an asset is required, the Group makes an estimate of the asset’s recoverable amount. An asset’s recoverable amount is the higher of an asset’s or cash-generating unit’s fair value less costs of disposal and its value in use and is determined for an individual asset, unless the asset does not generate cash inflows that are largely independent of those from other assets or asset groups. Where the carrying amount of an asset exceeds its recoverable amount, the asset is considered impaired and is written down to its recoverable amount. In assessing value in use, the estimated future cash flows are discounted to their present value using a pre-tax discount rate that reflects current market assessments of the time value of money and the risks specific to the asset. An appropriate valuation model is used to determine fair value less costs of disposal. These calculations are corroborated by valuation multiples, quoted share prices for publicly traded subsidiaries or other available fair value indicators. Impairment losses are recognized in the income statement. When an impairment loss arises, the useful life of the asset in question is reviewed and, if necessary, the future depreciation / amortization charge is accelerated.
3.13 IMPAIRMENT OF GOODWILLGoodwill impairment reviews are undertaken annually or more frequently if events or changes in circumstance indicate a poten-tial impairment. When the recoverable amount of the cash-generating units, being the higher of its fair value less costs of disposal or its value in use, is less, then the carrying value of the goodwill is reduced to its recoverable amount. The reduction is reported in the income statement as an impairment loss. The methodology used in the impairment testing is further described in note 14.
Panalpina Annual Report 2014
Consolidated Financial Statements 86

3.14 FINANCIAL INSTRUMENTS3.14.1 Amortized cost of financial instruments
Amortized cost is computed using the effective interest method less any allowance for impairment and principal repayment or reduction. The calculation takes into account any premium or discount on acquisition and includes transaction costs that are an integral part of the effective interest rate.
3.14.2 Financial AssetsFinancial assets, including cash and marketable securities, short- and long-term deposits, trade and other receivables, loans and other receivables, quoted and unquoted financial instruments and derivative financial instruments, are classified either as fair value through profit or loss, loans and receivables, available-for-sale, or in exceptional cases, as held to maturity. The classi- fica-tion depends on the purpose for which the financial assets were acquired. Management determines the classification of its financial assets at initial recognition. All financial assets are initially recognized at fair value plus, in the case of investments not at fair value through profit or loss, directly attributable transaction costs. All purchases and sales are recognized on the settle-ment date.
3.14.2.1 Subsequent measurementFinancial assets at fair value through profit or lossFinancial assets at fair value through profit or loss include financial assets held for trading and financial assets designated on ini-tial recognition at fair value through profit or loss. Financial assets are classified as held for trading if they are acquired for the purpose of selling in the near term. This category includes derivative financial instruments entered into by the Group. Financial assets at fair value through profit or loss are carried on the statement of financial position at fair value with gains or losses rec-ognized in the income statement.
Loans and receivablesLoans and receivables are non-derivative financial assets with fixed or determinable payments that are not quoted in an active market. Such financial assets are normally carried at amortized cost using the effective interest rate method. Gains and losses are recognized in the income statement when the loans and receivables are derecognized or impaired, as well as through the amortization process.
Trade receivables originated by the Group are financial assets that are created by providing services directly to the debtor. Such receivables are not quoted and are not originated with the intention to be sold immediately or in the near term. Receivables are presented in current assets for maturities up to 12 months (accounting treatment of trade receivables is outlined in more detail in the section: 3.14.5 Trade receivables).
Held-to-maturity investmentsNon-derivative financial assets with fixed or determinable payments and fixed maturities are classified as held to maturity when the Group has the positive intention and ability to hold them until maturity. After initial measurement, held-to-maturity invest-ments are measured at amortized cost using the effective interest method. This method uses an effective interest rate that exactly discounts estimated future cash receipts through the expected life of the financial asset to the net carrying amount of the financial asset. Gains and losses are recognized in the income statement when the investments are derecognized or impaired, as well as through the amortization process. The Group did not have any held-to-maturity investments during the peri-ods under review.
Available-for-sale financial assetsAvailable-for-sale financial assets are non-derivative financial assets that are designated as available-for-sale or are not classi-fied in any of the three preceding categories. After initial measurement, available-for-sale financial assets are measured at fair value with unrealized gains or losses recognized in comprehensive income until the investment is derecognized, at which time the cumulative gain or loss recorded in comprehensive income is reclassified to profit or loss, or determined to be impaired, at which time the cumulative loss recorded in comprehensive income is reclassified to profit or loss.
Panalpina Annual Report 2014
Consolidated Financial Statements 87

3.14.2.2 Impairment of financial assetsFinancial assets are individually assessed for possible impairment at each reporting date. An impairment charge is recorded where there is objective evidence of impairment, such as where the issuer is in bankruptcy, default or other significant financial difficulty. In addition, any available-for-sale equity securities that have a market value of more than 25 percent below their origi-nal cost, net of any previous impairment, will be considered as impaired. Any available-for-sale equity securities that have a market value below their original cost, net of any previous impairment, for a sustained six-month period will also be considered as impaired. Any decreases in the market price of less than 25 percent of original cost, net of any previous impairment, which are also for less than a sustained six-month period are not by themselves considered as objective evidence of impairment. Such movements in fair value are recorded in equity until there is objective evidence of impairment or until the asset is sold or other-wise disposed of. For financial assets carried at amortized cost, any impairment charge is the difference between the carrying value and the recoverable amount, calculated using estimated future cash flows discounted using the original effective interest rate. For available-for-sale financial assets, the original cost, net of any previous impairment charge, is the amount currently car-ried in equity for the difference between the original cost, net of any previous impairment and at fair value. An impairment loss is reversed if the reversal can be related objectively to an event occurring after the impairment loss was recognized. For debt securities that are available-for-sale, the reversal is recognized in income statement. For equity securities held as available-for-sale, the reversal is recognized directly in equity.
For Trade Receivables, an allowance for doubtful accounts is recorded when there is objective evidence that the Group will not be able to collect all amounts due according to the original terms of receivables. Significant financial difficulties of the debtor, probability that the debtor will enter bankruptcy or financial reorganization and default or delinquency in payments (more than 30 days overdue) are considered indicators that the trade receivable is impaired. The amount of the provision is the difference between the asset’s carrying amount and the present value of estimated future cash flows. The carrying amount of the asset is reduced through the use of an allowance account and the amount of the loss is recognized in the income statement within other operating expenses. When a trade receivable is uncollectible, it is written off against the allowance account for trade receiv-ables. Subsequent recoveries of amounts previously written off or 100 percent impaired are credited against operating expenses in the income statement. Trade discounts, volume rebates and similar allowances are recorded on an accrual basis consistent with the recognition of the related sales, using estimates based on existing contractual obligations, historical trends and the Group’s experience. Long-term accounts receivable are discounted to take into account the time value of money.
3.14.2.3 Derecognition of financial assetsA financial asset is derecognized when:
– the Group’s rights to receive cash flows from the asset have expired; or – the Group has transferred its rights to receive cash flows from the asset or has assumed an obligation to pay the received cash flows in full without material delay to a third party under a “pass-through” arrangement; and either (a) the Group has trans-ferred substantially all the risks and rewards of the asset or (b) the Group has neither transferred nor retained substantially all the risks and rewards of the asset, but has transferred control of the asset.
3.14.3 Financial liabilitiesFinancial liabilities are either classified as financial liabilities at fair value through profit or loss or financial liabilities at amortized cost. The Group determines the classification of its financial liabilities at initial recognition. Financial liabilities are recognized ini-tially at fair value and, in the case of loans and borrowings, directly attributable transaction costs. The Group’s financial liabilities include trade and other payables, loans and borrowings and derivative financial instruments.
3.14.3.1 Subsequent measurementFinancial liabilities at fair value through profit or loss include financial liabilities held for trading and financial liabilities designated on initial recognition as at fair value through profit or loss. This category includes derivative financial instruments entered into by the Group. Gains or losses on liabilities at fair value through profit or loss are recognized in the income statement.
3.14.3.2 BorrowingsAfter initial recognition, interest-bearing loans and borrowings are subsequently measured at amortized cost. Any discount between the net proceeds received and the principal value due on redemption is amortized over the duration of the debt instru-ments and is recognized as part of financing costs using the effective interest rate method.
Panalpina Annual Report 2014
Consolidated Financial Statements 88

3.14.3.3 Derecognition of financial liabilitiesFinancial liabilities are derecognized when the obligation under the liability is discharged or cancelled or expired. Where a finan-cial liability is replaced by another from the same lender on substantially different terms, or the terms of an existing liability are substantially modified, such an exchange or modification is treated as a derecognition of the original liability. The recognition of a new liability and the difference in the respective carrying amounts is recognized in the income statement.
3.14.4 DerivativesThe Group holds derivative financial instruments to hedge its foreign currency risk exposures. Derivative financial instruments are ini-tially recognized and subsequently carried at fair value. All changes in fair value are recorded as financial income or financial costs in the period in which they arise. Embedded derivatives are recognized separately if not closely related to the host contract and where the host contract is carried at amortized cost. Attributable transaction costs are recognized in the income statement when incurred. Derivatives are carried as financial assets when the fair value is positive and as financial liabilities when the fair value is negative.
3.14.5 Trade receivablesTrade receivables are carried at the original invoice amount less valuation adjustments for impairment, trade discounts, volume rebates and similar allowances. Subsequently, accounts receivable are measured at amortized cost using the effective interest method.
3.15 UNBILLED FORWARDING SERVICESUnbilled forwarding services represent the gross unbilled amount expected to be collected from customers for forwarding ser-vices in progress for which costs are incurred but not yet invoiced. For logistics projects and other services with a longer period of delivery, recognized profits are included.
3.16 CASH AND CASH EQUIVALENTS AND OTHER CURRENT FINANCIAL ASSETSCash and cash equivalents included in the statement of financial position and statement of cash flows represent cash on hand, bank and postal checks, bills of exchange net, current balance with banks and similar institutions and time deposits and highly liquid money market papers with a maturity period of less than three months from the date of acquisition. Such balances are reported as cash only if they are readily convertible to known amounts of cash and are subject to insignificant risk of change in value.
Other current financial assets include time deposits and highly liquid money market papers with a maturity period of between three months and one year.
3.17 SHARE CAPITALOrdinary shares are classified as equity. Incremental costs directly attributable to the issue of new shares or options are recog-nized in equity as a deduction, net of tax effects, from the proceeds.
3.18 TREASURY SHARESWhen share capital recognized as equity is repurchased, the amount of the consideration paid, which includes directly attribut-able costs, is net of any tax effects and is recognized as a deduction from equity. Repurchased shares are classified as treasury shares and are presented as a deduction from total equity. When treasury shares are sold or reissued subsequently, the amount received is recognized as an increase in equity and the resulting surplus or deficit on the transaction is presented within retained earnings.
3.19 RETAINED EARNINGSRetained earnings contain legal reserves that are not distributable to the shareholders pursuant to Swiss law as well as accumu-lated distributable profits, cumulative remeasurements of the net defined benefit liabilty / asset from post-employment plans net of taxes and the fair value reserve for available-for-sale assets.
3.20 TRANSLATION RESERVEThe translation reserve comprises all foreign currency differences arising from the translation of the financial statements of for-eign operations.
Panalpina Annual Report 2014
Consolidated Financial Statements 89

3.21 PROVISIONSProvisions are recognized where a legal or constructive obligation has been incurred and if an outflow of resources is probable and can be estimated reliably. Provisions are recorded for the estimated ultimate liability that is expected to arise, taking into account the time value of money where material, determined by discounting the expected future cash flows at a pre-tax rate that reflects current market assessments of the time value of money and the risks specific to the liability. The unwinding of the dis-count is recognized as finance cost. Provisions are established in particular for accrued costs of services, freight forwarding claims, short-term employee benefits, termination and other long-term employee benefits and decommissioning provisions. Pro-visions for restructuring are recognized only when the Group has approved a detailed and formal restructuring plan and the restructuring either has commenced or has been announced publicly. Future operating costs are not provided for.
3.22 FAIR VALUEFair value is the price that would be received to sell an asset or paid to transfer a liability in an orderly transaction between mar-ket participants at the measurement date. It is determined by reference to quoted market prices or by the use of established valuation techniques such as option pricing models and the discounted cash flow method if quoted prices in an active market are not available. Valuation tech niques will incorporate observable market data about market conditions and other factors that are likely to affect the fair value of a financial instrument. Valuation techniques are typically used for derivative financial instruments. Information on fair value hierarchy is included in note 17 on risk management.
4 CRITICAL ACCOUNTING ESTIMATES AND JUDGMENTSEstimates and judgments are continually evaluated and are based on historical experience and other factors, including expecta-tions of future events that are believed to be reasonable under the circumstances.
4.1 CRITICAL ACCOUNTING ESTIMATIONS AND ASSUMPTIONSThe Group makes estimates and assumptions concerning the future. The resulting accounting estimates will, by definition, sel-dom equal the related actual results. The estimates and assumptions that have a significant risk of causing a material adjustment to the carrying amounts of assets and liablilities within the next financial year are addressed below.
4.1.1 Impairment of goodwillThe Group tests periodically whether goodwill has suffered any impairment in accordance with the Group’s accounting policy and details are disclosed in note 14 – Intangible assets, section: Impairment test for goodwill. The recoverable amounts of cash- gen-erating units (CGUs) have been determined based on value-in-use calculations. The underlying calculations require the use of estimates.
4.1.2 Pension and other post-employment benefitsThe expense of defined benefit pension plans and other post-employment medical benefits and the present value of the pension obligation are determined using actuarial valuations. The actuarial valuation involves making assumptions about discount rates, future salary increases, mortality rates and future pension increases. All assumptions are reviewed at each reporting date. When determining the appropriate discount rate, management considers the interest rates on high-quality corporate bonds (with an AAA or AA rating) in the respective country and appropriate duration. The mortality rate is based on publicly available mortality tables for the specific country. Future salary increases and pension increases are based on expected future inflation rates for the specific country. The actuarial assumptions used may differ materially from actual results due to changes in market and eco-nomic conditions, higher or lower withdrawal rates, longer or shorter life spans of participants and other changes in the factors assessed. These differences could impact the assets or liabilities recognized in the statement of financial position in future peri-ods. Additional information is disclosed in note 7.
4.1.3 ProvisionsA number of subsidiaries are subject to litigation arising from the normal conduct of their businesses, as a result of which claims could be raised against them.
The Group has established a captive reinsurance company that insures a dedicated risk portion of its errors and omissions, transporter operator and commercial general liability programs. The exposure of its captive reinsurance company is limited by a third-party insurer that covers losses exceeding an amount of CHF 1 million on a single-case basis and a total aggregate limit of CHF 9 million annually for claims exceeding CHF 50,000 per incident. In a consolidated view, the Group, through its captive rein-surance company, bears the risks insured with its captive reinsurance company up to the limit as if such risks were not insured
Panalpina Annual Report 2014
Consolidated Financial Statements 90

at all. Furthermore, as third-party coverage is subject to a considerable deductible and a total aggregated limit per year, the Group, in effect, bears the risk of damages, losses and claims that are above such aggregated limits as well. The Group used for the above-mentioned provision an actuarial calculation method, which requires for the calculation of the “incurred but not reported reserves” (IBNR), among other estimations, the overall circumstances that may impact the future losses, such as the growth of business. At December 31, 2014, the recognized liability for claims amounts to CHF 38.5 million (2013: CHF 40.0 mil-lion). If the management decided to use the optimal actuarial calculation method, which takes into consideration only the linear loss development according to historical figures, the carrying amount of claim provisions would be approximately CHF 7.6 million lower (2013: CHF 3.7 million). Using a more conservative percentile, the carrying amount of claim provisions would be approxi-mately CHF 0.5 million higher (2013: 4.1 million).
The Group is also subject to legal and regulatory proceedings and government investigations in various jurisdictions. These pro-ceedings are related to the area of competition law. Such proceedings may result in criminal or civil sanctions, penalties or damages against the company. Regulatory and legal proceedings, as well as government investigations, involve complex legal issues, the outcome of which is difficult to predict. Accordingly, management’s judgment is affected in determining whether it is more likely or not that such a proceeding will result in an outflow of resources and whether the amount of the obligation can be reliably estimated. These judgments are subject to change as new information becomes available. On resolution of any legal or regulatory proceeding or government investigation, the Group may incur a cash outflow for such matters. It cannot be ruled out that the financial condition or results of operations of the Group will be materially affected. For additional information see note 30.2 – Pending legal claims.
4.1.4 Deferred income tax assetsDeferred tax assets are recognized for unused tax losses to the extent that it is probable that taxable profit will be available against which the losses can be utilized. Significant management judgment is required to determine the amount of deferred tax assets that can be recognized, based on the likely timing and level of future taxable profits.
The carrying value of recognized tax loss carry-forwards amounts to CHF 93.3 million resulting in a tax asset of CHF 30.7 million (2013: CHF 92.6 million resulting in a tax asset of CHF 29.8 million) and unrecognized tax loss carry-forwards to CHF 248.8 mil-lion (2013: 212.4 million). Further details are provided in note 26.
If the Group was able to recognize all unrecognized deferred tax assets, consolidated profit would increase by CHF 71.2 million (2013: CHF 63.3 million). If the Group failed to achieve the expected future taxable profits, the consolidated profit would decrease by CHF 30.7 million (2013 CHF 29.8 million), but the management believes that the full amount of the recognized deferred tax assets are recoverable in the foreseeable future.
4.1.5 Income taxesAt December 31, 2014, the net liability for current income taxes amounts to CHF 25.5 million (2013: CHF 22.4 million). As the Group is subject to income taxes in numerous jurisdictions, significant judgments are required in determining worldwide provi-sions for income taxes.
Some of these estimates are based on interpretations of existing tax laws or regulations. Management believes that the esti-mates are reasonable and that the recognized liabilities for income tax-related uncertainties are adequate. Various external factors may have favorable or unfavorable effects on income taxes. These factors include, but are not limited to, changes in tax law regulations and / or rates, changing interpretation of existing tax laws or regulations and changes in management estima-tions. Such changes that arise could affect the assets and liabilities recognized in the statement of financial position in future periods.
Panalpina Annual Report 2014
Consolidated Financial Statements 91

5 OPERATING SEGMENT INFORMATION Management has determined the operating segments based on the reports reviewed by the Executive Board that are used to make strategic decisions. The Executive Board considers the business from a geographic perspective, as the Group’s operations are predominately managed by geographical location.
The Executive Board assesses performance of the operating segments based on a measure of adjusted operating result (Seg-ment EBIT). This measurement basis excludes the effects on non-recurring expenditure from the operating segments.
2014 (IN THOUSAND CHF) EUROPE
MIDDLE EAST,
AFRICA, CIS AMERICAS
ASIA PACIFIC
TOTAL SEGMENTS
ELIMI- NATIONS
TOTAL GROUP
External forwarding services 3,481,599 674,158 2,592,272 1,424,409 8,172,438 0 8,172,438
Customs and duties (884,397) (143,065) (340,856) (97,007) (1,465,325) (1,465,325)
Intra-group forwarding services 1,208,290 200,825 837,872 1,703,342 3,950,329 (3,950,329) 0
Net forwarding revenue 3,805,492 731,918 3,089,288 3,030,744 10,657,442 (3,950,329) 6,707,113
Forwarding services (3,191,839) (584,793) (2,603,603) (2,691,240) (9,071,475) 3,950,329 (5,121,146)
Gross profit 613,653 147,125 485,685 339,504 1,585,967 0 1,585,967
Personnel expenses (419,877) (81,243) (303,235) (172,495) (976,850) 0 (976,850)
Other operating expenses (167,475) (48,101) (134,425) (85,089) (435,090) 0 (435,090)
Adjusted EBITDA 26,301 17,781 48,025 81,920 174,027 0 174,027
Depreciation and amortization (19,565) (6,610) (16,802) (14,321) (57,298) 0 (57,298)
Adjusted operating result (Segment EBIT) 6,736 11,171 31,223 67,599 116,729 0 116,729
Goodwill impairment 0
Fines 0
Reported operating result (EBIT) 6,736 11,171 31,223 67,599 116,729 116,729
Financial result
Finance income 3,375
Finance costs (4,711)
Profit before income tax (EBT) 115,393
Income tax expenses (28,872)
Consolidated profit 86,521
Information about segment assets and liabilities:
2014 (IN THOUSAND CHF) EUROPE
MIDDLE EAST,
AFRICA, CIS AMERICAS
ASIA PACIFIC
TOTAL OPERAT-
ING SEGMENT
NON- SEGMENT
ASSETS
NON- SEGMENT
LIABILITIESTOTAL
GROUP
Segment assets 505,937 199,056 472,820 334,335 1,512,148 417,584 1,929,732
Segment liabilities 430,717 96,555 226,997 260,082 1,014,351 182,232 1,196,583
Panalpina Annual Report 2014
Consolidated Financial Statements 92

Net forwarding revenue and non-current assets other than financial instruments, deferred tax assets and post-employment ben-efits assets from the country of domicile (Switzerland) and major countries:
2014 (IN THOUSAND CHF)SWITZER-
LAND GERMANY
UNITED STATES OF
AMERICA BRAZIL
REPUBLIC OF
CHINA
Net forwarding revenue 347,796 1,241,431 1,740,482 351,603 1,076,262
Segment non-current assets other than financial instruments, deferred tax assets and post-employment benefits assets 2,588 21,495 8,043 4,475 2,009
2013 (IN THOUSAND CHF) EUROPE
MIDDLE EAST,
AFRICA, CIS AMERICAS
ASIA PACIFIC
TOTAL SEGMENTS
ELIMI- NATIONS
TOTAL GROUP
External forwarding services 3,479,409 702,087 2,633,784 1,359,630 8,174,910 0 8,174,910
Customs and duties (871,942) (127,833) (323,428) (94,075) (1,417,278) 0 (1,417,278)
Intra-group forwarding services 1,366,641 195,591 803,404 1,523,575 3,889,211 (3,889,211) 0
Net forwarding revenue 3,974,108 769,845 3,113,760 2,789,130 10,646,843 (3,889,211) 6,757,632
Forwarding services (3,329,666) (637,374) (2,640,668) (2,478,110) (9,085,818) 3,889,211 (5,196,607)
Gross profit 644,442 132,471 473,092 311,020 1,561,025 0 1,561,025
Personnel expenses (430,110) (82,444) (292,333) (155,145) (960,032) 0 (960,032)
Other operating expenses (183,322) (41,377) (142,421) (73,085) (440,205) 0 (440,205)
Adjusted EBITDA 31,010 8,650 38,338 82,790 160,788 0 160,788
Depreciation and amortization (18,216) (7,193) (15,278) (12,069) (52,756) 0 (52,756)
Adjusted operating result (Segment EBIT) 12,794 1,457 23,060 70,721 108,032 0 108,032
Goodwill impairment (19,112) 0 0 0 (19,112) 0 (19,112)
Fines (40,939) (40,939)
Reported operating result (EBIT) (6,318) 1,457 23,060 70,721 47,981 47,981
Financial result
Finance income 3,959
Finance costs (16,468)
Profit before income tax (EBT) 35,472
Income tax expenses (23,777)
Consolidated profit 11,695
Information about segment assets and liabilities:
2013 (IN THOUSAND CHF) EUROPE
MIDDLE EAST,
AFRICA, CIS AMERICAS
ASIA PACIFIC
TOTAL OPERAT-
ING SEGMENT
NON- SEGMENT
ASSETS
NON- SEGMENT
LIABILITIESTOTAL
GROUP
Segment assets 557,081 211,786 429,536 324,866 1,523,269 426,188 1,949,457
Segment liabilities 379,807 106,253 316,842 239,045 1,041,947 198,329 1,240,276
Panalpina Annual Report 2014
Consolidated Financial Statements 93

Net forwarding revenue and non-current assets other than financial instruments, deferred tax assets and post-employment ben-efits assets from the country of domicile (Switzerland) and major countries:
2013 (IN THOUSAND CHF)SWITZER-
LAND GERMANY
UNITED STATES OF
AMERICA BRAZIL
REPUBLIC OF
CHINA
Net forwarding revenue 780,163 1,261,802 1,752,370 447,390 1,087,482
Segment non-current assets other than financial instruments, deferred tax assets and post-employment benefits assets 2,856 26,131 10,013 5,422 3,051
The Group did not have sales in excess of 10 percent of the total net forwarding revenues to any single external customer in 2013 or 2014.
5.1 INFORMATION BY PRODUCTThe Group’s business can be divided into three products: Air Freight, Ocean Freight and Logistics.
2014 (IN THOUSAND CHF) AIR
FREIGHTOCEAN
FREIGHT LOGISTICS TOTAL
GROUP
External forwarding services 3,700,415 3,659,103 812,920 8,172,438
Customs and duties (558,538) (824,223) (82,564) (1,465,325)
Net forwarding revenue 3,141,877 2,834,880 730,356 6,707,113
Forwarding services from third parties (2,505,627) (2,343,385) (272,134) (5,121,146)
Gross profit 636,250 491,495 458,222 1,585,967
Personnel expenses (366,846) (337,966) (272,038) (976,850)
Other operating expenses (136,274) (120,707) (178,109) (435,090)
Adjusted EBITDA 133,130 32,822 8,075 174,027
Depreciation and amortization (21,097) (19,908) (16,293) (57,298)
Adjusted operating result (Segment EBIT) 112,033 12,914 (8,218) 116,729
Goodwill impairment 0 0 0 0
Fines 0 0 0 0
Reported operating result (EBIT) 112,033 12,914 (8,218) 116,729
Financial result
Finance income 3,375
Finance costs (4,711)
Profit before income tax (EBT) 115,393
Income tax expenses (28,872)
Consolidated profit 86,521
Panalpina Annual Report 2014
Consolidated Financial Statements 94

2013 (IN THOUSAND CHF) AIR
FREIGHTOCEAN
FREIGHT LOGISTICS TOTAL
GROUP
External forwarding services 3,490,122 3,549,223 1,135,565 8,174,910
Customs and duties (434,516) (767,752) (215,010) (1,417,278)
Net forwarding revenue 3,055,606 2,781,471 920,555 6,757,632
Forwarding services from third parties (2,424,170) (2,289,562) (482,875) (5,196,607)
Gross profit 631,436 491,909 437,680 1,561,025
Personnel expenses (350,977) (323,459) (285,596) (960,032)
Other operating expenses (143,122) (122,928) (174,155) (440,205)
Adjusted EBITDA 137,337 45,522 (22,071) 160,788
Depreciation and amortization (18,053) (17,497) (17,206) (52,756)
Adjusted operating result (Segment EBIT) 119,284 28,025 (39,277) 108,032
Goodwill impairment (5,531) (3,005) (10,576) (19,112)
Fines (40,939) 0 0 (40,939)
Reported operating result (EBIT) 72,814 25,020 (49,853) 47,981
Financial result
Finance income 3,959
Finance costs (16,468)
Profit before income tax (EBT) 35,472
Income tax expenses (23,777)
Consolidated profit 11,695
6 PERSONNEL EXPENSES
IN THOUSAND CHF 2014 2013
Wages and salaries 754,200 748,411
Compulsory social security contributions 98,654 94,258
Contributions to defined contribution plans 53,364 52,702
Expenses related to defined benefit plans (note 7) 9,506 4,559
Staff training 6,175 7,338
Share-based compensation (note 8)
Equity-settled compensation plan 1,937 702
Cash-settled compensation plan 754 0
Other personnel-related expenses 52,260 52,062
Total personnel expenses 976,850 960,032
Number of employees (headcount on December 31) 15,639 16,010
thereof in Switzerland 682 754
Panalpina Annual Report 2014
Consolidated Financial Statements 95

7 POST-EMPLOYMENT BENEFIT OBLIGATIONSPanalpina’s objective is to provide attractive post-employment benefits to employees, while at the same time ensuring that the various plans are appropriately financed, while managing any potential impacts on the Group’s long-term financial position. The nature of such plans varies according to legal regulations and fiscal requirements in the countries in which the employees are employed. Other post-employment benefits consist mostly of post-retirement schemes. Post-employment benefit plans are clas-sified for IFRS as “defined contribution plans” if the Group pays fixed contributions in a separate fund or to a third-party financial institution and will have no further legal or constructive obligation to pay further contributions. All other plans are classified as defined benefit plans.
7.1 DEFINED BENEFIT PLANS Plans are usually established as trusts independent of the Group and are funded by payments from the Group and by employees. In some cases, notably for the defined benefit plans in Germany and Japan, the plans are unfunded and the Group pays pensions to retired employees directly from its own financial resources.
Qualified independent actuaries carry out valuations on a regular basis within the reporting period for major plans. For funded plans, which are usually trusts independent of the Group’s finances, the net defined pension liability / (asset) recognized in the Group’s statement of financial position corresponds to the over- / underfunding of the plan. For unfunded plans, where the Group meets the pension obligations directly from its own financial resources, a liability for the defined benefit obligation is recorded in the Group’s statement of financial position. Pension assets and liabilities in different defined benefit plans are not offset.
The Group’s defined benefit plans are located in Switzerland, Germany, Japan, Taiwan, France and Korea. The largest plans are in Switzerland followed by Germany. The Swiss pension plans account for 99 percent (2013: 99 percent) of the Group’s total plan assets and 81 percent (2013: 81 percent) of its defined benefit obligation.
7.1.1 Pension plans in Switzerland Pension plans are governed by the Swiss Federal Law on Occupational Retirement, Survivors’ and Disability Pension Plans (“BVG”), which stipulates that pension plans are to be managed by independent, legally autonomous units. Pension plans are overseen by a regulator and by a state supervisory body. The pension plan’s most senior governing body (Board of Trustees) must be composed of equal numbers of employee and employer representatives.
The defined benefit obligations are based on old age, disability and survivors benefits that include the legally required benefits. The various benefits are governed in regulations, with the BVG specifying the minimum benefits that are to be provided. The plan is contribution-based with a guaranteed minimum interest rate on old age savings and a mandatory conversion rate to define the level of the old age pension. The disability and survivors benefits are defined as a percentage of the insured salary. Both employer and employee pay contributions to the plan. Statutory minimum funding requirements exist. In case of underfunding, various measures can be taken such as the adjustment of the pension commitment by altering the conversion rate or increasing current contributions. The employer can also make additional restructuring contributions. The BVG prescribes how employees and employer have to jointly fund potential restructurings. Actuarial risks include both demographic (primarily life expectancy and disability) and financial risks (primarily discount rate, future increases in salaries and wages and the actual return on plan assets) and are regularly assessed by the Board of Trustees. The plans include certain features that share the benefits of a surplus or the cost of a deficit between the employer and the employees.
The Board of Trustees is responsible for the investment of the assets. It regularly defines and reassesses the investment strategy as deemed appropriate and necessary – especially in the case of significant market developments or changes to the structure of the plan participants – and at least annually. When defining the investment strategy, it takes into account the fund’s objectives, benefit obligations and risk capacity. The investment strategy is defined in the form of a long-term target asset structure (invest-ment policy). The Board of Trustees delegates the implementation of the investment policy – in accordance with the investment strategy as well as various principles and objectives – to an Investment Committee, which consists of members of the Board of Trustees.
Panalpina Annual Report 2014
Consolidated Financial Statements 96

7.2 MOVEMENT IN THE DEFINED BENEFIT OBLIGATION (DBO)
IN THOUSAND CHF 2014 2013
Changes in defined benefit obligation (DBO)
DBO at beginning of year (273,535) (290,693)
Included in profit or loss
Current service cost (8,791) (9,802)
Past service (costs) / gains 456 6,980
Interest expenses (6,241) (5,805)
(14,576) (8,627)
Included in OCI
Remeasurement gains / (losses)
– Actuarial gains / (losses) from:
demographic assumptions 91 700
financial assumptions (32,830) 9,642
experience adjustments (3,479) 3,870
Currency impact 47 (171)
(36,172) 14,041
Other
Employee contributions (6,493) (6,365)
Benefits paid 23,068 18,109
16,575 11,744
DBO at end of year (307,708) (273,535)
Represented by
Swiss plans (248,575) (222,041)
Other plans (59,133) (51,494)
(307,708) (273,535)
Panalpina Annual Report 2014
Consolidated Financial Statements 97

7.3 MOVEMENT IN THE PLAN ASSETS
IN THOUSAND CHF 2014 2013
Changes in fair value of plan assets
Fair value of plan assets at beginning of year 243,766 231,706
Included in profit or loss
Interest income 5,070 4,068
5,070 4,068
Included in OCI
Remeasurement gains / (losses)
Return on plan assets, excluding amounts included in interest income 15,749 12,081
Currency impact 103 (60)
15,852 12,021
Other
Employer contributions 7,026 6,971
Employee contributions 6,493 6,365
Benefits paid (20,706) (17,365)
(7,187) (4,029)
Fair value of plan assets at end of year 257,501 243,766
Represented by
Swiss plans 255,208 241,666
Other plans 2,293 2,100
257,501 243,766
7.4 MOVEMENT IN THE NET DEFINED BENEFIT (LIABILITY) / ASSET
IN THOUSAND CHF 2014 2013
Changes in net defined benefit (liability) / asset
Balance at beginning of year (29,769) (58,987)
Net impact included in profit or loss (9,506) (4,559)
Net impact included in OCI (20,320) 26,062
Net impact other 9,388 7,715
Balance at end of year (50,207) (29,769)
Split into
Post-employment benefit assets 6,862 19,905
Post-employment benefit liabilities (57,069) (49,674)
(50,207) (29,769)
Panalpina Annual Report 2014
Consolidated Financial Statements 98

7.5 PLAN ASSETS
IN THOUSAND CHF 2014 2014 2013 2013
Major categories of plan assets
Cash and cash equivalents 2,868 1.11 % 2,119 0.87 %
Equity investments 97,389 37.82 % 84,026 34.47 %
Equities Switzerland 18,775 7.29 % 17,497 7.18 %
Equities Global 66,126 25.68 % 55,483 22.76 %
Equities Emerging Markets 12,488 4.85 % 11,046 4.53 %
Bonds 113,216 43.97 % 122,676 50.33 %
Swiss Bonds (CHF) 45,996 17.86 % 47,388 19.44 %
Non-Swiss Bonds (CHF) 31,079 12.07 % 39,041 16.02 %
Non-Swiss Bonds (Foreign Currency) 36,141 14.04 % 36,247 14.87 %
Investment funds 0 0.00 % 0 0.00 %
Hedge funds and private equity 0 0.00 % 0 0.00 %
Real estate funds Switzerland 37,130 14.42 % 29,006 11.90 %
Others 6,898 2.68 % 5,939 2.44 %
Total 257,501 100.00 % 243,766 100.00 %
Equity investments, bonds and real estate funds have quoted market prices in active markets.
7.6 DEFINED BENEFIT OBLIGATION (DBO) 7.6.1 Actuarial assumptions
Actuarial assumptions are unbiased and mutually compatible estimates of variables that determine the ultimate cost of provid-ing past employment benefits. They are set on an annual basis by local management and actuaries and are subject to approval by corporate management. Actuarial assumptions consist of demographic assumptions on matters such as mortality and employee turnover and financial assumptions on matters such as salary and benefit level as well as discount rates. The Group operates defined benefit plans in many countries and the actuarial assumptions vary based on local economic and social conditions.
Demographic assumptionsThe most significant demographic assumptions relate to mortality rates. The Group’s actuaries use mortality tables that take into account historic patterns and expected changes, such as further increases in longevity. The mortality tables used for the major
schemes are:
Switzerland BVG 2010 Generation table
Germany tables 2005 G from Klaus Heubeck
France table INSEE TV / TD 2008 / 2010
Rates of employee turnover, disability and early retirement are based on historical behavior within the Group companies.
Panalpina Annual Report 2014
Consolidated Financial Statements 99

Financial assumptionsThese are based on market expectations for the period over which the obligations are to be settled. The assumptions used in the actuarial valuations with stable currencies and interest are shown below (expressed as weighted averages):
2014 2013
Discount rate 1.25 % 2.35 %
Future salary increase 1.16 % 1.92 %
Future pension increase 0.77 % 1.14 %
Discount rates are determined with reference to market yields on high-quality corporate bonds. Expected rates of salary increases are based on the latest expectation and historical behavior within Group entities.
At December 31, 2014, the weighted average duration of the DBO was 15.0 years (2013: 13.6 years). The Group expects to pay CHF 7.1 million in contributions in 2015.
DBO relating to the Swiss plansAt December 31, 2014, the duration of the DBO of CHF 248.6 million (2013: CHF 222.0 million) was approximately 14.6 years (2013: approximately 12.9 years). 615 active members (2013: 658) and 207 pensioners (2013: 198) were included in the 2014 actuarial valuation of the DBO.
DBO relating to the German plansAt December 31, 2014, the duration of the DBO of CHF 50.5 million (2013: CHF 43.8 million) was approximately 18 years (2013: approximately 18 years) related to 743 (2013: 811) active members (DBO of CHF 21.5 million, 2013 CHF 18.7 million), to 498 (2013: 457) deferred members (DBO of CHF 10.7 million, 2013: CHF 8.7 million) and to 217 (2013: 203) pensioners (DBO of CHF 18.3 million, 2013: CHF 16.4 million).
7.6.2 Sensitivity analysisReasonably possible changes at the reporting date to the one of the relevant actuarial assumptions, holding other assumptions constant, would have affected the defined benefit obligation by the amounts shown below:
2014 IN THOUSAND CHFINCREASE
OF DBO
DE-CREASE OF DBO
Discount rate (change of 0.3 %) 11,259 (10,398)
Future salary increase (change of 0.5 %) 2,951 (2,739)
Future pension increase (change of 0.25 %) 7,535 (7,134)
2013 IN THOUSAND CHFINCREASE
OF DBO
DE-CREASE OF DBO
Discount rate (change of 0.3 %) 7,449 (7,101)
Future salary increase (change of 0.5 %) 1,776 (1,804)
Future pension increase (change of 0.25 %) 3,967 (3,801)
Panalpina Annual Report 2014
Consolidated Financial Statements 100

8 SHARE AND OPTION OWNERSHIP PROGRAMThe Group operates several share and option ownership programs. The members of the Board of Directors, the members of the Executive Board and selected preferential employees were able to voluntarily participate in the share and option ownership pro-gram introduced in 2005 and continued in a modified program in the following years.
8.1 MANAGEMENT INCENTIVE PROGRAM IV (MIP IV)The remaining unexercized options expired during the period under review.
8.2 MANAGEMENT INCENTIVE PLAN 08 / 09 (MIP 08 / 09)In June 2009, the Group introduced the Management Incentive Program 08/09. Participants in this program had the right to pur-chase shares at a discounted share price that equals 75 percent of the closing price of one share at the SIX Swiss Exchange on April 30, 2009. The difference between the discounted share price on the grant date and the share price paid by the participants is recognized as personnel expenses on the date of the issue of the shares. The shares are subject to a one-year lock-up period. For every purchased share under this plan, the Group granted one option free of charge to the par ticipant. The options have a contractual term of six years and a vesting period of one to three years. Each option entitles the participant to obtain one share of Panalpina World Transport (Holding) Ltd. at a predetermined strike price (exercise price of option). The share options cannot be settled in cash. The program is also divided into an “International Management Incentive Plan” and a “United States Manage-ment Incentive Plan”. Beneficiaries of the “United States Management Incentive Plan” are selected preferential employees of the subsidiary in the US and members of the Board of Directors with residence in the US. The conditions of this plan do not differ from those of the “International Management Incentive Plan” except for the exercise price. The exercise price of options of the “International Management Incentive Plan” is equal to the closing price of one share at the SIX Swiss Exchange on April 30, 2009. The exercise price of options of the “United States Management Incentive Plan” is equal to the share price at the SIX Swiss Exchange on the grant date. Participants in the “International Management Incentive Plan IV” subscribed for 65,921 options with a strike price of CHF 61.25. Participants in the “United States Management Incentive Plan IV” subscribed for 5,132 options with a strike price of CHF 81.35.
8.3 MANAGEMENT INCENTIVE PLAN 09 / 10 (MIP 09 / 10)In 2010 an additional management incentive plan was set up. Apart from the strike price of the “International Management Incentive Plan”, which equals the closing price of the share on the cut-off day at the SIX Swiss Exchange, the terms of this share and option program are identical to the Management Incentive Program 08 / 09. Under this program participants of the “Inter-national Management Incentive Plan” received 12,099 options with a strike price of CHF 95.65 and participants of the “United States Management Plan” received 1,354 options with a strike price of CHF 87.75.
The following table summarizes the movements in the number of share options outstanding and their related average exercise prices:
2014 2013
AVERAGE EXERCISE
PRICE PER SHARE
(IN CHF)
OPTIONS
(NUMBER)
AVERAGE EXERCISE
PRICE PER SHARE
(IN CHF)
OPTIONS
(NUMBER)
Options outstanding on January 1 102.27 23,558 126.74 97,650
Exercised 109.31 (7,315) 90.52 (41,248)
Forfeited 0.00 0 95.65 (45)
Expired 128.18 (8,017) 189.91 (32,799)
Options outstanding on December 31 70.76 8,226 102.27 23,558
Options exercisable on December 31 70.76 8,226 102.27 23,558
Panalpina Annual Report 2014
Consolidated Financial Statements 101
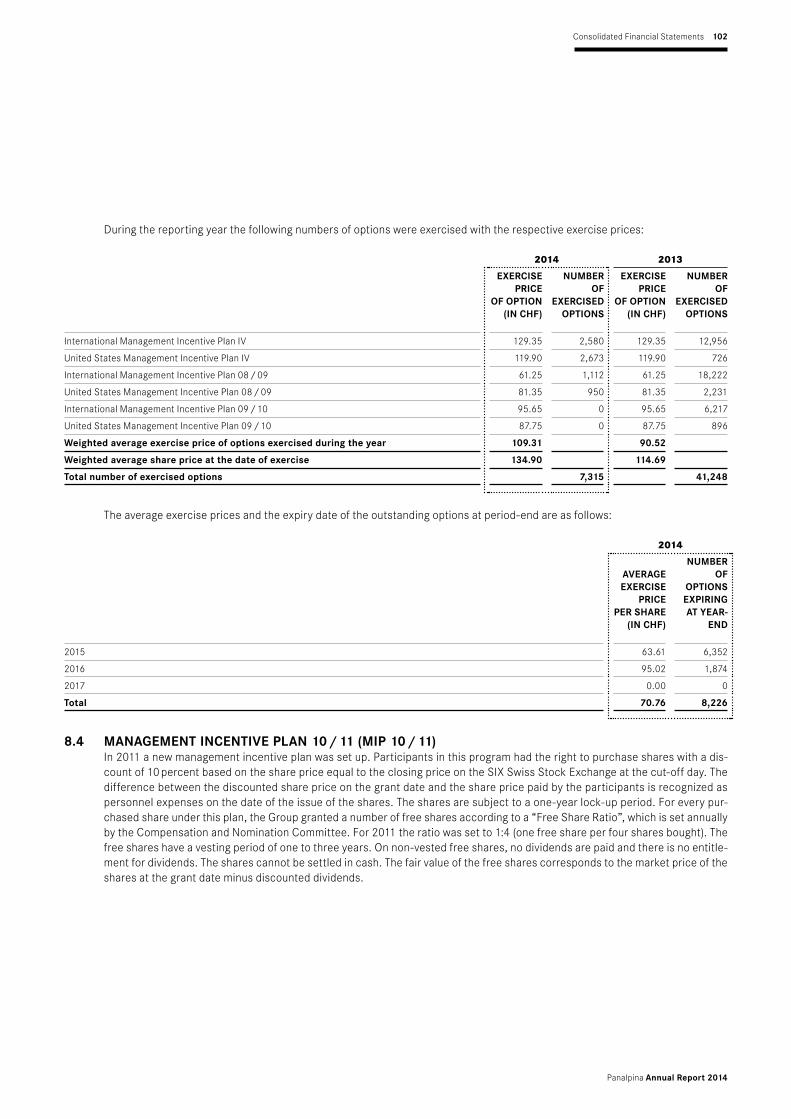
During the reporting year the following numbers of options were exercised with the respective exercise prices:
2014 2013
EXERCISE PRICE
OF OPTION (IN CHF)
NUMBER OF
EXERCISED OPTIONS
EXERCISE PRICE
OF OPTION (IN CHF)
NUMBER OF
EXERCISED OPTIONS
International Management Incentive Plan IV 129.35 2,580 129.35 12,956
United States Management Incentive Plan IV 119.90 2,673 119.90 726
International Management Incentive Plan 08 / 09 61.25 1,112 61.25 18,222
United States Management Incentive Plan 08 / 09 81.35 950 81.35 2,231
International Management Incentive Plan 09 / 10 95.65 0 95.65 6,217
United States Management Incentive Plan 09 / 10 87.75 0 87.75 896
Weighted average exercise price of options exercised during the year 109.31 90.52
Weighted average share price at the date of exercise 134.90 114.69
Total number of exercised options 7,315 41,248
The average exercise prices and the expiry date of the outstanding options at period-end are as follows:
2014
AVERAGE EXERCISE
PRICE PER SHARE
(IN CHF)
NUMBER OF
OPTIONS EXPIRING AT YEAR-
END
2015 63.61 6,352
2016 95.02 1,874
2017 0.00 0
Total 70.76 8,226
8.4 MANAGEMENT INCENTIVE PLAN 10 / 11 (MIP 10 / 11)In 2011 a new management incentive plan was set up. Participants in this program had the right to purchase shares with a dis-count of 10 percent based on the share price equal to the closing price on the SIX Swiss Stock Exchange at the cut-off day. The difference between the discounted share price on the grant date and the share price paid by the participants is recognized as personnel expenses on the date of the issue of the shares. The shares are subject to a one-year lock-up period. For every pur-chased share under this plan, the Group granted a number of free shares according to a “Free Share Ratio”, which is set annually by the Compensation and Nomination Committee. For 2011 the ratio was set to 1:4 (one free share per four shares bought). The free shares have a vesting period of one to three years. On non-vested free shares, no dividends are paid and there is no entitle-ment for dividends. The shares cannot be settled in cash. The fair value of the free shares corresponds to the market price of the shares at the grant date minus discounted dividends.
Panalpina Annual Report 2014
Consolidated Financial Statements 102

2014 MANAGE-
MENT INCENTIVE
PLAN 10/11
2013 MANAGE-
MENT INCENTIVE
PLAN 10/11
Outstanding free shares on January 1 1,406 3,339
Granted free shares 0 0
Vested free shares (1,406) (1,649)
Forfeited free shares 0 (284)
Free shares outstanding on December 31 0 1,406
8.5 MANAGEMENT INCENTIVE PLAN 11 / 12 (MIP 11 / 12)Conditions are identical with the management incentive plan 10 / 11.
2014 MANAGE-
MENT INCENTIVE
PLAN 11/12
2013 MANAGE-
MENT INCENTIVE
PLAN 11/12
Outstanding free shares on January 1 1,627 2,562
Granted free shares 0 0
Vested free shares (817) (901)
Forfeited free shares (22) (34)
Free shares outstanding on December 31 788 1,627
8.6 MANAGEMENT INCENTIVE PLAN 12 / 13 (MIP 12 / 13)Conditions are identical with the management incentive plan 10 / 11.
2014 MANAGE-
MENT INCENTIVE
PLAN 12/13
2013 MANAGE-
MENT INCENTIVE
PLAN 12/13
Outstanding free shares on January 1 1,698 0
Granted free shares 0 1,698
Vested free shares (610) 0
Forfeited free shares 0 0
Free shares outstanding on December 31 1,088 1,698
8.7 MANAGEMENT INCENTIVE PLAN 13 / 14 (MIP 13 / 14)Conditions are identical with the management incentive plan 10 / 11 except for the ratio of free shares granted for a certain amount of purchased shares, which was set for the MIP 13 / 14 to 1:3 (one free share per three shares bought) by the Compen-sation and Nomination Committee.
Panalpina Annual Report 2014
Consolidated Financial Statements 103
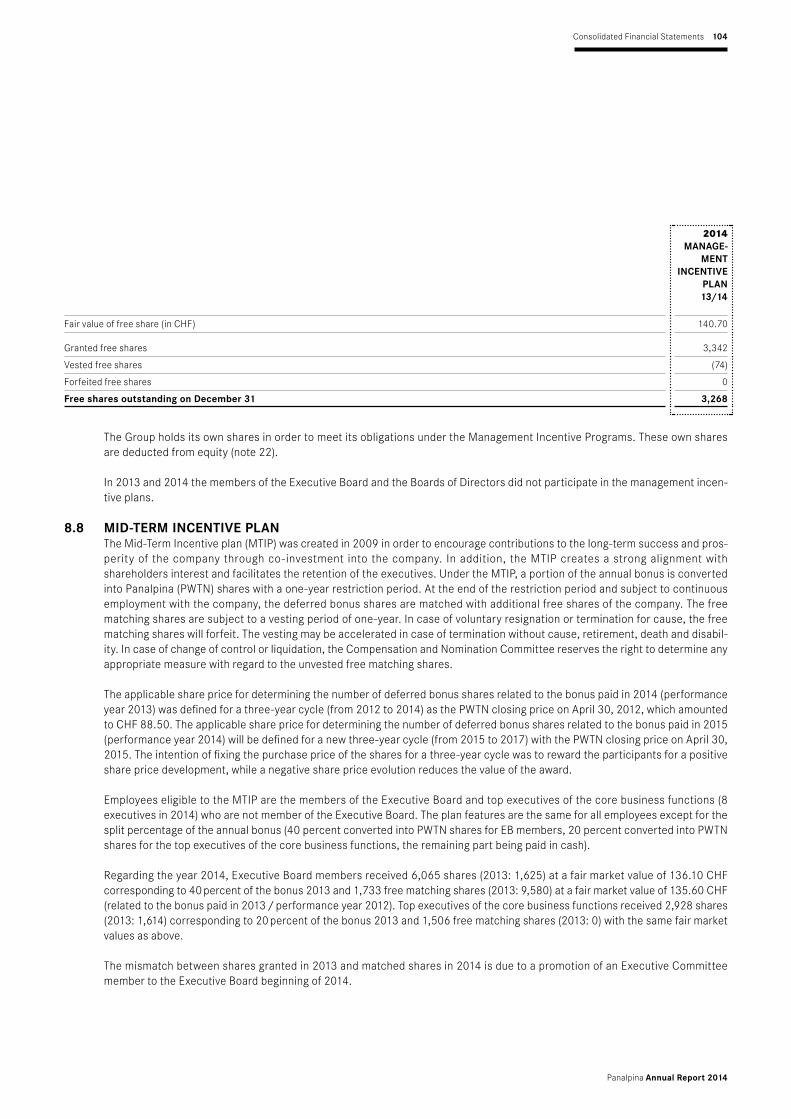
2014 MANAGE-
MENT INCENTIVE
PLAN 13/14
Fair value of free share (in CHF) 140.70
Granted free shares 3,342
Vested free shares (74)
Forfeited free shares 0
Free shares outstanding on December 31 3,268
The Group holds its own shares in order to meet its obligations under the Management Incentive Programs. These own shares are deducted from equity (note 22).
In 2013 and 2014 the members of the Executive Board and the Boards of Directors did not participate in the management incen-tive plans.
8.8 MID-TERM INCENTIVE PLANThe Mid-Term Incentive plan (MTIP) was created in 2009 in order to encourage contributions to the long-term success and pros-perity of the company through co-investment into the company. In addition, the MTIP creates a strong alignment with shareholders interest and facilitates the retention of the executives. Under the MTIP, a portion of the annual bonus is converted into Panalpina (PWTN) shares with a one-year restriction period. At the end of the restriction period and subject to continuous employment with the company, the deferred bonus shares are matched with additional free shares of the company. The free matching shares are subject to a vesting period of one-year. In case of voluntary resignation or termination for cause, the free matching shares will forfeit. The vesting may be accelerated in case of termination without cause, retirement, death and disabil-ity. In case of change of control or liquidation, the Compensation and Nomination Committee reserves the right to determine any appropriate measure with regard to the unvested free matching shares.
The applicable share price for determining the number of deferred bonus shares related to the bonus paid in 2014 (performance year 2013) was defined for a three-year cycle (from 2012 to 2014) as the PWTN closing price on April 30, 2012, which amounted to CHF 88.50. The applicable share price for determining the number of deferred bonus shares related to the bonus paid in 2015 (performance year 2014) will be defined for a new three-year cycle (from 2015 to 2017) with the PWTN closing price on April 30, 2015. The intention of fixing the purchase price of the shares for a three-year cycle was to reward the participants for a positive share price development, while a negative share price evolution reduces the value of the award.
Employees eligible to the MTIP are the members of the Executive Board and top executives of the core business functions (8 executives in 2014) who are not member of the Executive Board. The plan features are the same for all employees except for the split percentage of the annual bonus (40 percent converted into PWTN shares for EB members, 20 percent converted into PWTN shares for the top executives of the core business functions, the remaining part being paid in cash).
Regarding the year 2014, Executive Board members received 6,065 shares (2013: 1,625) at a fair market value of 136.10 CHF corresponding to 40 percent of the bonus 2013 and 1,733 free matching shares (2013: 9,580) at a fair market value of 135.60 CHF (related to the bonus paid in 2013 / performance year 2012). Top executives of the core business functions received 2,928 shares (2013: 1,614) corresponding to 20 percent of the bonus 2013 and 1,506 free matching shares (2013: 0) with the same fair market values as above.
The mismatch between shares granted in 2013 and matched shares in 2014 is due to a promotion of an Executive Committee member to the Executive Board beginning of 2014.
Panalpina Annual Report 2014
Consolidated Financial Statements 104

8.9 LONG-TERM INCENTIVE PLANThe Long-Term Incentive Plan rewards long-term value creation measured by economic profit. Under this plan, which has a five-year cycle, the individual Executive Board member and top executive of the core business functions is entitled to a proportion of the respective pool after the expiry of the five-year plan period. This plan can be cash-settled. The carrying amount of the liabil-ity at December 31, 2014, amounts to CHF 1,131 thousand (2013: CHF 377 thousand), which is also the intrinsic value. Based on a decision of the Compensation and Nomination Committee (CNC) this plan was discontinued so that the liabilty will remain con-stant until payout in 2018.
8.10 LONG-TERM PERFORMANCE SHARE UNIT (PSU) PLANAs of January 1, 2014, the members of the Executive Board and top executives of the core business functions (8 executives in 2014) participate in a new Long-Term Incentive Plan in form of Performance Share Units (PSU). The purpose of the PSU plan is to motivate executives to contribute to the long-term success and prosperity of the company and to encourage them to create shareholder value and at the same time to facilitate the retention of the executives. The PSUs will be delivered through an annual rolling grant with a cliff vesting after 3 years, dependent on the achievement of the Total Shareholder Return (TSR) which will be measured against a peer group of (25) companies, which consists of a balanced selection of companies within our industry tak-ing into consideration amongst other factors, market capitalization, turnover and geographic distribution. The performance period related to the 2014 PSU grant started on January 1, 2014 and will end on December 31, 2016. The cumulative TSR over the full three year performance period will be measured against the peer group and correlate into in the PSU vesting curve.
During the year 2014, 11,650 PSUs were granted to the Executive Board members and 9,800 to top executives of the core busi-ness functions. The present value per PSU at grant date amounted to 101.35 CHF (assuming median TSR performance versus peer group) versus a market value at grant date of 139.80 CHF.
8.11 BOARD OF DIRECTORS RESTRICTED STOCK AWARD PLANThe Restricted Stock Award Plan for the Board of Directors was introduced in 2009. Part of the remuneration of each Board member is settled in free shares of the Company. The corresponding number of shares per member will be based on the share’s closing price at the assignment date. The shares have a one-year restriction period. During the period under review the Board of Directors received 2,534 shares (2013: 0).
8.12 COSTS OF SHARE-BASED COMPENSATIONRecognized costs of share-based compensation were as follows:
IN TCHF 2014 2013
Employee share plan 1,937 780
Option plan 0 (79)
Total cost of share-based payments 1,937 702
Panalpina Annual Report 2014
Consolidated Financial Statements 105

9 OTHER OPERATING EXPENSES
IN THOUSAND CHF 2014 2013
Communication expenses 33,137 34,178
IT expenses 51,009 42,061
Facility and utilities expenses 151,385 150,012
Leased equipments 8,263 8,343
Maintenance and repair expenses 31,254 34,158
Cars and motor vehicles expenses 27,756 29,402
Travel and promotion expenses 32,311 38,784
Administrative expenses 58,031 62,208
Insurance expenses and claims 18,875 19,315
Bad-debt and collection expenses 10,943 8,044
Gains on sales of property, plant and equipment (1,452) (2,265)
Losses on sales of property, plant and equipment 1,965 1,285
Other 11,613 14,680
Total other operating expenses 435,090 440,205
Bad-debt and collection expenses include CHF 0.8 million (2013: CHF 1.0 million) of credit insurance premiums.
Panalpina Annual Report 2014
Consolidated Financial Statements 106

10 FINANCE INCOME AND COSTS
IN THOUSAND CHF 2014 2013
Interest income
Interest income on current bank accounts 1,970 2,290
Interest income on financial assets at fair value through profit or loss 9 7
Interest income on loans 0 1
Cash discount income 66 397
Subtotal interest income 2,045 2,695
Exchange differences 1,035 0
Dividend on available-for-sale financial assets 141 510
Fair value adjustments on financial assets 11 754
Other financial income 143 0
Total finance income 3,375 3,959
Interest expenses
Interest expenses on loans (104) (112)
Interest expenses on current bank accounts (689) (854)
Interest expenses on financial leasing (36) (34)
Cash discount expenses (283) (497)
Subtotal interest expenses (1,112) (1,497)
Bank charges (2,320) (2,663)
Exchange differences 0 (10,584)
Guarantee fees expenses (900) (950)
Other financial expenses (376) (774)
Impairment on financial assets (3) 0
Total finance costs (4,711) (16,468)
Net finance costs (1,336) (12,509)
Panalpina Annual Report 2014
Consolidated Financial Statements 107

11 INCOME TAX EXPENSES
IN THOUSAND CHF 2014 2013
Current income taxes
Current period 31,819 32,384
Adjustments for prior periods (1,692) (2,599)
Total current income taxes 30,127 29,785
Deferred income taxes (note 26)
Origination and reversal of taxes on temporary differences and on tax loss carry-forwards 228 (4,307)
Effect of changes in the tax rate on temporary differences 1,073 793
Utilization of non-recognized tax loss carry-forwards (2,556) (2,494)
Total deferred income taxes (1,254) (6,008)
Total income tax expenses 28,872 23,777
Management decided to calculate the applicable standard tax rate as in the previous year based on the standard tax rate in Basel, its headquarters’ domicile.
The Group’s effective tax charge can be reconciled to the Group’s expected charge as follows:
IN THOUSAND CHF 2014 2013
Profit before income tax 115,393 35,472
Tax at the applicable tax rate of 22.18 % (2013: 22.48 %) 25,594 7,974
Effective national tax rates (799) 8,284
Utilization of not yet recognized tax loss carry-forwards (2,556) (2,494)
Not yet recognized tax loss carry-forwards 9,170 8,123
Adjustment of previous year tax provision (1,692) (2,599)
Effect of changes in the tax rate on temporary differences 1,073 793
Withholding tax on dividends received 1,264 341
Expenses not deductible for tax purposes and not taxable income (388) 259
Miscellaneous (2,795) 3,096
Actual tax charge 28,872 23,777
Income tax recognized in other comprehensive income is as follows:
2014 2013
IN THOUSAND CHF
BEFORE TAX
TAX BENEFIT
(EXPENSE)
NET OF TAX
BEFORE TAX
TAX BENEFIT
(EXPENSE)
NET OF TAX
Remeasurement of the net defined asset / liability (20,470) 5,099 (15,371) 26,293 (6,349) 19,944
Available-for-sale financial assets 0 0 0 349 (116) 233
Exchange differences on translation of foreign operations 2,442 0 2,442 (23,159) 0 (23,159)
Total (18,028) 5,099 (12,929) 3,483 (6,465) (2,982)
Panalpina Annual Report 2014
Consolidated Financial Statements 108

12 EARNINGS PER SHARE12.1 BASIC EARNINGS PER SHARE
Basic earnings per share is calculated by dividing the profit attributable to ordinary shareholders of the company by the weighted average number of ordinary shares outstanding (total shares less treasury shares) during the period.
IN THOUSAND CHF 2014 2013
Consolidated profit attributable to owners of the parent 87,241 11,862
Weighted average number of ordinary shares outstanding 23,730 23,680
Basic earnings per share (in CHF) 3.68 0.50
12.2 DILUTED EARNINGS PER SHAREDiluted earnings per share is calculated by adjusting the weighted average number of ordinary shares outstanding to assume conversion of all dilutive potential ordinary shares. The Group has only share options and free shares outstanding that can be cat-egorized as dilutive potential ordinary shares. For the share options, a calculation is made to determine the number of shares that could have been issued at fair value based on the monetary value of the subscription rights attached to outstanding share options. The number of shares calculated as above is com pared with the number of shares that would have been issued assum-ing the exercise of the share options.
IN THOUSAND CHF 2014 2013
Consolidated profit attributable to owners of the parent 87,241 11,862
Weighted average number of ordinary shares outstanding 23,730 23,680
Adjustments for share options 7 2
Adjustments for share ownership program 14 8
Weighted average number of ordinary shares for diluted earnings per share 23,751 23,690
Diluted earnings per share (in CHF) 3.67 0.50
At December 31, 2014, 0 options (2013: 13,270 options) were excluded from the diluted weighted average number of ordinary shares calculation as their effect would have been anti-dilutive.
Panalpina Annual Report 2014
Consolidated Financial Statements 109

13 PROPERTY, PLANT AND EQUIPMENT
2014 (IN THOUSAND CHF)
LAND AND BUILDINGS
MACHI-NERY AND
EQUIP-MENT
VEHICLES
CON-STRUC- TION IN
PROGRESS
TOTAL
Acquisition costs
Balance on January 1 146,420 234,221 34,543 0 415,184
Translation differences 2,546 2,927 1,133 0 6,606
Additions 5,320 12,486 1,684 0 19,490
Disposals and deletions (17,446) (37,522) (3,934) 0 (58,902)
Reclassifications (54) 54 0 0 0
Balance on December 31 136,786 212,166 33,426 0 382,378
Accumulated depreciation
Balance on January 1 83,730 185,537 27,009 0 296,276
Translation differences 1,812 2,602 1,178 0 5,592
Additions 8,232 21,508 2,232 0 31,972
Disposals and deletions (16,542) (35,457) (3,746) 0 (55,745)
Reclassifications (30) 30 0 0 0
Balance on December 31 77,202 174,220 26,673 0 278,095
Net book value on January 1 62,690 48,684 7,534 0 118,908
Net book value on December 31 59,584 37,946 6,753 0 104,283
Of which net book value of assets acquired under finance leases 150 4 442 0 596
2013 (IN THOUSAND CHF)
LAND AND BUILDINGS
MACHI-NERY AND
EQUIP-MENT
VEHICLES
CON-STRUC- TION IN
PROGRESS
TOTAL
Acquisition costs
Balance on January 1 144,508 238,079 37,948 2,327 422,862
Translation differences (4,167) (6,790) (946) (217) (12,120)
Additions 5,439 17,062 3,545 1,615 27,661
Disposals and deletions (2,033) (14,948) (6,010) (228) (23,219)
Reclassifications 2,673 818 6 (3,497) 0
Balance on December 31 146,420 234,221 34,543 0 415,184
Accumulated depreciation
Balance on January 1 79,853 182,903 29,897 0 292,653
Translation differences (2,028) (6,039) (815) 0 (8,882)
Additions 7,760 23,306 3,212 0 34,278
Disposals and deletions (1,842) (14,645) (5,286) 0 (21,773)
Reclassifications (13) 12 1 0 0
Balance on December 31 83,730 185,537 27,009 0 296,276
Net book value on January 1 64,655 55,176 8,051 2,327 130,209
Net book value on December 31 62,690 48,684 7,534 0 118,908
Of which net book value of assets acquired under finance leases 191 13 550 0 754
Panalpina Annual Report 2014
Consolidated Financial Statements 110

14 INTANGIBLE ASSETS
2014 (IN THOUSAND CHF) GOODWILL SOFTWARE
BRANDS / CUSTOMER
LISTS
OTHER INTANGI-
BLE ASSETS
TOTAL
Acquisition costs
Balance on January 1 81,297 139,226 36,450 854 257,827
Translation differences 552 750 0 (14) 1,288
Additions 0 28,587 0 5 28,592
Disposals and deletions 0 (20,024) 0 (14) (20,038)
Balance on December 31 81,849 148,539 36,450 831 267,669
Accumulated amortization and impairment losses
Balance on January 1 36,990 65,489 36,450 805 139,734
Translation differences (75) 676 0 (14) 587
Additions 0 25,289 0 36 25,326
Disposals and deletions 0 (20,010) 0 4 (20,006)
Balance on December 31 36,915 71,444 36,450 831 145,640
Net book value on January 1 44,307 73,737 0 49 118,093
Net book value on December 31 44,934 77,095 0 0 122,029
2013 (IN THOUSAND CHF) GOODWILL SOFTWARE
BRANDS / CUSTOMER
LISTS
OTHER INTANGI-
BLE ASSETS
TOTAL
Acquisition costs
Balance on January 1 83,726 120,144 39,039 937 243,846
Translation differences (2,429) (1,339) (2,589) (101) (6,458)
Additions 0 22,141 0 18 22,159
Disposals and deletions 0 (1,720) 0 0 (1,720)
Balance on December 31 81,297 139,226 36,450 854 257,827
Accumulated amortization and impairment losses
Balance on January 1 19,925 51,947 37,086 753 109,711
Translation differences (2,047) (1,252) (2,453) (95) (5,847)
Additions 0 16,514 1,817 147 18,478
Impairment losses 19,112 0 0 0 19,112
Disposals and deletions 0 (1,720) 0 0 (1,720)
Balance on December 31 36,990 65,489 36,450 805 139,734
Net book value on January 1 63,801 68,197 1,953 184 134,135
Net book value on December 31 44,307 73,737 0 49 118,093
The net book value of software comprises accumulated, internally generated, capitalized software development costs of CHF 66.9 million (2013: CHF 49.2 million). All intangible assets with estimable useful lives are amortized over the period of their respective estimated useful lives to their estimated residual values and reviewed for impairment. In the fourth quarter of the pre-
Panalpina Annual Report 2014
Consolidated Financial Statements 111

vious year, management decided to discontinue certain activities in Norway. As a result (as volume and profitability were expected to significantly decrease), a goodwill impairment charge of CHF 19.1 million was recognized in 2013. During the period under review the Group did not recognize any goodwill impairment charge.
IMPAIRMENT TEST FOR GOODWILLGoodwill is allocated to the Group’s cash-generating units (CGUs) identified according to the country of operation. The recover-able amount of a CGU is determined based on value-in-use calculations. These calculations use cash flow projections based on financial budgets ap proved by management covering a five-year period. The management determined budgeted growth rates based on past performance and its expectations of market development. Cash flows beyond the five-year period are extrapo-lated using the estimated terminal growth rates stated below. The growth rate does not exceed the long-term average growth rate for the business in which the CGU operates.
The weighted average cost of capital (WACC) used is pre-tax and reflects specific risks relating to the relevant CGUs.
A summary of the goodwill allocation per CGU is presented below:
IN THOUSAND CHF 2014 2013
Air Freight division (CGU Airfreight) / various countries 31,018 31,018
Others 13,916 13,289
Grampian International Freight Aberdeen & Beverwijk (CGU Grampian) / United Kingdom 6,762 6,456
Panalpina World Transport (Singapore) Pte. Ltd. (CGU Janco) / Singapore 4,101 3,852
Panalpina World Transport (Pty) Ltd. (CGU Australia) / Australia 3,053 2,981
Total goodwill 44,934 44,307
The following key assumptions have been used for the value-in-use calculations of each CGU:
2014
CGU AIR-
FREIGHT OTHERS
Basis for recoverable amount value in use value in use
Pre-tax discount rate applied to the cash flow projections 7.17 %8.98 % – 10.19 %
Projection period 5 years 5 years
Terminal growth rate 3.00 %3.00 % –
3.50 %
2013
CGU AIR-
FREIGHT OTHERS
Basis for recoverable amount value in use value in use
Pre-tax discount rate applied to the cash flow projections 7.91 %8.39 % - 12.84 %
Projection period 5 years 5 years
Terminal growth rate 1.00 %1.60 % - 2.20 %
Panalpina Annual Report 2014
Consolidated Financial Statements 112

Management considers that it is not likely for the assumptions used to change so significantly, as to eliminate the excess of recoverable amounts. A sensitivity analysis for CGU Airfreight has been prepared with the following outcome:
Amount of excess (+) / necessary impairment (–) in thousand CHF depending on discount and growth rate
DISCOUNT RATE
CGU AIRFREIGHT 7.17 % 12.17 % 17.17 % 22.17 %
Growth rate
0.00 % 1,725,700 918,444 583,923 401,859
1.00 % 2,047,831 1,023,232 635,147 432,085
2.00 % 2,494,897 1,148,734 693,183 465,345
3.00 % 3,156,866 1,301,730 759,474 502,115
15 INVESTMENTS AND OTHER CURRENT FINANCIAL ASSETS
IN THOUSAND CHF 2014 2013
Available-for-sale investments 1,855 2,280
Fair value through profit or loss investments 401 1,040
Loans receivable 221 203
Long-term receivables 17,490 18,787
Other 8,302 6,039
Total investments 28,269 28,349
Fair value through profit or loss investments 0 5,472
Total other current financial assets 0 5,472
Long-term receivables primarily include rental and guarantee deposits.
15.1 AVAILABLE-FOR-SALE INVESTMENTS – UNQUOTED EQUITY SHARES
IN THOUSAND CHF 2014 2013
Balance on January 1 2,280 2,025
Translation differences (227) (197)
Additions 0 103
Disposals (196) 0
Fair value adjustments recognized in profit or loss (Impairment) (3) 0
Fair value adjustments recognized in other comprehensive income 0 349
Fair value adjustments reclassified to profit or loss 0 0
Balance on December 31 1,854 2,280
Less: non-current portion 1,854 2,280
Current portion 0 0
Panalpina Annual Report 2014
Consolidated Financial Statements 113
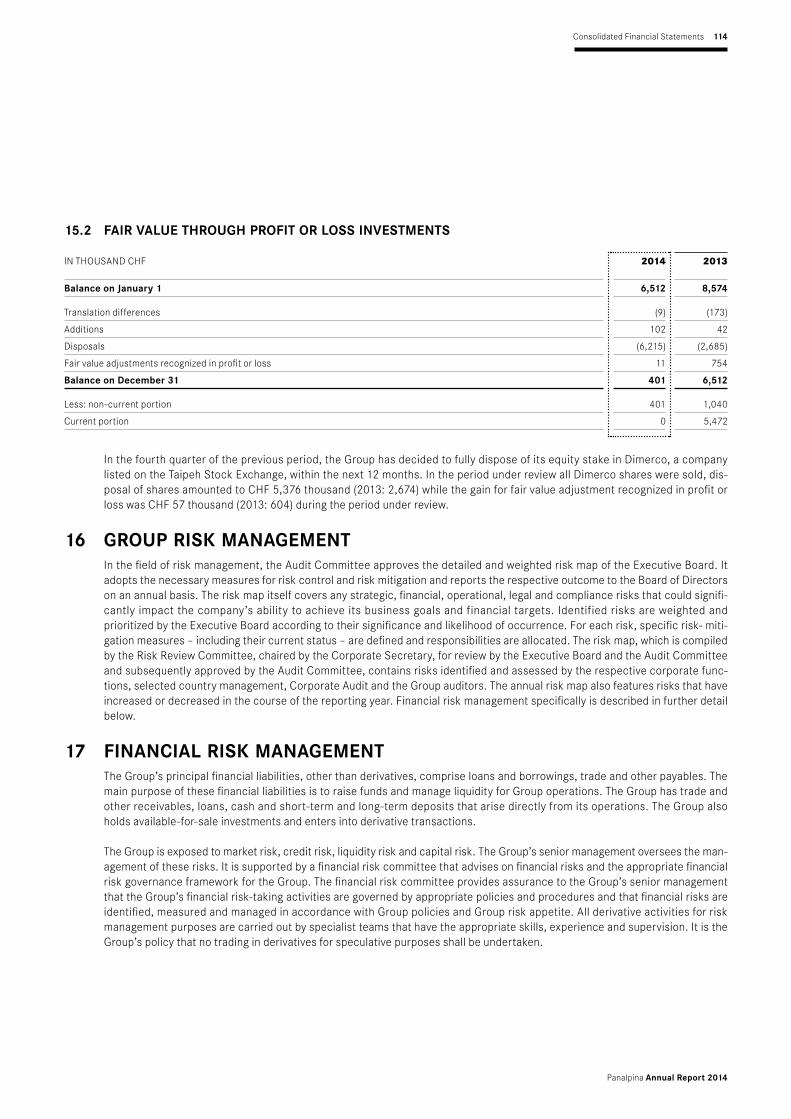
15.2 FAIR VALUE THROUGH PROFIT OR LOSS INVESTMENTS
IN THOUSAND CHF 2014 2013
Balance on January 1 6,512 8,574
Translation differences (9) (173)
Additions 102 42
Disposals (6,215) (2,685)
Fair value adjustments recognized in profit or loss 11 754
Balance on December 31 401 6,512
Less: non-current portion 401 1,040
Current portion 0 5,472
In the fourth quarter of the previous period, the Group has decided to fully dispose of its equity stake in Dimerco, a company listed on the Taipeh Stock Exchange, within the next 12 months. In the period under review all Dimerco shares were sold, dis-posal of shares amounted to CHF 5,376 thousand (2013: 2,674) while the gain for fair value adjustment recognized in profit or loss was CHF 57 thousand (2013: 604) during the period under review.
16 GROUP RISK MANAGEMENTIn the field of risk management, the Audit Committee approves the detailed and weighted risk map of the Executive Board. It adopts the necessary measures for risk control and risk mitigation and reports the respective outcome to the Board of Directors on an annual basis. The risk map itself covers any strategic, financial, operational, legal and compliance risks that could signifi-cantly impact the company’s ability to achieve its business goals and financial targets. Identified risks are weighted and prioritized by the Executive Board according to their significance and likelihood of occurrence. For each risk, specific risk- miti-gation measures – including their current status – are defined and responsibilities are allocated. The risk map, which is compiled by the Risk Review Committee, chaired by the Corporate Secretary, for review by the Executive Board and the Audit Committee and subsequently approved by the Audit Committee, contains risks iden tified and assessed by the respective corporate func-tions, selected country management, Corporate Audit and the Group auditors. The annual risk map also features risks that have increased or decreased in the course of the reporting year. Financial risk management specifically is described in further detail below.
17 FINANCIAL RISK MANAGEMENTThe Group’s principal financial liabilities, other than derivatives, comprise loans and borrowings, trade and other payables. The main purpose of these financial liabilities is to raise funds and manage liquidity for Group operations. The Group has trade and other receivables, loans, cash and short-term and long-term deposits that arise directly from its operations. The Group also holds available-for-sale investments and enters into derivative transactions.
The Group is exposed to market risk, credit risk, liquidity risk and capital risk. The Group’s senior management oversees the man-agement of these risks. It is supported by a financial risk committee that advises on financial risks and the appropriate financial risk governance framework for the Group. The financial risk committee provides assurance to the Group’s senior management that the Group’s financial risk-taking activities are governed by appropriate policies and procedures and that financial risks are identified, measured and managed in accor dance with Group policies and Group risk appetite. All derivative activities for risk management purposes are carried out by specialist teams that have the appropriate skills, experience and supervision. It is the Group’s policy that no trading in derivatives for speculative purposes shall be undertaken.
Panalpina Annual Report 2014
Consolidated Financial Statements 114

The Board of Directors reviews and agrees on policies for managing each of these risks, which are summarized below.
17.1 FINANCIAL RISK FACTORSCarrying amount and fair value of financial assets by asset classes
2014 (IN THOUSAND CHF) CASH
AVAI-LABLE-
FOR-SALE
FAIR VALUE
THROUGH PROFIT OR
LOSS HELD FOR
TRADING
LOANS AND
RECEI-VABLES
CARRYING AMOUNT
TOTAL (FAIR
VALUE)
Trade receivables and other receivables 1,039,798 1,039,798 1,039,798
Unbilled forwarding services 111,486 111,486 111,486
Accrued interest income 72 72 72
Cash and cash equivalents 306 371,737 372,043 372,043
Derivative financial instruments 2,960 2,960 2,960
Investments:
Bonds and debentures 401 401 401
Shares 1,854 0 1,854 1,854
Third-party loans 221 221 221
Rental and guarantee deposits 17,490 17,490 17,490
Other 8,230 8,230 8,230
Total on December 31, 2014 306 1,854 3,361 1,549,033 1,554,555 1,554,555
2014 (IN THOUSAND CHF)
FINANCIAL LIABILITIES
AT FAIR VALUE
THROUGH PROFIT
OR LOSS
FINANCIAL LIABILITIES MEASURED
AT AMOR-TIZED COST
CARRYING AMOUNT
TOTAL (FAIR
VALUE)
Payables and accruals 897,534 897,534 897,534
Borrowings 346 346 346
Finance lease liabilities 307 307 307
Derivative financial instruments 7,988 7,988 7,988
Total on December 31, 2014 7,988 898,187 906,175 906,175
Panalpina Annual Report 2014
Consolidated Financial Statements 115

2013 (IN THOUSAND CHF) CASH
AVAI-LABLE-
FOR-SALE
FAIR VALUE
THROUGH PROFIT OR
LOSS HELD FOR
TRADING
LOANS AND
RECEI-VABLES
CARRYING AMOUNT
TOTAL (FAIR
VALUE)
Trade receivables and other receivables 1,082,783 1,082,783 1,082,783
Unbilled forwarding services 91,192 91,192 91,192
Accrued interest income 32 32 32
Cash and cash equivalents 619 336,304 336,923 336,923
Derivative financial instruments 2,905 2,905 2,905
Investments:
Bonds and debentures 448 448 448
Shares 2,280 6,064 8,344 8,344
Third-party loans 203 203 203
Rental and guarantee deposits 18,787 18,787 18,787
Other 6,039 6,039 6,039
Total on December 31, 2013 619 2,280 9,417 1,535,340 1,547,656 1,547,656
2013 (IN THOUSAND CHF)
FINANCIAL LIABILITIES
AT FAIR VALUE
THROUGH PROFIT
OR LOSS
FINANCIAL LIABILITIES MEASURED
AT AMOR-TIZED COST
CARRYING AMOUNT
TOTAL (FAIR
VALUE)
Payables and accruals 913,701 913,701 913,701
Borrowings 2,834 2,834 2,834
Finance lease liabilities 427 427 427
Derivative financial instruments 1,710 1,710 1,710
Total on December 31, 2013 1,710 916,962 918,672 918,672
Panalpina Annual Report 2014
Consolidated Financial Statements 116
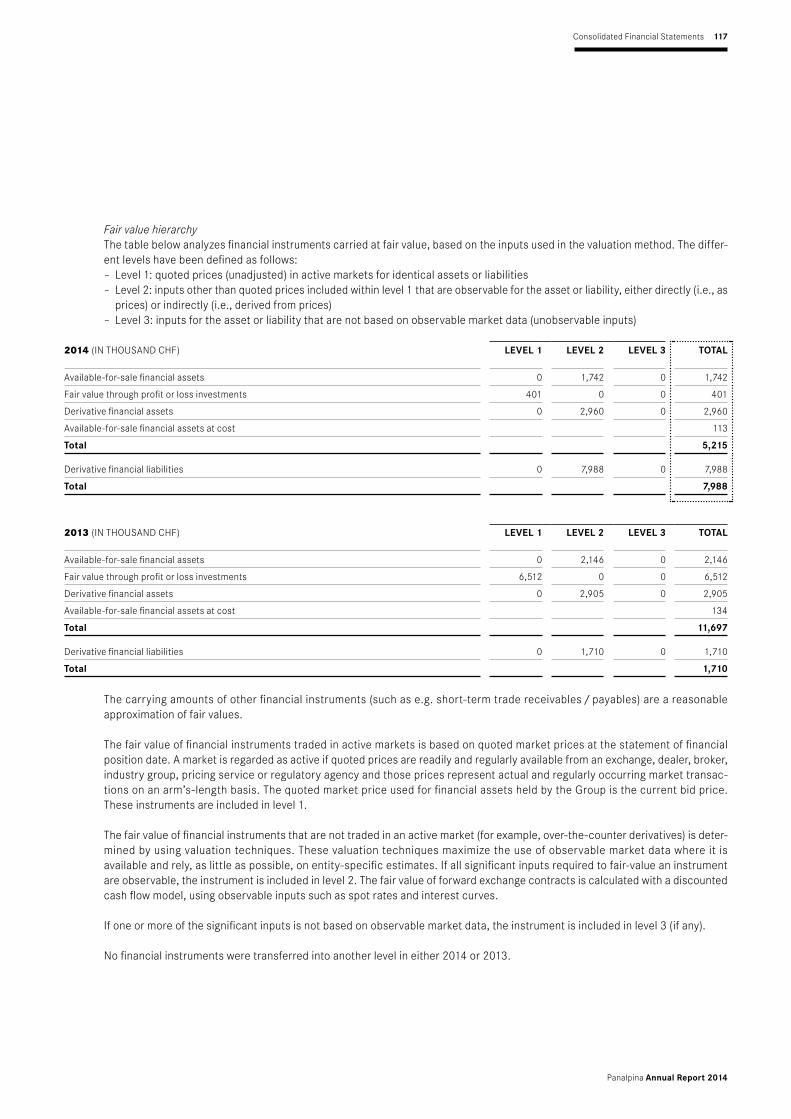
Fair value hierarchyThe table below analyzes financial instruments carried at fair value, based on the inputs used in the valuation method. The differ-ent levels have been defined as follows:
– Level 1: quoted prices (unadjusted) in active markets for identical assets or liabilities – Level 2: inputs other than quoted prices included within level 1 that are observable for the asset or liability, either directly (i.e., as prices) or indirectly (i.e., derived from prices)
– Level 3: inputs for the asset or liability that are not based on observable market data (unobservable inputs)
2014 (IN THOUSAND CHF) LEVEL 1 LEVEL 2 LEVEL 3 TOTAL
Available-for-sale financial assets 0 1,742 0 1,742
Fair value through profit or loss investments 401 0 0 401
Derivative financial assets 0 2,960 0 2,960
Available-for-sale financial assets at cost 113
Total 5,215
Derivative financial liabilities 0 7,988 0 7,988
Total 7,988
2013 (IN THOUSAND CHF) LEVEL 1 LEVEL 2 LEVEL 3 TOTAL
Available-for-sale financial assets 0 2,146 0 2,146
Fair value through profit or loss investments 6,512 0 0 6,512
Derivative financial assets 0 2,905 0 2,905
Available-for-sale financial assets at cost 134
Total 11,697
Derivative financial liabilities 0 1,710 0 1,710
Total 1,710
The carrying amounts of other financial instruments (such as e.g. short-term trade receivables / payables) are a reasonable approximation of fair values.
The fair value of financial instruments traded in active markets is based on quoted market prices at the statement of financial position date. A market is regarded as active if quoted prices are readily and regularly available from an exchange, dealer, broker, industry group, pricing service or regulatory agency and those prices represent actual and regularly occurring market transac-tions on an arm’s-length basis. The quoted market price used for financial assets held by the Group is the current bid price. These instruments are included in level 1.
The fair value of financial instruments that are not traded in an active market (for example, over-the-counter derivatives) is deter-mined by using valuation techniques. These valuation techniques maximize the use of observable market data where it is available and rely, as little as possible, on entity-specific estimates. If all significant inputs required to fair-value an instrument are observable, the instrument is included in level 2. The fair value of forward exchange contracts is calculated with a discounted cash flow model, using observable inputs such as spot rates and interest curves.
If one or more of the significant inputs is not based on observable market data, the instrument is included in level 3 (if any).
No financial instruments were transferred into another level in either 2014 or 2013.
Panalpina Annual Report 2014
Consolidated Financial Statements 117
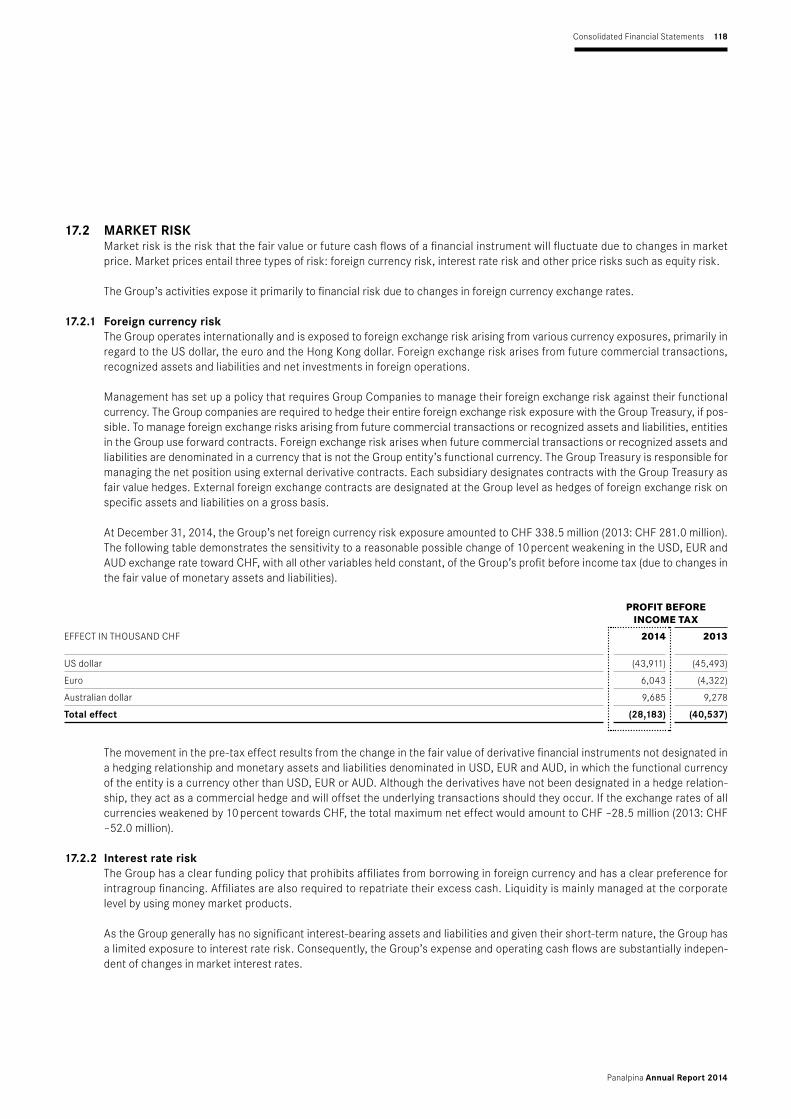
17.2 MARKET RISKMarket risk is the risk that the fair value or future cash flows of a financial instrument will fluctuate due to changes in market price. Market prices entail three types of risk: foreign currency risk, interest rate risk and other price risks such as equity risk.
The Group’s activities expose it primarily to financial risk due to changes in foreign currency exchange rates.
17.2.1 Foreign currency riskThe Group operates internationally and is exposed to foreign exchange risk arising from various currency exposures, primarily in regard to the US dollar, the euro and the Hong Kong dollar. Foreign exchange risk arises from future commercial transactions, recognized assets and liabilities and net investments in foreign operations.
Management has set up a policy that requires Group Companies to manage their foreign exchange risk against their functional currency. The Group companies are required to hedge their entire foreign exchange risk exposure with the Group Treasury, if pos-sible. To manage foreign exchange risks arising from future commercial transactions or recognized assets and liabilities, entities in the Group use forward contracts. Foreign exchange risk arises when future commercial transactions or recognized assets and liabilities are denominated in a currency that is not the Group entity’s functional currency. The Group Treasury is responsible for managing the net position using external derivative contracts. Each subsidiary designates contracts with the Group Treasury as fair value hedges. External foreign exchange contracts are designated at the Group level as hedges of foreign exchange risk on specific assets and liabilities on a gross basis.
At December 31, 2014, the Group’s net foreign currency risk exposure amounted to CHF 338.5 million (2013: CHF 281.0 million). The following table demonstrates the sensitivity to a reasonable possible change of 10 percent weakening in the USD, EUR and AUD exchange rate toward CHF, with all other variables held constant, of the Group’s profit before income tax (due to changes in the fair value of monetary assets and liabilities).
PROFIT BEFORE INCOME TAX
EFFECT IN THOUSAND CHF 2014 2013
US dollar (43,911) (45,493)
Euro 6,043 (4,322)
Australian dollar 9,685 9,278
Total effect (28,183) (40,537)
The movement in the pre-tax effect results from the change in the fair value of derivative financial instruments not designated in a hedging relationship and monetary assets and liabilities denominated in USD, EUR and AUD, in which the functional currency of the entity is a cur rency other than USD, EUR or AUD. Although the derivatives have not been designated in a hedge relation-ship, they act as a commercial hedge and will offset the underlying transactions should they occur. If the exchange rates of all currencies weakened by 10 percent towards CHF, the total maximum net effect would amount to CHF –28.5 million (2013: CHF –52.0 million).
17.2.2 Interest rate riskThe Group has a clear funding policy that prohibits affiliates from borrowing in foreign currency and has a clear preference for intragroup financing. Affiliates are also required to repatriate their excess cash. Liquidity is mainly managed at the corporate level by using money market products.
As the Group generally has no significant interest-bearing assets and liabilities and given their short-term nature, the Group has a limited exposure to interest rate risk. Consequently, the Group’s expense and operating cash flows are substantially indepen-dent of changes in market interest rates.
Panalpina Annual Report 2014
Consolidated Financial Statements 118

17.3 CREDIT RISKCredit risk is the risk that a counterparty will not meet its obligations under a financial instrument or customer contract, leading to a finan cial loss. The Group is exposed to credit risk from its operating activities (primarily for trade receivables) and from its investing activities, including deposits with banks and other financial institutions, foreign exchange transactions and other finan-cial instruments.
Credit risk related to trade receivablesCustomer credit is managed by each business unit and subject to the Group’s established policy, procedures and control relat-ing to cus tomer credit risk management. Credit limits are established for all customers based on external ratings or, if not available, according to internal rating criteria. The customer’s credit quality is assessed based on an extensive credit rating scorecard. Outstanding customer receivables are regularly monitored. The objective of the management of trade receivables is to sustain the growth and profitability of the Group by optimizing asset utilization while maintaining risks at an acceptable level. There is no significant concentration of counterparty credit risk due to the Group’s large number of customers and their wide geographical spread. Risk limits and exposures are continuously monitored by country and by the nature of counterparties. Addi-tionally, the Group obtains credit insurance and similar enhancements when appropriate to protect the collection of trade receivables.
Credit risk related to financial instruments and cash deposit Credit risk from balances with banks and financial institutions is managed by the Group Treasury in accordance with the Group’s policy. Investments of surplus funds are made only with approved counterparties and with credit limits assigned to each coun-terparty with a minimum rating of A. Counterparty credit limits are reviewed by senior management on a regular basis. The limits are set to minimize the concentra tion of risks and therefore mitigate financial loss through potential counterparty failure.
The table below shows the Group’s maximum exposure to credit risk:
IN THOUSAND CHF 2014 2013
Cash and cash equivalents (without cash in hand) 371,737 336,305
Derivative financial instruments 2,960 2,905
Trade receivables and other receivables 1,113,839 1,206,666
Loans and other financial assets 26,494 31,565
Total financial assets shown in statement of financial position subject to credit risk 1,515,028 1,577,441
Guarantees 355,755 527,058
Total credit risk 1,870,783 2,104,499
17.4 LIQUIDITY RISKLiquidity risk is the risk that the Group will not be able to meet its financial obligations as they become due. The Group’s approach to managing liquidity is to ensure, to the extent possible, that it will always have sufficient liquidity to meet its liabilities when due, under both normal and stressed conditions, without incurring unacceptable losses or risking damage to the Group’s reputation.
The Group’s objective is to maintain a balance between continuity of funding and flexibility through the use of overdrafts, bank loans, finance leases and hire purchase contracts. The Group’s liquidity is reported to the management on a monthly basis.
To secure liquidity, the Group holds a net cash position of CHF 371.4 million (2013: CHF 339.1 million) and credit lines with vari-ous finan cial institutions totaling CHF 538.4 million (2013: CHF 535.1 million). Of this total, CHF 214.1 million (2013: CHF 209.8 million) is allocated to bank guarantees and foreign exchange lines.
Panalpina Annual Report 2014
Consolidated Financial Statements 119

The table below summarizes the maturity profile of the Group’s financial liabilities at December 31 based on contractual un discounted payments.
2014 (IN THOUSAND CHF)
BETWEEN
1 AND 3 MONTHS
BETWEEN 3 MONTHS
AND 1 YEAR
BETWEEN
1 AND 5 YEARS
TOTAL RE-MAINING
CONTRAC-TUAL
PAYMENTS
Borrowings (note 24) 58 462 132 652
Trade and other payables 497,245 110,002 607,248
Accruals 244,639 45,632 0 290,271
Other liabilities 21,123 56,964 0 78,086
Foreign exchange contracts
Cash inflow 230,428 11,583 0 242,011
Cash outflow (411,603) (81,534) 0 (493,137)
Total 581,890 143,109 132 725,131
2013 (IN THOUSAND CHF)
BETWEEN 1 AND 3
MONTHS
BETWEEN 3 MONTHS
AND 1 YEAR
BETWEEN 1 AND 5
YEARS
TOTAL RE-MAINING
CONTRAC-TUAL
PAYMENTS
Borrowings (note 24) 2,333 720 208 3,261
Trade and other payables 517,633 128,857 3,807 650,297
Accruals 217,229 16,891 29,285 263,405
Provisions and other liabilities 38,479 10,698 0 49,177
Foreign exchange contracts
Cash inflow 364,895 57,803 0 422,698
Cash outflow (233,429) (31,354) 0 (264,783)
Total 907,140 183,615 33,300 1,124,055
17.5 CAPITAL RISK MANAGEMENTThe Group’s objectives when managing capital are to safeguard its ability to continue as a going concern in order to provide returns for shareholders and benefits for other stakeholders and to maintain an optimal capital structure to reduce the cost of capital. In order to maintain or adjust the capital structure, the Group may adjust the amount of dividends paid to shareholders, return capital to shareholders, issue new shares or sell assets to reduce debts. Capital is monitored on the basis of the equity ratio, which is calculated as equity (including non-controlling interests) as a percentage of total assets. This is reported to the management as part of the Group’s regular internal management reporting.
The Group’s capital and equity ratio is shown in the table below:
IN THOUSAND CHF 2014 2013
Capital and reserves attributable to Panalpina shareholders 720,904 697,508
Equity attributable to non-controlling interests 12,245 11,673
Total equity 733,149 709,181
Total assets 1,929,732 1,949,457
Equity ratio 38.0 % 36.4 %
The Group is not subject to regulatory capital adequacy requirements.
Panalpina Annual Report 2014
Consolidated Financial Statements 120

18 OTHER RECEIVABLES AND OTHER CURRENT ASSETS
IN THOUSAND CHF 2014 2013
Taxes (VAT, withholding tax) 53,129 51,876
Accrued income 2,485 5,625
Accrued interest income 72 32
Personnel advances 2,703 3,348
Social security and payroll taxes 1,046 915
Prepaid rent expenses 7,061 4,075
Prepaid communication and IT expenses 395 5,960
Supplier rebates 27,072 22,168
Short-term loans 79 1,033
Others 7,149 7,639
Total other receivables and other current assets 101,191 102,671
19 TRADE RECEIVABLES
IN THOUSAND CHF 2014 2013
Commercial clients 1,034,099 1,073,743
Agents 12,031 12,674
Total trade receivables (gross values) 1,046,130 1,086,417
Individual allowance (156) (400)
Overall allowance (33,327) (26,435)
Total trade receivables (net) 1,012,647 1,059,582
Europe 377,801 421,882
thereof European Union and Rest of Europe 342,088 379,181
thereof Switzerland 35,713 42,701
Middle East, Africa, CIS 103,073 124,206
Americas 333,829 326,609
Asia Pacific 197,944 186,885
Total trade receivables (net) 1,012,647 1,059,582
There is no concentration of credit risk with regard to trade receivables, as the Group has a large number of customers that are dispersed internationally.
Panalpina establishes its overall allowance for doubtful trade receivables based on its historical loss experiences. Significant financial difficulties of the debtor are individually impaired. The maximum exposure to credit risk on the reporting date is the car-rying amount of net trade receivables mentioned above. Based on past experience, the Group does not anticipate writing off not-past-due or unprovided trade receivables. The creation and usage of provisions for impaired trade receivables have been included in other operating expenses in the income statement.
Panalpina Annual Report 2014
Consolidated Financial Statements 121

The following table summarizes the movement in the provision for impairment of trade receivables:
IN THOUSAND CHF 2014 2013
Balance as of January 1 26,835 25,848
Receivables written off during the year as uncollectible (4,041) (5,107)
Changes in provision for doubtful accounts 10,689 6,094
Balance as of December 31 33,483 26,835
The following table provides details about the aging of trade receivables that are not overdue, as the payment terms specified in the terms and conditions established with Panalpina customers have not been exceeded and as an analysis of overdue amounts and related provisions for doubtful trade receivables:
IN THOUSAND CHF 2014 2013
Commercial clients 1,034,099 1,073,743
Agents 12,031 12,674
Total trade receivables (gross values) 1,046,130 1,086,417
Allowance for bad debt (33,483) (26,835)
Total trade receivables (net) 1,012,647 1,059,582
of which:
Not overdue 774,659 759,857
Past due not more than 30 days 177,758 194,805
Past due more than 30 days up to 180 days 94,556 117,559
Past due more than 180 days up to 360 days 23,655 16,417
Past due more than 360 days 14,245 12,105
Prepayment (38,743) (14,326)
Total trade receivables (gross) 1,046,130 1,086,417
Allowance for bad debt (33,483) (26,835)
Total trade receivables (net) 1,012,647 1,059,582
Panalpina Annual Report 2014
Consolidated Financial Statements 122

20 DERIVATIVE FINANCIAL INSTRUMENTS
CONTRACT VALUE
POSITIVE REPLACEMENT VALUE
NEGATIVE REPLACEMENT VALUE
IN THOUSAND CHF 2014 2013 2014 2013 2014 2013
Forward foreign exchange contracts 722,823 685,792 2,960 2,905 (7,988) (1,710)
Forward trading hedges 722,823 685,792 2,960 2,905 (7,988) (1,710)
CONTRACT VALUE
POSITIVE REPLACEMENT VALUE
NEGATIVE REPLACEMENT VALUE
IN THOUSAND CHF 2014 2013 2014 2013 2014 2013
Terms of the forward foreign exchange contracts 722,823 685,792 2,960 2,905 (7,988) (1,710)
0 - 3 months 683,858 597,384 2,960 2,420 (7,911) (1,070)
4 - 12 months 38,966 88,408 0 485 (78) (640)
Derivative financial instruments are spread over the following currencies:
FORWARD FOREIGN EXCHANGE CONTRACTS
IN THOUSAND CHF 2014 2013
EUR 362,733 367,738
USD 119,095 95,642
CNY 70,912 35,355
HKD 40,726 41,920
CHF 35,405 30,413
MXN 23,431 25,707
VND 8,033 8,571
KRW 7,497 6,510
TWD 6,911 7,095
MYR 6,399 5,176
BRL 5,558 0
NOK 4,395 729
SEK 3,472 6,191
CAD 3,124 7,611
SGD 2,839 12,142
CZK 2,818 4,182
GBP 2,775 1,249
CLP 2,529 3,823
PEN 2,367 2,621
TRY 2,121 7,343
UYU 2,112 1,166
PLN 1,813 886
AUD 1,700 2,370
Other 4,058 11,354
Total 722,823 685,792
Panalpina Annual Report 2014
Consolidated Financial Statements 123

ISDA Master AgreementsThe Group enters into derivative transactions with several counterparties under International Swaps and Derivatives Association (ISDA) master agreements. The ISDA agreements do not meet the criteria for offsetting in the consolidated statement of finan-cial position. This is because the Group does not have any currently legally enforceable right to offset recognized amounts, as the right to offset is enforceable only on the occurrence of triggering events in the future, e.g. when a credit event such as default occurs or in the event of bankruptcy of one party. In such a triggering event, all outstanding derivative transactions with one counterparty under such an agreement are terminated, the termination value is assessed and a single net amount is payable in settlement of all transactions.
The following table sets out the carrying amounts of recognized derivatives that are subject to the above agreements.
2014 (IN THOUSAND CHF)
GROSS AND NET
AMOUNTS PRESEN-
TED IN THE STATE-
MENT OF FINANCIAL POSITION
RELATED FINANCIAL
INSTRU-MENTS
THAT ARE NOT
OFFSETNET
AMOUNT
Financial assets
Forward foreign exchange contracts 2,960 (1,972) 988
Total on December 31 2,960 (1,972) 988
Financial liabilities
Forward foreign exchange contracts (7,988) 1,972 (6,017)
Total on December 31 (7,988) 1,972 (6,017)
2013 (IN THOUSAND CHF)
GROSS AND NET
AMOUNTS PRESEN-
TED IN THE STATE-
MENT OF FINANCIAL POSITION
RELATED FINANCIAL
INSTRU-MENTS
THAT ARE NOT
OFFSETNET
AMOUNT
Financial assets
Forward foreign exchange contracts 2,905 (1,134) 1,771
Total on December 31 2,905 (1,134) 1,771
Financial liabilities
Forward foreign exchange contracts (1,710) 1,134 (576)
Total on December 31 (1,710) 1,134 (576)
Panalpina Annual Report 2014
Consolidated Financial Statements 124

21 CASH AND CASH EQUIVALENTS
IN THOUSAND CHF 2014 2013
Cash on hand 306 619
Cash at bank 368,908 340,710
Checks and bills of exchange in transit 2,829 (4,406)
Total cash and cash equivalents 372,043 336,923
Net cash (debt) is comprised as follows:
IN THOUSAND CHF 2014 2013
Cash and cash equivalents 372,043 336,923
Other current financial assets 0 5,472
Short-term borrowings (520) (3,053)
Long-term borrowings (132) (208)
Net cash 371,391 339,134
22 SHARE CAPITAL AND TREASURY SHARES
OUT-STANDING
NUMBER OF SHARES
ORDINARY SHARES
TREASURY SHARES TOTAL
Numbers In TCHF In TCHF In TCHF
Shares issued 23,750,000 2,375 2,375
Treasury shares held (33,467) (3,339) (3,339)
Balance on January 1, 2014 23,716,533 2,375 (3,339) (964)
Treasury shares
Purchased (20,000) 0 (2,762) (2,762)
Sold under employee share plan 15,104 0 1,795 1,795
Sold under employee option plan 7,315 0 744 744
Bonus settled with own shares 14,766 0 1,473 1,473
Movement 17,185 0 1,250 1,250
Shares issued 23,750,000 2,375 2,375
Treasury shares held (16,282) (2,089) (2,089)
Balance on December 31, 2014 23,733,718 2,375 (2,089) 286
Panalpina Annual Report 2014
Consolidated Financial Statements 125

OUT-STANDING
NUMBER OF SHARES
ORDINARY SHARES
TREASURY SHARES TOTAL
Numbers In TCHF In TCHF In TCHF
Shares issued 23,750,000 2,375 2,375
Treasury shares held (100,398) (10,018) (10,018)
Balance on January 1, 2013 23,649,602 2,375 (10,018) (7,643)
Treasury shares
Sold under employee share plan 12,864 0 1,284 1,284
Sold under employee option plan 41,248 0 4,116 4,116
Bonus settled with own shares 12,819 0 1,279 1,279
Movement 66,931 0 6,679 6,679
Shares issued 23,750,000 2,375 2,375
Treasury shares held (33,467) (3,339) (3,339)
Balance on December 31, 2013 23,716,533 2,375 (3,339) (964)
The share capital is presented by 23,750,000 issued shares of CHF 0.10 par value (2013: 23,750,000 of CHF 0.10 par value), fully paid in. On December 31, 2014, the number of outstanding shares amounted to 23,733,718 shares (2013: 23,716,533) and the number of treas ury shares to 16,282 (2013: 33,467). Treasury shares have been deducted from equity attributable to owners of the parent. All shares issued by the company were fully paid in.
The Shareholders’ Meeting held on May 9, 2014 approved a dividend of CHF 2.20 per share that was distributed in respect of the business year 2013. The total dividend paid in 2014 amounted to CHF 52.2 million (2013: CHF 47.3 million). The Shareholders’ Meeting in 2013 authorized the Board of Directors to create authorized capital to the maximum amount of CHF 0.3 million by issuing a maximum of 3,000,000 registered shares with a nominal value of CHF 0.10 each at any time until May 15, 2015. The Board of Directors has not made use of this au thorization. The company has no conditional share capital.
The amount available for dividend distribution is based on the available distributable retained earnings of Panalpina World Trans-port (Holding) Ltd. determined in accordance with the legal provisions of the Swiss Code of Obligations. The Board of Directors has proposed dividends for the business year 2014 of CHF 2.75 per share (2013: 2.20 per share). This is subject to approval at the Annual Meeting of Shareholders on May 12, 2015.
Panalpina Annual Report 2014
Consolidated Financial Statements 126

23 NON-CONTROLLING INTERESTS (NCI)The following table summarizes the information relating to each of the Group’s subsidiaries that has material Non-Controlling Interests (NCI), before any intra-group eliminations.
2014 (IN THOUSAND CHF)
PANAL- PINA
SAKHALIN PROJECTS
PANAL- PINA
WORLD TRANS-
PORT (VIETNAM)
LTD.
PANAL- PINA
GULF LLC (DUBAI)
QATAR SHIPPING COMPANY
(PA QATAR) W.L.L.
OTHER IN-DIVIDUAL-LY IMMA-
TERIAL SUBSI-
DIARIES
INTRA-GROUP
ELIMINA-TIONS
TOTAL
NCI percentage 51 % 51 % 51 % 51 %
Non-current assets 47 400 33 47
Current assets 13,986 18,679 5,859 6,866
Non-current liabilities 0 0 (256) (156)
Current liabilities (8,840) (8,915) (998) (1,970)
Net assets 5,193 10,164 4,638 4,787
Carrying amount of NCI 2,649 5,184 2,366 2,441 (395) 12,245
Reclassification of non-controlling interests to parent shareholders 0 0 0 0 0 0
Other changes in non-controlling interests 0 0 0 0 0 0
Revenue 21,628 84,907 17,189 26,942
Profit (4,230) 1,144 652 1,095
Other comprehensive income 1,365 269 441 443
Total comprehensive income (2,865) 1,413 1,093 1,538
Profit allocated to NCI (2,157) 583 333 558 (37) 0 (720)
OCI allocated to NCI 696 137 225 226 8 0 1,292
Cash flows from operating activities 449 (409) 2,582 (467)
Cash flows from investment activities (22) 2,073 (1,732) 1,789
Cash flows from financing activities 0 0 0 0
Dividends paid to NCI 0 0 0 0 0 0 0
Effect of exchange rate changes on cash and cash equivalents (534) 115 106 153
Net increase (decrease) in cash and cash equivalents (106) 1,779 956 1,475
Panalpina Annual Report 2014
Consolidated Financial Statements 127
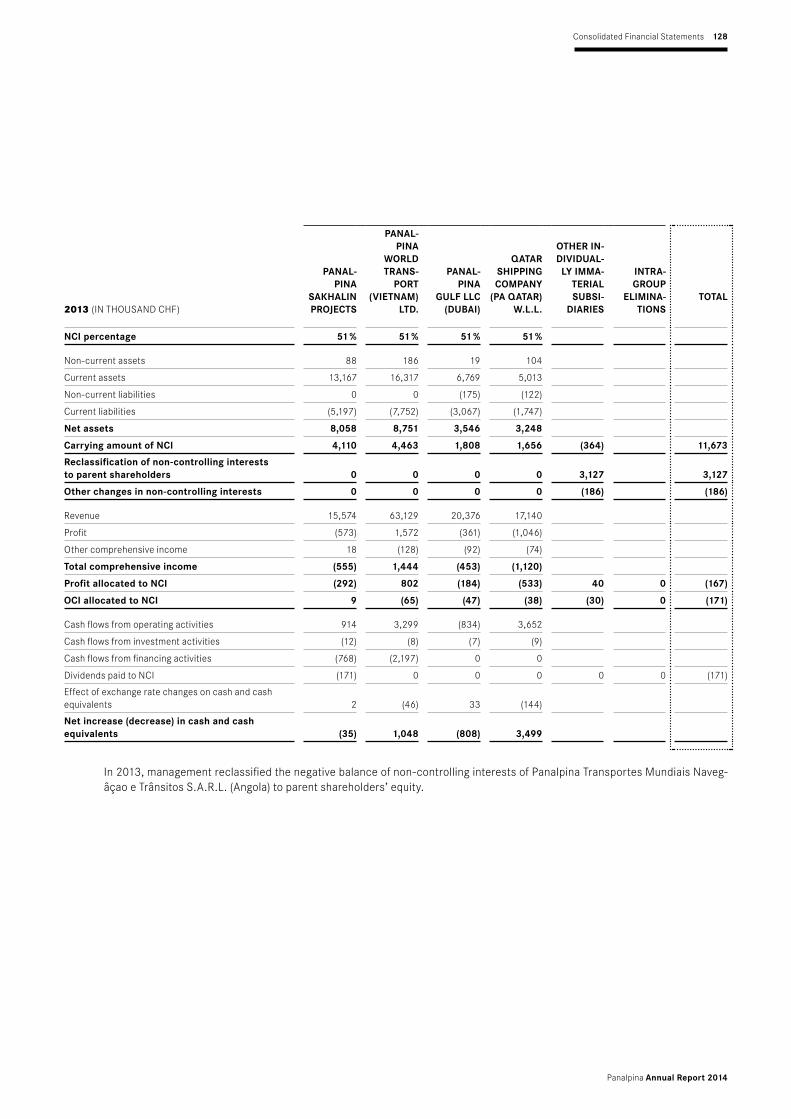
2013 (IN THOUSAND CHF)
PANAL- PINA
SAKHALIN PROJECTS
PANAL- PINA
WORLD TRANS-
PORT (VIETNAM)
LTD.
PANAL- PINA
GULF LLC (DUBAI)
QATAR SHIPPING COMPANY
(PA QATAR) W.L.L.
OTHER IN-DIVIDUAL-LY IMMA-
TERIAL SUBSI-
DIARIES
INTRA-GROUP
ELIMINA-TIONS
TOTAL
NCI percentage 51 % 51 % 51 % 51 %
Non-current assets 88 186 19 104
Current assets 13,167 16,317 6,769 5,013
Non-current liabilities 0 0 (175) (122)
Current liabilities (5,197) (7,752) (3,067) (1,747)
Net assets 8,058 8,751 3,546 3,248
Carrying amount of NCI 4,110 4,463 1,808 1,656 (364) 11,673
Reclassification of non-controlling interests to parent shareholders 0 0 0 0 3,127 3,127
Other changes in non-controlling interests 0 0 0 0 (186) (186)
Revenue 15,574 63,129 20,376 17,140
Profit (573) 1,572 (361) (1,046)
Other comprehensive income 18 (128) (92) (74)
Total comprehensive income (555) 1,444 (453) (1,120)
Profit allocated to NCI (292) 802 (184) (533) 40 0 (167)
OCI allocated to NCI 9 (65) (47) (38) (30) 0 (171)
Cash flows from operating activities 914 3,299 (834) 3,652
Cash flows from investment activities (12) (8) (7) (9)
Cash flows from financing activities (768) (2,197) 0 0
Dividends paid to NCI (171) 0 0 0 0 0 (171)
Effect of exchange rate changes on cash and cash equivalents 2 (46) 33 (144)
Net increase (decrease) in cash and cash equivalents (35) 1,048 (808) 3,499
In 2013, management reclassified the negative balance of non-controlling interests of Panalpina Transportes Mundiais Naveg-âçao e Trânsitos S.A.R.L. (Angola) to parent shareholders’ equity.
Panalpina Annual Report 2014
Consolidated Financial Statements 128

24 BORROWINGSThis note provides information about the contractual terms of the Group’s interest-bearing loans and borrowings, which are mea-sured at amortized cost. For more information about the Group’s exposure to foreign currency and liquidity risk, see note 17.
IN THOUSAND CHF 2014 2013
Current liabilities
Overdraft 9 2,263
Current portion of secured bank loans 337 571
Current portion of finance lease liabilities 175 219
Total current liabilities 520 3,053
Non-current liabilities
Non-current portion of finance lease liabilities 132 208
Total non-current liabilities 132 208
24.1 TERMS AND REPAYMENT SCHEDULE
2014 2013
IN THOUSAND CHF CURRENCY
NOMINAL INTEREST
RATE YEAR OF
MATURITY CARRYING
AMOUNT FAIR
VALUE CARRYING
AMOUNT FAIR
VALUE
Current liabilities
Secured bank loan DZD 5.50 % 2015 337 337 571 571
Total current liabilities 337 337 571 571
24.2 FINANCE LEASE LIABILITIES
2014 2013
IN THOUSAND CHF
FUTURE MINIMUM
LEASE PAYMENTS INTEREST
PRESENT VALUE OF MINIMUM
LEASE PAYMENTS
FUTURE MINIMUM
LEASE PAYMENTS INTEREST
PRESENT VALUE OF MINIMUM
LEASE PAYMENTS
Less than 1 year 184 9 175 223 4 219
Between 1 and 5 years 137 5 132 209 1 208
Total interest-bearing liabilities 321 14 307 432 5 427
The weighted average interest rate of bank borrowings and other financing liabilities is 6.43 percent (2013: 6.38 percent). The carrying amounts of short-term bank borrowings approximate their fair value. The carrying amounts of the Group’s borrowings are denominated in the following currencies:
IN THOUSAND CHF 2014 2013
EUR 0 2,262
DZD 337 571
PLN 282 386
Others 33 42
Total 652 3,261
Panalpina Annual Report 2014
Consolidated Financial Statements 129

25 NON-CURRENT PROVISIONS AND OTHER LIABILITIES
2014 IN THOUSAND CHFEMPLOYEE BENEFITS
CLAIMS AND
OTHER PROVI-SIONS
TOTAL PROVI-
SIONS AND OTHER
LIABILITIES
Balance on January 1 32,055 45,562 77,617
Translation differences 872 549 1,422
Addition 7,671 3,649 11,320
Reversal of unused amount (2,608) (7,100) (9,708)
Charged in income statement 5,063 (3,451) 1,612
Utilization (2,904) (1,229) (4,133)
Balance on December 31 35,086 41,431 76,518
2013 IN THOUSAND CHFEMPLOYEE BENEFITS
CLAIMS AND
OTHER PROVI-SIONS
TOTAL PROVI-
SIONS AND OTHER
LIABILITIES
Balance on January 1 34,097 38,984 73,081
Translation differences (439) (1,148) (1,587)
Addition 3,669 9,531 13,200
Reversal of unused amount (3,492) (1,244) (4,736)
Charged in income statement 177 8,287 8,464
Utilization (1,780) (561) (2,341)
Balance on December 31 32,055 45,562 77,617
Employee provisions mostly relate to certain employee benefit obligations, such as “anniversary” benefits, termination payments and long service benefits, mainly in the USA, Switzerland, Austria and Germany. The timings of these cash outflows can be rea-sonably estimated based on past performance.
The balance for claims represents a provision for certain claims brought forward against the Group by customers and forwarding agents. The balance as of December 31, 2014, is expected to be utilized within the next two to five years. Management deter-mined the provision based on past performance and its expectation of the funds needed for the future settlement of claims not yet reported (see also note 4 – Critical accounting estimates and judgments).
The current portion of employee benefits and claims and other provisions are disclosed in note 27.
Panalpina Annual Report 2014
Consolidated Financial Statements 130

26 DEFERRED INCOME TAXESDeferred taxes are related to the following statement of financial position items:
2014 IN THOUSAND CHFRECEIV-
ABLESFIXED
ASSETSPROVI-SIONS
POST-EM-PLOYMENT
BENEFITS
OTHER STATE-
MENT OF FINANCIAL POSITION CAPTIONS
DEDUCT-IBLE
LOSS CARRY-
FORWARDS TOTAL
Net deferred income tax balance at January 1 810 (10,352) 14,715 9,220 4,685 29,846 48,924
Recognized translation differences 76 (976) 1,113 (20) (252) 1,669 1,610
Recognized in income statement 863 6,594 (4,463) 0 (957) (782) 1,255
Recognized in OCI 0 0 0 5,099 0 0 5,099
Net deferred income tax balance at December 31 1,749 (4,734) 11,365 14,299 3,476 30,733 56,888
Thereof deferred income tax assets at December 31 67,962
Thereof deferred income tax liabilities at December 31 (11,074)
2013 (IN THOUSAND CHF)RECEIV-
ABLESFIXED
ASSETSPROVI-SIONS
POST-EM-PLOYMENT
BENEFITS
OTHER STATE-
MENT OF FINANCIAL POSITION CAPTIONS
DEDUCT-IBLE
LOSS CARRY-
FORWARDS TOTAL
Net deferred income tax balance at January 1 2,067 (11,763) 9,605 14,452 4,182 33,330 51,873
Recognized translation differences (130) (145) (765) 0 (247) (1,321) (2,608)
Recognized in income statement (1,127) 1,556 5,875 1,117 750 (2,163) 6,008
Recognized in OCI 0 0 0 (6,349) 0 0 (6,349)
Net deferred income tax balance at December 31 810 (10,352) 14,715 9,220 4,685 29,846 48,924
Thereof deferred income tax assets at December 31 65,457
Thereof deferred income tax liabilities at December 31 (16,533)
Panalpina Annual Report 2014
Consolidated Financial Statements 131
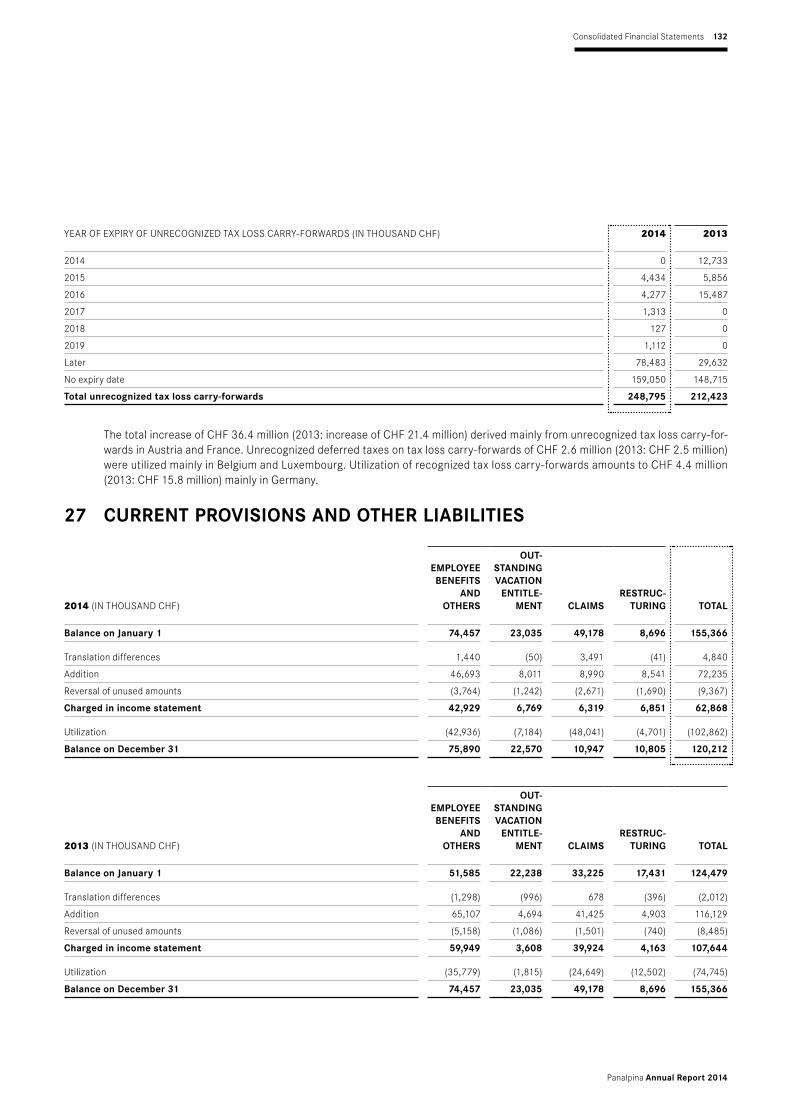
YEAR OF EXPIRY OF UNRECOGNIZED TAX LOSS CARRY-FORWARDS (IN THOUSAND CHF) 2014 2013
2014 0 12,733
2015 4,434 5,856
2016 4,277 15,487
2017 1,313 0
2018 127 0
2019 1,112 0
Later 78,483 29,632
No expiry date 159,050 148,715
Total unrecognized tax loss carry-forwards 248,795 212,423
The total increase of CHF 36.4 million (2013: increase of CHF 21.4 million) derived mainly from unrecognized tax loss carry-for-wards in Austria and France. Unrecognized deferred taxes on tax loss carry-forwards of CHF 2.6 million (2013: CHF 2.5 million) were utilized mainly in Belgium and Luxembourg. Utilization of recognized tax loss carry-forwards amounts to CHF 4.4 million (2013: CHF 15.8 million) mainly in Germany.
27 CURRENT PROVISIONS AND OTHER LIABILITIES
2014 (IN THOUSAND CHF)
EMPLOYEE BENEFITS
AND OTHERS
OUT-STANDING VACATION
ENTITLE-MENT CLAIMS
RESTRUC- TURING TOTAL
Balance on January 1 74,457 23,035 49,178 8,696 155,366
Translation differences 1,440 (50) 3,491 (41) 4,840
Addition 46,693 8,011 8,990 8,541 72,235
Reversal of unused amounts (3,764) (1,242) (2,671) (1,690) (9,367)
Charged in income statement 42,929 6,769 6,319 6,851 62,868
Utilization (42,936) (7,184) (48,041) (4,701) (102,862)
Balance on December 31 75,890 22,570 10,947 10,805 120,212
2013 (IN THOUSAND CHF)
EMPLOYEE BENEFITS
AND OTHERS
OUT-STANDING VACATION
ENTITLE-MENT CLAIMS
RESTRUC- TURING
TOTAL
Balance on January 1 51,585 22,238 33,225 17,431 124,479
Translation differences (1,298) (996) 678 (396) (2,012)
Addition 65,107 4,694 41,425 4,903 116,129
Reversal of unused amounts (5,158) (1,086) (1,501) (740) (8,485)
Charged in income statement 59,949 3,608 39,924 4,163 107,644
Utilization (35,779) (1,815) (24,649) (12,502) (74,745)
Balance on December 31 74,457 23,035 49,178 8,696 155,366
Panalpina Annual Report 2014
Consolidated Financial Statements 132

Apart from outstanding vacation entitlement, the current portions of provisions and other liabilities include personnel profit par-ticipation and related social security costs and payroll taxes, as well as compliance consultancy fees. During the period under review, a provision of CHF 36.2 million for personnel profit participation was recognized. In 2014, CHF 33.5 million of personnel profit participation (2013: CHF 34.1 million) was paid out. As of December 31, 2014 a provision of CHF 55.5 million (2013: CHF 51.3 million) was held for personnel profit participation including related social security costs and payroll taxes.
As disclosed in notes 4 and 25, claim provisions include the current portion of certain claims brought forward against the Group by customers and forwarding agents. Utilization of the claim provision in 2013 mainly included the payments of the WEKO claim (CHF 3.2 million) and the last portion of the FCPA settlement (CHF 17.1 million). Utilization of the claim provision in 2014 mainly included the payment to settle the class action lawsuit in the U.S. (USD 35 million). Further details on open legal claims are described in note 30.2 Pending Legal Claims.
The restructuring provision newly added in 2014 relates to headcount reductions in certain functions mainly in Europe. The addi-tional provision recognized in 2013 relates to headcount reductions in certain functions mainly in Germany, Norway and Angola.
28 RELATED PARTIES28.1 KEY MANAGEMENT PERSONNEL COMPENSATION
Key management personnel consists of the Board of Directors and the Executive Board. The members of the Board of Directors receive a fixed annual compensation and participate in certain equity compensation plans (see note 8). In 2014, there were 7 (2013: 7) members of the Board of Directors.
The compensation of the Executive Board consists of a fixed portion and a variable portion, which depends on the course of busi-ness and the individual manager’s performance. In addition, members of the Executive Board receive indirect benefits and are able to participate in certain equity compensation plans (see note 8). In 2014, there were 6 (2013: 5) members of the Executive Board.
There were no contributions or donations to close members of the families of the key management.
The following table shows the compensation of key management personnel:
2014 IN THOUSAND CHF
SHORT-TERM EM-
PLOYEE BENEFITS1
POST-EM-PLOYMENT
BENEFITS
OTHER LONG-
TERM BEN-EFITS
TERMINA-TION BEN-
EFITS
SHARE- BASED
PAYMENT2
TOTAL COMPEN-
SATION 2014
Total remuneration of Board of Directors 1,538 0 0 0 350 1,888
Total remuneration of Executive Board 6,884 645 0 0 2,172 9,701
Total remuneration of key management personnel 8,422 645 0 0 2,522 11,589
1 Short-term employee benefits incl. fringe benefits, expense allowance, salaries, bonus and social security payments2 Share-based payments are disclosed on an accrual basis. This means that for the Board of Directors, the amount includes the shares to be granted in 2015 for
the business year 2014. For the Executive Board, the disclosed amount includes the shares granted under the Mid-Term Incentive Plan (MTIP) and related to the 2014 annual bonus (grant in 2015), the matching free shares related to the 2013 annual bonus (grant in 2015) and the fair value of shares granted in 2015 related to the Performance Share Units Plan.
Panalpina Annual Report 2014
Consolidated Financial Statements 133

2013 IN THOUSAND CHF
SHORT TERM EM-
PLOYEE BENEFITS1
POST-EM-PLOYMENT
BENEFITS
OTHER LONG-
TERM BEN-EFITS
TERMINA-TION BEN-
EFITS
SHARE- BASED
PAYMENT2
TOTAL COMPEN-
SATION 2013
Total remuneration of Board of Directors 1,536 0 0 0 350 1,886
Total remuneration of Executive Board 5,918 630 0 0 1,325 7,873
Total remuneration of key management personnel 7,454 630 0 0 1,675 9,759
1 Short-term employee benefits incl. fringe benefits, expense allowance, salaries, bonus and social security payments2 Share-based payments are disclosed on an accrual basis. This means that for the Board of Directors, the amount includes the shares to be granted in 2014 for
the business year 2013. For the Executive Board, the disclosed amount includes the shares granted under the Mid-Term Incentive Plan (MTIP) and related to the 2013 annual bonus (grant in 2014) as well as the matching shares that will be transferred in 2014 related to the 2011 annual bonus / MTIP.
The following table shows the equity holdings in Panalpina World Transport (Holding) Ltd. (PWT) of key management personnel and their related parties in line with article 663c of the Swiss Code of Obligations.
Number of PWT nominal shares
Number of options
Board of Directors
Rudolf W. Hug, Chairman 7,926 0
Beat Walti, Vice Chairman 1,353 0
Ilias Läber, Member 362 0
Chris E. Muntwyler, Member 1,353 0
Roger Schmid, Member 6,875 0
Hans-Peter Strodel, Member 1,353 0
Knud Elmholdt Stubkjær, Member 926 0
Total on December 31, 2014 20,148 0
Executive Board
Peter Ulber, Chief Executive Officer 0 0
Robert Erni, Chief Financial Officer 4,497 0
Christoph Hess, General Counsel and Corporate Secretary 4,452 0
Karl Weyeneth, Chief Commercial Officer 4,871 0
Karsten Breum, Chief Human Resources 0 0
Roderick Angwin, Chief Information Officer 1,879
Total on December 31, 2014 15,699 0
Total on December 31, 2014 35,847 0
Panalpina Annual Report 2014
Consolidated Financial Statements 134
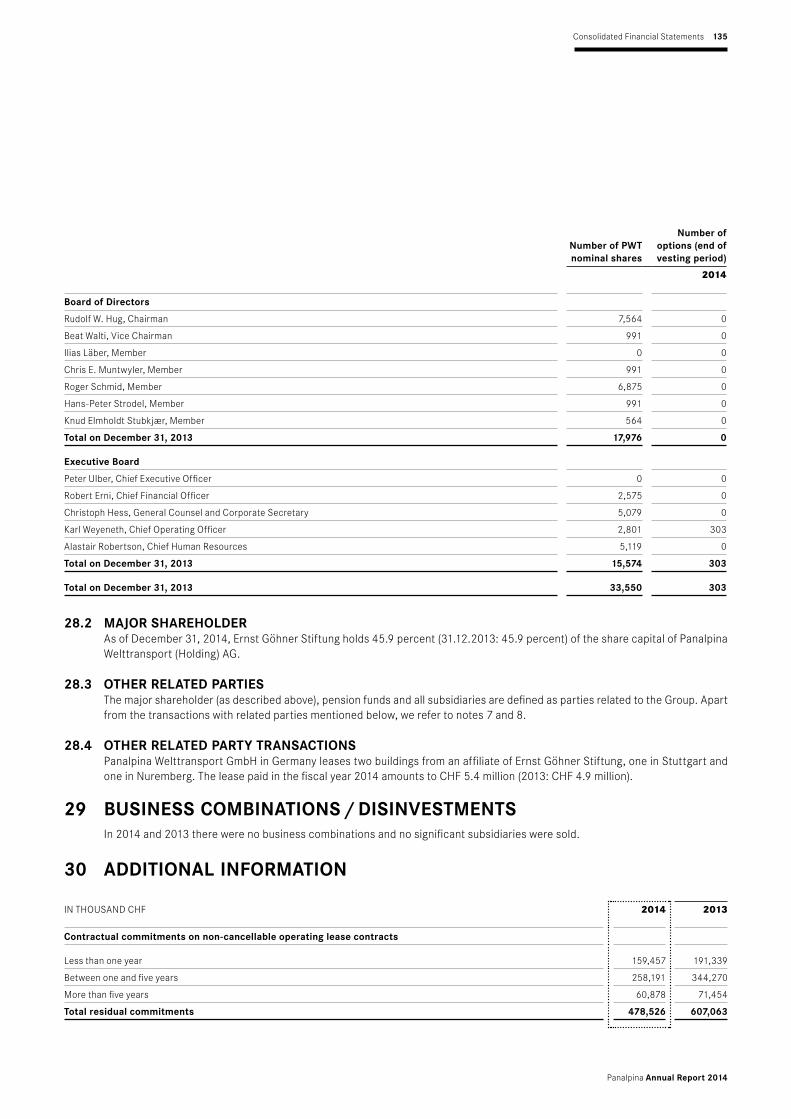
Number of PWT nominal shares
Number of options (end of vesting period)
2014
Board of Directors
Rudolf W. Hug, Chairman 7,564 0
Beat Walti, Vice Chairman 991 0
Ilias Läber, Member 0 0
Chris E. Muntwyler, Member 991 0
Roger Schmid, Member 6,875 0
Hans-Peter Strodel, Member 991 0
Knud Elmholdt Stubkjær, Member 564 0
Total on December 31, 2013 17,976 0
Executive Board
Peter Ulber, Chief Executive Officer 0 0
Robert Erni, Chief Financial Officer 2,575 0
Christoph Hess, General Counsel and Corporate Secretary 5,079 0
Karl Weyeneth, Chief Operating Officer 2,801 303
Alastair Robertson, Chief Human Resources 5,119 0
Total on December 31, 2013 15,574 303
Total on December 31, 2013 33,550 303
28.2 MAJOR SHAREHOLDERAs of December 31, 2014, Ernst Göhner Stiftung holds 45.9 percent (31.12.2013: 45.9 percent) of the share capital of Panalpina Welttransport (Holding) AG.
28.3 OTHER RELATED PARTIESThe major shareholder (as described above), pension funds and all subsidiaries are defined as parties related to the Group. Apart from the trans actions with related parties mentioned below, we refer to notes 7 and 8.
28.4 OTHER RELATED PARTY TRANSACTIONSPanalpina Welttransport GmbH in Germany leases two buildings from an affiliate of Ernst Göhner Stiftung, one in Stuttgart and one in Nuremberg. The lease paid in the fiscal year 2014 amounts to CHF 5.4 million (2013: CHF 4.9 million).
29 BUSINESS COMBINATIONS / DISINVESTMENTSIn 2014 and 2013 there were no business combinations and no significant subsidiaries were sold.
30 ADDITIONAL INFORMATION
IN THOUSAND CHF 2014 2013
Contractual commitments on non-cancellable operating lease contracts
Less than one year 159,457 191,339
Between one and five years 258,191 344,270
More than five years 60,878 71,454
Total residual commitments 478,526 607,063
Panalpina Annual Report 2014
Consolidated Financial Statements 135

30.1 PLEDGED ASSETSAs of the statement of financial position date 2014 and 2013, the Group does not have any pledged assets.
30.2 PENDING LEGAL CLAIMS
IntroductionAs mentioned in note 4 – Provisions, the Group from time to time is involved in legal proceedings in the ordinary course of its business. Other than as noted below, the Group is not a party to any legal, administrative or arbitration proceedings which could significantly harm the Group’s business, financial condition and results of operations taken as a whole and it does not know of any such proceedings which may currently be contemplated by governmental or third parties.
Claim against Pantainer Ltd.The Panalpina subsidiary Pantainer and other group companies are named third party defendants in a litigation launched in Japan in 2005. Insurers are seeking compensation for general average contributions and cargo loss / damage resulting from a fire on a vessel allegedly caused by a customer’s cargo. The customer lost the case in the second instance and appealed to the Japan Supreme Court. The value in dispute amounts to USD 9 million plus interest and cost.
Freight forwarding anti-trust investigationIn 2007 various competition authorities commenced anti-trust investigations against major global freight forwarders including Panalpina. Whereas some investigations (Canada, Australia) were discontinued, Panalpina entered in earlier reporting periods into settlement agreements with competition authorities in the US, Switzerland and New Zealand.
In the reporting year Panalpina also entered into a settlement agreement with the Brazilian competition authorities and agreed to pay a settlement contribution of CHF 2.8 million. This amount has been fully provisioned in 2013.
In 2012 Panalpina received a notice from the Competition Commission Singapore requiring the provision of information related to certain airfreight surcharges which have been subject of the previous and meanwhile completed investigations by other com-petition authorities. Panalpina has provided this information in December 2012 and has responded to a further information request in November 2013. The pending anti-trust proceedings in Singapore may result in penalties imposed on Panalpina. Man-agement however holds the view based on a legal opinion that the outcome of these proceedings will have no effect on the financial situation of the Group beyond the existing provision for pending claims.
In March 2012, the EU Commission has fined various major freight forwarding companies for anti-trust violations which occurred prior to 2008. Panalpina was ordered to pay a penalty of EUR 46.5 million. Panalpina has appealed the European Commission’s decision to the European General Court.
30.3 SUBSEQUENT EVENTSThe Swiss National Bank announced on January 15, 2015 that it was discontinuing the minimum exchange rate of 1.20 CHF perEUR. The amounts reported in these Consolidated Financial Statements do not reflect any changes in foreign exchange rates after December 31, 2014. The Panalpina Group uses CHF as the presentation currency in its consolidated financial statements, therefore a weakening of foreign currencies against the CHF will have a negative currency translation impact on the Group’s con-solidated results when reported in CHF. The Group’s foreign exchange risk management and the currency translation sensitivity of the Group’s results to movements in foreign currency exchange rates is included in the Note 17.
Panalpina Annual Report 2014
Consolidated Financial Statements 136

31 PRINCIPAL GROUP COMPANIES AND PARTICIPATIONS
COMPANY REGISTERED CURRENCY
NOMINAL CAPITAL IN 1,000
EQUITY INTEREST
IN %INVEST-
MENT
METHOD OF CON- SOLIDA-
TION
Europe
Panalpina World Transport (Holding) Ltd. Basel CHF 2,375 K
Panalpina Management Ltd. Basel CHF 2,500 100 1 K
Panalpina Ltd. Basel CHF 600 100 1 K
Panalpina International Ltd. Basel CHF 1,000 100 1 K
Panalpina Air & Ocean Ltd. Basel CHF 2,700 100 1 K
Panalpina Global Employment Services Ltd. Basel CHF 100 100 1 K
Panalpina Welttransport (Deutschland) GmbH Mörfelden EUR 10,226 100 1 K
Panalpina Welttransport GmbH Vienna EUR 36 100 1 K
Panalpina Welttransport GmbH Höchst EUR 36 100 1 K
Panalpina France Transports Internationaux S.A.S. Paris-Roissy EUR 2,000 100 1 K
Panalpina Trasporti Mondiali S.p.A. Milan EUR 2,000 100 1 K
Panalpina Transportes Mundiales S.A. Madrid EUR 451 100 1 K
Panalpina Transportes Mundiais Lda Lisbon EUR 50 100 1 K
Panalpina World Transport Ltd. London GBP 12,350 100 1 K
Panalpina World Transport (Ireland) Ltd. Dublin EUR 25 100 1 K
Panalpina World Transport N.V. Antwerp EUR 19,050 100 1 K
Panalpina Luxembourg S.A. Luxembourg EUR 31 100 1 K
Panalpina World Transport B.V. Amsterdam EUR 91 100 1 K
Panalpina (Beverwijk) B.V. Beverwijk EUR 18 100 1 K
Panalpina Czech Sro. Prague CZK 1,000 100 1 K
Panalpina Business Services (Prague), s.r.o. Prague CZK 1,000 100 1 K
Panalpina Croatia d.o.o. Rijeka HRK 400 100 1 K
Panalpina Slovakia S.R.O. Bratislava EUR 23 100 1 K
Panalpina Magyarorszag Kft. Budapest HUF 528,000 100 1 K
Panalpina Romania S.R.L. Oradea RON 6,072 100 1 K
Panalpina Polska Sp. z o.o. Wroclaw PLN 1,500 100 1 K
Panalpina AB Gothenburg SEK 1,000 100 1 K
Panalpina A / S Oslo NOK 75,060 100 1 K
Panalpina Annual Report 2014
Consolidated Financial Statements 137

COMPANY REGISTERED CURRENCY
NOMINAL CAPITAL IN 1,000
EQUITY INTEREST
IN %INVEST-
MENT
METHOD OF CON- SOLIDA-
TION
North, Central and South America
Panalpina Inc. New York USD 83,000 100 1 K
International Claims Handling Services Inc. Miami USD 1 100 1 K
Panalpina Inc. Toronto CAD 100 100 1 K
Panalpina Transportes Mundiales, S.A. de C.V. Mexico City MXN 35,834 100 1 K
Panalpina S.A. Panama City USD 1,250 100 1 K
Almacenadora Mercantil S.A. Panama City USD 25 100 1 K
Panalpina S.A. de C.V. San Salvador SVC 100 100 1 K
Panalpina Transportes Mundiales S.A. San José CRC 2,500 100 1 K
Panalpina Servicios Aduanales S.A. San José CRC 1,590 100 1 K
Panalpina Uruguay Transportes Mundiales S.A. Montevideo UYU 4,093 100 1 K
Panalpina S.A. Santa Fé de Bogotá COP 7,450,838 100 1 K
DAPSA Depositos Aduaneros Panalpina S.A. Santa Fé de Bogotá COP 2,815,208 100 1 K
Panalpina C.A. Caracas VEF 7,299,297 100 1 K
Panalpina Ecuador S.A. Quito USD 100 100 1 K
Panalpina Aduanas S.A. Lima PEN 732 100 1 K
Panalpina Transportes Mundiales S.A. Lima PEN 4,008 100 1 K
Panalpina Ltda. São Paulo BRL 148,422 100 1 K
Panalpina Chile Transportes Mundiales Ltda. Santiago CLP 3,505,817 100 1 K
Panalpina Transportes Mundiales S.A. Buenos Aires ARS 67,242 100 1 K
Panalpina Transportes Mundiales S.R.L. Santo Domingo DOP 1,000 100 1 K
Mondi Reinsurance Ltd. Hamilton CHF 1,000 100 1 K
Panalpina Annual Report 2014
Consolidated Financial Statements 138

COMPANY REGISTERED CURRENCY
NOMINAL CAPITAL IN 1,000
EQUITY INTEREST
IN %INVEST-
MENT
METHOD OF CON- SOLIDA-
TION
Asia and Australia
Panalpina World Transport (Singapore) Pte. Ltd. Singapore SGD 2,500 100 1 K
PT Panalpina Nusajaya Transport Jakarta IDR 1,500,000 95 1 K
Panalpina China Ltd. Hong Kong HKD 1,000 100 1 K
Panalpina World Transport (PRC) Ltd. Shanghai CNY 13,500 100 1 K
Panalpina Logistics (Shanghai) Ltd. Shanghai CNY 5,000 100 1 K
Panalpina Logistics (Wuhan) Ltd. Wuhan CNY 5,000 100 1 K
Panalpina Logistics (Chengdu) Limited Chengdu CNY 5,000 100 1 K
Panalpina Asia-Pacific Services Ltd. Hong Kong HKD 500 100 1 K
Panalpina World Transport Ltd. Hong Kong HKD 500 100 1 K
Pantainer (H. K.) Limited Hong Kong HKD 100 100 1 K
International Claims Handling Services Ltd. Hong Kong HKD 10 100 1 K
Panalpina Taiwan Ltd. Taipei TWD 15,500 100 1 K
Panalpina Korea Ltd. Seoul KRW 500,000 100 1 K
Panalpina World Transport (Thailand) Ltd. Bangkok THB 27,000 100 1 K
Panalpina Asia-Pacific Services (Thailand) Ltd. Bangkok THB 10,000 100 1 K
Panalpina Macao Ltd. Macao HKD 1,000 100 1 K
Panalpina World Transport (Vietnam) Company Ltd. Ho Chi Minh City VND 6,360,145 49 2 K
Panalpina Transport (Malaysia) Sdn. Bhd. Kuala Lumpur MYR 4,215 70 1 K
Panalpina World Transport (Japan) Ltd. Tokyo JPY 50,000 100 1 K
Panalpina World Transport (India) Pvt. Ltd. Delhi INR 100,050 100 1 K
Panindia Cargo Private Ltd. Delhi INR 100 100 1 K
Panalpina World Transport (Philippines) Inc. Manila PHP 10,000 99.998 1 K
Panalpina World Transport (Pty) Ltd. Sydney AUD 15,000 100 1 K
Panalpina Annual Report 2014
Consolidated Financial Statements 139

COMPANY REGISTERED CURRENCY
NOMINAL CAPITAL IN 1,000
EQUITY INTEREST
IN %INVEST-
MENT
METHOD OF CON- SOLIDA-
TION
Middle East and Africa
Panalpina Gulf LLC Dubai AED 1,000 49 2 K
Panalpina Jebel Ali Ltd. Jebel Ali AED 100 100 1 K
Panalpina World Transport (Dubai) DWC-LLC Dubai AED 300 100 1 K
Panalpina World Transport (Kuwait) WLL Kuwait KWD 20 49 2 K
Panalpina Qatar WLL Doha QAR 200 49 2 K
Panalpina World Transport (Saudi Arabia) Ltd. Al Khobar SAR 500 100 1 K
Panalpina (Bahrain) WLL Manama BHD 20 100 1 K
Panalpina Central Asia EC Manama USD 17,020 100 1 K
Al-Alb Co. for General Transportation (PLLC) Baghdad IQD 11,000 100 1 K
Panalpina World Transport Nakliyat Ltd. Srk. Istanbul TRY 10,000 100 1 K
Panalpina Georgia LLC Tbilisi GEL 11 100 1 K
Panalpina Azerbaijan LLC Baku AZN 1 100 1 K
Panalpina Turkmenistan LLC Turkmenbashi TMT 62 100 1 K
Panalpina World Transport LLP Atyrau KZT 1,252,395 100 1 K
Panalpina Sakhalin Projects Yuzhno-Sakhalinsk RUB 30 49 2 K
Panalpina World Transport ZAO Moscow RUB 2,100 100 1 K
Panalpina CIS Helsinki OY Vantaa EUR 8 100 1 K
Panalpina Logistics LLC Moscow RUB 240 100 1 K
Panalpina World Transport Ltd. Kiev UAH 376 100 1 K
Panalpina Transports Mondiaux Cameroun S.A.R.L. Douala XAF 150,000 90 1 K
Panalpina Transports Mondiaux Algérie EURL Hassi Messaoud DZD 128,039 100 1 K
Panalpina Transports Mondiaux Congo S.A.R.L. Pointe-Noire XAF 70,000 80 1 K
Panalpina Transports Mondiaux Gabon S.A. Port-Gentil XAF 50,000 90 1 K
Panalpina (Ghana) Ltd. Accra GHS 10 100 1 K
Panalpina Transportes Mundiais Navegãçao e Trânsitos S.A.R.L. Luanda AOA 18 49 2 K
K = fully consolidated
1 = capital participation 51 – 100 %
2 = controlling influence over management
Panalpina Annual Report 2014
Consolidated Financial Statements 140

REPORT OF THE STATUTORY AUDITOR TO THE GENERAL MEETING OF SHAREHOLDERS OF Panalpina World Transport (Holding) Ltd., Basel
Report of the Statutory Auditor on the Consolidated Financial StatementsAs statutory auditor, we have audited the accompanying consolidated financial statements of Panalpina World Transport (Holding) Ltd., which comprise the consolidated income statement, consolidated statement of comprehensive income, consolidated statement of finan-cial position, consolidated statement of changes in equity, consolidated statement of cash flows and notes on pages 72 to 140 for the year ended December 31, 2014.
Board of Directors’ ResponsibilityThe board of directors is responsible for the preparation of the consolidated financial statements in accordance with International Finan-cial Reporting Standards (IFRS) and the requirements of Swiss law. This responsibility includes designing, implementing and maintaining an internal control system relevant to the preparation of consolidated financial statements that are free from material misstatement, whether due to fraud or error. The board of directors is further responsible for selecting and applying appropriate accounting policies and making accounting estimates that are reasonable in the circumstances.
Auditor’s ResponsibilityOur responsibility is to express an opinion on these consolidated financial statements based on our audit. We conducted our audit in accordance with Swiss law and Swiss Auditing Standards as well as International Standards on Auditing. Those standards require that we plan and perform the audit to obtain reasonable assurance whether the consolidated financial statements are free from material mis-statement.
An audit involves performing procedures to obtain audit evidence about the amounts and disclosures in the consolidated financial state-ments. The procedures selected depend on the auditor’s judgment, including the assessment of the risks of material misstatement of the consolidated financial statements, whether due to fraud or error. In making those risk assessments, the auditor considers the internal control system relevant to the entity’s preparation of the consolidated financial statements in order to design audit procedures that are appropriate in the circumstances, but not for the purpose of expressing an opinion on the effectiveness of the entity’s internal control system. An audit also includes evaluating the appropriateness of the accounting policies used and the reasonableness of accounting esti-mates made, as well as evaluating the overall presentation of the consolidated financial statements. We believe that the audit evidence we have obtained is sufficient and appropriate to provide a basis for our audit opinion.
OpinionIn our opinion, the consolidated financial statements for the year ended December 31, 2014 give a true and fair view of the financial posi-tion, the results of operations and the cash flows in accordance with International Financial Reporting Standards (IFRS) and comply with Swiss law.
Report on Other Legal RequirementsWe confirm that we meet the legal requirements on licensing according to the Auditor Oversight Act (AOA) and independence (article 728 CO and article 11 AOA) and that there are no circumstances incompatible with our independence.
In accordance with article 728a paragraph 1 item 3 CO and Swiss Auditing Standard 890, we confirm that an internal control system exists, which has been designed for the preparation of consolidated financial statements according to the instructions of the board of directors.
We recommend that the consolidated financial statements submitted to you be approved.
KPMG AG
Marc Ziegler Martin RohrbachLicensed Audit Expert Licensed Audit ExpertAuditor in Charge
Zurich, March 2, 2015
Panalpina Annual Report 2014
Consolidated Financial Statements 141

IN MILLION CHF 2014 2013 2012 2011 2010
Forwarding services 8,172 8,175 8,066 7,926 8,676
Change in % (0.03) 1.35 1.78 (8.64) 18.19
Net forwarding revenue 6,707 6,758 6,617 6,500 7,164
Change in % (0.75) 2.13 1.81 (9.27) 20.25
Gross profit 1,586 1,561 1,465 1,477 1,480
Change in % 1.60 6.55 (0.81) (0.21) 7.49
in % of net revenue 23.65 23.10 22.14 22.72 20.66
Consolidated (loss) / profit 86.5 11.7 (71.8) 127.4 (26.0)
Change in % 639.50 (116.30) (156.37) (590.06) (348.94)
in % of gross profit 5.46 0.75 (4.90) 8.63 (1.76)
EBITDA 174.0 119.8 34.2 212.1 62.4
Change in % 45.26 250.29 (83.87) 240.09 (21.78)
in % of gross profit 10.97 7.67 2.33 14.36 4.21
EBITA 142.1 85.5 3.1 183.6 23.5
Change in % 66.15 2,658.06 (98.33) 682.11 (44.77)
in % of gross profit 8.96 5.48 0.21 12.43 1.59
EBIT 116.7 48.0 (39.6) 174.2 15.4
Change in % 143.19 (221.21) (122.74) 1,033.97 (48.64)
in % of gross profit 7.36 3.07 (2.70) 11.79 1.04
Cash generated from operations 152.9 73.8 (39.6) 229.1 75.3
Change in % 107.19 (286.36) (117.27) 204.35 (75.86)
in % of gross profit 9.64 4.73 (2.69) 15.51 5.09
Net cash from operating activities 123.0 42.5 (71.5) 193.5 37.0
Change in % 189.48 (159.44) (136.92) 422.45 (85.74)
in % of gross profit 7.76 2.72 (4.88) 13.10 2.50
Free cash flow 87.0 (5.5) (81.9) 41.9 6.2
Change in % (1,681.84) (93.28) (295.43) 570.94 (97.24)
in % of gross profit 5.49 (0.35) (5.59) 2.84 0.42
Net working capital 191.3 174.6 134.0 85.2 143.0
Change in % 9.59 30.29 57.28 (40.42) 8.20
Panalpina Annual Report 2014
Consolidated Financial Statements 142
KEY FIGURES IN CHF Five-year review

IN MILLION CHF 2014 2013 2012 2011 2010
Capital expenditure on fixed assets 48.1 49.8 84.2 51.2 40.0
Change in % (3.49) (40.86) 64.45 27.87 (4.31)
in % of gross profit 3.03 3.19 5.75 3.47 2.71
Net capital expenditure on fixed assets 45.1 48.5 83.9 108.7 28.5
Change in % (6.96) (42.19) (22.79) 281.81 (3.24)
in % of gross profit 2.84 3.11 5.73 7.36 1.92
Depreciation and amortization (incl. impairment losses) 57.3 71.9 73.9 37.9 47.0
Change in % (20.27) (2.71) 94.99 (19.37) (5.65)
in % of gross profit 3.61 4.61 5.04 2.57 3.18
Personnel expenses 976.9 960.0 957.2 892.4 890.9
Personnel
Number of employees at year-end (world) 15,639 16,010 15,224 15,051 14,136
Number of employees at year-end (Switzerland) 682 754 759 775 749
Yearly average (world) 16,180 15,925 15,782 15,286 14,223
Productivity ratios (CHF)
Net sales per average employee 414,521 424,364 419,272 425,226 503,703
Gross profit per average employee 98,018 98,022 92,826 96,624 104,062
Personnel expenses per average employee 60,372 60,283 60,650 58,380 62,641
Personnel cost in % of gross profit 61.59 61.50 65.34 60.42 60.20
Leverage (liabilities / equity) 1.66 1.78 1.65 1.31 1.46
Net interest-bearing liabilities (363) (332) (390) (562) (546)
Gross gearing (interest-bearing liabilities / equity) 0.01 0.01 0.00 0.01 0.01
Net gearing (net interest-bearing liabilities / equity) (0.50) (0.48) (0.53) (0.61) (0.68)
ROCE (EBIT less tax / capital employed) in % 24.01 6.71 (19.42) 42.32 (5.40)
Current cash debt coverage ratio (net operating cash flow / average current liability) 0.11 0.04 (0.07) 0.19 0.04
Cash debt coverage ratio (net operating cash flow / average total liability) 0.10 0.03 (0.06) 0.16 0.03
Return on equity in % 12.2 1.6 (8.7) 14.8 (3.1)
Change in % 662.50 (118.39) (158.78) (577.40) (360.81)
Panalpina Annual Report 2014
Consolidated Financial Statements 143

IN MILLION CHF 2014 2013 2012 2011 2010
ASSETS 1,930 1,949 1,957 2,135 1,989
Change in % (0.99) (0.41) (8.34) 7.32 3.35
Non-current assets 329 351 362 390 303
Change in % (6.15) (3.04) (7.13) 28.73 (7.04)
Property, plant and equipment 104 119 130 113 114
Change in % (12.37) (8.46) 15.03 (0.73) (19.27)
Financial assets 103 114 98 135 111
Change in % (9.57) 16.33 (27.71) 21.59 (1.75)
Intangible assets 122 118 134 142 78
Change in % 3.41 (11.94) (5.89) 81.84 8.65
Current assets 1,600 1,598 1,595 1,745 1,686
Change in % 0.15 0.19 (8.60) 3.47 5.47
Liquid funds 372 337 393 574 555
Change in % 10.40 (14.25) (31.58) 3.33 1.30
Receivables and other current assets 1,228 1,261 1,202 1,171 1,131
Change in % (2.59) 4.91 2.65 3.54 7.66
LIABILITIES AND EQUITY 1,930 1,949 1,957 2,135 1,989
Change in % (0.99) (0.42) (8.30) 7.31 3.34
Equity 721 697 734 919 804
Change in % 3.43 (5.04) (20.10) 14.22 (6.15)
Share capital 2 2 2 50 50
Change in % 18.75 0.00 (96.00) 0.00 0.00
Treasury shares (2) (3) (10) (197) (196)
Change in % (30.37) (70.00) (94.93) 0.65 1.78
Translation reserves (187) (188) (165) (162) (151)
Change in % (0.72) 13.94 1.85 7.30 10.70
Retained earnings and other reserves 907 886 907 1,228 1,101
Change in % 2.40 (2.32) (24.77) 11.50 (3.02)
Non-controlling interests 12 12 9 9 8
Liabilities 1,197 1,240 1,214 1,207 1,177
Change in % (3.50) 2.14 0.60 2.54 10.94
Payables, accruals and deferred income 991 1,002 1,013 985 914
Change in % (1.08) (1.09) 2.84 7.80 4.07
Borrowings 9 5 3 12 10
Change in % 72.80 66.67 (75.00) 23.23 (25.09)
Provisions 197 233 198 210 254
Change in % (15.57) 17.68 (6.19) (17.20) 49.20
Panalpina Annual Report 2014
Consolidated Financial Statements 144
CONSOLIDATED STATEMENT OF FINANCIAL POSITION IN CHFFive-year review

ANNUAL FINANCIAL
STATEMENTS Panalpina World Transport (Holding) Ltd.
Income Statement
Balance Sheet
Notes to the Financial Statements
Appropriation of Available Earnings
Report of the Statutory Auditor
146
147
148
151
152
Panalpina Annual Report 2014
Annual Financial Statements 145
CONTENTS
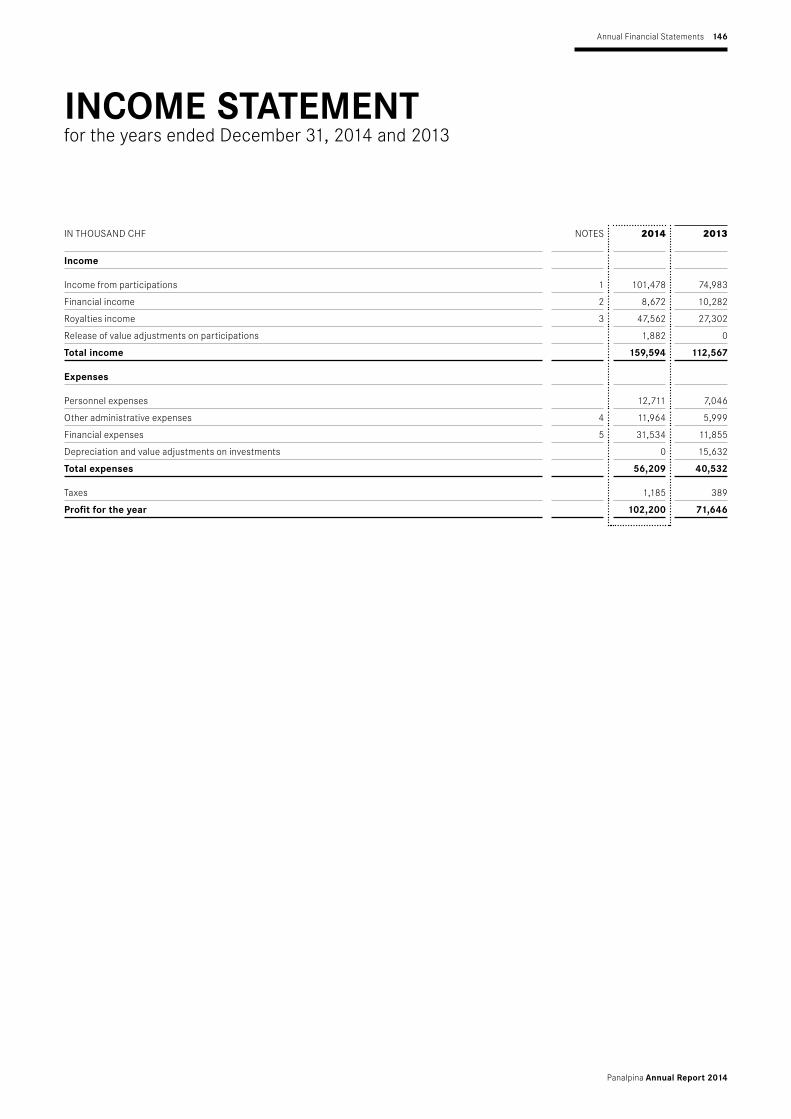
IN THOUSAND CHF NOTES 2014 2013
Income
Income from participations 1 101,478 74,983
Financial income 2 8,672 10,282
Royalties income 3 47,562 27,302
Release of value adjustments on participations 1,882 0
Total income 159,594 112,567
Expenses
Personnel expenses 12,711 7,046
Other administrative expenses 4 11,964 5,999
Financial expenses 5 31,534 11,855
Depreciation and value adjustments on investments 0 15,632
Total expenses 56,209 40,532
Taxes 1,185 389
Profit for the year 102,200 71,646
INCOME STATEMENT for the years ended December 31, 2014 and 2013
Panalpina Annual Report 2014
Annual Financial Statements 146

IN THOUSAND CHF NOTES 2014 2013
ASSETSCurrent assets
Cash 810 2,764
Cash pool receivables from Group companies 0 10,331
Receivables:
due from Group companies 89 461
due from third parties 47 101
Marketable securities 6 0 5,472
Prepaid expenses and deferred charges 49,482 30,566
Total current assets 50,428 49,695
Non-current assets
Other non-current assets 21 0
Participations 7 526,806 470,482
Loans due from Group companies 307,217 303,327
Treasury shares 8 150 1,400
Total non-current assets 834,194 775,209
Total assets 884,623 824,904
LIABILITES AND EQUITY
Current liabilities
Cash pool payables due to Group companies 31,348 23,936
Payables:
due to Group companies 2,489 841
due to third parties 635 1,002
Financial liabilities due to Group companies 47,265 43,774
Accrued expenses 5,426 7,547
Total current liabilities 87,162 77,100
Non-current liabilities
Loans due to Group companies 0 921
Provisions 926 363
Total non-current liabilities 926 1,284
Total liabilities 88,088 78,384
Equity
Share capital 9 2,375 2,375
Legal reserve 10 475 475
Reserve for own shares 2,089 3,339
Special reserve 264,036 262,786
Retained earnings:
balance brought forward from previous year 425,360 405,899
profit for the year 102,200 71,646
Total equity 796,535 746,520
Total liabilities and equity 884,623 824,904
Panalpina Annual Report 2014
Annual Financial Statements 147
BALANCE SHEET as of December 31

GeneralThe Group’s consolidated financial statements must be considered for an appropriate financial and economic assessment of the Panalpina Group. The statutory financial statements of Panalpina World Transport (Holding) Ltd. were prepared in accordance with the requirements of the Swiss Code of Obligations (SCO).
Valuation methods and translation of foreign currenciesTreasury shares are valued at the lower of cost or market value. Marketable securities are reported at market value. All other assets including participations are reported at cost less necessary depreciation or value adjustments. Assets and liabilities denominated in foreign currencies are translated into Swiss francs (CHF), using year-end rates of exchange, except participa-tions which are translated at historical rates. Resulting exchange gains and losses are recognized in the income statement with the exception of unrealized gains which are deferred. Transactions during the year which are denominated in foreign currencies are translated at exchange rates effective at the relevant transaction dates.
1 INCOME FROM PARTICIPATIONSThe increase of CHF 26,495 thousand compared to the prior year is mainly due to the fact that in 2014 a company has been liquidated which results in an additional liquidation dividend of CHF 20,485 thousand.
2 FINANCIAL INCOMEThe decrease of CHF 1,610 thousand compared to the prior year is mainly attributable to less foreign exchange gains of CHF 272 thousand, less interest income of CHF 399 thousand and decreased income of CHF 929 thousand on financial assets.
3 ROYALTIES INCOMESince 2009, Panalpina World Transport (Holding) Ltd. charges a royalty fee to its subsidiaries for the use of the Panalpina net-work and trademark name. This fee increased in 2014 by CHF 20,260 thousand compared to the prior year.
4 OTHER ADMINISTRATIVE EXPENSESThe increase of CHF 5,965 thousand in other administrative expenses is mostly attributable to higher project costs in 2014 (CHF 2,921 thousand), increase in insurance costs (CHF 465 thousand) as well as additional withholding tax payments (CHF 1,245 thousand).
Panalpina Annual Report 2014
Annual Financial Statements 148
NOTES TO THE FINANCIAL STATEMENTS

5 FINANCIAL EXPENSESThe increase in financial expenses of CHF 19,679 thousand is mainly due to an increase in loss coverage to subsidiaries.
6 MARKETABLE SECURITIESIn the year under review, the shares in Dimerco and Descartes have been fully sold.
7 PARTICIPATIONSThe principal direct and indirect subsidiaries of Panalpina World Transport (Holding) Ltd. are listed under the heading “Principal Group companies and participations” in note 31 of the Group’s financial statements.
8 TREASURY SHARES In the year under review, 20,000 treasury shares (2013: 0 shares) were purchased at an average price of 138.11. Treasury share sales totaled 37,185 shares (2013: 66,931 shares) with an average sale price of CHF 75.28 (2013: CHF 81.83). All shares are held to be used for share based payment.
The number of treasury shares held by Panalpina World Transport (Holding) Ltd. meets the definitions and requirements of art. 659, 659a, 663b para 10 and 671a SCO.
9 SHARE CAPITALThe fully paid-in share capital on December 31, 2014 amounts to CHF 2.375 million consisting of 23.75 million registered shares at a par value of CHF 0.10 each. With regard to the authorized capital increase we refer to note 22 in the Group’s financial statements.
NUMBER OF SHARES 31.12.2014
MOVE-MENT
IN YEAR 31.12.2013
MOVE-MENT
IN YEAR 31.12.2012
Total Panalpina World Transport (Holding) Ltd. shares issued 23,750,000 0 23,750,000 0 23,750,000
Total treasury shares held by Panalpina World Transport (Holding) Ltd. 16,282 (17,185) 33,467 (66,931) 100,398
in % 0.07 0.14 0.42
IN % 2014 2013
Shareholders
Ernst Göhner Stiftung, Switzerland 45.9 45.9
Cevian Capital II Master Fund L.P. 12.3 12.3
Artisan Partners Limited Partnership, USA ≥10 ≥5
Janus Capital Group ≥5 –
Other investors 26.6 ≤36.8
Panalpina World Transport (Holding) Ltd. 0.1 0.1
Bestinver Gestión, S.G. SGIIC, Spain – ≤3
Nominees
Chase Nominees Ltd., UK – 5.2
Panalpina Annual Report 2014
Annual Financial Statements 149

10 LEGAL RESERVESThe legal reserve must be at least 20 percent of the share capital of Panalpina World Transport (Holding) Ltd. in order to comply with the SCO. Panalpina World Transport (Holding) Ltd. has met the legal requirements for legal reserves under art. 671 SCO.
11 GUARANTEES
IN THOUSAND CHF 2014 2013
Guarantees in favor of third parties
Guarantees and indemnity liabilities, SCO, art. 663b para 1 284,981 480,072
Additionally, Panalpina World Transport (Holding) Ltd., Basel, has issued letters of awareness in favor of various banks concern-ing liabilities due from subsidiaries amounting to CHF 0.0 million (2013: CHF 0.1 million).
12 CONTINGENT LIABILITIESIn 2008, Panalpina World Transport (Holding) Ltd. has signed a letter of indemnity as a security for the intraday cash pool over-draft limits over a maximum amount of CHF 64,054 thousand (2013: CHF 64,500 thousand).
Panalpina World Transport (Holding) Ltd. carries joint liability to the federal tax authorities for value-added tax of all Swiss subsidiaries.
13 PENDING LEGAL CLAIMSThe status of the proceedings are disclosed under “pending legal claims” in note 30.2 of the Group’s financial statements.
14 RISK MANAGEMENTThe detailed disclosures regarding risk management / assessment that are required by Swiss law are included in notes 16 and 17 of the Group’s financial statements.
15 HIDDEN RESERVESIn the year under review, a net amount of CHF 1,585 thousand of hidden reserves was released.
16 RELATED PARTIESIn accordance with the stipulations of CO Art. 663c, the shareholdings in the company and the conversion and option rights held by each current member of the board of directors and the executive board are disclosed in note 28 of the Group’s financial statements.
Panalpina Annual Report 2014
Annual Financial Statements 150
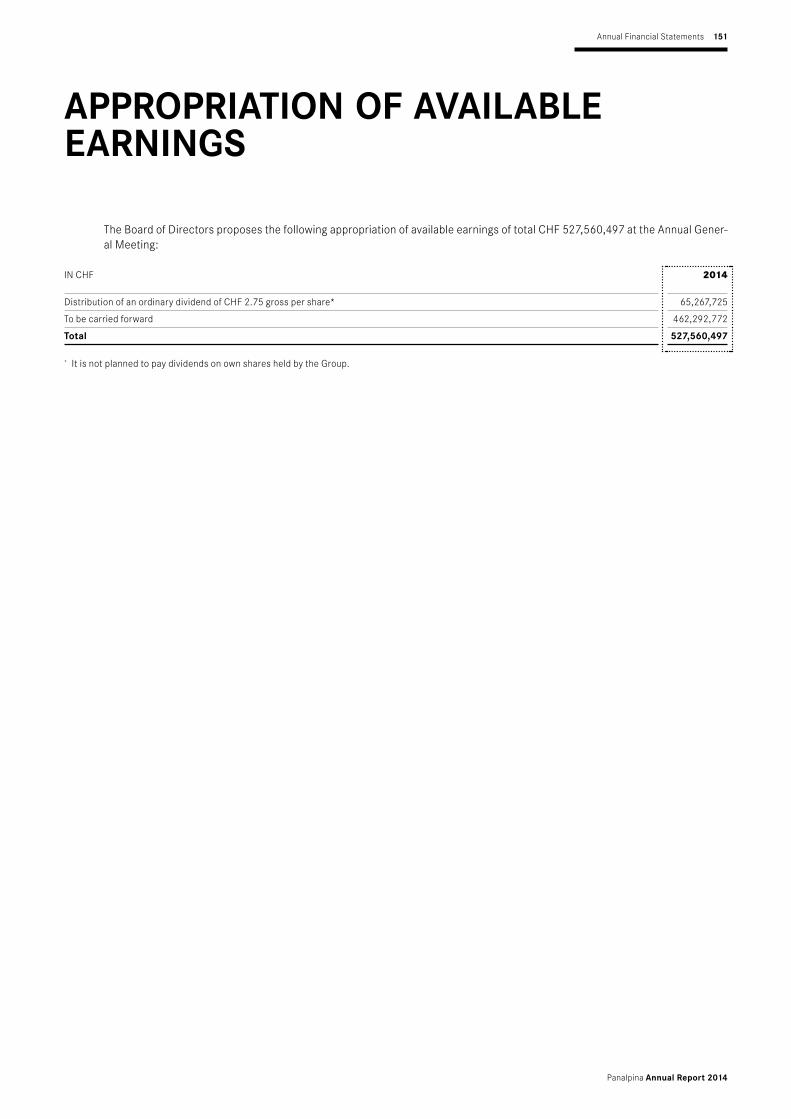
The Board of Directors proposes the following appropriation of available earnings of total CHF 527,560,497 at the Annual Gener-al Meeting:
IN CHF 2014
Distribution of an ordinary dividend of CHF 2.75 gross per share* 65,267,725
To be carried forward 462,292,772
Total 527,560,497
* It is not planned to pay dividends on own shares held by the Group.
Panalpina Annual Report 2014
Annual Financial Statements 151
APPROPRIATION OF AVAILABLE EARNINGS

REPORT OF THE STATUTORY AUDITOR TO THE GENERAL MEETING OF SHAREHOLDERS OFPanalpina World Transport (Holding) Ltd., Basel
Report of the Statutory Auditor on the Financial StatementsAs statutory auditor, we have audited the accompanying financial statements of Panalpina World Transport (Holding) Ltd., which com-prise the balance sheet, income statement and notes on pages 146 to 151 for the year ended December 31, 2014.
Board of Directors’ ResponsibilityThe board of directors is responsible for the preparation of the financial statements in accordance with the requirements of Swiss law and the company’s articles of incorporation. This responsibility includes designing, implementing and maintaining an internal control sys-tem relevant to the preparation of financial statements that are free from material misstatement, whether due to fraud or error. The board of directors is further responsible for selecting and applying appropriate accounting policies and making accounting estimates that are reasonable in the circumstances.
Auditor’s ResponsibilityOur responsibility is to express an opinion on these financial statements based on our audit. We conducted our audit in accordance with Swiss law and Swiss Auditing Standards. Those standards require that we plan and perform the audit to obtain reasonable assurance whether the financial statements are free from material misstatement.
An audit involves performing procedures to obtain audit evidence about the amounts and disclosures in the financial statements. The procedures selected depend on the auditor’s judgment, including the assessment of the risks of material misstatement of the financial statements, whether due to fraud or error. In making those risk assessments, the auditor considers the internal control system relevant to the entity’s preparation of the financial statements in order to design audit procedures that are appropriate in the circumstances, but not for the purpose of expressing an opinion on the effectiveness of the entity’s internal control system. An audit also includes evaluat-ing the appropriateness of the accounting policies used and the reasonableness of accounting estimates made, as well as evaluating the overall presentation of the financial statements. We believe that the audit evidence we have obtained is sufficient and appropriate to pro-vide a basis for our audit opinion.
OpinionIn our opinion, the financial statements for the year ended December 31, 2014 comply with Swiss law and the company’s articles of incorporation.
Report on Other Legal RequirementsWe confirm that we meet the legal requirements on licensing according to the Auditor Oversight Act (AOA) and independence (article 728 CO and article 11 AOA) and that there are no circumstances incompatible with our independence.
In accordance with article 728a paragraph 1 item 3 CO and Swiss Auditing Standard 890, we confirm that an internal control system exists, which has been designed for the preparation of financial statements according to the instructions of the board of directors.
We further confirm that the proposed appropriation of available earnings complies with Swiss law and the company’s articles of incorpo-ration. We recommend that the financial statements submitted to you be approved.
KPMG AG
Marc Ziegler Martin RohrbachLicensed Audit Expert Licensed Audit ExpertAuditor in Charge
Zurich, March 2, 2015
Panalpina Annual Report 2014
Annual Financial Statements 152

Panalpina World Transport(Holding) Ltd.Viaduktstrasse 42P.O. BoxCH-4002 BaselPhone +41 61 226 11 11Fax +41 61 226 11 [email protected]