Embed Size (px)
Citation preview
1
Effects of weight loss and exercise
on chemerin serum concentrations and adipose tissue
expression in human obesity
Dissertation
zur Erlangung des akademischen Grades
Dr. med.
an der Medizinischen Fakultät
der Universität Leipzig
eingereicht von: Rima Chakaroun
Geburtsdatum / Geburtsort: 08.10.1983/ Saida-Libanon
angefertigt an / in: Universität Leipzig
Medizinische Klinik III
Department für Endokrinologie und Nephrologie
Liebigstr. 20, 04103 Leipzig
Betreuer: Prof. Dr. Matthias Blüher
Beschluss über die Verleihung des Doktorgrades vom:
2
Bibliographische Beschreibung Chakaroun, Rima Effects of weight loss and exercise on chemerin serum concentrations and adipose tissue expression in human obesity Universität Leipzig, Dissertation 41 Seiten, 73 Literaturangaben, 3 Abbildungen Referat: Adipositas und die mit ihr assoziierten Erkrankungen bleiben vor allem in den Industrie-Ländern, eine nicht zu unterschätzende gesellschaftliche und ökonomische Belastung. In den letzten Jahren konnte gezeigt werden, dass verschiedene Adipozyten- und Hepatozyten-sezernierte Proteine Mediatoren von Insulinresistenz darstellen. Kürzlich wurde Chemerin als ein neues proinflammatorisches Hepatoadipokin vorgestellt, welches die Adipogenese reguliert und potenziell zur Induktion von Insulinresistenz führt. Bislang existierten nur wenige Studien über die Auswirkungen von Sport-Intervention und gewichtsreduktiven Maßnahmen auf die Chemerinkonzentration und -expression. In der vorliegenden Arbeit wurden die Unterschiede im zirkulierenden Chemerin in den verschiedenen Stadien von Adipositas und Insulinresistenz untersucht. Weiterhin wurde die Expression von Chemerin in subkutanem und viszeralem Fettgewebe und die Expression von CMKLR1 bei Adipositas analysiert. In zusätzlichen Untersuchungen wurden die Auswirkungen von drei verschiedenen Interventionen auf das zirkulierende Chemerin untersucht, hierfür folgten 60 Patienten einem Trainingsprogramm für 12 Wochen, 19 Patienten führten 6 Monate lang eine hypokalorische Diät und 32 Patienten unterzogen sich einer bariatrischen chirurgischen Operation. In den vorgelegten Studien konnte gezeigt werden, dass Chemerin mRNA im Fettgewebe von Patienten mit Typ 2 Diabetes im Vergleich zu normal Glukose-toleranten Probanden (NGT) signifikant erhöht exprimiert ist und mit zirkulierendem Chemerin korreliert. Auch korreliert sie mit dem Body-Mass Index (BMI), dem Körperfettanteil und CRP sowie HOMA-IR (Index für Insulinresistenz) und der Glukoseaufnahmerate in euglykämischen – hyperinsulinämischen Clamp Studien. Chemerin ist zudem bei Adipositas signifikant erhöht. Ein Unterschied in der Expression von Chemerin zwischen subkutanem und viszeralem Fettgewebe zeigte sich lediglich bei Typ 2 Diabetiker. Alle Interventionen führten zu einem Abfall des zirkulierenden Chemerins. Hier konnte erstmalig gezeigt werden, dass eine hypokalorische Diät zu einer signifikanten Abnahme des zirkulierenden Chemerins führt. Bariatrische Chirurgie bewirkte nach einem Jahr einen signifikanten Abfall der Chemerinexpression in viszeralem und subkutanem Fettgewebe. Sowohl Insulinresistenz als auch Inflammation scheinen BMI-unabhängige Prädiktoren für erhöhtes zirkulierendes Chemerin zu sein. Die vorgestellten Daten weisen darauf hin, dass Chemerin möglicherweise eine wichtige Rolle in der Initiierung der Inflammation und Dysfunktion im Fettgewebe spielt und somit zur Entwicklung der assoziierten kardiovaskulären Begleiterkrankungen beitragen könnte. Auch scheint eine Verminderung der Chemerinexpression im Fettgewebe basierend auf Gewichtsreduktion zu einer Verbesserung der Glukosetoleranz zu führen.
3
Table of content: 1. INTRODUCTION .......................................................................................................... 4
1.1 THE SKINNY ON FAT: OBESITY AND ASSOCIATED DISEASES, A THREAT ON THE RISE ...... 4 1.2 CHEMERIN ........................................................................................................................................................ 5
1.2.1 Chemerin Expression and secretion ........................................................................................... 6 1.2.2 Chemerin signaling and receptors ............................................................................................... 7 1.2.3 Chemerin and inflammation ............................................................................................................. 8 1.2.4 Role of chemerin in metabolism .................................................................................................... 9
2. MATERIAL AND METHODS ...................................................................................... 12 2.1 STUDY DESIGN ............................................................................................................................................. 12 2.2. SUBJECTS ..................................................................................................................................................... 12
2.2.1. Cohort 1 .................................................................................................................................................. 12 2.2.2. Cohort 2 .................................................................................................................................................. 13 2.2.3. Cohort 3 .................................................................................................................................................. 14 2.2.4. Cohort 4 .................................................................................................................................................. 14 2.2.5. Cohort 5 .................................................................................................................................................. 14
2.3. METHODS ..................................................................................................................................................... 15 2.3.1. Measurement of body fat content, glucose metabolism, and insulin sensitivity .................................................................................................................................................................................... 15 2.3.2. Analyses of blood samples .......................................................................................................... 15 2.3.3. Chemerin and CMKLR1 mRNA Expression Studies .................................................... 16 2.3.4. Histologic analyses and measurement of macrophage count in adipose tissue (Cohort 2) ............................................................................................................................................................. 16 2.4. Statistical Analysis ................................................................................................................................ 17
3. RESULTS ................................................................................................................... 17 3.1. CHEMERIN SERUM CONCENTRATION IN OBESITY AND T2D ..................................................... 17 3.2. CHEMERIN AND CMKLR1 MRNA EXPRESSION IN OM AND SC ADIPOSE TISSUE .......... 19 3.3. CHANGES IN CHEMERIN SERUM CONCENTRATIONS IN RESPONSE TO DIFFERENT WEIGHT LOSS INTERVENTIONS ...................................................................................................................... 21
4. DISCUSSION .............................................................................................................. 24 4.1 CHEMERIN AND OBESITY ......................................................................................................................... 24 4.2 CHEMERIN AND DIABETES ...................................................................................................................... 25
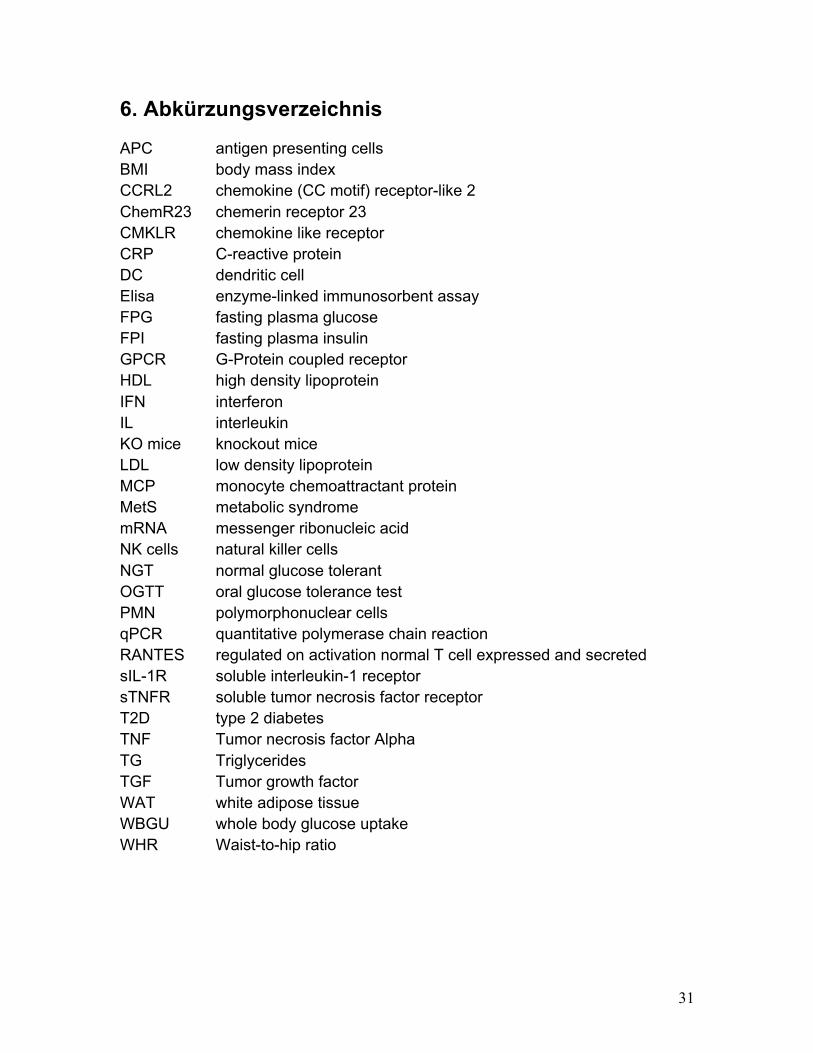
5. ZUSAMMENFASSUNG DER ARBEIT ....................................................................... 28 6. ABKÜRZUNGSVERZEICHNIS .................................................................................. 31 7. EIGENSTÄNDIGKEITSERKLÄRUNG ....................................................................... 32 8. PUBLIKATION ........................................................................................................... 33 9. LEBENSLAUF ............................................................................................................ 34 10. DANKSAGUNG ........................................................................................................ 36
4
1. Introduction 1.1 The Skinny on Fat: Obesity and associated diseases, a threat on the rise Obesity, derived from the Latin term “Obesus” meaning plump, is characterized by an accumulation of excess fat tissue within the body. Obesity is a prevalent condition, which is often stigmatized. The health risk of obesity is largely a consequence of the diseases associated with it within the frame of the metabolic syndrome, such as diabetes, hypertension, hyperlipidemia, and cardiac disease. Moreover, the rising risk of type 2 diabetes is the result of the growing obesity epidemic and the increase in mean fat mass in the individual.1 Obesity has been shown to increase the risk of cardiovascular disease and premature death. Adipose tissue releases a large number of mediators, which influence body weight homeostasis as well as insulin sensitivity and lead to alterations in lipids, blood pressure, coagulation, fibrinolysis and inflammation.2 Although there is a strong relationship between obesity and insulin resistance, about 15% of obese individuals seem to be protected against diabetes at higher weight, and therefore might not reduce their risk for diabetes or coronary heart disease through weight loss.3 Recent research has shown that independent of total fat mass, increased visceral fat accumulation and adipose tissue dysfunction are associated with insulin resistant obesity, suggesting that mechanisms such as inflammation and adipokine release, related to changes in adipose tissue biology, determine the pathological metabolic consequences in patients with obesity beyond positive caloric balance. White adipose tissue (WAT), long being considered a mere storage compartment for excess fat, has been the subject of intensive research, abolishing every doubt that it constitutes indeed a major active endocrine secretory organ, in addition to playing a metabolic key role. WAT secretes a number of signaling peptides with different biological functions among them: hormone-like adipokines such as leptin, resistin, adiponectin, apelin, visfatin, hepcidine, omentin, vaspin, adipsin and angiopoietin; inflammatory cytokines among such as interferons like IFNβ and IFNγ, interleukins such as IL-1 and IL-6, growth factors such as TNFα and chemokines such as IL-8, IL-10, RANTES and MCP1. Anti-inflammatory factors are also secreted by the WAT including the anti-inflammatory factors IL-4, IL-10, TGFβ, receptor antagonist IL-1Ra, soluble receptors IL-1RII, sTNFR and also sIL-1R.4 To make matters all the more complex, the different fat depots in the body play distinct
5
roles, secreting different sets of adipokines.5 The secretion or serum level of many adipokines is profoundly affected by the degree of obesity.6 Various adipocyte-secreted factors have been described to affect insulin sensitivity profoundly and may potentially link obesity, insulin resistance and cardiovascular disease. Among those, adiponectin for example appears as an insulin-sensitizing adipocytokine, whereas TNFα, IL-6, resistin, PAI-1 and others induce insulin resistance. Increased macrophage infiltration into omental adipose tissue appears to be the most prominent characteristic, which distinguishes adipose tissue of insulin-resistant from insulin-sensitive obese individuals. It has also been shown that the primary signal causing adipose tissue dysfunction and insulin-resistant obesity can be linked to the size of the adipocyte, as hypertrophic adipocytes are more insulin resistant and they produce a largely pro-inflammatory adipokine pattern. In other words, adipose tissue dysfunction characterized by increased visceral fat accumulation, increased adipocyte size and higher macrophage infiltration into omental fat is associated with insulin-resistant morbid obesity, making it a main contributor to a proinflammatory, atherogenic and diabetogenic state.7 Growing evidence suggests that obesity, insulin resistance and type 2 diabetes (T2D) are accompanied by a state of subclinical inflammation8 leading to the hypothesis that, in obesity, dysregulation in the secretion pattern of adipokines may serve as a pathogenic link between obesity, T2D and cardiovascular disease. Therefore, identifying the molecular targets of these adipokines will allow us to break this link and be able to develop treatment strategies for obesity and its related and/or derived diseases.9
1.2 Chemerin Five years ago, Goralski et al identified the chemoattractant protein chemerin as a novel adipokine, which plays a key role in the regulation of adipogenesis and adipocyte metabolism.10 Up until then, chemerin was identified as the major serum agonist for chemokine-like receptor (CMKLR) and the sole known ligand for CMKLR1. CMKL-Receptors are localized on plasmacytoid dendritic cells, which are key producers of type 1 IFNs, which in return can directly block viral replication and stimulate the adaptive immune response, giving chemerin a key role in the regulation of the adaptive immune response. Chemerin expression was found to mark early psoriatic skin lesions and to correlate with plasmacytoid dendritic cell recruitment.11, 12 Circulating levels of chemerin were found to be upregulated in psoriasis13, 14, 15and to normalize after successful treatment.16 Since then, we witnessed an explosion in clinical
6
studies and research investigating chemerin in the frame of a multitude of diseases ranging from obesity, diabetes, the metabolic syndrome, to psoriasis and Crohn’s disease.
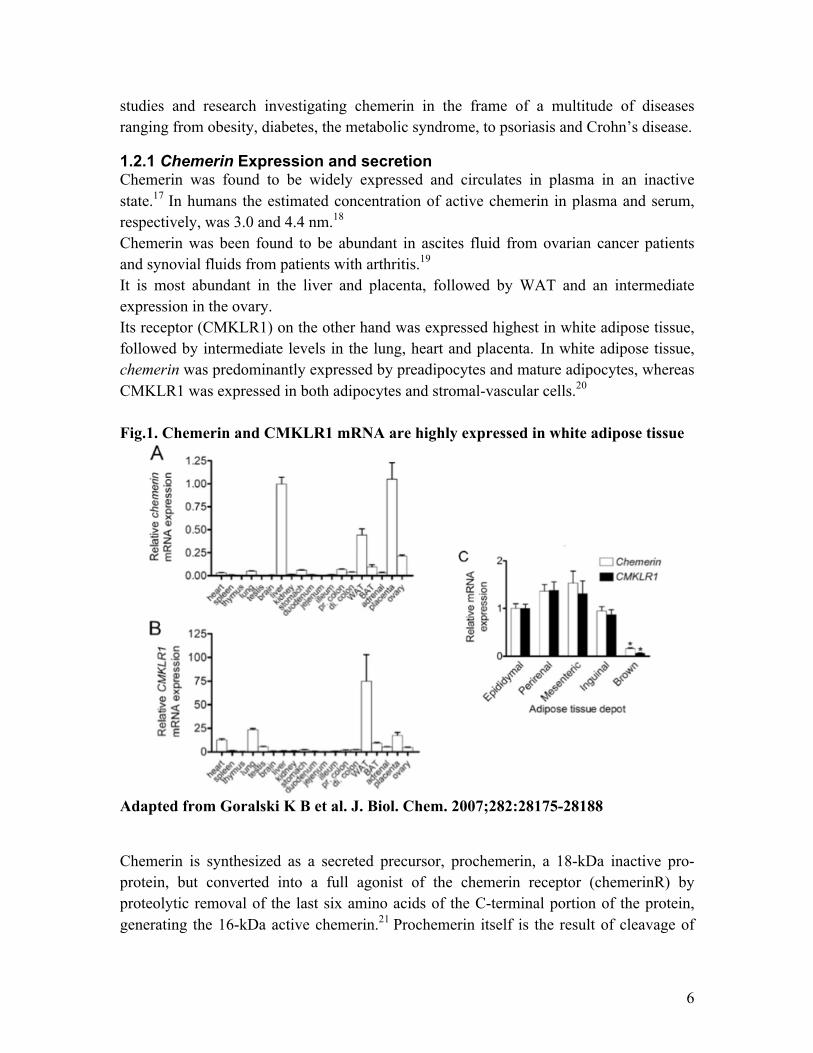
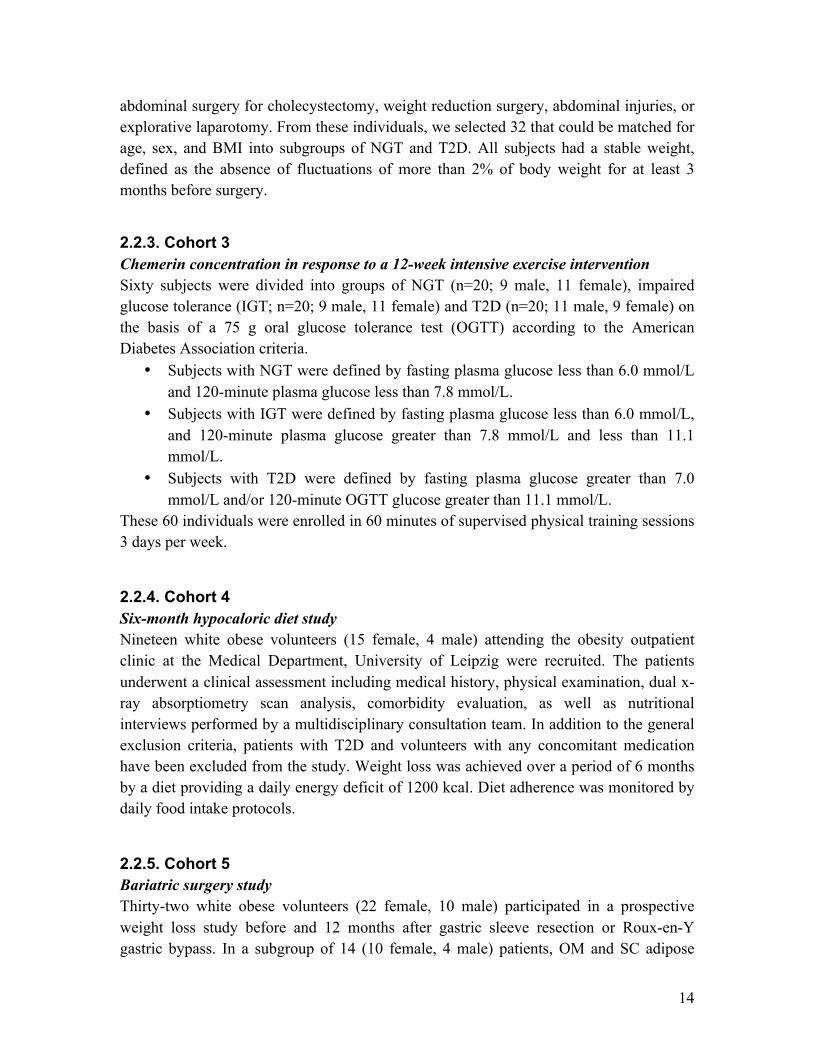
1.2.1 Chemerin Expression and secretion Chemerin was found to be widely expressed and circulates in plasma in an inactive state.17 In humans the estimated concentration of active chemerin in plasma and serum, respectively, was 3.0 and 4.4 nm.18 Chemerin was been found to be abundant in ascites fluid from ovarian cancer patients and synovial fluids from patients with arthritis.19 It is most abundant in the liver and placenta, followed by WAT and an intermediate expression in the ovary. Its receptor (CMKLR1) on the other hand was expressed highest in white adipose tissue, followed by intermediate levels in the lung, heart and placenta. In white adipose tissue, chemerin was predominantly expressed by preadipocytes and mature adipocytes, whereas CMKLR1 was expressed in both adipocytes and stromal-vascular cells.20 Fig.1. Chemerin and CMKLR1 mRNA are highly expressed in white adipose tissue
Adapted from Goralski K B et al. J. Biol. Chem. 2007;282:28175-28188 Chemerin is synthesized as a secreted precursor, prochemerin, a 18-kDa inactive pro-protein, but converted into a full agonist of the chemerin receptor (chemerinR) by proteolytic removal of the last six amino acids of the C-terminal portion of the protein, generating the 16-kDa active chemerin.21 Prochemerin itself is the result of cleavage of
7
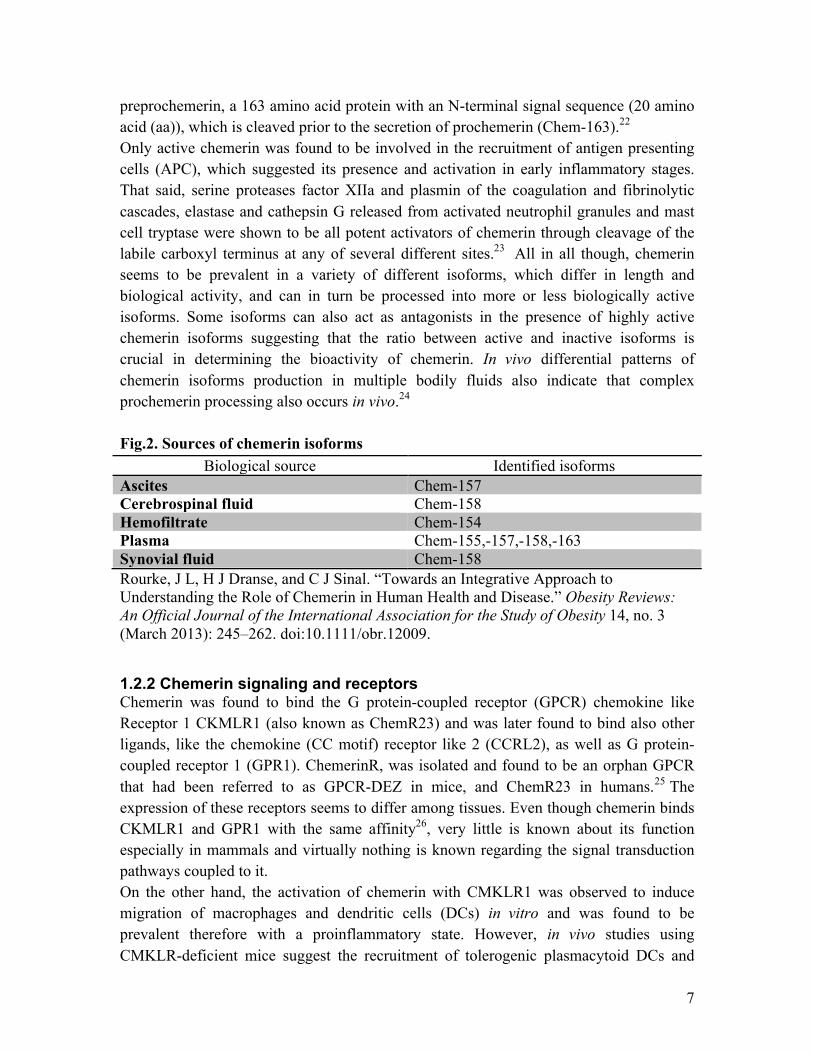
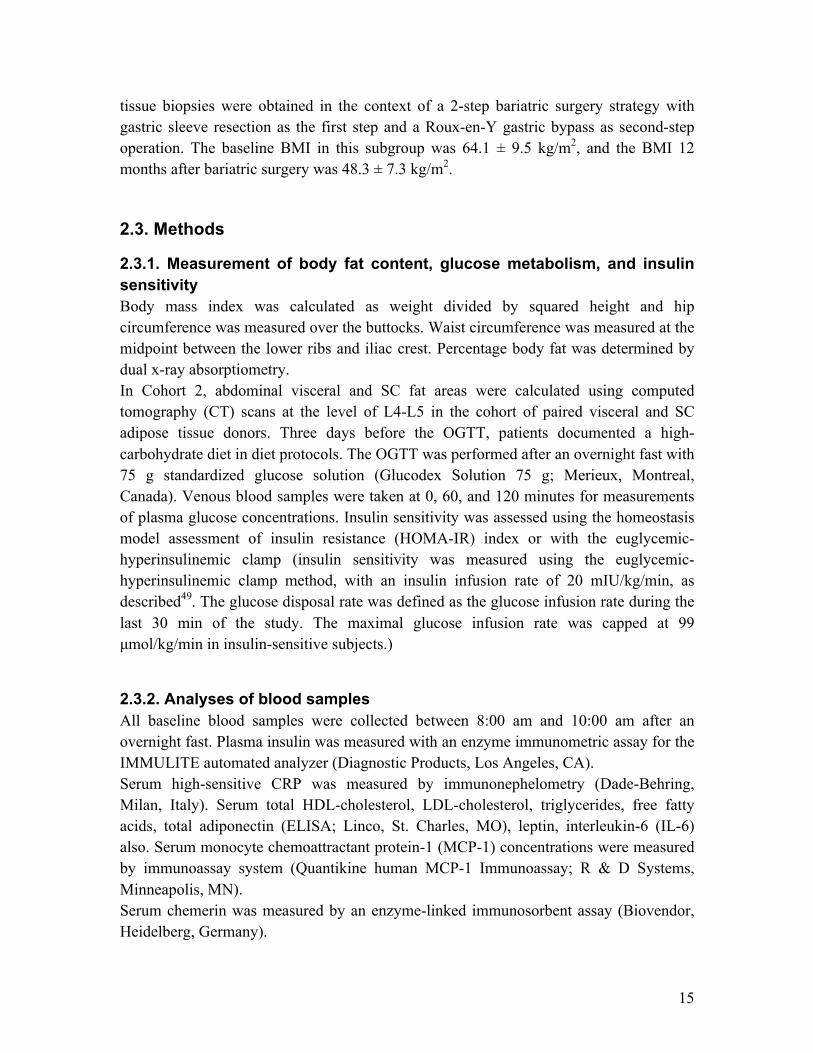
preprochemerin, a 163 amino acid protein with an N-terminal signal sequence (20 amino acid (aa)), which is cleaved prior to the secretion of prochemerin (Chem-163).22 Only active chemerin was found to be involved in the recruitment of antigen presenting cells (APC), which suggested its presence and activation in early inflammatory stages. That said, serine proteases factor XIIa and plasmin of the coagulation and fibrinolytic cascades, elastase and cathepsin G released from activated neutrophil granules and mast cell tryptase were shown to be all potent activators of chemerin through cleavage of the labile carboxyl terminus at any of several different sites.23 All in all though, chemerin seems to be prevalent in a variety of different isoforms, which differ in length and biological activity, and can in turn be processed into more or less biologically active isoforms. Some isoforms can also act as antagonists in the presence of highly active chemerin isoforms suggesting that the ratio between active and inactive isoforms is crucial in determining the bioactivity of chemerin. In vivo differential patterns of chemerin isoforms production in multiple bodily fluids also indicate that complex prochemerin processing also occurs in vivo.24 Fig.2. Sources of chemerin isoforms
Biological source Identified isoforms Ascites Chem-157 Cerebrospinal fluid Chem-158 Hemofiltrate Chem-154 Plasma Chem-155,-157,-158,-163 Synovial fluid Chem-158 Rourke, J L, H J Dranse, and C J Sinal. “Towards an Integrative Approach to Understanding the Role of Chemerin in Human Health and Disease.” Obesity Reviews: An Official Journal of the International Association for the Study of Obesity 14, no. 3 (March 2013): 245–262. doi:10.1111/obr.12009.
1.2.2 Chemerin signaling and receptors Chemerin was found to bind the G protein-coupled receptor (GPCR) chemokine like Receptor 1 CKMLR1 (also known as ChemR23) and was later found to bind also other ligands, like the chemokine (CC motif) receptor like 2 (CCRL2), as well as G protein-coupled receptor 1 (GPR1). ChemerinR, was isolated and found to be an orphan GPCR that had been referred to as GPCR-DEZ in mice, and ChemR23 in humans.25 The expression of these receptors seems to differ among tissues. Even though chemerin binds CKMLR1 and GPR1 with the same affinity26, very little is known about its function especially in mammals and virtually nothing is known regarding the signal transduction pathways coupled to it. On the other hand, the activation of chemerin with CMKLR1 was observed to induce migration of macrophages and dendritic cells (DCs) in vitro and was found to be prevalent therefore with a proinflammatory state. However, in vivo studies using CMKLR-deficient mice suggest the recruitment of tolerogenic plasmacytoid DCs and
8
thereby possibly an anti-inflammatory function. Chemerin/CMKLR1 interaction was further shown to promote adipogenesis and angiogenesis27 as well as adipogenesis and osteoblastogenesis of bone marrow-derived precursor cells.28 CMKLR1 was also found to bind the anti-inflammatory lipid mediator E1, suggesting that CMKLR1 is a multifunctional receptor. CCLR2 also binds with many chemokines (CCL5 and CCL19) but on the other hand, it does not signal but constitutively recycles, changing the concentrations of chemokines in the tissue and therefore influencing subsequent immune responses. CCRL2 was found to bind chemerin and increase local chemerin concentration to efficiently present it to CMKLR1 on nearby cells, providing a link between CCRL2 and CMKLR1.29 Further studies elucidating the overlapping and differential signaling pathways of different chemerin receptors as well as unique activation or inactivation by specific chemerin isoforms and the effects on the systems biology are still missing.
1.2.3 Chemerin and inflammation The generation of active chemerin by neutrophils, its presence in inflammatory tissues and its chemotactic properties on APCs strongly supported the hypothesis that this novel mediator constitutes an important link between innate and adaptive immunity and plays a central role in the initiation of immune responses. An elevation in circulating chemerin levels was associated with chronic inflammation in several diseases such as Crohn’s disease, ulcerative colitis 30 as well as chronic pancreatitis, polycystic ovarian syndrome and liver disease.31 The increase in chemerin serum levels correlated positively with circulating inflammatory markers such as CRP, TNFα and IL-632 as well as proinflammatory adipokines such as resistin.33 Consistent with these results, in vitro studies demonstrate enhanced secretion of proinflammatory cytokines such as IL-6, IL-8, TNFα and IL1-ß.34. All these findings suggest that chemerin produced in response to inflammation may also contribute to the inflammatory response through enhanced secretion of proinflammatory molecules in the sense of a positive feedback and through modulation of immune cell recruitment as mentioned above. Other studies suggest an anti-inflammatory role for chemerin either through its effects on non-leukocyte cells such as endothelial cells by reducing monocyte adhesion or through a group of anti-inflammatory mediators termed resolvins.35 That said, other research groups have failed to verify these results. It remains to be fully investigated whether chemerin plays a protective or pathologic role in inflammatory disease states, although evidence is leaning more toward the former than the latter. Moreover, chemerin most likely plays a different role depending on which populations of cells are activated in circumstances of disease.
9
1.2.4 Role of chemerin in metabolism
1.2.4.1 Chemerin in fat tissue and obesity As mentioned earlier, high-level expression of chemerin and its cognate receptor CMKLR1 were found in mouse and human adipocytes. Chemerin and CMKLR1 were expressed to a similar degree in epididymal, perirenal and mesenteric (visceral), as well as inguinal (subcutaneous) white adipose tissue depots and only at minimal levels in brown fat tissue. This lead early on to the hypothesis, that white adipose tissue is both a source and target of chemerin. Being also a secreted protein, the hypothesis that chemerin was an adipokine was soon to follow. Serum chemerin concentrations are elevated in obese animal models such as leptin deficient (ob/ob) and leptin receptor deficient (db/db) mice, obese rats but also in diet induced obesity.36 Many population based studies have shown that chemerin was elevated in young and adult obese patients and correlated positively with body mass index (BMI) and measures of central obesity such as waist to hip ratio (WHR) and visceral adipose tissue mass.37 An interesting observation was that fat explants from obese subjects secreted more chemerin that those isolated from lean individuals and this secretion correlated with increased BMI, WHR as well as fat cell volume suggesting that although many organs most notably the liver produced chemerin, white adipose tissue makes the greatest contribution.38 In considering the development of obesity, adipose tissue expansion is characterized by many processes like the enlargement of preexisting adipocytes (hypertrophy) as well as an increase in adipocyte numbers (hyperplasia). Hyperplasia is caused by the increased differentiation and proliferation of preadipocytes into adipocytes. Goralski et al were able to show that chemerin produced in cultured 3T3-L1 adipocytes triggered CMKLR1 signaling in adipocytes and other cell types and stimulated chemotaxis of CMKLR1-expressing cells 39 . Chemerin levels increased dramatically with adipocyte differentiation and adenoviral small hairpin RNA targeted knockdown of chemerin or CMKLR1 expression lead to an impaired differentiation of 3T3-L1 cells into adipocytes and reduced the expression of adipocyte genes involved in glucose and lipid homeostasis altering metabolic functions in mature adipocytes and leading to the conclusion that chemerin is a adipose-derived signaling molecule that regulates adipogenesis and adipocyte metabolism via its own receptor.40 Consistent with these results, the loss of CMKLR1 in vivo is associated with reduced obesity and a resistance to diet induced obesity41.
10
In order for hyperplasia and hypertrophy to occur, increased blood flow and dilatation of existing capillary networks are required to supply the increasing needs in expanding adipose tissue. Chemerin treatment was shown to activate angiogenesis cascades and induce proliferation and migration of human endothelial cells.42 Adiposity is characterized by increased secretion of adipokines such as TNFα and IL-6 and the recruitment and infiltration of WAT with macrophages, T-cells and NK cells as well as immature dendritic cells. Consistent with the established role of chemerin as a chemoattractant adipokine, elevated serum chemerin concentrations were shown to correlate with a greater percentage of NK cells as well as immune active CMKLR1-exhibiting cells in WAT. CMKLR1 knockout mice showed a reduced macrophage infiltration of WAT.43 Chemerin levels appear to be closely linked to adipose tissue, CRP expression and WAT expansion as well as subclinical inflammation linking chemerin to the development of obesity itself and associated metabolic diseases as will be discussed below.
1.2.4.2 Chemerin levels in T2D and Metabolic Syndrome (MetS) There is ample evidence suggesting the influence of chemerin on glucose tolerance especially in mice. The data from these studies seem to suggest that both reduction and augmentation of chemerin signaling may cause impaired glucose tolerance possibly through impaired glucose sensitive insulin secretion by possible regulation of ß-pancreatic cells.44 In euglycemic hyperinsulinemic clamps, chemerin knockout (KO) mice and CKMLR1-KO mice show normal insulin sensitivity. Interestingly chemerin KO mice exhibit impaired insulin signaling in fat tissue and enhanced insulin signaling in the liver.45 Experiments with human skeletal cells are consistent with a role for chemerin signaling in inducing insulin resistance and negatively modulating glucose uptake.46 The cluster of metabolic disturbances displayed in the metabolic syndrome including impaired glucose homeostasis, high blood pressure as well as central obesity and elevated lipoproteins are among the most prevalent comorbidities in obesity. Some studies suggests that circulating and adipose tissue expressed chemerin are independent markers for the MetS and predictive for MetS severity.47 Strong correlations with age and gender were observed due to higher chemerin levels in females compared with males and older compared with younger individuals. Plasma chemerin levels were not significantly different between the normal glucose tolerant (NGT) and T2D groups. After adjusting for age and gender, chemerin levels were significantly associated with measures of body fat (BMI, fat mass, weight, and WHR) and metabolic syndrome-related phenotypes (fasting glucose, fasting insulin, plasma triglycerides, and blood pressure) in NGT subjects. After further adjustment for BMI,
11
plasma chemerin levels were still independently associated with metabolic syndrome-related phenotypes, but not measures of insulin sensitivity or glucose homeostasis.48 The regulatory mechanisms supporting the relationship between chemerin and the development of T2D as well as metabolic syndrome are yet to be elucidated. It will be very interesting to know how inflammation contributes to the development of the metabolic syndrome and whether chemerin acts as a molecular link between the presence of these perturbations and the risk for T2D or as a mere indicator for severity. In this study we investigated the differences in chemerin secretion in obese patients and patients with insulin resistant and inflammatory states as compared to healthy controls. We also investigated the role of subcutaneous and visceral fat tissue expression as well as CMKLR1 messenger RNA (mRNA) expression in human obesity. These investigations were done in steady states of metabolism. We also investigated the dynamic changes of chemerin in 3 different weight loss intervention studies in relationship to markers of obesity and insulin sensitivity.
12
2. Material and Methods
2.1 Study design The study included 5 cohorts and a total number of 740 individuals. Cohorts 1 and 2 included individuals for a cross sectional analysis. Cohorts 3, 4 and 5 included patients with a predefined intervention. In the first cohort we examined chemerin serum concentrations in relation to obesity and measures of glucose metabolism (n=468). In the second cohort we investigated chemerin mRNA expression in paired omental and subcutaneous adipose tissue samples in addition to chemerin serum concentrations (n=161). In the last 3 cohorts we examined the effects of a 6 months calorie restriction diet (n=19), a 12-week intensive exercise intervention (n=60) and bariatric surgery 6 months post intervention on circulating chemerin (n=32). Inclusion criteria: (1) Absence of any acute or chronic inflammatory disease as determined by a leukocyte count greater than 7.0 × 10⁹ cells/L, CRP greater than 5.0 mg/dL, or clinical signs of infection (2) Undetectable antibodies against glutamic acid decarboxylase (3) No medical history of hypertension, that is, systolic blood pressure was less than 140 mmHg and diastolic blood pressure was less than 85 mmHg (4) No clinical evidence of either cardiovascular or peripheral artery disease (5) No thyroid dysfunction (6) No alcohol or drug abuse (7) No pregnancy Ethics statement: The ethics committee of the University of Leipzig approved all studies and all subjects gave written informed consent before taking part in the study.
2.2. Subjects
2.2.1. Cohort 1 Chemerin serum concentrations in relation to measures of obesity and glucose metabolism A total of 468 white men (n = 220) and women (n = 248) have been consecutively recruited in the context of a study on insulin resistance at the Department of Medicine, University of Leipzig, to represent a wide range of obesity, insulin sensitivity, and glucose tolerance. The age ranged from 19 to 80 years, and BMI was from 17.1 to 79.1 kg/m2. The study included 290 patients with type 2 diabetes mellitus (T2D) and 178 NGT
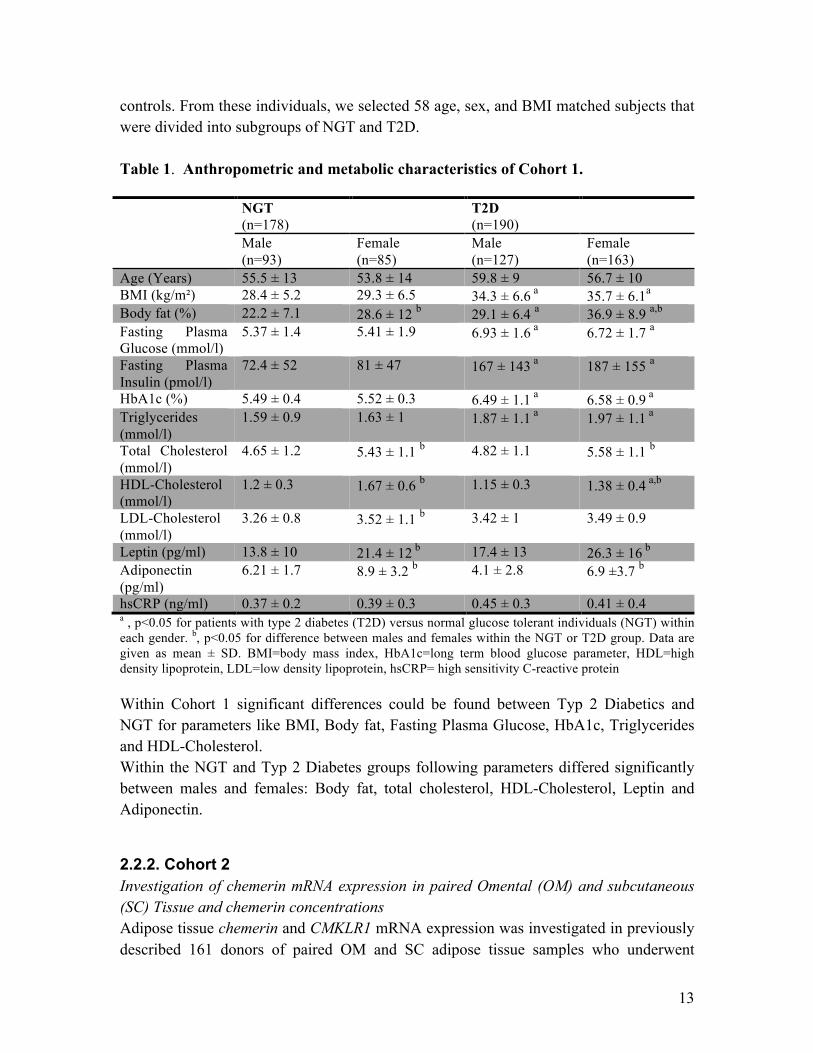
13
controls. From these individuals, we selected 58 age, sex, and BMI matched subjects that were divided into subgroups of NGT and T2D. Table 1. Anthropometric and metabolic characteristics of Cohort 1. NGT
(n=178) T2D
(n=190)
Male (n=93)
Female (n=85)
Male (n=127)
Female (n=163)
Age (Years) 55.5 ± 13 53.8 ± 14 59.8 ± 9 56.7 ± 10 BMI (kg/m²) 28.4 ± 5.2 29.3 ± 6.5 34.3 ± 6.6 a 35.7 ± 6.1a Body fat (%) 22.2 ± 7.1 28.6 ± 12 b 29.1 ± 6.4 a 36.9 ± 8.9 a,b Fasting Plasma Glucose (mmol/l)
5.37 ± 1.4 5.41 ± 1.9 6.93 ± 1.6 a 6.72 ± 1.7 a
Fasting Plasma Insulin (pmol/l)
72.4 ± 52 81 ± 47 167 ± 143 a 187 ± 155 a
HbA1c (%) 5.49 ± 0.4 5.52 ± 0.3 6.49 ± 1.1 a 6.58 ± 0.9 a Triglycerides (mmol/l)
1.59 ± 0.9 1.63 ± 1 1.87 ± 1.1 a 1.97 ± 1.1 a
Total Cholesterol (mmol/l)
4.65 ± 1.2 5.43 ± 1.1 b 4.82 ± 1.1 5.58 ± 1.1 b
HDL-Cholesterol (mmol/l)
1.2 ± 0.3 1.67 ± 0.6 b 1.15 ± 0.3 1.38 ± 0.4 a,b
LDL-Cholesterol (mmol/l)
3.26 ± 0.8 3.52 ± 1.1 b 3.42 ± 1 3.49 ± 0.9
Leptin (pg/ml) 13.8 ± 10 21.4 ± 12 b 17.4 ± 13 26.3 ± 16 b Adiponectin (pg/ml)
6.21 ± 1.7 8.9 ± 3.2 b 4.1 ± 2.8 6.9 ±3.7 b
hsCRP (ng/ml) 0.37 ± 0.2 0.39 ± 0.3 0.45 ± 0.3 0.41 ± 0.4 a , p<0.05 for patients with type 2 diabetes (T2D) versus normal glucose tolerant individuals (NGT) within each gender. b, p<0.05 for difference between males and females within the NGT or T2D group. Data are given as mean ± SD. BMI=body mass index, HbA1c=long term blood glucose parameter, HDL=high density lipoprotein, LDL=low density lipoprotein, hsCRP= high sensitivity C-reactive protein Within Cohort 1 significant differences could be found between Typ 2 Diabetics and NGT for parameters like BMI, Body fat, Fasting Plasma Glucose, HbA1c, Triglycerides and HDL-Cholesterol. Within the NGT and Typ 2 Diabetes groups following parameters differed significantly between males and females: Body fat, total cholesterol, HDL-Cholesterol, Leptin and Adiponectin.
2.2.2. Cohort 2 Investigation of chemerin mRNA expression in paired Omental (OM) and subcutaneous (SC) Tissue and chemerin concentrations Adipose tissue chemerin and CMKLR1 mRNA expression was investigated in previously described 161 donors of paired OM and SC adipose tissue samples who underwent
14
abdominal surgery for cholecystectomy, weight reduction surgery, abdominal injuries, or explorative laparotomy. From these individuals, we selected 32 that could be matched for age, sex, and BMI into subgroups of NGT and T2D. All subjects had a stable weight, defined as the absence of fluctuations of more than 2% of body weight for at least 3 months before surgery.
2.2.3. Cohort 3 Chemerin concentration in response to a 12-week intensive exercise intervention Sixty subjects were divided into groups of NGT (n=20; 9 male, 11 female), impaired glucose tolerance (IGT; n=20; 9 male, 11 female) and T2D (n=20; 11 male, 9 female) on the basis of a 75 g oral glucose tolerance test (OGTT) according to the American Diabetes Association criteria.
• Subjects with NGT were defined by fasting plasma glucose less than 6.0 mmol/L and 120-minute plasma glucose less than 7.8 mmol/L.
• Subjects with IGT were defined by fasting plasma glucose less than 6.0 mmol/L, and 120-minute plasma glucose greater than 7.8 mmol/L and less than 11.1 mmol/L.
• Subjects with T2D were defined by fasting plasma glucose greater than 7.0 mmol/L and/or 120-minute OGTT glucose greater than 11.1 mmol/L.
These 60 individuals were enrolled in 60 minutes of supervised physical training sessions 3 days per week.
2.2.4. Cohort 4 Six-month hypocaloric diet study Nineteen white obese volunteers (15 female, 4 male) attending the obesity outpatient clinic at the Medical Department, University of Leipzig were recruited. The patients underwent a clinical assessment including medical history, physical examination, dual x-ray absorptiometry scan analysis, comorbidity evaluation, as well as nutritional interviews performed by a multidisciplinary consultation team. In addition to the general exclusion criteria, patients with T2D and volunteers with any concomitant medication have been excluded from the study. Weight loss was achieved over a period of 6 months by a diet providing a daily energy deficit of 1200 kcal. Diet adherence was monitored by daily food intake protocols.
2.2.5. Cohort 5 Bariatric surgery study Thirty-two white obese volunteers (22 female, 10 male) participated in a prospective weight loss study before and 12 months after gastric sleeve resection or Roux-en-Y gastric bypass. In a subgroup of 14 (10 female, 4 male) patients, OM and SC adipose
15
tissue biopsies were obtained in the context of a 2-step bariatric surgery strategy with gastric sleeve resection as the first step and a Roux-en-Y gastric bypass as second-step operation. The baseline BMI in this subgroup was 64.1 ± 9.5 kg/m2, and the BMI 12 months after bariatric surgery was 48.3 ± 7.3 kg/m2.
2.3. Methods
2.3.1. Measurement of body fat content, glucose metabolism, and insulin sensitivity Body mass index was calculated as weight divided by squared height and hip circumference was measured over the buttocks. Waist circumference was measured at the midpoint between the lower ribs and iliac crest. Percentage body fat was determined by dual x-ray absorptiometry. In Cohort 2, abdominal visceral and SC fat areas were calculated using computed tomography (CT) scans at the level of L4-L5 in the cohort of paired visceral and SC adipose tissue donors. Three days before the OGTT, patients documented a high-carbohydrate diet in diet protocols. The OGTT was performed after an overnight fast with 75 g standardized glucose solution (Glucodex Solution 75 g; Merieux, Montreal, Canada). Venous blood samples were taken at 0, 60, and 120 minutes for measurements of plasma glucose concentrations. Insulin sensitivity was assessed using the homeostasis model assessment of insulin resistance (HOMA-IR) index or with the euglycemic-hyperinsulinemic clamp (insulin sensitivity was measured using the euglycemic-hyperinsulinemic clamp method, with an insulin infusion rate of 20 mIU/kg/min, as described49. The glucose disposal rate was defined as the glucose infusion rate during the last 30 min of the study. The maximal glucose infusion rate was capped at 99 µmol/kg/min in insulin-sensitive subjects.)
2.3.2. Analyses of blood samples All baseline blood samples were collected between 8:00 am and 10:00 am after an overnight fast. Plasma insulin was measured with an enzyme immunometric assay for the IMMULITE automated analyzer (Diagnostic Products, Los Angeles, CA). Serum high-sensitive CRP was measured by immunonephelometry (Dade-Behring, Milan, Italy). Serum total HDL-cholesterol, LDL-cholesterol, triglycerides, free fatty acids, total adiponectin (ELISA; Linco, St. Charles, MO), leptin, interleukin-6 (IL-6) also. Serum monocyte chemoattractant protein-1 (MCP-1) concentrations were measured by immunoassay system (Quantikine human MCP-1 Immunoassay; R & D Systems, Minneapolis, MN). Serum chemerin was measured by an enzyme-linked immunosorbent assay (Biovendor, Heidelberg, Germany).
16
2.3.3. Chemerin and CMKLR1 mRNA Expression Studies Human chemerin and CMKLR1 mRNA Expression was measured by qPCR in a fluorescent temperature cycler using the TaqMan Assay and Fluorescence was detected on an ABI Prism 7000 Sequence detector. (Applied Biosystems, Darmstadt, Germany). Total RNA was isolated using TRIzol (Life technologies, Grand Island, NY), and 1 µg RNA was then reversed transcribed with standard reagents (Life Technologies). From each PCR, 2 µl were amplified in a 26 µl PCR using the Brilliant SYBR Green QPCR Core Reagent Kit from Strategene (La Jolla, USA). Primers Used:
Gene direction Primers Chemerin forward 5’-GGAAGAAACCCGAGTGCAAG-3’
reverse 5’-TGATGCAGGCCAGGCATT- 3’ CMKLR1 forward 5’-CTCCCAATCCATATCACCTA-3’
reverse 5’-GCAGAGGAAGAAGGTAATGA-3’ qPCR- Protocol:
Procedure Temperature Time
Initial Denaturation 95 °C 10 minutes 40 cycles
95 °C 15 seconds 60 °C 1 minute 72 °C 1 minute
SYBR Green fluorescence emissions were monitored after each cycle. Human chemerin and CMKLR1 mRNA expression was calculated relative to the mRNA expression of 18s ribosomal RNA (rRNA), determined by premixed assay on demand for 18s rRNA (Applied Biosystems). Amplification of specific transcripts was confirmed by melting curve profiles at the end of each PCR. The specificity of the PCR was further verified by subjecting the amplification products to agarose gel electrophoresis.
2.3.4. Histologic analyses and measurement of macrophage count in adipose tissue (Cohort 2) SC and OM adipose tissue samples were immediately frozen in liquid nitrogen after explantation. The SC and OM fat samples were fixed at room temperature in 4% formaldehyde and embedded in paraffin. Five-micrometer sections were mounted on glass slides, deparaffinized in xylol, and stained for CD68 using anti-CD68 monoclonal mouse antihuman antibody (Dako, Glostrup, Denmark; close PGM1 M0876, dilution 1:100), using standard immunohistochemistry methods. Macrophages were identified in the
17
adipose parenchyma (CD68 within blood vessels were excluded) when cytoplasmic staining for CD68 was present along with an identifiable mononuclear nucleus and presented as the number per 100 adipocytes (percent macrophages) or as number of cells per 12 x 400 fields, as indicated. Counting was performed blinded to sample data and was confirmed by a certified pathologist (N.S.-V.). 2.3.5. 12 Week Training (Cohort 3) Each training session included 20 minutes of biking or running, 20 minutes of swimming, and 20 minutes of warming up/cooling down periods. All subjects completed a graded bicycle ergometer test to volitional exhaustion and had maximal oxygen uptake measured with an automated open circuit gas analysis system at baseline and after 4 and 12 weeks of training. The highest oxygen uptake per minute reached was defined as the maximal oxygen uptake, and subjects subsequently trained at their individual submaximal heart rate defined as 70% to 80% of the individual maximal heart rate during the bicycle ergometer test. At baseline and after 4 and 12 weeks of training (48 hours after the last training session), blood samples were obtained in the fasting state; and measurements of anthropometric parameters were performed.
2.4. Statistical Analysis Data are shown as mean ± standard deviation (SD) unless stated otherwise. Prior to statistical analysis, non-normally distributed parameters were ln-transformed to approximate a normal distribution. Differences in mRNA expression between visceral and subcutaneous adipose tissue were assessed using the paired Student's t-test. Also following statistical tests were used: -Test, and Pearson simple correlation. Linear relationships were assessed by least square regression analysis. Statistical Analysis was performed using SPSS Version 12.0 (Chicago, IL). P-Values <0.05 were considered to be statistically significant.
3. Results
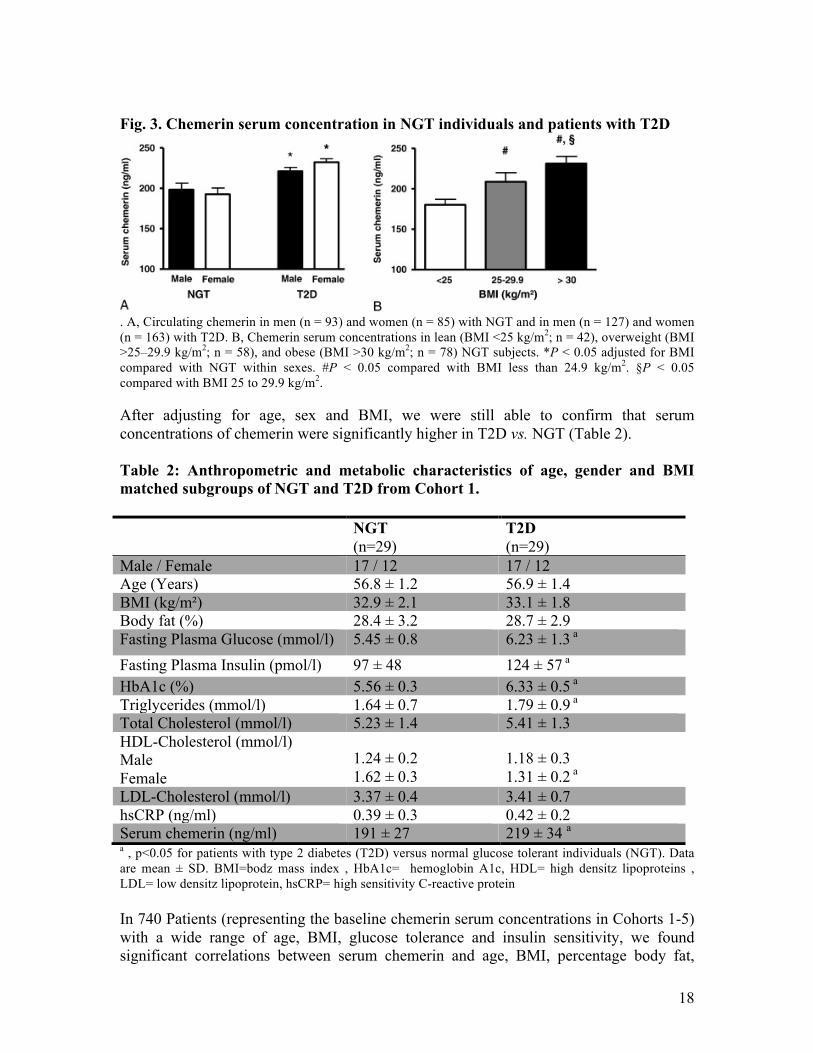
3.1. Chemerin serum concentration in obesity and T2D Anthropometric and metabolic characteristics of Cohort 1 are described in the Material and Methods – Subjects section. Chemerin concentrations were similar between male and female NGTs and T2D (Fig.3A). Chemerin serum concentration was significantly higher in individuals with T2D as compared to NGT. In addition, we found significantly increasing chemerin serum concentrations from lean to overweight and obese individuals with NGT (Fig. 3B).
18
Fig. 3. Chemerin serum concentration in NGT individuals and patients with T2D
. A, Circulating chemerin in men (n = 93) and women (n = 85) with NGT and in men (n = 127) and women (n = 163) with T2D. B, Chemerin serum concentrations in lean (BMI <25 kg/m2; n = 42), overweight (BMI >25–29.9 kg/m2; n = 58), and obese (BMI >30 kg/m2; n = 78) NGT subjects. *P < 0.05 adjusted for BMI compared with NGT within sexes. #P < 0.05 compared with BMI less than 24.9 kg/m2. §P < 0.05 compared with BMI 25 to 29.9 kg/m2. After adjusting for age, sex and BMI, we were still able to confirm that serum concentrations of chemerin were significantly higher in T2D vs. NGT (Table 2). Table 2: Anthropometric and metabolic characteristics of age, gender and BMI matched subgroups of NGT and T2D from Cohort 1.
NGT (n=29)
T2D (n=29)
Male / Female 17 / 12 17 / 12 Age (Years) 56.8 ± 1.2 56.9 ± 1.4 BMI (kg/m²) 32.9 ± 2.1 33.1 ± 1.8 Body fat (%) 28.4 ± 3.2 28.7 ± 2.9 Fasting Plasma Glucose (mmol/l) 5.45 ± 0.8 6.23 ± 1.3 a
Fasting Plasma Insulin (pmol/l) 97 ± 48 124 ± 57 a HbA1c (%) 5.56 ± 0.3 6.33 ± 0.5 a Triglycerides (mmol/l) 1.64 ± 0.7 1.79 ± 0.9 a Total Cholesterol (mmol/l) 5.23 ± 1.4 5.41 ± 1.3 HDL-Cholesterol (mmol/l) Male Female
1.24 ± 0.2 1.62 ± 0.3
1.18 ± 0.3 1.31 ± 0.2 a
LDL-Cholesterol (mmol/l) 3.37 ± 0.4 3.41 ± 0.7 hsCRP (ng/ml) 0.39 ± 0.3 0.42 ± 0.2 Serum chemerin (ng/ml) 191 ± 27 219 ± 34 a a , p<0.05 for patients with type 2 diabetes (T2D) versus normal glucose tolerant individuals (NGT). Data are mean ± SD. BMI=bodz mass index , HbA1c= hemoglobin A1c, HDL= high densitz lipoproteins , LDL= low densitz lipoprotein, hsCRP= high sensitivity C-reactive protein In 740 Patients (representing the baseline chemerin serum concentrations in Cohorts 1-5) with a wide range of age, BMI, glucose tolerance and insulin sensitivity, we found significant correlations between serum chemerin and age, BMI, percentage body fat,
19
waist and hip circumferences, fasting plasma glucose, HbA1c, fasting plasma insulin, insulin sensitivity as determined by HOMA-IR and/or glucose infusion rate (GIR) during the steady state of an euglycemic-hyperinsulinemic clamp, triglycerides (TG), C-reactive protein (CRP), creatinine, as well as adipocyte size and the number of macrophages in visceral adipose tissue. Correlations between chemerin concentrations and age, GIR, CRP, creatinine, and parameters of adipose tissue biology remained significant even after adjusting for BMI.
3.2. Chemerin and CMKLR1 mRNA expression in OM and SC adipose tissue The 161 patients previously described in Cohort 2 were classified into lean and predominately subcutaneously or viscerally obese by means of abdominal visceral and subcutaneous fat area measurements using computer tomography (CT) or magnetic resonance imaging (MRI) scans at L4-L5 level. We then investigated chemerin and CMKLR1 mRNA Expression in both fats deposits in parallel with serum chemerin concentrations. NGT vs. T2D: We found chemerin expression of SC and OM fat deposits to be approximately 1.4 fold higher in T2Ds compared with NGTs. Chemerin expression in SC and OM fat deposits did not differ in NGTs, interestingly, chemerin expression was significantly higher in OM fat as compared to SC fat in T2Ds. In age-, sex-, and BMI-matched subgroups of NGT (n=16) and T2D (n=16), we confirmed significantly higher chemerin mRNA expression in both fat depots in T2Ds. Lean vs. obese: Lean individuals were shown to have significantly lower chemerin expression in OM and SC adipose tissue as compared to obese individuals independently of subclass. Interestingly, chemerin expression was not different between the 2 obesity subclasses (central and subcutaneous). Again we were able to show significant correlations of OM and SC chemerin mRNA expression with chemerin serum concentrations as well as parameters of obesity, glycemic control, insulin sensitivity and inflammation as well as adipose tissue biology. After adjusting for BMI, OM chemerin mRNA expression still correlated significantly with GIR, HOMA-IR, fasting plasma insulin, CRP as well as adipose tissue biology such as mean adipocyte size and number of macrophages in adipose tissue. On the other hand subcutaneous chemerin mRNA expression only correlated with adipocyte size, CRP and TG levels independently of BMI.
20
CMKLR1 Expression In contrast to chemerin, CMKLR1 mRNA expression was not significantly different between NGTs and T2Ds, nor was it in OM and SC adipose tissue in both NGTs and T2Ds. CMKLR1 mRNA Expression was not significantly different between lean and obese individuals (independently of obesity subclass), nor was it significantly different between the 2 subclasses of obesity in OM and SC fat. Noteworthy is on the other hand a tendency for lower CMKLR1 mRNA expression in OM but not in SC fat depot in obese compared with lean individuals although not significant. Table 3. Univariate correlations (Spearman) between chemerin serum concentration and chemerin mRNA expression in OM and SC adipose tissue and measures of obesity, insulin sensitivity and parameters of inflammation Cohorts Serum chemerin
(baseline) OM chemerin mRNA SC chemerin
mRNA Cohorts 1-5 (n=740) Cohort 2 (n=161) Cohort 2 (n=161) r P value r P value r P value Serum chemerin
- - 0,33 <0,1 0,16 0,3
Age 00,3,33 (0,21)
<0.0001 (<0,1)
0,21 (0,04)
<0,1 (NS) 0,12 (0,06)
NS (NS)
Sex 0,03 NS 0,06 NS BMI 0,35 (-) <0,0001
(-) 0,33 (-) <001 (-) 0,24 (-) <0,01 (-)
% Body fat 0,39 (0,05)
<0,0001 (NS)
0,25 (0,13)
<0,01 (0,06) 0,22 (0,1)
<0,01 (0,09)
Hip circumference
0,17 (0,03)
0,02 (NS) 0,09 (0,03)
NS (NS) 0,06 (0,04)
NS (NS)
Waist circumference
0,21 (0,05)
0,003(NS) 0,18 (0,1)
0,02 (NS) 0,11 (0,08)
NS (NS)
Fasting plasma glucose
0,19 (0,07)
0,007 (NS)
0,1 (0,03)
NS (NS) 0,07 (0,05)
NS (NS)
HbA1c 0,14 (0,05)
0,009 (NS)
0,2 (0,08)
0,02 (NS) 0,1 (0,04)
NS (NS)
Fasting plasma insulin
0,2 (0,09) 0,005 (NS)
0,38 (0,19)
<0,01(<0,05) 0,24 (0,08)
<0,01 (NS)
HOMA-IR 0,22 (0,13)
0,002 (0,08)
0,35 (0,22)
<0,01 (<0,01)
0,19 (0,09)
<0,01 (NS)
GIR 0,26 (0,17)
0,001 (0,01)
0,41 (0,27)
<0,01 (0,01) 0,26 (0,11)
<0,01 (NS)
Triglycerides 0,2 (0,05) 0,006 0,1 NS (NS) 0,31 <0m01
21
(NS) (0,02) (0,19) (<0,01) hsCRP 0,38
(0,25) <0,0001 (<0,01)
0,38 (0,26)
<0,01 (<0,01)
0,35 (0,22)
<0,01 (<0,01)
Creatinine 0,25 (0,16)
<0,0001 (0,02)
0,04 (0,02)
NS (NS) 0,01 (0,01)
NS (NS)
Mean adipocyte size
0,18 (0,15)
0,008 (<0,05)
0,32 (0,18)
<0,01 (<0,05)
0,27 (0,15)
<0,01 (<0,5)
%Macrophages in adipose tissue
0,15 (0,14)
0,03 (<0,05)
0,35 (0,23)
<0,01 (<0,01)
0,07 (0,02)
NS (NS)
In brackets: r and P value adjusted for BMI. r indicates Spearman correlation coefficient; NS, not significant
3.3. Changes in chemerin serum concentrations in response to different weight loss interventions To dissect the relationship between chemerin concentrations and obesity as well as markers of insulin sensitivity, we investigated changes in chemerin concentrations in 3 different interventions as stated above. We found significantly reduced chemerin concentrations after 6 months of hypocaloric diet intervention. As expected, significant changes in BMI, markers of insulin resistance and inflammation (CRP) were noted, which, in the multivariate analyses were strong predictors for changes in circulation chemerin. Interestingly, both improved GIR and CRP were associated with changes in chemerin levels independently of changes in body weight. Table 4. Effects of weight loss achieved by 6 months hypocaloric diet (Cohort 4) or 12 months after bariatric surgery (Cohort 5) on anthropometric and metabolic parameters.
Hypocaloric diet intervention
Cohort 4 (n=19)
Bariatric surgery intervention Cohort 5 (n=32)
Baseline 6 m. post Baseline 12 m. post
Age (years) 49 ± 3 - 45 ± 12 -
BMI (kg/m²) 36.4 ± 1.2 34.5 ± 1.5* 55.8 ± 7.9 37.1 ± 8.8*
Body fat (%) 38.0 ± 2.9 35.4 ± 3* 57.1 ± 9.1 39.6 ± 9.2*
HbA1c (%) 5.7 ± 0.1 5.4 ± 0.1 6.7 ± 0.9 5.9 ± 0.4*
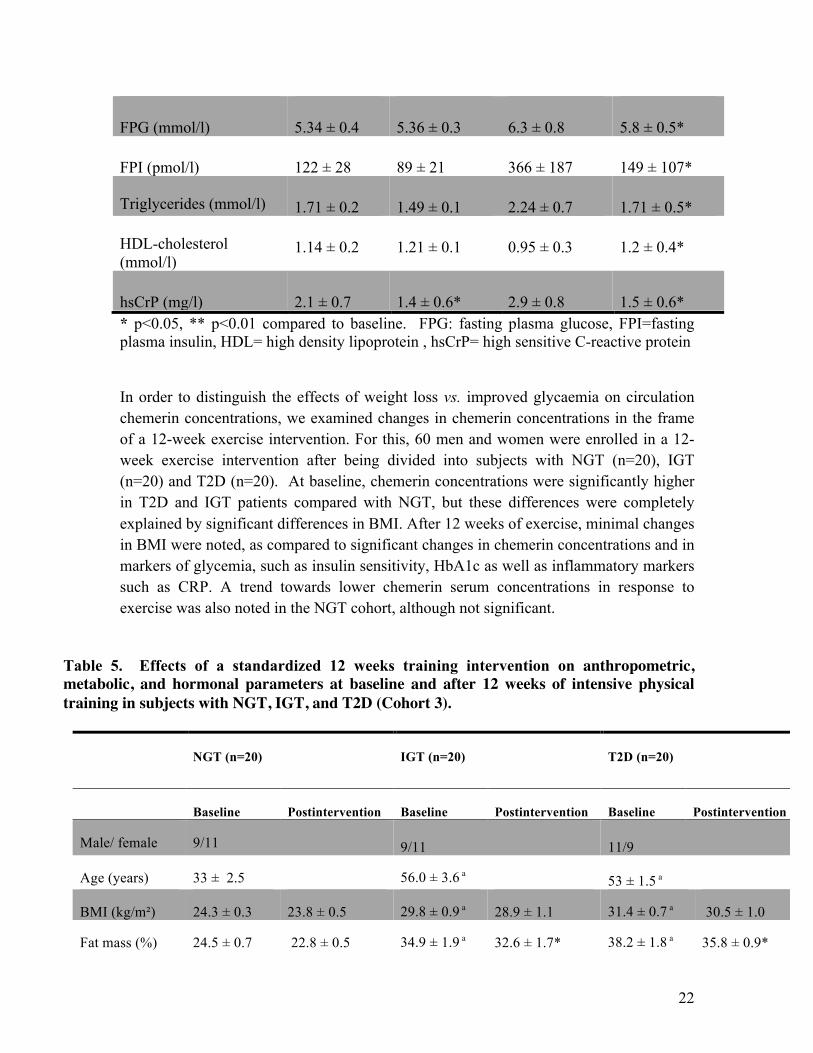
22
FPG (mmol/l) 5.34 ± 0.4 5.36 ± 0.3 6.3 ± 0.8 5.8 ± 0.5*
FPI (pmol/l) 122 ± 28 89 ± 21 366 ± 187 149 ± 107* Triglycerides (mmol/l) 1.71 ± 0.2 1.49 ± 0.1 2.24 ± 0.7 1.71 ± 0.5* HDL-cholesterol (mmol/l)
1.14 ± 0.2 1.21 ± 0.1 0.95 ± 0.3 1.2 ± 0.4*
hsCrP (mg/l) 2.1 ± 0.7 1.4 ± 0.6* 2.9 ± 0.8 1.5 ± 0.6* * p<0.05, ** p<0.01 compared to baseline. FPG: fasting plasma glucose, FPI=fasting plasma insulin, HDL= high density lipoprotein , hsCrP= high sensitive C-reactive protein In order to distinguish the effects of weight loss vs. improved glycaemia on circulation chemerin concentrations, we examined changes in chemerin concentrations in the frame of a 12-week exercise intervention. For this, 60 men and women were enrolled in a 12-week exercise intervention after being divided into subjects with NGT (n=20), IGT (n=20) and T2D (n=20). At baseline, chemerin concentrations were significantly higher in T2D and IGT patients compared with NGT, but these differences were completely explained by significant differences in BMI. After 12 weeks of exercise, minimal changes in BMI were noted, as compared to significant changes in chemerin concentrations and in markers of glycemia, such as insulin sensitivity, HbA1c as well as inflammatory markers such as CRP. A trend towards lower chemerin serum concentrations in response to exercise was also noted in the NGT cohort, although not significant.
Table 5. Effects of a standardized 12 weeks training intervention on anthropometric, metabolic, and hormonal parameters at baseline and after 12 weeks of intensive physical training in subjects with NGT, IGT, and T2D (Cohort 3).
NGT (n=20) IGT (n=20) T2D (n=20)
Baseline Postintervention Baseline Postintervention Baseline Postintervention
Male/ female 9/11 9/11
11/9
Age (years) 33 ± 2.5 56.0 ± 3.6 a
53 ± 1.5 a
BMI (kg/m²) 24.3 ± 0.3 23.8 ± 0.5 29.8 ± 0.9 a 28.9 ± 1.1 31.4 ± 0.7 a 30.5 ± 1.0
Fat mass (%) 24.5 ± 0.7 22.8 ± 0.5 34.9 ± 1.9 a 32.6 ± 1.7* 38.2 ± 1.8 a 35.8 ± 0.9*
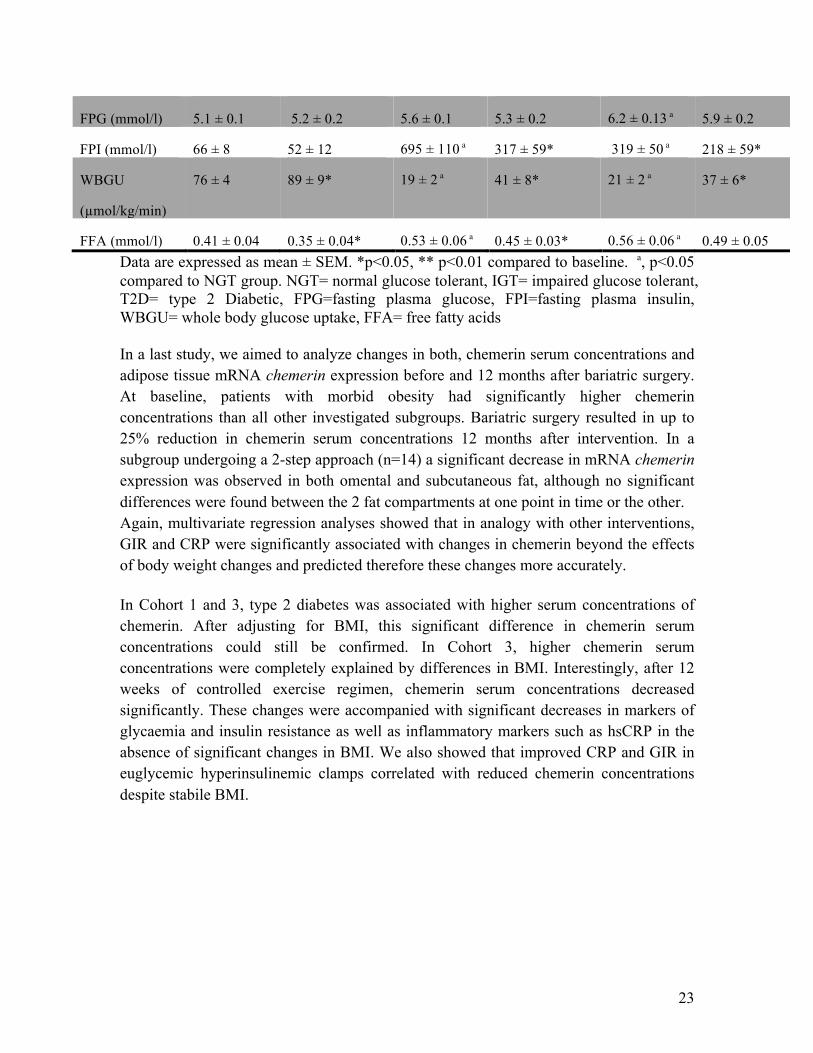
23
FPG (mmol/l) 5.1 ± 0.1 5.2 ± 0.2 5.6 ± 0.1 5.3 ± 0.2 6.2 ± 0.13 a 5.9 ± 0.2
FPI (mmol/l) 66 ± 8 52 ± 12 695 ± 110 a 317 ± 59* 319 ± 50 a 218 ± 59*
WBGU
(µmol/kg/min)
76 ± 4 89 ± 9* 19 ± 2 a 41 ± 8* 21 ± 2 a 37 ± 6*
FFA (mmol/l) 0.41 ± 0.04 0.35 ± 0.04* 0.53 ± 0.06 a 0.45 ± 0.03* 0.56 ± 0.06 a 0.49 ± 0.05 Data are expressed as mean ± SEM. *p<0.05, ** p<0.01 compared to baseline. a, p<0.05 compared to NGT group. NGT= normal glucose tolerant, IGT= impaired glucose tolerant, T2D= type 2 Diabetic, FPG=fasting plasma glucose, FPI=fasting plasma insulin, WBGU= whole body glucose uptake, FFA= free fatty acids In a last study, we aimed to analyze changes in both, chemerin serum concentrations and adipose tissue mRNA chemerin expression before and 12 months after bariatric surgery. At baseline, patients with morbid obesity had significantly higher chemerin concentrations than all other investigated subgroups. Bariatric surgery resulted in up to 25% reduction in chemerin serum concentrations 12 months after intervention. In a subgroup undergoing a 2-step approach (n=14) a significant decrease in mRNA chemerin expression was observed in both omental and subcutaneous fat, although no significant differences were found between the 2 fat compartments at one point in time or the other. Again, multivariate regression analyses showed that in analogy with other interventions, GIR and CRP were significantly associated with changes in chemerin beyond the effects of body weight changes and predicted therefore these changes more accurately. In Cohort 1 and 3, type 2 diabetes was associated with higher serum concentrations of chemerin. After adjusting for BMI, this significant difference in chemerin serum concentrations could still be confirmed. In Cohort 3, higher chemerin serum concentrations were completely explained by differences in BMI. Interestingly, after 12 weeks of controlled exercise regimen, chemerin serum concentrations decreased significantly. These changes were accompanied with significant decreases in markers of glycaemia and insulin resistance as well as inflammatory markers such as hsCRP in the absence of significant changes in BMI. We also showed that improved CRP and GIR in euglycemic hyperinsulinemic clamps correlated with reduced chemerin concentrations despite stabile BMI.
24
4. Discussion Chemerin is a hepatoadipokine, which induces insulin resistance in skeletal muscle cells in vivo and plays an important role in the negative cross talk between adipose tissue, liver and muscle.50 Chemerin serum concentrations correlate with BMI, traits of the metabolic syndrome including high plasma glucose and triglycerides as well as low high-density lipoprotein cholesterol and increased blood pressure.51 High serum concentrations were also found in insulin resistant states such as polycystic ovary syndrome.52 Baseline chemerin concentrations were also elevated with significant activity score for nonalcoholic fatty liver disease, portal inflammation, fibrosis, and fibroinflammation in obese patients and decreased significantly after bariatric surgery.53 Insulin resistant states were found to be associated with increased chemerin levels54, 55 and treatment with metformin decreased elevated chemerin concentrations.56 It remained unclear though, whether elevated chemerin concentrations were due to:
- obesity57 - insulin resistance58 - hyperglycemia59or - inflammatory response.60
We addressed this controversy by measuring dynamic changes in chemerin serum concentrations in 3 intervention studies. Across the 5 included cohorts we found significant correlation between chemerin serum concentrations and BMI, markers of insulin resistance and inflammation. In weight loss intervention studies, significant changes in chemerin levels were accompanied by changes in BMI, a shift towards improved glucose tolerance and a decrease in inflammatory markers such as hsCRP.
4.1 Chemerin and Obesity In Cohort 1, chemerin serum concentrations were shown to increase from lean to overweight and obese normal glucose tolerant individuals. We confirmed that chemerin serum concentrations were elevated in morbidly obese as compared to lean individuals. We also confirmed that chemerin serum concentrations are elevated in morbidly obese patients and significant weight loss as reflected in drastic reduction in BMI after bariatric surgery led to a significant decrease in chemerin concentrations.61 Also we showed for the first time, that moderate weight loss in the frame of a 6 months calorie-restricted diet study (Cohort 4) significantly decreases chemerin serum concentrations. Interestingly, multivariate linear regression analyses demonstrated that
25
reduced hsCRP serum concentrations and improved insulin sensitivity predicted changes in chemerin serum concentrations beyond changes in BMI.
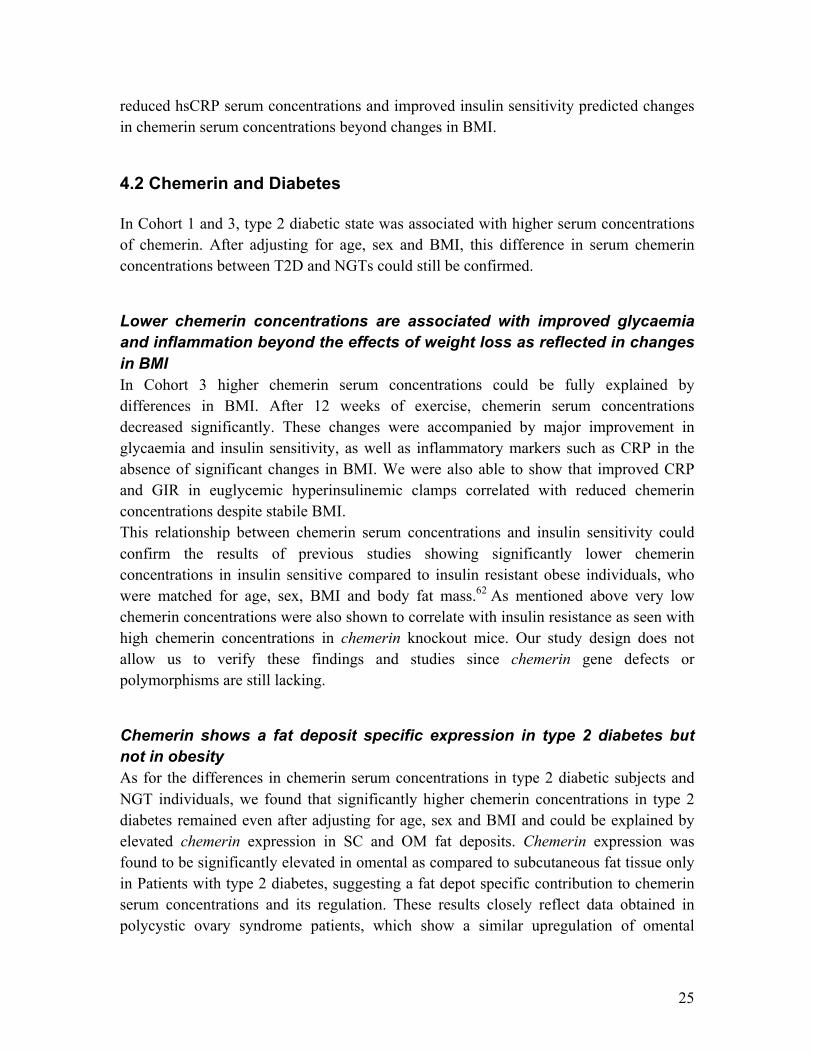
4.2 Chemerin and Diabetes In Cohort 1 and 3, type 2 diabetic state was associated with higher serum concentrations of chemerin. After adjusting for age, sex and BMI, this difference in serum chemerin concentrations between T2D and NGTs could still be confirmed.
Lower chemerin concentrations are associated with improved glycaemia and inflammation beyond the effects of weight loss as reflected in changes in BMI In Cohort 3 higher chemerin serum concentrations could be fully explained by differences in BMI. After 12 weeks of exercise, chemerin serum concentrations decreased significantly. These changes were accompanied by major improvement in glycaemia and insulin sensitivity, as well as inflammatory markers such as CRP in the absence of significant changes in BMI. We were also able to show that improved CRP and GIR in euglycemic hyperinsulinemic clamps correlated with reduced chemerin concentrations despite stabile BMI. This relationship between chemerin serum concentrations and insulin sensitivity could confirm the results of previous studies showing significantly lower chemerin concentrations in insulin sensitive compared to insulin resistant obese individuals, who were matched for age, sex, BMI and body fat mass.62 As mentioned above very low chemerin concentrations were also shown to correlate with insulin resistance as seen with high chemerin concentrations in chemerin knockout mice. Our study design does not allow us to verify these findings and studies since chemerin gene defects or polymorphisms are still lacking.
Chemerin shows a fat deposit specific expression in type 2 diabetes but not in obesity As for the differences in chemerin serum concentrations in type 2 diabetic subjects and NGT individuals, we found that significantly higher chemerin concentrations in type 2 diabetes remained even after adjusting for age, sex and BMI and could be explained by elevated chemerin expression in SC and OM fat deposits. Chemerin expression was found to be significantly elevated in omental as compared to subcutaneous fat tissue only in Patients with type 2 diabetes, suggesting a fat depot specific contribution to chemerin serum concentrations and its regulation. These results closely reflect data obtained in polycystic ovary syndrome patients, which show a similar upregulation of omental
26
adipose tissue chemerin expression, whereas healthy controls showed no fat depot specific expression of chemerin.63 When comparing lean and obese individuals we show that chemerin expression was elevated in both fat depots in obese as compared to lean subjects, reflecting elevated chemerin serum concentrations, but no significant differences were seen between the 2 fat depots in lean and obese patients.
Omental chemerin correlates significantly with markers of insulin resistance and adipose tissue biology After adjusting for BMI, OM chemerin mRNA expression still correlated significantly with markers of insulin resistance and inflammation as well as adipose tissue biology such as mean adipocyte size and numbers of macrophages in adipose tissue. The latter finding was described earlier and suggests a direct link between elevated chemerin serum concentrations and expression, as well as adipose tissue inflammation and dysfunction.64,65 This was supported by the finding that TNFα significantly increases chemerin expression in adipocytes66 and anti-TNFα therapy reduces serum levels of chemerin.67 The correlation between chemerin expression, serum concentrations and adipocyte size in both OM and SC tissue could mechanistically link adipocyte hypertrophy and subsequent insulin resistance to increased chemerin serum concentrations.
Changes in adipose tissue function and metabolic state are explained by elevated chemerin serum concentrations rather than elevated CKMLR1 expression It is important to mention that CMKLR1 mRNA expression was not significantly different between NGTs and T2Ds or lean and obese individuals. We also did not see fat depot specific differences in CMKLR1 expression, suggesting that changes in adipose tissue function or metabolic state can be explained by changes in serum chemerin concentrations rather than CKMLR1 expression. That said we did not perform functional studies on CMKLR1. In summary, it is difficult to establish a clear causality chain whether adipocyte hypertrophy or adipose tissue inflammation cause increase in chemerin or whether increased chemerin expression causes adipose tissue inflammation with subsequent insulin resistance. Although synthetic chemerin derived peptides were shown to suppress inflammation through ChemR2368, most publications suggest an important role for chemerin as a potent
27
chemoattractant of antigen presenting cells (APCs) in compartments with inflammation. After proteolytic cleavage, chemerin activates CMKLR1 and induces the migration of macrophages and dendritic cells.69 Given the fact that APCs are often preceded by polymorphonuclear neutrophils (PMNs) in inflamed tissues, it was hypothesized that PMNs could mediate chemerin generation and in fact, it was suggested that bioactive chemerin generation takes place during the early stages of inflammation, underscoring the functional contribution of chemerin as a bridge between innate and adaptive immunity.70 Interestingly, chemerin was found to bind CCRL2, thereby increasing its own local concentration in order to be efficiently presented to CMKLR1 on nearby cells, therefore preserving a proinflammatory state.71 In addition, chemerin may modulate adipose tissue function directly by regulating adipocyte differentiation and expression if adipocyte genes involved in glucose and lipid metabolism.72 In obesity, elevated adipose tissue chemerin as well as circulating chemerin could lead to recruitment of CMKLR1-expressing immune cells promoting inflammation and driving the alteration in the secretion of adipokines and cytokines leading to the mentioned adipose tissue dysfunction. Chemerin’s promotion of angiogenesis involved in the hyperplasia of adipose tissue could cause alteration in the function and structure of fat tissue. Chemerin is also deeply involved in the modulation of systemic glucose regulation. It is also noteworthy, that high levels of chemerin can be measured in hepatic venous blood, suggesting that chemerin is also released by the liver.73 However, our study design does not allow investigating the role of hepatic chemerin secretion in the observed correlation between obesity, insulin sensitivity, glucose metabolism and inflammation, although it suggests a possible contribution of chemerin to the metabolic facets of liver cirrhosis. In conclusion, we show that impaired insulin sensitivity and circulating parameters of inflammation are BMI-independent predictors of elevated chemerin serum concentrations in obesity and associated diseases. In the light of the role of chemerin in the recruitment of inflammatory cells, our data support an important role for chemerin in the initiation of adipose tissue inflammation and dysfunction, posing the question of its involvement in the evolution and occurrence of cardiovascular disease. It also suggests that reduced adipose chemerin expression may contribute to improved insulin sensitivity and subclinical inflammation beyond the effects of weight loss.
28
5. Zusammenfassung der Arbeit Dissertation zur Erlangung des akademischen Grades Dr. med. Untersuchungen zur Auswirkung von Gewichtsreduktionsmaßnahmen sowie Sport Intervention auf die Serum Konzentrationen von Chemerin und seine Expression im menschlichen Fettgewebe bei Adipositas Eingereicht von: Rima Chakaroun, geboren am 08.10.1983 in Saida, Libanon Angefertigt an der: Medizinischen Klinik III/ Universität Leipzig Betreut von: Prof. Dr. med. Matthias Blüher Einreichung…. 2013 Auch wenn aktuell heiß diskutiert wird, ob Adipositas tatsächlich mit einer erhöhten Mortalität durch ihren Beitrag zur Entstehung von kardiovaskulären und metabolischen Erkrankungen vergesellschaftet ist, bleibt sie und die mit ihr assoziierten Komorbiditäten vor allem in den Industrienationen eine zunehmende gesellschaftliche und ökonomische, sowie gesundheitliche Last. In den letzten Jahren entfernten wir uns zunehmend vom klassischen Bild des Fettgewebes als reines Speichergewebe für überschüssiges Fett hin zum Bild eines der größten endokrinen Gewebe des menschlichen Körpers. Viele vom Fettgewebe sezernierten Proteine scheinen eine wichtige Rolle als Mediatoren und Regulatoren von Insulinresistenz und Dyslipidämie zu spielen. Zusätzlich fungieren sie sowohl autokrin als auch parakrin als Modulatoren von physiologischen Regelkreisläufen und inflammatorischen Prozessen. Kürzlich wurde Chemerin als ein neues proinflammatorisches Hepatoadipokin vorgestellt, welches die Adipogenese reguliert und potenziell zur Induktion von Insulinresistenz führt. Sowohl das im Fettgewebe exprimierte, als auch zirkulierende Chemerin scheinen bei adipösen Mausmodellen wie z.B. ob-/ob- und db-/db- Mäusen vielfach erhöht zu sein.
29
Auch populationsbasierte Studien zeigten erhöhte Chemerinkonzentrationen bei adipösen Erwachsenen. Interessant war auch, dass explantiertes Fettgewebe von adipösen Patienten signifikant mehr Chemerin produzierte. Das erhöhte Chemerin korrelierte mit dem BMI und dem Taille-Hüft-Verhältnis sowie dem Fettzellvolumen. Zudem ist zirkulierendes Chemerin bei insulinresistenten Stoffwechsellagen wie Diabetes mellitus und polyzystisches Ovarien Syndrom aber auch bei inflammatorischen Erkrankungen wie Morbus Crohn, chronischer Pankreatitis und Colitis Ulcerosa erhöht. Korrespondierend hierzu senkten die anti-inflammatorische Therapie sowie die Therapie mit Metformin das zirkulierende Chemerin. Chemerin entwickelt seine Effekte über mehrere Rezeptoren. Dabei scheint lediglich CKMLR1 in der Vermittlung von Entzündung und Insulinresistenz in den durchgeführten Studien eine Rolle zu spielen. Bislang existierten nur wenige Studien über die Auswirkungen von Sport-Intervention und gewichtsreduktiven Maßnahmen auf die Chemerinkonzentration und -expression. In der vorliegenden Arbeit wurden die Unterschiede im zirkulierenden Chemerin in den verschiedenen Stadien von Adipositas und Insulinresistenz untersucht. Weiterhin wurde die Expression von Chemerin in subkutanem und viszeralem Fettgewebe und die Expression von CMKLR1 bei Adipositas analysiert. In zusätzlichen Untersuchungen wurden die Auswirkungen von drei verschiedenen Interventionen auf das zirkulierende Chemerin untersucht, hierfür folgten 60 Patienten einem Trainingsprogramm für 12 Wochen, 19 Patienten führten 6 Monate lang eine hypokalorische Diät und 32 Patienten unterzogen sich einer bariatrischen chirurgischen Operation. In den vorgelegten Studien konnte gezeigt werden, dass Chemerin mRNA im Fettgewebe von Patienten mit Typ 2 Diabetes im Vergleich zu normal Glukose-toleranten Probanden (NGT) signifikant erhöht exprimiert ist und mit zirkulierendem Chemerin korreliert. Auch korreliert sie mit dem Body-Mass Index (BMI), dem Körperfettanteil und CRP sowie HOMA-IR (Index für Insulinresistenz) und der Glukoseaufnahmerate in euglykämischen – hyperinsulinämischen Clamp Studien. Chemerin ist zudem bei Adipositas signifikant erhöht. Ein Unterschied in der Expression von Chemerin zwischen subkutanem und viszeralem Fettgewebe zeigte sich lediglich bei Typ 2 Diabetischen Probanden. Alle Interventionen führten zu einem Abfall des zirkulierenden Chemerins. Hier konnte erstmals gezeigt werden, dass eine hypokalorische Diät zu einer signifikanten Abnahme des zirkulierenden Chemerins führt. Bariatrische Chirurgie bewirkte nach einem Jahr einen signifikanten Abfall der Chemerinexpression in viszeralem und subkutanem Fettgewebe. Sowohl Insulinresistenz als auch Inflammation scheinen BMI-unabhängige Prädiktoren für erhöhtes zirkulierendes Chemerin zu sein.

30
Die vorgestellten Daten weisen darauf hin, dass Chemerin möglicherweise eine wichtige Rolle in der Initiierung der Inflammation und Dysfunktion im Fettgewebe spielt und somit zur Entwicklung der assoziierten kardiovaskulären Begleiterkrankungen beitragen könnte. Auch scheint eine Verminderung der Chemerinexpression im Fettgewebe basierend auf Gewichtsreduktion zu einer Verbesserung der Glukosetoleranz zu führen. Die genauen Signalwege, die zu den beobachteten Effekten von Chemerin führen, müssen jedoch weiterhin aufgeschlüsselt werden.
31
6. Abkürzungsverzeichnis APC antigen presenting cells BMI body mass index CCRL2 chemokine (CC motif) receptor-like 2 ChemR23 chemerin receptor 23 CMKLR chemokine like receptor CRP C-reactive protein DC dendritic cell Elisa enzyme-linked immunosorbent assay FPG fasting plasma glucose FPI fasting plasma insulin GPCR G-Protein coupled receptor HDL high density lipoprotein IFN interferon IL interleukin KO mice knockout mice LDL low density lipoprotein MCP monocyte chemoattractant protein MetS metabolic syndrome mRNA messenger ribonucleic acid NK cells natural killer cells NGT normal glucose tolerant OGTT oral glucose tolerance test PMN polymorphonuclear cells qPCR quantitative polymerase chain reaction RANTES regulated on activation normal T cell expressed and secreted sIL-1R soluble interleukin-1 receptor sTNFR soluble tumor necrosis factor receptor T2D type 2 diabetes TNF Tumor necrosis factor Alpha TG Triglycerides TGF Tumor growth factor WAT white adipose tissue WBGU whole body glucose uptake WHR Waist-to-hip ratio
32
7. Eigenständigkeitserklärung Erklärung über die eigenständige Abfassung der Arbeit Hiermit erkläre ich, dass ich die vorliegende Arbeit selbstständig und ohne unzulässige Hilfe oder Benutzung anderer als der angegebenen Hilfsmittel angefertigt habe. Ich versichere, dass Dritte mir weder unmittelbar noch mittelbar geldwerte Leistungen für Arbeiten erhalten haben, die im Zusammenhang mit dem Inhalt der vorgelegten Dissertation stehen, und dass die vorgelegte Arbeit weder im Inland noch im Ausland in gleicher oder ähnlicher Form einer anderen Prüfungsbehörde zum Zweck einer Promotion oder eines anderen Prüfungsverfahrens vorgelegt wurde. Alles aus anderen Quellen und von anderen Personen übernommene Material, das in der Arbeit verwendet wurde oder auf das direkt Bezug genommen wird, wurde als solches kenntlich gemacht. Insbesondere wurden alle Personen genannt, die direkt an der Entstehung der vorliegenden Arbeit beteiligt waren. Leipzig, den 08.10.2013 ………………………… …………………… Datum Unterschrift
33
8. Publikation Metabolism: Effects of weight loss and exercise on chemerin serum concentrations and adipose tissue expression in human obesity
Journal: METABOLISM CLINICAL AND EXPERIMENTAL Veröffentlichungsdatum: Oktober 2011 Autoren: Rima Chakaroun, Matthias Raschpichler, Nora Klöting, Andreas Oberbach, Gesine Flehmig, Matthias Kern, Michael R. Schön, Edward Shang, Tobias Lohmann, Miriam Dreßler, Mathias Fasshauer, Michael Stumvoll, Matthias Blüher
Titel: Effects of weight loss and exercise on chemerin serum concentrations and adipose tissue expression in human obesity Impact Factor 2011: 2,664
34
9. Lebenslauf Curriculum vitae Rima Chakaroun Geburtsdatum 08.10.1983 Geburtsort Saida, Libanon Nationalität Libanesisch Schulische Ausbildung 1989-2001 französische Schule: Ecole Saint-Joseph de L'apparition, Saida Studium 09/2002 - 07/ 2003 Studienkolleg Sachsen, Leipzig 2003 -2010 Studium der Humanmedizin, Universität Leipzig Wintersemester 05/06 beurlaubt: Teilnahme an dem Projekt Language Farm
Zur Förderung der logopädischen und motorischen Entwicklung von Kindern (v.a. behinderter Kindern und Kindern aus sozial schwachen Verhältnissen), HIWI-Stelle im Carl Ludwig Institut für Physiologie.
Sommersemester 2008 beurlaubt: Beginn der Promotionsarbeit in der AG Blüher im Rahmen einer Promotionsförderung der Universität Leipzig
Praktisches Jahr 08/2009-12/2009 Klinik für Anästhesie, Intensivmedizin und
Schmerztherapie: Universitätsklinikum Leipzig 01/2010-04/2010 Innere Medizin: University of Alabama at
Birmingham Cardiology Consult, CICU (Cadiology Intensive Care
Unit) Infectious Diseases Endocrinolgy and Metabolism Rheumatology 04/2010-07/2010 Chirurgische Klinik Allgemein-, Viszeral-, Gefäß und
35
Thoraxchirurgie, Helios Krankenhaus, Plauen Berufliche Tätigkeit
Seit August 2011: Medizinische Klinik III- Klinik und Poliklinik für Endokrinologie und Nephrologie Universität Leipzig
Förderung 2007-2008 Teilnahme an den Förderungsprogrammen des
Freistaats Sachsen und des Europäischen Fonds Elimed zur Förderung von weiblicher Elite in der Medizin und Menco (Mentoring und Coaching) zur Berufseinstiegsförderung Pro für angehende Ärzte und Ärztinnen in Sachsen
2008 Nachwuchsförderung (Promotionsstipendium) der Universität Leipzig
2009 Stibet: Stipendium zur Betreuung ausländischer Studierender und Förderung des internationalen Austausches des DAAD und der Universität Leipzig
Posterpreis d. 8. Leipzig Research Festival für: Chemerin: A novel marker for impaired glucose Homeostasis
Promotionsarbeit
Betreuer: Prof. Dr. med. Matthias Blüher Arbeitsthema: Chemerin: A novel marker for impaired glucose homeostasis Beginn: Januar 2009
36
10. Danksagung Für die Überlassung des Promotionsthemas, die vielfältige Betreuung und Förderung, möchte ich mich bei Herrn Prof. Dr. med. Matthias Blüher und Herrn Prof. Michael Stumvoll bedanken. Prof. Dr. Blüher ist ein Vorbild für den “allrounder Mediziner“ und war als Leiter der Arbeitsgruppe stets ein in allen Fragen hilfreicher und wegweisender Mentor. Ganz herzlich möchte ich mich bei Frau Dr. Nora Klöting, auch Gruppenleiterin der Gruppe: Animal models of obesity; rechte exekutive Hand in der AG Blüher und “Brain of Operation” bedanken. Sie ist das Abbild der modernen Powerfrau. Ihr gilt meine größte Bewunderung und mein tiefster Respekt. Unter Ihrer kompetenten Führung, ermöglichte Sie mir selbständiges wissenschaftliches Arbeiten und steckte mich mit ihrer Liebe zur Forschung und ihre wissenschaftliche Neugier an. Aus der AG Blüher gilt mein Dank Frau Susanne Berthold, Frau Daniela Kern und Frau Manuela Prellberg für ihre Große Hilfe im Laboralltag. Auch möchte ich mich bei Herrn Dr. Matthias Kern und Frau Dr. Gesine Flehmig für die gute Zusammenarbeit und das angenehme Arbeitsklima bedanken. Stets nach 16 h und am Freitag zu erreichen und immer offen für einen spannenden praktischen sowie wissenschaftlichen Austausch waren auch Frau Eileen Bösenberg und Herr Dr. Stephan Lorenz. Dafür möchte ich mich herzlich bedanken. Die medizinische Klinik III fasst eine Fülle an stets hilfsbereiten Wissenschaftlern und Freunden. Ich möchte mich bei jedem einzelnen bedanken, der mir über den Weg gelaufen ist, am Anfang im Roten Haus, später im Anatomieinstitut, dann im Forschungsgebäude. Danke für die angenehme Atmosphäre, für die Offenheit und stete Möglichkeit zum Austausch sowie die vielen kleinen Inspirationen. Mein besonderer Dank gilt meiner Familie und Freunden, v.a. meinem guten Freund Brian Spencer für die Unterstützung über die Jahre und die lustigen Überraschungen im Labor! Mein größter Dank gilt meiner Mutter, die mir die Devise eingetrichtert hat, dass es kein Weg gibt außer zum Erfolg, und dass dieser jedoch nicht immer so aussieht, wie wir ihn uns vorstellen. Für Ihre Kraft, Inspiration und Geduld bin ich ihr für immer dankbar. Sie ist vermutlich die einzige wunderschöne Frau, die Spaß an Physik in gelangweilten 16- Jährigen erwecken kann und mit 50 den Spaß am Drehen von Kurzfilmen über praktische Physik entdeckt hat und dabei immer noch das leckerste Essen auf dem Planeten kochen kann. Meinem Partner Alexander möchte ich für die Motivationsarbeit und Unterstützung bei der Vollendung dieser Arbeit danken!
37
10. Literaturverzeichnis 1 Ford, Giles, and Dietz, “Prevalence of the Metabolic Syndrome Among US Adults: Findings from the Third National Health and Nutrition Examination Survey.” 2 Van Gaal, Mertens, and De Block, “Mechanisms Linking Obesity with Cardiovascular Disease.” 3 Bogardus et al., “Relationship Between Degree of Obesity and in Vivo Insulin Action in Man.” 4 Wozniak et al., “Adipose Tissue: The New Endocrine Organ? A Review Article.” 5 Juge-Aubry, Henrichot, and Meier, “Adipose Tissue”; Gesta, Tseng, and Kahn, “Developmental Origin of Fat: Tracking Obesity to Its Source.” 6 Hu, Liang, and Spiegelman, “AdipoQ Is a Novel Adipose-specific Gene Dysregulated in Obesity”; Scherer et al., “A Novel Serum Protein Similar to C1q, Produced Exclusively in Adipocytes”; Friedman and Halaas, “Leptin and the Regulation of Body Weight in Mammals”; Steppan et al., “The Hormone Resistin Links Obesity to Diabetes”; Samad, Yamamoto, and Loskutoff, “Distribution and Regulation of Plasminogen Activator Inhibitor-1 in Murine Adipose Tissue in Vivo. Induction by Tumor Necrosis Factor-alpha and Lipopolysaccharide.” 7 Kloting et al., “Insulin-sensitive Obesity.” 8 Sjöholm and Nyström, “Inflammation and the Etiology of Type 2 Diabetes.” 9 Fasshauer and Paschke, “Regulation of Adipocytokines and Insulin Resistance.” 10 Goralski et al., “Chemerin, a Novel Adipokine That Regulates Adipogenesis and Adipocyte Metabolism.” 11 Albanesi et al., “Chemerin Expression Marks Early Psoriatic Skin Lesions and Correlates with Plasmacytoid Dendritic Cell Recruitment.” 12 Skrzeczyńska-Moncznik et al., “Potential Role of Chemerin in Recruitment of Plasmacytoid Dendritic Cells to Diseased Skin.” 13 Nakajima et al., “Circulating Level of Chemerin Is Upregulated in Psoriasis.” 14 Zheng et al., “[Alteration of Tazarotene Induced Gene-2 Expression in Psoriasis Vulgaris].” 15 Albanesi et al., “Immune Functions and Recruitment of Plasmacytoid Dendritic Cells in Psoriasis.” 16 Gisondi et al., “Serum Chemerin Is Increased in Patients with Chronic Plaque Psoriasis and Normalizes Following Treatment with Infliximab.”
38
17 Zabel, Silverio, and Butcher, “Chemokine-Like Receptor 1 Expression and Chemerin-Directed Chemotaxis Distinguish Plasmacytoid from Myeloid Dendritic Cells in Human Blood.” 18 Zabel et al., “Chemoattractants, Extracellular Proteases, and the Integrated Host Defense Response.” 19 Wittamer et al., “Specific Recruitment of Antigen-presenting Cells by Chemerin, a Novel Processed Ligand from Human Inflammatory Fluids.” 20 Goralski et al., “Chemerin, a Novel Adipokine That Regulates Adipogenesis and Adipocyte Metabolism”; Bozaoglu et al., “Chemerin Is a Novel Adipokine Associated with Obesity and Metabolic Syndrome.” 21 Wittamer et al., “Neutrophil-Mediated Maturation of Chemerin.” 22 Wittamer et al., “Specific Recruitment of Antigen-presenting Cells by Chemerin, a Novel Processed Ligand from Human Inflammatory Fluids.” 23 Zabel et al., “Chemerin Activation by Serine Proteases of the Coagulation, Fibrinolytic, and Inflammatory Cascades.” 24 Rourke, Dranse, and Sinal, “Towards an Integrative Approach to Understanding the Role of Chemerin in Human Health and Disease.” 25 Roh et al., “Chemerin—A New Adipokine That Modulates Adipogenesis via Its Own Receptor.” 26 Barnea et al., “From the Cover: The Genetic Design of Signaling Cascades to Record Receptor Activation.” 27 Yoshimura and Oppenheim, “Chemokine-like Receptor 1 (CMKLR1) and Chemokine (C-C Motif) Receptor-like 2 (CCRL2); Two Multifunctional Receptors with Unusual Properties.” 28 Muruganandan, Roman, and Sinal, “Role of chemerin/CMKLR1 Signaling in Adipogenesis and Osteoblastogenesis of Bone Marrow Stem Cells.” 29 Yoshimura and Oppenheim, “Chemokine-like Receptor 1 (CMKLR1) and Chemokine (C-C Motif) Receptor-like 2 (CCRL2); Two Multifunctional Receptors with Unusual Properties.” 30 Kukla et al., “Potential Role of Leptin, Adiponectin and Three Novel Adipokines--visfatin, Chemerin and Vaspin--in Chronic Hepatitis.” 31 Sell et al., “Chemerin Correlates with Markers for Fatty Liver in Morbidly Obese Patients and Strongly Decreases after Weight Loss Induced by Bariatric Surgery.” 32 Lehrke et al., “Chemerin Is Associated with Markers of Inflammation and Components of the Metabolic Syndrome but Does Not Predict Coronary Atherosclerosis.” 33 Ibid.; Weigert et al., “Systemic Chemerin Is Related to Inflammation Rather Than Obesity in Type 2 Diabetes”; Pfau et al., “Serum Levels of the Adipokine Chemerin in Relation to Renal Function.” 34 Kralisch et al., “Interleukin-1ß Induces the Novel Adipokine Chemerin in Adipocytes in Vitro.”
39
35 Cash et al., “Synthetic Chemerin-derived Peptides Suppress Inflammation through ChemR23.” 36 Ernst et al., “Disruption of the Chemokine-like Receptor-1 (CMKLR1) Gene Is Associated with Reduced Adiposity and Glucose Intolerance”; Muruganandan et al., “Chemerin, a Novel Peroxisome Proliferator-activated Receptor Gamma (PPARgamma) Target Gene That Promotes Mesenchymal Stem Cell Adipogenesis.” 37 Yoo et al., “Circulating Chemerin Level Is Independently Correlated with Arterial Stiffness”; Feng et al., “Elevated Levels of Serum Chemerin in Patients with Obstructive Sleep Apnea Syndrome”; Bozaoglu et al., “Chemerin Is a Novel Adipokine Associated with Obesity and Metabolic Syndrome”; Shin et al., “Chemerin Levels Are Positively Correlated with Abdominal Visceral Fat Accumulation.” 38 Sell et al., “Chemerin Is a Novel Adipocyte-derived Factor Inducing Insulin Resistance in Primary Human Skeletal Muscle Cells.” 39 Goralski et al., “Chemerin, a Novel Adipokine That Regulates Adipogenesis and Adipocyte Metabolism.” 40 Roh et al., “Chemerin—A New Adipokine That Modulates Adipogenesis via Its Own Receptor.” 41 Ernst et al., “Disruption of the Chemokine-like Receptor-1 (CMKLR1) Gene Is Associated with Reduced Adiposity and Glucose Intolerance.” 42 Kaur et al., “Identification of Chemerin Receptor (ChemR23) in Human Endothelial Cells: Chemerin-induced Endothelial Angiogenesis.” 43 Takahashi et al., “Chemerin Regulates Β-cell Function in Mice.” 44 Ernst et al., “Chemerin Exacerbates Glucose Intolerance in Mouse Models of Obesity and Diabetes”; Ernst et al., “Disruption of the Chemokine-like Receptor-1 (CMKLR1) Gene Is Associated with Reduced Adiposity and Glucose Intolerance”; Nakajima et al., “Circulating Level of Chemerin Is Upregulated in Psoriasis.” 45 Takahashi et al., “Chemerin Regulates Β-cell Function in Mice.” 46 Sell et al., “Chemerin Is a Novel Adipocyte-derived Factor Inducing Insulin Resistance in Primary Human Skeletal Muscle Cells.” 47 Stejskal et al., “Chemerin Is an Independent Marker of the Metabolic Syndrome in a Caucasian Population--a Pilot Study.” 48 Bozaoglu et al., “Chemerin Is Associated with Metabolic Syndrome Phenotypes in a Mexican-American Population”; Stejskal et al., “Chemerin Is an Independent Marker of the Metabolic Syndrome in a Caucasian Population--a Pilot Study”; Yoo et al., “Circulating Chemerin Level Is Independently Correlated with Arterial Stiffness.” 49 DeFronzo, Tobin, and Andres, “Glucose Clamp Technique.” 50 Sell et al., “Chemerin Is a Novel Adipocyte-derived Factor Inducing Insulin Resistance in Primary Human Skeletal Muscle Cells.” 51 Bozaoglu et al., “Chemerin Is Associated with Metabolic Syndrome Phenotypes in a Mexican-American Population”; ibid.
40
52 Tan et al., “Insulin and Metformin Regulate Circulating and Adipose Tissue Chemerin.” 53 Sell et al., “Chemerin Correlates with Markers for Fatty Liver in Morbidly Obese Patients and Strongly Decreases after Weight Loss Induced by Bariatric Surgery.” 54 Barker et al., “Increased Chemerin Concentrations in Fetuses of Obese Mothers and Correlation with Maternal Insulin Sensitivity.” 55 Bergmann and Sypniewska, “Diabetes as a Complication of Adipose Tissue Dysfunction. Is There a Role for Potential New Biomarkers?”; El-Mesallamy, El-Derany, and Hamdy, “Serum Omentin-1 and Chemerin Levels Are Interrelated in Patients with Type 2 Diabetes Mellitus with or Without Ischaemic Heart Disease”; Hu and Feng, “Elevated Serum Chemerin Concentrations Are Associated with Renal Dysfunction in Type 2 Diabetic Patients”; Yu et al., “Chemerin and Apelin Are Positively Correlated with Inflammation in Obese Type 2 Diabetic Patients”; Sell and Eckel, “Chemotactic Cytokines, Obesity and Type 2 Diabetes”; Shin et al., “Chemerin Levels Are Positively Correlated with Abdominal Visceral Fat Accumulation.” 56 Tan et al., “Insulin and Metformin Regulate Circulating and Adipose Tissue Chemerin.” 57 Sell et al., “Chemerin Correlates with Markers for Fatty Liver in Morbidly Obese Patients and Strongly Decreases after Weight Loss Induced by Bariatric Surgery.” 58 Sell et al., “Chemerin Is a Novel Adipocyte-derived Factor Inducing Insulin Resistance in Primary Human Skeletal Muscle Cells.” 59 Tönjes et al., “Adipokine Pattern in Subjects with Impaired Fasting Glucose and Impaired Glucose Tolerance in Comparison to Normal Glucose Tolerance and Diabetes.” 60 Weigert et al., “Systemic Chemerin Is Related to Inflammation Rather Than Obesity in Type 2 Diabetes.” 61 Sell et al., “Chemerin Correlates with Markers for Fatty Liver in Morbidly Obese Patients and Strongly Decreases after Weight Loss Induced by Bariatric Surgery.” 62 Klöting et al., “Insulin-sensitive Obesity.” 63 Tan et al., “Insulin and Metformin Regulate Circulating and Adipose Tissue Chemerin.” 64 Sell and Eckel, “Chemotactic Cytokines, Obesity and Type 2 Diabetes.” 65 Bergmann and Sypniewska, “Diabetes as a Complication of Adipose Tissue Dysfunction. Is There a Role for Potential New Biomarkers?”. 66 Sell et al., “Chemerin Is a Novel Adipocyte-derived Factor Inducing Insulin Resistance in Primary Human Skeletal Muscle Cells.” 67 Herenius et al., “Anti-TNF Therapy Reduces Serum Levels of Chemerin in Rheumatoid Arthritis.” 68 Cash et al., “Synthetic Chemerin-derived Peptides Suppress Inflammation through ChemR23.”
41
69 Sell and Eckel, “Chemotactic Cytokines, Obesity and Type 2 Diabetes”; Zabel et al., “Chemerin Activation by Serine Proteases of the Coagulation, Fibrinolytic, and Inflammatory Cascades”; Skrzeczyńska-Moncznik et al., “Potential Role of Chemerin in Recruitment of Plasmacytoid Dendritic Cells to Diseased Skin”; Wittamer et al., “Neutrophil-Mediated Maturation of Chemerin”; Yoshimura and Oppenheim, “Chemokine-like Receptor 1 (CMKLR1) and Chemokine (C-C Motif) Receptor-like 2 (CCRL2); Two Multifunctional Receptors with Unusual Properties.” 70 Wittamer et al., “Neutrophil-Mediated Maturation of Chemerin.” 71 Yoshimura and Oppenheim, “Chemokine-like Receptor 1 (CMKLR1) and Chemokine (C-C Motif) Receptor-like 2 (CCRL2); Two Multifunctional Receptors with Unusual Properties.” 72 Bozaoglu et al., “Chemerin Is Associated with Metabolic Syndrome Phenotypes in a Mexican-American Population”; Roh et al., “Chemerin—A New Adipokine That Modulates Adipogenesis via Its Own Receptor”; Goralski et al., “Chemerin, a Novel Adipokine That Regulates Adipogenesis and Adipocyte Metabolism.” 73 Weigert et al., “Systemic Chemerin Is Related to Inflammation Rather Than Obesity in Type 2 Diabetes.”
![Medkoo Biosciences Quality Control Data ......2013/11/08 · 20131106-1_131106130759 #77-97 RT:0.51-0.64 AV:21 NL:2.22E5 T:ITMS + c ESI sid=35.00 Full ms [100.00-1000.00] 100 200](https://img.pdfslide.us/doc/110x75/60e2a685cab34d621831cef0/medkoo-biosciences-quality-control-data-20131108-20131106-1131106130759.jpg)