Embed Size (px)
Citation preview
Investor Presentation2013 Full Year Results
10 OCTOBER 2013
For
per
sona
l use
onl
y
This document, and any constituent or associated presentation, information or material (collectively, the Material), is not (and doesnot form part of) an offer, solicitation, invitation or recommendation in respect of any securities and neither the Material nor any part ofit will form the basis of, or be relied upon in connection with, any contract, commitment or investment decision.No representation or warranty is or will be made by any person (including CMI Limited and its officers, directors, employees, advisers and agents (CMI)) in relation to the accuracy or completeness of all or part of the Material, or the accuracy, likelihood of achievement or reasonableness of any forecasts, prospects or returns contained in, or implied by, the Material or any part of it. To the maximum extent permitted by law, CMI does not accept any responsibility, and disclaims any liability (including, without limitation any liability arising from fault or negligence), for any loss arising from any use of or reliance upon all or any part of the Material or otherwise arising in connection with it or for any action taken by the recipients of the Material on the basis of such Material. The Material contains certain forward-looking statements with respect to the financial condition, results of operations and business of CMI and certain plans and objectives of the management of CMI. All such forward-looking statements involve known and unknown risks, significant uncertainties, assumptions, contingencies and other factors, many of which are outside the control of CMI, which may cause the actual results or performance of CMI to be materially different from any future results or performance expressed or implied by such forward-looking statements. Such forward-looking statements speak only as of the date of the Material. Factors that could cause actual results or performance to differ materially include without limitation the following: fluctuations in interest and currency exchange rates, basis risk and credit risk; levels of supply and demand and market prices; legislation or regulations throughout the world that affect CMI's business; legal defense costs, insurance expenses, settlement costs and the risk of an adverse decision or other outcome relating to governmental investigations, class actions or other claims; growth in costs andexpenses; risk of adverse or unanticipated market, financial or political developments (including without limitation in relation to commodity markets). The Material is provided for informational purposes only and is subject to change without notice. Subject to any obligations under applicable laws, regulations or securities exchange listing rules, CMI disclaims any obligation or undertaking to release any updates or revisions to the Material to reflect any change in expectations or assumptions. Nothing in the Material should be interpreted to mean that future earnings per share of CMI will necessarily match or exceed its historical published earnings per share, or that there has been no change in the affairs of CMI since the date of the Material.Nothing contained in the Material constitutes investment, legal, tax or other advice. The information in the Material does not take into account the investment objectives, financial situation or particular needs of any recipient. Before making an investment decision, each recipient of the Material should make its own assessment and take independent professional advice in relation to the Material and any action taken on the basis of the Material.
DisclaimerDisclaimer
Page 2
For
per
sona
l use
onl
y
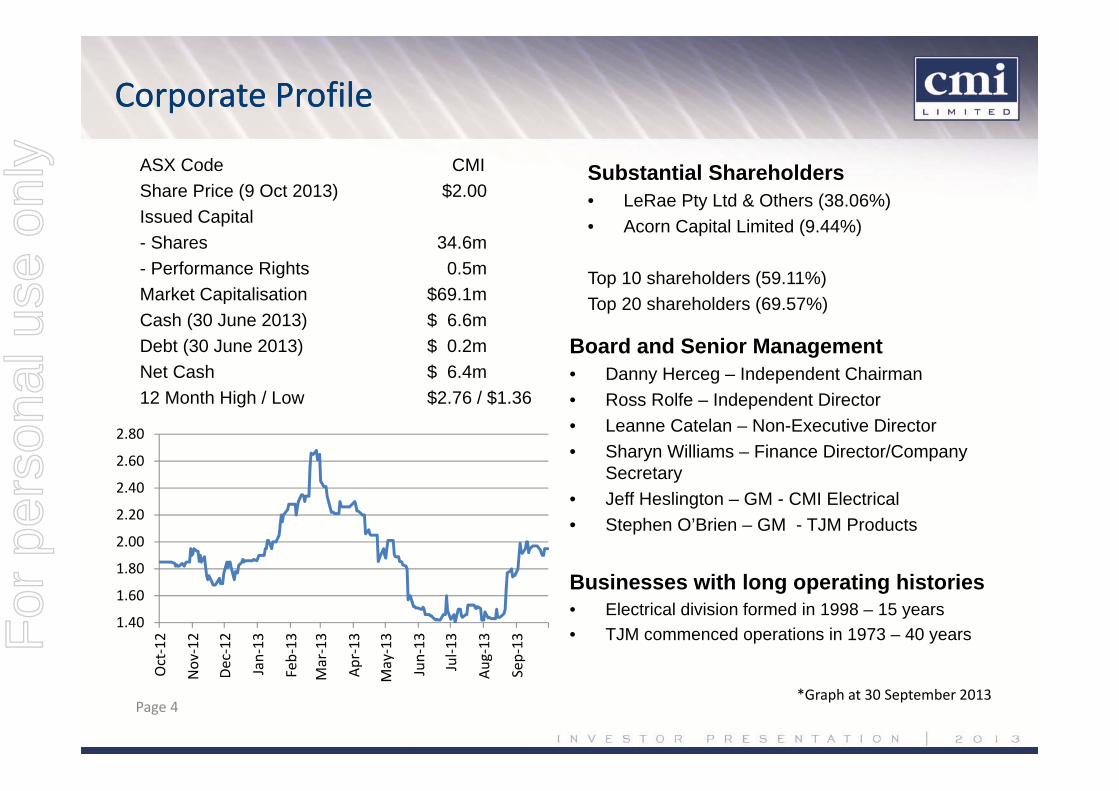
ASX Code CMIShare Price (9 Oct 2013) $2.00Issued Capital- Shares 34.6m- Performance Rights 0.5mMarket Capitalisation $69.1mCash (30 June 2013) $ 6.6mDebt (30 June 2013) $ 0.2mNet Cash $ 6.4m12 Month High / Low $2.76 / $1.36
Board and Senior Management• Danny Herceg – Independent Chairman• Ross Rolfe – Independent Director• Leanne Catelan – Non-Executive Director• Sharyn Williams – Finance Director/Company
Secretary• Jeff Heslington – GM - CMI Electrical• Stephen O’Brien – GM - TJM Products
Businesses with long operating histories• Electrical division formed in 1998 – 15 years• TJM commenced operations in 1973 – 40 years
Corporate ProfileCorporate Profile
Page 4*Graph at 30 September 2013
Substantial Shareholders• LeRae Pty Ltd & Others (38.06%)• Acorn Capital Limited (9.44%)
Top 10 shareholders (59.11%)Top 20 shareholders (69.57%)
1.40
1.60
1.80
2.00
2.20
2.40
2.60
2.80
Oct‐12
Nov
‐12
Dec‐12
Jan‐13
Feb‐13
Mar‐13
Apr‐13
May‐13
Jun‐13
Jul‐1
3
Aug‐13
Sep‐13F
or p
erso
nal u
se o
nly
Performance FY2013
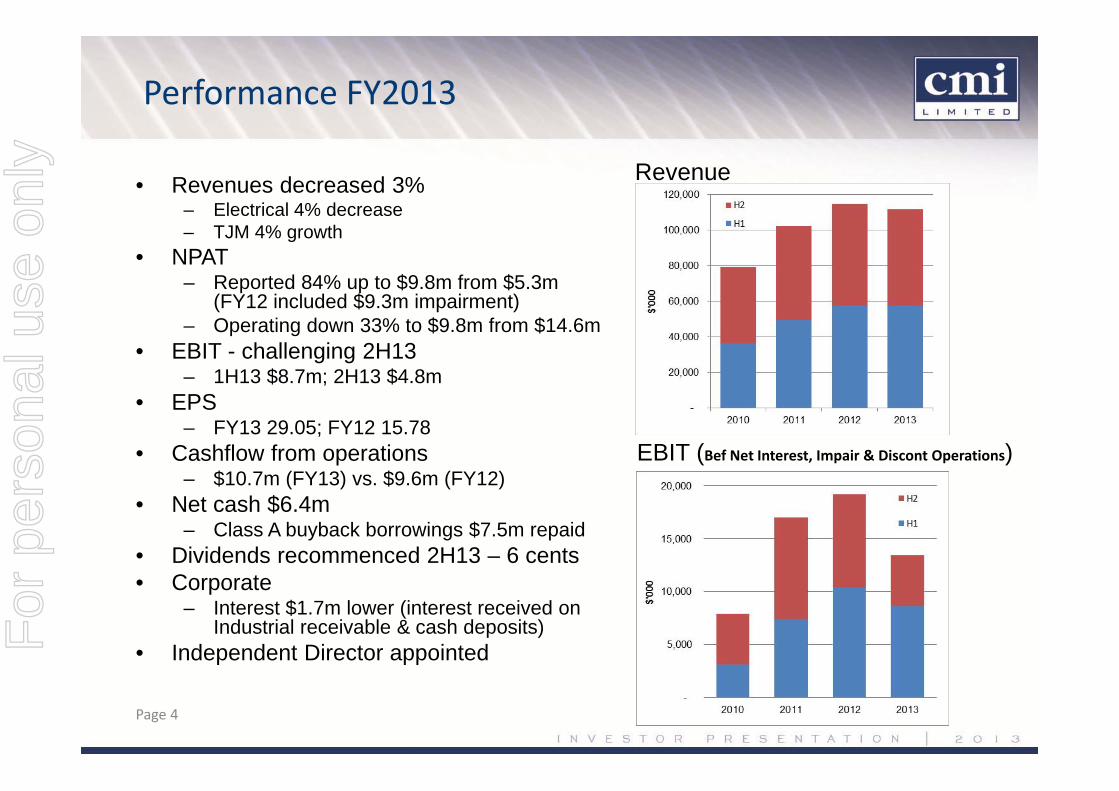
• Revenues decreased 3%– Electrical 4% decrease– TJM 4% growth
• NPAT– Reported 84% up to $9.8m from $5.3m
(FY12 included $9.3m impairment)– Operating down 33% to $9.8m from $14.6m
• EBIT - challenging 2H13– 1H13 $8.7m; 2H13 $4.8m
• EPS – FY13 29.05; FY12 15.78
• Cashflow from operations – $10.7m (FY13) vs. $9.6m (FY12)
• Net cash $6.4m– Class A buyback borrowings $7.5m repaid
• Dividends recommenced 2H13 – 6 cents• Corporate
– Interest $1.7m lower (interest received on Industrial receivable & cash deposits)
• Independent Director appointed
Revenue
EBIT (Bef Net Interest, Impair & Discont Operations)
Page 4
For
per
sona
l use
onl
y
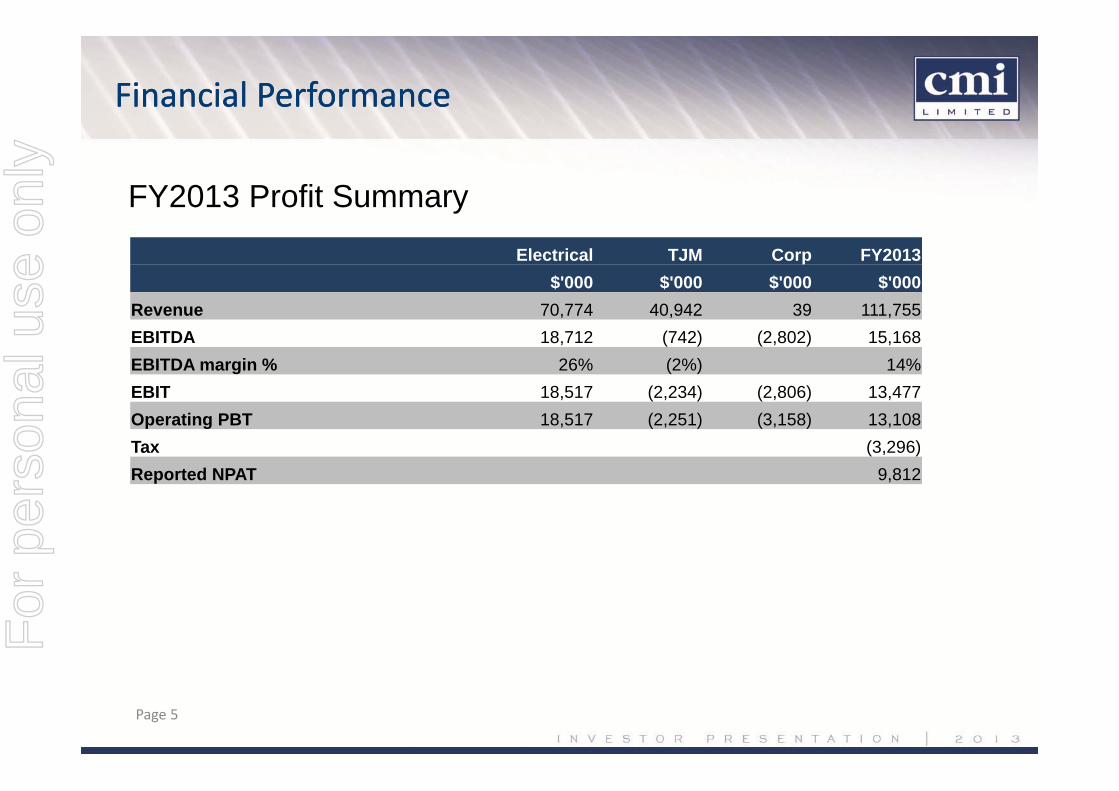
FY2013 Profit Summary
Financial PerformanceFinancial Performance
Page 5
Electrical TJM Corp FY2013$'000 $'000 $'000 $'000
Revenue 70,774 40,942 39 111,755EBITDA 18,712 (742) (2,802) 15,168EBITDA margin % 26% (2%) 14%EBIT 18,517 (2,234) (2,806) 13,477Operating PBT 18,517 (2,251) (3,158) 13,108Tax (3,296)Reported NPAT 9,812
For
per
sona
l use
onl
y
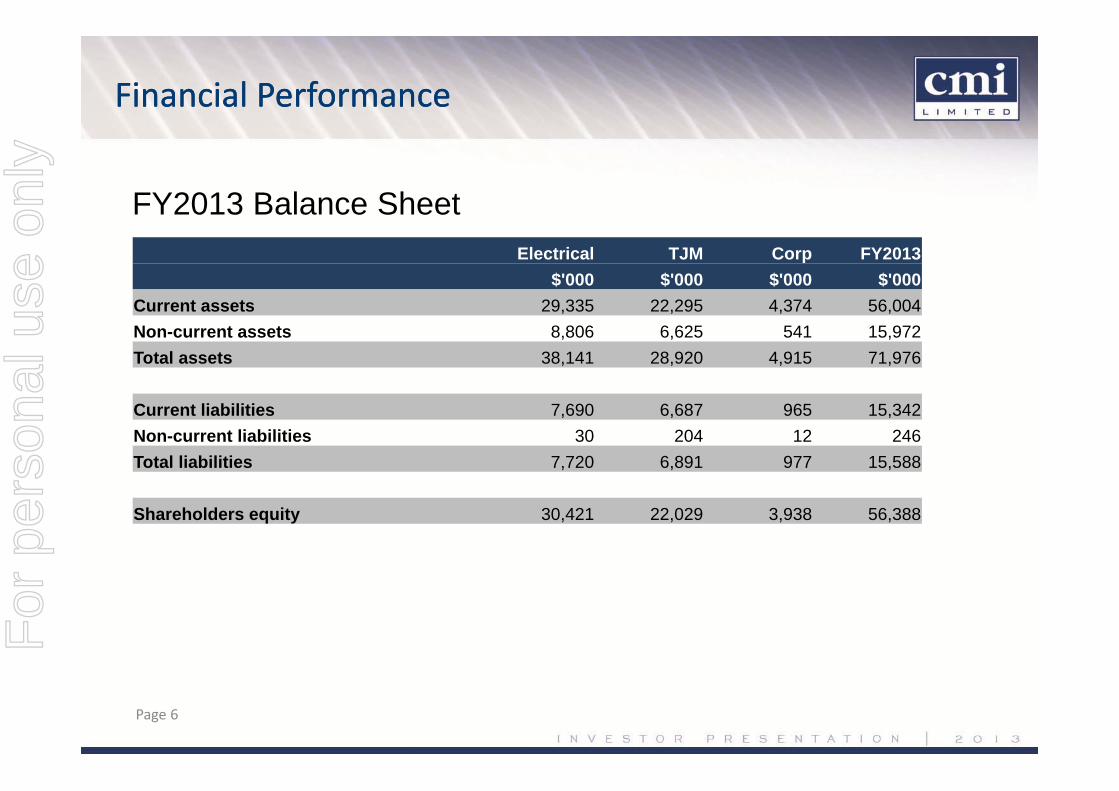
FY2013 Balance Sheet
Financial PerformanceFinancial Performance
Page 6
Electrical TJM Corp FY2013$'000 $'000 $'000 $'000
Current assets 29,335 22,295 4,374 56,004Non-current assets 8,806 6,625 541 15,972Total assets 38,141 28,920 4,915 71,976
Current liabilities 7,690 6,687 965 15,342Non-current liabilities 30 204 12 246Total liabilities 7,720 6,891 977 15,588
Shareholders equity 30,421 22,029 3,938 56,388
For
per
sona
l use
onl
y
Financial PerformanceFinancial Performance
Page 7
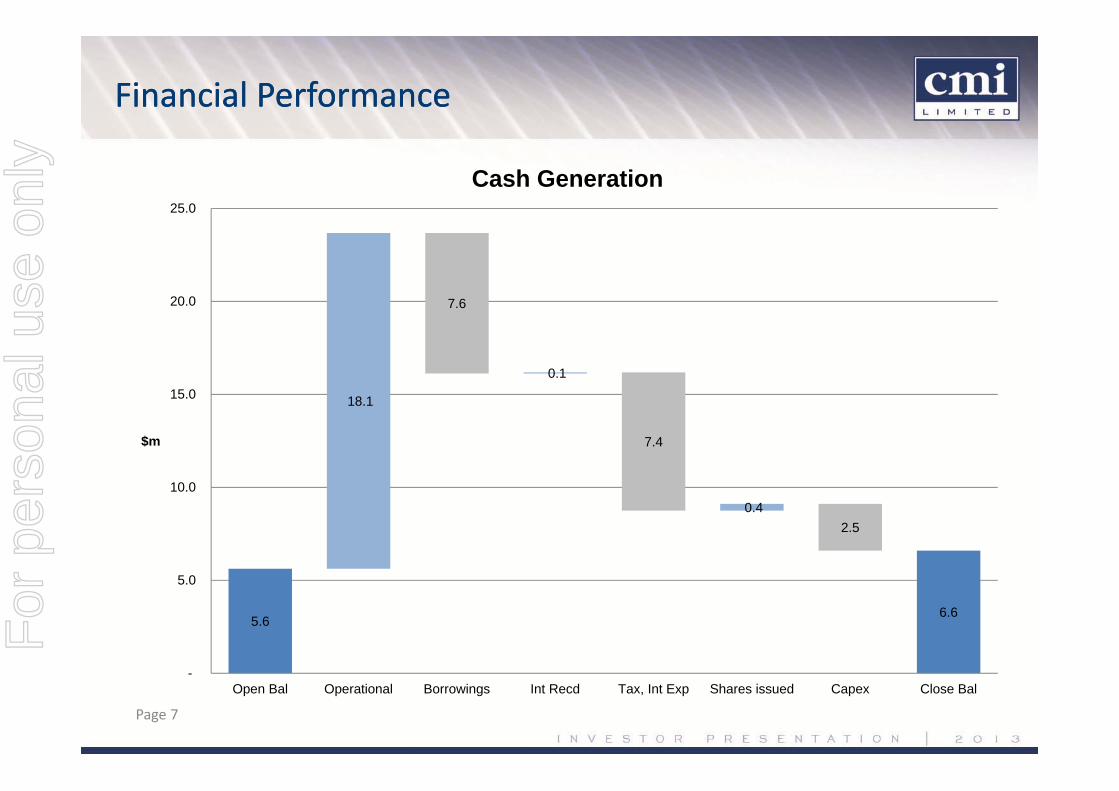
5.66.6
18.1
0.1
0.4
7.6
7.4
2.5
-
5.0
10.0
15.0
20.0
25.0
Open Bal Operational Borrowings Int Recd Tax, Int Exp Shares issued Capex Close Bal
$m
Cash Generation
For
per
sona
l use
onl
y
Financial PerformanceFinancial Performance
Page 8
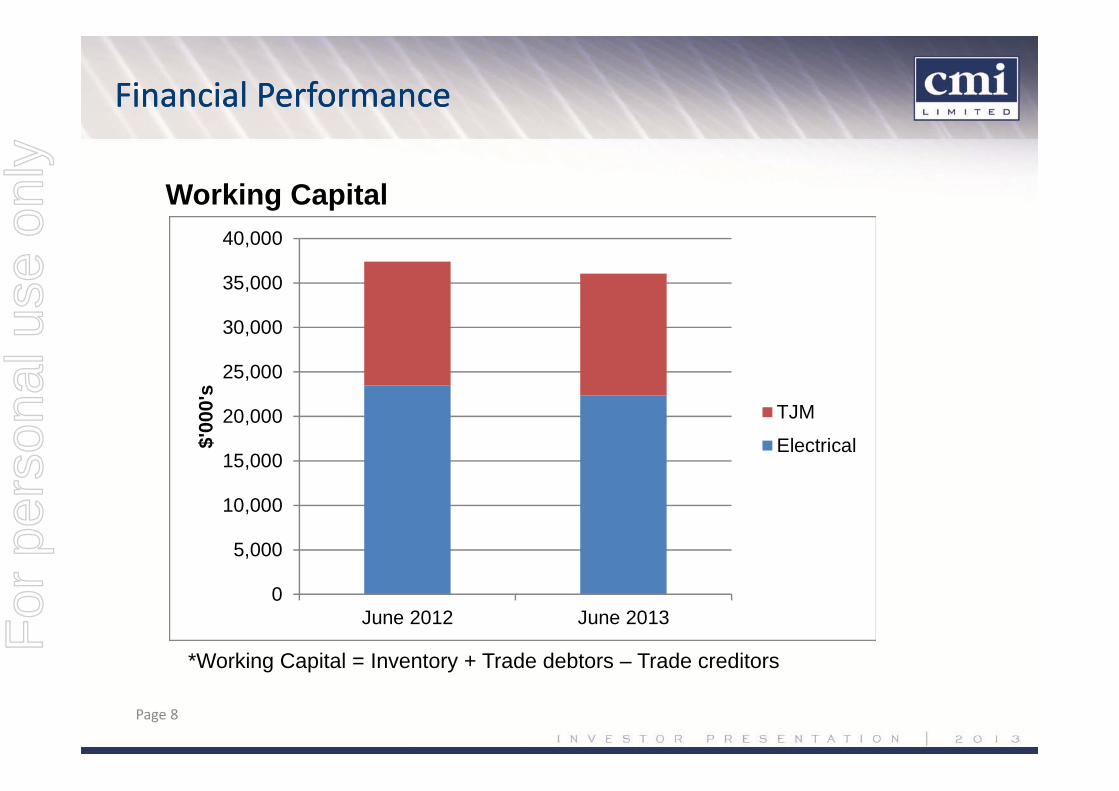
Working Capital
*Working Capital = Inventory + Trade debtors – Trade creditors
0
5,000
10,000
15,000
20,000
25,000
30,000
35,000
40,000
June 2012 June 2013
$'00
0's
TJM
Electrical
For
per
sona
l use
onl
y
Electrical Division
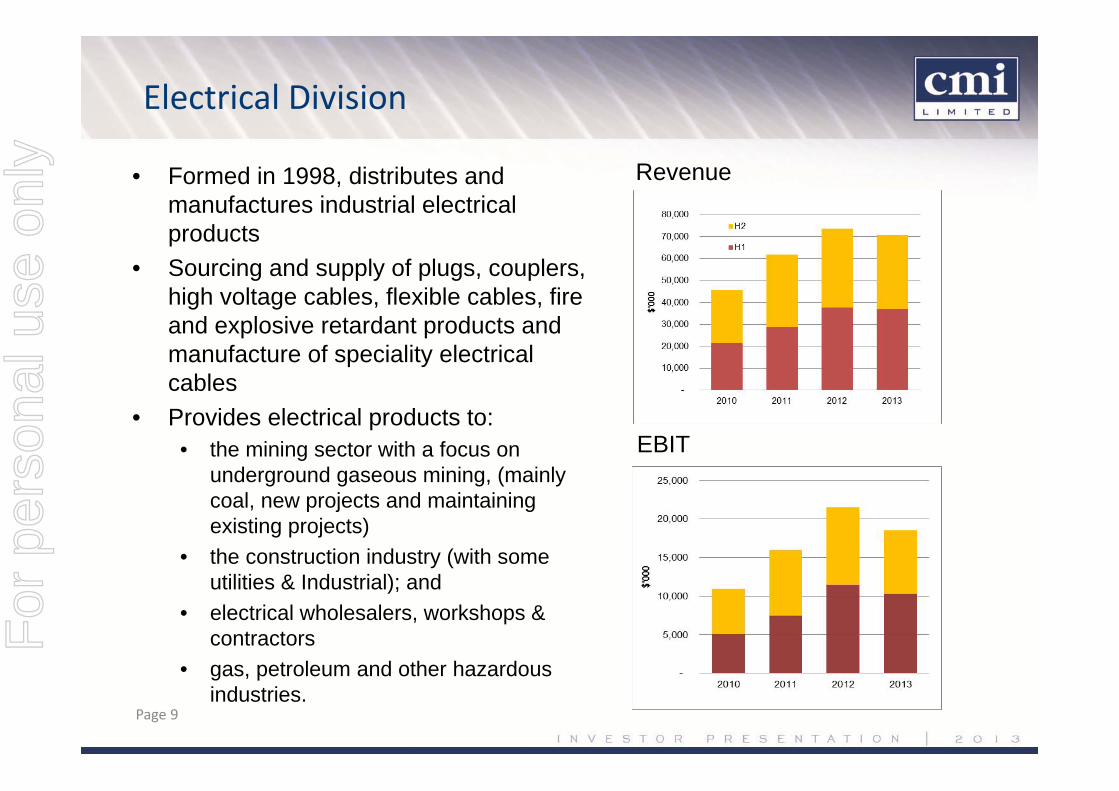
• Formed in 1998, distributes and manufactures industrial electrical products
• Sourcing and supply of plugs, couplers, high voltage cables, flexible cables, fire and explosive retardant products and manufacture of speciality electrical cables
• Provides electrical products to:• the mining sector with a focus on
underground gaseous mining, (mainly coal, new projects and maintaining existing projects)
• the construction industry (with some utilities & Industrial); and
• electrical wholesalers, workshops & contractors
• gas, petroleum and other hazardous industries.
Revenue
EBIT
Page 9
For
per
sona
l use
onl
y
Electrical DivisionElectrical Division
Page 10
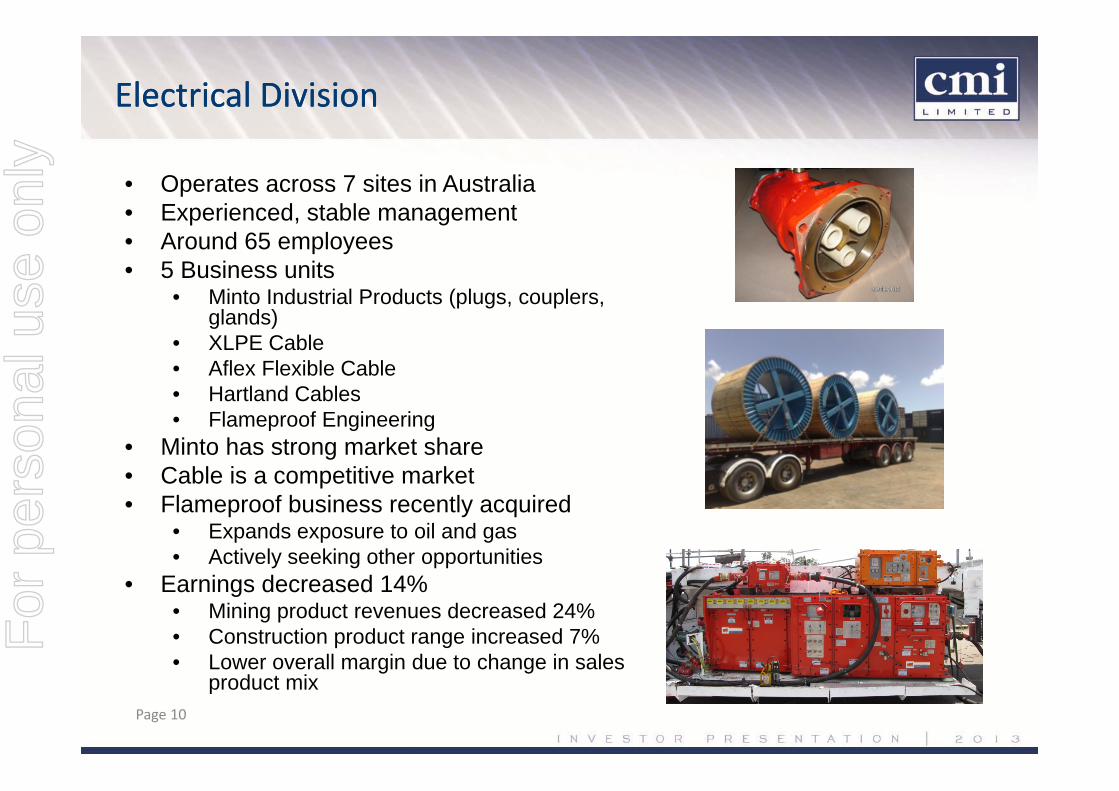
• Operates across 7 sites in Australia• Experienced, stable management• Around 65 employees• 5 Business units
• Minto Industrial Products (plugs, couplers, glands)
• XLPE Cable• Aflex Flexible Cable• Hartland Cables• Flameproof Engineering
• Minto has strong market share• Cable is a competitive market• Flameproof business recently acquired
• Expands exposure to oil and gas• Actively seeking other opportunities
• Earnings decreased 14% • Mining product revenues decreased 24%• Construction product range increased 7%• Lower overall margin due to change in sales
product mix
For
per
sona
l use
onl
y
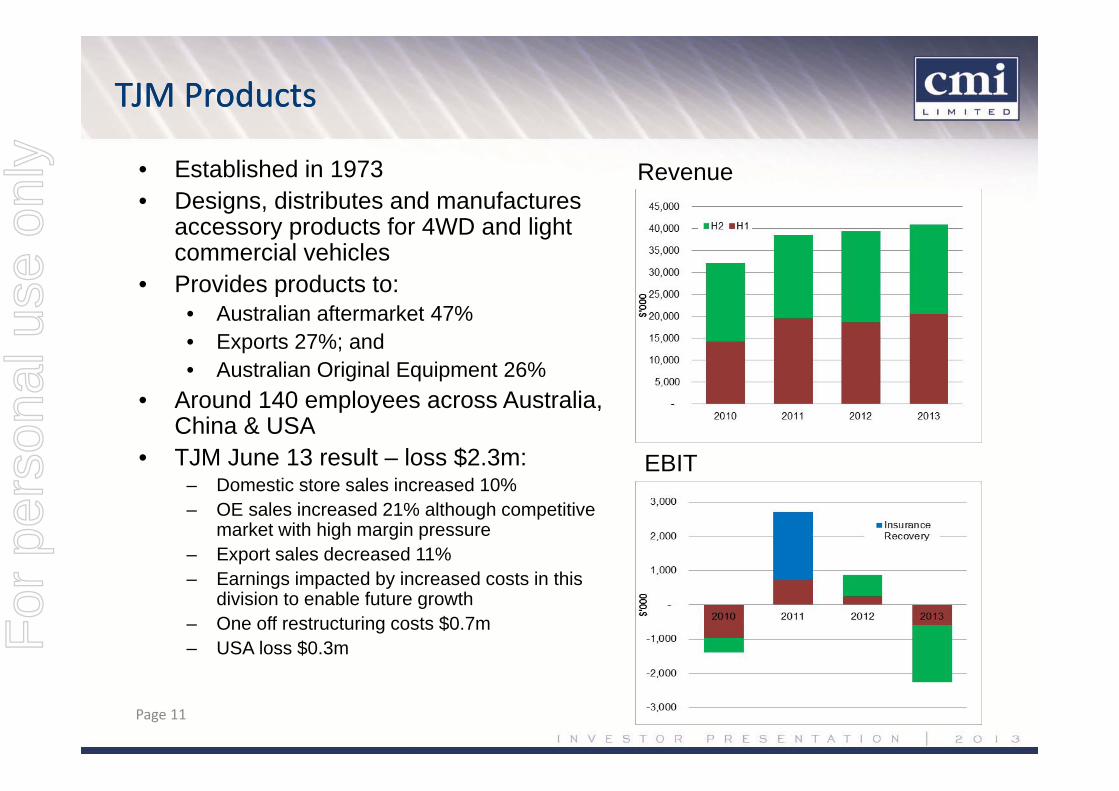
• Established in 1973• Designs, distributes and manufactures
accessory products for 4WD and light commercial vehicles
• Provides products to:• Australian aftermarket 47%• Exports 27%; and• Australian Original Equipment 26%
• Around 140 employees across Australia, China & USA
• TJM June 13 result – loss $2.3m:– Domestic store sales increased 10%– OE sales increased 21% although competitive
market with high margin pressure– Export sales decreased 11%– Earnings impacted by increased costs in this
division to enable future growth– One off restructuring costs $0.7m– USA loss $0.3m
TJM ProductsTJM Products
Revenue
EBIT
Page 11
For
per
sona
l use
onl
y
TJM ProductsTJM Products
Page 12
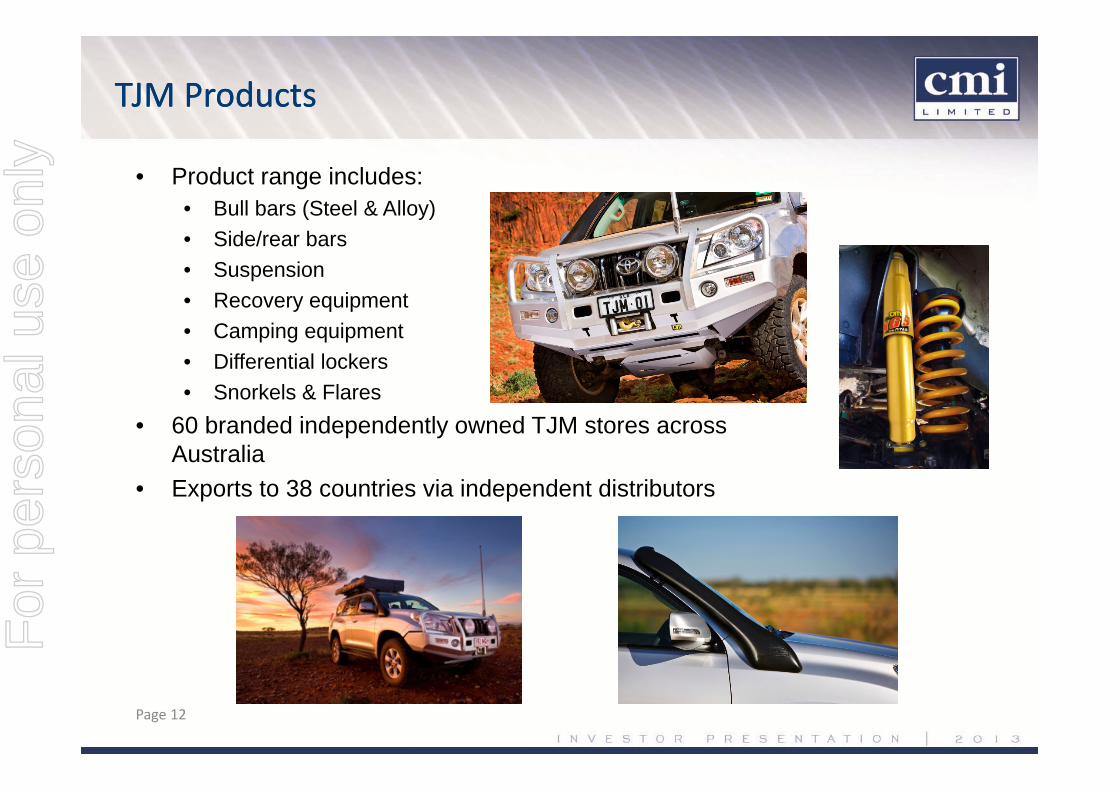
• Product range includes:• Bull bars (Steel & Alloy)• Side/rear bars• Suspension• Recovery equipment• Camping equipment• Differential lockers • Snorkels & Flares
• 60 branded independently owned TJM stores across Australia
• Exports to 38 countries via independent distributors
For
per
sona
l use
onl
y
TJM Restructure Status
Achievements 2013 Year:• 5 additional domestic retail stores (9% increase)• Improved time to market for new products• Expansion of the existing branded product range• Expanded manufacturing & assembly in China – premises relocation complete • Improved working capital management• New TJM consumer website including online shopping with increased traffic• Launch of the innovative “Build your own” 3D modelling website• Reduced losses from the USA operations• Implementation of safety and training web‐based management system
Focus for the coming 12 months on:• Capacity increase at the off‐shore production facility to improve margins and control quality of
selective products• A more efficient and cost‐effective supply chain• An increase in branded domestic distribution outlets and increased penetration in existing
distribution outlets• Increased market penetration in export markets (particularly Middle East) including review of
the USA strategy• Further improvements to time to market of new products• Continued expansion of the existing product range using branded and third party products
Page 13
For
per
sona
l use
onl
y
• Impact of subdued conditions in the resource sector more pronounced in 2H13
• Expect these conditions to persist to impact earnings through 1H14 although anticipate some improvement starting during the 2H14
• A strong balance sheet means CMI will continue to invest capital and grow our existing businesses, while continuing to look for opportunities to create value for shareholders.
OutlookOutlook
Page 14
For
per
sona
l use
onl
y


![20130630 What motivates library crowdsourcing volunteers? [ALA LITA]](https://img.pdfslide.us/doc/110x75/5549a91eb4c9050c708b55a9/20130630-what-motivates-library-crowdsourcing-volunteers-ala-lita.jpg)