Embed Size (px)
Citation preview

Maps using SAS/Graph
Colleen McGahanCancer Surveillance & Outcomes (CSO)
BC Cancer Agency
PLEASE NOTE: The Map #’s in the
presentation relate to the code labelled in
the SAS program that goes with this
presentation. I have also asked for the
data to be made available so you can
reproduce and see what maps are
produced.
Projected map data:
<lha_shp.sas7bdat>
Response dataset:
<mortality_data.sas7bdat>
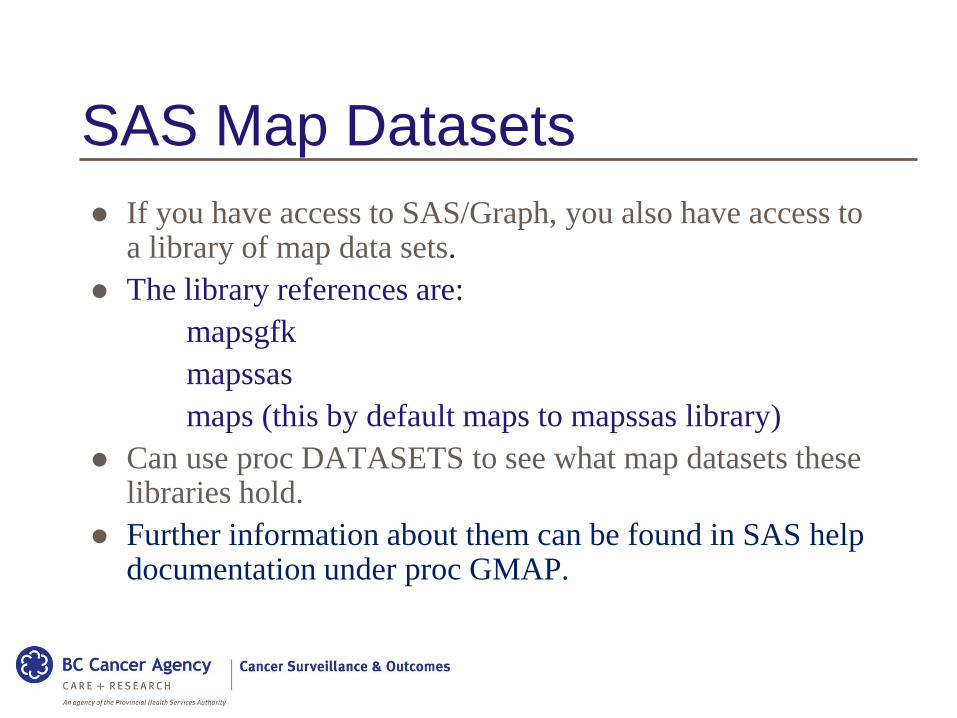
SAS Map Datasets
If you have access to SAS/Graph, you also have access to a library of map data sets.
The library references are:
mapsgfk
mapssas
maps (this by default maps to mapssas library)
Can use proc DATASETS to see what map datasets these libraries hold.
Further information about them can be found in SAS help documentation under proc GMAP.
SAS Map Datasets
The datasets in the SAS map libraries mentioned are map datasets which contain variables whose values are coordinates.
The coordinates define the outline of the map and the regions within it.
You can also use map files which are in spatial data formats known as *.SHP (‘shape’) files.
These can be imported using proc MAPIMPORT
External Mapping FilesSome Shape files specific to BC:
http://www.bcstats.gov.bc.ca/StatisticsBySubject/Geography/TranslationsDataSets.aspx
Development Regions (Economic Regions)
Census Divisions (Regional Districts)
Census Subdivisions (Municipalities)
Health Boundaries
School Districts
College Regions
Provincial Electoral Districts
http://www.empr.gov.bc.ca/Mining/Geoscience/MapPlace/GeoData/pag
es/default.aspx
Main Steps in Drawing a Map
Import map data if not using SAS map datasets (proc MAPIMPORT)
Project the map data if not already projected (proc GPROJECT)
Use annotate dataset if not producing a simple map
Draw the map (proc GMAP)
Importing Map Data
Three files are necessary for the conversion of the shape file to a data set: *.DBF, *.SHP, *.SHX
To import shape files, just the *.SHP file is specified in ProcMAPIMPORT.
Below is the basic code required to import shape files:
proc mapimport
datafile=“<Shape filename>” out=<map dataset>;
run;
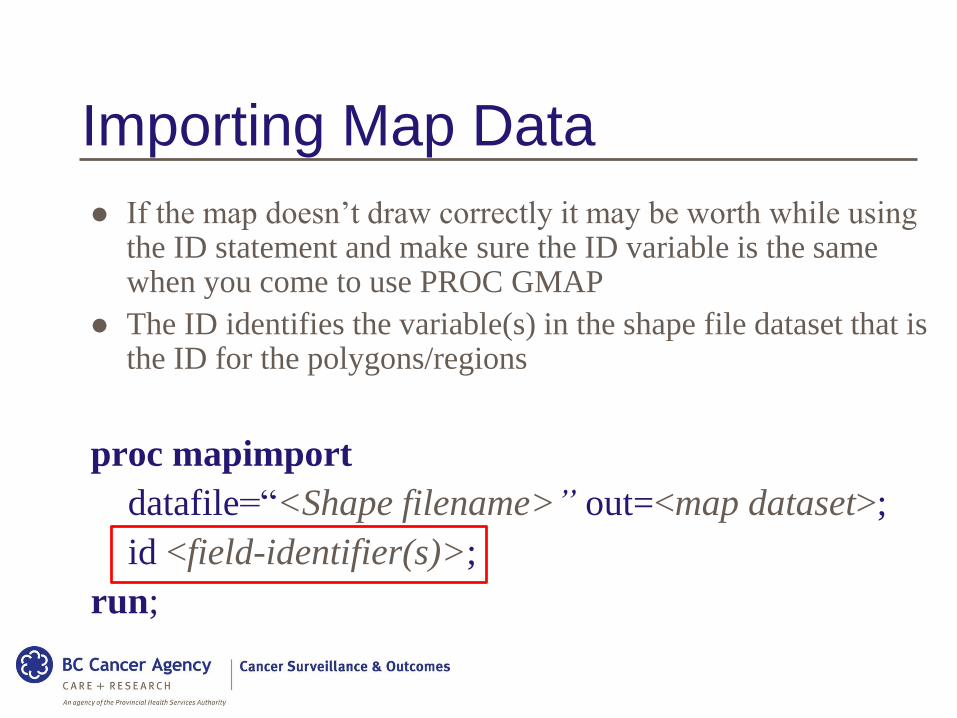
Importing Map Data
If the map doesn’t draw correctly it may be worth while using the ID statement and make sure the ID variable is the same when you come to use PROC GMAP
The ID identifies the variable(s) in the shape file dataset that is the ID for the polygons/regions
proc mapimport
datafile=“<Shape filename>” out=<map dataset>;
id <field-identifier(s)>;
run;
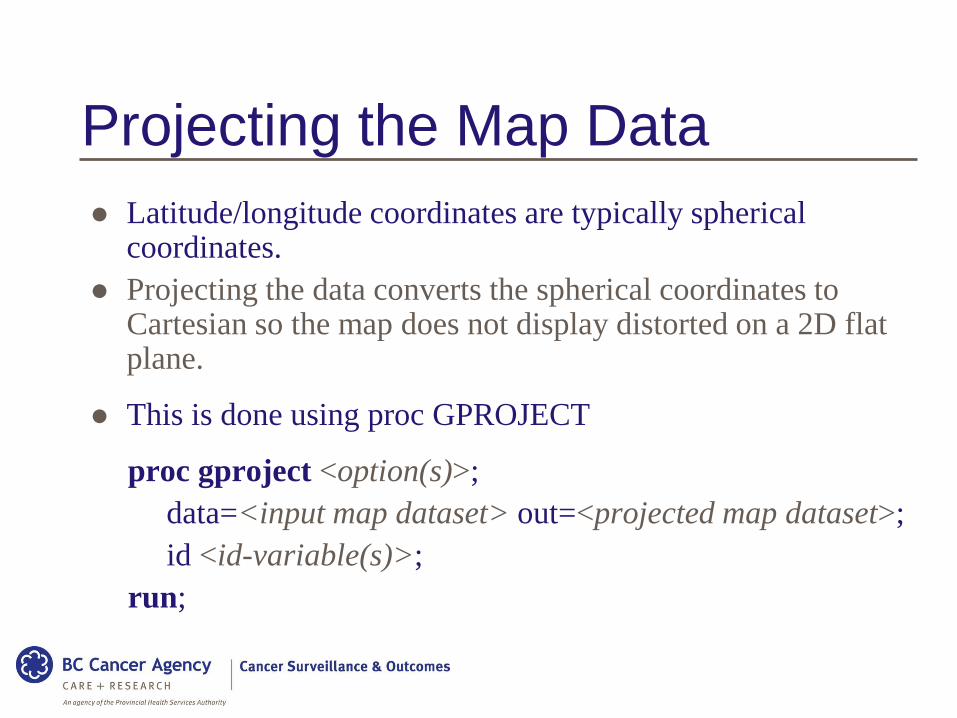
Projecting the Map Data
Latitude/longitude coordinates are typically spherical coordinates.
Projecting the data converts the spherical coordinates to Cartesian so the map does not display distorted on a 2D flat plane.
This is done using proc GPROJECT
proc gproject <option(s)>;
data=<input map dataset> out=<projected map dataset>;
id <id-variable(s)>;
run;
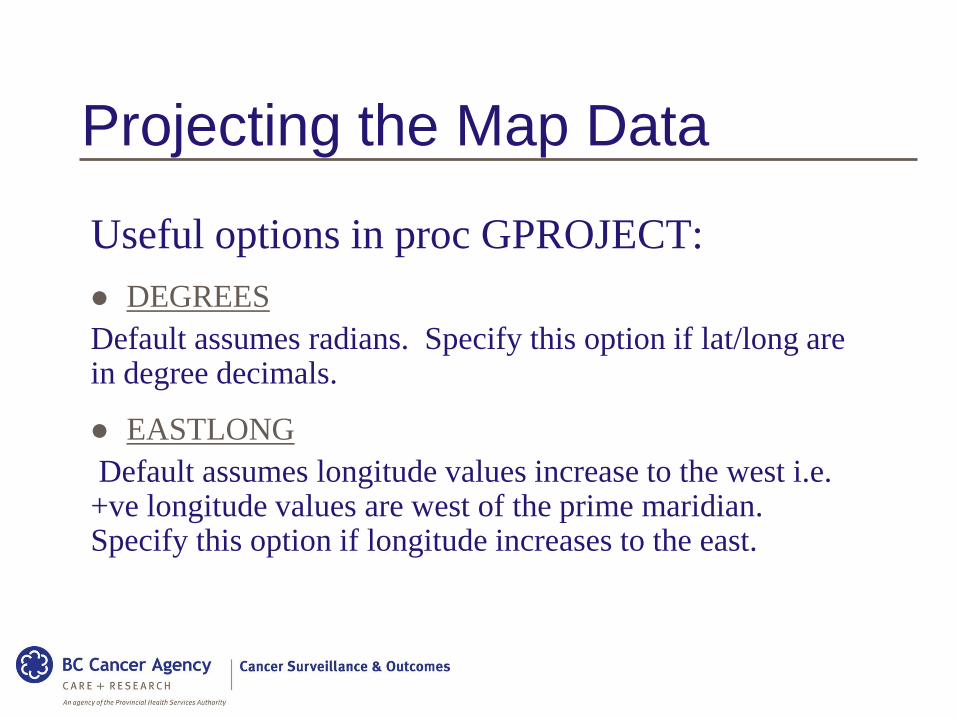
Projecting the Map Data
Useful options in proc GPROJECT:
DEGREES
Default assumes radians. Specify this option if lat/long are in degree decimals.
EASTLONG
Default assumes longitude values increase to the west i.e. +ve longitude values are west of the prime maridian. Specify this option if longitude increases to the east.
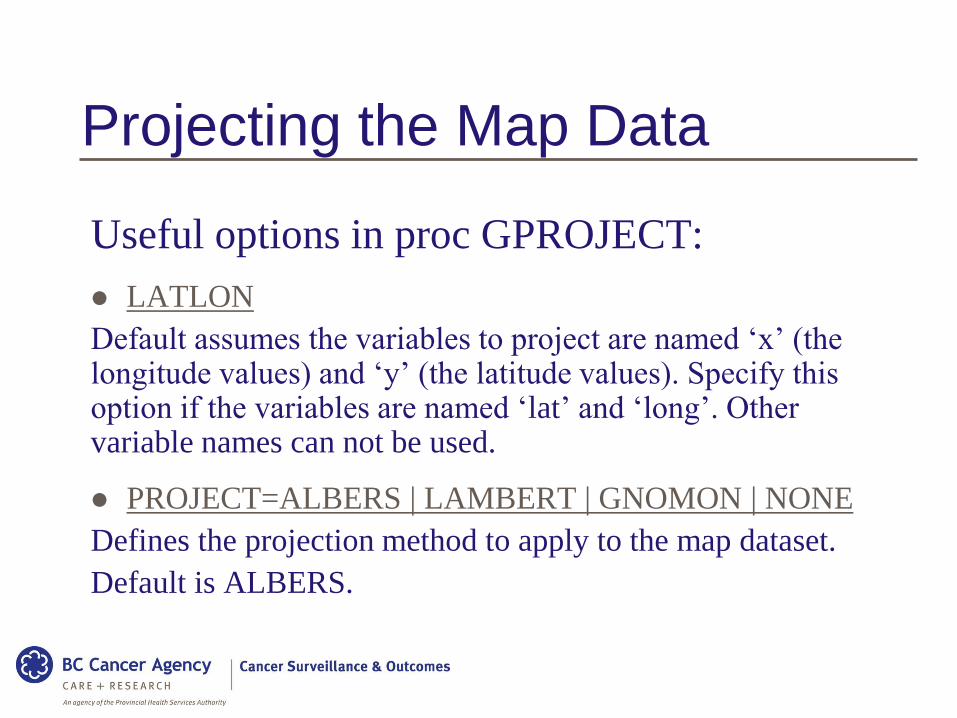
Projecting the Map Data
Useful options in proc GPROJECT:
LATLON
Default assumes the variables to project are named ‘x’ (the longitude values) and ‘y’ (the latitude values). Specify this option if the variables are named ‘lat’ and ‘long’. Other variable names can not be used.
PROJECT=ALBERS | LAMBERT | GNOMON | NONE
Defines the projection method to apply to the map dataset.
Default is ALBERS.
Projecting the Map Data
A lot of the SAS map datasets have ‘x’ and ‘y’ variables which hold the unprojected coordinates and also ‘lat’ and ‘long’ variables which hold the already projected data.
If have projected data no need to project again.
If your data are already projected an error would appear.
Error Message: Expected range is (-180, 180) for X and (-90, 90) for Y
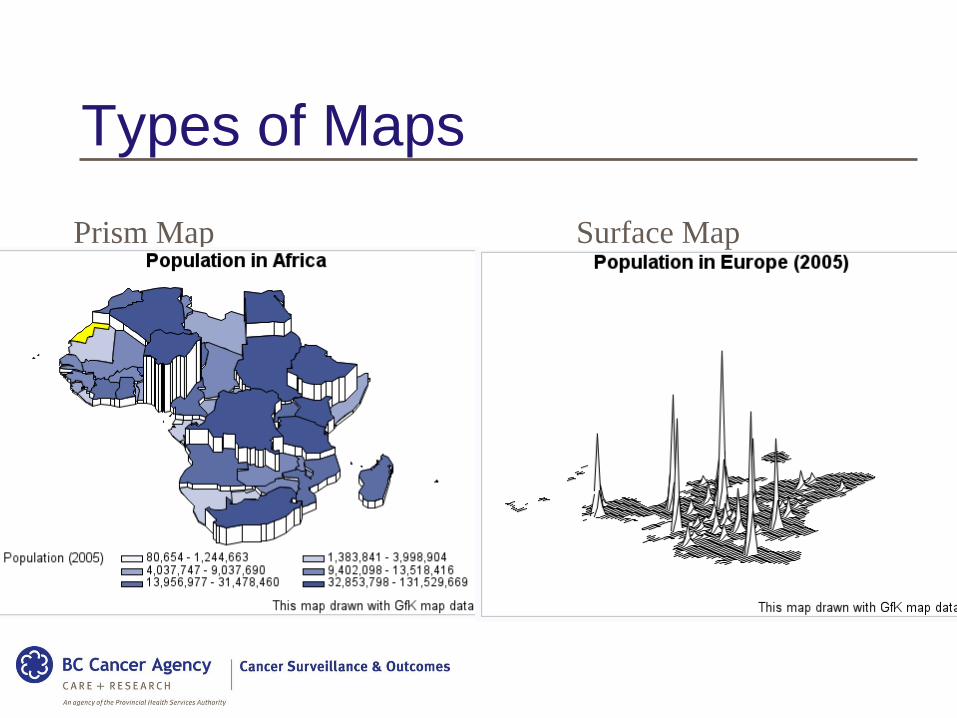
Types of Maps
Prism Map Surface Map
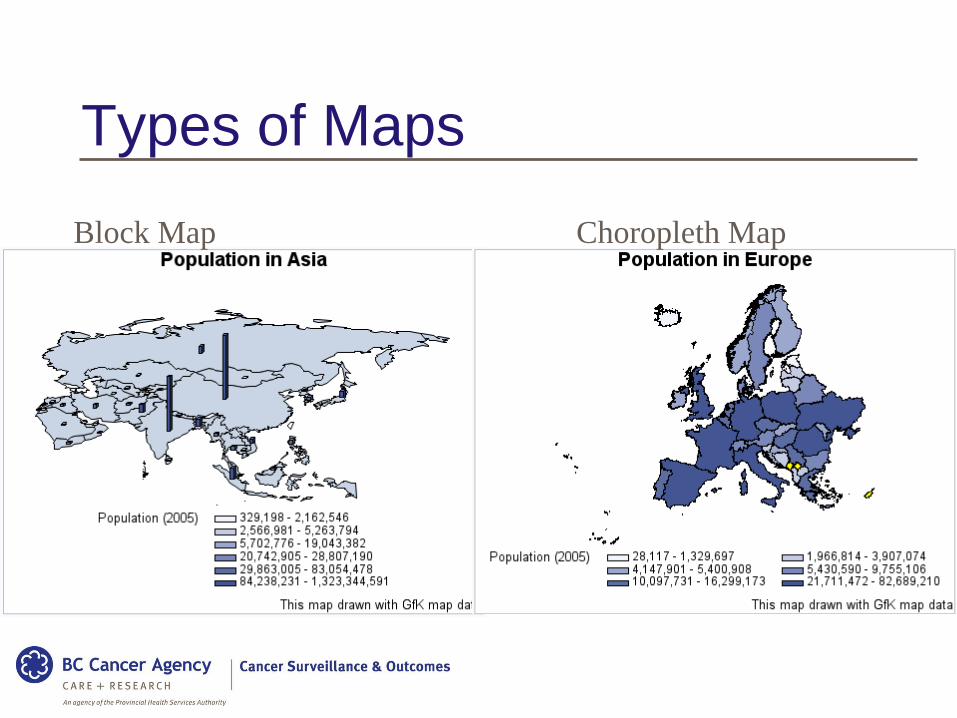
Types of Maps
Block Map Choropleth Map
Producing Maps with Response Data
To produce a map to display response data, you basically need 2 datasets:
(1) The map dataset that has the projected
coordinates
(2) The response dataset – the response data you
want to show the results of on the map
Proc GMAP is used to map the data
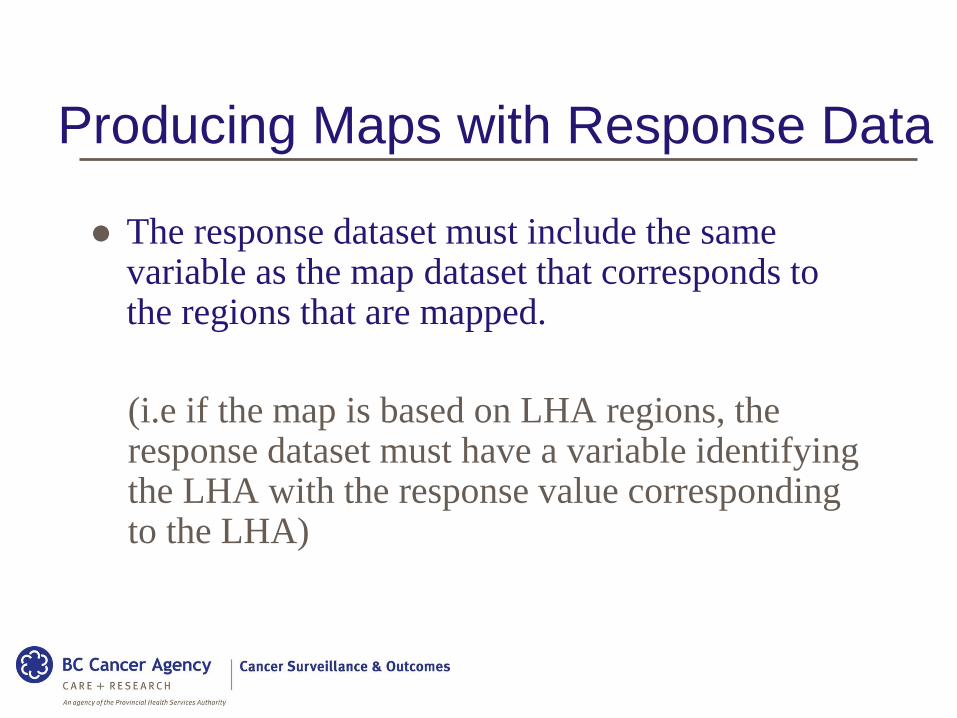
The response dataset must include the same variable as the map dataset that corresponds to the regions that are mapped.
(i.e if the map is based on LHA regions, the response dataset must have a variable identifying the LHA with the response value corresponding to the LHA)
Producing Maps with Response Data

A Few Examples
Basic choropleth map
Changing the colours on the choropleth map
Changing location of the legend
Using a format for the response
Labelling the regions on the map - includes box popup and drill down to a website
Annotating cities on a map
Animating multiple maps
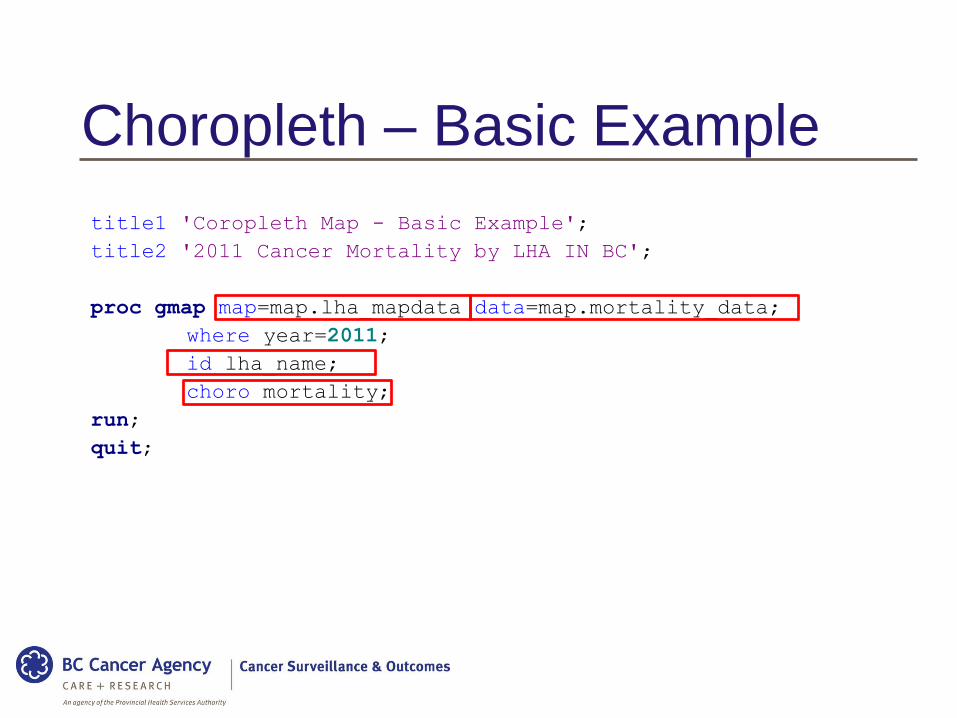
Choropleth – Basic Example
title1 'Coropleth Map - Basic Example';
title2 '2011 Cancer Mortality by LHA IN BC';
proc gmap map=map.lha_mapdata data=map.mortality_data;
where year=2011;
id lha_name;
choro mortality;
run;
quit;
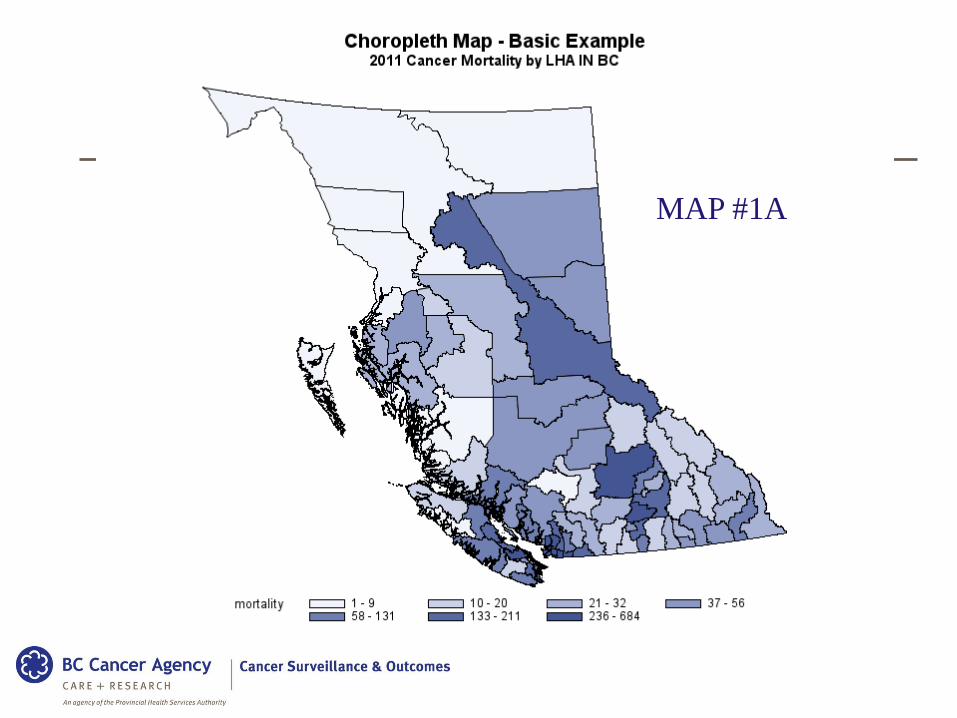
MAP #1A
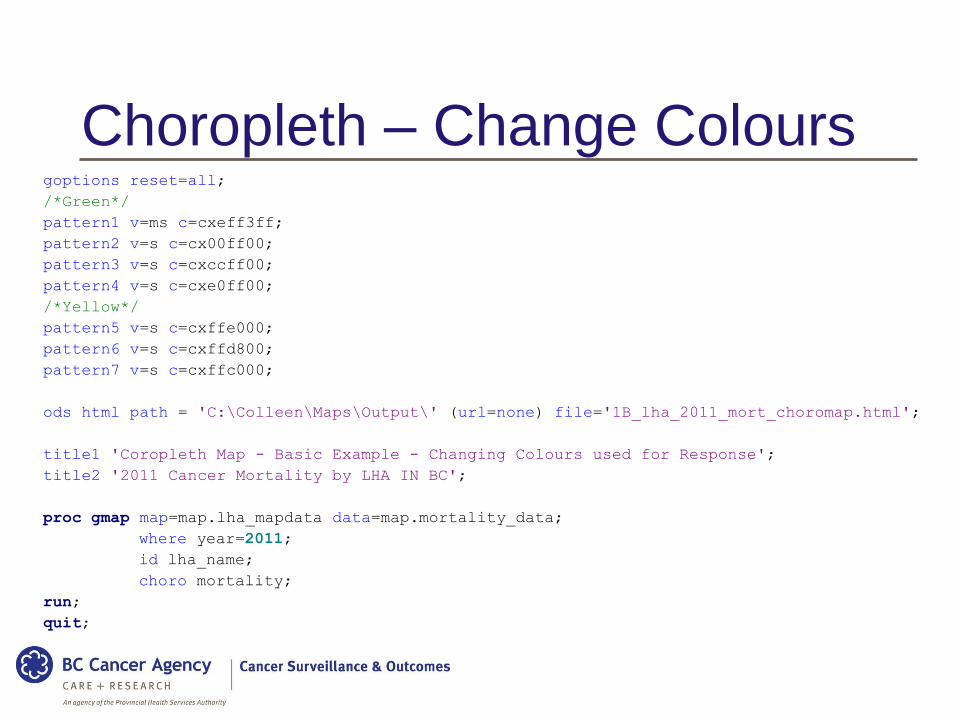
Choropleth – Change Coloursgoptions reset=all;
/*Green*/
pattern1 v=ms c=cxeff3ff;
pattern2 v=s c=cx00ff00;
pattern3 v=s c=cxccff00;
pattern4 v=s c=cxe0ff00;
/*Yellow*/
pattern5 v=s c=cxffe000;
pattern6 v=s c=cxffd800;
pattern7 v=s c=cxffc000;
ods html path = 'C:\Colleen\Maps\Output\' (url=none) file='1B_lha_2011_mort_choromap.html';
title1 'Coropleth Map - Basic Example - Changing Colours used for Response';
title2 '2011 Cancer Mortality by LHA IN BC';
proc gmap map=map.lha_mapdata data=map.mortality_data;
where year=2011;
id lha_name;
choro mortality;
run;
quit;
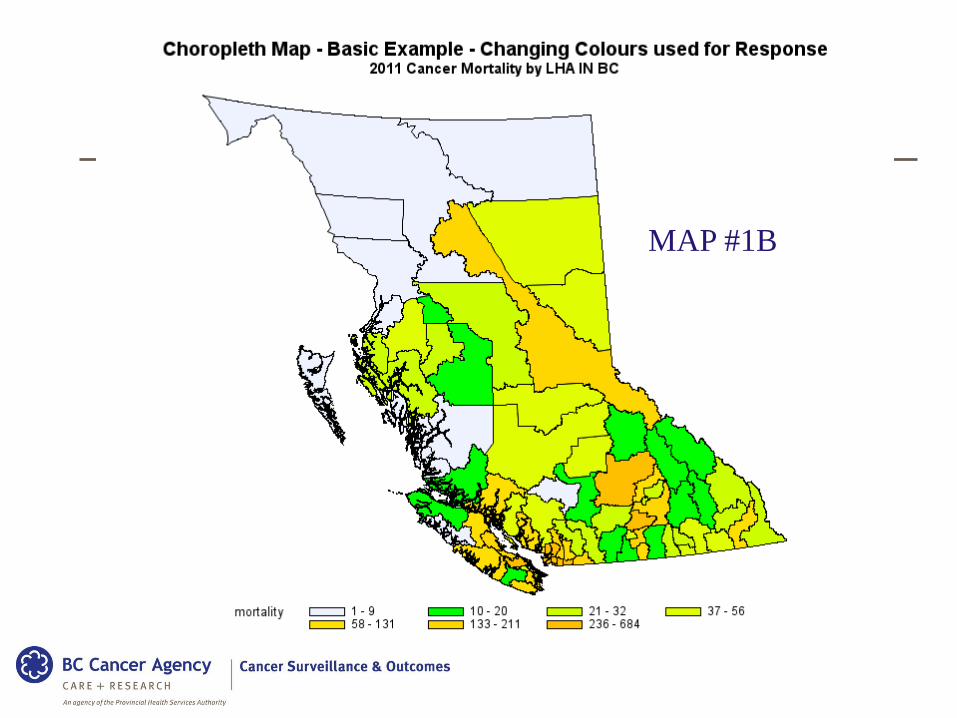
MAP #1B
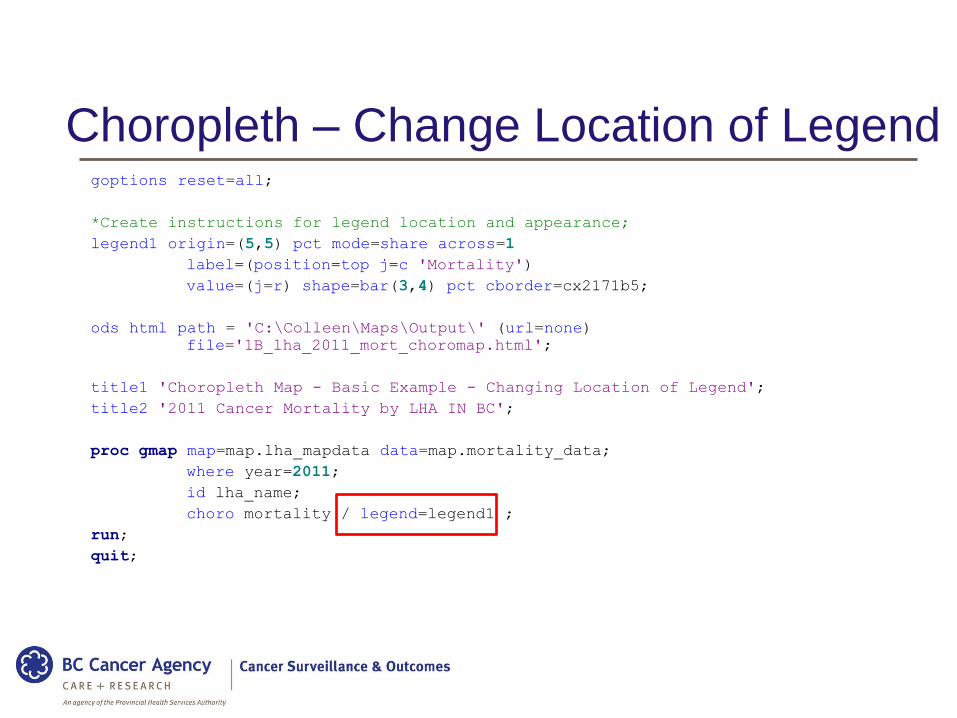
Choropleth – Change Location of Legendgoptions reset=all;
*Create instructions for legend location and appearance;
legend1 origin=(5,5) pct mode=share across=1
label=(position=top j=c 'Mortality')
value=(j=r) shape=bar(3,4) pct cborder=cx2171b5;
ods html path = 'C:\Colleen\Maps\Output\' (url=none)
file='1B_lha_2011_mort_choromap.html';
title1 'Choropleth Map - Basic Example - Changing Location of Legend';
title2 '2011 Cancer Mortality by LHA IN BC';
proc gmap map=map.lha_mapdata data=map.mortality_data;
where year=2011;
id lha_name;
choro mortality / legend=legend1 ;
run;
quit;
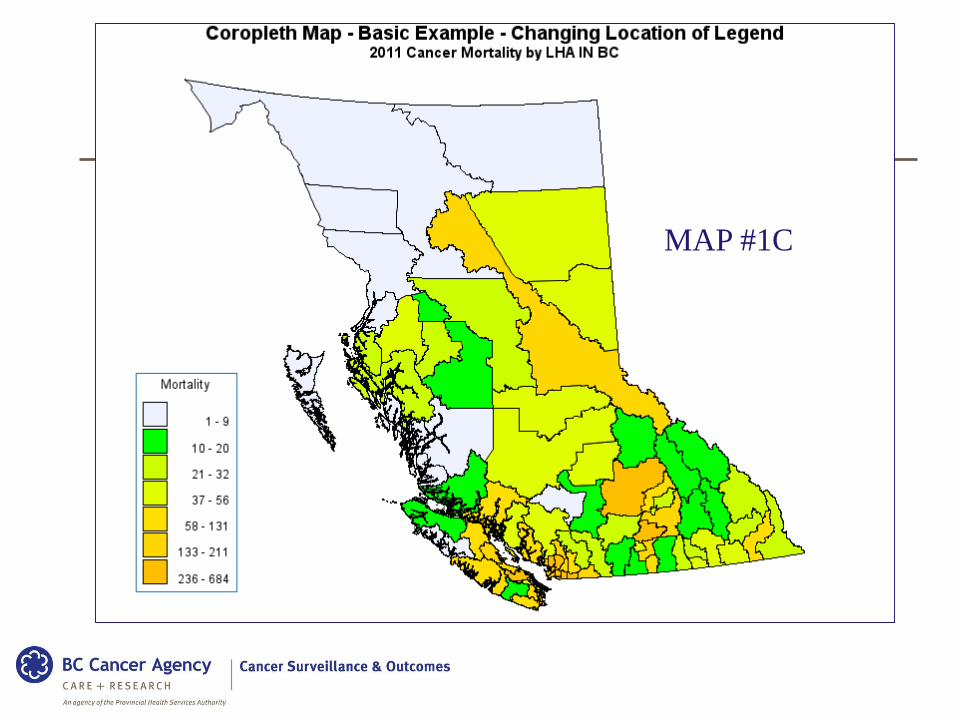
MAP #1C
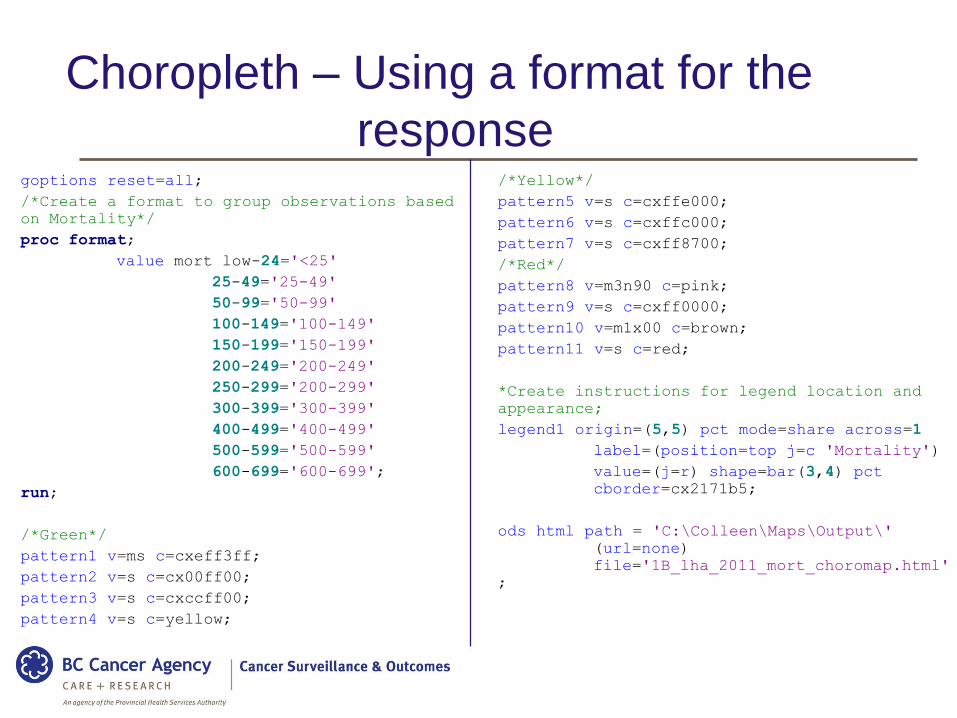
/*Yellow*/
pattern5 v=s c=cxffe000;
pattern6 v=s c=cxffc000;
pattern7 v=s c=cxff8700;
/*Red*/
pattern8 v=m3n90 c=pink;
pattern9 v=s c=cxff0000;
pattern10 v=m1x00 c=brown;
pattern11 v=s c=red;
*Create instructions for legend location and
appearance;
legend1 origin=(5,5) pct mode=share across=1
label=(position=top j=c 'Mortality')
value=(j=r) shape=bar(3,4) pct
cborder=cx2171b5;
ods html path = 'C:\Colleen\Maps\Output\'
(url=none)
file='1B_lha_2011_mort_choromap.html'
;
Choropleth – Using a format for the
responsegoptions reset=all;
/*Create a format to group observations based
on Mortality*/
proc format;
value mort low-24='<25'
25-49='25-49'
50-99='50-99'
100-149='100-149'
150-199='150-199'
200-249='200-249'
250-299='200-299'
300-399='300-399'
400-499='400-499'
500-599='500-599'
600-699='600-699';
run;
/*Green*/
pattern1 v=ms c=cxeff3ff;
pattern2 v=s c=cx00ff00;
pattern3 v=s c=cxccff00;
pattern4 v=s c=yellow;
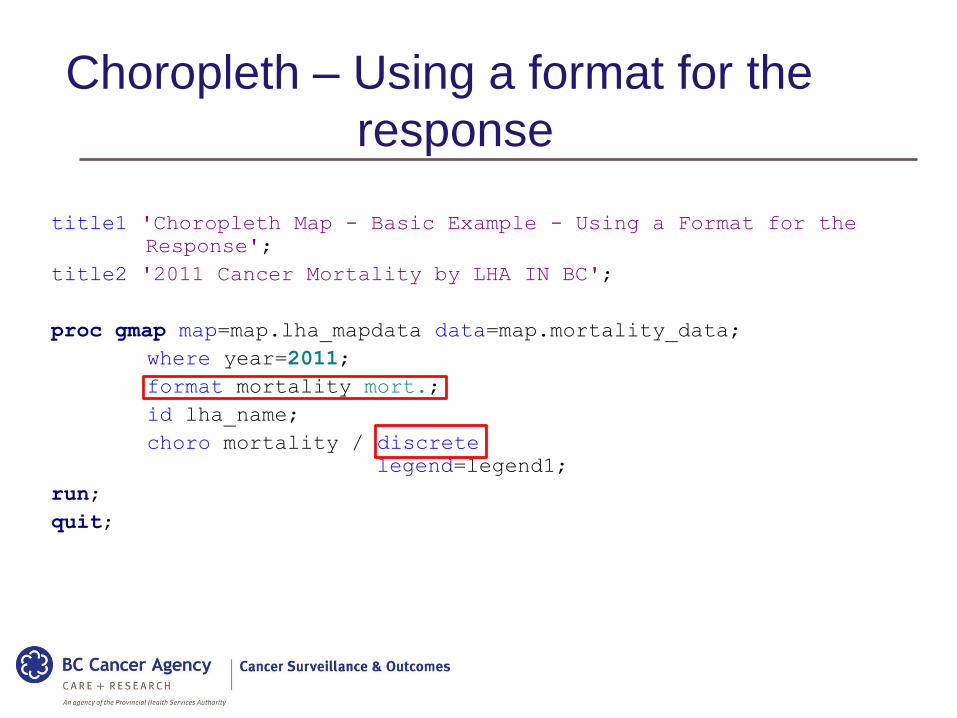
title1 'Choropleth Map - Basic Example - Using a Format for the
Response';
title2 '2011 Cancer Mortality by LHA IN BC';
proc gmap map=map.lha_mapdata data=map.mortality_data;
where year=2011;
format mortality mort.;
id lha_name;
choro mortality / discrete
legend=legend1;
run;
quit;
Choropleth – Using a format for the
response
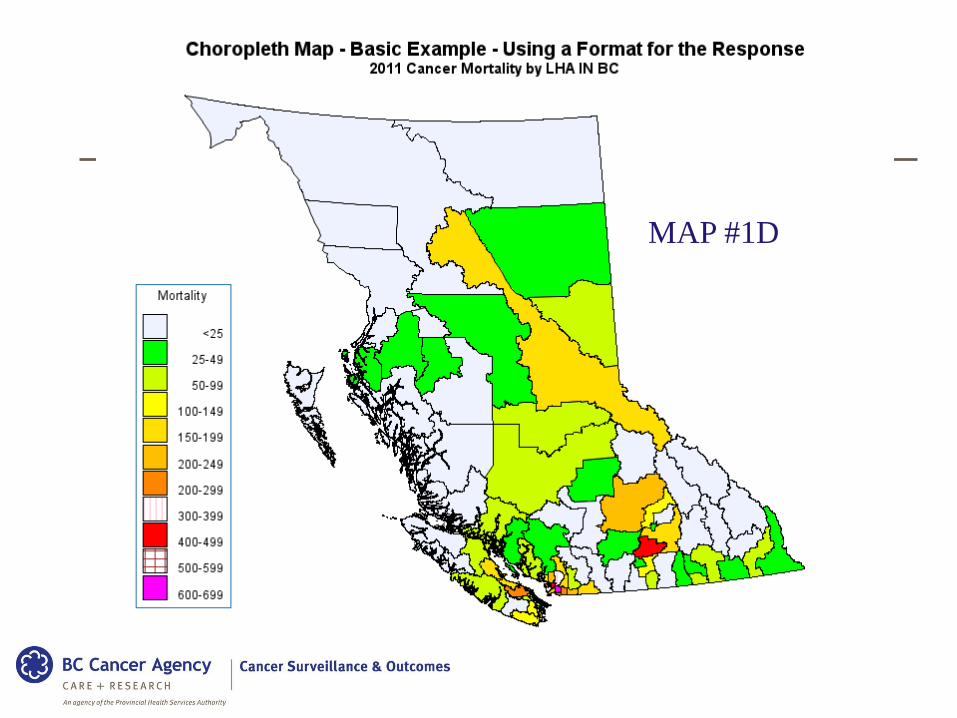
MAP #1D
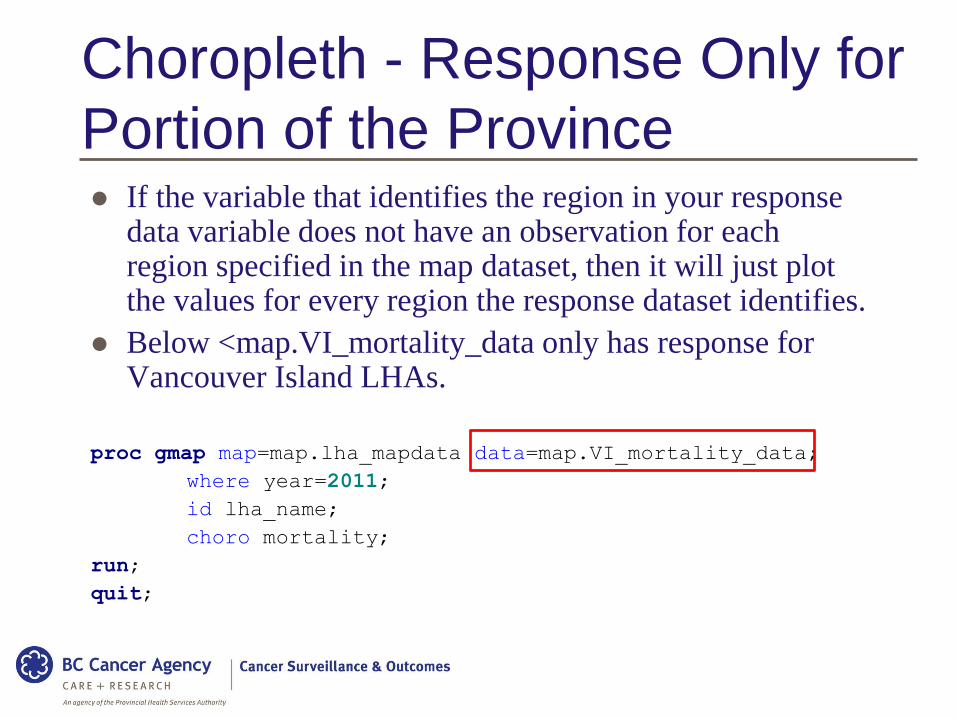
Choropleth - Response Only for
Portion of the Province If the variable that identifies the region in your response
data variable does not have an observation for each region specified in the map dataset, then it will just plot the values for every region the response dataset identifies.
Below <map.VI_mortality_data only has response for Vancouver Island LHAs.
proc gmap map=map.lha_mapdata data=map.VI_mortality_data;
where year=2011;
id lha_name;
choro mortality;
run;
quit;
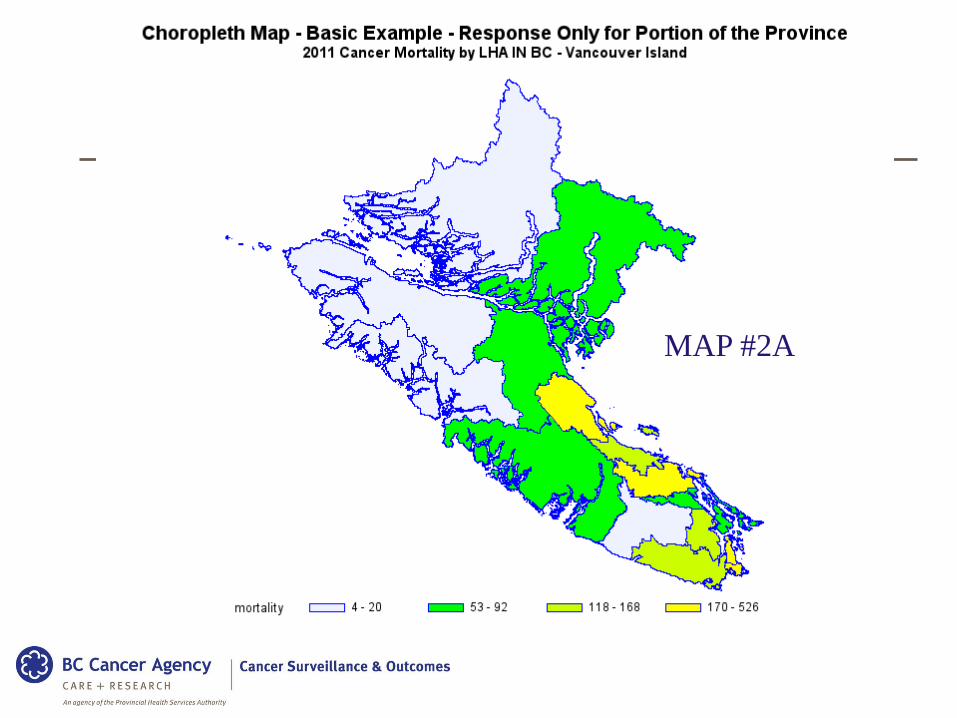
MAP #2A
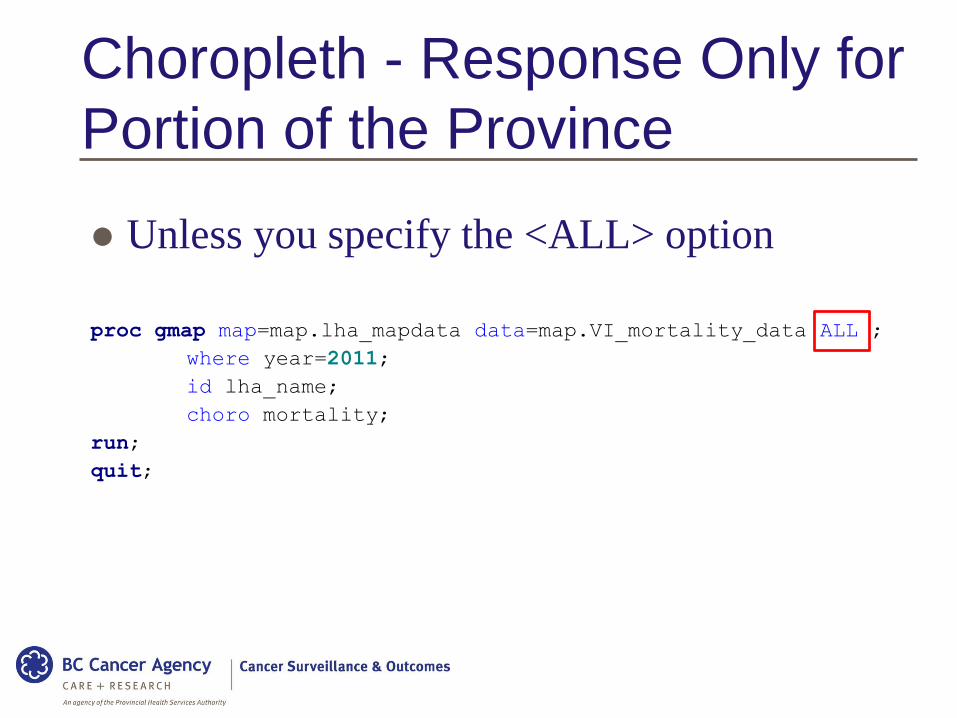
Unless you specify the <ALL> option
proc gmap map=map.lha_mapdata data=map.VI_mortality_data ALL ;
where year=2011;
id lha_name;
choro mortality;
run;
quit;
Choropleth - Response Only for
Portion of the Province
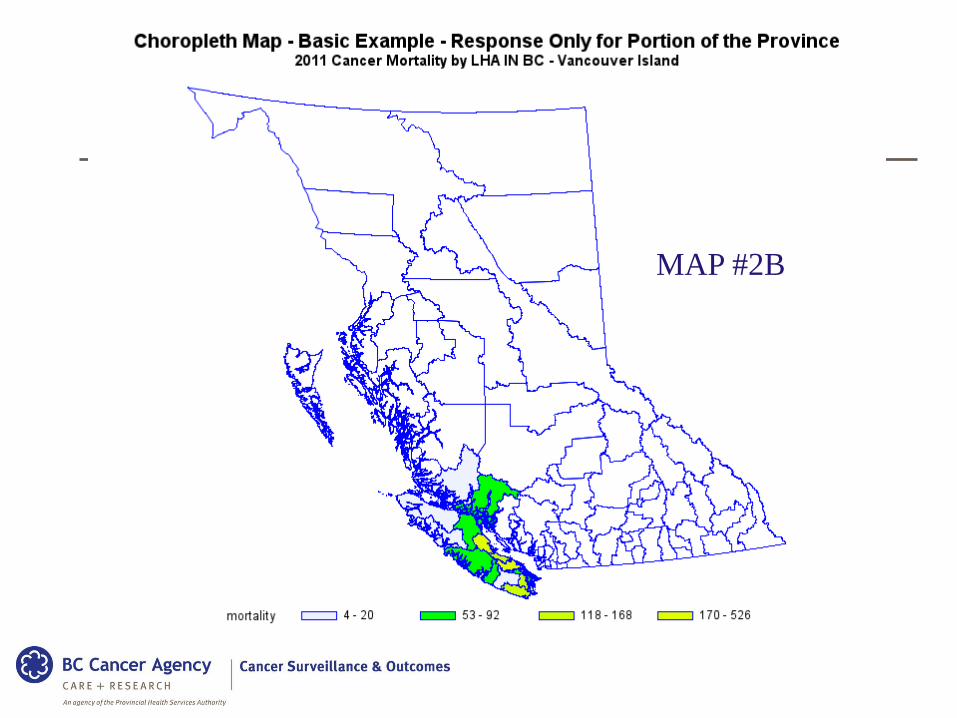
MAP #2B
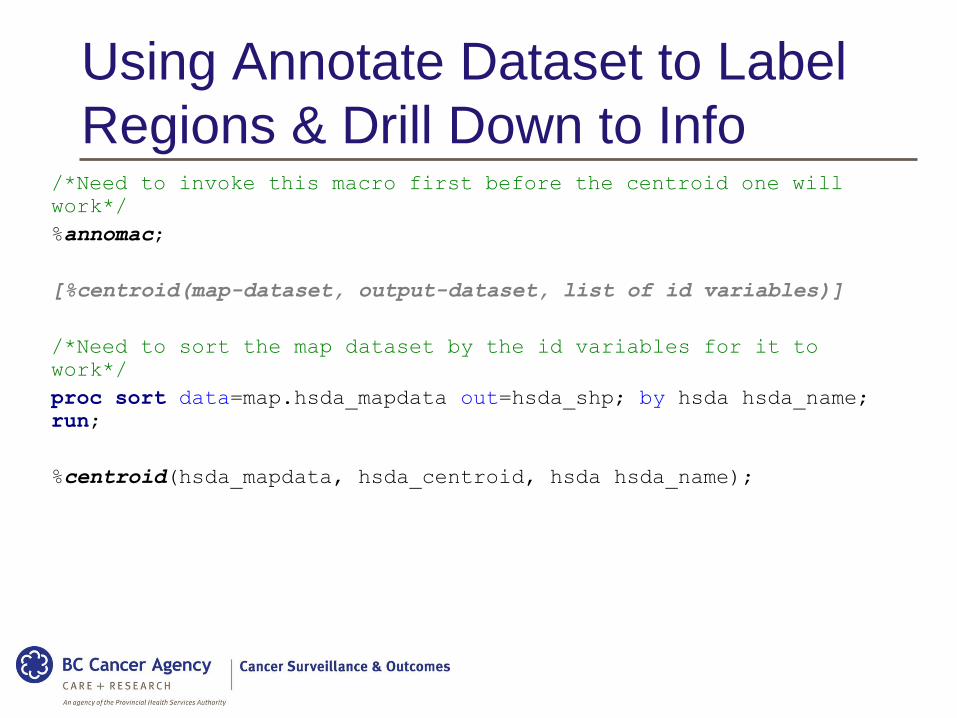
Using Annotate Dataset to Label
Regions & Drill Down to Info/*Need to invoke this macro first before the centroid one will
work*/
%annomac;
[%centroid(map-dataset, output-dataset, list of id variables)]
/*Need to sort the map dataset by the id variables for it to
work*/
proc sort data=map.hsda_mapdata out=hsda_shp; by hsda hsda_name;
run;
%centroid(hsda_mapdata, hsda_centroid, hsda hsda_name);
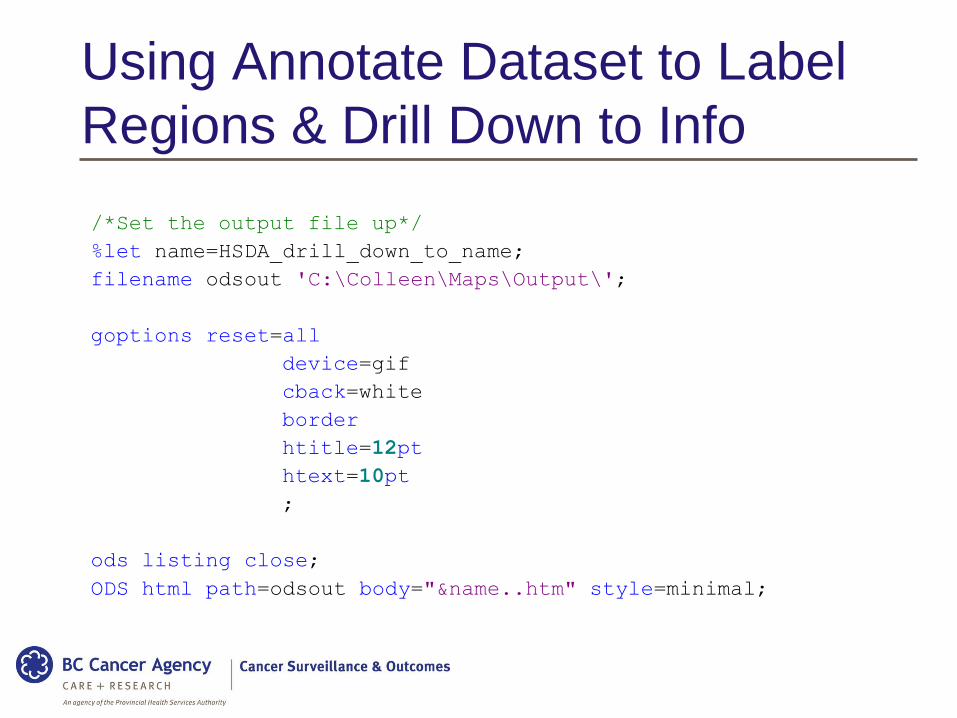
/*Set the output file up*/
%let name=HSDA_drill_down_to_name;
filename odsout 'C:\Colleen\Maps\Output\';
goptions reset=all
device=gif
cback=white
border
htitle=12pt
htext=10pt
;
ods listing close;
ODS html path=odsout body="&name..htm" style=minimal;
Using Annotate Dataset to Label
Regions & Drill Down to Info
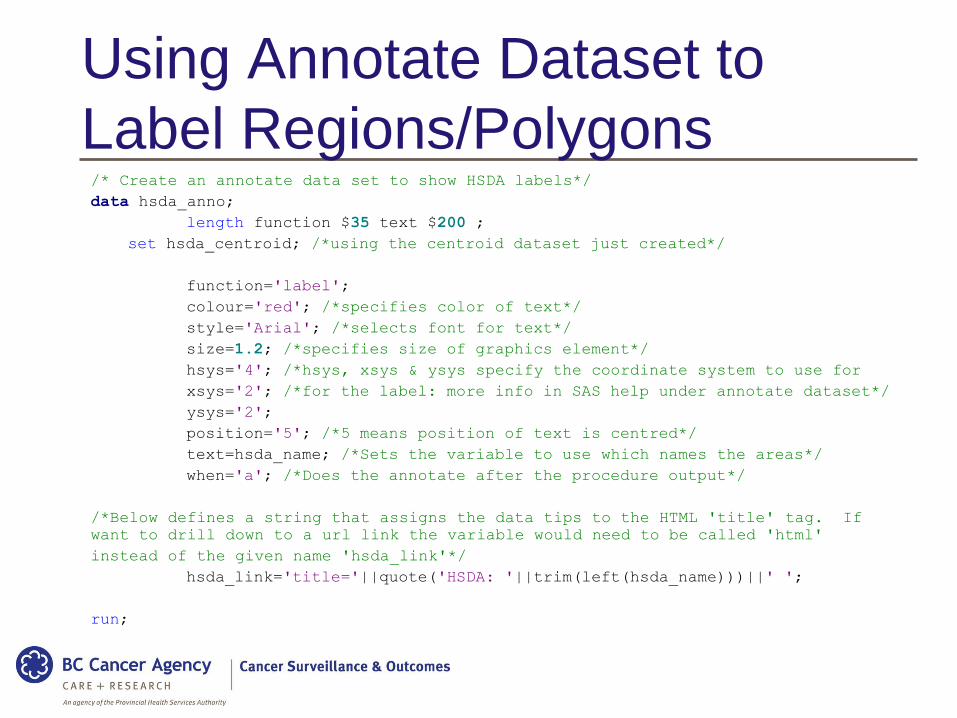
Using Annotate Dataset to
Label Regions/Polygons/* Create an annotate data set to show HSDA labels*/
data hsda_anno;
length function $35 text $200 ;
set hsda_centroid; /*using the centroid dataset just created*/
function='label';
colour='red'; /*specifies color of text*/
style='Arial'; /*selects font for text*/
size=1.2; /*specifies size of graphics element*/
hsys='4'; /*hsys, xsys & ysys specify the coordinate system to use for
xsys='2'; /*for the label: more info in SAS help under annotate dataset*/
ysys='2';
position='5'; /*5 means position of text is centred*/
text=hsda_name; /*Sets the variable to use which names the areas*/
when='a'; /*Does the annotate after the procedure output*/
/*Below defines a string that assigns the data tips to the HTML 'title' tag. If
want to drill down to a url link the variable would need to be called 'html'
instead of the given name 'hsda_link'*/
hsda_link='title='||quote('HSDA: '||trim(left(hsda_name)))||' ';
run;
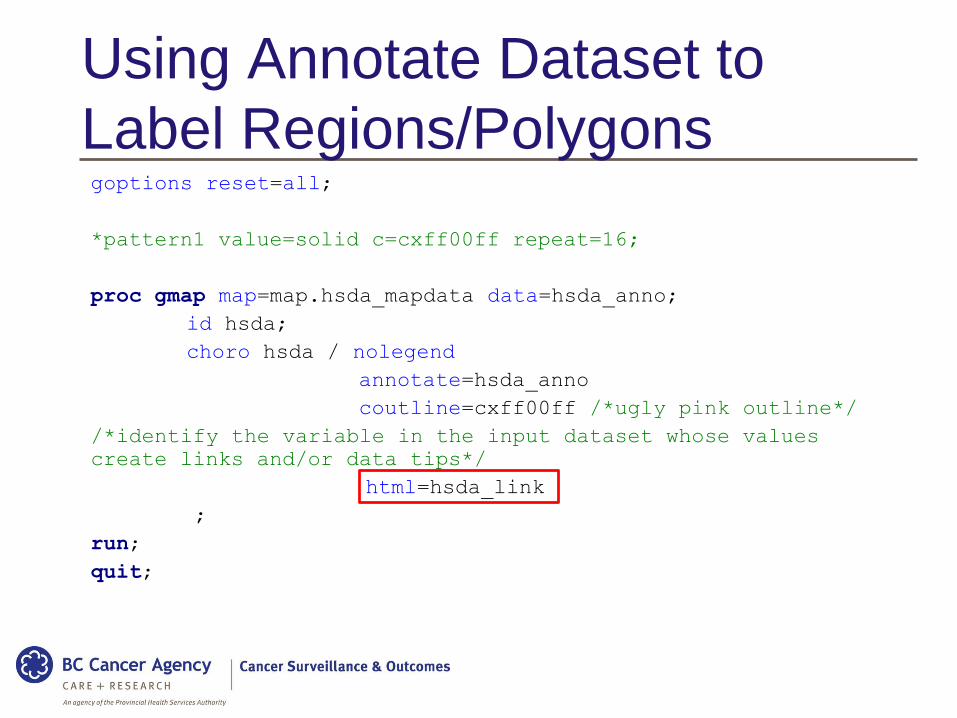
Using Annotate Dataset to
Label Regions/Polygonsgoptions reset=all;
*pattern1 value=solid c=cxff00ff repeat=16;
proc gmap map=map.hsda_mapdata data=hsda_anno;
id hsda;
choro hsda / nolegend
annotate=hsda_anno
coutline=cxff00ff /*ugly pink outline*/
/*identify the variable in the input dataset whose values
create links and/or data tips*/
html=hsda_link
;
run;
quit;
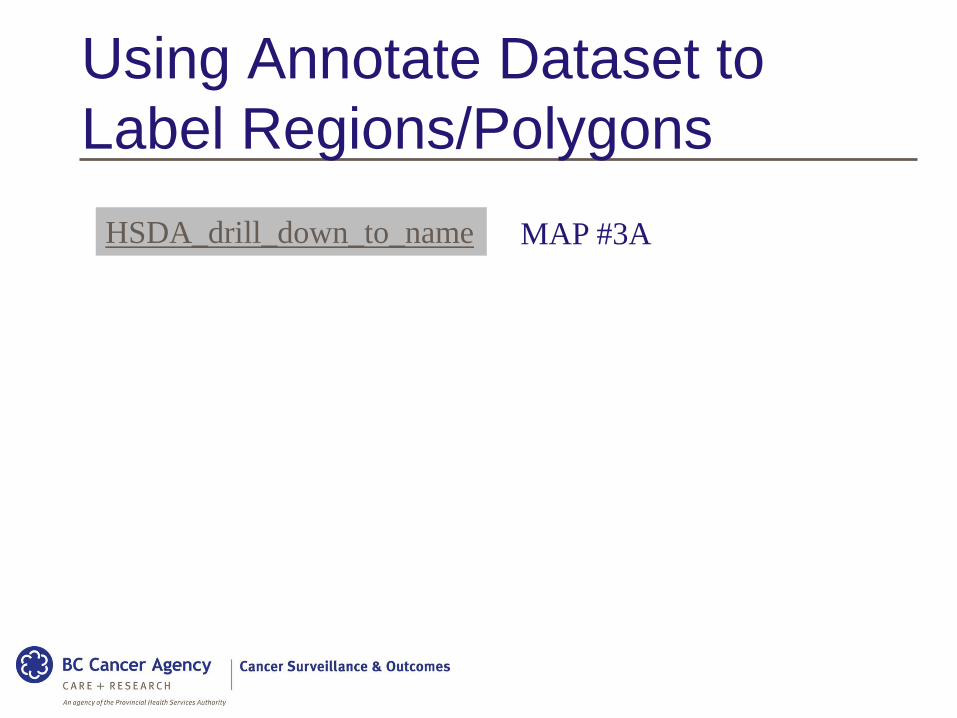
Using Annotate Dataset to
Label Regions/Polygons
HSDA_drill_down_to_name MAP #3A
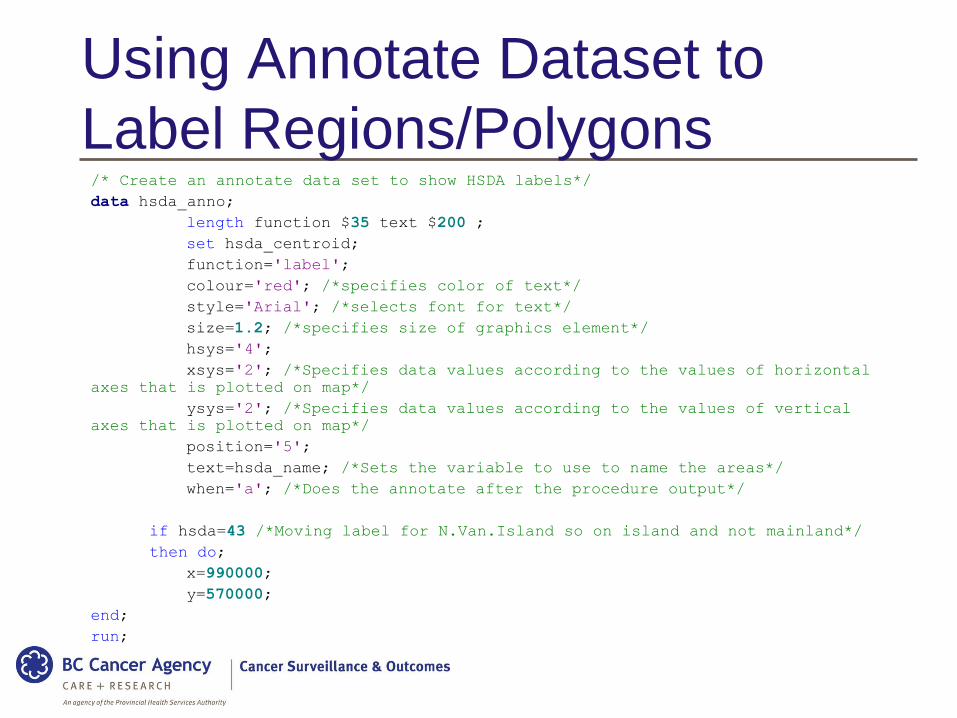
Using Annotate Dataset to
Label Regions/Polygons/* Create an annotate data set to show HSDA labels*/
data hsda_anno;
length function $35 text $200 ;
set hsda_centroid;
function='label';
colour='red'; /*specifies color of text*/
style='Arial'; /*selects font for text*/
size=1.2; /*specifies size of graphics element*/
hsys='4';
xsys='2'; /*Specifies data values according to the values of horizontal
axes that is plotted on map*/
ysys='2'; /*Specifies data values according to the values of vertical
axes that is plotted on map*/
position='5';
text=hsda_name; /*Sets the variable to use to name the areas*/
when='a'; /*Does the annotate after the procedure output*/
if hsda=43 /*Moving label for N.Van.Island so on island and not mainland*/
then do;
x=990000;
y=570000;
end;
run;
Using Annotate Dataset to
Label Regions/Polygons
Link_to_map_HSDA_drill_down_to_name_label_
move
MAP #3B
Cities Colleen has travelled to shown on the World Map
Link to Map
Animated Mapping & Using Annotate
Dataset to Put Cities on a Map
MAP #4
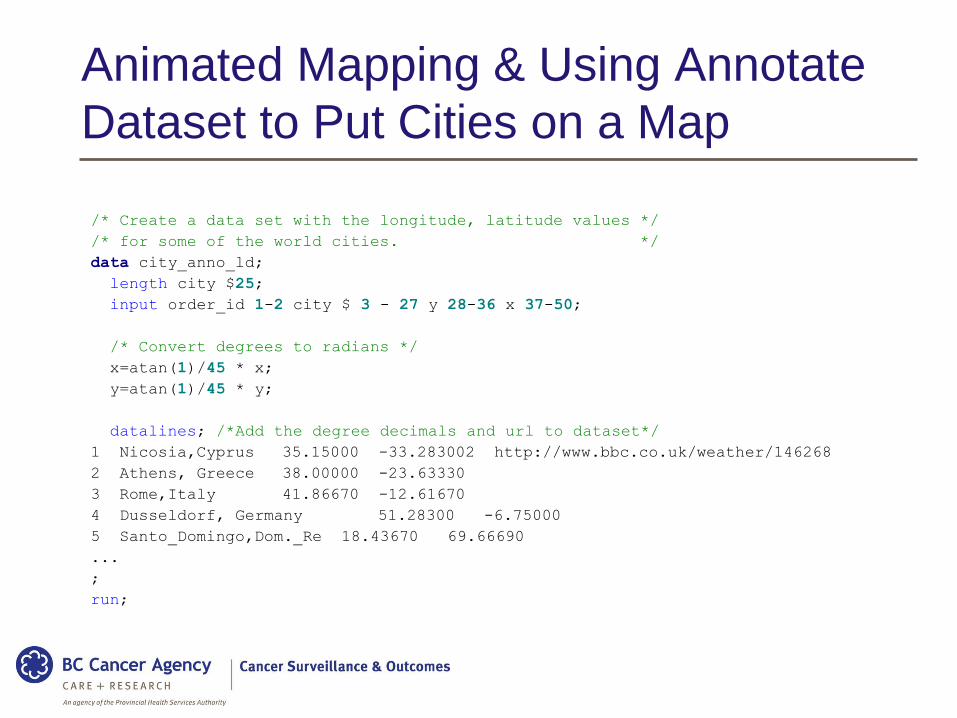
/* Create a data set with the longitude, latitude values */
/* for some of the world cities. */
data city_anno_ld;
length city $25;
input order_id 1-2 city $ 3 - 27 y 28-36 x 37-50;
/* Convert degrees to radians */
x=atan(1)/45 * x;
y=atan(1)/45 * y;
datalines; /*Add the degree decimals and url to dataset*/
1 Nicosia,Cyprus 35.15000 -33.283002 http://www.bbc.co.uk/weather/146268
2 Athens, Greece 38.00000 -23.63330
3 Rome,Italy 41.86670 -12.61670
4 Dusseldorf, Germany 51.28300 -6.75000
5 Santo_Domingo,Dom._Re 18.43670 69.66690
...
;
run;
Animated Mapping & Using Annotate
Dataset to Put Cities on a Map
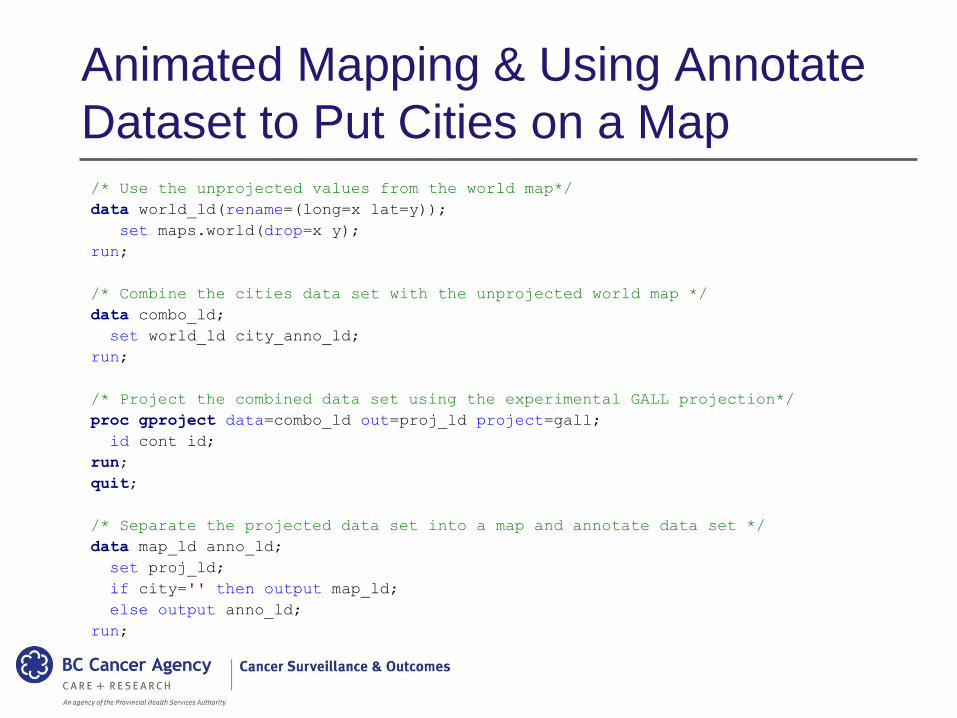
/* Use the unprojected values from the world map*/
data world_ld(rename=(long=x lat=y));
set maps.world(drop=x y);
run;
/* Combine the cities data set with the unprojected world map */
data combo_ld;
set world_ld city_anno_ld;
run;
/* Project the combined data set using the experimental GALL projection*/
proc gproject data=combo_ld out=proj_ld project=gall;
id cont id;
run;
quit;
/* Separate the projected data set into a map and annotate data set */
data map_ld anno_ld;
set proj_ld;
if city='' then output map_ld;
else output anno_ld;
run;
Animated Mapping & Using Annotate
Dataset to Put Cities on a Map
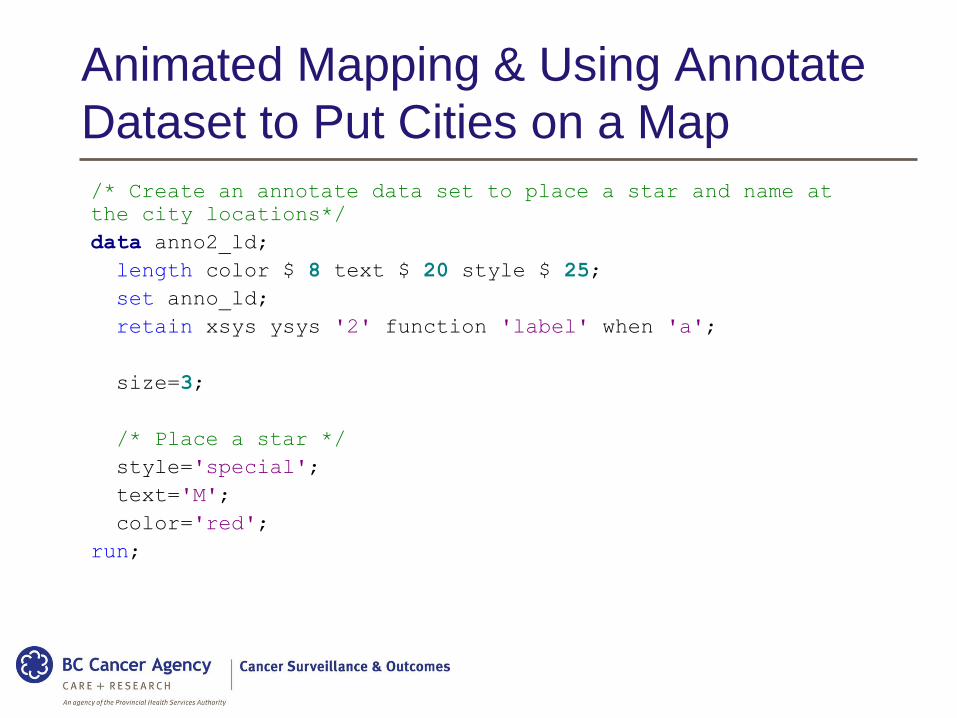
/* Create an annotate data set to place a star and name at
the city locations*/
data anno2_ld;
length color $ 8 text $ 20 style $ 25;
set anno_ld;
retain xsys ysys '2' function 'label' when 'a';
size=3;
/* Place a star */
style='special';
text='M';
color='red';
run;
Animated Mapping & Using Annotate
Dataset to Put Cities on a Map

/*Create a macro that produces the map*/
%macro citymap;
proc gmap map=map_ld data=map_ld;
id cont id;
choro id / anno=anno_use
nolegend
coutline=grayaa;
run;
%mend;
Animated Mapping & Using Annotate
Dataset to Put Cities on a Map
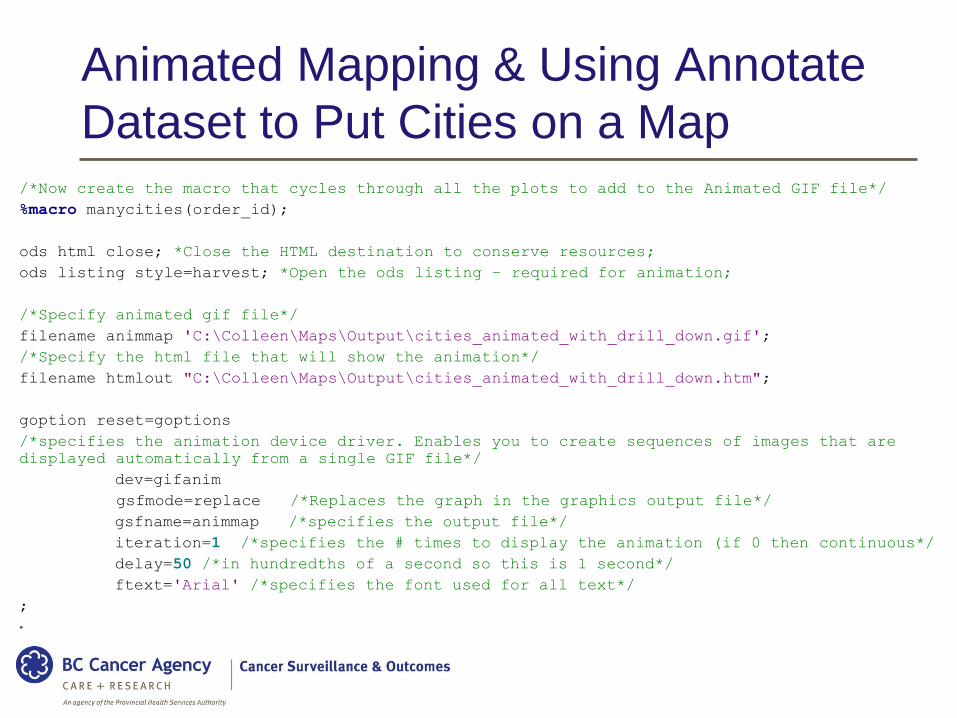
/*Now create the macro that cycles through all the plots to add to the Animated GIF file*/
%macro manycities(order_id);
ods html close; *Close the HTML destination to conserve resources;
ods listing style=harvest; *Open the ods listing – required for animation;
/*Specify animated gif file*/
filename animmap 'C:\Colleen\Maps\Output\cities_animated_with_drill_down.gif';
/*Specify the html file that will show the animation*/
filename htmlout "C:\Colleen\Maps\Output\cities_animated_with_drill_down.htm";
goption reset=goptions
/*specifies the animation device driver. Enables you to create sequences of images that are
displayed automatically from a single GIF file*/
dev=gifanim
gsfmode=replace /*Replaces the graph in the graphics output file*/
gsfname=animmap /*specifies the output file*/
iteration=1 /*specifies the # times to display the animation (if 0 then continuous*/
delay=50 /*in hundredths of a second so this is 1 second*/
ftext='Arial' /*specifies the font used for all text*/
;
•
Animated Mapping & Using Annotate
Dataset to Put Cities on a Map
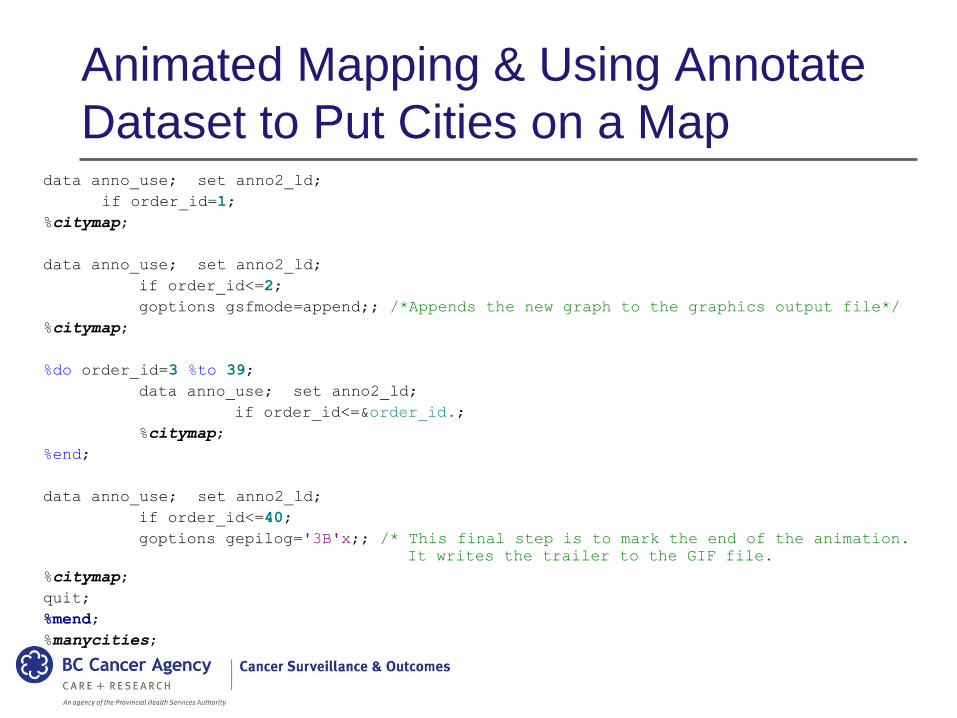
data anno_use; set anno2_ld;
if order_id=1;
%citymap;
data anno_use; set anno2_ld;
if order_id<=2;
goptions gsfmode=append;; /*Appends the new graph to the graphics output file*/
%citymap;
%do order_id=3 %to 39;
data anno_use; set anno2_ld;
if order_id<=&order_id.;
%citymap;
%end;
data anno_use; set anno2_ld;
if order_id<=40;
goptions gepilog='3B'x;; /* This final step is to mark the end of the animation.
It writes the trailer to the GIF file.
%citymap;
quit;
%mend;
%manycities;
Animated Mapping & Using Annotate
Dataset to Put Cities on a Map
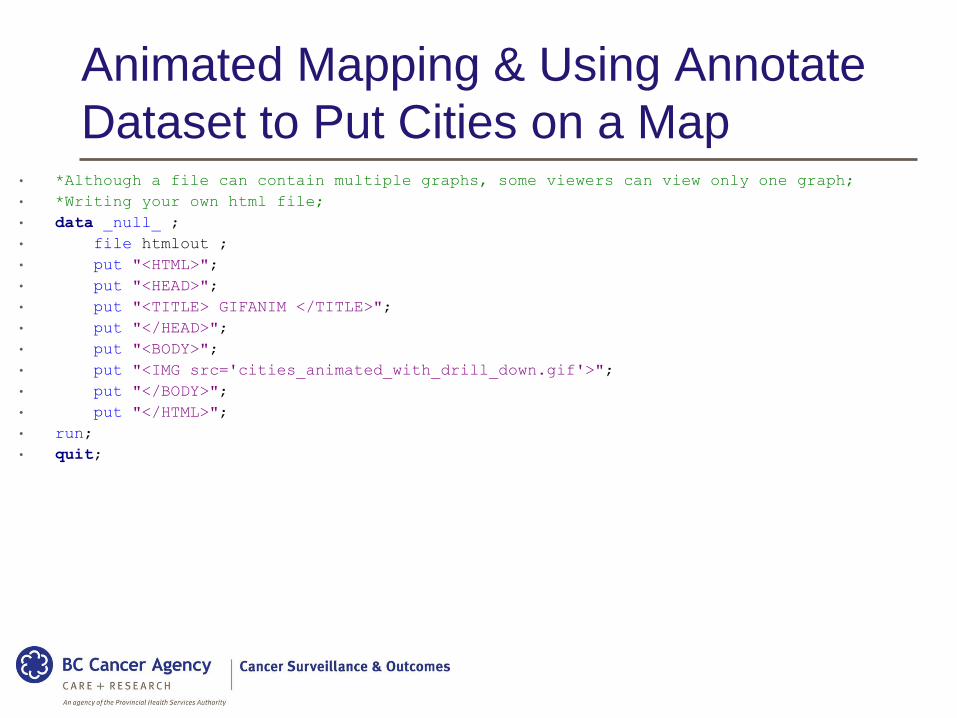
• *Although a file can contain multiple graphs, some viewers can view only one graph;
• *Writing your own html file;
• data _null_ ;
• file htmlout ;
• put "<HTML>";
• put "<HEAD>";
• put "<TITLE> GIFANIM </TITLE>";
• put "</HEAD>";
• put "<BODY>";
• put "<IMG src='cities_animated_with_drill_down.gif'>";
• put "</BODY>";
• put "</HTML>";
• run;
• quit;
Animated Mapping & Using Annotate
Dataset to Put Cities on a Map
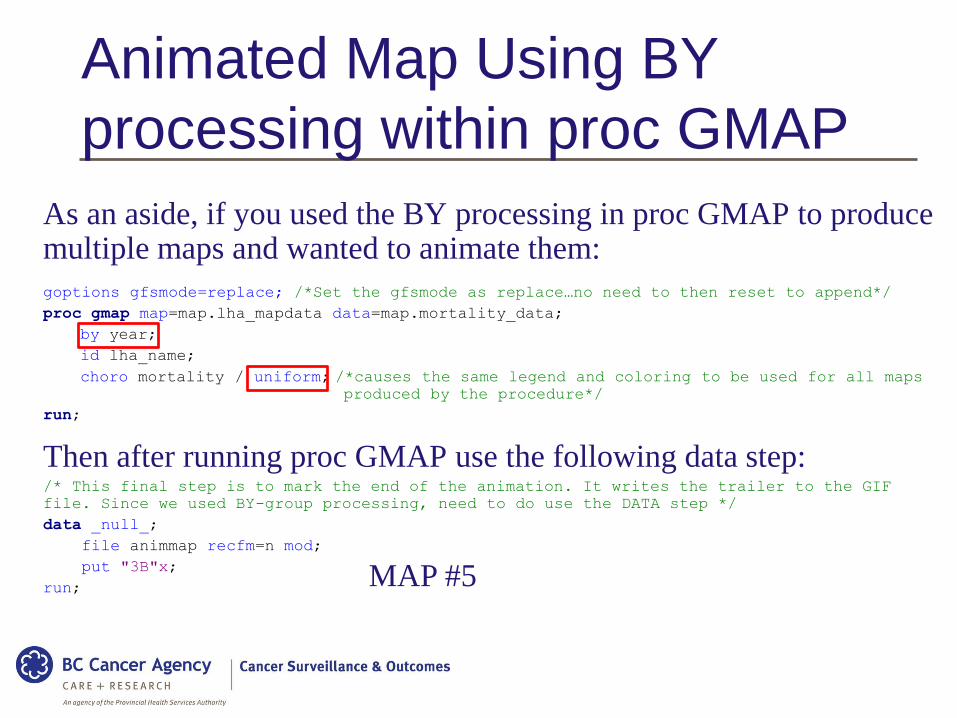
As an aside, if you used the BY processing in proc GMAP to produce multiple maps and wanted to animate them:
goptions gfsmode=replace; /*Set the gfsmode as replace…no need to then reset to append*/
proc gmap map=map.lha_mapdata data=map.mortality_data;
by year;
id lha_name;
choro mortality / uniform; /*causes the same legend and coloring to be used for all maps
produced by the procedure*/
run;
Then after running proc GMAP use the following data step:/* This final step is to mark the end of the animation. It writes the trailer to the GIF
file. Since we used BY-group processing, need to do use the DATA step */
data _null_;
file animmap recfm=n mod;
put "3B"x;
run;
Animated Map Using BY
processing within proc GMAP
MAP #5
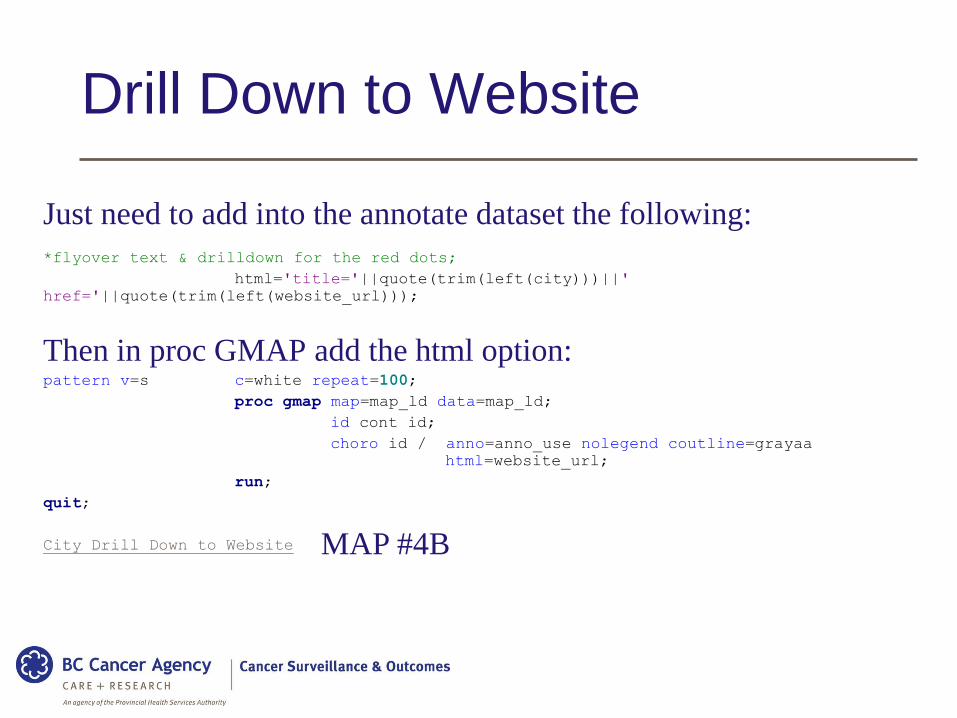
Just need to add into the annotate dataset the following:
*flyover text & drilldown for the red dots;
html='title='||quote(trim(left(city)))||'
href='||quote(trim(left(website_url)));
Then in proc GMAP add the html option:pattern v=s c=white repeat=100;
proc gmap map=map_ld data=map_ld;
id cont id;
choro id / anno=anno_use nolegend coutline=grayaa
html=website_url;
run;
quit;
City Drill Down to Website
Drill Down to Website
MAP #4B