Embed Size (px)
Citation preview

2014 Service Availability Benchmark Survey
Published by

© Continuity Software 2014 2
Executive Summary This benchmark survey presents service availability metrics that allow IT infrastructure, business continuity, and disaster recovery managers to compare their organization’s performance and practices to their peers. The results presented here are based on responses from 155 professionals from a wide range of industries and geographies collected through an online survey. Some of the key findings of the survey include:
• Ensuring customer satisfaction is the most common business driver for service availability, mentioned by 43% of the survey respondents. The vast majority (90%) indicated service availability is highly critical to their customers (at least 8 on a scale of 1-10).
• At the same time, 41% of the organization surveyed missed their service availability goal for mission-critical systems in 2013. Organizations with higher service availability goals were significantly less successful in meeting their goal. Given these results, it is not surprising that 66% of the respondents have initiatives for improving service availability management in 2014.
• The most common and most effective strategy for ensuring service availability is virtualization HA, used by 72% of the respondents this year compared to 63% in 2013.
• Proactive identification of risks is the top challenge 20% of the respondents face in ensuring service availability.
© Continuity Software 2014 3
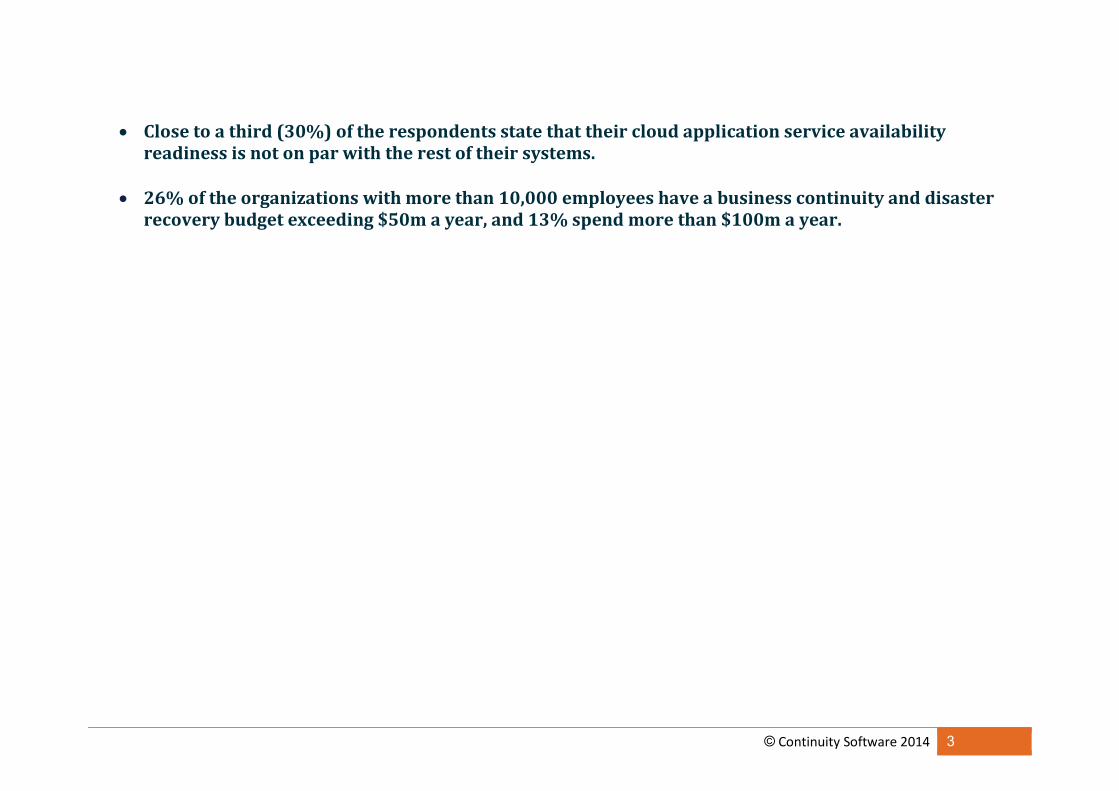
• Close to a third (30%) of the respondents state that their cloud application service availability readiness is not on par with the rest of their systems.
• 26% of the organizations with more than 10,000 employees have a business continuity and disaster recovery budget exceeding $50m a year, and 13% spend more than $100m a year.

© Continuity Software 2014 4
Table of Contents
What Drives Service Availability Goals? .................................................................................................................................................................. 5 Importance of Service Availability to Customers ..................................................................................................................................................... 6 Service Availability Commitment to Customers ...................................................................................................................................................... 7 Service Availability Goals ....................................................................................................................................................................................... 8 Service Availability: The Reality ............................................................................................................................................................................. 9 What is Downtime? ............................................................................................................................................................................................. 10 Last Downtime Event .......................................................................................................................................................................................... 11 Strategies and Tools to Ensure Service Availability ............................................................................................................................................... 12 The Effectiveness of Service Availability Strategies and Tools ............................................................................................................................... 13 Top Challenges in Ensuring Service Availability .................................................................................................................................................... 14 Cost of Downtime ................................................................................................................................................................................................ 15 Causes for Outages .............................................................................................................................................................................................. 16 Which Industry was Most Successful in Meeting its Service Availability Goals? ...................................................................................................... 17 Mission-Critical in the Cloud ................................................................................................................................................................................ 18 Private Cloud Testing .......................................................................................................................................................................................... 19 Cloud Application Service Availability Readiness .................................................................................................................................................. 20 Annual Business Continuity / Disaster Recovery Budget ....................................................................................................................................... 21 Annual Business Continuity / Disaster Recovery Budget vs. Cost of Downtime ....................................................................................................... 22 Respondent Demographics .................................................................................................................................................................................. 23 Respondent Demographics .................................................................................................................................................................................. 24 Table of Figures .................................................................................................................................................................................................. 25

© Continuity Software 2014 5
What Drives Service Availability Goals?
Ensuring customer satisfaction is the most common business driver for service availability, mentioned by 43% of the survey respondents. The second most common business driver for service availability is avoiding productivity loss, cited by 35% of the respondents.
Figure 1: Most common business driver for service availability
43%
35%
10% 10%
3%
Ensuringcustomer
satisfaction
Avoidingproductivity loss
Protectingcompany
reputation
Regulatorycompliance
Other

© Continuity Software 2014 6
Importance of Service Availability to Customers
The vast majority (90%) of the survey respondents indicated service availability is highly critical to their customers (at least 8 on a scale of 1-10).
Figure 2: How critical is service availability to your customers?
45%
30%
15%
7%
1% 1%
10 -Most
critical
9 8 7 6 5 4 3 2 1 - Notcritical at
all
© Continuity Software 2014 7
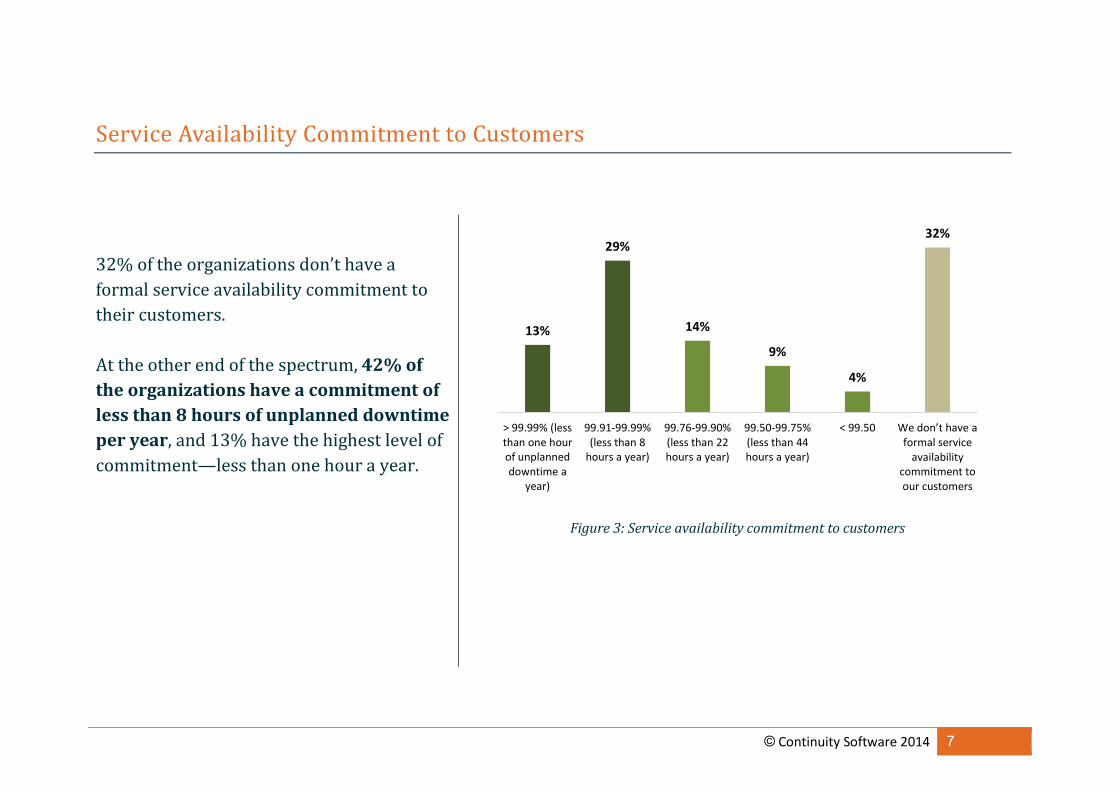
Service Availability Commitment to Customers
32% of the organizations don’t have a formal service availability commitment to their customers. At the other end of the spectrum, 42% of the organizations have a commitment of less than 8 hours of unplanned downtime per year, and 13% have the highest level of commitment—less than one hour a year.
Figure 3: Service availability commitment to customers
13%
29%
14%
9%
4%
32%
> 99.99% (lessthan one hourof unplanneddowntime a
year)
99.91-99.99%(less than 8
hours a year)
99.76-99.90%(less than 22hours a year)
99.50-99.75%(less than 44hours a year)
< 99.50 We don’t have a formal service
availability commitment to our customers
© Continuity Software 2014 8
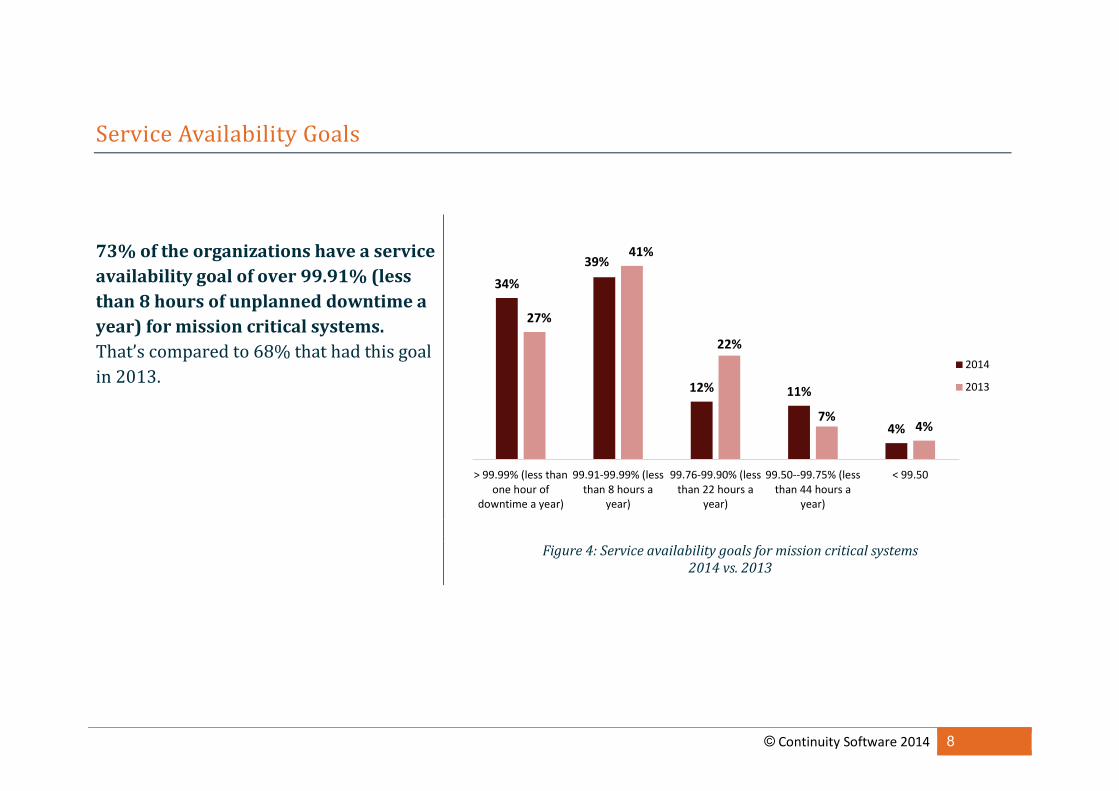
Service Availability Goals
73% of the organizations have a service availability goal of over 99.91% (less than 8 hours of unplanned downtime a year) for mission critical systems. That’s compared to 68% that had this goal in 2013.
Figure 4: Service availability goals for mission critical systems 2014 vs. 2013
34% 39%
12% 11%
4%
27%
41%
22%
7% 4%
> 99.99% (less thanone hour of
downtime a year)
99.91-99.99% (lessthan 8 hours a
year)
99.76-99.90% (lessthan 22 hours a
year)
99.50--99.75% (lessthan 44 hours a
year)
< 99.50
2014
2013

© Continuity Software 2014 9
Service Availability: The Reality
Overall, 41% of the organization surveyed missed their service availability goal for mission-critical systems in 2013.
Organizations with higher service availability goals were significantly less successful in meeting their goal.
Figure 5: Service availability goals for mission-critical systems: met vs. missed goal
Figure 6: Service availability goals for mission-critical systems
Met goal 59%
Missed goal 41%
38%
66% 77% 75%
63%
34% 23% 25%
0%10%20%30%40%50%60%70%80%90%
100%
> 99.99% 99.91-99.99% 99.76-99.90% 99.50-99.75%
Missed goal
Met goal

© Continuity Software 2014 10
What is Downtime?
88% of the survey respondents define downtime as inaccessible system. For many of the organizations the definition of downtime also includes instances when the system is accessible but some functions are not operational (51%) or when performance is severely degraded (36%).
Figure 7: Definition of downtime (Respondents could select more than one option)
88%
51%
36%
The system is not accessible The system is accessible butsome functions are not
operational
The systems is accessible butperformance is highly
degraded

© Continuity Software 2014 11
Last Downtime Event
Over half of the companies (59%) had an outage in the past 3 months and 28% had an outage in the past month.
Figure 8: Last downtime event
6%
22%
31%
17%
12% 12%
Week Month 3 months 6 months Year More than ayear

© Continuity Software 2014 12
Strategies and Tools to Ensure Service Availability
The most common strategy for ensuring service availability is virtualization HA. It is used by 72% of the respondents this year, compared to 63% in 2013.
Replication to disaster recovery site, which was the most popular strategy last year, went down from 77% in 2013 to 70% in 2014.
Figure 9: Strategies and tools to ensure service availability (Respondents could select more than one option)
2%
26%
41%
50%
54%
77%
64%
63%
3%
18%
36%
47%
62%
70%
71%
72%
Other
Strategic outsourcing / DR as a service
VMware SRM
High availability clusters – Unix
High availability clusters – Others
Replication to disaster recovery site
Restore from backup
Virtualization HA
2014
2013

© Continuity Software 2014 13
The Effectiveness of Service Availability Strategies and Tools
According to the survey results, virtualization HA is also the most effective strategy for ensuring service availability. Restore from backup, while the second most common strategy, is viewed as one of the least effective.
Figure 10: Effectiveness of strategies and tools
2.58
2.92
3.34
3.69
3.59
2.93
3.82
DR as a Service
VMware SRM
High Availability Clusters – Unix
High Availability Clusters – Others
Replication to Disaster Recovery Site
Restore from Backup
Virtualization HA

© Continuity Software 2014 14
Top Challenges in Ensuring Service Availability
Proactive identification of risks is the top challenge respondents face in ensuring service availability. Other challenges mentioned include:
• Change management • Lack of resources for testing • Cross-domain/cross-team
coordination
Figure 11: Top challenges in ensuring service availability
66% of the respondents indicated they have initiatives for improving service availability management in 2014.
Figure 12: Have a service availability initiative
10%
8%
10%
10%
14%
14%
14%
20%
Other
Measuring service availability risk & readiness
Inadequate system capacity
Inadequate documentation of infrastructure…
Cross-domain/cross-team coordination
Lack of resources for testing
Change management
Proactive identification of risks
Yes 66%
No 34%

© Continuity Software 2014 15
Cost of Downtime
For 43% of the organizations surveyed, every hour of downtime costs $100,000 or more. 12% of the respondents reported an hourly downtime cost of more than one million dollars.
Figure 13: Cost of an hour of downtime
15%
22%
20%
17%
14%
12%
<$10,000 $10,000-$50,000 $50,001 – $100,000
$100,001 -$500,000
$500,001 -$1,000,000
>$1,000,000

© Continuity Software 2014 16
Causes for Outages
Hardware failure continues to be the most common reason for outages, mentioned by 55% of the respondents.
Other causes for outages include system upgrade & migration (51%), human error (47%), application error (43%) and power outages (39%).
Figure 14: Causes for outages (Respondents could select more than one option)
9%
17%
7%
38%
38%
46%
47%
8%
14%
10%
39%
43%
47%
51%
55%
Other
Unknown
Cyber attacks
Power outages
Application error
Human error
System upgrades & migrations
Hardware failure
2014
2013
2012

© Continuity Software 2014 17
Which Industry was Most Successful in Meeting its Service Availability Goals?
Manufacturing is the industry that was most successful in meeting its service availability goals.
At the same time, 59% of the financial services organizations surveyed missed their availability goals for mission critical systems.
Figure 15: Which industry met its service availability goal?
79%
60% 50% 44% 41%
21%
40% 50% 56% 59%
0%
10%
20%
30%
40%
50%
60%
70%
80%
90%
100%
Manufacturing High Tech Business Services Healthcare FinancialServices
Missed goal
Met goal
© Continuity Software 2014 18
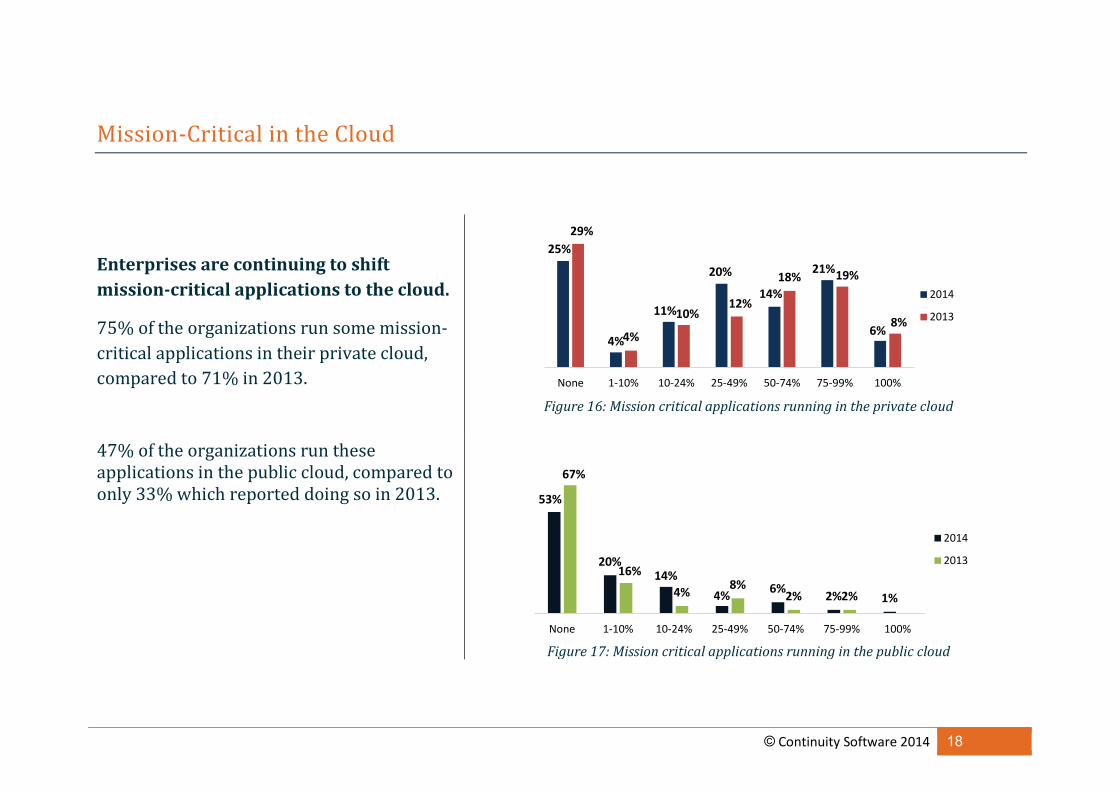
Mission-Critical in the Cloud
Enterprises are continuing to shift mission-critical applications to the cloud.
75% of the organizations run some mission-critical applications in their private cloud, compared to 71% in 2013.
Figure 16: Mission critical applications running in the private cloud
47% of the organizations run these applications in the public cloud, compared to only 33% which reported doing so in 2013.
Figure 17: Mission critical applications running in the public cloud
25%
4%
11%
20%
14%
21%
6%
29%
4%
10% 12%
18% 19%
8%
None 1-10% 10-24% 25-49% 50-74% 75-99% 100%
2014
2013
53%
20% 14%
4% 6% 2% 1%
67%
16%
4% 8% 2% 2%
None 1-10% 10-24% 25-49% 50-74% 75-99% 100%
2014
2013

© Continuity Software 2014 19
Private Cloud Testing
47% of the organizations surveyed have a DR solution in place for their private cloud system.
Figure 18: Have a DR solution in place for cloud systems
As many as 39% of the organizations never test their private cloud availability. Just over a half of the respondents (51%) conduct such testing at least once a year.
Figure 19: Frequency of testing private cloud availability
Have a DR solution
47%
Don't have a DR solution
53%
39%
3%
8%
21%
15%
8%
7%
Never
Less than every 24 months
Every 12-24 months
Every 7-12 months
Every 4-6 months
Every 2-3 months
Monthly or more often
© Continuity Software 2014 20
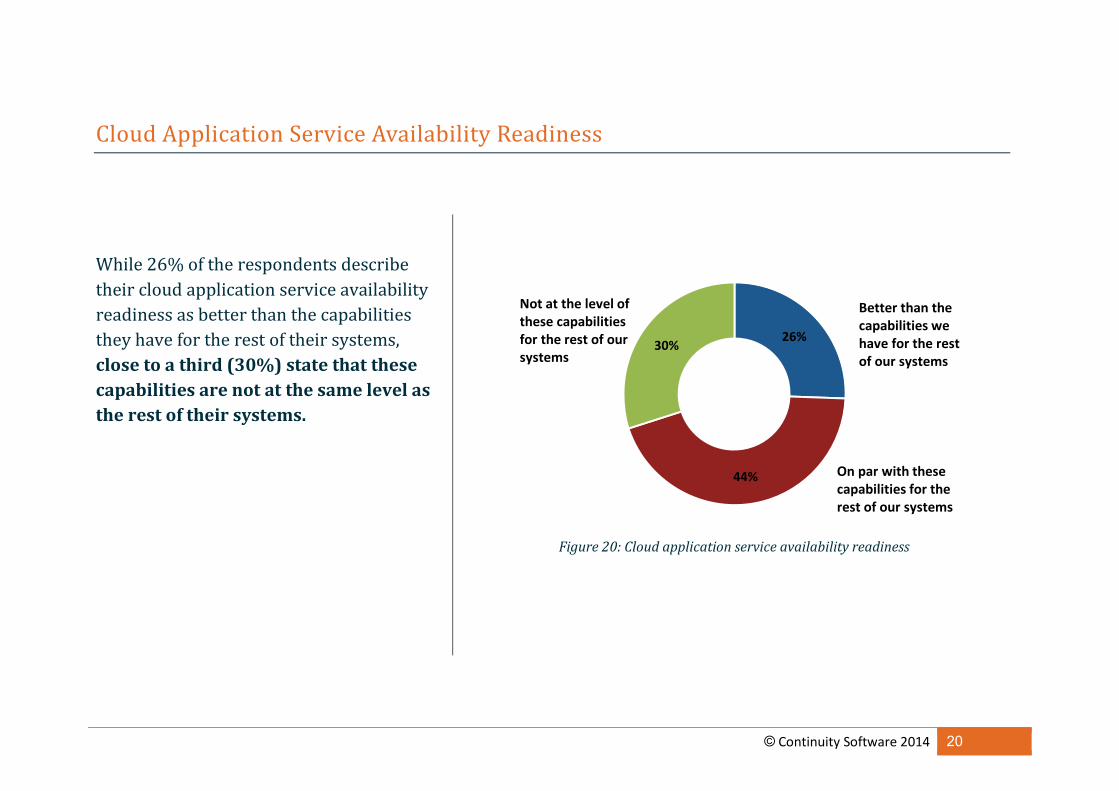
Cloud Application Service Availability Readiness
While 26% of the respondents describe their cloud application service availability readiness as better than the capabilities they have for the rest of their systems, close to a third (30%) state that these capabilities are not at the same level as the rest of their systems.
Figure 20: Cloud application service availability readiness
26%
44%
30%
Better than the capabilities we have for the rest of our systems
On par with these capabilities for the rest of our systems
Not at the level of these capabilities for the rest of our systems

© Continuity Software 2014 21
Annual Business Continuity / Disaster Recovery Budget
While 90% of the small organizations surveyed indicate that their annual business continuity / disaster recovery budget is less than $5m, 26% of the largest organizations spend more than $50m a year, and 13% spend more than $100m.
Figure 21: Annual business continuity / disaster recovery budget by company size
90% 86% 77%
53%
33%
5% 7%
8% 40%
17%
7% 15%
24%
7%
13%
5% 13%
0%
10%
20%
30%
40%
50%
60%
70%
80%
90%
100%
1-500 501-2500 2501-5,000 5,000-10,000 >10,000
> $100m
$50-100m
$10-50m
$5-10m
< $5m
Number of employees in the organization
Annual BC/DR budget

© Continuity Software 2014 22
Annual Business Continuity / Disaster Recovery Budget vs. Cost of Downtime
Not surprisingly, the budget allocated to business continuity and disaster recovery is correlated to the cost of downtime. 30% of the organizations with a downtime cost of over $1m an hour have an annual budget that exceeds $100m.
Figure 22: Annual business continuity / disaster recovery budget vs. cost of downtime
90%
65% 60% 57% 38% 40%
22% 20% 21%
23%
13% 7% 14%
23%
20%
7% 8%
10%
10% 7% 7% 8% 30%
0%
10%
20%
30%
40%
50%
60%
70%
80%
90%
100%
> $100m
$50-100m
$10-50m
$5-10m
< $5m
Cost of an hour of downtime
Annual BC/DR budget

© Continuity Software 2014 23
Respondent Demographics
44% of the survey respondents come from organizations of over 10,000 employees.
Figure 23: Number of employees
40% of the respondents have more than 1,000 servers deployed across all their data centers.
Figure 24: Number of serves deployed across all data centers
18% 13% 11% 13%
44%
1-500 501-2500 2501-5,000 5,000-10,000 >10,000
14% 8%
18% 20%
40%
0-50 51-100 101-500 500-1,000 > 1,000

© Continuity Software 2014 24
Respondent Demographics 27% of the survey respondents are in IT infrastructure management and another 18% are responsible for other IT functions.
12% of the respondents are in business continuity and another 12% are in disaster recovery functions.
Figure 25: Job responsibility
18% of the respondents come from the financial services sector, 17% from healthcare, 14% from manufacturing and 10% are in the business services sector.
Figure 26: Industry

© Continuity Software 2014 25
Table of Figures
Figure 1: Most common business driver for service availability .................................................................................................................................. 5 Figure 2: How critical is service availability to your customers? ................................................................................................................................. 6 Figure 3: Service availability commitment to customers ............................................................................................................................................ 7 Figure 4: Service availability goals for mission critical systems .................................................................................................................................. 8 Figure 5: Service availability goals for mission-critical systems: met vs. missed goal .................................................................................................... 9 Figure 6: Service availability goals for mission-critical systems .................................................................................................................................. 9 Figure 7: Definition of downtime ........................................................................................................................................................................... 10 Figure 8: Last downtime event .............................................................................................................................................................................. 11 Figure 9: Strategies and tools to ensure service availability ..................................................................................................................................... 12 Figure 10: Effectiveness of strategies and tools ....................................................................................................................................................... 13 Figure 11: Top challenges in ensuring service availability ....................................................................................................................................... 14 Figure 12: Have a service availability initiative ...................................................................................................................................................... 14 Figure 13: Cost of an hour of downtime ................................................................................................................................................................. 15 Figure 14: Causes for outages ............................................................................................................................................................................... 16 Figure 15: Which industry met its service availability goal? ..................................................................................................................................... 17 Figure 16: Mission critical applications running in the private cloud ........................................................................................................................ 18 Figure 17: Mission critical applications running in the public cloud ......................................................................................................................... 18 Figure 18: Have a DR solution in place for cloud systems ......................................................................................................................................... 19 Figure 19: Frequency of testing private cloud availability ....................................................................................................................................... 19 Figure 20: Cloud application service availability readiness ...................................................................................................................................... 20 Figure 21: Annual business continuity / disaster recovery budget by company size.................................................................................................... 21 Figure 22: Annual business continuity / disaster recovery budget vs. cost of downtime .............................................................................................. 22 Figure 23: Number of employees ........................................................................................................................................................................... 23 Figure 24: Number of serves deployed across all data centers .................................................................................................................................. 23 Figure 25: Job responsibility ................................................................................................................................................................................. 24 Figure 26: Industry .............................................................................................................................................................................................. 24

© Continuity Software 2014 26
Sign up for a Service Availability Assessment Sign up for a Service Availability Assessment and find out how your IT organization can improve your ability to meet critical KPI goals:
• Find hidden risks that can jeopardize your datacenter • Test your environment against a database of 5,000+
documented availability risks • Get actionable recommendations that will help you
eliminate availability risks before they impact your business
100% of the companies that have performed the assessment uncovered vulnerabilities that were previously undetected! Sign up today
About Continuity Software Continuity Software is a leading provider of Service Availability Management solutions, helping many of the world’s largest organizations avoid infrastructure outages and prevent service disruptions .
By proactively detecting single-points-of-failure and deviations from vendor best-practices across all layers of the IT infrastructure, our software will help you ensure IT operations excellence and 24x7 availability. For more information Website: www.continuitysoftware.com Email: [email protected] Tel: 1-888-782-8170 or +1-646.216.8628