Embed Size (px)
Citation preview
Also in this issue:
Feature: California Readies for Historic Cap-and-Trade Program
IT Insight: Managing Spreadsheet Risk
2013 A&WMA Annual Conference: Call for Abstracts
OCTOBER 2012
U.S. Clean Air ActHave Air Regulations Improved Public Health and Welfare?

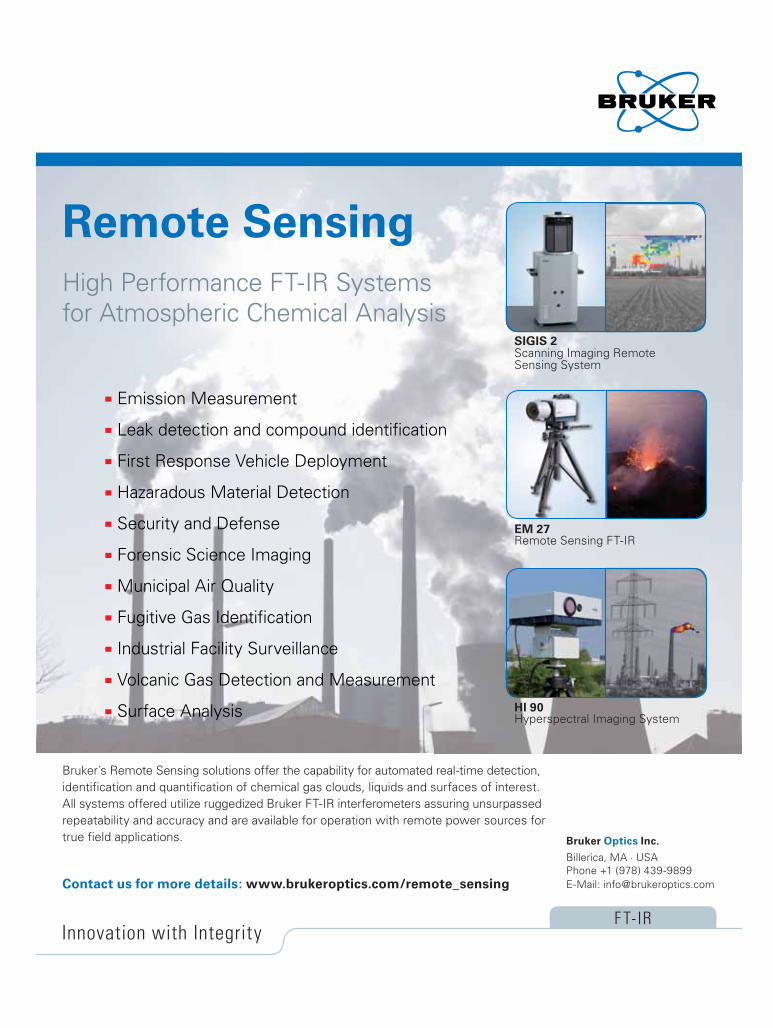
Bruker´s Remote Sensing solutions offer the capability for automated real-time detection,identification and quantification of chemical gas clouds, liquids and surfaces of interest.All systems offered utilize ruggedized Bruker FT-IR interferometers assuring unsurpassedrepeatability and accuracy and are available for operation with remote power sources for true field applications.
Remote Sensing
High Performance FT-IR Systemsfor Atmospheric Chemical Analysis
F T-IRInnovation with Integrity
Bruker Optics Inc.
Billerica, MA · USAPhone +1 (978) 439-9899E-Mail: [email protected] us for more details: www.brukeroptics.com/remote_sensing
Emission Measurement
Leak detection and compound identification
First Response Vehicle Deployment
Hazaradous Material Detection
Security and Defense
Forensic Science Imaging
Municipal Air Quality
Fugitive Gas Identification
Industrial Facility Surveillance
Volcanic Gas Detection and Measurement
Surface Analysis
SIGIS 2 Scanning Imaging Remote Sensing System
HI 90 Hyperspectral Imaging System
EM 27 Remote Sensing FT-IR

2 em october 2012 awma.orgCopyright 2012 Air & Waste Management Association
California Readies for HistoricCap-and-Trade Programby Chris Easter, FirstCarbon Solutions
The countdown is on for implementation of apivotal part of California’s AB 32: Global WarmingSolutions Act. On January 1, 2013, companieswill be subject to the requirements of a new market-based cap-and-trade mandate to reducegreenhouse gas emissions.Page 30
6
16
22
8
october 2012 em 3awma.orgCopyright 2012 Air & Waste Management Association
EM, a publication of the Air & Waste Management Association (ISSN 1088-9981), is published monthly with editorial and executive offices at One Gateway Center, 3rd Floor, 420 Fort Duquesne Blvd., Pittsburgh, PA 15222-1435. ©2012 Air & Waste Management Association. All rights reserved. Materials may not be reproduced, redistributed, or translated in any form without prior written permission of the Editor. Periodicals postage paid at Pittsburgh and at an additional mailing office. Postmaster: Send address changes to EM, Air & Waste Management Association, OneGateway Center, 3rd Floor, 420 Fort Duquesne Blvd., Pittsburgh, PA 15222-1435. GST registration number: 135238921. Subscription rates are $280/year for nonprofit libraries and nonprofit institutions and $425/year for all other institutions. Additional postage charges may apply. Pleasecontact A&WMA Member Services for current rates (1-800-270-3444). Send change of address with recent address label (6 weeks advance notice) and claims for missing issues to the Membership Department. Claims for missing issues can be honored only up to three months for domes-tic addresses, six months for foreign addresses. Duplicate copies will not be sent to replace ones undelivered through failure of the member/subscriber to notify A&WMA of change of address. A&WMA assumes no responsibility for statements and opinions advanced by contributors to thispublication. Views expressed in editorials are those of the author and do not necessarily represent an official position of the Association.
Have Air Regulations Improved Public Health and Welfare?by John D. Bachmann
The U.S. Clean Air Act established a hybrid system of air quality management, tech-nology, and market-based programs, all with the goal of improving public health andthe environment. To its credit, the system includes a fair amount of periodic meas-urements and reporting to verify that required improvements in emissions and airquality are actually occurring. In recent decades, science and policy commenters inside and outside of air quality management have recommended assessments thatgo beyond these traditional air quality measures to provide a better sense of what airprograms actually achieve in terms of actual environmental and health benefits. Earlyproponents have termed such research and measurements as providing “account-ability” for air programs. Others, noting the multiple meanings associated with thatterm, prefer to call it “outcomes” research. This month’s EM examines the results andprospects for “accountability” or “outcomes” research that attempts to measure the actual benefits achieved by implementing air pollution regulations.Page 6
Assessing the Results of Air Quality Management Programsby Bryan Hubbell, U.S. Environmental Protection Agency
Page 8
Does Reducing Air Pollution Improve Human Health? Evidence from Accountability Studiesby C. Arden Pope III, Brigham Young University
Page 16
Recent Progress and Challenges in Assessing the Effectiveness of Air Quality Interventions Toward ImprovingPublic Health: The HEI Experienceby Annemoon M. van Erp, Aaron J. Cohen, Rashid Shaikh, and Robert O’Keefe,
Health Effects Institute
Page 22
Advertisers’ IndexEM Advertiser (www) Page
Bruker Optics Inc. (brukeroptics.com) ...........1
EMSL Analytical Inc.
(emsl.com)...............................Inside Front Cover
Lakes Environmental Software Inc.
(weblakes.com)....................................Back Cover
Pittcon Conference & Expo
(pittcon.org) ...........................................................19
UL-DQS Inc. (dqs-ul.com)...................................7
Valero Energy Corp. (valero.com) ................15
To advertise in EM, call Alison Lizziat 1-412-904-6003.
NEXT MONTH:
2012 Annual Conference & Exhibition Wrap-Up
COLUMNSIT Insight: Managing Spreadsheet Risk . . . . . . . . . . 34by Jill Barson Gilbert
YP Perspective: A Greenhouse Gas Verifier’s Perspective:Third-Party Verifications in theFirst North American Jurisdic-tion with Regulations for GHG Emission Reductions . . 38by Imtiyaz Moulvi
ASSOCIATION NEWSMessage from the President . . . . . 4Commitments in Difficult Timesby Merlyn Hough
Call for Abstracts for A&WMA’s106th Annual Conference & Exhibition . . . . . . . . . . . . . . . . . . . 46
DEPARTMENTSWashington Report. . . . . . . . . . . . . . . . . . . 37
Canadian Report. . . . . . . . . . . . . . . . . . . . . 41
News Focus. . . . . . . . . . . . . . . . . . . . . . . . . 42
Calendar of Events . . . . . . . . . . . . . . . . . . . 48
JA&WMA Table of Contents . . . . . . . . . . . 48
CONFERENCE
105TH ANNUAL
C
UAL
awma.org
In some of my recent messages, I reviewed several cor-nerstones and foundation blocks that I believe are criticalto the continued success of A&WMA. Loyalty is an espe-cially important foundation block in these difficult times.
My understanding of loyalty was largely shaped by train-ing provided by Character First, an executive coaching,management training, and ethics training program basedin Oklahoma City. Loyalty is defined as “using difficulttimes to demonstrate our commitment to those we serve.”
Loyalty is faithfulness to relationships “through thick orthin,” regardless of the difficulty. Loyalty is faithfulness toone’s priorities, regardless of changing conditions. A clearsense of loyalty gives stability in charting one’s directionthrough the decisions of life. Ultimately, loyalty is rootedin relationships. Loyalty is investing in and strengtheningrelationships. Loyalty is a commitment to a relationshipthrough all the ups and downs.
In my recent travels through Oregon, Washington,Idaho, and Montana, I was reminded of Sacagawea, anoutstanding example of fortitude and loyalty. Sacagaweawas a young Shoshone woman who served with herFrench-Canadian husband Toussaint Charbonneau as interpreter and guide for the Lewis and Clark expeditionduring the administration of President Thomas Jefferson.Perhaps most importantly, Sacagawea helped the expe-dition leaders establish peaceful relations with the Indiannations west of the Continental Divide by teaching Lewisand Clark the extensive customs and protocol necessaryfor peaceful interaction.
Lewis and Clark’s journals uphold her as a heroine oftremendous loyalty. “Indeed,” recorded Clark, “she hasborne with a patience truly admirable the fatigues of solong a route encumbered with the charge of an infant,who is even now [at the end of the trek] only 19 monthsold.” Sacagawea, despite the valid pressures of her ownresponsibilities with a newborn child, nonetheless cheer-fully and loyally gave support above and beyond her interpreting duties throughout the difficulties of the
A&WMA HEADQUARTERS
Jim Powell, QEPExecutive Director
Air & Waste Management AssociationOne Gateway Center, 3rd Floor420 Fort Duquesne Blvd.Pittsburgh, PA 15222-14351-412-232-3444; 412-232-3450 (fax)[email protected]
ADVERTISINGAlison [email protected]
EDITORIAL Lisa BucherManaging [email protected]
EDITORIAL ADVISORY COMMITTEEDan L. Mueller, P.E., ChairZephyr Environmental CorporationTerm Ends: 2013
Mingming Lu, Vice ChairUniversity of CincinnatiTerm Ends: 2013
John D. BachmannVision Air ConsultingTerm Ends: 2012
Gary Bramble, P.E.Dayton Power and LightTerm Ends: 2014
Prakash Doraiswamy, Ph.D.RTI InternationalTerm Ends: 2014
Steven P. Frysinger, Ph.D.James Madison UniversityTerm Ends: 2012
Christian HogrefeU.S. Environmental Protection AgencyTerm Ends: 2013
John D. KinsmanEdison Electric InstituteTerm Ends: 2014
Miriam Lev-On, Ph.D.The LEVON GroupTerm Ends: 2012
Ann McIver, QEPCitizens Energy GroupTerm Ends: 2014
Mark R. Manninen3MTerm Ends: 2014
Teresa RaineERMTerm Ends: 2014
Jacqueline SibbliesIndependent ConsultantTerm Ends: 2014
Abhilash Vijayan, Ph.D., P.E., QEPCalifornia Air Resources BoardTerm Ends: 2014
Susan S.G. WiermanMid-Atlantic Regional AirManagement AssociationTerm Ends: 2012
James J. Winebrake, Ph.D.Rochester Institute of TechnologyTerm Ends: 2012
PUBLICATIONS COMMITTEEMichael T. Kleinman, ChairUniversity of California, IrvineTerm Ends: 2014
Commitments in Difficult Timesby Merlyn [email protected]
expedition. This certainly puts my A&WMA travels thispast year in perspective!
Here are five keys to building loyalty that I have seen demonstrated in our Association’s leadership andmembership:
• Make people a priority. People want to know you willremain committed to them, regardless of time con-straints, convenience, or conflicts.
• Expect hard times. Difficult circumstances will occurwhatever your position in life. Your colleagues andfriends will experience situations beyond their control.Prepare yourself to carefully and systematically addressissues as they arise. Avoid using difficulties as excusesto retract commitment. When you foresee complica-tions, remember your priorities so that you can stay on track.
• Support one another. Individuals can help one anotherwork through challenges. If you are going through adifficult time, seek those who can give you wise sup-port. Encourage others by relating what you foundhelpful. Learn to empathize with others, even if youhave not experienced the same challenges.
• Keep commitments. Each relationship involves certainobligations each person must fulfill. Circumstances, con-flicts, and change will test your commitment to others.Fulfill your responsibilities without setting conditions.
• Stay connected. Relationships depend on your commitment to resolve conflicts. It might appear easierto leave a situation, but a loyal person will respondconstructively. Instead of adopting a critical attitude,discern your responsibility and look for positives tobuild upon.
These past few years are the most difficult economic andpolitical times that I have experienced in my environmen-tal career. My hope is that we would all continue to usethese “difficult times to demonstrate our commitment tothose we serve!”
emawma.org
em • message from the president
“These are the times that try men’s souls.”» Thomas Paine, the English-American political theorist
and revolutionary, during the American Revolution
4 em october 2012Copyright 2012 Air & Waste Management Association
The 37th Annual A&WMA/EPA Information ExchangeNovember 27 - 29, 2012 Research Triangle Park, NC www.awma.org/infoexchange
November 27, 9:00 a.m. - 5:00 p.m. November 28, 9:00 a.m. - 4:00 p.m. November 29, 8:00 a.m. - 12:00 p.m.The Auditorium, U.S. EPA, RTP Campus 109 T.W. Alexander Drive, Research Triangle Park, NC
Hear the latest research and program news directly from EPA!
Joint Meeting of the Research Triangle Park Chapter
A&WMA Federal Facilities Committee (EI-1) Extended Meeting with EPA to discuss new/emerging regulations
for more information!
Register Today!
he 37th ATember 27 - 29, 2012 vNo
A/EPnnual A&WMhe 37th Aember 27 - 29, 2012 riangle PTch esear R
ormanfA IA/EPPA, NC arkriangle P wma.or.aww w
changetion Exormachangexoeg/infwma.or
change
ch and presearest rtear the laHopicTTo ely include:s will likke
om EPtly frecs dirwam negroch and pr
y!A!PPA daoer TToRegist
t Join ch eeting of the ResearMeembvoN
erhaptk Carriangle PTch
Pa tionormanft Iymen
andvA e c
er tfA ember 5, 2012 vNo
essionSw/El-1
essionw/El-1 S
ession
ession
ommittacilities Cal FederA FA&WMo discuss neA teeting with EPPAM
mveoN
tion!ormae infor morffo
ended tee (EI-1) Exommitttionsegulaging rw/emero discuss ne
6 em october 2012 awma.orgCopyright 2012 Air & Waste Management Association
As detailed in my 2007 A&WMA Critical Review,1 the U.S. Clean Air Act establisheda hybrid system of air quality management,
technology, and market-based programs, all withthe goal of improving public health and the envi-ronment. To its credit, the system includes a fairamount of periodic measurements and reportingto verify that required improvements in emissionsand air quality are actually occurring. This “feed-back loop” provides an important impetus for cor-recting the system when it is not delivering results,as was the case in the late 1980s and early 1990sfor addressing regional ozone in the easternUnited States. Traditional measures of program effectiveness focused logically enough on emis-sions and air quality.
In recent decades science and policy commentersinside and outside of air quality management haverecommended assessments that go beyond thesetraditional air quality measures to provide a bettersense of what air programs actually achieve in
terms of actual environmental and health benefits.Early proponents have termed such research andmeasurements as providing “accountability” for airprograms. Others, noting the multiple meaningsassociated with that term, prefer to call it “out-comes” research.
As outlined by the three articles that follow, researchers and analysts have come up with anumber of approaches and indicators to assess airquality programs. Bryan Hubbell’s introductionsummarizes recent analyses using traditional emis-sions and air quality indicators of national trends,and includes a regional analysis provided by GregStella (starts on page 8). Hubbell also notes specialstudies and indicators used to assess specific pro-grams, including emissions and ozone reductionsfrom the so-called “NOx SIP Call” and the acid raincap-and-trade program.
Hubbell introduces the “damage function” approachused to estimate benefits of Clean Air Act pro-grams. Here, concentration response relationshipsfrom epidemiology studies are used to providemodeled estimates of reduced health effects asso-ciated with modeled reductions in air pollutants.These kinds of modeling analyses currently providethe most comprehensive basis for determininghow much specific air regulations have improvedhealth and welfare. For comparison of these benefitswith costs, an additional step includes assigning amonetary value to reduced mortality and morbidity,raising the kinds of questions posed by JonathanLarson (see above). Addressing them is, however,beyond the scope of this issue.
Hubbell goes on to introduce studies that actuallymeasure air quality and health and welfare effectsmore directly. These studies, including several included in the reviews by Pope (page 16) and vanErp et al. (page 22) are often retrospective, usingavailable data collected for other purposes. Whilethese types of studies provide useful information,they are often limited by statistical power, meas-urement error, and lack of data on specific air pollution components. The ideal outcomes research
em • cover story
Have Air Regulations Improved “In daylights, in sunsets, inmidnights, in cups of coffee
In inches, in miles, in laughter, in strife
In five hundred twenty-fivethousand six hundred minutes
How do you measure, a yearin the life?”
»Jonathan LarsonSeasons of Love/Rent
october 2012 em 7awma.orgCopyright 2012 Air & Waste Management Association
would be prospective, where the original study design identifies an air quality control program (intervention) before it is implemented and designedair and health measurement programs to be implemented along with the intervention.
Pope provides a cogent overview of a variety ofmostly retrospective studies in which health effectsimprovements were associated with air pollution in-terventions, some of which were occasioned by fac-tors other than air pollution strategies. As he notes,these studies are subject to a number of limitationscommon to epidemiology, but generally provideevidence that reductions in air pollution can resultin measureable improvements in human health.
van Erp et al. summarize recent outcomes researchsponsored by the Health Effects Institute (HEI).
This includes a reexamination of some of the ear-lier studies that highlights the challenges and limi-tations inherent in attempting to ascribe moderateto small improvements in health to specific air pollu-tion programs. They also identify several new stud-ies that promise to provide additional insights soon.
The circle continues… em
John D. BachmannVision Air [email protected]
John is a member of EM’s Editorial Advisory Committee.
Reference1. 37th Annual A&WMA Critical
Review: “Will the Circle BeUnbroken: A History of theU.S. National Ambient AirQuality Standards”; J. Air &Waste Manage. Assoc. 2007,57 (6), 652-697.
Public Health and Welfare?
8 em october 2012 awma.orgCopyright 2012 Air & Waste Management Association
em • feature
by Bryan Hubbell
Bryan Hubbell leads theRisk and Benefits Group inthe Health and EnvironmentalImpacts Division of the U.S.Environmental ProtectionAgency’s (EPA) Office of Air Quality Planning andStandards, Research Triangle Park, NC. E-mail:[email protected].
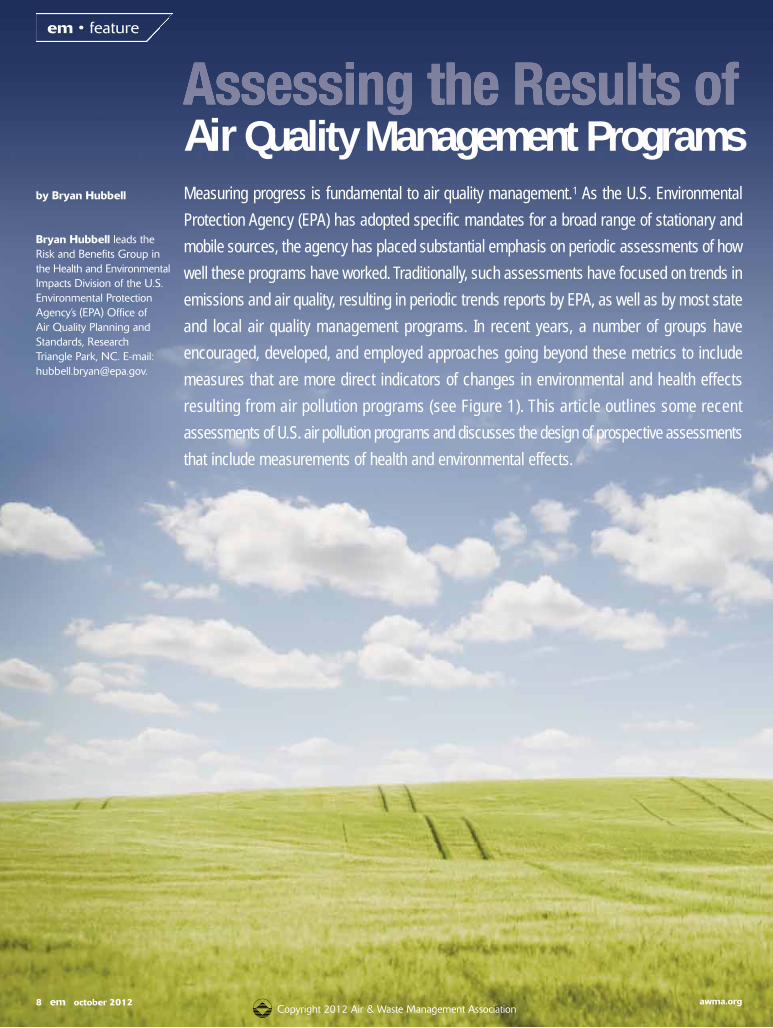
Measuring progress is fundamental to air quality management.1 As the U.S. Environmental
Protection Agency (EPA) has adopted specific mandates for a broad range of stationary and
mobile sources, the agency has placed substantial emphasis on periodic assessments of how
well these programs have worked. Traditionally, such assessments have focused on trends in
emissions and air quality, resulting in periodic trends reports by EPA, as well as by most state
and local air quality management programs. In recent years, a number of groups have
encouraged, developed, and employed approaches going beyond these metrics to include
measures that are more direct indicators of changes in environmental and health effects
resulting from air pollution programs (see Figure 1). This article outlines some recent
assessments of U.S. air pollution programs and discusses the design of prospective assessments
that include measurements of health and environmental effects.
Air Quality Management Programs
october 2012 em 9awma.orgCopyright 2012 Air & Waste Management Association
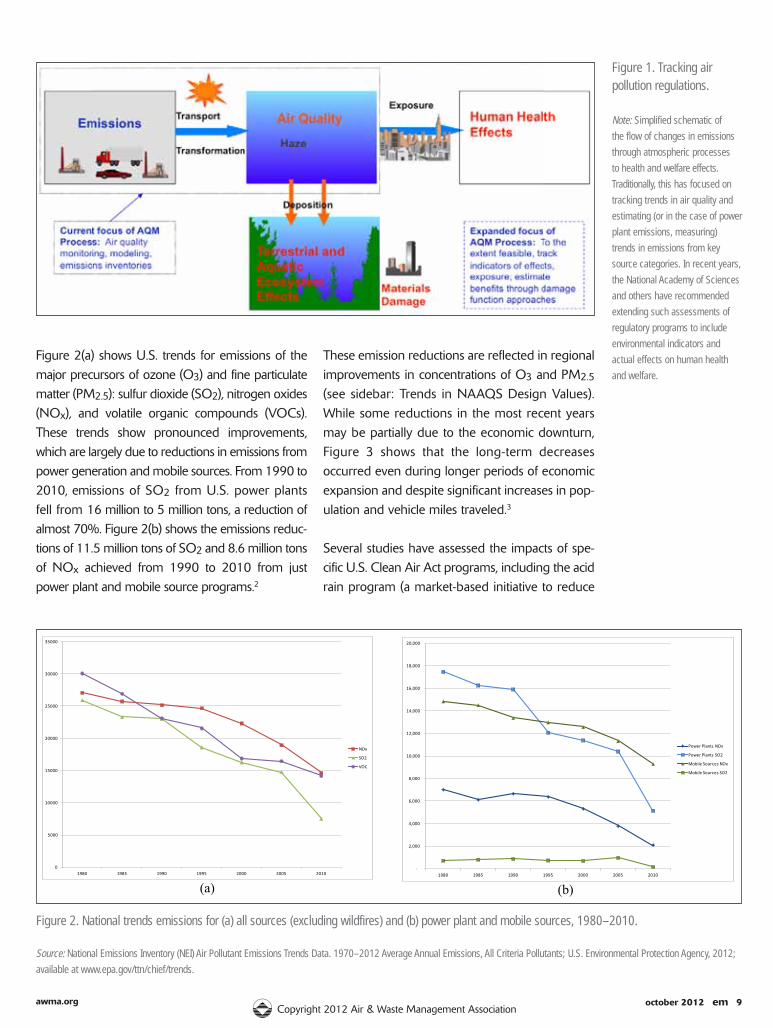
Figure 2(a) shows U.S. trends for emissions of themajor precursors of ozone (O3) and fine particulatematter (PM2.5): sulfur dioxide (SO2), nitrogen oxides(NOx), and volatile organic compounds (VOCs).These trends show pronounced improvements,which are largely due to reductions in emissions frompower generation and mobile sources. From 1990 to2010, emissions of SO2 from U.S. power plantsfell from 16 million to 5 million tons, a reduction ofalmost 70%. Figure 2(b) shows the emissions reduc-tions of 11.5 million tons of SO2 and 8.6 million tonsof NOx achieved from 1990 to 2010 from justpower plant and mobile source programs.2
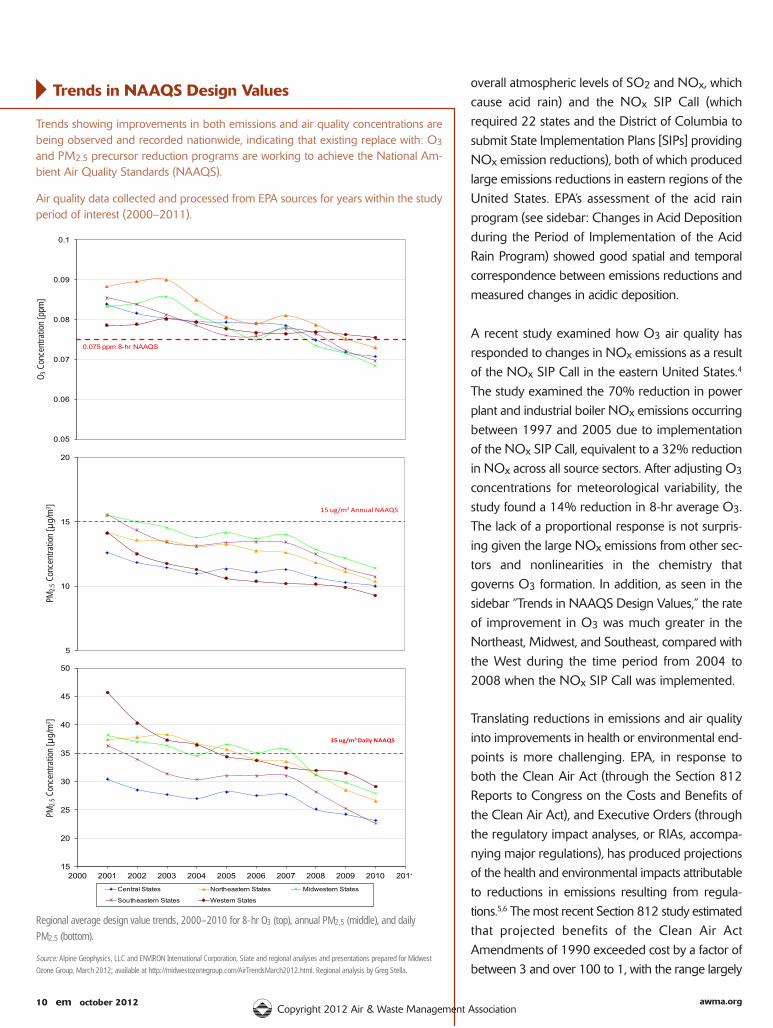
These emission reductions are reflected in regionalimprovements in concentrations of O3 and PM2.5
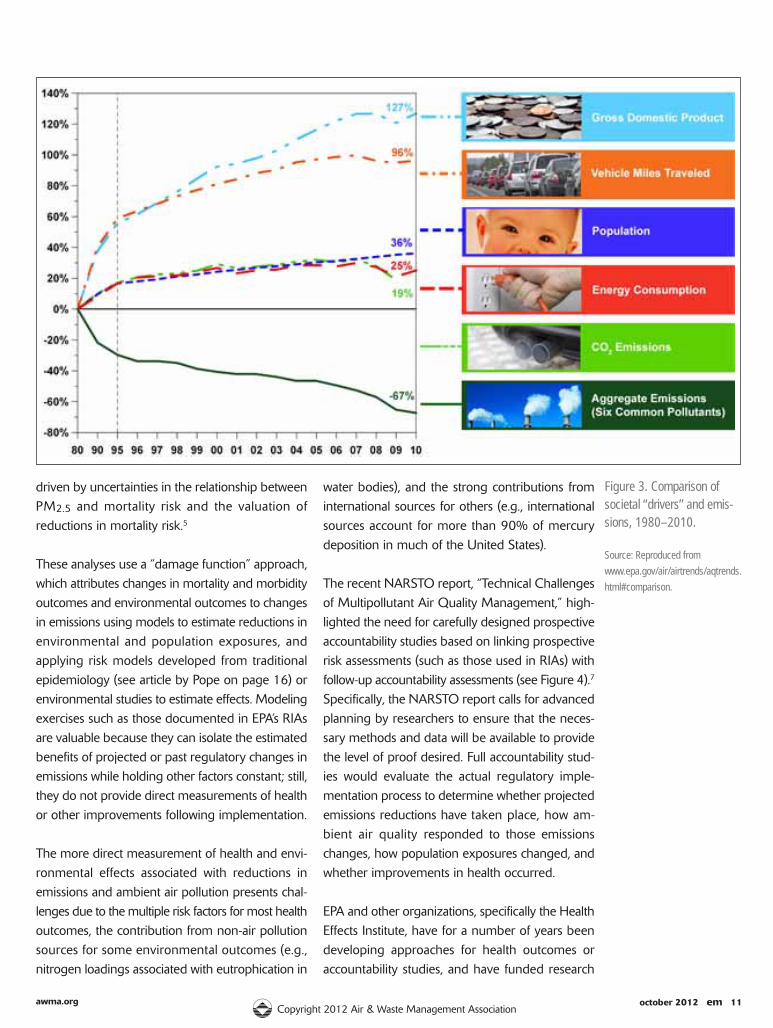
(see sidebar: Trends in NAAQS Design Values).While some reductions in the most recent yearsmay be partially due to the economic downturn,Figure 3 shows that the long-term decreases occurred even during longer periods of economicexpansion and despite significant increases in pop-ulation and vehicle miles traveled.3
Several studies have assessed the impacts of spe-cific U.S. Clean Air Act programs, including the acidrain program (a market-based initiative to reduce
0
5000
10000
15000
20000
25000
30000
35000
1980 1985 1990 1995 2000 2005 2010
NOx
SO2
VOC
(a)
-
2,000
4,000
6,000
8,000
10,000
12,000
14,000
16,000
18,000
20,000
1980 1985 1990 1995 2000 2005 2010
Power Plants NOx
Power Plants SO2
Mobile Sources NOx
Mobile Sources SO2
(b)
Figure 1. Tracking air pollution regulations.
Note: Simplified schematic of
the flow of changes in emissions
through atmospheric processes
to health and welfare effects.
Traditionally, this has focused on
tracking trends in air quality and
estimating (or in the case of power
plant emissions, measuring)
trends in emissions from key
source categories. In recent years,
the National Academy of Sciences
and others have recommended
extending such assessments of
regulatory programs to include
environmental indicators and
actual effects on human health
and welfare.
Figure 2. National trends emissions for (a) all sources (excluding wildfires) and (b) power plant and mobile sources, 1980–2010.
Source: National Emissions Inventory (NEI) Air Pollutant Emissions Trends Data. 1970–2012 Average Annual Emissions, All Criteria Pollutants; U.S. Environmental Protection Agency, 2012;
available at www.epa.gov/ttn/chief/trends.
10 em october 2012 awma.orgCopyright 2012 Air & Waste Management Association
overall atmospheric levels of SO2 and NOx, whichcause acid rain) and the NOx SIP Call (which required 22 states and the District of Columbia tosubmit State Implementation Plans [SIPs] providingNOx emission reductions), both of which producedlarge emissions reductions in eastern regions of theUnited States. EPA’s assessment of the acid rainprogram (see sidebar: Changes in Acid Depositionduring the Period of Implementation of the AcidRain Program) showed good spatial and temporalcorrespondence between emissions reductions andmeasured changes in acidic deposition.
A recent study examined how O3 air quality hasresponded to changes in NOx emissions as a resultof the NOx SIP Call in the eastern United States.4
The study examined the 70% reduction in powerplant and industrial boiler NOx emissions occurringbetween 1997 and 2005 due to implementationof the NOx SIP Call, equivalent to a 32% reductionin NOx across all source sectors. After adjusting O3
concentrations for meteorological variability, thestudy found a 14% reduction in 8-hr average O3.The lack of a proportional response is not surpris-ing given the large NOx emissions from other sec-tors and nonlinearities in the chemistry thatgoverns O3 formation. In addition, as seen in thesidebar “Trends in NAAQS Design Values,” the rateof improvement in O3 was much greater in theNortheast, Midwest, and Southeast, compared withthe West during the time period from 2004 to2008 when the NOx SIP Call was implemented.
Translating reductions in emissions and air qualityinto improvements in health or environmental end-points is more challenging. EPA, in response toboth the Clean Air Act (through the Section 812Reports to Congress on the Costs and Benefits ofthe Clean Air Act), and Executive Orders (throughthe regulatory impact analyses, or RIAs, accompa-nying major regulations), has produced projectionsof the health and environmental impacts attributableto reductions in emissions resulting from regula-tions.5,6 The most recent Section 812 study estimatedthat projected benefits of the Clean Air ActAmendments of 1990 exceeded cost by a factor ofbetween 3 and over 100 to 1, with the range largely
0.05
0.06
0.07
0.08
0.09
0.1
0.075 ppm 8-hr NAAQS
5
10
15
20
15 ug/m3 Annual NAAQS
15
20
25
30
35
40
45
50
2000 2001 2002 2003 2004 2005 2006 2007 2008 2009 2010 2011
Central States Northeastern States Midwestern States
Southeastern States Western States
35 ug/m3 Daily NAAQS
Trends showing improvements in both emissions and air quality concentrations arebeing observed and recorded nationwide, indicating that existing replace with: O3
and PM2.5 precursor reduction programs are working to achieve the National Am-bient Air Quality Standards (NAAQS).
Air quality data collected and processed from EPA sources for years within the studyperiod of interest (2000–2011).
Regional average design value trends, 2000–2010 for 8-hr O3 (top), annual PM2.5 (middle), and daily
PM2.5 (bottom).
Source: Alpine Geophysics, LLC and ENVIRON International Corporation, State and regional analyses and presentations prepared for Midwest
Ozone Group, March 2012; available at http://midwestozonegroup.com/AirTrendsMarch2012.html. Regional analysis by Greg Stella.
Trends in NAAQS Design Values
O 3Co
ncen
tratio
n [p
pm]
PM2.
5Co
ncen
tratio
n [µg
/m3 ]
PM2.
5Co
ncen
tratio
n [µg
/m3 ]
october 2012 em 11awma.orgCopyright 2012 Air & Waste Management Association
driven by uncertainties in the relationship betweenPM2.5 and mortality risk and the valuation of reductions in mortality risk.5
These analyses use a “damage function” approach,which attributes changes in mortality and morbidityoutcomes and environmental outcomes to changesin emissions using models to estimate reductions inenvironmental and population exposures, and applying risk models developed from traditionalepidemiology (see article by Pope on page 16) orenvironmental studies to estimate effects. Modelingexercises such as those documented in EPA’s RIAsare valuable because they can isolate the estimatedbenefits of projected or past regulatory changes inemissions while holding other factors constant; still,they do not provide direct measurements of healthor other improvements following implementation.
The more direct measurement of health and envi-ronmental effects associated with reductions inemissions and ambient air pollution presents chal-lenges due to the multiple risk factors for most healthoutcomes, the contribution from non-air pollutionsources for some environmental outcomes (e.g., nitrogen loadings associated with eutrophication in
water bodies), and the strong contributions frominternational sources for others (e.g., internationalsources account for more than 90% of mercurydeposition in much of the United States).
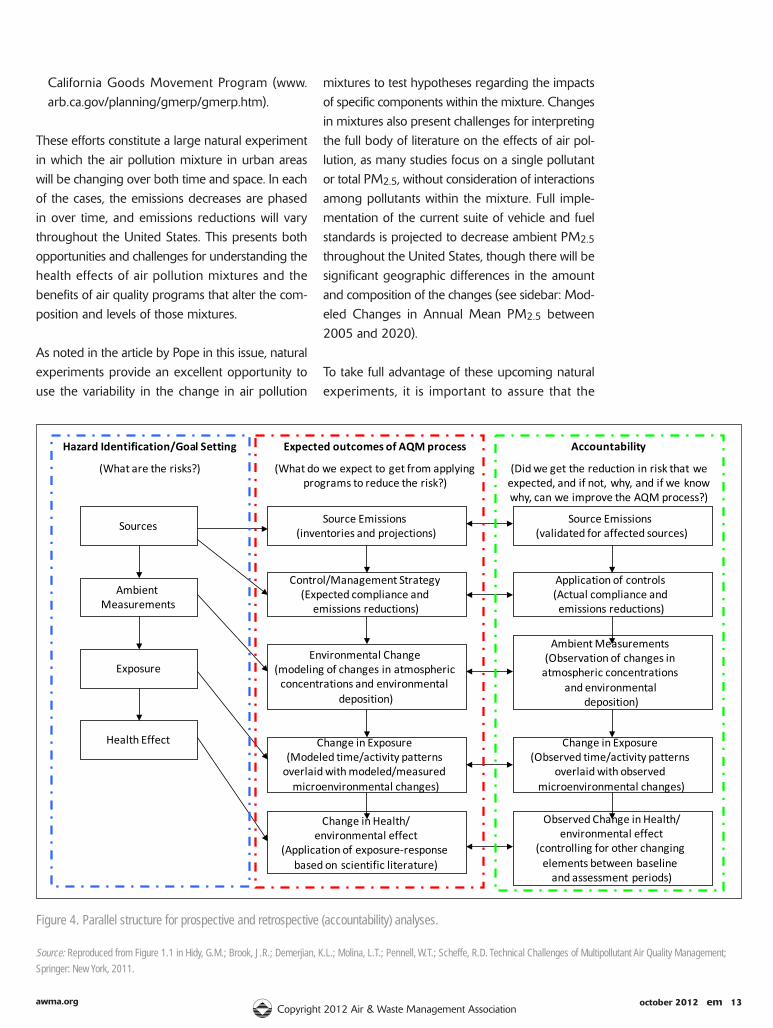
The recent NARSTO report, “Technical Challengesof Multipollutant Air Quality Management,” high-lighted the need for carefully designed prospectiveaccountability studies based on linking prospectiverisk assessments (such as those used in RIAs) withfollow-up accountability assessments (see Figure 4).7
Specifically, the NARSTO report calls for advancedplanning by researchers to ensure that the neces-sary methods and data will be available to providethe level of proof desired. Full accountability stud-ies would evaluate the actual regulatory imple-mentation process to determine whether projectedemissions reductions have taken place, how am-bient air quality responded to those emissionschanges, how population exposures changed, andwhether improvements in health occurred.
EPA and other organizations, specifically the HealthEffects Institute, have for a number of years beendeveloping approaches for health outcomes or accountability studies, and have funded research
Figure 3. Comparison of societal “drivers” and emis-sions, 1980–2010.
Source: Reproduced from
www.epa.gov/air/airtrends/aqtrends.
html#comparison.
12 em october 2012 awma.orgCopyright 2012 Air & Waste Management Association
to demonstrate the effectiveness of regulatory interventions in improving air quality and health.Existing efforts have focused on short-term inter-ventions and retrospective analyses, highlights ofwhich are discussed in the articles by Pope (page16) and van Erp et al. (page 22) in this issue.
New research on accountability is being fundedboth directly by EPA through the Clean Air ResearchCenters (CLARC; www.epa.gov/ncer/clarcs) andthrough the Health Effects Institute (HEI;www.healtheffects.org/accountability.htm). The Har-vard CLARC research is focusing on long-termchanges in life expectancy, and in conjunction withan HEI project, looking at the impact on mortalityof NAAQS nonattainment designations.8,9
While much of the accountability research to datehas been retrospective, making use of the bestavailable data on emissions, air quality, and healthto analyze the effects of air quality improvements,
some of the best opportunities for accountabilityresearch are through prospective research design.HEI recommends in a recent report on accounta-bility that the research community “anticipate andprepare for major upcoming regulatory actions atnational and state levels.”10 There are several suchmajor regulatory actions that are in the process ofbeing implemented, including:
• Power plant regulations—the Cross State Air Pol-lution Rule (www.epa.gov/airtransport) and Mer-cury Air Toxics Standards (www.epa.gov/mats/)
• Industrial source regulations—Industrial boilerMACT standard (www.epa.gov/ttn/atw/boiler/boilerpg.html)
• Mobile source regulations—on road and non-roaddiesel standards (www.epa.gov/otaq/highway-diesel/index.htm, www.epa.gov/nonroad-diesel/regulations.htm); locomotive and marine dieselengine standards (www.epa.gov/oms/locomotives.htm, www.epa.gov/oms/marine.htm); and
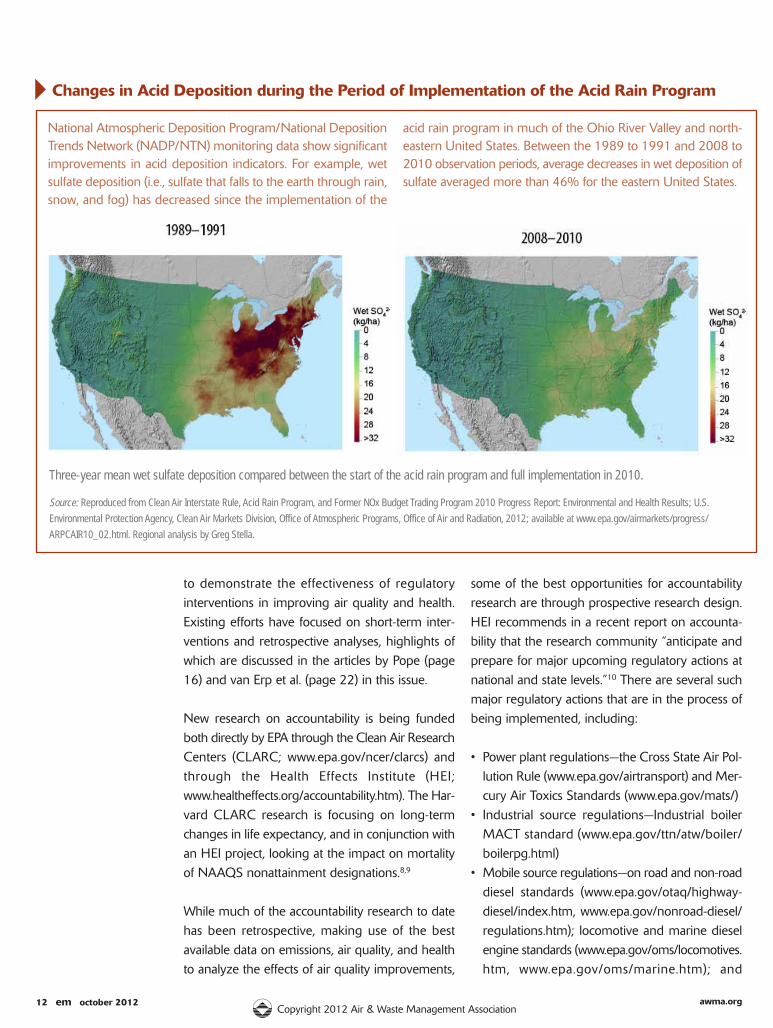
Three-year mean wet sulfate deposition compared between the start of the acid rain program and full implementation in 2010.
Source: Reproduced from Clean Air Interstate Rule, Acid Rain Program, and Former NOx Budget Trading Program 2010 Progress Report: Environmental and Health Results; U.S.
Environmental Protection Agency, Clean Air Markets Division, Office of Atmospheric Programs, Office of Air and Radiation, 2012; available at www.epa.gov/airmarkets/progress/
ARPCAIR10_02.html. Regional analysis by Greg Stella.
National Atmospheric Deposition Program/National DepositionTrends Network (NADP/NTN) monitoring data show significantimprovements in acid deposition indicators. For example, wetsulfate deposition (i.e., sulfate that falls to the earth through rain,snow, and fog) has decreased since the implementation of the
acid rain program in much of the Ohio River Valley and north-eastern United States. Between the 1989 to 1991 and 2008 to2010 observation periods, average decreases in wet deposition ofsulfate averaged more than 46% for the eastern United States.
Changes in Acid Deposition during the Period of Implementation of the Acid Rain Program
october 2012 em 13awma.orgCopyright 2012 Air & Waste Management Association
California Goods Movement Program (www.arb.ca.gov/planning/gmerp/gmerp.htm).
These efforts constitute a large natural experimentin which the air pollution mixture in urban areaswill be changing over both time and space. In eachof the cases, the emissions decreases are phasedin over time, and emissions reductions will varythroughout the United States. This presents bothopportunities and challenges for understanding thehealth effects of air pollution mixtures and the benefits of air quality programs that alter the com-position and levels of those mixtures.
As noted in the article by Pope in this issue, naturalexperiments provide an excellent opportunity touse the variability in the change in air pollution
mixtures to test hypotheses regarding the impactsof specific components within the mixture. Changesin mixtures also present challenges for interpretingthe full body of literature on the effects of air pol-lution, as many studies focus on a single pollutantor total PM2.5, without consideration of interactionsamong pollutants within the mixture. Full imple-mentation of the current suite of vehicle and fuelstandards is projected to decrease ambient PM2.5
throughout the United States, though there will besignificant geographic differences in the amountand composition of the changes (see sidebar: Mod-eled Changes in Annual Mean PM2.5 between2005 and 2020).
To take full advantage of these upcoming naturalexperiments, it is important to assure that the
Figure 4. Parallel structure for prospective and retrospective (accountability) analyses.
Source: Reproduced from Figure 1.1 in Hidy, G.M.; Brook, J.R.; Demerjian, K.L.; Molina, L.T.; Pennell, W.T.; Scheffe, R.D. Technical Challenges of Multipollutant Air Quality Management;
Springer: New York, 2011.
Sources
Ambient Measurements
Exposure
Health Effect
Hazard Identification/Goal Setting
(What are the risks?)
Source Emissions (inventories and projections)
Control/Management Strategy (Expected compliance and
emissions reductions)
Environmental Change (modeling of changes in atmospheric concentrations and environmental
deposition)
Change in Exposure (Modeled time/activity patterns overlaid with modeled/measured microenvironmental changes)
Change in Health/environmental effect
(Application of exposure-response based on scientific literature)
Expected outcomes of AQM process
(What do we expect to get from applying programs to reduce the risk?)
Source Emissions (validated for affected sources)
Application of controls (Actual compliance and emissions reductions)
Ambient Measurements (Observation of changes in atmospheric concentrations
and environmental deposition)
Change in Exposure (Observed time/activity patterns
overlaid with observed microenvironmental changes)
Observed Change in Health/environmental effect
(controlling for other changing elements between baseline and assessment periods)
Accountability
(Did we get the reduction in risk that we expected, and if not, why, and if we know why, can we improve the AQM process?)
14 em october 2012 awma.orgCopyright 2012 Air & Waste Management Association
necessary data are or will be available. Planningahead to design studies to evaluate these changesin air pollution mixtures would allow for collectionof data on the nature of current air pollution mix-tures and population exposures in places wherelarge changes are expected to occur, and enhancethe likelihood that research will be able to success-fully address some of the important hypotheses re-garding the role of specific components andsources in health effects associated with the ambi-ent air pollution mixture.
While speciation network monitors and some special purpose monitors collecting data on PM2.5
components exist, a forward-looking planningprocess may help to determine whether those monitors are sufficient in location and sampling frequency to inform a study focused on the changesin PM2.5 levels and composition expected from implementation of the Cross State Air Pollution Rule(CSAPR), Mercury and Air Toxics Standards (MATS),and the multiple diesel PM reduction programslisted above. In addition, it may be necessary to planfor additional health data collection to be able to detect the impacts of the change in the PM2.5 mix-ture. The Centers for Disease Control has initiated aNational Environmental Public Health Tracking Pro-gram, which will collect health surveillance data thatcan be linked to environmental hazards includingair pollution (http://ephtracking.cdc.gov). This pro-gram may provide a vehicle for collecting detailedlocation specific health data for use in prospectiveresearch designs.
By asking research design questions ahead of time,focusing on the magnitude of change in PM2.5
that would be needed to detect a change in health,it may be possible to design studies to addresssome of the issues that have plagued existing ac-countability research efforts. To the extent that for-ward-looking research designs can identify moreoptimal collection of data to maximize the powerof studies without increasing the cost of monitoringair quality and health, prospective designs can alsohelp to develop efficient research programs with ahigh likelihood of success. Prospective designs canalso more effectively consider the best use of a variety of sources of data on air quality, including
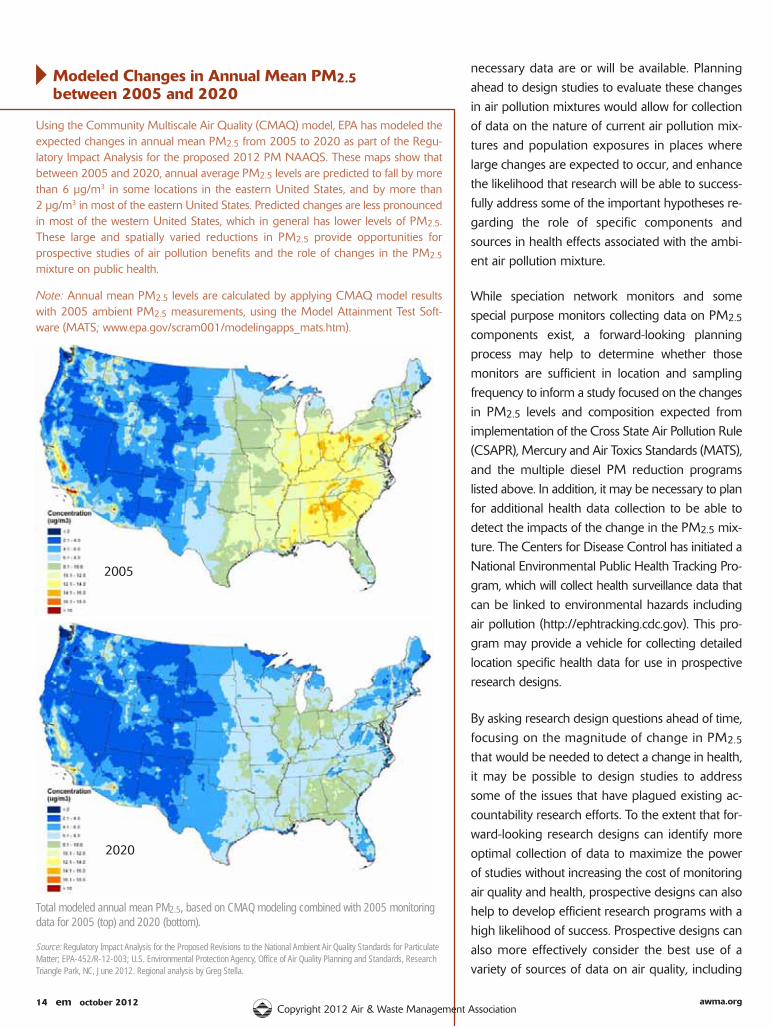
Using the Community Multiscale Air Quality (CMAQ) model, EPA has modeled theexpected changes in annual mean PM2.5 from 2005 to 2020 as part of the Regu-latory Impact Analysis for the proposed 2012 PM NAAQS. These maps show thatbetween 2005 and 2020, annual average PM2.5 levels are predicted to fall by morethan 6 μg/m3 in some locations in the eastern United States, and by more than 2 μg/m3 in most of the eastern United States. Predicted changes are less pronouncedin most of the western United States, which in general has lower levels of PM2.5.These large and spatially varied reductions in PM2.5 provide opportunities forprospective studies of air pollution benefits and the role of changes in the PM2.5
mixture on public health.
Note: Annual mean PM2.5 levels are calculated by applying CMAQ model resultswith 2005 ambient PM2.5 measurements, using the Model Attainment Test Soft-ware (MATS; www.epa.gov/scram001/modelingapps_mats.htm).
Modeled Changes in Annual Mean PM2.5between 2005 and 2020
Total modeled annual mean PM2.5, based on CMAQ modeling combined with 2005 monitoringdata for 2005 (top) and 2020 (bottom).
Source: Regulatory Impact Analysis for the Proposed Revisions to the National Ambient Air Quality Standards for ParticulateMatter; EPA-452/R-12-003; U.S. Environmental Protection Agency, Office of Air Quality Planning and Standards, ResearchTriangle Park, NC, June 2012. Regional analysis by Greg Stella.
2005
2020
october 2012 em 15awma.orgCopyright 2012 Air & Waste Management Association
remote sensing and use of new techniques, such asmobile monitoring or cell phone-based moni-toring systems.11,12
Some of the elements to consider in a prospectiveresearch design include:
• how best to take advantage of predictive model-ing information regarding emissions, air quality,population exposures, and health impacts (e.g.mortality and hospital admissions);
• how to ensure collection of parallel informationto evaluate actual outcomes relative to predictedoutcomes;
• what are the optimal designs for emissions, airquality, exposure, and health monitoring?; and
• what data collection efforts can be leveraged toobtain information useful for accountability re-search (e.g., are there existing cohort researchprojects that could be modified to add account-ability components?).
Careful consideration of these elements can leadto research designs that take maximum advantage ofthe upcoming natural experiments and maximizethe ability to detect changes in air quality, expo-sures, and health. This will lead to a better understanding of both emissions and air quality
improvements resulting from U.S. air quality regu-lations and resulting public health benefits. em
References1. Bachmann, J.D. Will the Circle Be Unbroken? A History of the U.S. National Ambient Air Quality Standards; J. Air & Waste Manage. Assoc. 2007,
57, 652-697.2. National Emissions Inventory (NEI) Air Pollutant Emissions Trends Data, 1970–2012, Average Annual Emissions, All Criteria Pollutants; U.S.
Environmental Protection Agency, 2012; available at www.epa.gov/ttn/chief/trends (accessed July 17, 2012).3. U.S. Environmental Protection Agency. See www.epa.gov/air/airtrends/aqtrends.html#comparison (accessed July 17, 2012).4. Butler, T.J.; Vermeylen, F.M.; Rury, M.; Likens, G.E.; Lee, B.; Bowker, G.E.; McCluney, L. Response of Ozone and Nitrate to Stationary Source
NOx Emission Reductions in the Eastern USA; Atmos. Environ. 2011, 45, 1084-1094.5. The Benefits and Costs of the Clean Air Act from 1990 to 2020: Summary Report; U.S. Environmental Protection Agency, 2011; available at
www.epa.gov/air/sect812/prospective2.html (accessed July 17, 2012).6. Regulatory Impact Analysis for the Final Mercury and Air Toxics Standards; EPA-452/R-11-011; U.S. Environmental Protection Agency, Office of
Air Quality Planning and Standards, Health and Environmental Impacts Division, Research Triangle Park, NC, 2011. 7. Hidy, G.M.; Brook, J.R.; Demerjian, K.L.; Molina, L.T.; Pennell, W.T.; Scheffe, R.D. Technical Challenges of Multipollutant Air Quality Management;
Springer: New York, 2011.8. Correia, A.; Pope, III, C.A.; Dockery, D.; Ezzati, M.; Dominici, F. The Effect of Air Pollution Control on Life Expectancy in the United States A
Population-Based Analysis of Major Metropolitan Areas. Poster Presentation, Harvard School of Public Health Clean Air Research Center, ScienceAdvisory Committee Meeting. June 6–7, 2012; available at: www.hsph.harvard.edu/clarc/sac2012/correia.pdf (accessed on July 17, 2012).
9. Zigler, C.; Dominici, F.; Wang, Y. Estimating Causal Effects of Air Quality Regulations using Principal Stratification for Spatially Correlated Multivariate Intermediate Outcomes; Biostatistics 2012, 13, 289-302.
10. Health Effects Institute. Proceedings of an HEI Workshop on Further Research to Assess the Health Impacts of Actions Taken to Improve Air Quality;Communication 15; Health Effects Institute: Boston, 2010.
11. Zwack, L.M.; Paciorek, C.J.; Spengler, J.D.; Levy, J.I. Characterizing Local Traffic Contributions to Particulate Air Pollution in Street Canyons usingMobile Monitoring Techniques; Atmos. Environ. 2011, 45, 2507-2514.
12. Ramanathan, N.; Lukac, M.; Ahmed, T.; Kar, A.; Praveen, P.S.; Honles, T.; Leong, I.; Rehman, I.H.; Schauer, J.J.; Ramanathan, V. A Cellphone-BasedSystem for Large-Scale Monitoring of Black Carbon; Atmos. Environ. 2011, 45, 4481-4487.
Valero is committed to producing
environmentally clean products, while improving
the environmental quality of operations and
making the safety of employees, operations
and communities its highest priority.
aalleera roalero e isero s cois ommmco mio itom ttm temit edt d te toe o ptoalero is committed to pVVVV
ennvvie irenv ronv onvir nmro meo enon ntnme tae alen lnta lya ly al cllyll leeac ancle n e pra roodp dupro uco ctdu tsuc s,c s,ctsenvironmentally clean products,s,
thhee t enthe nvvie irenv rov onvir nmro meo enon ntme tae alen al ta qua uaalqu liua ita tyal ty it ofty of othe environmental quality of
maakima ina ngak ng kinki thn hee t sathe affesa eta tyfety e ofety of emo mpple loem oymp yeployeoymaking the safety of employeoye
anndd a cond ommmco muo unom nimu itmu tiun ienit est es tie ite tss it hits igghh hehig eighand communities its higheghe
prrooddupro uco cidu inuc ngc ng cinproducing n
whhiilw lewh e hi imile mpprim rom ovmp vipro inov ngov ngvin while improvingn
oppeero raop ate tiera iora ont nstio s o anon ndd aoperations and nd
eeess,e s, e ops, peero raop ate tiera iora onat nstio soees, operationson
esstst e prs riiop orpr ririo ito tyor .rit .tyest prioritytyyy
16 em october 2012 awma.orgCopyright 2012 Air & Waste Management Association
em • feature
by C. Arden Pope III
C. Arden Pope III, Ph.D., isthe Mary Lou Fulton Professorof Economics at BrighamYoung University in Provo,UT. E-mail: [email protected].
This article focuses on evidence from accountability studies regarding potential improvements
in human health due to reducing exposure to air pollution.
Does Reducing Air PollutionEvidence from
Epidemiological studies of air pollution are funda-mentally attempts to exploit various dimensions ofexposure variability in real-world settings.1,2 Mostof these studies rely on naturally occurring exposurevariability. For example, daily time-series studies—aswell as episode and case-crossover studies—exploitnaturally occurring day-to-day variability. Thesestudies demonstrate that short-term (i.e., one toseveral days) increases in exposure can result in
increases in risk of respiratory and cardiovasculardisease and death. These studies also demonstratethat subsequent short-term reductions in exposureresult in comparable risk decreases and provide estimates of improvements in health that could beexpected from an intervention that results in short-term reductions in air pollution exposure.
Studies of long-term exposure—including variouscross-sectional studies, prospective cohort studies,and long-term longitudinal panel studies—exploitlong-term spatial variability. These studies demon-strate that long-term air pollution exposure (i.e.,over years or decades) is associated with increased
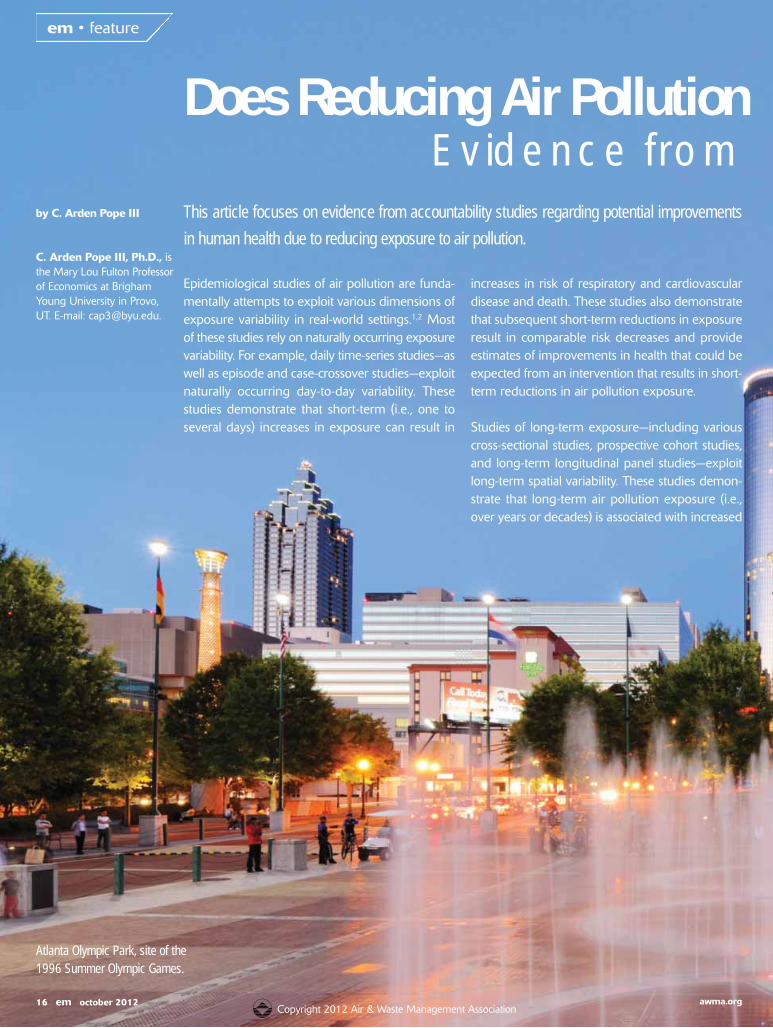
Atlanta Olympic Park, site of the1996 Summer Olympic Games.

october 2012 em 17awma.orgCopyright 2012 Air & Waste Management Association
risk of cardiovascular disease and death, lung cancer risk, deficits in lung function growth, andother adverse health endpoints. These studies provide underlying estimates—or at least realisticpriors—regarding health improvements that couldbe expected from planned interventions that resultin long-term reductions in air pollution exposures.As discussed by Hubbell3 elsewhere in this issue,such studies have been used as damage functionsin prospective analyses of the benefits of the U.S. Clean Air Act.
“Accountability” studies are a subset of epidemio-logical studies that exploit natural or policy-related
interventions that potentially result in changes (usually reductions) in air pollution exposure andpollution-related health impacts. Accountabilitystudies of policy-related interventions are important,in part, because these interventions typically imposeeconomic costs on society. It is reasonable to ask ifthere are compensating, tangible, and measurableimprovements in air quality and public health. Thisarticle is not a comprehensive review, but illustratesevidence of human health effects from accounta-bility studies by providing selected examples ofstudies of various types of interventions, includinglabor disputes and intermittent operation of industrialsources, temporary Olympics-related interventions,
Improve Human Health? Accountability Studies
18 em october 2012 awma.orgCopyright 2012 Air & Waste Management Association
long-term local interventions, national controls andstandards, and household-level interventions.
Labor Disputes and Intermittent Operation of Industrial SourcesSeveral accountability studies have assessed impactsof unplanned interventions or natural experimentsthat occurred when labor disputes resulted in theintermittent operation of major industrial sourcesof air pollution. In Utah Valley in the 1980s, for example, a local steel mill was the largest singlesource of local air pollution, contributing approxi-mately half of fine particulate matter pollution. Thissteel mill shut down for a 13-month period due toa labor dispute and subsequent change in owner-ship. Retrospective analyses of this natural experi-ment indicated that the mill closure resulted insubstantially reduced concentrations of air pollutionwith corresponding reductions in pediatric respira-tory hospital admissions.4
Subsequent epidemiological studies in the valleyalso observed air pollution associations with lungfunction and respiratory symptoms, school absences,respiratory and cardiovascular mortality,5 andpreterm birth.6 Evidence from the epidemiologicalstudies of Utah Valley was bolstered by toxicologicalstudies that found that particulate matter extractedfrom archived filters of air pollution monitors elicitedacute airway injury and inflammation in experi-mentally exposed rats and humans.7
Another study retrospectively explored a naturalexperiment associated with an 8.5-month coppersmelter strike in the 1960s that occurred through-out four Southwest states in the United States. During the strike, a regional decline in suspendedsulfate particles, changes in metal content of particleexposure, and an improvement in regional visibilitywere observed.8 In addition during the strike, asmall (1.5–4.0%) but statistically significant decreasein mortality was observed—even while controllingfor time and mortality trends elsewhere.9
Temporary Olympics-Related Interventions Temporary interventions to reduce traffic conges-tion in downtown Atlanta during the 1996Olympic Games resulted in an interesting potentialopportunity to evaluate the impact of reduced air
pollution on human health. An initial analysis sug-gested that these interventions resulted in reductionsin air pollution, especially ozone, and significantreductions in childhood asthma events.10 As discussed by van Erp et al. elsewhere in this issue,11
however, subsequent analyses indicate that the reductions in ozone were due to a combination ofmetrological conditions and reduced traffic and findlittle compelling evidence of direct intervention-related health benefits.12
The 2008 Beijing Olympic Games also providedan opportunity to evaluate potential health benefitsfrom temporary interventions to control air pollution.Concentrations of most measured air pollutantswere generally lower during the Olympics inter-vention period as compared to periods before andafter the Olympics. Acute changes in various bio-markers of inflammation and thrombosis, as wellas various measures of cardiovascular physiology,were observed in a panel of healthy young adults.13,14
Another analysis using the Beijing Olympics inter-ventions found reductions in air pollution (with afocus on black carbon) and exhaled nitric oxide, abiomarker of acute respiratory inflammation.15
These findings provided evidence that reduced airpollution exposure contributed to improved health,although the clinical significance of the findings remains unclear.
Long-Term Local InterventionsThere have been a number of studies of local interventions that resulted in long-term or perma-nent reductions in air pollution exposure. For example, in 1990, there were important air pollutioninterventions in Dublin and in Hong Kong. A banon coal sales in Dublin Ireland in 1990 resulted inan immediate, remarkably large, and permanentreduction in particulate matter air pollution. Studiesof this intervention found corresponding significantreductions in respiratory and cardiovascular deathrates in Dublin.16,17 The health effects of subse-quent bans of coal sales in other Irish cities are alsobeing studied with somewhat more ambiguous results (see accompanying article by van Erp etal.11). Also in 1990, an intervention reduced thesulfur content of fuel used in power plants and vehicles in Hong Kong—leading to an immediatereduction in sulfur dioxide and a change in metalconcentrations. A reduction in seasonal deaths,
october 2012 em 19awma.orgCopyright 2012 Air & Waste Management Association
especially respiratory and cardiovascular deathswas observed.18
Erfurt, Germany experienced substantial improve-ments in air quality following German unification.Restructuring of industries, a changed car fleet andfuel replacement, the exchange of brown coal fornatural gas in power plants and domestic heating,and related interventions resulted in substantial decreases in air pollution concentrations with declining relative risks of mortality.19
In 2003, traffic management measures, includinga congestion charging scheme, were implementedin central London. Accountability related analysesbased on this intervention have been conducted. Inthe first year, the program resulted in reductions intraffic volume and congestion; however, air pollu-tion monitoring and modeling indicated that therewere, at best, only very small reductions in centralLondon air pollution concentrations and minimalmortality benefits.20,21 A low-emission zone, which
encompasses most of Greater London, is providingfurther opportunity to study potential health bene-fits of air pollution interventions in London.22 (Alsosee accompanying article by van Erp et al.11)
National Controls and StandardsOver the last several decades, the U.S. Clean AirAct, its amendments, and related public policy effortsto improve air quality have provided opportunitiesfor accountability studies. A recent study of differen-tial increases in life expectancy related to differentialdeclines in air pollution between 1980 and 2000in the United States was basically a large, nation-wide natural experiment study.23 This study askeda key accountability relevant question: did citieswith bigger improvements in air quality over thesetwo decades have bigger improvements in health,measured by life expectancy? The answer was basically yes. On average, greater reductions in airpollution were associated with greater increases inlife expectancy, even after controlling for socio-economic, demographic, and smoking variables.
POWERING INNOVATIONS IN
W TER ANALYSISAttending Pittcon, the world’s largest annual conference and exposition
for laboratory science, gives you the power to get a hands-on look at
innovative equipment, learn about industry trends and discover new
applications and methodologies used in water analysis. Technical
presentation topics include the latest innovations in LC/GC, ion
chromatography, ICP-MS, HPLC, atomic spectroscopy, and general
chemical analysis.
For more information on technical sessions, exhibitors and short courses,
visit www.pittcon.org.
Scan this or go to www.pittcon.org to save 50% on registration.
follow us
awma.org
The Harvard Six-Cities study24 was originally designedto prospectively study differential changes in airpollution across six U.S. cities due to the implemen-tation of the U.S. Clean Air Act, its amendments, andrelated national ambient air quality standards. Extended analyses of the Harvard Six-Cities cohort,25,26
with longer follow-up periods can be considered, atleast in part, as accountability studies because differential changes in air pollution did eventuallyoccur. These changes, however, were due only inpart to the planned interventions associated withthe Clean Air Act and enforcement of air qualitystandards. Economic factors (especially in the steeland coal industries) and other changes influencedair pollution levels. Nevertheless, extended analysesof the Harvard Six-Cities cohort indicate that reductions in air pollution resulted in substantivedeclines in mortality risk.
Household-Level Interventions Several household-level interventions that reduceexposure to air pollution have provided evidence ofcorresponding improvements in health. For example,a program to replace old wood stoves with U.S. Environmental Protection Agency (EPA)-certifiedstoves or other heating sources was implemented
in Libby, MT—a rural mountain valley communitythat often experienced high winter-time levels ofair pollution from residential wood smoke. Ambientfine particulate matter concentrations were reducedby approximately 30% and reductions in indoorconcentrations were also observed, although thereductions were highly variable across homes. Thestove replacement intervention was at the house-hold-level; however, reductions in air pollutionwere associated with decreased reports of child-hood wheeze and other respiratory ailments thatwere not limited to children living in homes withwood stoves.11,27,28
In the Western Highland region of Guatemala,many homes use open-fire stoves for cooking. Arandomized trial of improved cook stoves withchimneys provided evidence of substantial reduc-tions in air pollution exposure along with lowerblood pressure among studied women.29 Otherexamples of household-level interventions includethe filtration of indoor air in homes located inCopenhagen, Denmark. Reductions in air pollutionconcentrations were found to improve vascularfunction in the aged but not in healthy youngeradults.30,31 Another study of indoor air filtration inhomes was conducted in Smithers, British Columbia,Canada—a community highly impacted by woodsmoke. Air filters reduced the indoor fine particu-late pollution by 60%. This pollution reduction wasassociated with improved vascular function and decreased inflammatory biomarkers.32
Conclusion There is now a limited, but growing body of accountability studies that provides evidence thatreducing air pollution exposure can result in improvements in respiratory and cardiovascular
health. The basic underlying approach to an intervention or natural experiment study usedin an accountability analyses is highly appeal-ing. An ideal accountability study should bedirectly related to a specific, well-defined andplanned intervention, have a prospective design, and have adequate measurement ofexposure and health endpoints before,
during, and after the intervention. Further, theintervention should result in temporally and/
or spatially well-defined and clearly exogenouschanges in exposure.
There is now a
growing body of
accountability
studies that
provides evidence
that reducing air
pollution exposure
can result in
improvements
in health.
20 em october 2012Copyright 2012 Air & Waste Management Association
october 2012 em 21awma.org
Accountability studies, however, are rarely or neverideal. They have limitations similar to other epi-demiological study designs. For example, there areoften only very small changes in exposures orlarger changes are applicable only to small popu-lations, resulting in limited statistical power. Expo-sure changes are often not truly exogenous, butare associated with other changes that may affecthealth, resulting in the potential of confounding.The temporal changes in exposure are not alwayssharp, well-defined, or easily distinguished frommore general temporal trends. The intrinsic appealand the potential opportunities for accountability
studies, coupled with problems of limited statisticalpower, lack of distinct exogeneity, and difficultiesin establishing clear identification strategies, also results in substantial potential for reporting andpublication bias.
Nevertheless, as illustrated with the examples inthe article, intervention studies are adding to theepidemiological evidence regarding health effectsof air pollution. At present, a variety of accountabilitystudies provide evidence that interventions causinga reduction in exposure to air pollution can also resultin measurable improvements in human health. em
References1. Brunekreef, B.; Holgate, S.T. Air Pollution and Health; Lancet 2002, 360, 1233-1242.2. Pope, C.A., III; Dockery D.W. Health Effects of Fine Particulate Air Pollution: Lines that Connect; J. Air & Waste Manage. Assoc. 2006, 56, 709-742. 3. Hubbell, B. Assessing the Results of Air Quality Management Programs; EM October 2012, 8-15.4. Pope, C.A., III. Respiratory Disease Associated with Community Air Pollution and a Steel Mill, Utah Valley; Am. J. Public Health 1989, 79 (5), 623-628.5. Pope, C.A., III. Particulate Pollution and Health: A Review of the Utah Valley Experience; J. Expo. Analys. Environ. Epidemiol. 1996, 6 (1), 23-34.6. Parker, J.D.; Mendola, P.; Woodruff, T.J. Preterm Birth After the Utah Valley Steel Mill Closure: A Natural Experiment; Epidemiol. 2008, 19 (6), 820-823.7. Ghio, A.J. Biological Effects of Utah Valley Ambient Air Particles in Humans: A Review; J. Aerosol Med. 2004, 17 (2), 157-164.8. Trijonis, J. Visibility in the Southwest—An Exploration of the Historical Data Base; Atmos. Environ. 1979, 13, 833-843.9. Pope, C.A., III; Rodermund, D.L.; Gee, M.M. Mortality Effects of a Copper Smelter Strike and Reduced Ambient Sulfate Particulate Matter Air
Pollution; Environ. Health Perspect. 2007, 115 (5), 679-683.10. Friedman, M.S.; Powell, K.E.; Hutwagner, L.; Graham, L.M.; Teague, W.G. Impact of Changes in Transportation and Commuting Behaviors During
the 1996 Summer Olympic Games in Atlanta on Air Quality and Childhood Asthma; J. Amer. Med. Assoc. 2001, 285 (7), 897-905.11. van Erp, A.M.; Cohen, A.J.; Shaikh, R.; O’Keefe, R. Recent Progress and Challenges in Assessing the Effectiveness of Air Quality Interventions
Toward Improving Public Health: The HEI Experience; EM October 2012, 22-28.12. Peel, J.L.; Klein, M.; Flanders, W.D.; Mulholland, J.A.; Tolbert, P.E. Impact of Improved Air Quality During the 1996 Summer Olympic Games in Atlanta
on Multiple Cardiovascular and Respiratory Outcomes; Research Report 148; Health Effects Institute: Boston, 2010.13. Kipen, H.; Rich, D.; Huang, W.; Zhu, T.; Wang, G.; Hu, M.; Lu, S.E.; Ohman-Strickland, P.; Zhu, P.; Wang, Y.; Zhang, J. Measurement of Inflammation
and Oxidative Stress Following Drastic Changes in Air Pollution During the Beijing Olympics: A Panel Study Approach; Ann. N.Y. Acad. Sci.2010, 1203, 160-167.
14. Rich, D.Q.; Kipen, H.M.; Huang, W.; Wang, G.; Wang, Y.; Zhu, P.; Ohman-Strickland, P.; Hu, M.; Philipp, C.; Diehl, S.R.; Lu, S.E.; Tong, J.; Gong,J., Thomas, D.; Zhu, T.; Zhang, J. Association Between Changes in Air Pollution Levels During the Beijing Olympics and Biomarkers of Inflammationand Thrombosis in Healthy Young Adults; J. Amer. Med. Assoc. 2012, 307 (19), 2068-2078.
15. Lin, W.; Huang, W.; Zhu, T.; Hu, M.; Brunekreef, B.; Zhang, Y.; Liu, X.; Cheng, H.; Gehring, U.; Li, C.; Tang, X. Acute Respiratory Inflammation inChildren and Black Carbon in Ambient Air Before and During the 2008 Beijing Olympics; Environ. Health Perspect. 2011, 119 (10), 1507-1512.
16. Clancy, L.; Goodman, P.; Sinclair, H.; Dockery, D.W. Effect of Air-Pollution Control on Death Rates in Dublin Ireland: An Intervention Study; Lancet2002, 360, 1210-1214.
17. Goodman, P.G.; Dockery, D.W.; Clancy, L. Cause-Specific Mortality and the Extended Effects of Particulate Pollution and Temperature Exposure;Environ. Health Perspect. 2004, 112 (2), 179-185.
18. Hedley, A.J.; Wong, C.M.; Thach, T.Q.; Ma, S.; Lam, T.H.; Anderson, H.R. Cardiorespiratory and All-Cause Mortality after Restrictions on SulphurContent of Fuel in Hong Kong: An Intervention Study; Lancet 2002, 360, 1646-1652.
19. Breitner, S.; Stölzel, M.; Cyrys, J.; Pitz, M.; Wölke, G.; Kreyling, W.; Küchenhoff, H.; Heinrich, J.; Wichmann, H.E.; Peters, A. Short-Term MortalityRates during a Decade of Improved Air Quality in Erfurt, Germany; Environ. Health Perspect. 2009, 117 (3), 448-454.
20. Tonne, C.; Beevers, S.; Armstrong, B.; Kelly, F.; Wilkinson, P. Air Pollution and Mortality Benefits of the London Congestion Charge: Spatial andSocioeconomic Inequalities; Occup. Environ. Med. 2008, 65, 620-627.
21. Kelly, F.; Anderson, H.R.; Armstrong, B.; Atkinson, R.; Barratt, B.; Beevers, S.; Derwent, D.; Green, D.; Mudway, I.; Wilkinson, P. The Impact of theCongestion Charging Scheme on Air Quality in London; Research Report 155; Health Effects Institute: Boston, 2011.
22. Kelly, F.; Armstrong, B.; Atkinson, R.; Anderson, H.R.; Barratt, B.; Beevers, S.; Cook, D.; Derwent, D.; Mudway, I.; Wilkinson, P. The London LowEmission Zone Baseline Study; Research Report 163; Health Effects Institute: Boston, 2011.
23. Pope, C.A., III; Ezzati, M.; Dockery, D.W. Fine-Particulate Air Pollution and Life Expectancy in the United States; N. Engl. J. Med. 2009, 360, 376-386.24. Dockery, D.W.; Pope, C.A., III; Xu, X.P.; Spenger, J.D.; Ware, J.H.; Fay, M.E.; Ferris, B.G.; Speizer, F.E. An Association between Air Pollution and
Mortality in Six U.S. Cities; N. Engl. J. Med. 1993, 329, 1753-1759.25. Laden, F.; Schwartz, J.; Speizer, F.E.; Dockery, D.W. Reduction in Fine Particulate Air Pollution and Mortality: Extended Follow-Up of the Harvard
Six Cities Study; Am. J. Respir. Crit. Care Med. 2006, 173 (6), 667-672.26. Schwartz, J.; Coull, B.; Laden, F.; Ryan, L. The Effect of Dose and Timing of Dose on the Association between Airborne Particles and Survival; Environ.
Health Perspect. 2008, 116 (1), 64-69.27. Noonan, C.W.; Ward, T.J.; Navidi, W.; Sheppard, L.; Bergauff, M.; Palmer, C. Assessing the Impact of a Wood Stove Replacement Program on Air
Quality and Children’s Health; Research Report 162; Health Effects Institute: Boston, 2011.28. Noonan, C.W.; Ward, T.J.; Navidi, W.; Sheppard, L. A Rural Community Intervention Targeting Biomass Combustion Sources: Effects on Air
Quality and Reporting of Children’s Respiratory Outcomes; Occup. Environ. Med. 2012, 69 (5), 354-360.29. McCracken, J.P.; Smith, K.R.; Diaz, A.; Mittleman, M.A.; Schwartz, J. Chimney Stove Intervention to Reduce Long-Term Wood Smoke Exposure
Lowers Blood Pressure among Guatemalan Women; Environ. Health Perspect. 2007, 115 (7), 996-1001.30. Bräuner, E.V.; Forchhammer, L.; Møller, P.; Barregard, L.; Gunnarsen, L.; Afshari, A.; Wåhlin, P.; Glasius, M.; Dragsted, L.O.; Basu, S.; Raaschou-
Nielsen, O.; Loft, S. Indoor Particles Affect Vascular Function in the Aged: An Air Filtration-based Intervention Study; Am. J. Respir. Cri. Care Med.2008, 177, 419-425.
31. Bräuner, E.V.; Møller, P.; Barregard, L.; Dragsted, L.O.; Glasius, M.; Wåhlin, P.; Vinzents, P.; Raaschou-Nielsen, O.; Loft, S. Exposure to AmbientConcentrations of Particulate Air Pollution Does Not Influence Vascular Function or Inflammatory Pathways in Young Healthy Individuals; Particleand Fibre Toxicology 2008, 5 (13); doi:10.1186/1743-8977-5-13.
32. Allen, R.W.; Carlsten, C.; Karlen, B.; Leckie, S.; van Eeden, S.; Vedal, S.; Wong, I.; Brauer, M. An Air Filter Intervention Study of Endothelial Functionamong Healthy Adults in a Woodsmoke-Impacted Community; Am. J. Respir. Crit. Care Med. 2011, 183, 1222-1230.
Copyright 2012 Air & Waste Management Association
22 em october 2012 awma.orgCopyright 2012 Air & Waste Management Association
em • feature
Recent Progress and Challenges in Assessing the Effectiveness
by Annemoon M. van Erp,Aaron J. Cohen, RashidShaikh, and RobertO’Keefe
Annemoon van Erp,Aaron Cohen, RashidShaikh, and RobertO’Keefe are all with theHealth Effects Institute (HEI)in Boston, MA, a nonprofitorganization that funds research on air pollution and health. E-mail: [email protected].
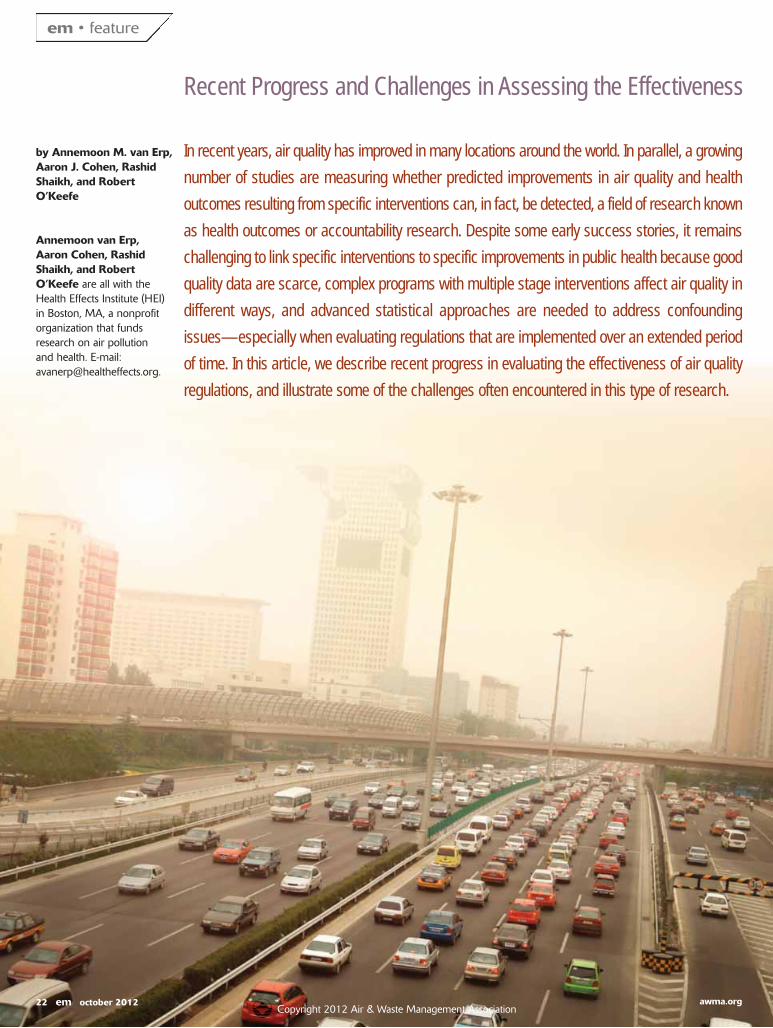
In recent years, air quality has improved in many locations around the world. In parallel, a growing
number of studies are measuring whether predicted improvements in air quality and health
outcomes resulting from specific interventions can, in fact, be detected, a field of research known
as health outcomes or accountability research. Despite some early success stories, it remains
challenging to link specific interventions to specific improvements in public health because good
quality data are scarce, complex programs with multiple stage interventions affect air quality in
different ways, and advanced statistical approaches are needed to address confounding
issues—especially when evaluating regulations that are implemented over an extended period
of time. In this article, we describe recent progress in evaluating the effectiveness of air quality
regulations, and illustrate some of the challenges often encountered in this type of research.
october 2012 em 23awma.orgCopyright 2012 Air & Waste Management Association
There has been a long-standing interest in meas-uring the effectiveness of air quality regulations andother interventions to improve air quality, as indi-cated in the accompanying articles by Hubbell1 andPope2 elsewhere in this issue. Over the past fewdecades, a body of evidence has started to emerge;some early studies were quite promising becausethey showed that interventions led to dramatic,sudden improvements in air quality and were associated with clear improvements in health out-comes. These included the well-known examplesof a steel mill closure in the Utah Valley,3 a ban oncoal sales in Dublin, Ireland,4 and regulations to reduce sulfur in fuel in Hong Kong.5
In this article, we discuss recent insights from follow-on studies of the interventions in Dublin and HongKong that have shed further light on the originalfindings. We also revisit the evaluations of the 1996Olympic Games in Atlanta and describe recent results from the 2008 Olympic Games in Beijing,which can be viewed as “experiments” in which interventions lasted only a limited period of time.The Beijing study and a recent study of a woodstove change-out program in Montana wereunique in that they were conducted prospectivelyand followed a small number of participants before, during, and after the intervention.
In contrast, there have been relatively few studiesof complex regulations that are implemented in multiple-year programs, as discussed by Pope.2
We describe a recent study of restrictions of powerplant emissions that emphasizes the challenges inevaluating regional scale air quality changes. Table1 provides an overview of the interventions andstudies discussed in this article (all funded by HEI),highlighting their strengths and weaknesses. For more detailed information on the generalchallenges specific to air quality and health out-comes research, we refer the reader to a series ofprevious papers.6-9
Revisiting Early Success Stories The 2002 study by Clancy and colleagues4 of the1990 ban on the marketing, sale, and distribution ofcoal in Dublin, Ireland, has been a flagship illustrationof a significant decrease in concentrations of blacksmoke that was associated with a noted reduction incardiovascular and respiratory mortality. A subse-quent study by Dockery and colleagues10 focused oncoal sales bans in smaller Irish towns from 1995 to2000 and compared the changes with observationsin rural areas without a ban. In addition, the originalanalysis of mortality data in Dublin was expanded toinclude hospital admissions data. Dockery and colleagues report decreases (ranging from 45–70%)in black smoke in each of the Irish cities after their respective bans, but no clear pattern in sulfur diox-ide (SO2) concentrations. The bans were associatedwith significant reductions in respiratory mortalityand cardiovascular hospital admissions, but not cardiovascular or total mortality.10
The ban on coal sales appears to have been asso-ciated with some health benefits, although the extent of those benefits in Dublin and other partsof Ireland was less than originally reported.4 Possi-ble explanations are that the population outside ofDublin is relatively small, reducing the power to detect significant changes in mortality. In addition,the subsequent bans resulted in a lesser improve-ment to air quality because pollutant concentra-tions were lower at the subsequent starting points.A general downward trend in air pollutant con-centrations over time and long-term declines inmortality rates may also have contributed. Finally,neighboring counties may have been affected indirectly due to economic factors (e.g., the priceand availability of coal) and other trends that resulted from bans elsewhere (e.g., a general trendto replace coal furnaces with gas stoves).
A 2002 study by Hedley and colleagues5 focusedon a 1990 reduction of sulfur in fuel in Hong
The HEI Experience
DISCLAIMER:The views expressed in this article are those of the authors and do not necessarily reflect the views of the Health EffectsInstitute or its sponsors.
of Air Quality Interventions Toward Improving Public Health
24 em october 2012 awma.orgCopyright 2012 Air & Waste Management Association
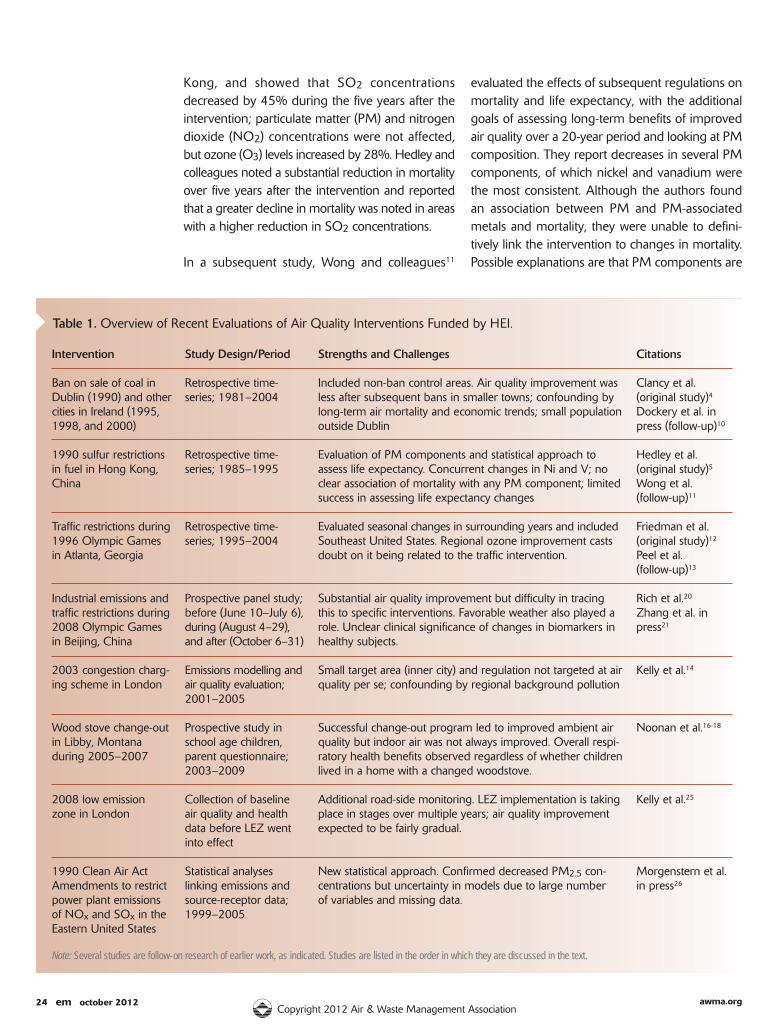
Table 1. Overview of Recent Evaluations of Air Quality Interventions Funded by HEI.
Kong, and showed that SO2 concentrations decreased by 45% during the five years after theintervention; particulate matter (PM) and nitrogendioxide (NO2) concentrations were not affected,but ozone (O3) levels increased by 28%. Hedley andcolleagues noted a substantial reduction in mortalityover five years after the intervention and reportedthat a greater decline in mortality was noted in areaswith a higher reduction in SO2 concentrations.
In a subsequent study, Wong and colleagues11
evaluated the effects of subsequent regulations onmortality and life expectancy, with the additionalgoals of assessing long-term benefits of improvedair quality over a 20-year period and looking at PMcomposition. They report decreases in several PMcomponents, of which nickel and vanadium werethe most consistent. Although the authors foundan association between PM and PM-associatedmetals and mortality, they were unable to defini-tively link the intervention to changes in mortality.Possible explanations are that PM components are
Intervention
Ban on sale of coal inDublin (1990) and othercities in Ireland (1995,1998, and 2000)
1990 sulfur restrictionsin fuel in Hong Kong,China
Traffic restrictions during1996 Olympic Gamesin Atlanta, Georgia
Industrial emissions andtraffic restrictions during2008 Olympic Gamesin Beijing, China
2003 congestion charg-ing scheme in London
Wood stove change-outin Libby, Montana during 2005–2007
2008 low emissionzone in London
1990 Clean Air ActAmendments to restrictpower plant emissionsof NOx and SOx in theEastern United States
Study Design/Period
Retrospective time-series; 1981–2004
Retrospective time- series; 1985–1995
Retrospective time- series; 1995–2004
Prospective panel study;before (June 10–July 6),during (August 4–29),and after (October 6–31)
Emissions modelling andair quality evaluation;2001–2005
Prospective study inschool age children,parent questionnaire;2003–2009
Collection of baselineair quality and healthdata before LEZ wentinto effect
Statistical analyses linking emissions andsource-receptor data;1999–2005
Strengths and Challenges
Included non-ban control areas. Air quality improvement wasless after subsequent bans in smaller towns; confounding bylong-term air mortality and economic trends; small populationoutside Dublin
Evaluation of PM components and statistical approach to assess life expectancy. Concurrent changes in Ni and V; noclear association of mortality with any PM component; limitedsuccess in assessing life expectancy changes
Evaluated seasonal changes in surrounding years and includedSoutheast United States. Regional ozone improvement castsdoubt on it being related to the traffic intervention.
Substantial air quality improvement but difficulty in tracingthis to specific interventions. Favorable weather also played arole. Unclear clinical significance of changes in biomarkers inhealthy subjects.
Small target area (inner city) and regulation not targeted at airquality per se; confounding by regional background pollution
Successful change-out program led to improved ambient airquality but indoor air was not always improved. Overall respi-ratory health benefits observed regardless of whether childrenlived in a home with a changed woodstove.
Additional road-side monitoring. LEZ implementation is takingplace in stages over multiple years; air quality improvementexpected to be fairly gradual.
New statistical approach. Confirmed decreased PM2.5 con-centrations but uncertainty in models due to large number of variables and missing data.
Citations
Clancy et al. (original study)4Dockery et al. inpress (follow-up)10
Hedley et al. (original study)5Wong et al. (follow-up)11
Friedman et al.(original study)12
Peel et al. (follow-up)13
Rich et al.20
Zhang et al. inpress21
Kelly et al.14
Noonan et al.16-18
Kelly et al.25
Morgenstern et al.in press26
Note: Several studies are follow-on research of earlier work, as indicated. Studies are listed in the order in which they are discussed in the text.
october 2012 em 25awma.orgCopyright 2012 Air & Waste Management Association
generally measured only once every six days, andthe considerable spatial variability in air qualitychanges was difficult to account for in the statisticalanalyses. The authors estimated effects of the sulfur reduction on life expectancy based on analy-sis of daily time-series of PM and mortality; this approach met with limited success, due to difficultyin controlling for long-term trends in potential con-founding factors.
Friedman and colleagues12 studied the traffic inter-vention in Atlanta, GA, during the 1996 OlympicGames. Results showed a decrease in acute carevisits for pediatric asthma during the Games com-pared with the weeks before and after. This studyalso showed an associated decrease in O3, PM10,and carbon monoxide (CO) concentrations. How-ever, it remained unclear to what extent normalseasonal patterns in pollutant concentrations orhealth outcomes may have influenced the results.
In a subsequent study, Peel and colleagues13 con-firmed that O3 concentrations were approximately30% lower during the Olympic Games; PM10,CO, and NO2 concentrations were also slightlylower. However, they showed that there were sim-ilar reductions in O3 concentrations in several othercities throughout the Southeast United States thatwere not affected by the traffic intervention. In addition, Peel and colleagues observed little or noevidence of overall reductions in traffic or reducedemergency department visits for respiratory or cardiovascular health outcomes in adults or chil-dren during the Olympic Games when they tookinto account seasonal health trends in previous andfollowing years.
The follow-on study by Peel thus illustrated the crucial importance of using control areas, evaluatingappropriate time windows surrounding interven-tions, and properly adjusting for seasonal and othertrends that may influence the results. Ultimately, itcalled into question whether the findings of the orig-inal Friedman study could be attributed to the traf-fic restrictions and whether the traffic actions takencould have been designed more effectively.
Other studies have noted similar difficulties in find-ing substantive air quality changes associated withtraffic interventions, in part, due to the limited area
covered by the intervention (i.e., city center only),limited road side monitoring that might have beenable to show more definitive air quality improve-ments, and confounding by regional weather pat-terns.14 Potential benefits in terms of improvedmortality were estimated to be low.15
Prospective Studies of Local InterventionsWhen there is sufficient lead time before a partic-ular regulation goes into effect, unique opportuni-ties exist to conduct prospective evaluations, forexample, panel studies that follow a small popula-tion before, during, and after the intervention andactively collect exposure and health information.One such intervention was the change-out ofwood stoves in a rural mountain community.16-18
Noonan and colleagues found that the wood stovechangeout was effective in reducing ambient pol-lutant concentrations, but that indoor concentra-tions did not always improve as expected. Possiblereasons include variability in stove operation, pres-ence of other indoor sources, and the fact that
Friedman et al. showed adecrease in acute carevisits for pediatric asthmaduring the 1996 OlympicGames.
REGISTER NOW!
The Conference provides a forum for the discussion of state-of-the-art technical information, regulations, and public policy on thermal treatmenttechnologies and their relationship to air emissions, greenhouse gases, and climate change. Invited and contributed papers will address approachesto safely managing waste streams amenable to thermal treatmentprocesses, and evaluate associated costs, risks, and impacts.
Sponsorship and exhibit opportunities are available
CONFERENCE LOCATIONJW Marriott New Orleans +1- 504-525-6500 Hotel Rate: $131
HOTEL CUTOFF/REGISTRATION DEADLINESeptember 24, 2012
http://it3.awma.org
IT3HWC
31st International Conferenceon Thermal Treatment Technologies & HazardousWaste Combustors
October 22-24, 2012 • New Orleans, LA
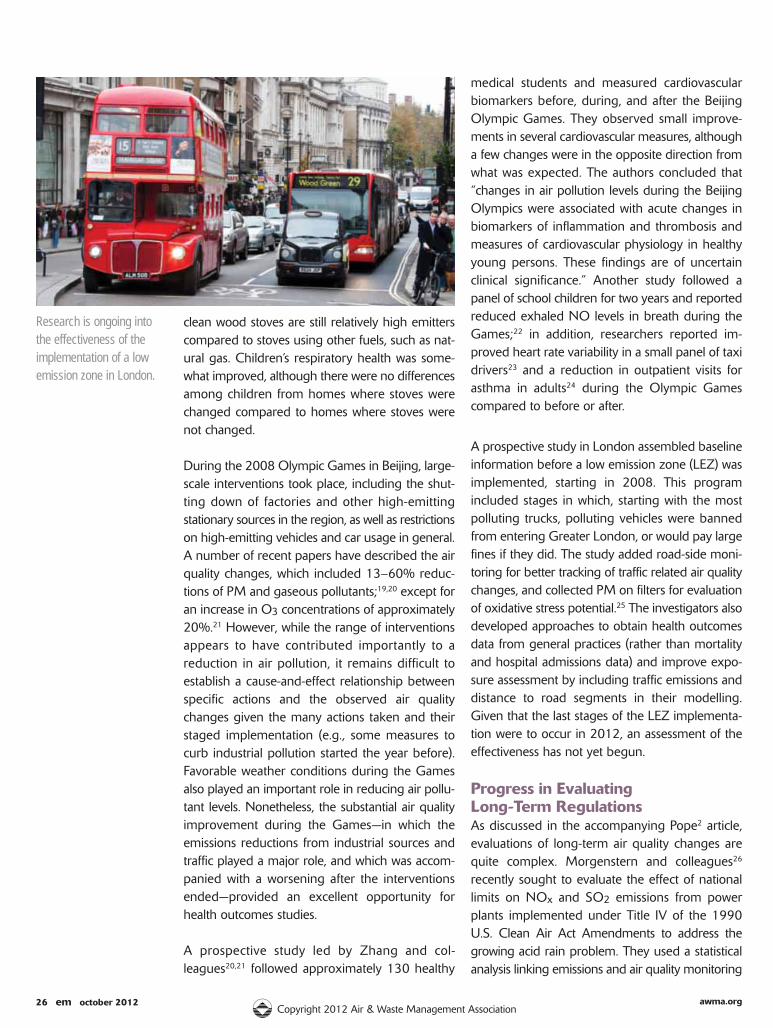
26 em october 2012 awma.orgCopyright 2012 Air & Waste Management Association
clean wood stoves are still relatively high emitterscompared to stoves using other fuels, such as nat-ural gas. Children’s respiratory health was some-what improved, although there were no differencesamong children from homes where stoves werechanged compared to homes where stoves werenot changed.
During the 2008 Olympic Games in Beijing, large-scale interventions took place, including the shut-ting down of factories and other high-emittingstationary sources in the region, as well as restrictionson high-emitting vehicles and car usage in general.A number of recent papers have described the airquality changes, which included 13–60% reduc-tions of PM and gaseous pollutants;19,20 except foran increase in O3 concentrations of approximately20%.21 However, while the range of interventionsappears to have contributed importantly to a reduction in air pollution, it remains difficult to establish a cause-and-effect relationship betweenspecific actions and the observed air qualitychanges given the many actions taken and theirstaged implementation (e.g., some measures tocurb industrial pollution started the year before).Favorable weather conditions during the Gamesalso played an important role in reducing air pollu-tant levels. Nonetheless, the substantial air qualityimprovement during the Games—in which theemissions reductions from industrial sources andtraffic played a major role, and which was accom-panied with a worsening after the interventionsended—provided an excellent opportunity forhealth outcomes studies.
A prospective study led by Zhang and col-leagues20,21 followed approximately 130 healthy
medical students and measured cardiovascular biomarkers before, during, and after the BeijingOlympic Games. They observed small improve-ments in several cardiovascular measures, althougha few changes were in the opposite direction fromwhat was expected. The authors concluded that“changes in air pollution levels during the BeijingOlympics were associated with acute changes inbiomarkers of inflammation and thrombosis andmeasures of cardiovascular physiology in healthyyoung persons. These findings are of uncertainclinical significance.” Another study followed apanel of school children for two years and reportedreduced exhaled NO levels in breath during theGames;22 in addition, researchers reported im-proved heart rate variability in a small panel of taxidrivers23 and a reduction in outpatient visits forasthma in adults24 during the Olympic Gamescompared to before or after.
A prospective study in London assembled baselineinformation before a low emission zone (LEZ) wasimplemented, starting in 2008. This program included stages in which, starting with the mostpolluting trucks, polluting vehicles were bannedfrom entering Greater London, or would pay largefines if they did. The study added road-side moni-toring for better tracking of traffic related air qualitychanges, and collected PM on filters for evaluationof oxidative stress potential.25 The investigators alsodeveloped approaches to obtain health outcomesdata from general practices (rather than mortalityand hospital admissions data) and improve expo-sure assessment by including traffic emissions anddistance to road segments in their modelling.Given that the last stages of the LEZ implementa-tion were to occur in 2012, an assessment of theeffectiveness has not yet begun.
Progress in Evaluating Long-Term RegulationsAs discussed in the accompanying Pope2 article,evaluations of long-term air quality changes arequite complex. Morgenstern and colleagues26
recently sought to evaluate the effect of nationallimits on NOx and SO2 emissions from powerplants implemented under Title IV of the 1990 U.S. Clean Air Act Amendments to address thegrowing acid rain problem. They used a statisticalanalysis linking emissions and air quality monitoring
Research is ongoing intothe effectiveness of theimplementation of a lowemission zone in London.
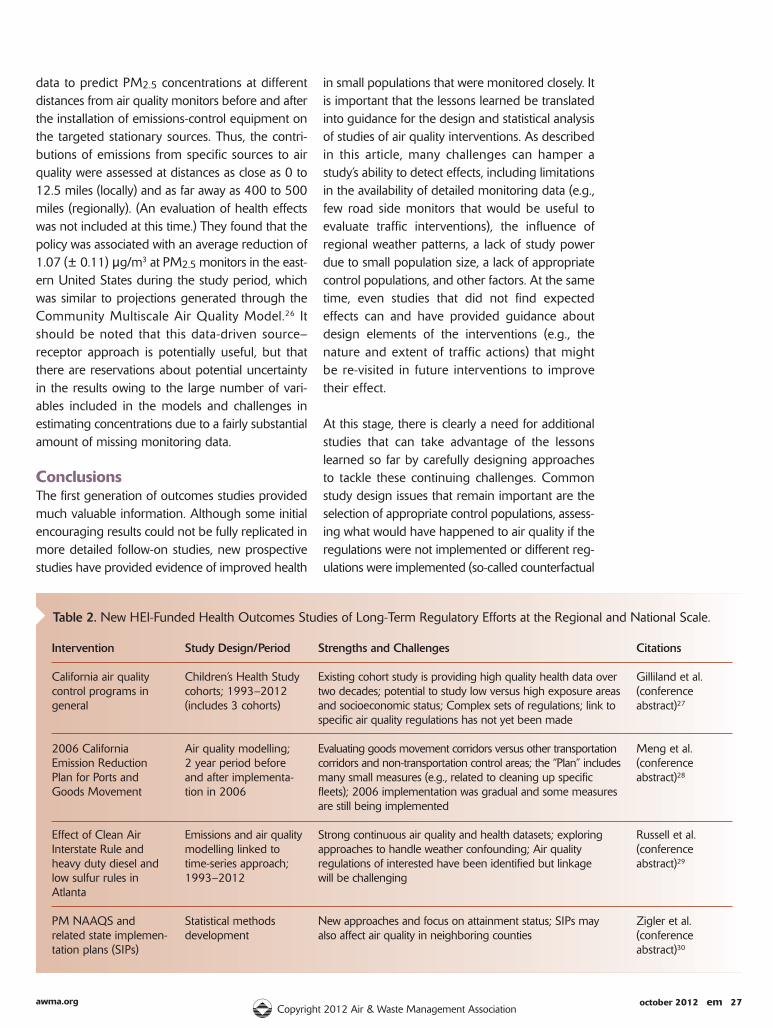
october 2012 em 27awma.orgCopyright 2012 Air & Waste Management Association
data to predict PM2.5 concentrations at differentdistances from air quality monitors before and afterthe installation of emissions-control equipment onthe targeted stationary sources. Thus, the contri-butions of emissions from specific sources to airquality were assessed at distances as close as 0 to12.5 miles (locally) and as far away as 400 to 500miles (regionally). (An evaluation of health effectswas not included at this time.) They found that thepolicy was associated with an average reduction of1.07 (± 0.11) µg/m3 at PM2.5 monitors in the east-ern United States during the study period, whichwas similar to projections generated through theCommunity Multiscale Air Quality Model.26 Itshould be noted that this data-driven source–receptor approach is potentially useful, but thatthere are reservations about potential uncertaintyin the results owing to the large number of vari-ables included in the models and challenges in estimating concentrations due to a fairly substantialamount of missing monitoring data.
ConclusionsThe first generation of outcomes studies providedmuch valuable information. Although some initialencouraging results could not be fully replicated inmore detailed follow-on studies, new prospectivestudies have provided evidence of improved health
in small populations that were monitored closely. Itis important that the lessons learned be translatedinto guidance for the design and statistical analysisof studies of air quality interventions. As describedin this article, many challenges can hamper astudy’s ability to detect effects, including limitationsin the availability of detailed monitoring data (e.g.,few road side monitors that would be useful toevaluate traffic interventions), the influence of regional weather patterns, a lack of study powerdue to small population size, a lack of appropriatecontrol populations, and other factors. At the sametime, even studies that did not find expected effects can and have provided guidance about design elements of the interventions (e.g., the nature and extent of traffic actions) that might be re-visited in future interventions to improvetheir effect.
At this stage, there is clearly a need for additionalstudies that can take advantage of the lessonslearned so far by carefully designing approachesto tackle these continuing challenges. Commonstudy design issues that remain important are theselection of appropriate control populations, assess-ing what would have happened to air quality if theregulations were not implemented or different reg-ulations were implemented (so-called counterfactual
Table 2. New HEI-Funded Health Outcomes Studies of Long-Term Regulatory Efforts at the Regional and National Scale.
Intervention
California air qualitycontrol programs ingeneral
2006 California Emission ReductionPlan for Ports andGoods Movement
Effect of Clean Air Interstate Rule andheavy duty diesel andlow sulfur rules in Atlanta
PM NAAQS and related state implemen-tation plans (SIPs)
Study Design/Period
Children’s Health Studycohorts; 1993–2012(includes 3 cohorts)
Air quality modelling; 2 year period beforeand after implementa-tion in 2006
Emissions and air qualitymodelling linked totime-series approach;1993–2012
Statistical methods development
Strengths and Challenges
Existing cohort study is providing high quality health data overtwo decades; potential to study low versus high exposure areasand socioeconomic status; Complex sets of regulations; link tospecific air quality regulations has not yet been made
Evaluating goods movement corridors versus other transportationcorridors and non-transportation control areas; the “Plan” includesmany small measures (e.g., related to cleaning up specificfleets); 2006 implementation was gradual and some measuresare still being implemented
Strong continuous air quality and health datasets; exploring approaches to handle weather confounding; Air quality regulations of interested have been identified but linkage will be challenging
New approaches and focus on attainment status; SIPs may also affect air quality in neighboring counties
Citations
Gilliland et al. (conference abstract)27
Meng et al. (conference abstract)28
Russell et al. (conference abstract)29
Zigler et al. (conference abstract)30
28 em october 2012 awma.orgCopyright 2012 Air & Waste Management Association
air quality scenarios), selecting time periods surrounding the implementation of the regulatoryaction, as well as appropriately adjusting for unmeasured and potentially confounding risk fac-tors and regional meteorological effects. Contin-ued exploration of alternative approaches andadditional methods development, especially for
evaluating complex long-term regulatory actionsand accounting for the individual and combinedeffects of multiple pollutants, is recommended.Currently, HEI is funding four new studies of long-term national and regional scale regulatory efforts(described in Table 2) that are expected to providefurther insights in the near future. em
References1. Hubbell, B. Assessing the Results of Air Quality Management Programs; EM October 2012, 8-15.2. Pope, C.A., III. Does Reducing Air Pollution Improve Human Health? Evidence from Accountability Studies; EM October 2012, 16-21.3. Pope C.A., III. Respiratory Disease Associated with Community Air Pollution and a Steel Mill, Utah Valley; Am. J. Public Health 1989, 79, 623-628.4. Clancy, L.; Goodman, P.; Sinclair, H.; Dockery, D.W. Effect of Air-Pollution Control on Death Rates in Dublin, Ireland: An Intervention Study; Lancet
2002, 360, 1210-1214.5. Hedley, A.J.; Wong, C.M.; Thach, T.Q.; Ma, S.; Lam, T.H.; Anderson, H.R. Cardiorespiratory and All-Cause Mortality After Restrictions on Sulphur
Content of Fuel in Hong Kong: An Intervention Study; Lancet 2002, 360, 1646-1652.6. Assessing Health Impact of Air Quality Regulations: Concepts and Methods for Accountability Research; HEI Communication 11; Health Effects Institute:
Boston, MA, 2003; available at http://pubs.healtheffects.org/view.php?id=153 (accessed July 10, 2012).7. Proceedings of an HEI Workshop on Further Research to Assess the Health Impacts of Actions Taken to Improve Air Quality; HEI Communication
15; Health Effects Institute: Boston, MA, 2010; available at http://pubs.healtheffects.org/view.php?id=346 (accessed July 10, 2012).8. van Erp, A.M.; Cohen, A.J. HEI’s Research Program on the Impact of Actions to Improve Air Quality: Interim Evaluation and Future Directions; HEI Com-
munication 14; Health Effects Institute: Boston, MA, 2009; available at http://pubs.healtheffects.org/view.php?id=326 (accessed July 10, 2012).9. van Erp, A.M.; Kelly, F.J,; Demerjian, K.L.; Pope, C.A., III; Cohen, A.J. Progress in Research to Assess the Effectiveness of Air Quality Interventions
Towards Improving Public Health; Air. Qual. Atmos. Health 2012, 5, 217-230.10. Dockery, D.W.; Rich, D.Q.; Goodman, P.G.; Clancy, L.; Ohman-Strickland, P.; George, P.; Kotlov, T. Effect of Air Pollution Control on Mortality and
Hospital Admissions in Ireland; Research Report; Health Effects Institute: Boston, MA, 2012, in press.11. Wong, C.M.; Rabl, A.; Thach, T.Q.; Chau, Y.K.; Chan, K.P.; Cowling, B.J.; Lai, H.K.; Lam, T.H.; McGhee, S.M.; Anderson, H.R.; Hedley, A.H. Impact of
the 1990 Hong Kong Legislation for Restriction on Sulphur Content in Fuel; Research Report 170; Health Effects Institute: Boston, MA, 2012; availableat http://pubs.healtheffects.org/view.php?id=387 (accessed Sept. 24, 2012).
12. Friedman, M.S.; Powell, K.E.; Hutwagner, L.; Graham, L.M.; Teague, W.G. Impact of Changes in Transportation and Commuting Behavior During the 1996 Summer Olympic Games in Atlanta on Air Quality and Childhood Asthma; J. Am. Med. Assoc.. 2001, 285, 897-905.
13. Peel, J.L.; Klein, M.; Flanders, W.D.; Mulholland, J.A.; Tolbert, P.E. Impact of Improved Air Quality During the 1996 Summer Olympic Games in Atlanta on Multiple Cardiovascular and Respiratory Outcomes; Research Report 148; Health Effects Institute: Boston, MA, 2010; available athttp://pubs.healtheffects.org/view.php?id=337 (accessed July 10, 2012).
14. Kelly, F.J.; Anderson, H.R.; Armstrong, B.; Atkinson, R.; Barratt, B.; Beevers, S.; Cook, D.; Derwent, R.; Duggan, S.; Green, D.; Mudway, I.S.;Wilkinson, P. Congestion Charging Scheme in London: Assessing its Impact on Air Quality; Research Report 155; Health Effects Institute: Boston,MA, 2011; available at http://pubs.healtheffects.org/view.php?id=358 (accessed July 10, 2012).
15. Tonne, C.; Beevers, S.; Armstrong, B.; Kelly, F.; Wilkinson, P. Air Pollution and Mortality Benefits of the London Congestion Charge: Spatial andSocioeconomic Inequalities; Occup. Environ. Med. 2008, 65, 620-627.
16. Noonan, C.W.; Ward, T.J.; Navidi, W.; Sheppard, L.; Bergauff, M.; Palmer, C. Assessing the Impact of a Wood Stove Replacement Program on Air Qual-ity and Children’s Health; Research Report 162; Health Effects Institute: Boston, MA, 2011; available at http://pubs.healtheffects.org/view.php?id=367(accessed July 10, 2012).
17. Noonan, C.W.; Navidi, W.; Sheppard, L.; Palmer, C.P.; Bergauff, M.; Hooper, K.; Ward, T.J. Residential Indoor PM(2.5) in Wood Stove Homes:Follow-up of the Libby Changeout program; Indoor Air [Epub ahead of print, May 19, 2012]; doi: 10.1111/j.1600-0668.2012.00789.x.
18. Noonan, C.W.; Ward, T.J.; Navidi, W.; Sheppard, L. A Rural Community Intervention Targeting Biomass Combustion Sources: Effects on AirQuality and Reporting of Children’s Respiratory Outcomes; Occup. Environ. Med. 2012, 69, 354-360.
19. Wang, S.; Zhao, M.; Xing, J.; Wu, Y.; Zhou, Y.; Lei, Y.; He, K.; Fu, L.; Hao, J. Quantifying the Air Pollutants Emission Reduction During the 2008Olympic Games in Beijing; Environ. Sci. Technol. 2010, 44, 2490-2496.
20. Rich, D.Q.; Kipen, H.M.; Huang, W.; Wang, G.; Wang, Y.; Zhu, P.; Ohman-Strickland, P.; Hu, M.; Philipp, C.; Diehl, S.R.; Lu, S.E.; Tong, J.; Gong, J.;Thomas, D.; Zhu, T.; Zhang, J.J. Association Between Changes in Air Pollution Levels During the Beijing Olympics and Biomarkers of Inflammationand Thrombosis in Healthy Young Adults; J. Am. Med. Assoc. 2012, 307, 2068-2078.
21. Zhang, J.J.; Kipen, H.M.; Zhu, T.; Wang, G.; Huang, W.; Rich, D.; Zhu, P.; Wang, Y.; Lu, S.-E.; Ohman-Strickland, P.; Diehl, S.R.; Hu, M.; Tong, J.;Gong, J.; Thomas. D. Cardio-Respiratory Biomarker Responses of Healthy Young Adults to Drastic Air Quality Changes Surrounding the BeijingOlympics; Research Report; Health Effects Institute: Boston, MA, 2012, in press.
22. Lin, W.; Huang, W.; Zhu, T.; Hu, M.; Brunekreef, B.; Zhang, Y.; Liu, X.; Cheng, H.; Gehring, U.; Li, C.; Tang, X. Acute Respiratory Inflammationin Children and Black Carbon in Ambient Air Before and During the 2008 Beijing Olympics; Environ. Health. Perspect. 2011, 119, 1507-1512.
23. Wu, S.; Deng, F.; Niu, J.; Huang, Q.; Liu, Y.; Guo, X. Association of Heart Rate Variability in Taxi Drivers with Marked Changes in Particulate AirPollution in Beijing in 2008; Environ. Health Perspect. 2010, 118, 87-191.
24. Li, Y.; Wang, W.; Wang, J.; Zhang, X.; Lin, W.; Yang, Y. Impact of Air Pollution Control Measures and Weather Conditions on Asthma during the2008 Summer Olympic Games in Beijing; Int. J. Biometeorol. 2011, 55, 547-554.
25. Kelly, F.; Anderson, H.R.; Armstrong, B.; Atkinson, R.; Barratt, B.; Cook, D.; Beevers, S.; Derwent, D.; Green, D.; Mudway, I.; Wilkinson, P. TheLondon Low Emission Zone Baseline Study; Research Report 163; Health Effects Institute: Boston, MA, 2011; available at http://pubs.healtheffects.org/view.php?id=366 (accessed July 10, 2012).
26. Morgenstern, R.D.; Harrington, W.; Shih, J.-S.; Bell, M. Accountability Analysis of Title IV Phase 2 of the 1990 Clean Air Act Amendments; ResearchReport 168; Health Effects Institute: Boston, MA, 2012, in press.
27. Gilliland, F.; Avol, E.; Gauderman, W.J.; McConnell, R.; Lurmann, F. The Effects of Policy-Driven Air Quality Improvements on Children’s RespiratoryHealth; Program and Abstracts, HEI Annual Conference 2012, Chicago, IL, April 15-17, 2012; Health Effects Institute: Boston, MA, 2012.
28. Meng, Y.-Y.; Su, J.G.; Jerrett, M.; Seto, E.; Turner, M.W.; Ritz, B. Improvements in Air Quality and Health Outcomes Among California MedicaidEnrollees due to Goods Movement Actions—Phase I: Assessing Air Quality Changes; Program and Abstracts, HEI Annual Conference 2012,Chicago, IL, April 15-17, 2012; Health Effects Institute: Boston, MA, 2012.
29. Russell, A.G.; Mulholland, J.A.; Hu, Y.T.; Klein, M.; Strickland, M.J.; Sarnat, S.E.; Tolbert, P.E. Impacts of Emission Changes on Air Quality and AcuteHealth Effects in the Southeast, 1993–2012; Program and Abstracts, HEI Annual Conference 2012, Chicago, IL, April 15-17, 2012; Health Effects Institute: Boston, MA, 2012.
30. Zigler, C.; Dominici, F.; Samet, J.; King, G. Causal Inference Methods for Estimating Long-Term Health Effects of Air Quality Regulations; Program and Abstracts, HEI Annual Conference 2012, Chicago, IL, April 15-17, 2012; Health Effects Institute: Boston, MA, 2012.
Workshop Topics: • Water Treatment
• Water Reuse and Recycle
• Water Sourcing and Logistics
• Wastewater Disposal
The workshop will focus on the engineering design and
in-the-field implementation of water use and reuse activities.
Additionally it will bring together experts to discuss current
water management technologies and processes utilized to
address water use and impacted water disposal.
Save the Date
Shale Oil and Gas E&P – Water Challenges and Opportunities
November 1st and 2nd, 2012 Pittsburgh, PA
AIChE/A&WMA Joint Workshop
For more information go to http://www.aiche.org/conferences/calendar/2012.aspx
© 2012 AIChE 7245a • 03.12
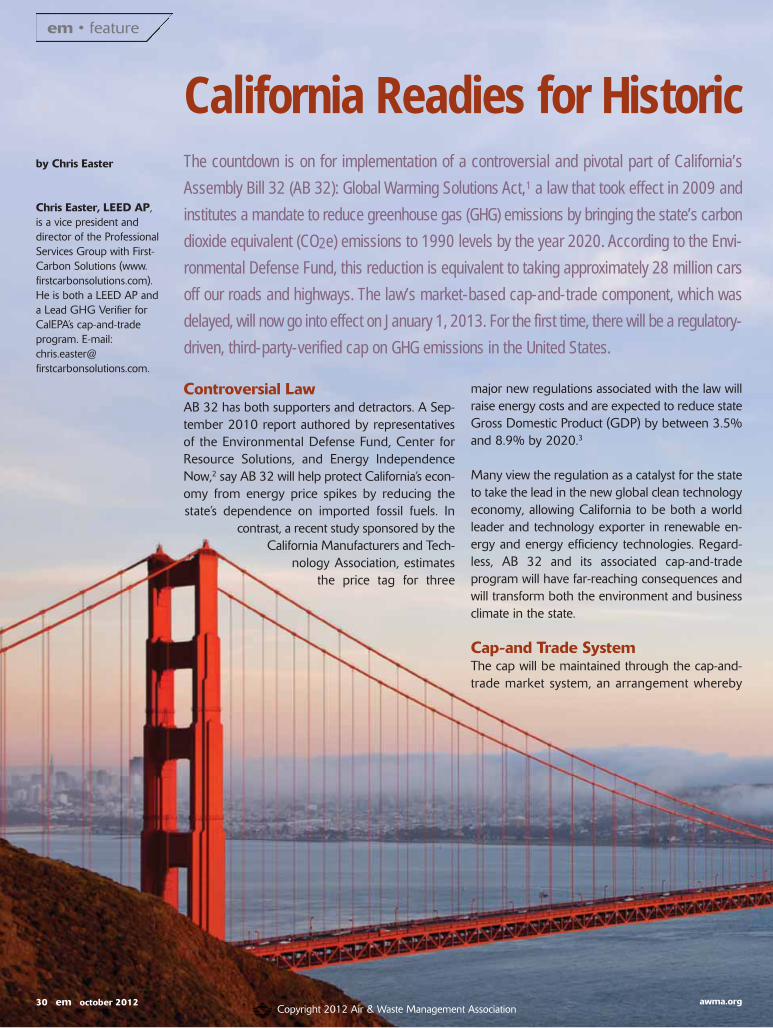
30 em october 2012 awma.orgCopyright 2012 Air & Waste Management Association
em • feature
The countdown is on for implementation of a controversial and pivotal part of California’s
Assembly Bill 32 (AB 32): Global Warming Solutions Act,1 a law that took effect in 2009 and
institutes a mandate to reduce greenhouse gas (GHG) emissions by bringing the state’s carbon
dioxide equivalent (CO2e) emissions to 1990 levels by the year 2020. According to the Envi-
ronmental Defense Fund, this reduction is equivalent to taking approximately 28 million cars
off our roads and highways. The law’s market-based cap-and-trade component, which was
delayed, will now go into effect on January 1, 2013. For the first time, there will be a regulatory-
driven, third-party-verified cap on GHG emissions in the United States.
California Readies for Historic
Controversial LawAB 32 has both supporters and detractors. A Sep-tember 2010 report authored by representativesof the Environmental Defense Fund, Center for Resource Solutions, and Energy IndependenceNow,2 say AB 32 will help protect California’s econ-omy from energy price spikes by reducing thestate’s dependence on imported fossil fuels. In
contrast, a recent study sponsored by theCalifornia Manufacturers and Tech-
nology Association, estimatesthe price tag for three
major new regulations associated with the law willraise energy costs and are expected to reduce stateGross Domestic Product (GDP) by between 3.5%and 8.9% by 2020.3
Many view the regulation as a catalyst for the stateto take the lead in the new global clean technologyeconomy, allowing California to be both a worldleader and technology exporter in renewable en-ergy and energy efficiency technologies. Regard-less, AB 32 and its associated cap-and-tradeprogram will have far-reaching consequences andwill transform both the environment and businessclimate in the state.
Cap-and Trade SystemThe cap will be maintained through the cap-and-trade market system, an arrangement whereby
by Chris Easter
Chris Easter, LEED AP, is a vice president and director of the ProfessionalServices Group with First-Carbon Solutions (www.firstcarbonsolutions.com).He is both a LEED AP and a Lead GHG Verifier forCalEPA’s cap-and-trade program. E-mail:[email protected].
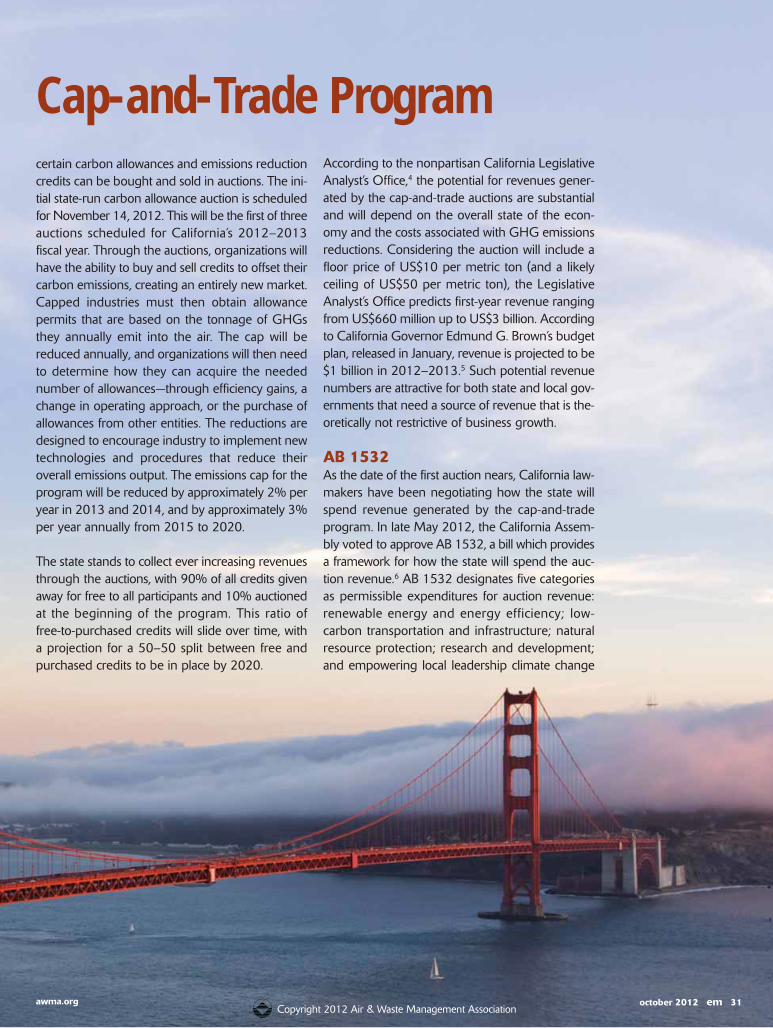
october 2012 em 31awma.orgCopyright 2012 Air & Waste Management Association
certain carbon allowances and emissions reductioncredits can be bought and sold in auctions. The ini-tial state-run carbon allowance auction is scheduledfor November 14, 2012. This will be the first of threeauctions scheduled for California’s 2012–2013 fiscal year. Through the auctions, organizations willhave the ability to buy and sell credits to offset theircarbon emissions, creating an entirely new market.Capped industries must then obtain allowance permits that are based on the tonnage of GHGsthey annually emit into the air. The cap will be reduced annually, and organizations will then needto determine how they can acquire the needednumber of allowances—through efficiency gains, achange in operating approach, or the purchase ofallowances from other entities. The reductions aredesigned to encourage industry to implement newtechnologies and procedures that reduce theiroverall emissions output. The emissions cap for theprogram will be reduced by approximately 2% peryear in 2013 and 2014, and by approximately 3%per year annually from 2015 to 2020.
The state stands to collect ever increasing revenuesthrough the auctions, with 90% of all credits givenaway for free to all participants and 10% auctionedat the beginning of the program. This ratio of free-to-purchased credits will slide over time, witha projection for a 50–50 split between free andpurchased credits to be in place by 2020.
According to the nonpartisan California LegislativeAnalyst’s Office,4 the potential for revenues gener-ated by the cap-and-trade auctions are substantialand will depend on the overall state of the econ-omy and the costs associated with GHG emissionsreductions. Considering the auction will include afloor price of US$10 per metric ton (and a likelyceiling of US$50 per metric ton), the LegislativeAnalyst’s Office predicts first-year revenue rangingfrom US$660 million up to US$3 billion. Accordingto California Governor Edmund G. Brown’s budgetplan, released in January, revenue is projected to be$1 billion in 2012–2013.5 Such potential revenuenumbers are attractive for both state and local gov-ernments that need a source of revenue that is the-oretically not restrictive of business growth.
AB 1532As the date of the first auction nears, California law-makers have been negotiating how the state willspend revenue generated by the cap-and-tradeprogram. In late May 2012, the California Assem-bly voted to approve AB 1532, a bill which providesa framework for how the state will spend the auc-tion revenue.6 AB 1532 designates five categoriesas permissible expenditures for auction revenue: renewable energy and energy efficiency; low-carbon transportation and infrastructure; natural resource protection; research and development;and empowering local leadership climate change
Cap-and-Trade Program
32 em october 2012 awma.orgCopyright 2012 Air & Waste Management Association
planning and implementation. AB 1532 nowmoves on to California’s Senate, where manyexpect it to pass.
Reporting and VerificationThe California Air Resources Board (CARB) is thestate agency tasked with administering AB 32. Asa result, CARB has been implementing ancillaryregulations designed to enable the cap-and-trademeasure to achieve the intended goals. An exam-ple is the rigorous reaccreditation process thatthird-party verifiers must complete in order toproperly verify emissions at affected facilities. CARBoperates a third-party verification system to ensurefacilities subject to the cap meet rigorous carbon
accounting standards to ensure a metric ton of car-bon is standardized throughout the market. Regu-lations that control the verification process need tobe consistently reviewed and refined as the cap-and-trade program operates over time. Such com-plex systems require strict rules for the system tooperate properly and not produce unintended con-sequences or allow participants to unfairly “game”the system.
The reporting tool in use by CARB, the CaliforniaElectric Greenhouse Gas Reporting Tool (Cal e-GGRT), was built collaboratively with the U.S. Environmental Protection Agency (EPA). It is Web-based and allows organizations to electronically report data within a secure, online system. Thereare more comprehensive toolsets on the market,including FirstCarbon Solutions’ own ghgTrack,that are capable of monitoring, managing, anddashboarding carbon emissions data from allsources within an organization. These tools are designed to make it easy to track impacts of emis-sions reduction initiatives and report to multipleregistries and internally.
SummaryNow is the time for organizations to gain a strategicadvantage by working with sustainability expertswho have the consulting and data processing expertise to manage data collection, complete dataanalysis, emissions inventory and footprinting cal-culations, and the appropriate validation necessaryfor quality control and data verification.
With AB 32 now in place, the upcoming Novemberauction, and cap-and-trade market-based systemthat goes into effect at the beginning of 2013, Cal-ifornia is positioned to lead the way in the neweconomy. If AB 32 is implemented effectively, wewill see improvements in energy efficiency, carbonfootprint reductions, and innovative businessprocesses and systems that lower GHG emissionsand create competitive advantages. em
References1. Assembly Bill 32: Global Warming Solutions Act, 2006. See www.arb.ca.gov/cc/ab32/ab32.htm.2. Fine, J.; Busch, C.; Garderet, R. Shockproofing Society: How California’s Global Warming Solutions Act (AB 32) Reduces the Economic Pain of
Energy Price Shocks; Environmental Defense Fund, Center for Resource Solutions, and Energy Independence Now, September 2010; availableat www.resource-solutions.org/pub_pdfs/Shockproofing%20Society.pdf.
3. The Fiscal and Economic Impact of the California Global Warming Solutions Act of 2006 Executive Summary. By Andrew Chang & Company, LLC,Sacramento, CA, on behalf of the California Manufacturers & Technology Association, June 2012; available at http://cmta.net/pdfs/CMTA%20-%20Exec%20Summary-Final.pdf.
4. California Legislative Analyst’s Office. See www.lao.ca.gov.5. 2012-2013 California Budget, State of California, Department of Finance, 2012. See www.ebudget.ca.gov.6. AB 1532 (John A. Pérez), January 23, 2012. See www.leginfo.ca.gov/pub/11-12/bill/asm/ab_1501-1550/ab_1532_bill_20120123_introduced.pdf.
CATRGreenhouse Gas
Tailoring
8 hr. OzoneStandard
TitleV
PM2.5
NSR
REGISTER NOW!
Get up-to-date on the latest rules impacting NSR and Title V permitting: theGreenhouse Gas Tailoring Rule; the New Ozone, NO2 and PM2.5 NAAQSs;modeling; NEPA issues; CAFO sources, and more. This two-day workshopwill cover permitting changes presented by both national and regional lead-ers in the field.
This is last workshop in Air & Waste Management’s Understanding Today’sClean Air Act Permit Programs Workshop Series. Don’t miss out on this relevant and informative workshop. Register today!
Sponsorship and exhibit opportunities are available
WORKSHOP LOCATIONHilton Hartford+1-860-240-7201Hotel Rate: $149
HOTEL CUTOFF/REGISTRATION DEADLINEOctober 16, 2012
www.//permitting.awma.org
Understanding Today’sClean Air Act PermitProgramsNovember 13-14, 2012 • Hartford, CT

Who do you know that deserves special
Recognition?The Air & Waste Management Association bestows 10 achieve-ment awards annually, presented at the Honors & Awards Cere-mony during the Association's Annual Conference & Exhibition.
Please consider whom you might nominate for the awards to bepresented in 2013.
Descriptions of each award are available on our web site(www.awma.org) in the Honors & Awards section under the“About A&WMA” tab. The 2013 nomination forms will be available online by the end of July.
Awards A&WMA members can nominate for:Charles W. Gruber Association Leadership AwardFellow A&WMA MembershipHonorary A&WMA MembershipOutstanding Young Professional AwardJ. Deane Sensenbaugh Environmental Technology Award
Awards anyone can nominate for:Frank A. Chambers Excellence in Air Pollution Control AwardS. Smith Griswold Outstanding Air Pollution Control Official AwardRichard Beatty Mellon Environmental Stewardship AwardLyman A. Ripperton Environmental Educator AwardRichard I. Stessel Waste Management Award
The deadline for complete nomination material will be November 1, 2012.

34 em october 2012 awma.orgCopyright 2012 Air & Waste Management Association
em • it insight
by Jill Gilbert
Jill Barson Gilbert, QEP,is president of Lexicon Systems, LLC. E-mail:[email protected].
As managers, engineers, and scientists, we often spend the majority of our time—up to
80%1—gathering data, and minimal time acting on it. We find it hard to get the information
we need from disparate, unintegrated data sources, much of it locked within spreadsheets.
While many of us now use commercial or homegrown enterprise environment, health, and
safety (EH&S) software packages as data repositories, some users still opt to download certain
information into spreadsheets. More than 30 years after their introduction, electronic spread-
sheets are pervasive. The unrelenting use of spreadsheets creates risk when, unconstrained,
they feed data and decisions into critical business processes and we rely upon them for
compliance reporting.
Managing Spreadsheet Risk
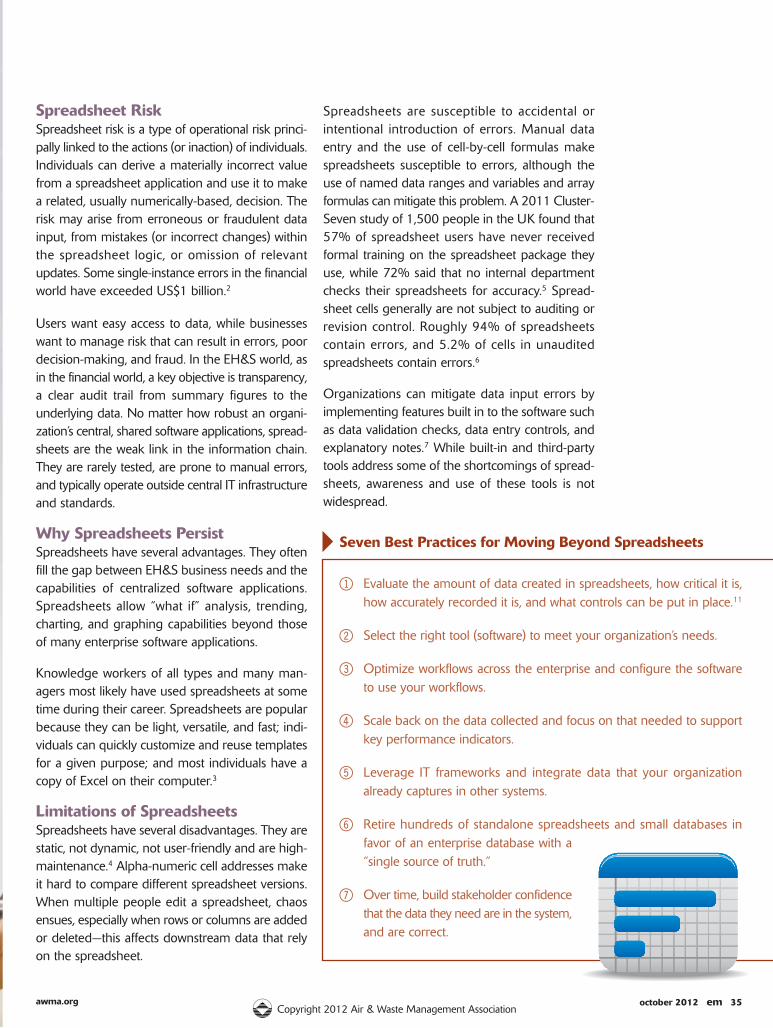
october 2012 em 35awma.orgCopyright 2012 Air & Waste Management Association
Spreadsheet RiskSpreadsheet risk is a type of operational risk princi-pally linked to the actions (or inaction) of individuals.Individuals can derive a materially incorrect valuefrom a spreadsheet application and use it to makea related, usually numerically-based, decision. Therisk may arise from erroneous or fraudulent datainput, from mistakes (or incorrect changes) withinthe spreadsheet logic, or omission of relevant updates. Some single-instance errors in the financialworld have exceeded US$1 billion.2
Users want easy access to data, while businesseswant to manage risk that can result in errors, poordecision-making, and fraud. In the EH&S world, asin the financial world, a key objective is transparency,a clear audit trail from summary figures to the underlying data. No matter how robust an organi-zation’s central, shared software applications, spread-sheets are the weak link in the information chain.They are rarely tested, are prone to manual errors,and typically operate outside central IT infrastructureand standards.
Why Spreadsheets PersistSpreadsheets have several advantages. They oftenfill the gap between EH&S business needs and thecapabilities of centralized software applications.Spreadsheets allow “what if” analysis, trending,charting, and graphing capabilities beyond thoseof many enterprise software applications.
Knowledge workers of all types and many man-agers most likely have used spreadsheets at sometime during their career. Spreadsheets are popularbecause they can be light, versatile, and fast; indi-viduals can quickly customize and reuse templatesfor a given purpose; and most individuals have acopy of Excel on their computer.3
Limitations of SpreadsheetsSpreadsheets have several disadvantages. They arestatic, not dynamic, not user-friendly and are high-maintenance.4 Alpha-numeric cell addresses makeit hard to compare different spreadsheet versions.When multiple people edit a spreadsheet, chaosensues, especially when rows or columns are addedor deleted—this affects downstream data that relyon the spreadsheet.
Spreadsheets are susceptible to accidental or intentional introduction of errors. Manual dataentry and the use of cell-by-cell formulas makespreadsheets susceptible to errors, although theuse of named data ranges and variables and arrayformulas can mitigate this problem. A 2011 Cluster-Seven study of 1,500 people in the UK found that57% of spreadsheet users have never received formal training on the spreadsheet package theyuse, while 72% said that no internal departmentchecks their spreadsheets for accuracy.5 Spread-sheet cells generally are not subject to auditing orrevision control. Roughly 94% of spreadsheetscontain errors, and 5.2% of cells in unauditedspreadsheets contain errors.6
Organizations can mitigate data input errors by implementing features built in to the software suchas data validation checks, data entry controls, andexplanatory notes.7 While built-in and third-partytools address some of the shortcomings of spread-sheets, awareness and use of these tools is notwidespread.
1 Evaluate the amount of data created in spreadsheets, how critical it is,how accurately recorded it is, and what controls can be put in place.11
2 Select the right tool (software) to meet your organization’s needs.
3 Optimize workflows across the enterprise and configure the softwareto use your workflows.
4 Scale back on the data collected and focus on that needed to supportkey performance indicators.
5 Leverage IT frameworks and integrate data that your organization already captures in other systems.
6 Retire hundreds of standalone spreadsheets and small databases infavor of an enterprise database with a“single source of truth.”
7 Over time, build stakeholder confidencethat the data they need are in the system,and are correct.
Seven Best Practices for Moving Beyond Spreadsheets
36 em october 2012 awma.orgCopyright 2012 Air & Waste Management Association
Business analytics software allows organizations toconsolidate relevant performance data and thencompare against key performance indicators. Busi-ness analytics allows stakeholders to look beyonddaily static reports to view prior periods and lookfor trends.
Enterprise software with business analytics embed-ded can be powerful, especially for EH&S data thatcomes from many sources throughout the business.
“Do nothing” (i.e., maintaining the status quo) isnot viable in the long term.
Moving Beyond SpreadsheetsApplying technology beyond spreadsheets canbring about efficiencies, including
• reduced operating and capital expenses;• increased productivity—up to 30% cost reduction
for data entry and reporting processes;10
• enhanced brand and image;• enhanced compliance; and • integration with data along the supply chain,
including suppliers and customers.
Electronic spreadsheets have served us well for morethan 30 years. As knowledge workers, we are com-fortable with spreadsheets and willing to overlooktheir limitations. Trying to manage a large volumeof spreadsheets without proper security and audittrails, data entry error and revision control is a riskthat few organizations can afford to assume. It’stime to acknowledge spreadsheet risk and take action. em
References1. Governance and Compliance for End-User Computing; ClusterSeven, www.clusterseven.com.2. See http://en.wikipedia.org/wiki/Spreadsheet.3. Chan, V. Easy Project Management Using Microsoft Excel; launchexcel.com, 2011.4. Service Management: Beyond Management by Spreadsheet; Verisae.com, 2010.5. See http://en.wikipedia.org/wiki/Spreadsheet.6. Powell, S.; Baker, K.; Lawson, B. A Critical Review of the Literature on Spreadsheet Errors; Tuck School of Business, Dartmouth College, 2008;
http://mba.tuck.dartmouth.edu/spreadsheet/product_pubs_files/Literature.pdf.7. Blaustein, R. Eliminating Spreadsheet Risks; Internal Auditor, 2009; http://www.theiia.org/intAuditor/itaudit/2009-articles/eliminating-spreadsheet-risks/.8. Ferguson, E. Are You Managing Spreadsheet Risk?; Protiviti, September 2008. 9. Ferguson, E. Can Technology Improve Spreadsheet Risk Management?; Protiviti, November 2008.10. Greden, L. Achieve Business Value with Financial Grade Sustainability Data. Presented at the Cap Gemini Webinar, July 25, 2012.11. Evans, J. CFO Horror Story: Can You Trust Your Spreadsheets?; CIO, February 6, 2012.
Managing Spreadsheet RiskManaging spreadsheet risk entails understandingrisk—what is the risk, where is it, how significant isit, and who is currently dealing with it—and managing it to an acceptable level.8
Organizations typically have four options for man-aging spreadsheet risk:
1 Implement commercial spreadsheet manage-ment software
2 Implement business analytics software3 Implement enterprise software that incor-
porates analytics4 Do nothing
Spreadsheet management solutions include spread-sheet management/control, spreadsheet search/discovery, and spreadsheet auditing tools.9 Suchsoftware can address data integrity, informationchain, and revision control issues, but it does notsolve the underlying problems of spreadsheet pro-liferation and lack of integration with key businesssystems.
Spreadsheets are
the weak link in the
information chain.
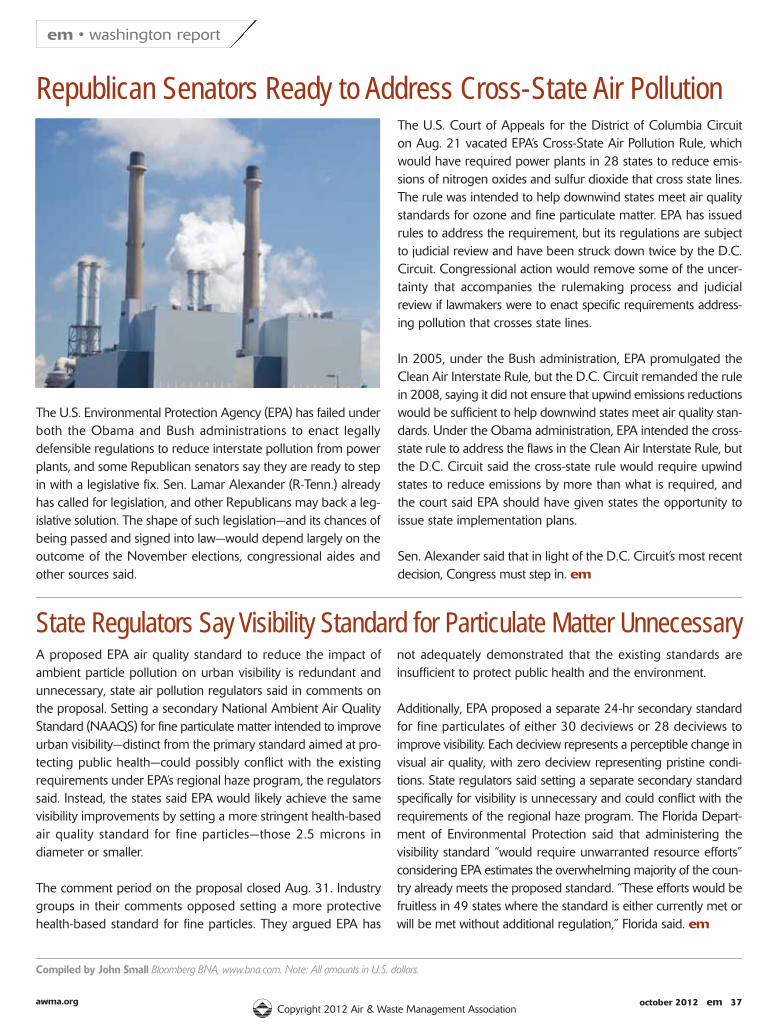
october 2012 em 37awma.orgCopyright 2012 Air & Waste Management Association
em • washington report
Compiled by John Small Bloomberg BNA, www.bna.com. Note: All amounts in U.S. dollars.
A proposed EPA air quality standard to reduce the impact of ambient particle pollution on urban visibility is redundant andunnecessary, state air pollution regulators said in comments onthe proposal. Setting a secondary National Ambient Air QualityStandard (NAAQS) for fine particulate matter intended to improveurban visibility—distinct from the primary standard aimed at pro-tecting public health—could possibly conflict with the existing requirements under EPA’s regional haze program, the regulatorssaid. Instead, the states said EPA would likely achieve the samevisibility improvements by setting a more stringent health-basedair quality standard for fine particles—those 2.5 microns in diameter or smaller.
The comment period on the proposal closed Aug. 31. Industrygroups in their comments opposed setting a more protectivehealth-based standard for fine particles. They argued EPA has
not adequately demonstrated that the existing standards are insufficient to protect public health and the environment.
Additionally, EPA proposed a separate 24-hr secondary standardfor fine particulates of either 30 deciviews or 28 deciviews to improve visibility. Each deciview represents a perceptible change invisual air quality, with zero deciview representing pristine condi-tions. State regulators said setting a separate secondary standardspecifically for visibility is unnecessary and could conflict with therequirements of the regional haze program. The Florida Depart-ment of Environmental Protection said that administering the visibility standard “would require unwarranted resource efforts”considering EPA estimates the overwhelming majority of the coun-try already meets the proposed standard. “These efforts would befruitless in 49 states where the standard is either currently met orwill be met without additional regulation,” Florida said. em
Republican Senators Ready to Address Cross-State Air Pollution
State Regulators Say Visibility Standard for Particulate Matter Unnecessary
The U.S. Environmental Protection Agency (EPA) has failed underboth the Obama and Bush administrations to enact legally defensible regulations to reduce interstate pollution from powerplants, and some Republican senators say they are ready to stepin with a legislative fix. Sen. Lamar Alexander (R-Tenn.) alreadyhas called for legislation, and other Republicans may back a leg-islative solution. The shape of such legislation—and its chances ofbeing passed and signed into law—would depend largely on theoutcome of the November elections, congressional aides andother sources said.
The U.S. Court of Appeals for the District of Columbia Circuiton Aug. 21 vacated EPA’s Cross-State Air Pollution Rule, whichwould have required power plants in 28 states to reduce emis-sions of nitrogen oxides and sulfur dioxide that cross state lines.The rule was intended to help downwind states meet air qualitystandards for ozone and fine particulate matter. EPA has issuedrules to address the requirement, but its regulations are subjectto judicial review and have been struck down twice by the D.C.Circuit. Congressional action would remove some of the uncer-tainty that accompanies the rulemaking process and judicial review if lawmakers were to enact specific requirements address-ing pollution that crosses state lines.
In 2005, under the Bush administration, EPA promulgated theClean Air Interstate Rule, but the D.C. Circuit remanded the rulein 2008, saying it did not ensure that upwind emissions reductionswould be sufficient to help downwind states meet air quality stan-dards. Under the Obama administration, EPA intended the cross-state rule to address the flaws in the Clean Air Interstate Rule, butthe D.C. Circuit said the cross-state rule would require upwindstates to reduce emissions by more than what is required, andthe court said EPA should have given states the opportunity toissue state implementation plans.
Sen. Alexander said that in light of the D.C. Circuit’s most recentdecision, Congress must step in. em
awma.org
em • yp perspective
Alberta’s Specified Gas EmittersRegulationMuch has been said and written about Alberta’sSpecified Gas Emitters Regulation (SGER). In a nut-shell, Alberta Environment developed the SGERrequiring all facilities in Alberta emitting more than100,0001 metric tonnes of carbon dioxide equivalent(CO2e) per year to reduce their per-unit GHG out-put by 12% below their established baseline levels.Basically, it’s an intensity-based reduction program,where the absolute quantity of total emissions is notas relevant as the amount of GHGs emitted perunit of production. This means that the facility canhave increased total emissions in any given year(associated with an increased production) and stillbe in compliance, as long as it can reduce theamount of GHGs emitted per unit of production.
The goal of the regulation is to reduce GHG emis-sions through a combination of alternatives, includ-ing implementing actual physical improvements inprocess operations, purchasing emission offsets obtained through GHG reduction projects withinAlberta, and contributing C$15 per tonne of addi-tional CO2e toward a Climate Change and Emis-sions Management (CCEM) Fund that is used forthe development and implementation of new emis-sions reduction technologies.
Alberta has the only fully functioning multi-sectoremissions trading scheme in North America. Al-berta’s trading scheme is a compliance mechanismthat allows polluters to meet their emission reductiontargets by buying carbon offsets from a selection
of projects. Alberta carbon offset projects are notrequired to have their project plans verified by athird party because all projects must be developedto government approved protocols.
Carbon offset projects are primarily GHG emissionreduction or removal activities that occur in theprovince of Alberta; activities that are additional tobusiness as usual and were not required by law.These activities range from paying farmers to adoptlow-till or no-till agricultural practices—thereby turn-ing fields into carbon sinks—to the collection andcombustion of landfill gas.
Verification and monitoring of the offsets is manda-tory prior to registration on the Alberta EmissionsOffset Registry (AEOR). AEOR is the public platformfor registration of all Alberta-based compliance off-sets and serves as a means of recording projectand credit information, including assigning serialnumbers, which are used to track offset credits.Emission Performance Credits (EPC), generated byregulated facilities that reduce their emissionsbelow their reduction target, are serialized andtracked by Alberta Environment and available fortrading among Alberta facilities.
Five rounds of verification were completed thisyear. To bring into perspective the scale of this pro-gram: 33.6 million tonnes (MT) of CO2e havebeen reduced through operational changes and investment in verified offsets. In total, C$312 millionhave been contributed toward the CCEM Fund, outof which C$126 million were invested in 27 emission
A Greenhouse GasThird-Party Verifications in the First North American Each year since 2008, the month of March brings about an intense rush of activities related to
greenhouse gas (GHG) inventory quantification, verification, and reporting to the point that I have
termed this whole process as “March Madness.” The reason for this rush of activity, you may
ask? I work in the Canadian province of Alberta, where GHG emissions are regulated and have
to be reported annually by March 31. Most of the province’s environmental reporting deadlines
are March 31 and, hence, the madness.
by Imtiyaz Moulvi
Imtiyaz Moulvi, M.Eng.,P.Eng., is a project managerwith Levelton’s EnvironmentalDivision in Calgary, Alberta,Canada. He holds a master’sdegree in environmental engineering and is a regis-tered Professional Engineerin Alberta. His technical expertise lies in air quality assessment and dispersionmodeling, emissions inventorydevelopment, greenhousegas management, and envi-ronmental auditing. E-mail:[email protected].
YP Perspective is a monthlycolumn organized byA&WMA’s Young ProfessionalAdvisory Council (YPAC). Ifyou have a topic you wouldlike to see young professionalsdiscuss, e-mail: [email protected].
YPAC strives to effectively engage YPs within the Association by developingservices and activities to meetthe needs of today’s youngprofessionals. A YP is definedby the Association as being 35 years of age or younger.Each YP is encouraged to getinvolved with the Association,whether within their localChapter or Section or withinthe Association’s four Councils(Education Council, TechnicalCouncil, Sections and ChaptersCouncils, and YPAC). YPs interested in getting involvedmay contact YPAC for more in-formation on current volunteerand leadership opportunities.
38 em october 2012Copyright 2012 Air & Waste Management Association
october 2012 em 39awma.org
reduction projects relating to energy efficiency, re-newable energy, clean energy production, and carbon capture and storage. Combined, these 27 projects are anticipated to produce a total emis-sions reduction of 2.3 MT per year over a periodof 10 years.
Third-Party VerificationAs an environmental consultant, my role within thisgrand scheme is to conduct independent third-party verifications for a facility’s annual compliancereporting. This is a mandatory requirement as perthe regulations in order to improve the overall assurance of the system. A third-party verifier mustconfirm that the facility’s GHG emissions as reportedhave been completed in an accurate and appropri-ate manner. Starting in 2012, the level of assurancefor verification has moved from “limited” to “reas-onable”. Currently, any chartered accountant or
professional engineer with relevant expertise canact as the verifier, but Alberta Environment is con-sidering the issue of verifier certification to bring itin line with other markets.
Over the past five years, I have been involved inverifications for various industries, ranging from oilsands processing to utility companies. This March,I was involved in verifications for three diverse facilities—one of the perks of working in the con-sulting industry. An interesting aspect this year wasthat each of the three facilities utilized a differentcompliance mechanism.
First, a natural gas processing plant with a daily processing capacity of about 15 million cubic metersof raw gas failed to meet its 12% reduction targetby emitting some 26,000 tonnes of CO2e above thelimit. To be in compliance, the facility contributed
Abstracts Should Be:
Submitted via e-mail to [email protected]
No more than 600 words
Submitted prior to October 31, 2012
Selected papers are to be platform presented at the conference (there will not be a poster session).
Please contact Carrie Hartz, A&WMA Conference & Events Planner, at [email protected] or +1-412-904-6008 for questions or additional information.
Air & Waste Management Association’s Specialty Conference Guideline on Air Quality Models: The Path Forward will provide a technical forum for environmental professionals to discuss the U.S. Environmental Protection Agency's Guideline on Air Quality Models, the guideline that is required for use in the preparation of state implementation plans, federal construction permits, and state permits.
CALL FOR ABSTRACTS! DEADLINE IS OCTOBER 31, 2012
Guideline on Air Quality Models: The Path ForwardMarch 19-21, 2013
www.awma.org
Papers may be on topics discussed at the EPA 10th Modeling Conference, related to the current discussion of changes to the Guideline, or other relevant air quality dispersion modeling topics.
Suggested topics include:
ALL FOR ABSTRC
S! DEADLINE IS OCTCAALL FOR ABSTR
OBER 31, 2012TS! DEADLINE IS OC
OBER 31, 2012
www
gwma.or.aw
Verifier’s Perspective: Jurisdiction with Regulations for GHG Emission Reductions
Copyright 2012 Air & Waste Management Association
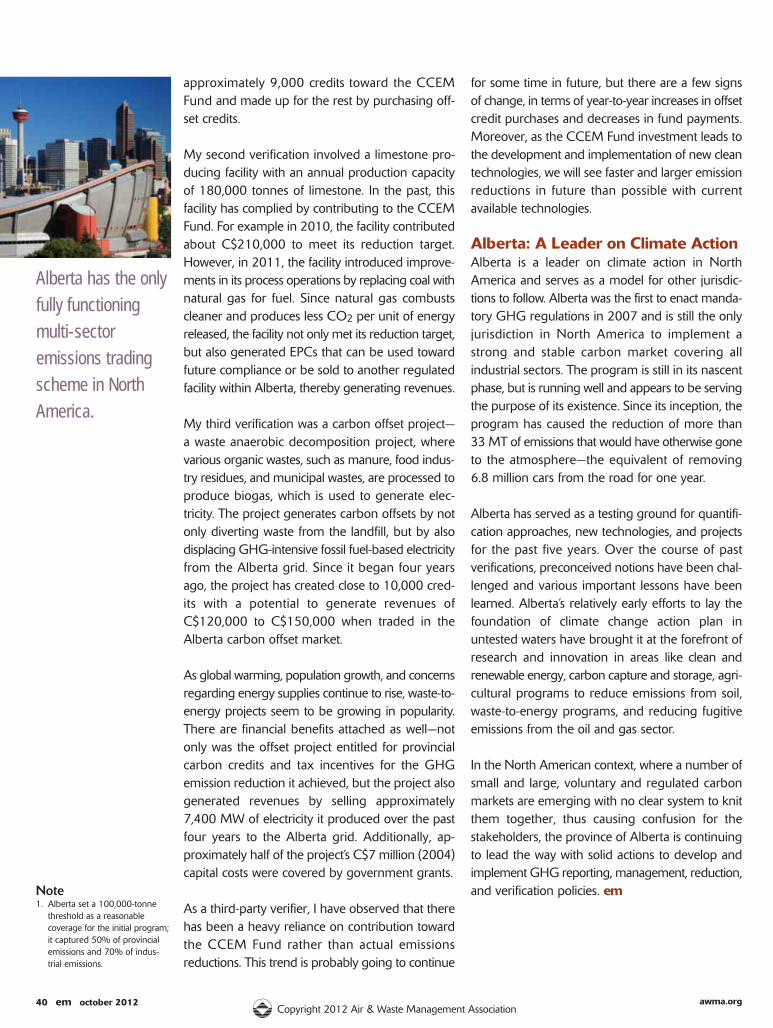
40 em october 2012 awma.orgCopyright 2012 Air & Waste Management Association
approximately 9,000 credits toward the CCEMFund and made up for the rest by purchasing off-set credits.
My second verification involved a limestone pro-ducing facility with an annual production capacityof 180,000 tonnes of limestone. In the past, thisfacility has complied by contributing to the CCEMFund. For example in 2010, the facility contributedabout C$210,000 to meet its reduction target.However, in 2011, the facility introduced improve-ments in its process operations by replacing coal withnatural gas for fuel. Since natural gas combustscleaner and produces less CO2 per unit of energyreleased, the facility not only met its reduction target,but also generated EPCs that can be used towardfuture compliance or be sold to another regulatedfacility within Alberta, thereby generating revenues.
My third verification was a carbon offset project—a waste anaerobic decomposition project, wherevarious organic wastes, such as manure, food indus-try residues, and municipal wastes, are processed toproduce biogas, which is used to generate elec-tricity. The project generates carbon offsets by notonly diverting waste from the landfill, but by alsodisplacing GHG-intensive fossil fuel-based electricityfrom the Alberta grid. Since it began four yearsago, the project has created close to 10,000 cred-its with a potential to generate revenues ofC$120,000 to C$150,000 when traded in the Alberta carbon offset market.
As global warming, population growth, and concernsregarding energy supplies continue to rise, waste-to-energy projects seem to be growing in popularity.There are financial benefits attached as well—notonly was the offset project entitled for provincialcarbon credits and tax incentives for the GHGemission reduction it achieved, but the project alsogenerated revenues by selling approximately7,400 MW of electricity it produced over the pastfour years to the Alberta grid. Additionally, ap-proximately half of the project’s C$7 million (2004)capital costs were covered by government grants.
As a third-party verifier, I have observed that therehas been a heavy reliance on contribution towardthe CCEM Fund rather than actual emissions reductions. This trend is probably going to continue
for some time in future, but there are a few signsof change, in terms of year-to-year increases in offsetcredit purchases and decreases in fund payments.Moreover, as the CCEM Fund investment leads tothe development and implementation of new cleantechnologies, we will see faster and larger emissionreductions in future than possible with currentavailable technologies.
Alberta: A Leader on Climate ActionAlberta is a leader on climate action in NorthAmerica and serves as a model for other jurisdic-tions to follow. Alberta was the first to enact manda-tory GHG regulations in 2007 and is still the onlyjurisdiction in North America to implement astrong and stable carbon market covering all industrial sectors. The program is still in its nascentphase, but is running well and appears to be servingthe purpose of its existence. Since its inception, theprogram has caused the reduction of more than33 MT of emissions that would have otherwise goneto the atmosphere—the equivalent of removing 6.8 million cars from the road for one year.
Alberta has served as a testing ground for quantifi-cation approaches, new technologies, and projectsfor the past five years. Over the course of past verifications, preconceived notions have been chal-lenged and various important lessons have beenlearned. Alberta’s relatively early efforts to lay thefoundation of climate change action plan inuntested waters have brought it at the forefront ofresearch and innovation in areas like clean and renewable energy, carbon capture and storage, agri-cultural programs to reduce emissions from soil,waste-to-energy programs, and reducing fugitiveemissions from the oil and gas sector.
In the North American context, where a number ofsmall and large, voluntary and regulated carbonmarkets are emerging with no clear system to knitthem together, thus causing confusion for thestakeholders, the province of Alberta is continuingto lead the way with solid actions to develop and implement GHG reporting, management, reduction,and verification policies. emNote
1. Alberta set a 100,000-tonnethreshold as a reasonable coverage for the initial program;it captured 50% of provincialemissions and 70% of indus-trial emissions.
Alberta has the only
fully functioning
multi-sector
emissions trading
scheme in North
America.

october 2012 em 41awma.orgCopyright 2012 Air & Waste Management Association
em • canadian report
Canadian Report is compiled with excerpts from EcoLog News and the EcoCompliance.ca newsletter, both published by EcoLog Information Resources Group, a divisionof BIG Information Product LP. For more Canadian environmental information, visit www.ecolog.com. Note: All amounts in Canadian dollars.
BC Natural Gas Industry Supports Investigation Findings on Fracking TremorsIn the name of human and environmental safety, Canada’s natural gas producers have announced support for the recentfindings and recommendations from the British Columbia (BC)Oil and Gas Commission’s investigation into seismic activity fromhydraulic fracking.
From 2009 to 2011, the investigation delved into tremor mon-itoring, data collection, and operator assessments and protocolsin BC’s Horn River Basin, Canada’s largest shale gas field. Expertsestimate there are 250 trillion cubic feet of natural gas in north-east BC, 10%–20% of which could be recoverable.
“Continuing our record of no harm to people or structures isparamount, as is supporting geoscience that can assure landown-ers and the public hydraulic fracturing can and will continuesafely,” said Canadian Association of Petroleum Producers’ Pres-ident, Dave Collyer, in a statement to media August 30, 2012.
Hydraulic fracturing is a process that injects water and other fluids at high pressure significantly below the earth’s surface tocrack shale rocks and produce natural gas. More than 8,000high-volume hydraulic fracturing completions have been per-formed in BC, according to the report Investigation of ObservedSeismicity in the Horn River Basin, by BC Oil and Gas Commis-sion, August 2012 (available at www.bcogc.ca).
The commission found a total of 272 seismic events were“caused by fluid injection during hydraulic fracturing in proximityto preexisting faults,” and noted, “none of the events causedany injury, property damage or posed any risk to public safetyor the environment.” em
New Arctic Research Station Set for Nunavut, PM SaysThe federal government has approved a $188-million CanadianHigh Arctic Research Station in Nunavut’s Cambridge Bay tomonitor the area and ensure environmental stewardship.
The Canadian High Arctic Research Station (CHARS) will be ayear-round multi-disciplinary facility focusing on innovative research into environmental and resource development issues,the federal government announced during the Prime Minister’sseventh annual Northern Tour from August 20 to 24, 2012.
“The North is a fundamental part of Canada’s heritage, future,and identity, and we must continue to assert our sovereigntyover Canada’s Arctic,” said Prime Minister Stephen Harper in astatement to media. “This new station will undertake science andtechnology research that will support the responsible develop-ment of Canada’s North, inform environmental stewardship, andenhance the quality of life of Northerners and all Canadians.”
Beginning in 2017, between 35 and 50 seasonal, part-time, andfull-time staff will be employed to operate the CHARS Scienceand Technology Program at the station. The government says it plans to spend $142.4 million over the next six years on construction, equipment, and start-up costs for the facility and$46.2 million over the next six years on its science and technologyresearch program. The government is budgeting $26.5 million peryear to run the station. em
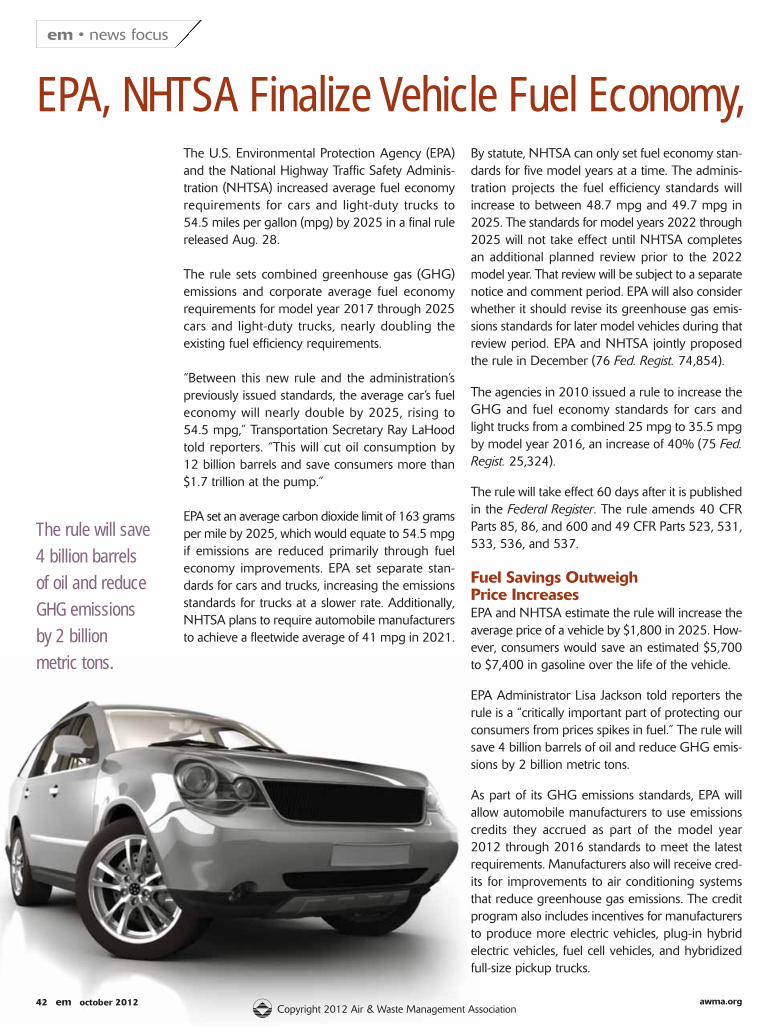
42 em october 2012 awma.orgCopyright 2012 Air & Waste Management Association
em • news focus
By statute, NHTSA can only set fuel economy stan-dards for five model years at a time. The adminis-tration projects the fuel efficiency standards willincrease to between 48.7 mpg and 49.7 mpg in2025. The standards for model years 2022 through2025 will not take effect until NHTSA completesan additional planned review prior to the 2022model year. That review will be subject to a separatenotice and comment period. EPA will also considerwhether it should revise its greenhouse gas emis-sions standards for later model vehicles during thatreview period. EPA and NHTSA jointly proposedthe rule in December (76 Fed. Regist. 74,854).
The agencies in 2010 issued a rule to increase theGHG and fuel economy standards for cars andlight trucks from a combined 25 mpg to 35.5 mpgby model year 2016, an increase of 40% (75 Fed.Regist. 25,324).
The rule will take effect 60 days after it is publishedin the Federal Register. The rule amends 40 CFRParts 85, 86, and 600 and 49 CFR Parts 523, 531,533, 536, and 537.
Fuel Savings Outweigh Price IncreasesEPA and NHTSA estimate the rule will increase theaverage price of a vehicle by $1,800 in 2025. How-ever, consumers would save an estimated $5,700to $7,400 in gasoline over the life of the vehicle.
EPA Administrator Lisa Jackson told reporters therule is a “critically important part of protecting ourconsumers from prices spikes in fuel.” The rule willsave 4 billion barrels of oil and reduce GHG emis-sions by 2 billion metric tons.
As part of its GHG emissions standards, EPA willallow automobile manufacturers to use emissionscredits they accrued as part of the model year2012 through 2016 standards to meet the latestrequirements. Manufacturers also will receive cred-its for improvements to air conditioning systemsthat reduce greenhouse gas emissions. The creditprogram also includes incentives for manufacturersto produce more electric vehicles, plug-in hybridelectric vehicles, fuel cell vehicles, and hybridizedfull-size pickup trucks.
EPA, NHTSA Finalize Vehicle Fuel Economy,The U.S. Environmental Protection Agency (EPA)and the National Highway Traffic Safety Adminis-tration (NHTSA) increased average fuel economyrequirements for cars and light-duty trucks to 54.5 miles per gallon (mpg) by 2025 in a final rulereleased Aug. 28.
The rule sets combined greenhouse gas (GHG)emissions and corporate average fuel economy requirements for model year 2017 through 2025cars and light-duty trucks, nearly doubling the existing fuel efficiency requirements.
“Between this new rule and the administration’spreviously issued standards, the average car’s fueleconomy will nearly double by 2025, rising to 54.5 mpg,” Transportation Secretary Ray LaHoodtold reporters. “This will cut oil consumption by 12 billion barrels and save consumers more than$1.7 trillion at the pump.”
EPA set an average carbon dioxide limit of 163 gramsper mile by 2025, which would equate to 54.5 mpgif emissions are reduced primarily through fueleconomy improvements. EPA set separate stan-dards for cars and trucks, increasing the emissionsstandards for trucks at a slower rate. Additionally,NHTSA plans to require automobile manufacturersto achieve a fleetwide average of 41 mpg in 2021.
The rule will save
4 billion barrels
of oil and reduce
GHG emissions
by 2 billion
metric tons.
october 2012 em 43awma.orgCopyright 2012 Air & Waste Management Association
Manufacturers, Unions Support RuleThe Obama administration negotiated the fueleconomy standards with automakers, unions, California, and environmental groups as part of apush to set a single, national program for vehicleemissions.
“It’s not every century that the auto industry andthe environmental movement agree on anything,but everyone on the spectrum from G.M. to envi-ronmentalists supports these rules,” Daniel Becker,director of the Center for Auto Safety’s Safe Climate Campaign, said in a statement. “Underthese rules, the auto industry can build cleaner,safer cars for Americans and a competitive futurefor itself.”
United Autoworkers President Bob King said in astatement that the standards “provide certainty formanufacturers in planning their investments andcreating jobs in the auto industry as they add morefuel-saving technology to their vehicles.”
Environmental Group WantsStronger StandardsAlthough environmental groups largely praised therule, the Center for Biological Diversity said thestandards are not stringent enough to keep up withChina and Japan, which are moving more aggres-sively to improve fuel efficiency. The flexibility andcredits built into the rule effectively lower the man-dated fuel efficiency, Vera Pardee, an attorney at theCenter for Biological Diversity, told BNA Aug. 28.
“When you think about flexibility, the 54.5 rule is really a fictitious number,” she said. “The standardshould be stronger. When you subtract the flexibilityand credits already given, the standard is really closerto 47 mpg. The flexibility isn’t getting us where weneed to go. These rules need to be tech-forcing.”
The rule also creates incentives for carmakers tobuild larger vehicles because they are subject toless stringent emissions standards, Pardee said. Themore stringent standards for smaller cars will increasetheir retail prices, narrowing the price differencebetween them and larger vehicles, she said. Thatcould actually lead more consumers to buy heavier,
less efficient vehicles, she said. “What we need to dois get the most reductions as quickly as possible,”Pardee said.
Automakers ‘Strong-Armed,’ Issa SaysAlthough automobile manufacturers and unionsboth supported EPA and NHTSA’s regulations,House Oversight and Government Reform Com-mittee Chairman Darrell Issa (R-Calif.) accused theObama administration of “strong-arming” manu-facturers into accepting the rules.
“The administration drafted these standards in secret,strong-arming automakers and short-circuiting thedeliberative regulatory process to achieve a purelypolitical result, abandoning sound science and ob-jectivity to appease its political allies in the extremeenvironmentalist lobby,” he said in a statement.
Issa criticized the standards in an Aug. 10 report,saying the rule would increase vehicle costs, limitconsumer choice, and compromise safety. The reportalso criticized the role environmental groups andthe California Air Resources Board played in negotiating the vehicle standards. EPA had givenCalifornia two U.S. Clean Air Act waivers thatwould have allowed it to set its own GHG emis-sions standards. Automobile manufacturers saidthey favor the single national standard rather thana patchwork of state regulations.
“The Auto Alliance has called for a single, nationalprogram because conflicting requirements fromseveral regulatory bodies raise costs, ultimately tak-ing money out of consumers’ pockets and hurtingsales,” the Alliance of Automobile Manufacturerssaid in a statement. “We all want to get more fuel-efficient autos on our roads, and a single, nationalprogram with a strong midterm review helps usget closer to that shared goal.”
EPA and NHTSA’s final fuel economy rule is availableat www.epa.gov/oms/climate/documents/2017-2025-ghg-cafe-standards-frm.pdf.—By AndrewChilders, Bloomberg BNA em
Carbon Emissions Standards
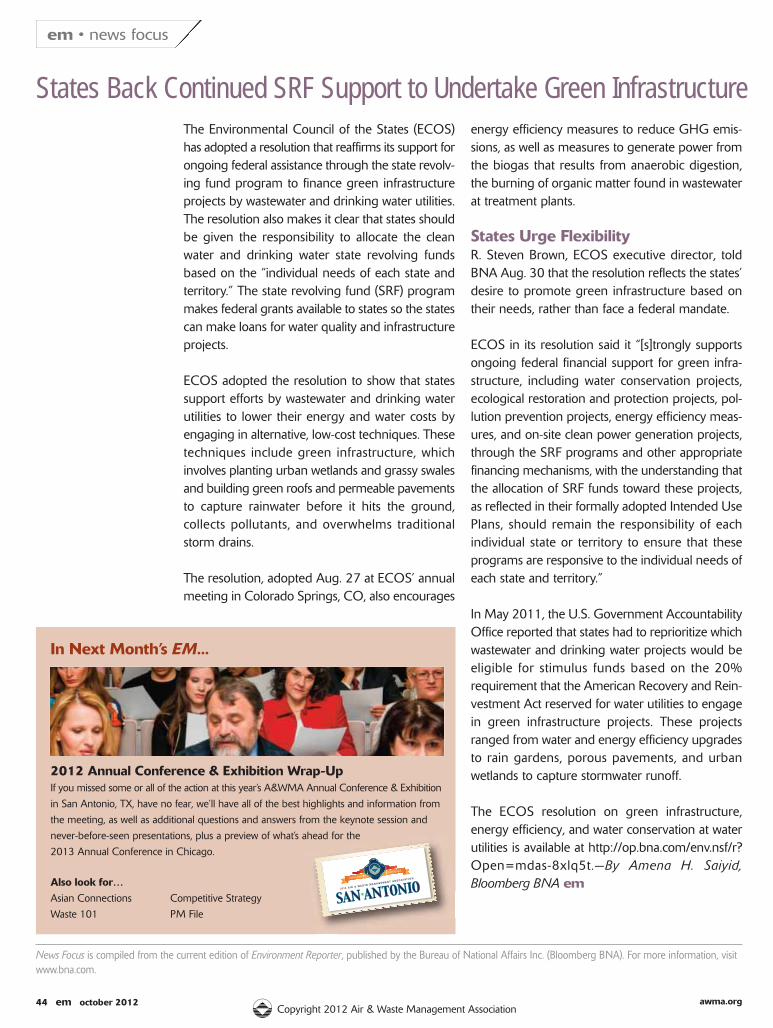
44 em october 2012 awma.orgCopyright 2012 Air & Waste Management Association
em • news focus
energy efficiency measures to reduce GHG emis-sions, as well as measures to generate power fromthe biogas that results from anaerobic digestion,the burning of organic matter found in wastewaterat treatment plants.
States Urge FlexibilityR. Steven Brown, ECOS executive director, toldBNA Aug. 30 that the resolution reflects the states’desire to promote green infrastructure based ontheir needs, rather than face a federal mandate.
ECOS in its resolution said it “[s]trongly supportsongoing federal financial support for green infra-structure, including water conservation projects,ecological restoration and protection projects, pol-lution prevention projects, energy efficiency meas-ures, and on-site clean power generation projects,through the SRF programs and other appropriatefinancing mechanisms, with the understanding thatthe allocation of SRF funds toward these projects,as reflected in their formally adopted Intended UsePlans, should remain the responsibility of each individual state or territory to ensure that these programs are responsive to the individual needs ofeach state and territory.”
In May 2011, the U.S. Government AccountabilityOffice reported that states had to reprioritize whichwastewater and drinking water projects would beeligible for stimulus funds based on the 20% requirement that the American Recovery and Rein-vestment Act reserved for water utilities to engagein green infrastructure projects. These projectsranged from water and energy efficiency upgradesto rain gardens, porous pavements, and urban wetlands to capture stormwater runoff.
The ECOS resolution on green infrastructure, energy efficiency, and water conservation at waterutilities is available at http://op.bna.com/env.nsf/r?Open=mdas-8xlq5t.—By Amena H. Saiyid,Bloomberg BNA em
States Back Continued SRF Support to Undertake Green InfrastructureThe Environmental Council of the States (ECOS)has adopted a resolution that reaffirms its support forongoing federal assistance through the state revolv-ing fund program to finance green infrastructureprojects by wastewater and drinking water utilities.The resolution also makes it clear that states shouldbe given the responsibility to allocate the cleanwater and drinking water state revolving fundsbased on the “individual needs of each state andterritory.” The state revolving fund (SRF) programmakes federal grants available to states so the statescan make loans for water quality and infrastructureprojects.
ECOS adopted the resolution to show that statessupport efforts by wastewater and drinking waterutilities to lower their energy and water costs byengaging in alternative, low-cost techniques. Thesetechniques include green infrastructure, which involves planting urban wetlands and grassy swalesand building green roofs and permeable pavementsto capture rainwater before it hits the ground, collects pollutants, and overwhelms traditionalstorm drains.
The resolution, adopted Aug. 27 at ECOS’ annualmeeting in Colorado Springs, CO, also encourages
News Focus is compiled from the current edition of Environment Reporter, published by the Bureau of National Affairs Inc. (Bloomberg BNA). For more information, visitwww.bna.com.
2012 Annual Conference & Exhibition Wrap-UpIf you missed some or all of the action at this year’s A&WMA Annual Conference & Exhibitionin San Antonio, TX, have no fear, we’ll have all of the best highlights and information fromthe meeting, as well as additional questions and answers from the keynote session andnever-before-seen presentations, plus a preview of what’s ahead for the2013 Annual Conference in Chicago.
Also look for…Asian Connections Competitive StrategyWaste 101 PM File
In Next Month’s EM...
CONFERENCE
105TH ANNUALC
AL
Here’s just a sampling of the benefits you receive as an A&WMA Member:
Quality Information: from the Journal of the Air & Waste Management Association to EMmagazine to technical books and publications, you get the technical, practical, and professionalinformation you need.
Professional Development and Education: improve your professional skills and expertise atmore than 30 continuing education programs, specialty conferences, and a wide variety ofworkshops held each year, in addition to the Annual Conference & Exhibition.
Networking and Contacts: take advantage of numerous opportunities to meet with yourpeers and expand your circle of valuable business contacts.
Job Search and Employment: find a position in the environmental field or fill a vacancy inyour organization through our online job board.
Membership and Resource Directories: your quick reference for finding colleagues and arange of products and services.
Discounts: members receive substantial discounts on publications, conferences, educationalseminars, insurance coverage, logo merchandise, and more.
Recognition: get recognized for your accomplishments through the A&WMA awards programs, publishing an article in EM or the Journal, or serving on an A&WMA committee.
A&WMAMembership Benefits
For more information on these great member benefits, contact A&WMA Member Services at 1-800-270-3444 or visit us online at www.awma.org.

CALL FOR ABSTRACTS
Call for Abstracts
Abstracts Due
Technical Program Timeline
OR ABSCALL F TRAOR ABS STCTRAOR ABSCALL F TRAOR ABS STCTRA
actstrsor AbCall f
ogral PrechnicTTe am Timelineogr
acts DuetrsAb
al Program Chairechnicat Brush, TTePal Program Vicechnicalina, TTeDale KKa
al Program Chaire Chairal Program Vic
46 em october 2012 awma.orgCopyright 2012 Air & Waste Management Association
categories
parentheses)
Chicago Area
conference must register for the conference and pay the
2013 ANNUAL CONFERENCE
october 2012 em 47awma.orgCopyright 2012 Air & Waste Management Association
48 em october 2012 awma.orgCopyright 2012 Air & Waste Management Association
Events sponsored and cosponsored by the Air& Waste Management Association (A&WMA)are highlighted in bold.For more information,call A&WMA MemberServices at 1-800-270-3444 or visit theA&WMA Events Website:www.awma.org/events.
To add your events tothis calendar, send to:Calendar Listings, Air &Waste Management Association, One GatewayCenter, 3rd Floor, 420Fort Duquesne Blvd.,Pittsburgh, PA 15222-1435. Calendar listingsare published on a space-available basis andshould be received byA&WMA’s editorial officesat least three months inadvance of publication.
em • calendar of events
Listed here are the papers appearing in theOctober 2012 issue of EM's sister publication,the Journal of the Air & Waste Management Association. For more information, go to www.tandfonline.com/UAWM.
OCTOBER 2012 • VOLUME 62
JOURNAL
Multispecies remote-sensing measurements ofvehicle emissions on Sherman Way in Van Nuys, CA
Comparison of the MOVES2010a, MOBILE6.2,and EMFAC2007 Mobile Source Emissions Models with on-road traffic tunnel and remote-sensing measurements
Modeling an air pollution episode in northwesternUnited States: Identifying the effect of nitrogenoxide and volatile organic compound emissionchanges on air pollutants formation using directsensitivity analysis
Optimization of a horizontal flow biofilm reactorfor the removal of methane at low temperatures
The addition of modified attapulgite reduces theemission of nitrous oxide and ammonia fromaerobically composted chicken manure
Exposure to airborne ultrafine particles fromcooking in Portuguese homes
Air impacts from three alternatives for producingJP-8 jet fuel
Effects of activated carbon surface properties onthe adsorption of volatile organic compounds
Comparison of the purification performance andmicrobial community functional diversity in FDSand UF biotrickling filters
Gas-phase elemental mercury removal in a simulated combustion flue gas using TiO2 withfluorescent light
Winter and summer PM2.5 chemical composi-tions in fourteen Chinese cities
Adsorption behavior of Toluene on a modified13X molecular sieve
2012OCTOBER14–16 Annual Conference of the A&WMA
Florida Section, Crystal River, FL; www.flawma.com/conference.html
22–24 Thermal Treatment Technologies/Hazardous Waste Combustors, New Orleans, LA
Oct. 28 2012 AIChE Annual Meeting, Pittsburgh,–Nov. 2 PA; www.aiche.org
NOVEMBER1–2 AIChE/A&WMA Joint Workshop: Shale
Oil and Gas E&P – Water Challengesand Opportunities, Pittsburgh, PA;www.aiche.org
7–9 A&WMA’s Pacific Northwest InternationalSection (PNWIS) 2012 Annual Confer-ence—The Crossroads of the Environmentand Economy, Portland, OR; http://oregonawma.org/pnwis-2012/
13–14 Understanding Today’s Clean Air ActPermit Programs Workshop, Hartford, CT
27–28 37th Annual EPA–A&WMA Information Exchange, Research Triangle Park, NC
DECEMBER5–7 Better Air Quality Conference 2012,
Hong Kong, www.baq2012.org
2013FEBRUARY19 A&WMA's Midwest Section Annual
Conference, Overland Park, KS
JUNE25–28 A&WMA's 106th Annual
Conference & Exhibition, Chicago, IL
Printed on Recycled Paper

SAVETHE
DATE
Mark your calendars now and plan to join us in Chicago for the environmental industries’ premier education, networking, and solutionsevent where you will enhance your knowledge and network with fellowenvironmental professionals from around the world.
The conference will feature a technical program boasting over 500 speakers, hundreds of exhibitors displaying the newest products and services, social tours and networking events, and professional development courses taught by leading instructors.
Join us and be a part of a global conversation that will drive environmental progress.
A&WMA’s 106th Annual Conference & Exhibition
TOWARDS SUSTAINABILITY June 25-28th, 2013Hyatt Regency ChicagoChicago, Illinois
www.awma.org