Embed Size (px)
DESCRIPTION
En la cabeza asasdasd asdasd asdasdasd asda s sasaas asdasdas dasdasda a s d a s d a sdas asdasdlkjs lkjas dlkjas dowepoiq wepoiqw peoi aposdi paosid paosid paosi dpoias dpoais dpoaisd paoisd paoiepeeoipwoeipqowie poqiwe pqoiwe pqowie poie p23oi po1i23 p1oi23 1po2i3 p1oi23 pqowie poqiwe poiqw epoiqwpeoi pqowiep qwiepoqiwpe qoiwpoe pqowieqweww
Citation preview
Hong Kong Poverty Situation Report 2012Table of Contents
i
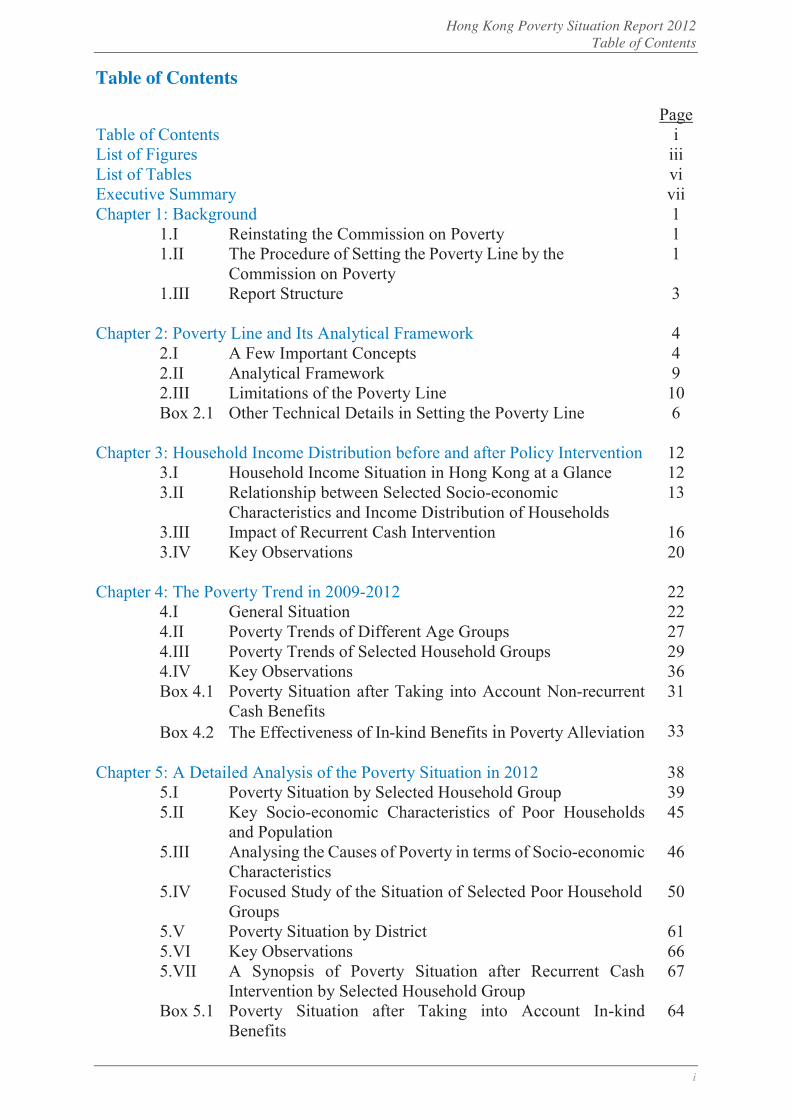
Table of Contents
Page Table of Contents i List of Figures iii List of Tables vi Executive Summary vii Chapter 1: Background 1 1.I Reinstating the Commission on Poverty 1 1.II The Procedure of Setting the Poverty Line by the
Commission on Poverty 1
1.III Report Structure 3 Chapter 2: Poverty Line and Its Analytical Framework 4 2.I A Few Important Concepts 4 2.II Analytical Framework 9 2.III Limitations of the Poverty Line 10 Box 2.1 Other Technical Details in Setting the Poverty Line 6 Chapter 3: Household Income Distribution before and after Policy Intervention 12 3.I Household Income Situation in Hong Kong at a Glance 12 3.II Relationship between Selected Socio-economic
Characteristics and Income Distribution of Households 13
3.III Impact of Recurrent Cash Intervention 16 3.IV Key Observations 20 Chapter 4: The Poverty Trend in 2009-2012 22 4.I General Situation 22 4.II Poverty Trends of Different Age Groups 27 4.III Poverty Trends of Selected Household Groups 29 4.IV Key Observations 36 Box 4.1 Poverty Situation after Taking into Account Non-recurrent
Cash Benefits 31
Box 4.2 The Effectiveness of In-kind Benefits in Poverty Alleviation
33
Chapter 5: A Detailed Analysis of the Poverty Situation in 2012 38 5.I Poverty Situation by Selected Household Group 39 5.II Key Socio-economic Characteristics of Poor Households
and Population 45
5.III Analysing the Causes of Poverty in terms of Socio-economic Characteristics
46
5.IV Focused Study of the Situation of Selected Poor Household Groups
50
5.V Poverty Situation by District 61 5.VI Key Observations 66 5.VII A Synopsis of Poverty Situation after Recurrent Cash
Intervention by Selected Household Group 67
Box 5.1 Poverty Situation after Taking into Account In-kind Benefits
64
Hong Kong Poverty Situation Report 2012Table of Contents
ii
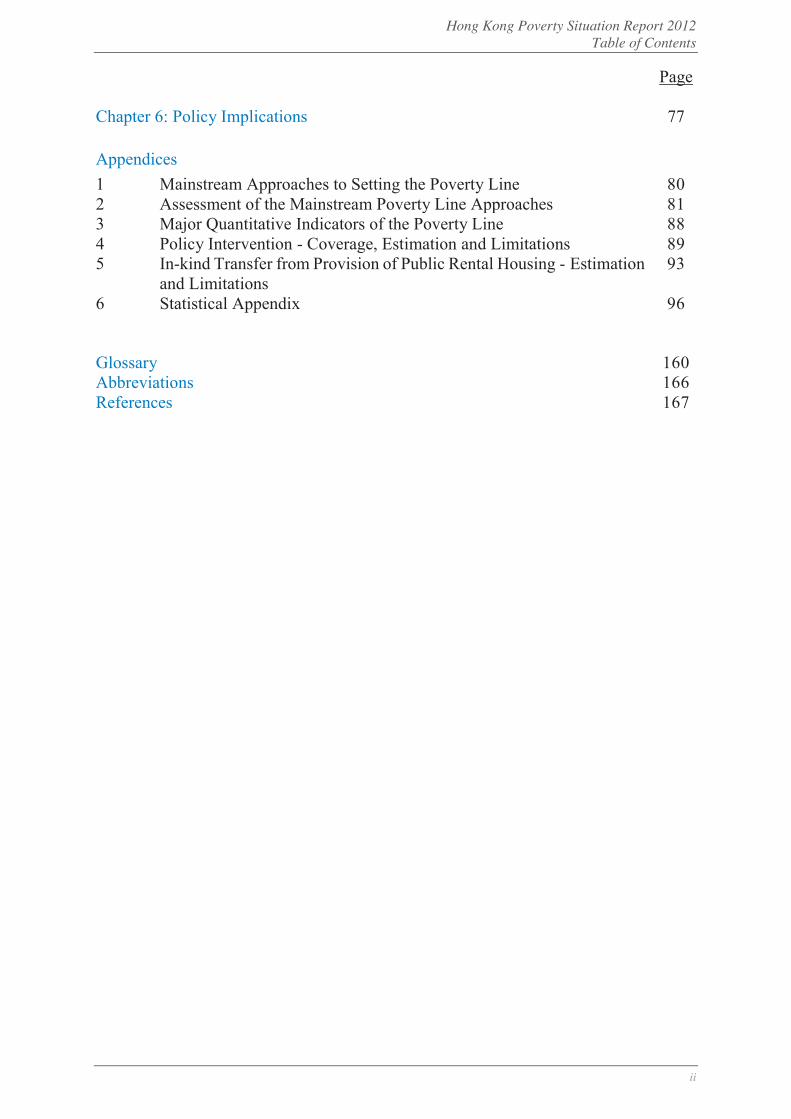
Page Chapter 6: Policy Implications 77 Appendices 1 Mainstream Approaches to Setting the Poverty Line 80 2 Assessment of the Mainstream Poverty Line Approaches 81 3 Major Quantitative Indicators of the Poverty Line 88 4 Policy Intervention - Coverage, Estimation and Limitations 89 5 In-kind Transfer from Provision of Public Rental Housing - Estimation
and Limitations 93
6 Statistical Appendix 96
Glossary 160 Abbreviations 166 References 167
Report on the Poverty Situation in Hong Kong 2012List of Figures
iii
List of Figures
Page
Figure 2.1 The poverty line by household size, 2009-2012 4 Figure 2.2 Schematic representation of pre- and post-intervention
household income 7
Figure 2.3 Schematic representation of the poverty line and its analytical framework
9
Figure 3.1 Pre-intervention household income distribution by household size, 2012
14
Figure 3.2 Pre-intervention household income distribution by economic activity status, 2012
15
Figure 3.3 Pre-intervention household income distribution by type of housing, 2012
16
Figure 3.4 Key statistics of household income, 2009-2012 17 Figure 3.5 Pre-intervention household income distribution, by whether
receiving recurrent cash benefits, 2012 18
Figure 3.6 Pre- and post-intervention household income distribution, 2012
18
Figure 3.7 Pre- and post-intervention household income distribution by household size, 2012
19
Figure 4.1 Labour market situation: unemployment rate, wages and average employment earnings
22
Figure 4.2 Poor population and poverty rate, 2009-2012 23 Figure 4.3 The poverty line by household size, 2009-2012 23 Figure 4.4 Poverty gaps, 2009-2012 24 Figure 4.5 Effectiveness of recurrent cash benefits in alleviating poverty,
2009-2012 25
Figure 4.6 Government expenditure on social security payments, 2009/10-2012/13
26
Figure 4.7 Effectiveness of selected recurrent cash benefits in alleviating poverty, 2012
27
Figure 4.8 Poor population and poverty rate by age, 2009-2012 28 Figure 4.9 Poor population and poverty rate by economic activity status,
2009-2012 29
Figure 4.10 Total annual poverty gap by economic activity status, 2009-2012
30
Figure 4.11 Poor population and poverty rate after taking into account non-recurrent cash benefits, 2009-2012
31
Report on the Poverty Situation in Hong Kong 2012List of Figures
iv
Page Figure 4.12 Effectiveness of non-recurrent cash benefits in alleviating
poverty, 2009-2012 32
Figure 4.13 Poor population and poverty rate after taking into account in-kind benefits, 2009-2012
34
Figure 4.14 Effectiveness of in-kind benefits in alleviating poverty, 2009-2012
35
Figure 4.15 Comparison of effectiveness in poverty alleviation, PRH provision and recurrent cash benefits, 2012
35
Figure 5.1 Selected socio-economic household groups under the analytical framework endorsed by CoP
38
Figure 5.2 Poor population by selected socio-economic household group 40 Figure 5.3 Poverty rate by selected socio-economic household group 41 Figure 5.4 Poor population by type of housing 43 Figure 5.5 Poverty rate by type of housing 43 Figure 5.6 Number of poor households by household size 44 Figure 5.7 Poverty rate by household size 44 Figure 5.8 Selected socio-economic characteristics of poor households 45 Figure 5.9 Selected socio-economic characteristics of poor population 46 Figure 5.10 Proportion of full-time workers and poverty rate 47 Figure 5.11 Poverty rate by number of employed persons in a household 48 Figure 5.12 Proportions of dependants and economically inactive persons
in poor households 48
Figure 5.13 Poverty rate by number of children in a household 49 Figure 5.14 Poverty rate by number of economically inactive elders in a
household 50
Figure 5.15 Selected socio-economic characteristics of working and unemployed poor households
52
Figure 5.16 Working poor households by number of employed persons and by number of children in a household
53
Figure 5.17 Poverty rate of working households by household size 53 Figure 5.18 Selected socio-economic characteristics of single-parent and
new-arrival poor households 54
Figure 5.19 Selected socio-economic characteristics of elderly and economically inactive poor households
56
Figure 5.20 Poor households without economic needs and those as owner-occupiers without mortgages or loans
57
Figure 5.21 Overall 1-person households by economic activity status 58
Report on the Poverty Situation in Hong Kong 2012List of Figures
v
Page Figure 5.22 Poor population of 1-person households by selected socio-
economic household group 59
Figure 5.23 Poverty rate of 1-person households by selected socio-economic household group
59
Figure 5.24 Poor population of 1-person households by economic activity status
60
Figure 5.25 Poor population of 1-person households by type of housing and by whether receiving CSSA
60
Figure 5.26 Poor population by District Council district 61 Figure 5.27 Poverty rate by District Council district 61 Figure 5.28 Poverty map by District Council district 62 Figure 5.29 Poverty map showing districts with above-average poverty
rates 63
Figure A.1 Methodology of estimating the in-kind transfer of PRH provision
94

Report on the Poverty Situation in Hong Kong 2012List of Tables
vi
List of Tables
Page
Table 2.1 Four selected key household characteristics for focused analysis under the analytical framework
10
Table 3.1 Pre-intervention household income, 2009-2012 13 Table 4.1 Estimated transfers and impact on poverty alleviation by
policy category, 2012 36
Table 5.1 CSSA poor households by selected socio-economic household group
42
Table 5.2 Selected poor household groups for focused analysis 51 Table 5.3 Selected types of working poor households 55 Table 5.4 Changes in poverty indicators after the inclusion of in-kind
benefits 64
Table 5.5 Comparison of selected characteristics of the poor under different types of household income
65
Table A.1 Mainstream approaches to setting the poverty line 80 Table A.2 Assessment of the feasibility and practicability of various
poverty line approaches based on five guiding principles 81
Table A.3 Existing statistical surveys related to household income / expenditure
83
Table A.4 Assessment of the feasibility and practicability of mainstream poverty line approaches
85
Table A.5 Major quantitative indicators of the poverty line 88 Table A.6 Detailed coverage of policy measures recommended by CoP 91
Report on the Poverty Situation in Hong Kong 2012Executive Summary
vii
Executive Summary
Background
ES.1 To better understand Hong Kong’s poverty situation and to more effectively support the formulation of poverty alleviation policies, the current term Government has reinstated the Commission on Poverty (CoP). One of the tasks undertaken by CoP is to set a “poverty line” appropriate to Hong Kong’s unique circumstances. This unprecedented move demonstrates the Government’s commitment to poverty alleviation. In this exercise, CoP agreed on the three major functions of poverty line: viz. analysing the poverty situation, assisting policy formulation, and assessing policy effectiveness; together with five guiding principles (ready measurability, international comparability, regular data availability, cost-effectiveness, and amenability to compilation and interpretation).
Poverty Line and Its Analytical Framework
ES.2 CoP has made reference to international experience and solicited views from academics, non-governmental organisations and members of the public in deliberating the poverty line. After rounds of discussions, CoP has reached a general consensus on the proposal of: adopting the concept of “relative poverty”, with household income before policy intervention (i.e. remove the impact of taxation and cash transfer) as the basis for measurement, and setting the main poverty line at 50% of median household income by household size. Yet, no matter what approach is adopted in setting the poverty line, there are bound to be limitations, in particular, since household assets / liabilities are not taken into account, the poverty line cannot be taken to be a poverty alleviation line.
ES.3 Statistics for poverty analysis are mainly sourced from the General Household Survey of the Census and Statistics Department. Apart from supplying key overall poverty indicators (e.g. poor population and poverty rate), the data can facilitate identification and quantification of the poverty situation, and support further analysis of various underprivileged groups, such as elderly, single-parent and working poor households, so as to understand the different forms and causes of poverty. By comparing poverty statistics before and after government policy intervention, it is also possible to assess the effectiveness of poverty alleviation policies on different segments of the community.
Report on the Poverty Situation in Hong Kong 2012Executive Summary
viii
Household Income Distribution before and after Policy Intervention
ES.4 To start with, it is useful to have a general idea on the household income distribution before and after policy intervention prior to entering into the detailed analyses of poverty indicators and the socio-economic characteristics of the poor. Thanks to the tight labour market with low unemployment rate, employment earnings of grassroots workers have improved visibly over the past few years. The pre-intervention household income likewise exhibited a broad-based improvement. However, with the emergence of other socio-economic structural change which pulled most economically inactive and elderly households to the lowest end of the income distribution, overall income growth of the lower-income households was far less favourable than the higher-income counterpart, mostly being employed households.
ES.5 The 2012 household income data suggest a certain relationship between socio-economic characteristics and household income distribution. Household income is highly correlated with its size: in general, the larger the household size, the higher is the income. Members in elderly and economically inactive households are mostly retired or workless due to long-term illness or other reasons, so they are in lack of employment earnings and usually enter into the lowest segment of the distribution. Given a relative poverty line that employs income as the sole benchmark, the poverty incidence would tend to be higher for those elderly and economically inactive households.
ES.6 Comparing the income distribution by household size before and after policy intervention, recurrent cash measures are clearly found to have a significant income-redistribution effect. Most lower-income households have visibly benefited from these measures, leading to a significant increase in post-intervention household income, pulling some to or even above the poverty line. Nevertheless, a considerable number of households remain poor after policy intervention. Some of these households are even found to receive no benefits. We must therefore closely monitor the poverty statistics of such households, and conduct an in-depth and comprehensive analysis with respect to their socio-economic characteristics.
The Poverty Trend in 2009-2012
ES.7 The persistently sturdy labour market and implementation of the statutory minimum wage in 2011 have brought about a visible improvement in earnings of grassroots workers over the past few years. In the light of this, the corresponding sizes of the poor population and poverty rates before and
Report on the Poverty Situation in Hong Kong 2012Executive Summary
ix
after policy intervention in 2012 wereNote:
Before policy intervention: 1.31 million and 19.6%;
After policy intervention (recurrent cash): 1.02 million and 15.2%;
After policy intervention (recurrent + non-recurrent cash): 0.80 million and 12.0%; and
After policy intervention (recurrent cash + in-kind): 0.67 million and 10.1%, among which the provision of public rental housing contributed most to the estimation of in-kind benefits.
ES.8 Hence, in spite of the upshifted poverty line thresholds due to increased median household income amid steady economic growth (Figure 4.3), the number of poor households, poor population and its corresponding poverty rate, both before and after policy intervention, have decreased over the period, reflecting a general improvement in Hong Kong’s poverty situation. Take the 2012 poor population and poverty rate after recurrent cash intervention as an example, the figures are broadly similar to those in 2011 (1.01 million and 15.2% respectively), yet both lower than those in 2009 (1.04 million and 16.0%).
ES.9 The Government attaches great importance to poverty alleviation and has been allocating substantial resources to various welfare and support programmes. Comparing poverty statistics before and after recurrent cash policy intervention reveals that recurrent cash benefits have lifted 0.29 million to 0.31 million people out of poverty between 2009 and 2012, and reduced the poverty rate by 4.4 to 4.6 percentage points, reflecting a stable magnitude of poverty alleviation by these measures. Such magnitude would be even greater if non-recurrent cash benefits or in-kind benefits have been taken into account.
ES.10 Since the income distributions of economically active and inactive households are obviously different, they should be separately studied when analysing changes in poverty indicators. While the decrease in poor population in economically active households has much to do with economic growth and improvement in income of grassroots, the increase in poor population in economically inactive households is partly due to a rise in number of retired elders amid population ageing. This has offset, to some
Note The poverty figures after policy intervention which take into account non-recurrent cash and in-kind
benefits are for supplementary information only. In particular, the estimation of in-kind transfer from the provision of public rental housing (PRH) is considered controversial during CoP’s deliberation. Given its complexity, it is decided that focus should be on figures before and after recurrent cash intervention. Further research on how to enhance the estimation of PRH provision is necessary before incorporating it into the core analytical framework of poverty line.
Report on the Poverty Situation in Hong Kong 2012Executive Summary
x
extent, the improvement in overall poverty situation.
A Detailed Analysis of the Poverty Situation in 2012
ES.11 In 2012, Hong Kong’s poor population and poverty rate after recurrent cash intervention improved notably as compared with the figures before policy intervention. The effect of recurrent cash benefits was widespread, but the extent of poverty among selected household groups and the impact of these benefits could vary, depending on households’ socio-economic characteristics (such as housing type, household size and the district residing in). Working households had below-average poverty rate, yet there were still 537 500 persons living therein, contributing to 52.8% of the total poor population. Specific groups (such as new-arrival and with-children households) among these working households had low take-up rates of Comprehensive Social Security Assistance, with the post-intervention poverty rates remaining at relatively high levels. The Government might need to provide further assistance to them.
ES.12 A comparison of the characteristics of various household groups suggests that employment is crucial to reducing poverty risk. Generally, the larger the number of working members in a household, the lower its poverty risk. On the other hand, the larger the number of dependants (e.g. children or the elderly) in a household, the heavier would be its burden, and the higher its poverty risk. The number of dependants in a household may also affect other household members’ employment conditions.
ES.13 Similar findings emerge from a detailed analysis of the socio-economic characteristics of selected poor household groups. For instance, most working poor households only have one breadwinner but have one or more children to look after. Unemployed households are at higher poverty risk, as they will lose the means of living if their only wage earners become unemployed. For those with unique characteristics such as single-parent and new-arrival poor households, their family burden and employment status remain matters of concern.
ES.14 Economically inactive and elderly households mostly comprise retired members in lack of employment earnings. As a result, their household incomes are low, and their poverty rates are high, contributing a significant portion to total poor population. Yet, to some extent, this reflects the limitations of poverty line which measures poverty solely based on income. Survey data suggest that some of these poor households may have assets with little financial needs. With an ageing population in Hong Kong, such limitations may become more apparent when there is a persistently growing
Report on the Poverty Situation in Hong Kong 2012Executive Summary
xi
number of “asset-rich, income-poor” retired elders.
Policy Implications
ES.15 Setting a poverty line for Hong Kong could help the Government better understand the features and underlying causes of poverty, with a view to formulating targeted poverty alleviation measures to help different poverty groups in need. It also provides an objective tool for policy analysis and assessment, useful for devising more appropriate and effective initiatives. Through a quantitative assessment of policy effectiveness, i.e. analysing the changes in poverty estimates before and after intervention, policies implemented or under deliberation can be reviewed and further enhanced.
ES.16 Upon the completion of setting the poverty line, the Government will continue to review existing policies and gauge the views of different sectors, so as to provide targeted assistance to various needy groups as early as possible, with a view to achieving the objectives of poverty alleviation and prevention. Looking ahead the poverty situation in 2013, the burden of poor households should be further eased by virtue of a largely steady macroeconomic environment, a labour market virtually in a state of full employment, and a variety of new poverty alleviation measures launched by the Government.

Hong Kong Poverty Situation Report 2012 Chapter 1: Background
P. 1
1 Background
1.1 The Government of the Hong Kong Special Administrative Region (HKSAR) attaches great importance to the local poverty situation and poverty alleviation. The guiding principle of the current Government in regard to poverty alleviation, as set out in the election manifesto of the Chief Executive (CE), is to foster a balanced economic growth where different strata of the society can share the fruits of economic development, and to develop a sustainable social welfare system to help the needy. In his 2013 Policy Address, CE undertook to help the underprivileged capable of working by offering them opportunities to become self-reliant and improve their livelihood, and to devote public resources to those who cannot provide for themselves1.
1.I Reinstating the Commission on Poverty
1.2 The Preparatory Task Force on the Commission on Poverty led by CE believed that for a better understanding of the poor population and a more effective formulation of poverty alleviation measures, the first step is to set a “poverty line” with broad consensus that reflects the actual situation in Hong Kong. This move signifies the current Government’s strong commitment to tackling poverty. The reinstated Commission on Poverty (CoP) is responsible for carrying out this important task.
1.3 CoP, under the chairmanship of the Chief Secretary for Administration, has a broad representation comprising 18 non-official members with different backgrounds appointed by CE and four secretaries of policy bureaux. Six Task Forces have been established under CoP to discuss specific areas and conduct related in-depth studies. After setting the poverty line, CoP will undertake an overall review of the features and causes of poverty, and systematically explore ways to address and alleviate various poverty issues.
1.II The Procedure of Setting the Poverty Line by the Commission on Poverty
1.4 CoP considered that a poverty line may not just serve as a tool to monitor the poverty situation and assess the effectiveness of poverty alleviation policies, but can also facilitate policy deliberation and formulation of targeted poverty relief measures. Therefore, the setting of a poverty line that matches Hong
1 See page 46 of the Manifesto for the Chief Executive Election 2012 and paragraph 92 of the 2013 Policy
Address.
Hong Kong Poverty Situation Report 2012 Chapter 1: Background
P. 2
Kong’s unique circumstances and practical needs is a significant first step for poverty alleviation.
1.5 CoP and its Social Security and Retirement Protection Task Force (the Task Force) convened several rounds of meetings between December 2012 and May 2013, and reached a consensus on the functions, guiding principles and related details of setting the poverty line after thorough discussions.
1.6 The poverty line should perform three major functions:
(i) To analyse the poverty situation: quantifying the poverty situation in Hong Kong, with focused analyses of various groups below the poverty line and thorough study of the forms and manners by which poverty is manifested and their underlying causes;
(ii) To assist policy formulation: serving as a guiding reference for formulation of more appropriate and effective policy initiatives that can cater for the needs of various underprivileged groups given limited resources; and
(iii) To assess policy effectiveness: enabling quantitative assessment of the effectiveness of Government’s poverty alleviation measures for the needy.
1.7 Five guiding principles on setting the poverty line:
(i) Measurability: the poverty line should be in line with the socio-economic characteristics specific to the local context. The poverty line should be readily adjusted for structural changes in the society so that it can continue to serve as an effective tool for a reliable statistical measurement of poverty;
(ii) International comparability: the formulation of poverty line should make reference to the prevailing international practices to the extent possible, so as to ensure credibility, recognition, comparability and practicability;
(iii) Data availability: data should be available on a regular basis, so as to render periodic updates in quantifying the poverty situation for long-term and systematic monitoring;
(iv) Cost-effectiveness: in order to provide timely analysis of the latest situation, the resources and time required to carry out a full compilation cycle (from data collection to results analysis) should be considered manageable; and
Hong Kong Poverty Situation Report 2012 Chapter 1: Background
P. 3
(v) Compilation and interpretation: poverty measurements in quantitative indicators should be simple and easy to understand, so as to facilitate the public to thoroughly understand the crux of the issue.
1.8 Various sectors in the community have shown great concern about CoP’s task of setting the poverty line. The Government and Members of the Legislative Council (LegCo) exchanged views on related issues through the Subcommittee on Poverty under the House Committee of LegCo (the Subcommittee). In December 2012 and April 2013, the Subcommittee held two public hearings, inviting deputations from various non-governmental organisations (NGOs), political parties and the general public to give comments on the setting of a poverty line2.
1.III Report Structure
1.9 This Report gives an analysis of the poverty situation in Hong Kong in the ensuing chapters:
Chapter 2 briefly describes the poverty line and its analytical framework established according to the unique circumstances of Hong Kong for measuring poverty, assessing policy effectiveness and providing policy directions.
Chapter 3 analyses the relationship between income distribution and key socio-economic characteristics of households, and the impact of recurrent cash intervention on income distribution.
Chapter 4 examines the poverty trend in Hong Kong between 2009 and 2012 based on a set of poverty indicators before and after policy intervention.
Chapter 5 provides an in-depth study of Hong Kong’s poverty situation in 2012, with a view to understanding the underlying causes of poverty by analysing the characteristics of households and persons with income below the poverty line even after policy intervention.
Chapter 6 concludes by providing policy implications according to the results of the analysis.
2 More than 70 organisations participated in each of the two public hearings.
Hong Kong Poverty Situation Report 2012 Chapter 2: Poverty Line and Its Analytical Framework
P. 4
2 Poverty Line and Its Analytical Framework
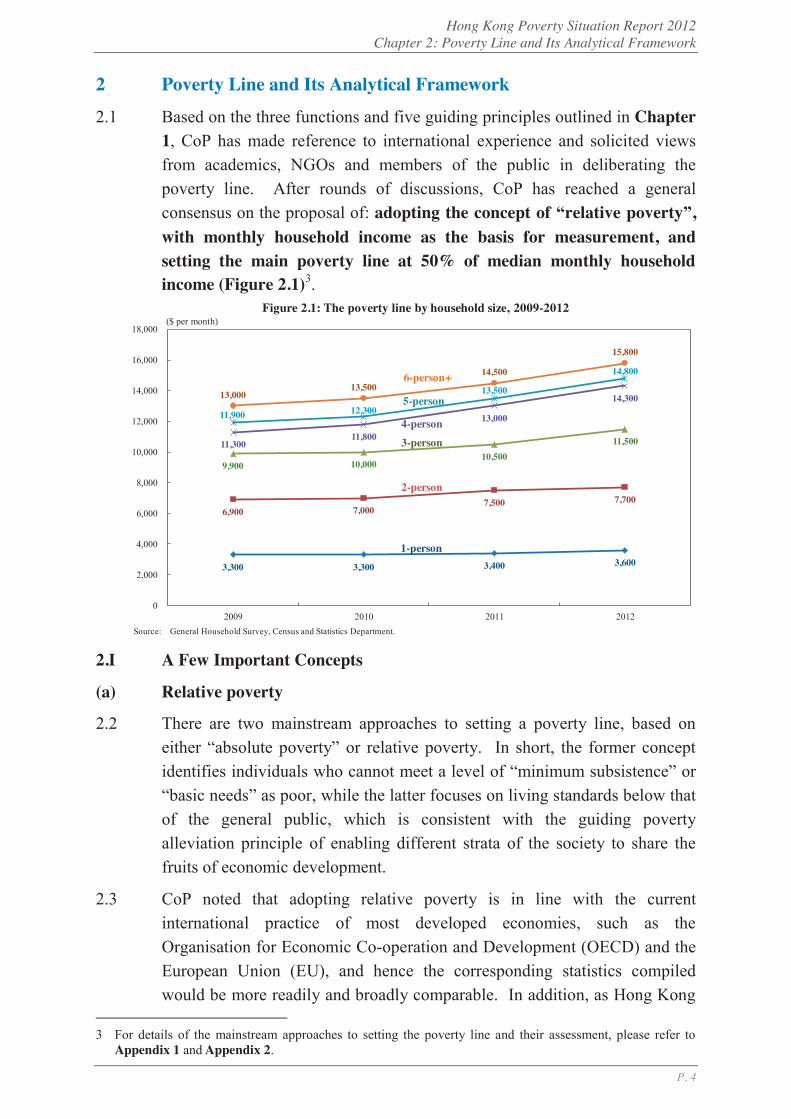
2.1 Based on the three functions and five guiding principles outlined in Chapter 1, CoP has made reference to international experience and solicited views from academics, NGOs and members of the public in deliberating the poverty line. After rounds of discussions, CoP has reached a general consensus on the proposal of: adopting the concept of “relative poverty”, with monthly household income as the basis for measurement, and setting the main poverty line at 50% of median monthly household income (Figure 2.1)3.
2.I A Few Important Concepts
(a) Relative poverty
2.2 There are two mainstream approaches to setting a poverty line, based on either “absolute poverty” or relative poverty. In short, the former concept identifies individuals who cannot meet a level of “minimum subsistence” or “basic needs” as poor, while the latter focuses on living standards below that of the general public, which is consistent with the guiding poverty alleviation principle of enabling different strata of the society to share the fruits of economic development.
2.3 CoP noted that adopting relative poverty is in line with the current international practice of most developed economies, such as the Organisation for Economic Co-operation and Development (OECD) and the European Union (EU), and hence the corresponding statistics compiled would be more readily and broadly comparable. In addition, as Hong Kong
3 For details of the mainstream approaches to setting the poverty line and their assessment, please refer to
Appendix 1 and Appendix 2.
3,300 3,300 3,400 3,600
6,900 7,000 7,500 7,700
9,900 10,000 10,500
11,500 11,300 11,800
13,000
14,300
11,900 12,300
13,500
14,800
13,000 13,500
14,500
15,800
0
2,000
4,000
6,000
8,000
10,000
12,000
14,000
16,000
18,000
2009 2010 2011 2012
($ per month)
1-person
2-person
3-person
4-person
5-person
6-person+
Source: General Household Survey, Census and Statistics Department.
Figure 2.1: The poverty line by household size, 2009-2012
Hong Kong Poverty Situation Report 2012 Chapter 2: Poverty Line and Its Analytical Framework
P. 5
is a mature and developed economy, it would be difficult to form broad consensus if only those living below the minimum subsistence level are regarded as poor. To tackle the poverty issue given the current stage of economic development of Hong Kong, CoP believed the main focus should be on those with relatively less endowment.
2.4 During the discussion process of setting the poverty line, most views supported adopting the concept of relative poverty as it is simpler and easier to understand. It would also gain a higher recognition by the community as local organisations like Oxfam Hong Kong (Oxfam) and the Hong Kong Council of Social Service (HKCSS) have been adopting the same basis for poverty estimates in Hong Kong. However, some considered it necessary to set a “protection line for basic living” for Hong Kong based on an absolute poverty concept so as to identify individuals living in severe poverty, i.e. failing to maintain the subsistence living or meet basic needs. As a first step, CoP considered appropriate to set a relative poverty line.
(b) Household income as the basis for measurement
2.5 Having regard to the international experience on adopting the concept of relative poverty, CoP found that many places set their poverty lines by anchoring to a certain percentage of median household income. In other words, households with income below the selected percentage of median would be defined as poor.
2.6 In the course of discussion, there were views that CoP should also take into account the expenditure pattern of households when setting a poverty line. For example, household income net of housing expenses should be used to define poverty. However, detailed statistics on household expenditure are only available in the Household Expenditure Survey (HES) conducted by the Census and Statistics Department (C&SD) once every five years (with the next update to be conducted in 2014/15). CoP therefore reckoned that a poverty line based on such concept would be difficult to provide timely updates for serving the important functions of closely monitoring the poverty situation and assessing the effectiveness of policy intervention.
2.7 As such, CoP’s decision is to first adopt household income as the basic standard for measuring poverty, and to conduct in-depth feasibility studies on other options (such as household expenditure) in the future. Furthermore, the poverty line thresholds are estimated with the effects of taxation and various cash benefits excluded from household income. This is to prevent the poverty line thresholds from being affected by policy intervention, which is in cognisance with one important function of the poverty line, i.e. to assess policy effectiveness. For details, please refer to Box 2.1.
Hong Kong Poverty Situation Report 2012 Chapter 2: Poverty Line and Its Analytical Framework
P. 6
Box 2.1
Other Technical Details in Setting the Poverty Line
Pre- and post-intervention household income
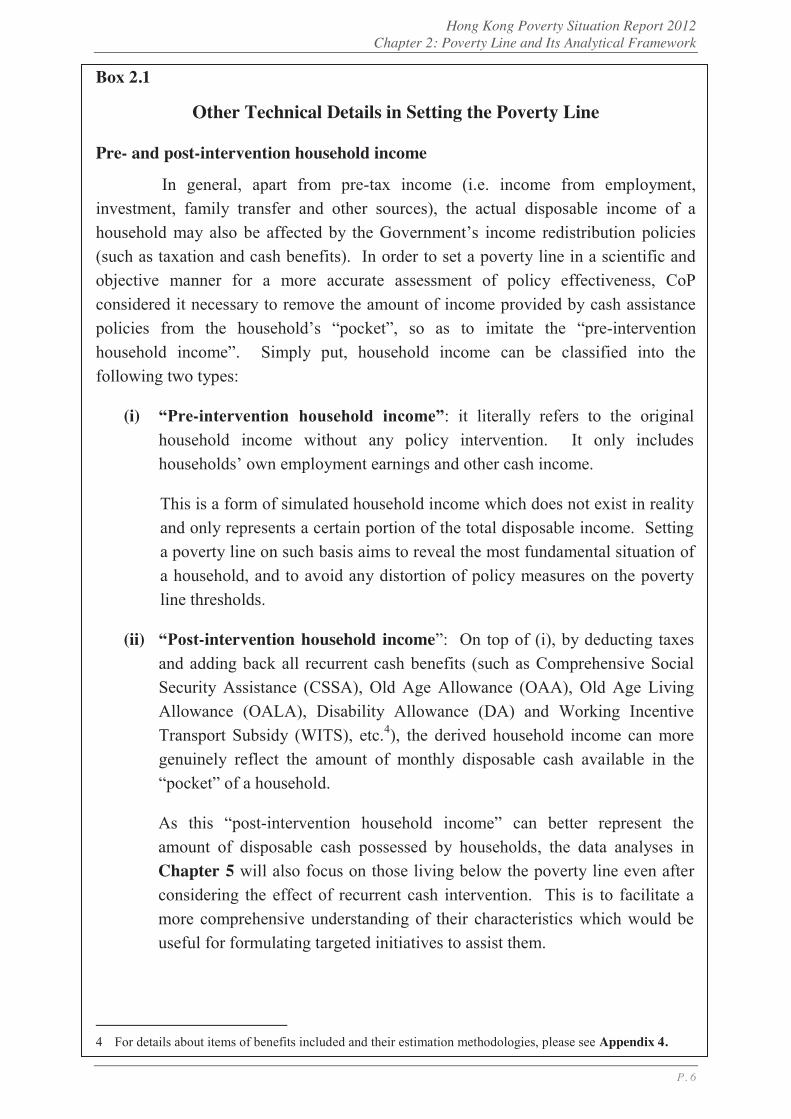
In general, apart from pre-tax income (i.e. income from employment, investment, family transfer and other sources), the actual disposable income of a household may also be affected by the Government’s income redistribution policies (such as taxation and cash benefits). In order to set a poverty line in a scientific and objective manner for a more accurate assessment of policy effectiveness, CoP considered it necessary to remove the amount of income provided by cash assistance policies from the household’s “pocket”, so as to imitate the “pre-intervention household income”. Simply put, household income can be classified into the following two types:
(i) “Pre-intervention household income”: it literally refers to the original household income without any policy intervention. It only includes households’ own employment earnings and other cash income.
This is a form of simulated household income which does not exist in reality and only represents a certain portion of the total disposable income. Setting a poverty line on such basis aims to reveal the most fundamental situation of a household, and to avoid any distortion of policy measures on the poverty line thresholds.
(ii) “Post-intervention household income”: On top of (i), by deducting taxes and adding back all recurrent cash benefits (such as Comprehensive Social Security Assistance (CSSA), Old Age Allowance (OAA), Old Age Living Allowance (OALA), Disability Allowance (DA) and Working Incentive Transport Subsidy (WITS), etc.4), the derived household income can more genuinely reflect the amount of monthly disposable cash available in the “pocket” of a household.
As this “post-intervention household income” can better represent the amount of disposable cash possessed by households, the data analyses in Chapter 5 will also focus on those living below the poverty line even after considering the effect of recurrent cash intervention. This is to facilitate a more comprehensive understanding of their characteristics which would be useful for formulating targeted initiatives to assist them.
4 For details about items of benefits included and their estimation methodologies, please see Appendix 4.

Hong Kong Poverty Situation Report 2012 Chapter 2: Poverty Line and Its Analytical Framework
P. 7
Box 2.1 (Cont’d)
2. Internationally, cash benefits offered by the government are usually counted as household income in the analysis of poverty and income distribution. For instance, EU includes government cash allowances as one of the components in the estimation of household “disposable income”5. Although the inclusion of in-kind benefits as household income is more controversial, CoP considered that many of these means-tested policies can indeed benefit the poor, among which the impact of the provision of public rental housing (PRH) is most significant in improving the livelihood of the grassroots and hence undoubtedly alleviate their poverty situation. Hence, relevant poverty figures should also be estimated as supplementary information (please see Box 4.2).
3. CoP also noted that the Government introduced many non-recurrent cash benefits (including one-off measures) in recent years, involving considerable amount of public spending. Although these measures can provide direct support to the grassroots, they are non-recurrent in nature, and thus may introduce distortion to the corresponding estimates and unnecessary confusion when interpreting the poverty situation. CoP therefore considered that the core analytical framework should only cover recurrent cash benefits, while the impact of non-recurrent cash items should be estimated separately as supplementary information in the policy effectiveness assessment (Figure 2.2, for details please see Box 4.1).
The implications of household size for household income
4. Household size will certainly affect living needs. For example, a 2-person family normally consumes fewer resources than a 4-person family. But since some 5 For details, please see the EU’s webpage on metadata (http://epp.eurostat.ec.europa.eu/cache/ITY_SDDS/
en/ilc_esms.htm).
Note: (**) Non-recurrent cash benefits include one-off measures.
(2) Post-intervention household income
(1) Pre-intervention household income
Recurrent cash benefits:(+) Social security payments
(CSSA, OAA, OALA and DA)(+) Education-related cash benefits
(+) Other cash benefits
(-) Taxation
Including recurrent and non-recurrent cash benefits
Including recurrent cash benefits only
(2) Post-intervention household income
(+) Recurrent cash benefits(+) Non-recurrent cash benefits**
(e.g. rent waiver for PRH tenants, cash benefits under Community Care Fund
(CCF).)
Supplementary information:
Cashbenefits
Figure 2.2: Schematic representation of pre- and post-intervention household income

Hong Kong Poverty Situation Report 2012 Chapter 2: Poverty Line and Its Analytical Framework
P. 8
Box 2.1 (Cont’d)
resources can be shared among household members, the larger the household, the greater the economies of scale, thus the lesser average living needs of each family member. As far as the effect of household size on economies of scale is concerned, one approach is to adopt the “equivalence scale”, which assigns weightings to households of different sizes and socio-economic characteristics to equivalise their household incomes. After such adjustments, all household incomes can theoretically be compared on the same basis.
5. Upon deliberation, CoP concluded that internationally there is no universal standard for the equivalence scale, and its application and estimation methodology are also controversial. It would be difficult for the public to understand and interpret the figures, and therefore not in compliance with the guiding principle of “amenability to compilation and interpretation” in setting a poverty line. As such, CoP agreed to make reference to the approach currently adopted by Oxfam and HKCSS, i.e. setting different poverty line thresholds according to household size. This is a simpler approach with less subjective judgment. For more details about the implications of household size for income distribution, please refer to Section 3.II.
(c) Setting the main poverty line at 50% of median household income
2.8 CoP also noted that it has been a common practice, both internationally and locally, to set the poverty line at 50% of median household income. For instance, OECD adopts 50% of median household income as the main poverty threshold. In Hong Kong, NGOs (such as Oxfam and HKCSS) also adopt 50% of median household income in estimating the size of the poor population for public information. Their poverty estimates have been widely quoted and well recognised in the community.
2.9 There are views that a poverty line set at 50% of median household income is too low. Hence, multiple poverty lines should be set at 40%, 60% or even 70% of the median, so as to comprehensively review the circumstances of households living just above and below the poverty lines. However, CoP considered that a poverty line framework that is simple and easy to understand can facilitate the community’s discussion. Also taking timeliness into account, CoP’s decision is to set one main poverty line at 50% of median household income at this juncture, and would further explore the need of setting supplementary poverty lines in the future.
Hong Kong Poverty Situation Report 2012 Chapter 2: Poverty Line and Its Analytical Framework
P. 9
2.II Analytical Framework
2.10 One of the major functions of the poverty line is to assess policy effectiveness. By estimating two types of household income as per Box 2.1, we can analyse the changes in poverty indicators before and after policy intervention, so as to quantify and evaluate the effectiveness of existing poverty alleviation measures. This is useful for facilitating policy review and setting out broad directions in poverty alleviation (Figure 2.3). By the same token, the poverty line also serves as a tool for simulating the effect of policy initiatives under deliberation on various poverty indicators, thereby providing objective policy guidance.
2.11 With reference to international practice, there are several major poverty indicators under the poverty line framework, namely (i) poverty incidence (including the number of poor households and the poor population) and (ii) poverty rate for measuring the extent of poverty, and (iii) poverty gap (including average and total poverty gaps) for measuring the depth of poverty6. These quantitative poverty indicators may serve the purpose of long-term monitoring and analysis, and provide concise information that summarises the poverty trend in Hong Kong (please refer to Chapter 4 for details).
6 For definitions of these poverty indicators, please refer to Appendix 3.
1. Relative poverty line50% of median household income before
policy intervention
Household income before policy intervention
applied to
to derive
2. Policy intervention
3. Poverty dataNumber of poor households, poor population, poverty rates, poverty gaps, situations of various groups and
districts, their socio-economic characteristics, etc.under different household income types
Analyse and compare the data before and after policy intervention to quantify
the impact of policy intervention on poverty
Figure 2.3: Schematic representation of the poverty line and its analytical framework
Household income after policy intervention

Hong Kong Poverty Situation Report 2012 Chapter 2: Poverty Line and Its Analytical Framework
P. 10
2.12 Statistics for poverty analysis are mainly sourced from the General Household Survey (GHS) of C&SD. The data collected can be further analysed by a set of socio-economic characteristics, such as gender, age, employment conditions and district, etc. Focused analysis of the conditions of various underprivileged groups, such as elderly, single-parent and unemployed households (Table 2.1) below the poverty line can also facilitate a continuous and systematic monitoring of their poverty situations. Chapter 5 of the Report will provide a detailed analysis of the characteristics of these groups. Corresponding statistics are at Appendix 6.
Table 2.1: Four selected key household characteristics for focused analysis under the analytical framework
(i) Social (ii) Economic (iii) Housing (iv) District
Elderly Youth With-children CSSA Single-parent New-arrival
Economically inactive
Working Unemployed
Public rental housing Subsidised sale flats Private housing
(owner-occupiers) Private housing
(tenants) Temporary housing
by the 18 District Council districts
Note: For the definitions of various household groups, please refer to the Glossary.
2.13 Nevertheless, given the constraint of sample size, statistics for some specific groups cannot be disseminated from GHS. For instance, it is not possible to provide further breakdowns for each of the 18 District Council districts. In addition, given the limitations of the survey design, data regarding some vulnerable groups (e.g. ethnic minorities and persons with disabilities) are not available. CoP will, if and when necessary, examine the possibility of conducting further analysis of these groups through Population Census / By-census or other thematic studies.
2.III Limitations of the Poverty Line
2.14 Setting a poverty line can facilitate the formulation of appropriate and effective poverty alleviation policies, yet there is no perfect way of doing so. The following few major limitations must be observed:
(a) Does not take assets into account
2.15 Since the poverty line takes household income as the single indicator for measuring poverty without considering the amount of assets and liabilities, some “asset-rich, income-poor” people (such as retired elderly with considerable amount of savings or possessing properties) might as a result be
Hong Kong Poverty Situation Report 2012 Chapter 2: Poverty Line and Its Analytical Framework
P. 11
classified as poor. Such limitation should not be overlooked when interpreting the poverty figures.
(b) The “poverty line” is not a “poverty alleviation line”
2.16 Without considering household assets, the poverty line cannot be taken as the eligibility criteria of any poverty alleviation initiatives. In other words, setting the poverty line does not mean that the Government should automatically offer subsidies to individuals or households below the poverty line. On the contrary, even if the household incomes of some groups are slightly above the poverty line, they will still be eligible for government subsidies subject to meeting of the means tests for individual support schemes. In fact, the eligibility criteria of most of the existing schemes are more lenient than the poverty line thresholds7.
2.17 Poverty line is an analytical tool for identifying the poor population, formulating initiatives that meet their needs, monitoring the poverty situations of various groups in a systematic and continuous manner, and assessing the effectiveness of government intervention in alleviating poverty. As such, the poverty line should not be linked directly to the means-tested mechanisms of social assistance schemes.
(c) The poor population always exists statistically
2.18 Under normal circumstances, there are always people in poverty statistically based on a relative poverty line set at a percentage of the median household income. It is because the threshold of a relative poverty line is not fixed. Households with income “relatively” lower than that of the overall by a certain extent are, by definition, classified as poor. As such, the size of the poor population would still increase if all households in the community enjoy the same income growth. Even experiencing significant income hikes, households in the lowest segment will remain as poor if their income levels are still lower than the relative poverty line anchored to the median income.
2.19 Therefore, an economic upturn with a widespread improvement in household income does not guarantee a decrease in the size of the poor population, especially when the income growth of households below poverty line is less promising as compared to the overall (i.e. median income).
7 For example, the income limits of WITS are about 60% to 100% of median household income.

Hong Kong Poverty Situation Report 2012 Chapter 3: Household Income Distribution before and after Policy Intervention
P. 12
3 Household Income Distribution before and after Policy Intervention
3.1 As mentioned in the previous chapter, the poverty line and its analytical framework should be set in accordance with Hong Kong’s unique circumstances, as one of its important functions is to assess the effectiveness of the Government’s poverty alleviation measures by comparing the poverty indicators compiled under different household income types (i.e. before and after policy intervention).
3.2 Since the above two types of income are estimated solely for this unprecedented study of setting the poverty line, they are somewhat different from the prevailing definition and have not been published by C&SD before8. To avoid doubt, before entering into details of the poverty situation in the ensuing chapters, this chapter briefly analyses the household income distribution before policy intervention, and also objectively describes the impact of recurrent cash benefits on it.
3.I Household Income Situation in Hong Kong at a Glance
3.3 With the overall economy on an up-cycle for most of the time over the past few years, about 190 000 new jobs were created between 2009 and 2012 thanks to the vibrant growth in domestic demand. As a result, total employment reached a record high of 3 660 700 in 2012. The unemployment rate fell to 3.3%, the lowest level since 1997, signifying a tight local labour market virtually in a state of full employment. Coupled with the implementation of the statutory minimum wage (SMW) in May 2011, there was an upsurge of employment earnings in grassroots workers9. All these developments have been reflected in the household income distribution.
3.4 As a result, there was a broad-based increase in household income, with the monthly median household income10 (before policy intervention) increasing from $17,400 in 2009 to $18,000 in 2010 and $19,200 in 2011, and further
8 Consequently, discrepancies exist between the household income figures quoted in this Report (before and
after policy intervention) and those regularly published in the Quarterly Report on GHS by C&SD.
9 Wages and payroll surged by 8.1% and 7.9% respectively in 2011, recording their largest growth since mid-1990s. The increases after discounting price effects were 2.7% and 2.5% respectively in real terms. The corresponding increases in 2012 were 5.7% and 6.5% in nominal terms and 1.6% and 2.3% in real terms. Over the same period, wage growth was particularly distinct for workers in the lower segment. For instance, wages of miscellaneous non-production workers and service workers rose in 2012 by 6.5% and 7.5% respectively in nominal terms and 2.3% and 3.3% in real terms, much higher than the overall average.
10 Unless otherwise specified, all household income figures are quoted on a monthly basis, rounded to the nearest hundred.

Hong Kong Poverty Situation Report 2012 Chapter 3: Household Income Distribution before and after Policy Intervention
P. 13
to $20,000 in 2012. The corresponding increases were 3.7%, 6.7% and 4.2% (Table 3.1). After netting out the effect of inflation, the increases were 1.4%, 1.3% and 0.1% in real terms respectively.
Table 3.1: Pre-intervention household income, 2009-2012
Percentile Nominal household income ($) Annual change (%) 2009 2010 2011 2012 2010 2011 2012
90th 54,000 55,000 59,300 60,900 1.9 7.8 2.7 75th 31,000 32,000 34,800 36,500 3.2 8.6 5.0 50th
(Median) 17,400 18,000 19,200 20,000 3.7 6.7 4.2
25th 8,000 8,400 9,000 9,900 5.0 7.1 10.0 10th 2,000 2,000 2,100 2,000 @ 2.5 -2.0
Notes: (@) Annual change within ±0.05%. Annual changes are calculated based on unrounded figures. Source: General Household Survey, Census and Statistics Department. 3.5 Statistics also indicate that household income in the lowest segment (e.g. the
10th percentile) remained low, with the growth lagging behind the median. It should however be noted that this figure would somewhat be affected by changes in various socio-economic factors. For example, a visible increase in retired elderly households amid population ageing would suppress the pre-intervention household income of the segment, since the majority of them comprise only one and two persons in lack of employment earnings. In view of this, it is essential to have a more thorough understanding on the relationship between household characteristics and income distribution.
3.II Relationship between Selected Socio-economic Characteristics and Income Distribution of Households
3.6 As there have been no significant changes in household income distribution over the past four years, we will focus on the 2012 statistics for ease of exposition.
(a) Household size
3.7 There is no doubt that household size has an obvious bearing on household income distribution. The larger the household size, the higher the incidence that household members are economically active with employment earnings. Take a typical 4-person family as an example, it is quite common for both parents to have a paid job. In contrast, it is more common to see elderly singletons and couples in 1- and 2-person households. Retired and workless,
Hong Kong Poverty Situation Report 2012 Chapter 3: Household Income Distribution before and after Policy Intervention
P. 14
these households are bound to be on the lower side of the income distribution.
3.8 As shown in Figure 3.1, the majority of households with income below $10,000 were 1- and 2-person families, contributing to 78.3% of the total of the income group in question. Moving along the distribution from lower-income to higher-income, the proportion of 1- and 2-person households decreases significantly, replaced by medium-sized 3- and 4-person households. The number of large households (households with five persons and six-and-above persons) has continued to decline in Hong Kong as reflected by a downward trend of average household size. In 2012, they only accounted for 6.3% and 2.4% respectively of the overall total, and hence their shares in each income group were naturally less significant.
(b) Economic activity status
3.9 The pre-intervention income distribution can also be categorised by economic activity status of households. As shown in Figure 3.2, the majority of the lowest income group were elderly and workless (i.e. economically inactive or unemployed) households11, which largely explains why the 10th percentile household income as illustrated earlier was so low12. The higher the household income, the higher the proportion of working
11 Among them, 26 400 were working households (or 1.1% of the total) with income less than $5,000. Most of
workers in these households were part-timers or underemployed.
12 For economically active households only, the 10th percentile of the nominal pre-intervention household income in 2011 and 2012 were $8,500 and $9,000 respectively, representing a growth of 5.9%.
169
81 43 25 24 11 14 8 7 4 6
2 3 2 2 2 7
117
101
83
63 53 36 35
23 22 13 17 10 11 7 6 4 4 2 3 2 23
33
49
84
90 81
60 51
34 28 18 20
12 12 8 8 5 6 3 4 2
24
13
22 50
61 64
51 49
34 29
17 19 12 12
8 8 7 7 3 4 2
27
4
6 14
18 19
17 14
11 9
7 6
5 3 2 3
7
2
2 3
7 7
6 5
5 4
4 3 2 2
2
0
50
100
150
200
250
300
350
400
<5
5-<1
0
10-<
15
15-<
20
20-<
25
25-<
30
30-<
35
35-<
40
40-<
45
45-<
50
50-<
55
55-<
60
60-<
65
65-<
70
70-<
75
75-<
80
80-<
85
85-<
90
90-<
95
95-<
100
100
6-person+
5-person
4-person
3-person
2-person
1-person
Figure 3.1: Pre-intervention household income distribution by household size, 2012No. of households ('000)
Monthly household income ($'000)
Note:Source:
Income groups are classified according to their respective pre-intervention household incomes.General Household Survey, Census and Statistics Department.
Hong Kong Poverty Situation Report 2012 Chapter 3: Household Income Distribution before and after Policy Intervention
P. 15
households. This is not at all surprising, given that employment earnings are usually the key component of household income. Also worth mentioning is that the socio-economic characteristics of poor households would tend to be biased towards the economically inactive.
(c) Type of housing
3.10 Analysed by type of housing, it is easy to understand why most of the lower-income households are residing in PRH, a policy with means test. When moving up the income ladder, the number and share of these households fell, largely replaced by owner-occupiers or tenants of private housing. This is particularly obvious in higher-income groups (such as households with income at $70,000 and above), with nearly 90% of them living in private flats (Figure 3.3). However, while households residing in rooms / bedspaces / cocklofts and temporary housing only amounted to 12 500 and 15 400 respectively (accounting for 0.5% and 0.6% of all households), they were mostly found in the lower-income segments. 56% (or 15 600) of them had pre-intervention household income of less than $10,000.
3.11 It can be seen from the above that income of a household is highly correlated with its socio-economic characteristics. For instance, households with more members generally have higher income; while income of elderly, economically inactive and unemployed households are generally lower given a lack of working members. Most lower-income households reside in PRH, while some live in temporary housing or rooms / bedspaces / cocklofts.
26
171
249 253 239
178 163 114 97
63 69 42 43 28 28 19 21 10 13 8
88 19
7
2
123
34
12 6 4
2 2
168 47
13 4 3
2
0
50
100
150
200
250
300
350
400
<5
5-<1
0
10-<
15
15-<
20
20-<
25
25-<
30
30-<
35
35-<
40
40-<
45
45-<
50
50-<
55
55-<
60
60-<
65
65-<
70
70-<
75
75-<
80
80-<
85
85-<
90
90-<
95
95-<
100
100
Elderly households
Economically inactive households
Unemployed households
Working households
Figure 3.2: Pre-intervention household income distribution by economic activity status, 2012No. of households ('000)
Monthly household income ($'000)Notes:
Source:
Income groups are classified according to their respective pre-intervention household incomes.Elderly households refer to those with all members aged 65 and above. Economically inactive, unemployed and working househo lds as shown above do not include elderly households.General Household Survey, Census and Statistics Department.
Hong Kong Poverty Situation Report 2012 Chapter 3: Household Income Distribution before and after Policy Intervention
P. 16
3.III Impact of Recurrent Cash Intervention
3.12 The previous section outlines the relationship between some socio-economic characteristics of households and their respective levels of income, which should facilitate a better understanding of the detailed analyses of the poor in Chapter 5. The last section of this chapter mainly focuses on the impact of Government’s recurrent cash benefits through policy intervention on household income distribution.
3.13 Similar to Table 3.1, Figure 3.4 shows the major statistics on household income, but with the corresponding post-recurrent cash intervention figures added for easy comparison. Although the post-intervention median household income was broadly similar to that of pre-intervention, the 10th and 25th percentiles were obviously higher, while the 75th and 90th percentiles were notably lower in contrast. This shows that Government’s recurrent cash intervention has a significant bearing on household income redistribution.
9 7 5 2 2
176 133 123
108 75
45 28 16 9 5 3 2
32
31 43 47
50
42 36
25 20 13 10 6 6 3 3 2 2
31
31 3735
37
2930
2220
13 17 10 11 8 7 5 5 2 4 231
89
5869
7183
6473
5249
32 4024 26
16 18 12 14 7 9 6
56
0
50
100
150
200
250
300
350
400
<5
5-<1
0
10-<
15
15-<
20
20-<
25
25-<
30
30-<
35
35-<
40
40-<
45
45-<
50
50-<
55
55-<
60
60-<
65
65-<
70
70-<
75
75-<
80
80-<
85
85-<
90
90-<
95
95-<
100
100
Private housing - owner-occupiers
Private housing - tenants**
Subsidised sale flats
PRH
Temporary housing & private tenants in rooms /bedspaces / cocklofts
Figure 3.3: Pre-intervention household income distribution by type of housing, 2012No. of households ('000)
Notes: (**)
Source:
Including tenants, rent-free tenants, and residence provided by employers. Tenants in rooms / bedspaces / cocklofts excluded.Income groups are classified according to their respective pre-intervention household incomes.General Household Survey, Census and Statistics Department.
Monthly household income ($'000)
Hong Kong Poverty Situation Report 2012 Chapter 3: Household Income Distribution before and after Policy Intervention
P. 17
3.14 As Box 2.1 of Chapter 2 has clearly explained, taxation and recurrent cash benefits, including social security payments and other cash allowances, are covered in the estimation of post-intervention household income. Since most of these measures are designed with means-tested mechanisms to assist needy households, those with lower pre-intervention income will have a higher chance of passing the eligibility criteria. It is thus natural to see that most of these households in the lower-income household groups 13 have benefited from recurrent cash measures, with such portion decreasing sharply as household income increases (Figure 3.5).
3.15 By comparing the distributional changes in household income before and after policy intervention in 2012, Figure 3.6 illustrates more clearly that the number of households in the lowest income group (e.g. below $5,000) fell visibly after intervention. In contrast, the number of households with relatively higher incomes (e.g. $5,000 - <$10,000, $10,000 - <$15,000, etc.) rose appreciably. This shows that the grassroots have benefited markedly from recurrent cash benefits with their household income lifted up. On the other hand, the number of households with income at $50,000 and above decreased notably, reflecting the Government’s role in income redistribution through taxation.
13 Please refer to Appendix 6 for the graphical presentation of the 2012 household income distributions (before
and after intervention) by socio-economic group, including CSSA, elderly, single-parent, with-children and youth households.
2,000 2,000 2,100 2,000
8,000 8,400 9,000 9,900
17,400 18,000 19,20020,000
31,000 32,00034,800
36,500
54,000 55,000
59,300 60,900
0
10,000
20,000
30,000
40,000
50,000
60,000
70,000
2009 2010 2011 2012
(a) Pre-intervention($)
4,700 4,700 4,800 5,000
9,300 9,500 10,100 10,800
17,500 17,90019,300
20,400
30,600 31,30033,600
35,600
50,400 51,90054,500
57,000
0
10,000
20,000
30,000
40,000
50,000
60,000
70,000
2009 2010 2011 2012
($) (b) Post-recurrent cash intervention
Figure 3.4: Key statistics of household income, 2009-2012
Source: General Household Survey, Census and Statistics Department.
10th percentile 25th percentile Median 75th percentile 90th percentile
Hong Kong Poverty Situation Report 2012 Chapter 3: Household Income Distribution before and after Policy Intervention
P. 18
3.16 As outlined at the beginning of Section 3.II, household size is closely related to household income. Therefore, more meaningful observations could be drawn from the analysis if a comparison of pre- and post-intervention household income distributions is separately presented by household size alongside the adopted poverty line framework.
3.17 Figures 3.7(a) to 3.7(f) show the household income distribution by household size in 2012. Dotted bars denote the pre-intervention distribution, with the corresponding median and poverty line marked. Solid bars
294
162 162 138
93 52 35 22 16 10 10 6 4 3 3 2 2 2 9
43
98 115 126
154
129 133
93 83
53 61 37 39 25 26 17 19 9 11 7
82
0
50
100
150
200
250
300
350
400
<5
5-<1
0
10-<
15
15-<
20
20-<
25
25-<
30
30-<
35
35-<
40
40-<
45
45-<
50
50-<
55
55-<
60
60-<
65
65-<
70
70-<
75
75-<
80
80-<
85
85-<
90
90-<
95
95-<
100
100
Without recurrent cash benefits
With recurrent cash benefits
Figure 3.5: Pre-intervention household income distribution, by whether receiving recurrent cash benefits, 2012
No. of households ('000)
Monthly household income ($'000)Note:Source:
Income groups are classified according to their respective pre-intervention household incomes.General Household Survey, Census and Statistics Department.
0
50
100
150
200
250
300
350
400
<5
5-<1
0
10-<
15
15-<
20
20-<
25
25-<
30
30-<
35
35-<
40
40-<
45
45-<
50
50-<
55
55-<
60
60-<
65
65-<
70
70-<
75
75-<
80
80-<
85
85-<
90
90-<
95
95-<
100
100
Pre-interventionPost-recurrent cash intervention
No. of households ('000)
Figure 3.6: Pre- and post-intervention household income distribution, 2012
Source: General Household Survey, Census and Statistics Department.
Monthly household income ($'000)
Median household incomePre-intervention: $20,000Post-recurrent cash intervention: $20,400
Hong Kong Poverty Situation Report 2012 Chapter 3: Household Income Distribution before and after Policy Intervention
P. 19
represent the post-intervention distribution, in which households are further divided into two types, i.e. with (blue) and without (red) recurrent cash benefits. In particular, households lifted to or above the poverty line after intervention are marked in light blue for easy identification. This not only facilitates our understanding on the impact of policy intervention, but also offers a preliminary assessment of the effectiveness of poverty alleviation policies:
For instance, median household income and poverty line for 1-person households was $7,200 and $3,600 respectively. Most of the households with income below the poverty line could benefit from recurrent cash benefits. 63 300 households (or 15.3% of total 1-person households) became non-poor after policy intervention. Nevertheless, it should be noted that some households not in poverty (accounted for
20
70 43
28 15 16 10 10 6 4 3 3 2 2 1 1 1 1 5
63
65
37
5 1
1 0
20
40
60
80
100
120
140
160
180
<3.6
3.6-
<10
10-<
1515
-<20
20-<
2525
-<30
30-<
3535
-<40
40-<
4545
-<50
50-<
5555
-<60
60-<
6565
-<70
70-<
7575
-<80
80-<
8585
-<90
90-<
9595
-<10
010
0
(a) 1-person (414 300 households)Poverty line: $3,600Median household income : $7,200(Before policy intervention)
<3.6
16 13 23 49 51 40 38 27 24 18 15 15 8 8 4 5 3 2 4 2 17
19
14 51 61 17
47
18 9 6
3 3 2 1 1 1
0
20
40
60
80
100
120
140
160
180
<55-
<7.7
7.7-
<10
10-<
1515
-<20
20-<
2525
-<30
30-<
3535
-<40
40-<
4545
-<50
50-<
5555
-<60
60-<
6565
-<70
70-<
7575
-<80
80-<
8585
-<90
90-<
95 95
(b) 2-person (636 800 households)
5-<7
.7
Poverty line: $7,700Median household income : $15,500(Before policy intervention)
No. of households ('000)
Figure 3.7: Pre- and post-intervention household income distribution by household size, 2012
Before policy intervention with recurrent out of poverty without recurrentcash benefits with recurrent cash benefits cash benefits
After policy intervention
2 6 15
25 37 33 30
20 20 13 12 10 8 8 4 5 4 2 3 18
11 4
3 16
39
52 40 20 12
7 5 3 2 2 1 1 1 1 1
2
0
20
40
60
80
100
120
<55-
<10
10-<
14.3
14.3
-<20
20-<
2525
-<30
30-<
3535
-<40
40-<
4545
-<50
50-<
5555
-<60
60-<
6565
-<70
70-<
7575
-<80
80-<
8585
-<90
90-<
9595
-<10
010
0
(d) 4-person (498 600 households)
10-<
14.3
Poverty line: $14,300Median household income : $28,500(Before policy intervention)
1 3 4 6 5 6 5 5 4 3 2 2 1 1 1 1 1
4
5 1
13
12
1316 12
96
4 32
21 1 1 1 1
2
0
5
10
15
20
25
<55-
<10
10-<
14.8
14.8
-<20
20-<
2525
-<30
30-<
3535
-<40
40-<
4545
-<50
50-<
5555
-<60
60-<
6565
-<70
70-<
7575
-<80
80-<
8585
-<90
90-<
9595
-<10
010
0
(e) 5-person (149 600 households)
10-<
14.8
Poverty line: $14,800Median household income: $29,500(Before policy intervention)
2 16 23
49 57 53 38 32
22 21 13 12 9 6 7 4 4 4 2 2 14
16
71
9
61
35
50
20 13
9 5
3 3 2 1 1 1 1
1
0
20
40
60
80
100
120
<55-
<11.
511
.5-<
1515
-<20
20-<
2525
-<30
30-<
3535
-<40
40-<
4545
-<50
50-<
5555
-<60
60-<
6565
-<70
70-<
7575
-<80
80-<
8585
-<90
90-<
9595
-<10
010
0
(c) 3-person (631 100 households)
5-<1
1.5
Poverty line: $11,500Median household income : $23,000(Before policy intervention)
1 1 2 2 1 2 2 1 1 1 1 1 2
1 4
3 5 6 4 3 3 2 2 1 1 1
0
5
10
15
20
25
<55-
<10
10-<
15.8
15.8
-<20
20-<
2525
-<30
30-<
3535
-<40
40-<
4545
-<50
50-<
5555
-<60
60-<
6565
-<70
70-<
7575
-<80
80-<
8585
-<90
90-<
9595
-<10
010
0
(f) 6-person and above (56 300 households)
10-<
15.8
Poverty line: $15,800Median household income: $31,500(Before policy intervention)
Source: General Household Survey, Census and Statistics Department.Monthly household income ($'000)

Hong Kong Poverty Situation Report 2012 Chapter 3: Household Income Distribution before and after Policy Intervention
P. 20
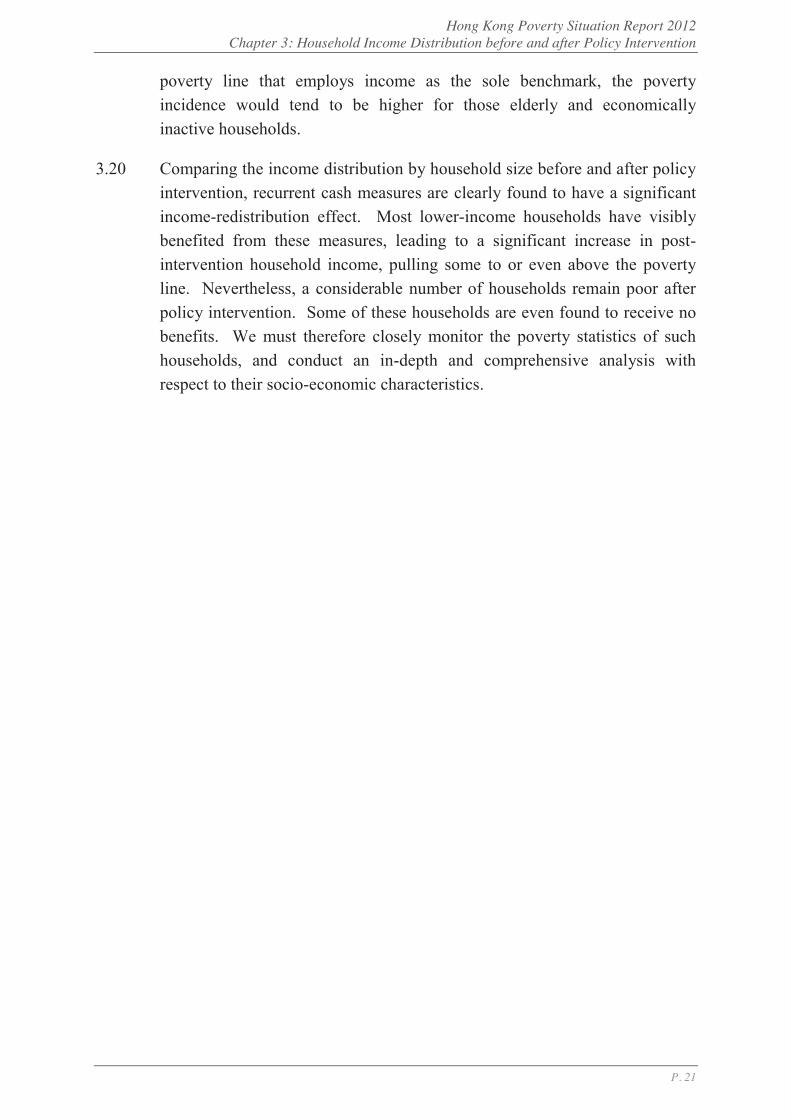
11.1% of total 1-person households) also enjoyed recurrent cash benefits. For a more detailed analysis of the poverty situation of 1-person households, please refer to Section 5.IV(d) of Chapter 5.
Similar to 1-person households, many households of different household sizes below the corresponding poverty lines were able to move up to higher-income groups on account of recurrent cash benefits, resulting in a marked increase in the number of households between the poverty line and median household income.
The larger the household size, the higher the chances are for household members to enjoy recurrent cash benefits (for example, a considerable number of households with elders aged 70 and above can readily apply for OAA; or those with children may also enjoy various education-related cash benefits). As such, even for non-poor households, a considerable number and proportion of them are beneficiaries of recurrent cash benefits.
Nevertheless, there are still poor households in various household sizes that do not enjoy any Government’s recurrent cash assistance. Even among those who are beneficiaries of cash benefits, some of them are still below the poverty line. This is a matter of concern, and it is therefore necessary for us to conduct an in-depth study on these households and population in poverty.
3.IV Key Observations
3.18 Thanks to the tight labour market with low unemployment rate, employment earnings of grassroots workers have improved visibly over the past few years. The pre-intervention household income likewise exhibited a broad-based improvement. However, with the emergence of other socio-economic structural change which pulled most economically inactive and elderly households to the lowest end of the income distribution, overall income growth of the lower-income households was far less favourable than the higher-income counterpart, mostly being employed households.
3.19 The 2012 household income data suggest a certain relationship between socio-economic characteristics and income distribution of households. Household income is highly correlated with its size: in general, the larger the household size, the higher is the income. Members in elderly and economically inactive households are mostly retired or workless due to long-term illness or other reasons, so they are in lack of employment earnings and usually enter into the lowest segment of the distribution. Given a relative
Hong Kong Poverty Situation Report 2012 Chapter 3: Household Income Distribution before and after Policy Intervention
P. 21
poverty line that employs income as the sole benchmark, the poverty incidence would tend to be higher for those elderly and economically inactive households.
3.20 Comparing the income distribution by household size before and after policy intervention, recurrent cash measures are clearly found to have a significant income-redistribution effect. Most lower-income households have visibly benefited from these measures, leading to a significant increase in post-intervention household income, pulling some to or even above the poverty line. Nevertheless, a considerable number of households remain poor after policy intervention. Some of these households are even found to receive no benefits. We must therefore closely monitor the poverty statistics of such households, and conduct an in-depth and comprehensive analysis with respect to their socio-economic characteristics.

Hong Kong Poverty Situation Report 2012 Chapter 4: The Poverty Trend in 2009-2012
P. 22
4 The Poverty Trend in 2009-2012
4.I General Situation
4.1 Thanks to the resilient labour market in recent years, in particular the persistently strong labour demand in the lower-skilled segment, total employment posted successive new highs with the unemployment rate kept at relatively low levels. All these combined to bring about a visible growth in overall income. Also coupled with the implementation of SMW in 2011, the improvement of earnings in low-paid workers was even more substantial (Figure 4.1).
4.2 Against this backdrop, both sets of poverty indicators, whether before or after recurrent cash intervention, indicate that the number of poor households, poor population and its corresponding poverty rate have declined between 2009 and 2012. This suggests an improvement in the overall poverty situation of Hong Kong.
(a) Poverty incidence and poverty rate
4.3 The total number of poor households before policy intervention fell from 541 100 in 2009 to 540 600 in 2012. Poor population also declined from 1 348 400 to 1 312 300 over the same period, with the poverty rate down by 1.0 percentage point to 19.6%. The picture after recurrent cash intervention is broadly similar, with the number of poor households and persons living therein down from 406 300 and 1 043 400 in 2009 to 403 000 and 1 017 800 in 2012 respectively. The poverty rate, at 15.2% in 2012, was also lower than the 16.0% in 2009 (Figure 4.2).
3.7
3.3
2
3
4
5
6
7
2008 2009 2010 2011 2012 2013Q2
Unemployment rate of lower-skilled workers
Seasonally adjusted unemployment rate
0
7.5
4.7
-4
0
4
8
12
16
2008 2009 2010 2011 2012 2013Q1
Average employment earnings of the lowestdecile group - full-time employees
Wages
Sources: General Household Survey; and Labour Earnings Survey, Census and Statistics Department.
Figure 4.1: Labour market situation: unemployment rate, wages and average employment earnings
Percent (%) Year-on-year rate of change (%)
(a) Unemployment rate (b) Wages and average employment earnings

Hong Kong Poverty Situation Report 2012 Chapter 4: The Poverty Trend in 2009-2012
P. 23
4.4 Following the increase in median household income as a result of the general economic upturn since 2010, the relative poverty line thresholds have likewise upshifted (Figure 4.3). Such increases14 were particularly notable for 3- and 4-person households, by 9.5% and 9.6% respectively in 2012 over 2011. Fortunately, the poverty situation remained largely steady over the same period, on the back of distinct income growth of the grassroots. The pre- and post-intervention poverty rates both remained unchanged, despite slight increases in number of poor households and the poor population.
14 The annual rates of change of the poverty line thresholds are calculated based on unrounded figures.
1 348 1 322 1 295 1 312
1 043 1 031 1 005 1 018
20.6 20.1 19.6 19.616.0 15.7 15.2 15.2
0
5
10
15
20
25
0
500
1 000
1 500
2 000
2 500
2009 2010 2011 2012
Source: General Household Survey, Census and Statistics Department.
Poor population ('000
Figure 4.2: Poor population and poverty rate, 2009-2012
Pre-interventionPost-intervention(recurrent cash)
Poverty rate (%)
Poor population (LHS)Poverty rate (RHS)
Poor households ('000) 2009 2010 2011 2012
Pre-intervention 541 536 530 541
Post-intervention(recurrent cash) 406 405 399 403
3,300 3,300 3,400 3,600
6,900 7,000 7,500 7,700
9,900 10,000 10,500
11,500 11,300 11,800
13,000
14,300
11,900 12,300
13,500
14,800
13,000 13,500
14,500
15,800
0
2,000
4,000
6,000
8,000
10,000
12,000
14,000
16,000
18,000
2009 2010 2011 2012
($ per month)
1-person
2-person
3-person
4-person
5-person
6-person+
Source: General Household Survey, Census and Statistics Department.
Figure 4.3: The poverty line by household size, 2009-2012
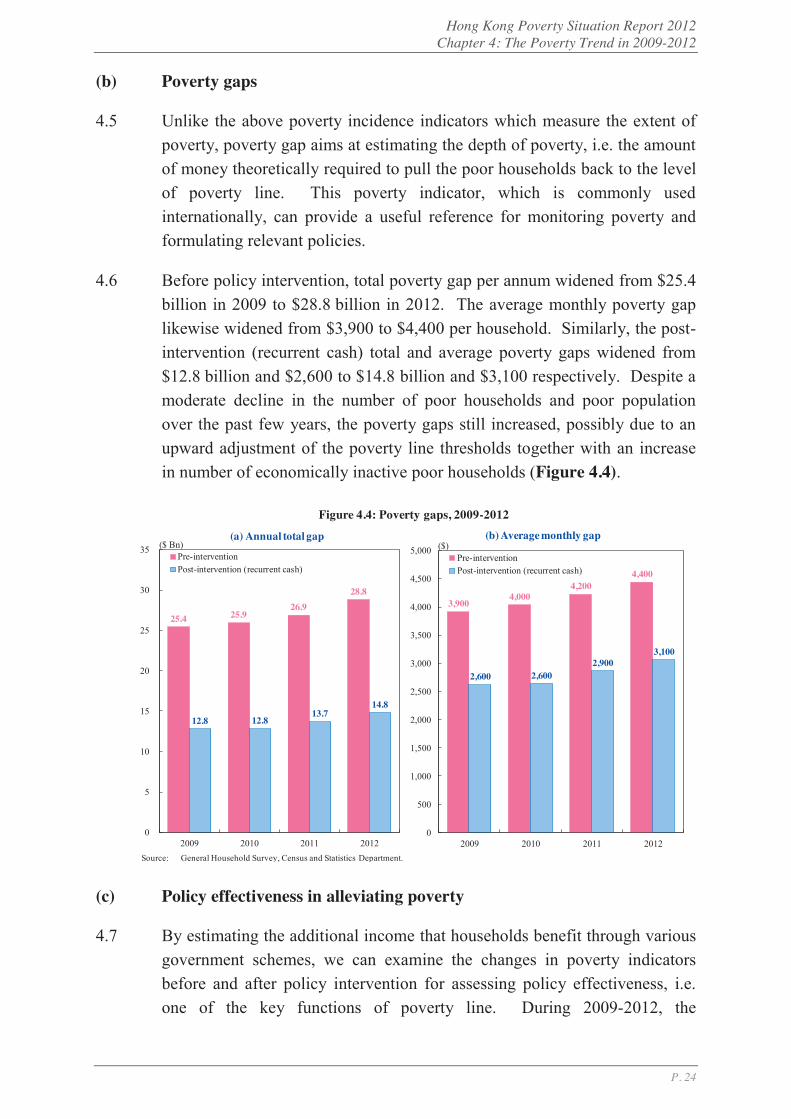
Hong Kong Poverty Situation Report 2012 Chapter 4: The Poverty Trend in 2009-2012
P. 24
(b) Poverty gaps
4.5 Unlike the above poverty incidence indicators which measure the extent of poverty, poverty gap aims at estimating the depth of poverty, i.e. the amount of money theoretically required to pull the poor households back to the level of poverty line. This poverty indicator, which is commonly used internationally, can provide a useful reference for monitoring poverty and formulating relevant policies.
4.6 Before policy intervention, total poverty gap per annum widened from $25.4 billion in 2009 to $28.8 billion in 2012. The average monthly poverty gap likewise widened from $3,900 to $4,400 per household. Similarly, the post-intervention (recurrent cash) total and average poverty gaps widened from $12.8 billion and $2,600 to $14.8 billion and $3,100 respectively. Despite a moderate decline in the number of poor households and poor population over the past few years, the poverty gaps still increased, possibly due to an upward adjustment of the poverty line thresholds together with an increase in number of economically inactive poor households (Figure 4.4).
(c) Policy effectiveness in alleviating poverty
4.7 By estimating the additional income that households benefit through various government schemes, we can examine the changes in poverty indicators before and after policy intervention for assessing policy effectiveness, i.e. one of the key functions of poverty line. During 2009-2012, the
25.4 25.9 26.9
28.8
12.8 12.8 13.7
14.8
0
5
10
15
20
25
30
35
2009 2010 2011 2012
Figure 4.4: Poverty gaps, 2009-2012
Pre-interventionPost-intervention (recurrent cash)
($ Bn)
Source: General Household Survey, Census and Statistics Department.
(a) Annual total gap
3,9004,000
4,2004,400
2,600 2,6002,900
3,100
0
500
1,000
1,500
2,000
2,500
3,000
3,500
4,000
4,500
5,000
2009 2010 2011 2012
(b) Average monthly gap
Pre-interventionPost-intervention (recurrent cash)
($)
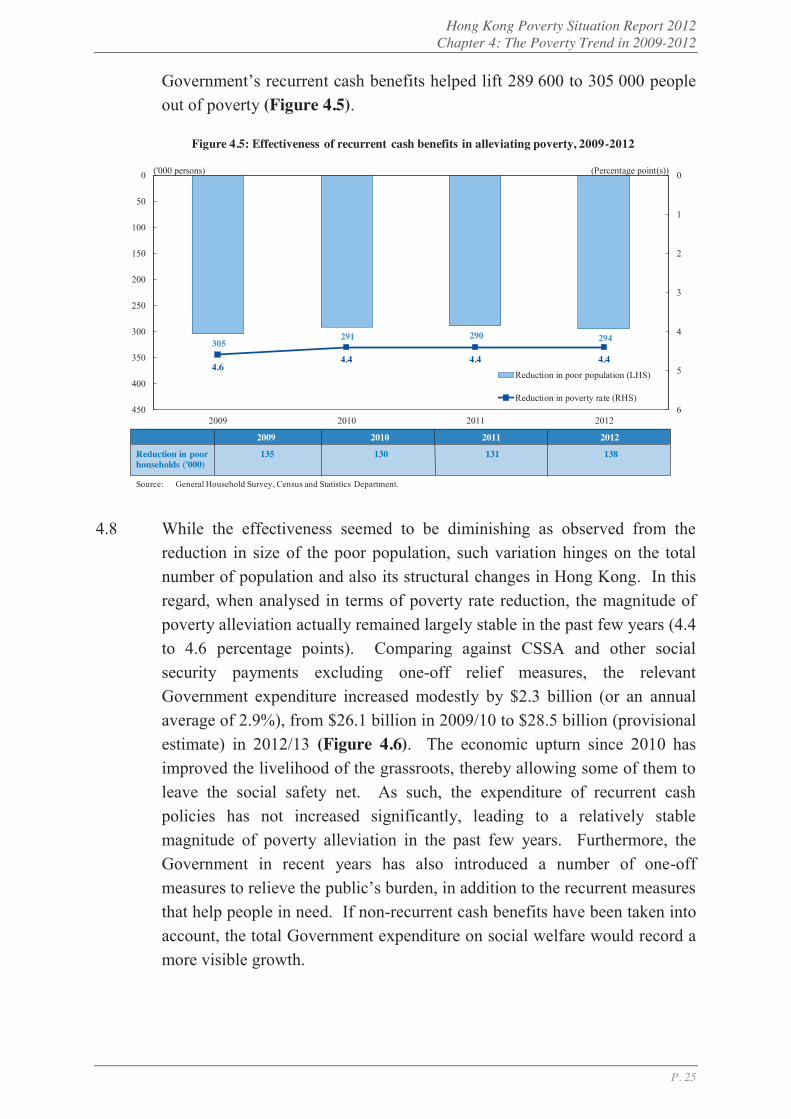
Hong Kong Poverty Situation Report 2012 Chapter 4: The Poverty Trend in 2009-2012
P. 25
Government’s recurrent cash benefits helped lift 289 600 to 305 000 people out of poverty (Figure 4.5).
4.8 While the effectiveness seemed to be diminishing as observed from the reduction in size of the poor population, such variation hinges on the total number of population and also its structural changes in Hong Kong. In this regard, when analysed in terms of poverty rate reduction, the magnitude of poverty alleviation actually remained largely stable in the past few years (4.4 to 4.6 percentage points). Comparing against CSSA and other social security payments excluding one-off relief measures, the relevant Government expenditure increased modestly by $2.3 billion (or an annual average of 2.9%), from $26.1 billion in 2009/10 to $28.5 billion (provisional estimate) in 2012/13 (Figure 4.6). The economic upturn since 2010 has improved the livelihood of the grassroots, thereby allowing some of them to leave the social safety net. As such, the expenditure of recurrent cash policies has not increased significantly, leading to a relatively stable magnitude of poverty alleviation in the past few years. Furthermore, the Government in recent years has also introduced a number of one-off measures to relieve the public’s burden, in addition to the recurrent measures that help people in need. If non-recurrent cash benefits have been taken into account, the total Government expenditure on social welfare would record a more visible growth.
305291 290 294
4.6 4.4 4.4 4.4
0
1
2
3
4
5
6
0
50
100
150
200
250
300
350
400
4502009 2010 2011 2012
Figure 4.5: Effectiveness of recurrent cash benefits in alleviating poverty, 2009-2012
Reduction in poor population (LHS)
Reduction in poverty rate (RHS)
Source: General Household Survey, Census and Statistics Department.
('000 persons) (Percentage point(s))
2009 2010 2011 2012
Reduction in poor 135 130 131 138households ('000)
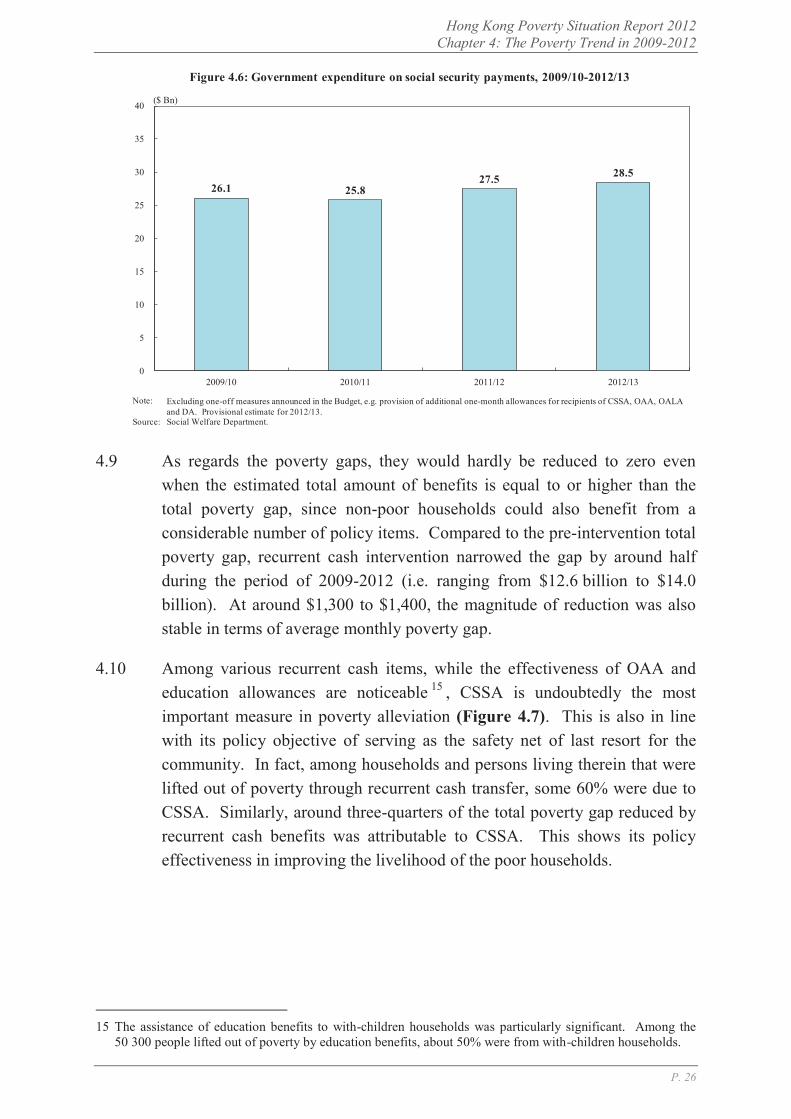
Hong Kong Poverty Situation Report 2012 Chapter 4: The Poverty Trend in 2009-2012
P. 26
4.9 As regards the poverty gaps, they would hardly be reduced to zero even
when the estimated total amount of benefits is equal to or higher than the total poverty gap, since non-poor households could also benefit from a considerable number of policy items. Compared to the pre-intervention total poverty gap, recurrent cash intervention narrowed the gap by around half during the period of 2009-2012 (i.e. ranging from $12.6 billion to $14.0 billion). At around $1,300 to $1,400, the magnitude of reduction was also stable in terms of average monthly poverty gap.
4.10 Among various recurrent cash items, while the effectiveness of OAA and education allowances are noticeable 15 , CSSA is undoubtedly the most important measure in poverty alleviation (Figure 4.7). This is also in line with its policy objective of serving as the safety net of last resort for the community. In fact, among households and persons living therein that were lifted out of poverty through recurrent cash transfer, some 60% were due to CSSA. Similarly, around three-quarters of the total poverty gap reduced by recurrent cash benefits was attributable to CSSA. This shows its policy effectiveness in improving the livelihood of the poor households.
15 The assistance of education benefits to with-children households was particularly significant. Among the
50 300 people lifted out of poverty by education benefits, about 50% were from with-children households.
26.1 25.8 27.5 28.5
0
5
10
15
20
25
30
35
40
2009/10 2010/11 2011/12 2012/13
Note:
Source: Social Welfare Department.
($ Bn)
Figure 4.6: Government expenditure on social security payments, 2009/10-2012/13
Excluding one-off measures announced in the Budget, e.g. provision of additional one-month allowances for recipients of CSSA, OAA, OALA and DA. Provisional estimate for 2012/13.

Hong Kong Poverty Situation Report 2012 Chapter 4: The Poverty Trend in 2009-2012
P. 27
4.11 It should be noted that only recurrent cash benefits were taken into account
when estimating the impact of the abovementioned policy intervention. The effectiveness of poverty alleviation would be more visible when non-recurrent cash or in-kind benefits have been considered. To understand more about the changes in poverty indicators after factoring in non-recurrent cash benefits, please refer to Box 4.1. Box 4.2 illustrates the situation when means-tested in-kind benefits (such as PRH provision) are also taken into account.
4.II Poverty Trends of Different Age Groups
4.12 Analysing the poverty indicators by age gives the following observations (Figure 4.8)16:
Children aged 0-17: before policy intervention, the number of poor children decreased from 283 700 in 2009 to 253 600 in 2012. The respective poverty rate likewise declined from 25.4% to 24.2% over the same period. However, the poverty trend for children after recurrent cash intervention exhibited a slightly different pattern. The poverty rate remained relatively stable between 19.3% and 19.9%, despite a decrease in number of poor children over the same period.
People aged 18-64: the size of poor population and poverty rate for this age group were on the decrease both before and after policy
16 Computed based on poor population of all households. Hence, the number of poor elders aged 65 and above
is different from the number of persons living in elderly poor households (households with all members aged 65 and above) in Chapter 5.
181
76
22
50
294
2.7
1.1
0.3 0.7
4.4
0
1
2
3
4
5
6
7
0
50
100
150
200
250
300
350CSSA OAA** DA Education benefits All recurrent cash benefits
Reduction in poor population (LHS)
Reduction in poverty rate (RHS)
Including OALA, implemented w.e.f. 1 December 2012.General Household Survey, Census and Statistics Department.
('000 persons) (Percentage point(s))
Figure 4.7: Effectiveness of selected recurrent cash benefits in alleviating poverty, 2012
Note: (**)Source:
CSSA OAA** DA Education benefits All recurrent cash benefits
Reduction in poor 92 38 8 13 138households ('000)
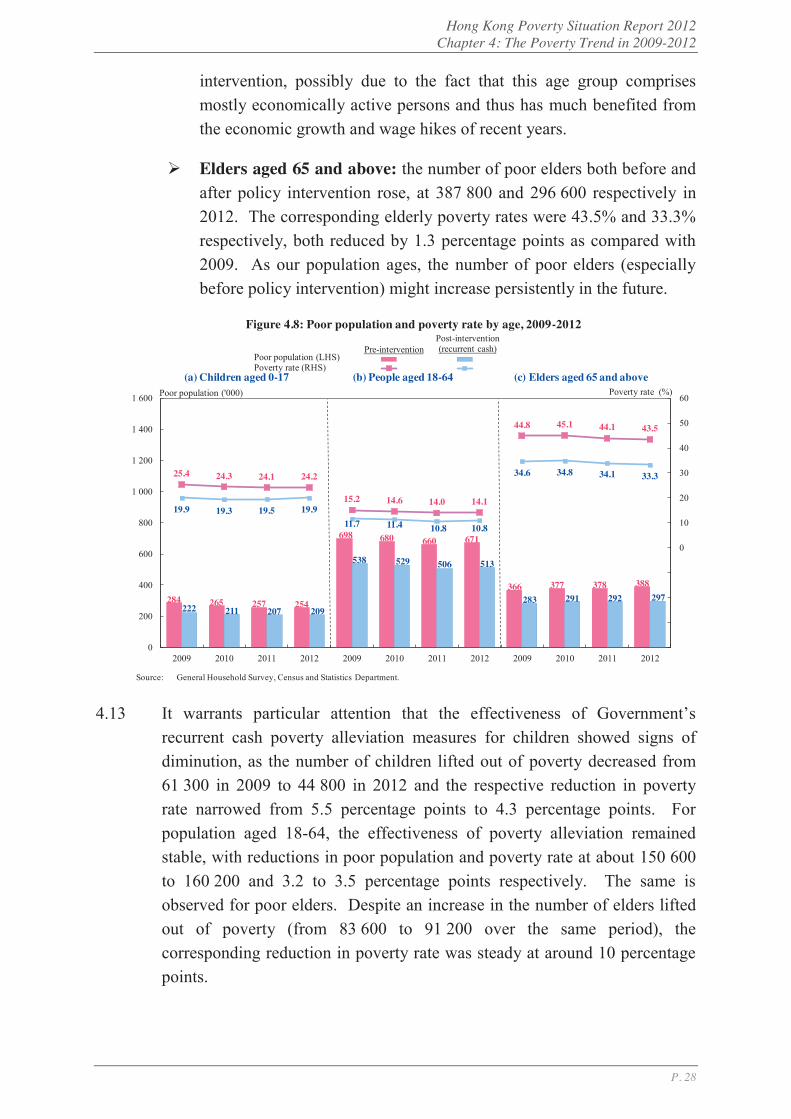
Hong Kong Poverty Situation Report 2012 Chapter 4: The Poverty Trend in 2009-2012
P. 28
intervention, possibly due to the fact that this age group comprises mostly economically active persons and thus has much benefited from the economic growth and wage hikes of recent years.
Elders aged 65 and above: the number of poor elders both before and after policy intervention rose, at 387 800 and 296 600 respectively in 2012. The corresponding elderly poverty rates were 43.5% and 33.3% respectively, both reduced by 1.3 percentage points as compared with 2009. As our population ages, the number of poor elders (especially before policy intervention) might increase persistently in the future.
4.13 It warrants particular attention that the effectiveness of Government’s recurrent cash poverty alleviation measures for children showed signs of diminution, as the number of children lifted out of poverty decreased from 61 300 in 2009 to 44 800 in 2012 and the respective reduction in poverty rate narrowed from 5.5 percentage points to 4.3 percentage points. For population aged 18-64, the effectiveness of poverty alleviation remained stable, with reductions in poor population and poverty rate at about 150 600 to 160 200 and 3.2 to 3.5 percentage points respectively. The same is observed for poor elders. Despite an increase in the number of elders lifted out of poverty (from 83 600 to 91 200 over the same period), the corresponding reduction in poverty rate was steady at around 10 percentage points.
284 265 257 254
698 680 660 671
366 377 378 388
222 211 207 209
538 529 506 513
283 291 292 297
25.4 24.3 24.1 24.2
15.2 14.6 14.0 14.1
44.8 45.1 44.1 43.5
19.9 19.3 19.5 19.911.7 11.4 10.8 10.8
34.6 34.8 34.1 33.3
(40)
(30)
(20)
(10)
0
10
20
30
40
50
60
0
200
400
600
800
1 000
1 200
1 400
1 600
2009 2010 2011 2012 2009 2010 2011 2012 2009 2010 2011 2012
Source: General Household Survey, Census and Statistics Department.
Poverty rate (%)Poor population ('000)
Figure 4.8: Poor population and poverty rate by age, 2009-2012
(a) Children aged 0-17 (b) People aged 18-64 (c) Elders aged 65 and above
Pre-interventionPost-intervention(recurrent cash)
Poor population (LHS)Poverty rate (RHS)
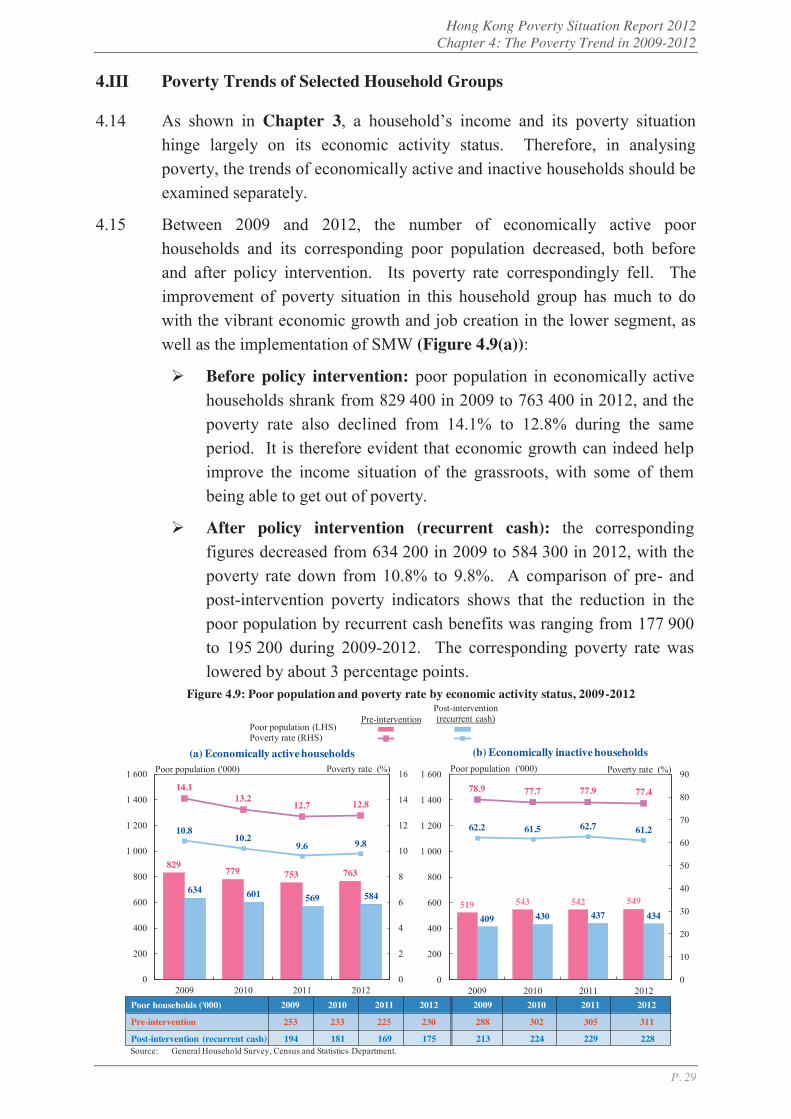
Hong Kong Poverty Situation Report 2012 Chapter 4: The Poverty Trend in 2009-2012
P. 29
4.III Poverty Trends of Selected Household Groups
4.14 As shown in Chapter 3, a household’s income and its poverty situation hinge largely on its economic activity status. Therefore, in analysing poverty, the trends of economically active and inactive households should be examined separately.
4.15 Between 2009 and 2012, the number of economically active poor households and its corresponding poor population decreased, both before and after policy intervention. Its poverty rate correspondingly fell. The improvement of poverty situation in this household group has much to do with the vibrant economic growth and job creation in the lower segment, as well as the implementation of SMW (Figure 4.9(a)):
Before policy intervention: poor population in economically active households shrank from 829 400 in 2009 to 763 400 in 2012, and the poverty rate also declined from 14.1% to 12.8% during the same period. It is therefore evident that economic growth can indeed help improve the income situation of the grassroots, with some of them being able to get out of poverty.
After policy intervention (recurrent cash): the corresponding figures decreased from 634 200 in 2009 to 584 300 in 2012, with the poverty rate down from 10.8% to 9.8%. A comparison of pre- and post-intervention poverty indicators shows that the reduction in the poor population by recurrent cash benefits was ranging from 177 900 to 195 200 during 2009-2012. The corresponding poverty rate was lowered by about 3 percentage points.
829779 753 763
634 601 569 584
14.1 13.2
12.7 12.8
10.8 10.2
9.6 9.8
0
2
4
6
8
10
12
14
16
0
200
400
600
800
1 000
1 200
1 400
1 600
2009 2010 2011 2012
Source: General Household Survey, Census and Statistics Department.
Poverty rate (%)Poor population ('000)
Figure 4.9: Poor population and poverty rate by economic activity status, 2009-2012
(a) Economically active households
Pre-interventionPost-intervention(recurrent cash)
519 543 542 549
409 430 437 434
62.2 61.5 62.7 61.2
78.9 77.7 77.9 77.4
0
10
20
30
40
50
60
70
80
90
0
200
400
600
800
1 000
1 200
1 400
1 600
2009 2010 2011 2012
Poverty rate (%)Poor population ('000)
(b) Economically inactive households
Poor population (LHS)Poverty rate (RHS)
Poor households ('000) 2009 2010 2011 2012 2009 2010 2011 2012
Pre-intervention 253 233 225 230 288 302 305 311
Post-intervention (recurrent cash) 194 181 169 175 213 224 229 228
Hong Kong Poverty Situation Report 2012 Chapter 4: The Poverty Trend in 2009-2012
P. 30
4.16 However, the improvement in the general poverty situation was partly offset by the increases in the number and population of economically inactive poor households amid demographic changes. It should be noted that among the population living in economically inactive poor households, some 80% were recipients of cash assistance such as CSSA, OAA and DA. In this regard, the post-recurrent cash intervention poverty indicators after taking into account these benefits may be more meaningful in reflecting the actual poverty situation of these households (Figure 4.9(b)):
As the number of economically inactive households and population increased substantially over the period, the respective poor population grew visibly from 409 200 in 2009 to 433 500 in 2012, representing an increase of 5.9%.
Relatively speaking, the poverty rate of economically inactive households was more stable, hovering at 61.2% to 62.7% between 2009 and 2012.
4.17 As mentioned in paragraph 4.6, the pre- and post-intervention total poverty gaps widened between 2009 and 2012, given the fact that a narrowing of poverty gap caused by a decrease in number of economically active poor households was more than offset by a widening caused by an increase in number of economically inactive households. From the policy effectiveness perspective, the Government has already reduced this gap considerably through recurrent cash benefits, among which $10.0 billion or 72% of the total reduction in 2012 was contributed by economically inactive poor households, most of them being recipients of these benefits (Figure 4.10).
9.99.3 9.3
9.8
6.05.4 5.4
5.8
0
2
4
6
8
10
12
14
16
18
20
2009 2010 2011 2012
Figure 4.10: Total annual poverty gap by economic activity status, 2009-2012
Pre-interventionPost-intervention (recurrent cash)
($ Bn)
4.0**(31%) 3.9**
(30%)3.9**
(30%)
The amount of reduction in total poverty gap after recurrent cash intervention. Figures in parentheses denote the figures represented as percentages of total reductions.General Household Survey, Census and Statistics Department.
(a) Economically active households (b) Economically inactive households
4.0**(28%)
15.5
16.6 17.6
19.0
6.8 7.4
8.3 9.0
0
2
4
6
8
10
12
14
16
18
20
2009 2010 2011 2012
Pre-interventionPost-intervention (recurrent cash)
($ Bn)
8.7**(69%)
9.2**(70%)
9.3**(70%)
10.0**(72%)
Notes:
Source:
(**)( )
Hong Kong Poverty Situation Report 2012 Chapter 4: The Poverty Trend in 2009-2012
P. 31
Box 4.1
Poverty Situation after Taking into Account Non-recurrent Cash Benefits
Apart from recurrent cash policies, the Government has in recent years also provided many non-recurrent cash benefits (including one-off measures), for example the provision of rates waiver, electricity charges subsidy, one additional month of social security payments, and public rental waiver, etc.17, involving a considerable amount of public resources. While CoP considered that the core analytical framework of the poverty line exercise should only cover recurrent cash benefits, the additional impact of non-recurrent cash items on poverty alleviation should also be estimated as supplementary information for general reference. This box article furnishes the poverty situation in 2009-2012 after taking into account these non-recurrent cash measures.
2. The poverty indicators improved over the period after considering the abovementioned policies. The number of poor households fell from 361 200 in 2009 to 312 500 in 2012, and the poor population and poverty rate declined from 936 600 and 14.3% in 2009 to 804 900 and 12.0% in 2012. The decline was particularly noticeable in 2011 due to the introduction of the “Scheme $6,000”. After netting out the effect of the “Scheme $6,000”, the poor population and poverty rate in 2011 and 2012 were both around 880 000 and 13.2% respectively. Given the additional fluctuation of poverty figures after including these measures in the estimation, it would be more appropriate to regard these figures as supplementary information (Figure 4.11).
17 For the coverage and estimation of non-recurrent cash benefits, please refer to Appendix 4.
1 348 1 322 1 295 1 312
1 043 1 031 1 005 1 018
937 910
720805
[876 (13.2%)] [882 (13.2%)]
0
200
400
600
800
1 000
1 200
1 400
1 600
2009 2010 2011 2012
Post-intervention (recurrent + non-recurrent cash)
Pre-intervention
Post-intervention(recurrent cash)
Post-intervention (recurrent + non-recurrent cash)
(20.1%)(20.6%)(19.6%)
Poor population ('000)
(16.0%) (15.7%) (15.2%)
Figure 4.11: Poor population and poverty rate after taking into account non-recurrent cash benefits, 2009-2012
(14.3%)
Figures in parentheses are the corresponding poverty rates.Figures in square brackets denote the corresponding poverty figures with the effect of the “Scheme $6,000” excluded. General Household Survey, Census and Statistics Department.
(19.6%)
(15.2%)
(13.8%)
(10.9%)(12.0%)
Poor households ('000) 2009 2010 2011 2012
Pre-intervention 541 536 530 541
Post-intervention (recurrent cash) 406 405 399 403
361 354 281 [339] 312 [341]
Notes: ( )[ ]
Source:
Hong Kong Poverty Situation Report 2012 Chapter 4: The Poverty Trend in 2009-2012
P. 32
Box 4.1 (Cont’d)
3. Compared with the situation in which only recurrent cash benefits are taken into account, the non-recurrent cash measures further increased the magnitude of poverty alleviation by around 45 000 to 61 600 households and 106 700 to 136 200 persons respectively between 2009 and 2012, having netted out the effect of “Scheme $6,000”. The poverty rate was further reduced by around 2 percentage points (Figure 4.12). Please refer to Appendix 6 for the corresponding detailed poverty statistics.
4. While the Government’s non-recurrent cash benefits can reduce the poverty rate by a further 2 percentage points, in terms of poverty alleviation, it is less effective than that of recurrent cash measures. Take the year of 2012 for example, non-recurrent cash benefits were estimated to involve $24.3 billion18. The estimated amount involved in CSSA was $13.7 billion, representing only 56.6% of the former, yet it could reduce the poverty rate by 2.7 percentage points. This is because the non-recurrent measures 19 aim at alleviating burden of the general public, with most benefits not targeted at poor households. As a result, their poverty alleviation impact is clearly less effective than that of recurrent, targeted cash benefits, in spite of a massive amount of resources devoted by the Government. 18 Excluding the effect of “Scheme $6,000”.
19 Measures funded by CCF aim at assisting households and people with financial difficulties, e.g. provision of one-off allowance of $6,000 to new arrivals. These measures lifted 11 000 people out of poverty or reduced the poverty rate by 0.1 percentage point in 2012. It should be noted that while the individual poverty alleviation effect of CCF measures was not significant, low-income households benefited from CFF might also be covered by other benefits, thereby further magnifying the composite effect of poverty alleviation. In addition, as the CCF implements more measures to “plug the gaps” in the existing welfare system, the expected poverty alleviation effect in 2013 and beyond should be more prominent.
305 291 290 294
412 412 419 431
4.6 4.4 4.4 4.4
6.3 6.3 6.4 6.4
0
1
2
3
4
5
6
7
8
0
100
200
300
400
500
6002009 2010 2011 2012
1 2
3 4
Note: Excluding the effect of “Scheme $6,000”.Source: General Household Survey, Census and Statistics Department.
('000 persons) (Percentage point(s))
Poor population (LHS)Poverty rate (RHS)
Post-intervention(recurrent cash)
Post-intervention(recurrent + non-recurrent cash)
Figure 4.12: Effectiveness of non-recurrent cash benefits in alleviating poverty, 2009-2012
Reduction in
Reduction in poor households ('000) 2009 2010 2011 2012
Post-intervention (recurrent cash) 135 130 131 138
Post-intervention 180 181 192 199(recurrent + non-recurrent cash)
Hong Kong Poverty Situation Report 2012 Chapter 4: The Poverty Trend in 2009-2012
P. 33
Box 4.2
The Effectiveness of In-kind Benefits in Poverty Alleviation
Box 2.1 in Chapter 2 of this Report elaborates on CoP’s discussion on various cash benefits when deciding on the coverage of policy intervention items. Besides, CoP also noted that the Government has helped eligible grassroots through a number of means-tested in-kind benefits. Among these, the provision of PRH is one of the most crucial large-scale policies with strong impact on low-income households given that housing costs are normally one of the major household expenditure items. Those who secured a PRH enjoy rents lower than market levels, with their housing needs met.
2. CoP considered that PRH is effective in improving the livelihood of the grassroots. On the one hand, as an important poverty alleviation policy of the Government, it should be included in the analytical framework of poverty line in order to assess its policy effectiveness. On the other hand, CoP recognised that the benefit transfer from PRH is not an actual cash subsidy which directly increases the disposable income in the “pocket” of a household. Therefore, quantifying its effect as part of household income would be controversial, and further research on how to enhance the estimation is necessary before incorporating it into the core poverty analytical framework. At this stage, it is more appropriate to estimate its impact separately as supplementary information, similar to non-recurrent cash benefits.
How to estimate in-kind transfer from the provision of PRH
3. In fact, the opportunity cost approach adopted by C&SD is the mainstream approach used internationally (such as OECD and EU) to estimate in-kind transfer to tenants of PRH. Simply put, the opportunity cost that Government incurred in letting out the PRH flat to beneficiaries, i.e. the difference between its market rent (estimated based on the assumption that the unit could be leased in an open market20) and actual rent paid by the household, is estimated as the in-kind transfer to PRH households21.
4. Take a PRH flat of Tin Heng Estate in Tin Shui Wai as an example. In 2012, the actual monthly rent payable was about $1,300. According to the estimation, if the flat had been leased in the private market, the prevailing market rent would have been about $3,200 per month. The difference of $1,900 was then the estimated in-kind transfer to the tenant. It is worth noting that the actual monthly rent of a similar flat in the private market (say, a flat in Tin Shing Court) during that period was as high as
20 Estimated based on information provided by the Rating and Valuation Department (R&VD).
21 For details as regards estimations of various kinds of benefits and their limitations, please see Appendix 4 and Appendix 5.

Hong Kong Poverty Situation Report 2012 Chapter 4: The Poverty Trend in 2009-2012
P. 34
Box 4.2 (Cont’d)
$6,400. Hence, this approach should be on the conservative side and should not over-estimate the PRH benefit transfer.
5. After rounds of thorough discussions, CoP came to the view that the existing method adopted by C&SD for estimating the PRH benefit transfer should be scientific, objective and conservative enough to reasonably reflect the policy effectiveness of PRH in poverty alleviation. While some suggested that household income after key expenditure (e.g. household income after deducting housing costs) should be used to measure poverty, such data are not available in GHS of C&SD. This limitation has been discussed in Section 2.I and will not be repeated here.
Estimation results
6. The number of poor households, poor population and poverty rate after policy intervention (recurrent cash + in-kind benefits) are shown in Figure 4.13. Similar to the original poverty indicators before and after recurrent cash intervention, a downward trend is observed between 2009 and 2012 after including in-kind benefits in the estimation, in addition to lower levels and rates. In comparison with the poverty situation after recurrent cash intervention, PRH and other in-kind benefits lifted up the livelihood of 122 100 to 131 300 households (or 317 400 to 343 700 persons) each year to a level equivalent to or above the poverty line. The poverty rate saw a further reduction of about 5 percentage points (Figure 4.14). These findings absolutely do not purport to manipulate the poverty figures, but only aim at providing reference for assessing the effectiveness of in-kind benefits in poverty alleviation.
1 348 1 322 1 295 1 312
1 043 1 031 1 005 1 018
726 699 675 674
0
200
400
600
800
1 000
1 200
1 400
1 600
2009 2010 2011 2012
Post-intervention (recurrent cash +in-kind)
Pre-intervention
Post-intervention (recurrent cash)
Post-intervention (recurrent cash + in-kind)
(20.1%)(20.6%)(19.6%)
Poor population ('000)
(16.0%) (15.7%) (15.2%)
Figure 4.13: Poor population and poverty rate after taking into account in-kind benefits, 2009-2012
(11.1%)
Note: ( ) Figures in parentheses denote the corresponding poverty rates.Source: General Household Survey, Census and Statistics Department.
(19.6%)
(15.2%)
(10.6%) (10.2%) (10.1%)
Poor households ('000) 2009 2010 2011 2012
Pre-intervention 541 536 530 541
Post-intervention (recurrent cash) 406 405 399 403
284 278 271 272
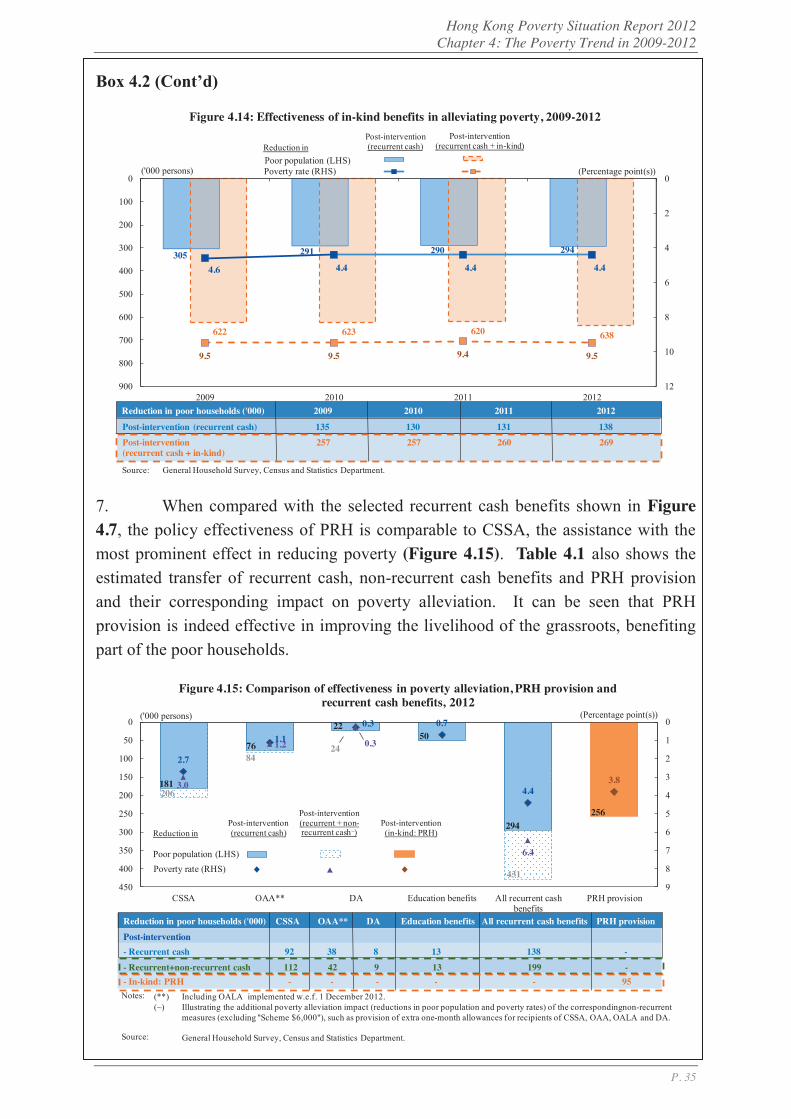
Hong Kong Poverty Situation Report 2012 Chapter 4: The Poverty Trend in 2009-2012
P. 35
Box 4.2 (Cont’d)
7. When compared with the selected recurrent cash benefits shown in Figure 4.7, the policy effectiveness of PRH is comparable to CSSA, the assistance with the most prominent effect in reducing poverty (Figure 4.15). Table 4.1 also shows the estimated transfer of recurrent cash, non-recurrent cash benefits and PRH provision and their corresponding impact on poverty alleviation. It can be seen that PRH provision is indeed effective in improving the livelihood of the grassroots, benefiting part of the poor households.
305 291 290 294
622 623 620 638
4.6 4.4 4.4 4.4
9.5 9.5 9.4 9.5
0
2
4
6
8
10
12
0
100
200
300
400
500
600
700
800
9002009 2010 2011 2012
1 2
3 4
Source: General Household Survey, Census and Statistics Department.
('000 persons) (Percentage point(s))Poor population (LHS)Poverty rate (RHS)
Figure 4.14: Effectiveness of in-kind benefits in alleviating poverty, 2009-2012Post-intervention(recurrent cash)
Post-intervention(recurrent cash + in-kind)Reduction in
Reduction in poor households ('000) 2009 2010 2011 2012
Post-intervention (recurrent cash) 135 130 131 138
Post-intervention 257 257 260 269(recurrent cash + in-kind)
206
8424
431
181
76
22 50
294 256
2.7
1.1
0.3 0.7
4.4 3.8 3.0
1.2 0.3
6.4
0
1
2
3
4
5
6
7
8
9
0
50
100
150
200
250
300
350
400
450CSSA OAA** DA Education benefits All recurrent cash
benefitsPRH provision
Figure 4.15: Comparison of effectiveness in poverty alleviation, PRH provision and recurrent cash benefits, 2012
Notes:
Source:
('000 persons) (Percentage point(s))
Including OALA implemented w.e.f. 1 December 2012.Illustrating the additional poverty alleviation impact (reductions in poor population and poverty rates) of the correspondingnon-recurrent measures (excluding "Scheme $6,000"), such as provision of extra one-month allowances for recipients of CSSA, OAA, OALA and DA.
General Household Survey, Census and Statistics Department.
Post-intervention(recurrent cash)
Poor population (LHS)Poverty rate (RHS)
Post-intervention(recurrent + non-recurrent cash~)
Post-intervention(in-kind: PRH)Reduction in
Reduction in poor households ('000) CSSA OAA** DA Education benefits All recurrent cash benefits PRH provision
Post-intervention- Recurrent cash 92 38 8 13 138 -
- Recurrent+non-recurrent cash 112 42 9 13 199 -- In-kind: PRH - - - - - 95
(**) (~)

Hong Kong Poverty Situation Report 2012 Chapter 4: The Poverty Trend in 2009-2012
P. 36
Box 4.2 (Cont’d)
Table 4.1: Estimated transfers and impact on poverty alleviation by policy category, 2012
Item Estimated transfer ($ Bn)
Proportion of transfer enjoyed by
poor households (%)
Reduction in poverty rate (% point(s))
Recurrent cash 27.2 70.1 4.4
Non-recurrent cash** 24.3 16.9 2.0
PRH provision 24.7 37.1 3.8
Note: (**) Excluding the effect of “Scheme $6,000”. Source: General Household Survey, Census and Statistics Department.
4.IV Key Observations
4.18 The persistently sturdy labour market and implementation of the SMW in 2011 have brought about visible improvement in earnings of grassroots workers over the past few years. In the light of this, the corresponding sizes of the poor population and poverty rates before and after policy intervention in 2012 were:
Before policy intervention: 1 312 300 and 19.6%;
After policy intervention (recurrent cash): 1 017 800 and 15.2%;
After policy intervention (recurrent + non-recurrent cash): 804 900 and 12.0%; and
After policy intervention (recurrent cash + in-kind): 674 200 and 10.1%, among which the provision of PRH contributed most to the estimation of in-kind benefits.
4.19 Hence, in spite of the upshifted poverty line thresholds due to increased median household income amid steady economic growth, the number of poor households, poor population and its corresponding poverty rate, both before and after policy intervention, have decreased over the period, reflecting a general improvement in Hong Kong’s poverty situation. Take the 2012 poor population and poverty rate after recurrent cash intervention as an example, the figures are broadly similar to as those in 2011 (1 005 400 and 15.2% respectively), yet both lower than those in 2009 (1 043 400 and 16.0%).
4.20 The Government attaches great importance to poverty alleviation and has been allocating a substantial resources to various welfare and support programmes. Comparing poverty statistics before and after recurrent cash

Hong Kong Poverty Situation Report 2012 Chapter 4: The Poverty Trend in 2009-2012
P. 37
intervention revealed that recurrent cash benefits have lifted 289 600 to 305 000 people out of poverty between 2009 and 2012, and have reduced poverty rate by 4.4 to 4.6 percentage points, reflecting a stable magnitude of poverty alleviation by these measures. Such magnitude would be even greater if non-recurrent cash benefits or in-kind benefits have been taken into account.
4.21 Since the income distributions of economically active and inactive households are obviously different, they should be separately studied when analysing changes in poverty indicators. While the shrinkage in poor population in economically active households has much to do with economic growth and improvement in income of grassroots, the increase in poor population in economically inactive households is partly due to a rise in number of retired elders amid population ageing. This has offset, to some extent, the improvement in overall poverty situation.

Hong Kong Poverty Situation Report 2012 Chapter 5: A Detailed Analysis of the Poverty Situation in 2012
P. 38
5 A Detailed Analysis of the Poverty Situation in 2012
5.1 Chapter 4 describes the latest trends of poverty situation in Hong Kong. As the last section of our poverty line analysis, this chapter focuses on the poverty situation in 2012 and analyses in detail the characteristics of various household groups with income below the poverty line. The multi-perspective analysis serves to provide a more comprehensive understanding of the forms and manners by which poverty is manifested and their underlying causes.
5.2 As explained in Chapter 2, the poverty situation can be analysed by making reference to four major household characteristics (paragraph 2.12) under the analytical framework endorsed by CoP. Given that some of the selected socio-economic household groups are usually considered by the community as the relatively underprivileged in need of assistance, this chapter puts particular emphasis on analysing the causes and features of their poverty situation (Figure 5.1).
Figure 5.1: Selected socio-economic household groups under the analytical framework endorsed by CoP
Note: Some of the above household groups are not mutually exclusive. For example, an elderly household may also be classified as an economically inactive household and a single-parent household may be receiving CSSA. For their definitions, please refer to the Glossary.
5.3 This chapter involves detailed analyses with extensive use of statistics. To facilitate understanding of the information and analysis results, this chapter can be broadly divided into five main sections as follows:
Analysis of the poverty situation by selected household group: an examination of poor households and poverty rates with reference to
Poor households
Economic characteristics
Working
Unemployed
Economically active
Economically inactive
Youth CSSA
New-arrival
Social characteristics
Elderly
With-children
Single-parent
Hong Kong Poverty Situation Report 2012 Chapter 5: A Detailed Analysis of the Poverty Situation in 2012
P. 39
major characteristics, especially the changes in poverty indicators before and after policy intervention;
Focused studies of the properties of poverty: comparing the profiles of selected poor households with those of non-poor households, and analysing the properties of their poverty in greater depth;
Analysis of the causes of poverty in terms of socio-economic characteristics: analysing the causes of poverty in the light of the characteristics of selected household groups;
Analysis of the poverty features of selected poor household groups: summarising and comparing the socio-economic characteristics of the poor in different selected groups; drawing on other supporting statistics to provide reference about their assets / liabilities status and financial needs; and
Analysis of the poverty situation by district: studying the poverty situation in the 18 District Council districts for a better understanding of the causes of poverty in various districts.
5.4 The profile of each selected socio-economic group of poor households with handy statistics and diagrams is set out in the last section of this chapter for quick reference. Detailed tabulations are shown in Appendix 6.
5.I Poverty Situation by Selected Household Group
5.5 In 2012, Hong Kong’s poor population after recurrent cash intervention was 1 017 800, involving 403 000 households. Compared with the corresponding figures before intervention (1 312 300 and 540 600), the poor population and households were reduced by 294 500 (or 22.4%) and 137 600 (or 25.5%) respectively, demonstrating the effectiveness of policy intervention.
5.6 Over the same period, the post-intervention (recurrent cash) poverty rate, at 15.2%, was lower than the pre-intervention poverty rate of 19.6%, by 4.4 percentage points. An analysis by selected household group shows that policy intervention generally helped alleviate poverty, but the magnitude varied across households with different socio-economic characteristics.
(a) Analysis by socio-economic characteristic
5.7 Both before and after policy intervention, poor population was relatively concentrated among those households with children, those receiving CSSA and those solely with elders. On the contrary, the size of poor population in youth households was the smallest (less than 5 000 persons). Poor
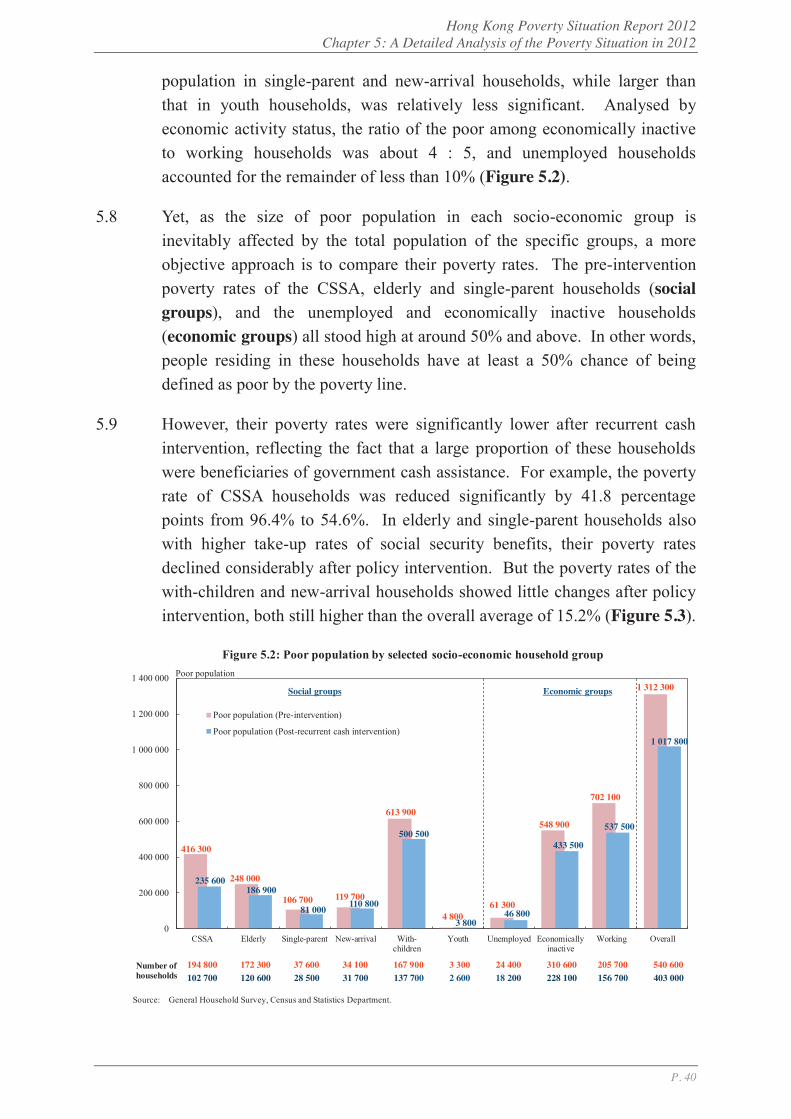
Hong Kong Poverty Situation Report 2012 Chapter 5: A Detailed Analysis of the Poverty Situation in 2012
P. 40
population in single-parent and new-arrival households, while larger than that in youth households, was relatively less significant. Analysed by economic activity status, the ratio of the poor among economically inactive to working households was about 4 : 5, and unemployed households accounted for the remainder of less than 10% (Figure 5.2).
5.8 Yet, as the size of poor population in each socio-economic group is inevitably affected by the total population of the specific groups, a more objective approach is to compare their poverty rates. The pre-intervention poverty rates of the CSSA, elderly and single-parent households (social groups), and the unemployed and economically inactive households (economic groups) all stood high at around 50% and above. In other words, people residing in these households have at least a 50% chance of being defined as poor by the poverty line.
5.9 However, their poverty rates were significantly lower after recurrent cash intervention, reflecting the fact that a large proportion of these households were beneficiaries of government cash assistance. For example, the poverty rate of CSSA households was reduced significantly by 41.8 percentage points from 96.4% to 54.6%. In elderly and single-parent households also with higher take-up rates of social security benefits, their poverty rates declined considerably after policy intervention. But the poverty rates of the with-children and new-arrival households showed little changes after policy intervention, both still higher than the overall average of 15.2% (Figure 5.3).
416 300
248 000
106 700 119 700
613 900
4 80061 300
548 900
702 100
1 312 300
235 600186 900
81 000 110 800
500 500
3 80046 800
433 500
537 500
1 017 800
0
200 000
400 000
600 000
800 000
1 000 000
1 200 000
1 400 000
CSSA Elderly Single-parent New-arrival With-children
Youth Unemployed Economicallyinactive
Working Overall
Poor population (Pre-intervention)
Poor population (Post-recurrent cash intervention)
Source: General Household Survey, Census and Statistics Department.
Figure 5.2: Poor population by selected socio-economic household groupPoor population
102 700 120 600 28 500 31 700 137 700 2 600 18 200 228 100 156 700 403 000
Social groups Economic groups
194 800 172 300 37 600 34 100 167 900 3 300 24 400 310 600 205 700 540 600 Number of households
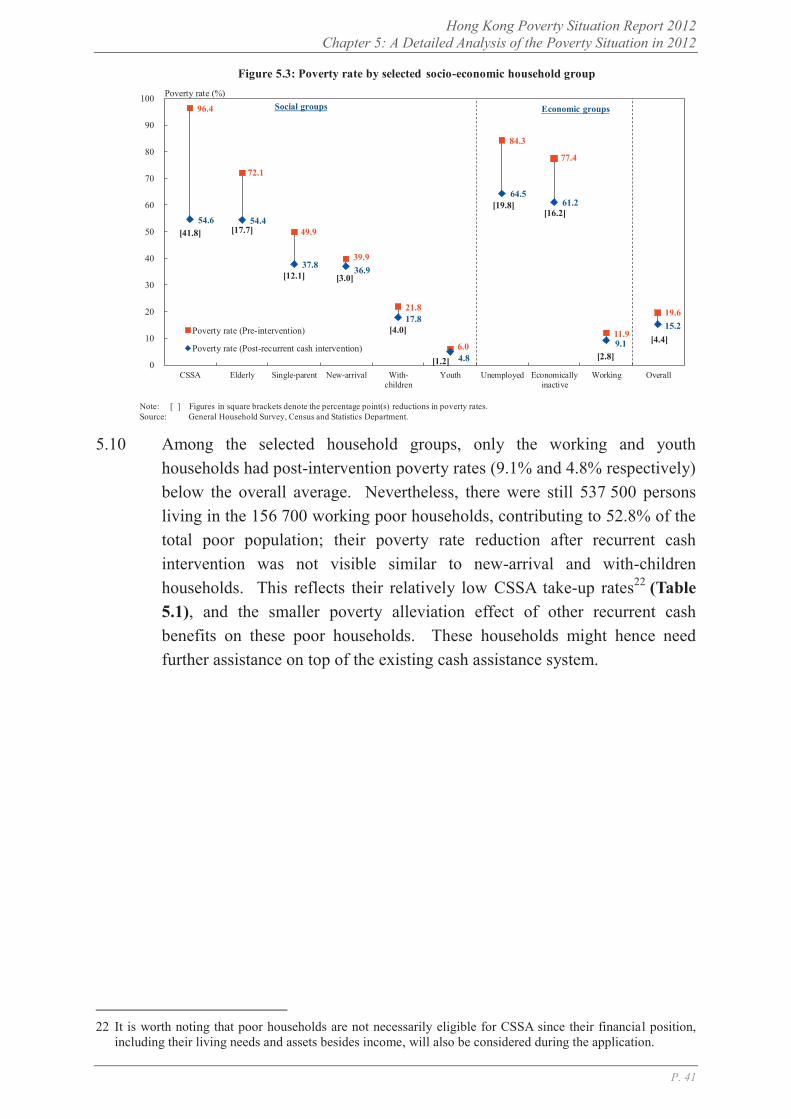
Hong Kong Poverty Situation Report 2012 Chapter 5: A Detailed Analysis of the Poverty Situation in 2012
P. 41
5.10 Among the selected household groups, only the working and youth
households had post-intervention poverty rates (9.1% and 4.8% respectively) below the overall average. Nevertheless, there were still 537 500 persons living in the 156 700 working poor households, contributing to 52.8% of the total poor population; their poverty rate reduction after recurrent cash intervention was not visible similar to new-arrival and with-children households. This reflects their relatively low CSSA take-up rates22 (Table 5.1), and the smaller poverty alleviation effect of other recurrent cash benefits on these poor households. These households might hence need further assistance on top of the existing cash assistance system.
22 It is worth noting that poor households are not necessarily eligible for CSSA since their financial position,
including their living needs and assets besides income, will also be considered during the application.
96.4
72.1
49.9
39.9
21.8
6.0
84.3
77.4
11.9
19.6
54.6 54.4
37.8 36.9
17.8
4.8
64.561.2
9.1
15.2
0
10
20
30
40
50
60
70
80
90
100
CSSA Elderly Single-parent New-arrival With-children
Youth Unemployed Economicallyinactive
Working Overall
Poverty rate (Pre-intervention)
Poverty rate (Post-recurrent cash intervention)
Note: [ ] Figures in square brackets denote the percentage point(s) reductions in poverty rates.Source: General Household Survey, Census and Statistics Department.
Figure 5.3: Poverty rate by selected socio-economic household group Poverty rate (%)
Social groups Economic groups
[41.8]
[4.4]
[2.8]
[16.2][19.8]
[1.2]
[4.0]
[3.0][12.1]
[17.7]
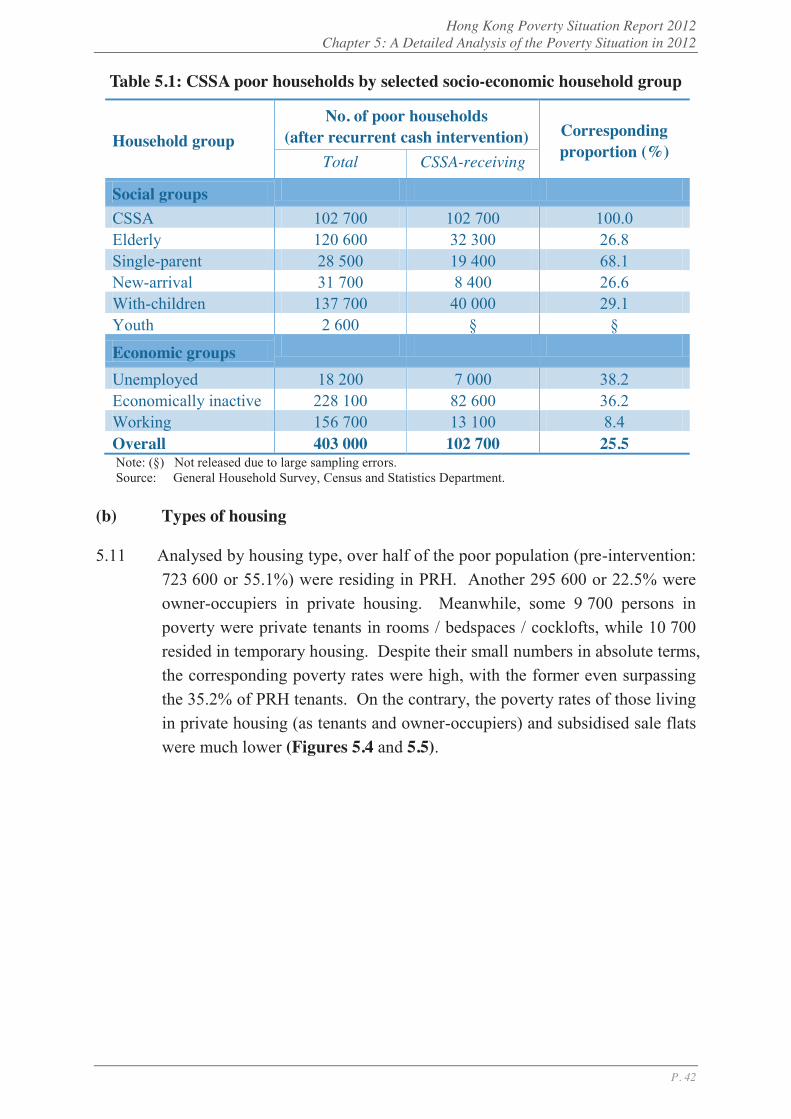
Hong Kong Poverty Situation Report 2012 Chapter 5: A Detailed Analysis of the Poverty Situation in 2012
P. 42
Table 5.1: CSSA poor households by selected socio-economic household group
Household group No. of poor households
(after recurrent cash intervention) Corresponding proportion (%) Total CSSA-receiving
Social groups
CSSA 102 700 102 700 100.0 Elderly 120 600 32 300 26.8 Single-parent 28 500 19 400 68.1 New-arrival 31 700 8 400 26.6 With-children 137 700 40 000 29.1 Youth 2 600 § §
Economic groups
Unemployed 18 200 7 000 38.2 Economically inactive 228 100 82 600 36.2 Working 156 700 13 100 8.4 Overall 403 000 102 700 25.5
Note: (§) Not released due to large sampling errors. Source: General Household Survey, Census and Statistics Department.
(b) Types of housing
5.11 Analysed by housing type, over half of the poor population (pre-intervention: 723 600 or 55.1%) were residing in PRH. Another 295 600 or 22.5% were owner-occupiers in private housing. Meanwhile, some 9 700 persons in poverty were private tenants in rooms / bedspaces / cocklofts, while 10 700 resided in temporary housing. Despite their small numbers in absolute terms, the corresponding poverty rates were high, with the former even surpassing the 35.2% of PRH tenants. On the contrary, the poverty rates of those living in private housing (as tenants and owner-occupiers) and subsidised sale flats were much lower (Figures 5.4 and 5.5).
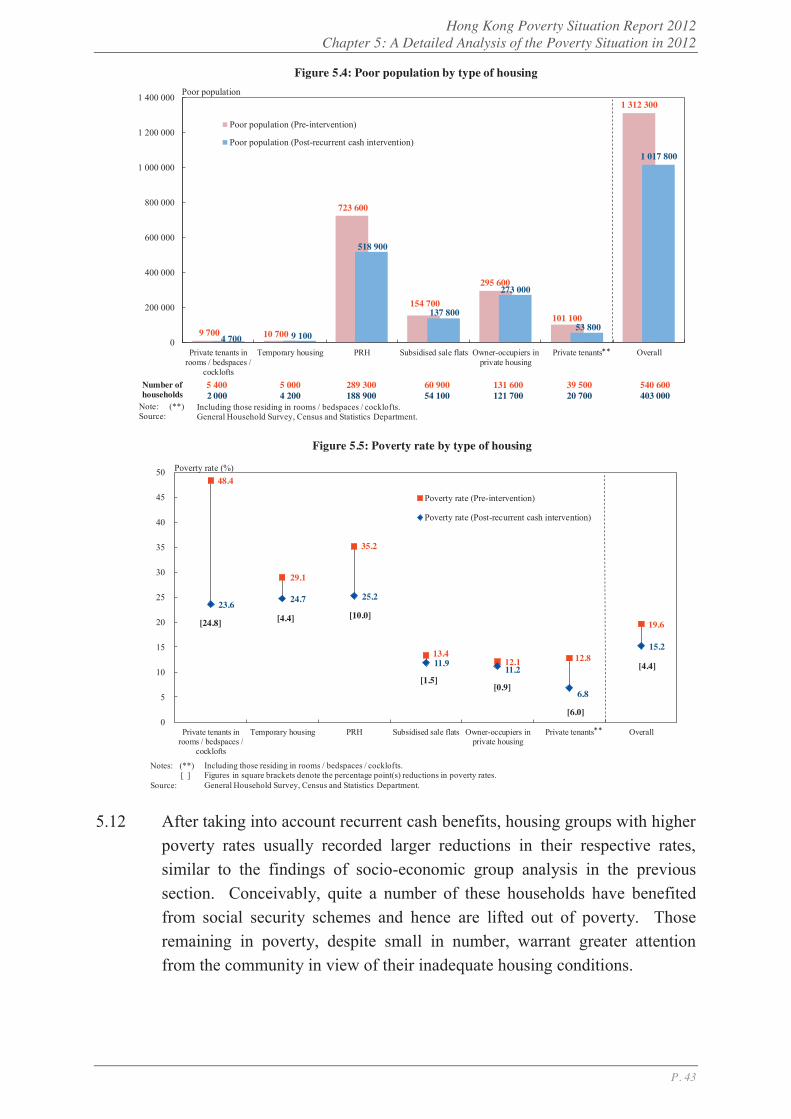
Hong Kong Poverty Situation Report 2012 Chapter 5: A Detailed Analysis of the Poverty Situation in 2012
P. 43
5.12 After taking into account recurrent cash benefits, housing groups with higher poverty rates usually recorded larger reductions in their respective rates, similar to the findings of socio-economic group analysis in the previous section. Conceivably, quite a number of these households have benefited from social security schemes and hence are lifted out of poverty. Those remaining in poverty, despite small in number, warrant greater attention from the community in view of their inadequate housing conditions.
9 700 10 700
723 600
154 700
295 600
101 100
1 312 300
4 700 9 100
518 900
137 800
273 000
53 800
1 017 800
0
200 000
400 000
600 000
800 000
1 000 000
1 200 000
1 400 000
Private tenants inrooms / bedspaces /
cocklofts
Temporary housing PRH Subsidised sale flats Owner-occupiers inprivate housing
Private tenants Overall
Poor population (Pre-intervention)
Poor population (Post-recurrent cash intervention)
Note: (**)Source:
Including those residing in rooms / bedspaces / cocklofts.General Household Survey, Census and Statistics Department.
Figure 5.4: Poor population by type of housingPoor population
2 000 4 200 188 900 54 100 121 700 20 700 403 000 5 400 5 000 289 300 60 900 131 600 39 500 540 600
**
Number of households
48.4
29.1
35.2
13.412.1 12.8
19.6
23.6 24.7 25.2
11.911.2
6.8
15.2
0
5
10
15
20
25
30
35
40
45
50
Private tenants inrooms / bedspaces /
cocklofts
Temporary housing PRH Subsidised sale flats Owner-occupiers inprivate housing
Private tenants Overall
Poverty rate (Pre-intervention)
Poverty rate (Post-recurrent cash intervention)
Figure 5.5: Poverty rate by type of housing
Poverty rate (%)
Notes: (**)[ ]
Source:
Including those residing in rooms / bedspaces / cocklofts.Figures in square brackets denote the percentage point(s) reductions in poverty rates.General Household Survey, Census and Statistics Department.
[24.8]
[6.0]
[0.9][1.5]
[10.0][4.4]
[4.4]
**
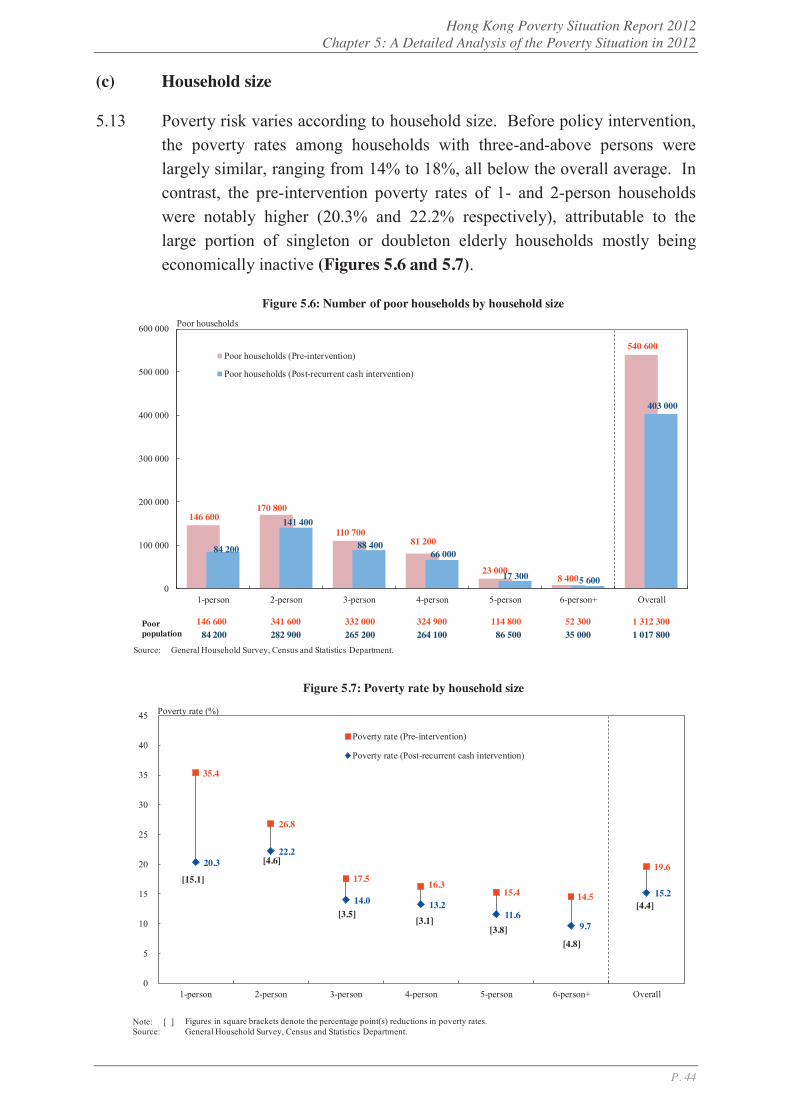
Hong Kong Poverty Situation Report 2012 Chapter 5: A Detailed Analysis of the Poverty Situation in 2012
P. 44
(c) Household size
5.13 Poverty risk varies according to household size. Before policy intervention, the poverty rates among households with three-and-above persons were largely similar, ranging from 14% to 18%, all below the overall average. In contrast, the pre-intervention poverty rates of 1- and 2-person households were notably higher (20.3% and 22.2% respectively), attributable to the large portion of singleton or doubleton elderly households mostly being economically inactive (Figures 5.6 and 5.7).
146 600170 800
110 70081 200
23 0008 400
540 600
84 200
141 400
88 40066 000
17 300 5 600
403 000
0
100 000
200 000
300 000
400 000
500 000
600 000
1-person 2-person 3-person 4-person 5-person 6-person+ Overall
Poor households (Pre-intervention)
Poor households (Post-recurrent cash intervention)
Source: General Household Survey, Census and Statistics Department.
Figure 5.6: Number of poor households by household sizePoor households
84 200 282 900 265 200 264 100 86 500 35 000 1 017 800146 600 341 600 332 000 324 900 114 800 52 300 1 312 300 Poor
population
35.4
26.8
17.5 16.315.4 14.5
19.620.322.2
14.0 13.211.6
9.7
15.2
0
5
10
15
20
25
30
35
40
45
1-person 2-person 3-person 4-person 5-person 6-person+ Overall
Poverty rate (Pre-intervention)
Poverty rate (Post-recurrent cash intervention)
Figure 5.7: Poverty rate by household size
Poverty rate (%)
Note: [ ]Source:
Figures in square brackets denote the percentage point(s) reductions in poverty rates.General Household Survey, Census and Statistics Department.
[15.1]
[4.8][3.8]
[3.1][3.5]
[4.6]
[4.4]
Hong Kong Poverty Situation Report 2012 Chapter 5: A Detailed Analysis of the Poverty Situation in 2012
P. 45
5.II Key Socio-economic Characteristics of Poor Households and Population
5.14 After recurrent cash intervention in 2012, there were still 403 000 households with 1 017 800 persons living below the poverty line in Hong Kong. To understand the causes and properties of poverty as a reference for policy formation, it is worth examining the socio-economic characteristics of the poor households and population. Comparing these poor households with non-poor households yields the following observations (Figure 5.8):
Mostly workless: 56.6% of the poor households were economically
inactive, distinctly higher than the 9.5% of the non-poor households;
Small household size: 56.0% of the poor households were singleton and doubleton, while the corresponding proportion among the non-poor was lower (41.6%);
High ratio of elderly: 29.9% of the poor households were elderly households23, much higher than the 6.2% of their counterpart; and
Many were receiving CSSA or residing in PRH: Nearly half (46.9%) of the poor households had secured PRH and over one-quarter (25.5%) were receiving CSSA. Both numbers were significantly higher than those of the non-poor households.
5.15 The key characteristics of the poor population (amounted to 1 017 800 persons) were (Figure 5.9):
23 Despite the fact that most of the members are in lack of employment income and hence living below the
poverty line, they might not face economic difficulties. Please refer to Section 5.IV(c) for supplementary information.
46.9
25.5
29.9
56.0
56.6
27.2
4.9
6.2
41.6
9.5
0 10 20 30 40 50 60
in PRH
CSSA
Elderly
1- and 2-person
Economicallyinactive
Shares of households with respective socio-economic characteristics in total (%)
Non-poor (1 983 500 households)
Poor (403 000 households)
Note: ( )Source:
Figures in parentheses denote the corresponding numbers of households.General Household Survey, Census and Statistics Department.
Figure 5.8: Selected socio-economic characteristics of poor households
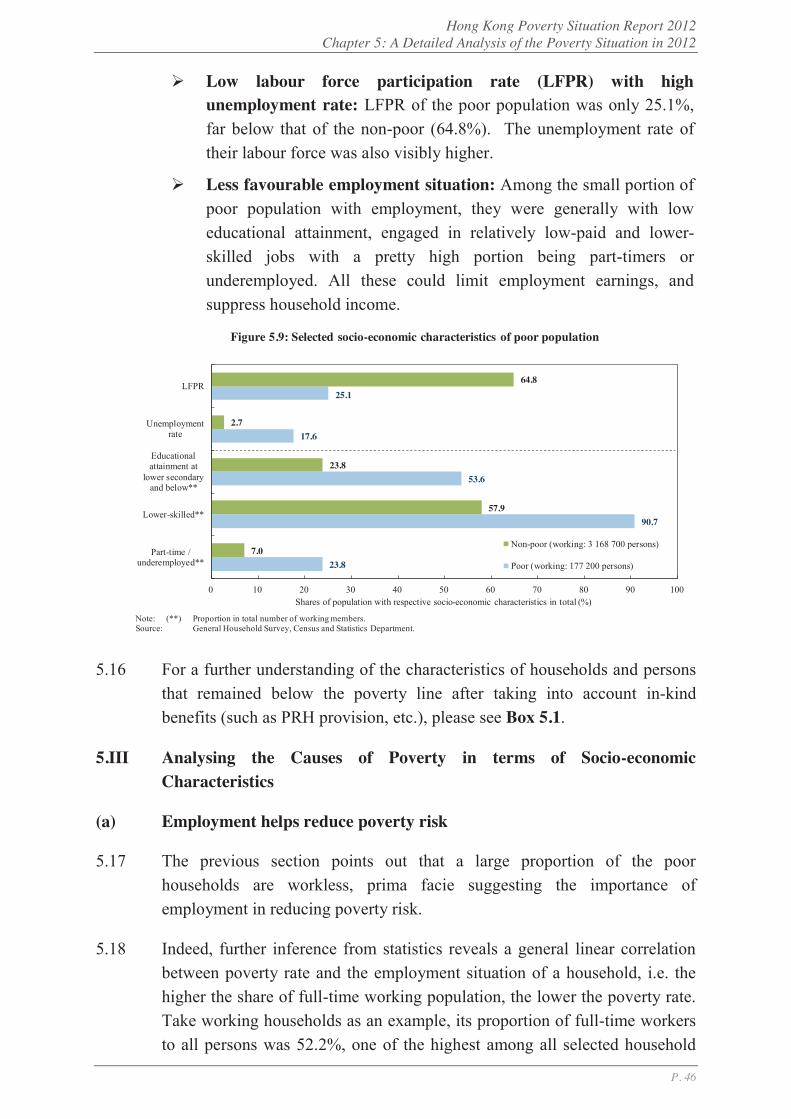
Hong Kong Poverty Situation Report 2012 Chapter 5: A Detailed Analysis of the Poverty Situation in 2012
P. 46
Low labour force participation rate (LFPR) with high unemployment rate: LFPR of the poor population was only 25.1%, far below that of the non-poor (64.8%). The unemployment rate of their labour force was also visibly higher.
Less favourable employment situation: Among the small portion of poor population with employment, they were generally with low educational attainment, engaged in relatively low-paid and lower-skilled jobs with a pretty high portion being part-timers or underemployed. All these could limit employment earnings, and suppress household income.
5.16 For a further understanding of the characteristics of households and persons
that remained below the poverty line after taking into account in-kind benefits (such as PRH provision, etc.), please see Box 5.1.
5.III Analysing the Causes of Poverty in terms of Socio-economic Characteristics
(a) Employment helps reduce poverty risk
5.17 The previous section points out that a large proportion of the poor households are workless, prima facie suggesting the importance of employment in reducing poverty risk.
5.18 Indeed, further inference from statistics reveals a general linear correlation between poverty rate and the employment situation of a household, i.e. the higher the share of full-time working population, the lower the poverty rate. Take working households as an example, its proportion of full-time workers to all persons was 52.2%, one of the highest among all selected household
23.8
90.7
53.6
17.6
25.1
7.0
57.9
23.8
2.7
64.8
0 10 20 30 40 50 60 70 80 90 100
Part-time /underemployed**
Lower-skilled**
Educationalattainment at
lower secondaryand below**
Unemploymentrate
LFPR
Shares of population with respective socio-economic characteristics in total (%)
Non-poor (working: 3 168 700 persons)
Poor (working: 177 200 persons)
Note: (**)Source:
Proportion in total number of working members.General Household Survey, Census and Statistics Department.
Figure 5.9: Selected socio-economic characteristics of poor population
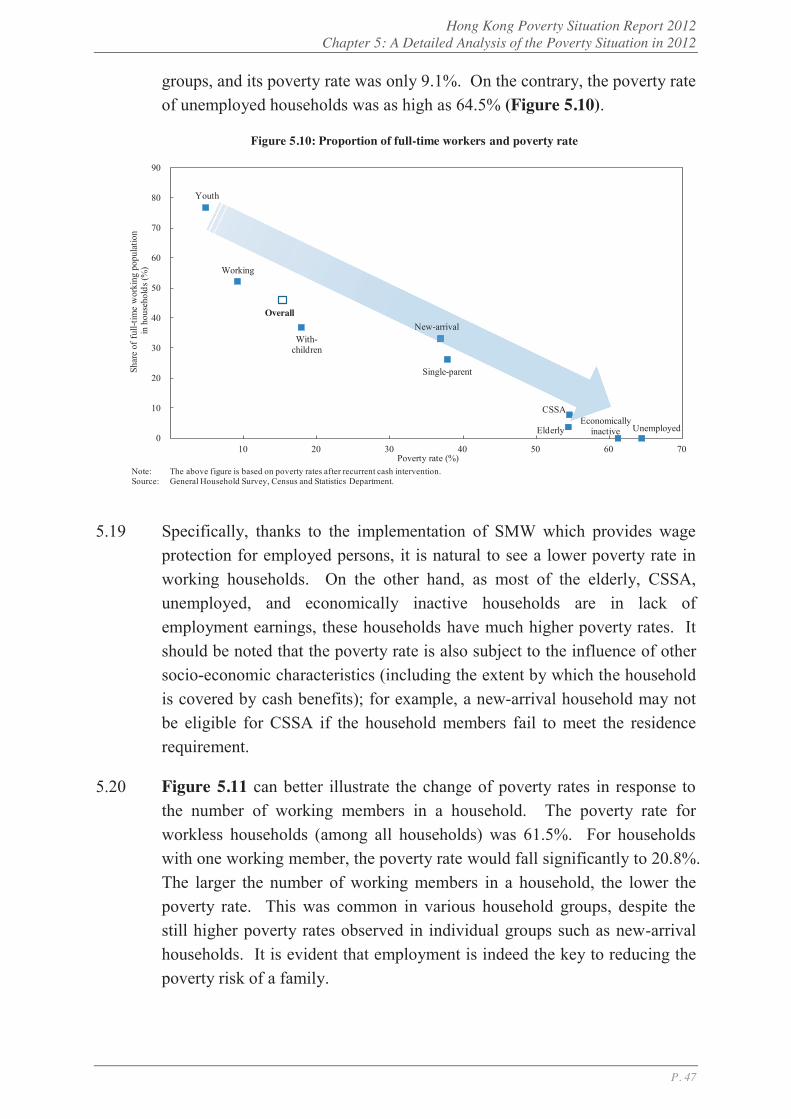
Hong Kong Poverty Situation Report 2012 Chapter 5: A Detailed Analysis of the Poverty Situation in 2012
P. 47
groups, and its poverty rate was only 9.1%. On the contrary, the poverty rate of unemployed households was as high as 64.5% (Figure 5.10).
5.19 Specifically, thanks to the implementation of SMW which provides wage protection for employed persons, it is natural to see a lower poverty rate in working households. On the other hand, as most of the elderly, CSSA, unemployed, and economically inactive households are in lack of employment earnings, these households have much higher poverty rates. It should be noted that the poverty rate is also subject to the influence of other socio-economic characteristics (including the extent by which the household is covered by cash benefits); for example, a new-arrival household may not be eligible for CSSA if the household members fail to meet the residence requirement.
5.20 Figure 5.11 can better illustrate the change of poverty rates in response to the number of working members in a household. The poverty rate for workless households (among all households) was 61.5%. For households with one working member, the poverty rate would fall significantly to 20.8%. The larger the number of working members in a household, the lower the poverty rate. This was common in various household groups, despite the still higher poverty rates observed in individual groups such as new-arrival households. It is evident that employment is indeed the key to reducing the poverty risk of a family.
0
10
20
30
40
50
60
70
80
90
0 10 20 30 40 50 60 70
Note:Source:
The above figure is based on poverty rates after recurrent cash intervention.General Household Survey, Census and Statistics Department.
Figure 5.10: Proportion of full-time workers and poverty rate
Poverty rate (%)
Shar
e of
full-
time
wor
king
pop
ulat
ion
in h
ouse
hold
s (%
)
Youth
Working
With-children
Overall
Single-parent
CSSA
ElderlyEconomically
inactive UnemployedE
New-arrival

Hong Kong Poverty Situation Report 2012 Chapter 5: A Detailed Analysis of the Poverty Situation in 2012
P. 48
5.21 While employment is effective in reducing poverty risk, whether a household member chooses to work is still subject to various factors. For example, a heavier family burden with more children or elders to take care of may create obstacles for working-age members to take up jobs. Figure 5.12 shows that in working poor households, the proportion of children and elders living therein was 37.5%, and close to half (48.7%) of the working-age persons therein were economically inactive. As the proportion of children and elders in the household group rises, so does the ratio of economically inactive working-age persons.
Notes:
Source:
Figures in parentheses denote the corresponding numbers of households.Not released due to large sampling errors.The above figure is based on poverty rates after recurrent cash intervention.General Household Survey, Census and Statistics Department.
Figure 5.11: Poverty rate by number of employed persons in a household
87.5
48.1
12.2
76.4
30.7
5.9
74.7
28.7
3.80.6
61.5
20.8
2.80.3
0
10
20
30
40
50
60
70
80
90
100
None 1 2 3+
New-arrival (86 900 households)
Single-parent (73 500 households)
With-children (740 400 households)
Overall (2 386 500 households)
Poverty rate (%)
Number of working members in a household
( )( )
30
35
40
45
50
55
60
65
70
30 40 50 60 70 80 90 100
Note:
Source:
According to definitions, the proportions of children and elders in elderly households and youth households are 100% and 0% respectively. Such household groups are therefore not included in the above diagram for analysis.General Household Survey, Census and Statistics Department.
Figure 5.12: Proportions of dependants and economically inactive persons in poor households
Proportion of economically inactive members of working age in poor households (%)
Prop
ortio
n of
chi
ldre
n an
d el
ders
in
poo
r hou
seho
lds (
%)
0
Working
With-children
Overall
New-arrival
Single-parent
CSSA
Unemployed
Economically inactive
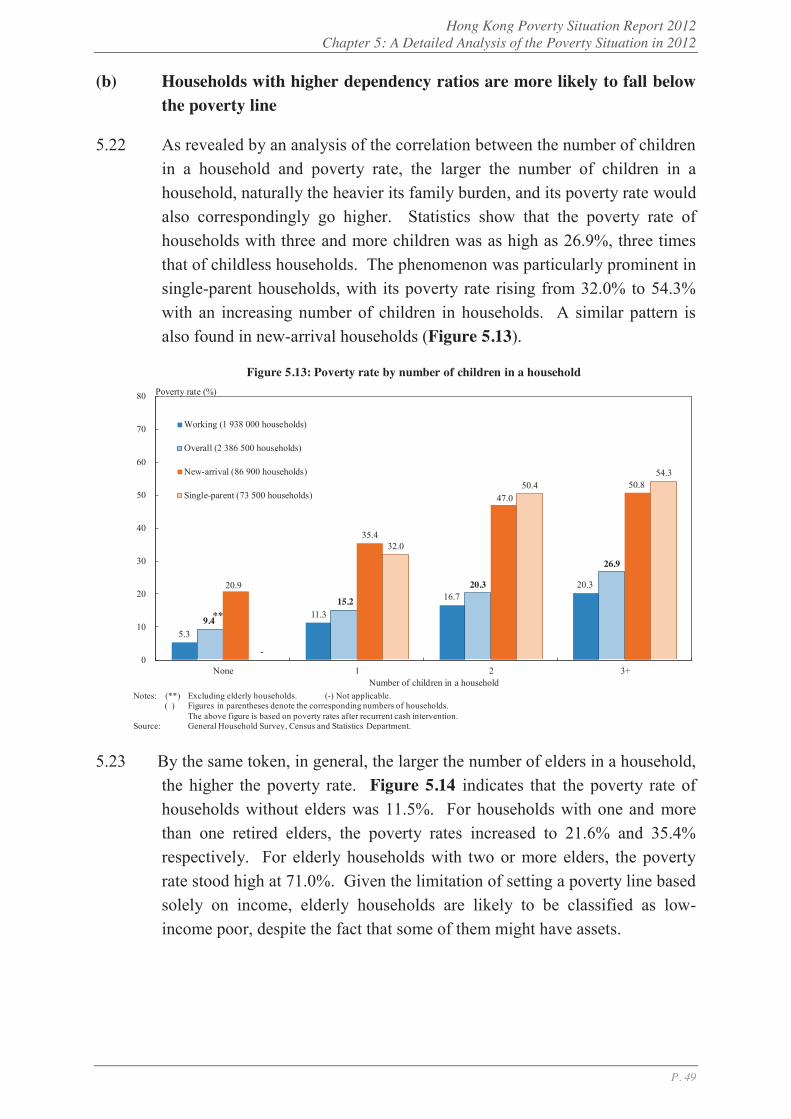
Hong Kong Poverty Situation Report 2012 Chapter 5: A Detailed Analysis of the Poverty Situation in 2012
P. 49
(b) Households with higher dependency ratios are more likely to fall below the poverty line
5.22 As revealed by an analysis of the correlation between the number of children in a household and poverty rate, the larger the number of children in a household, naturally the heavier its family burden, and its poverty rate would also correspondingly go higher. Statistics show that the poverty rate of households with three and more children was as high as 26.9%, three times that of childless households. The phenomenon was particularly prominent in single-parent households, with its poverty rate rising from 32.0% to 54.3% with an increasing number of children in households. A similar pattern is also found in new-arrival households (Figure 5.13).
5.23 By the same token, in general, the larger the number of elders in a household, the higher the poverty rate. Figure 5.14 indicates that the poverty rate of households without elders was 11.5%. For households with one and more than one retired elders, the poverty rates increased to 21.6% and 35.4% respectively. For elderly households with two or more elders, the poverty rate stood high at 71.0%. Given the limitation of setting a poverty line based solely on income, elderly households are likely to be classified as low-income poor, despite the fact that some of them might have assets.
Notes: (**)( )
Source:
Excluding elderly households. (-) Not applicable.Figures in parentheses denote the corresponding numbers of households.The above figure is based on poverty rates after recurrent cash intervention.General Household Survey, Census and Statistics Department.
Figure 5.13: Poverty rate by number of children in a household
5.3
11.3
16.720.3
9.4
15.2
20.3
26.9
20.9
35.4
47.050.8
-
32.0
50.454.3
0
10
20
30
40
50
60
70
80
None 1 2 3+
Working (1 938 000 households)
Overall (2 386 500 households)
New-arrival (86 900 households)
Single-parent (73 500 households)
Poverty rate (%)
Number of children in a household
**
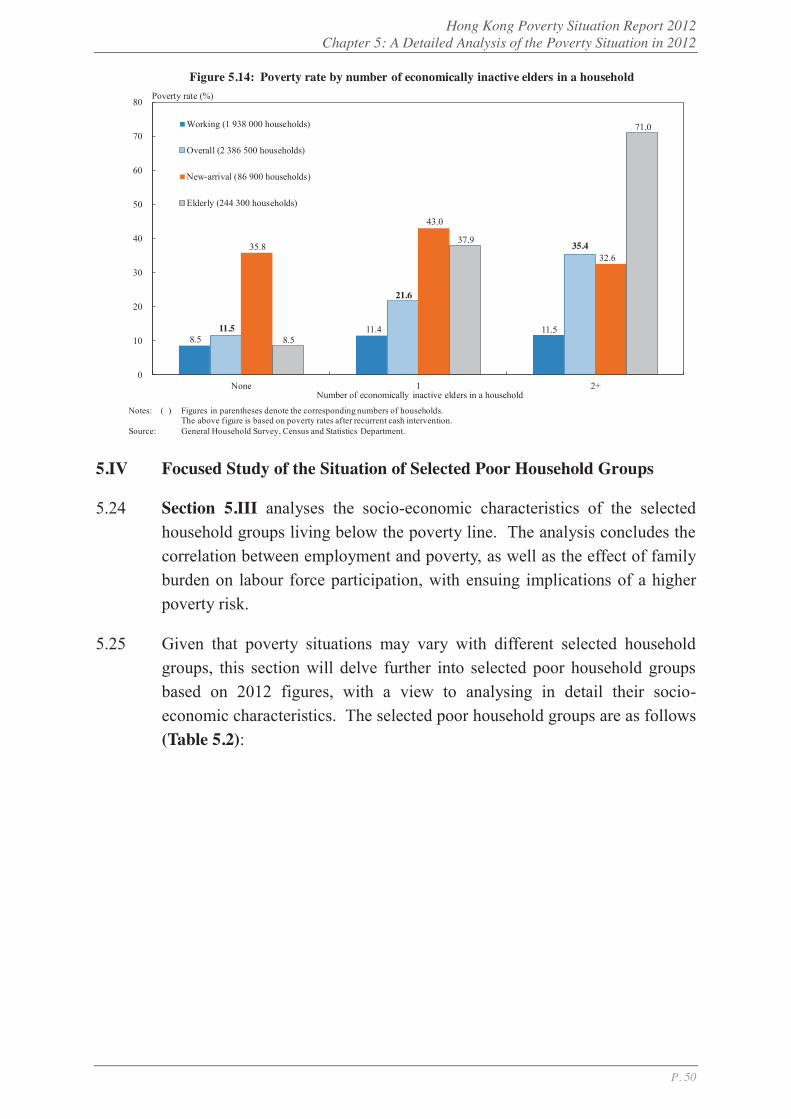
Hong Kong Poverty Situation Report 2012 Chapter 5: A Detailed Analysis of the Poverty Situation in 2012
P. 50
5.IV Focused Study of the Situation of Selected Poor Household Groups
5.24 Section 5.III analyses the socio-economic characteristics of the selected household groups living below the poverty line. The analysis concludes the correlation between employment and poverty, as well as the effect of family burden on labour force participation, with ensuing implications of a higher poverty risk.
5.25 Given that poverty situations may vary with different selected household groups, this section will delve further into selected poor household groups based on 2012 figures, with a view to analysing in detail their socio-economic characteristics. The selected poor household groups are as follows (Table 5.2):
Notes: ( )
Source:
Figures in parentheses denote the corresponding numbers of households.The above figure is based on poverty rates after recurrent cash intervention.General Household Survey, Census and Statistics Department.
Figure 5.14: Poverty rate by number of economically inactive elders in a household
8.5 11.4 11.5 11.5
21.6
35.4 35.8
43.0
32.6
8.5
37.9
71.0
0
10
20
30
40
50
60
70
80
None 1 2+
Working (1 938 000 households)
Overall (2 386 500 households)
New-arrival (86 900 households)
Elderly (244 300 households)
Poverty rate (%)
Number of economically inactive elders in a household
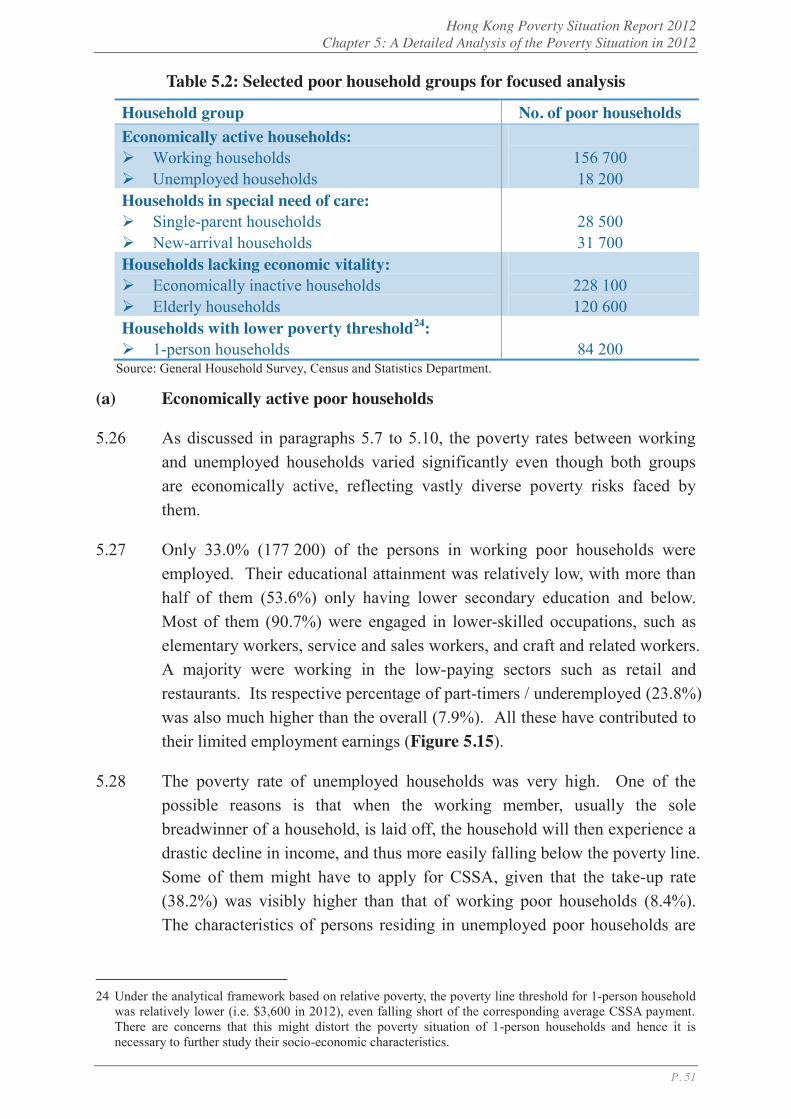
Hong Kong Poverty Situation Report 2012 Chapter 5: A Detailed Analysis of the Poverty Situation in 2012
P. 51
Table 5.2: Selected poor household groups for focused analysis
Household group No. of poor households Economically active households:
Working households Unemployed households
156 700 18 200
Households in special need of care: Single-parent households New-arrival households
28 500 31 700
Households lacking economic vitality: Economically inactive households Elderly households
228 100 120 600
Households with lower poverty threshold24: 1-person households
84 200
Source: General Household Survey, Census and Statistics Department.
(a) Economically active poor households
5.26 As discussed in paragraphs 5.7 to 5.10, the poverty rates between working and unemployed households varied significantly even though both groups are economically active, reflecting vastly diverse poverty risks faced by them.
5.27 Only 33.0% (177 200) of the persons in working poor households were employed. Their educational attainment was relatively low, with more than half of them (53.6%) only having lower secondary education and below. Most of them (90.7%) were engaged in lower-skilled occupations, such as elementary workers, service and sales workers, and craft and related workers. A majority were working in the low-paying sectors such as retail and restaurants. Its respective percentage of part-timers / underemployed (23.8%) was also much higher than the overall (7.9%). All these have contributed to their limited employment earnings (Figure 5.15).
5.28 The poverty rate of unemployed households was very high. One of the possible reasons is that when the working member, usually the sole breadwinner of a household, is laid off, the household will then experience a drastic decline in income, and thus more easily falling below the poverty line. Some of them might have to apply for CSSA, given that the take-up rate (38.2%) was visibly higher than that of working poor households (8.4%). The characteristics of persons residing in unemployed poor households are
24 Under the analytical framework based on relative poverty, the poverty line threshold for 1-person household
was relatively lower (i.e. $3,600 in 2012), even falling short of the corresponding average CSSA payment. There are concerns that this might distort the poverty situation of 1-person households and hence it is necessary to further study their socio-economic characteristics.
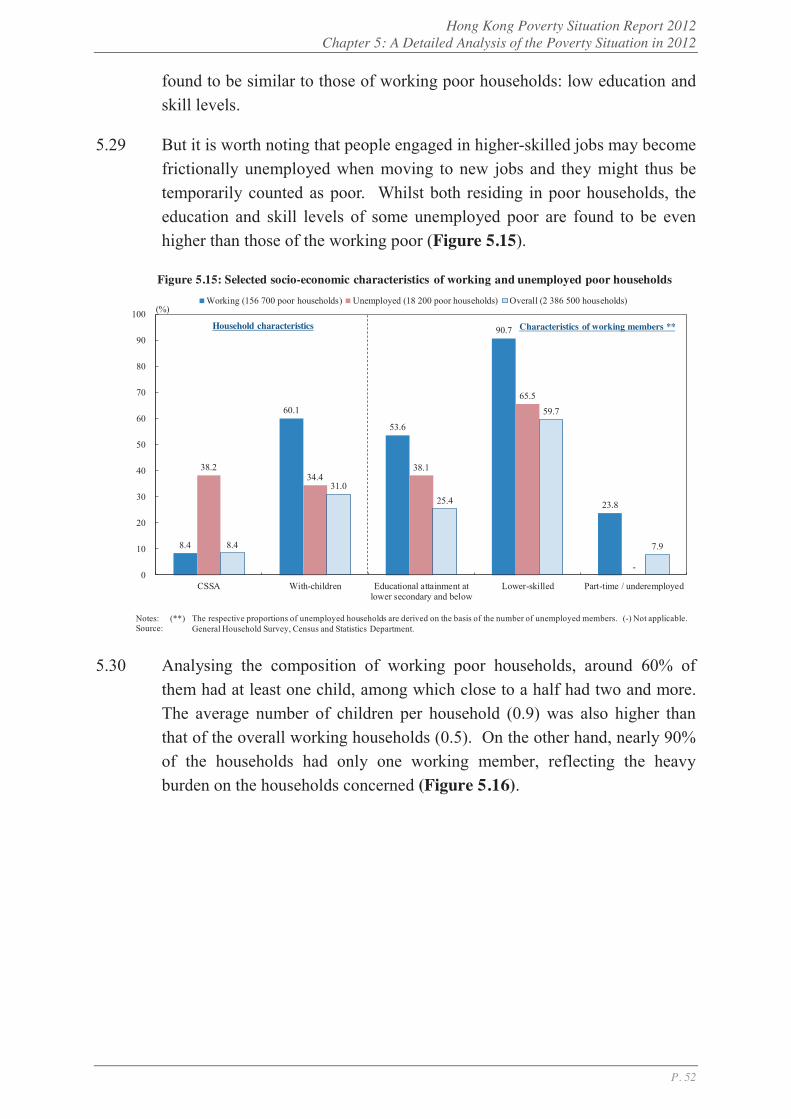
Hong Kong Poverty Situation Report 2012 Chapter 5: A Detailed Analysis of the Poverty Situation in 2012
P. 52
found to be similar to those of working poor households: low education and skill levels.
5.29 But it is worth noting that people engaged in higher-skilled jobs may become frictionally unemployed when moving to new jobs and they might thus be temporarily counted as poor. Whilst both residing in poor households, the education and skill levels of some unemployed poor are found to be even higher than those of the working poor (Figure 5.15).
5.30 Analysing the composition of working poor households, around 60% of them had at least one child, among which close to a half had two and more. The average number of children per household (0.9) was also higher than that of the overall working households (0.5). On the other hand, nearly 90% of the households had only one working member, reflecting the heavy burden on the households concerned (Figure 5.16).
8.4
60.1
53.6
90.7
23.8
38.234.4
38.1
65.5
-
8.4
31.025.4
59.7
7.9
0
10
20
30
40
50
60
70
80
90
100
CSSA With-children Educational attainment atlower secondary and below
Lower-skilled Part-time / underemployed
Working (156 700 poor households) Unemployed (18 200 poor households) Overall (2 386 500 households)
Notes: (**)Source:
The respective proportions of unemployed households are derived on the basis of the number of unemployed members. (-) Not applicable.General Household Survey, Census and Statistics Department.
Figure 5.15: Selected socio-economic characteristics of working and unemployed poor households
Household characteristics Characteristics of working members **
(%)
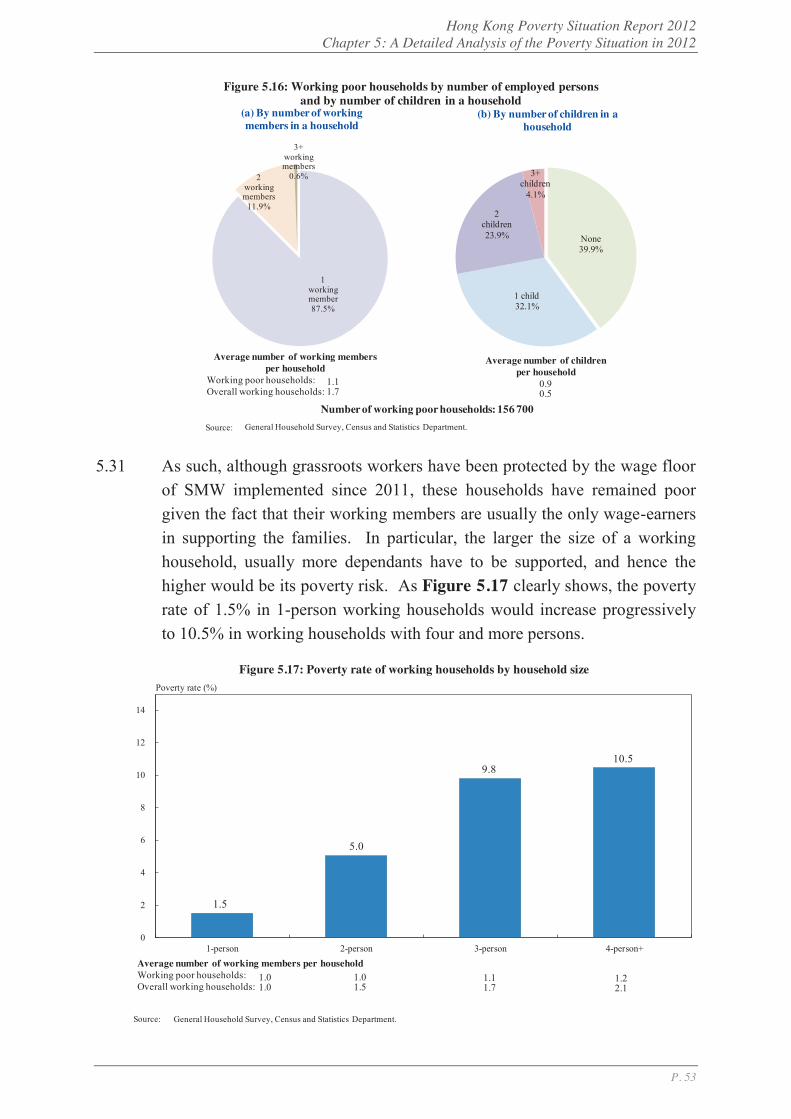
Hong Kong Poverty Situation Report 2012 Chapter 5: A Detailed Analysis of the Poverty Situation in 2012
P. 53
5.31 As such, although grassroots workers have been protected by the wage floor of SMW implemented since 2011, these households have remained poor given the fact that their working members are usually the only wage-earners in supporting the families. In particular, the larger the size of a working household, usually more dependants have to be supported, and hence the higher would be its poverty risk. As Figure 5.17 clearly shows, the poverty rate of 1.5% in 1-person working households would increase progressively to 10.5% in working households with four and more persons.
1 working member87.5%
2 working members
11.9%
3+ working members
0.6%
(a) By number of working members in a household
Figure 5.16: Working poor households by number of employed persons and by number of children in a household
Source: General Household Survey, Census and Statistics Department.
Number of working poor households: 156 700
None39.9%
1 child32.1%
2 children23.9%
3+ children
4.1%
(b) By number of children in a household
Average number of children per household
Average number of working members per household
Working poor households:Overall working households:
1.11.7
0.90.5
Source: General Household Survey, Census and Statistics Department.
Figure 5.17: Poverty rate of working households by household size
1.5
5.0
9.810.5
0
2
4
6
8
10
12
14
1-person 2-person 3-person 4-person+
Poverty rate (%)
Average number of working members per householdWorking poor households: Overall working households:
1.01.0
1.01.5
1.11.7
1.22.1

Hong Kong Poverty Situation Report 2012 Chapter 5: A Detailed Analysis of the Poverty Situation in 2012
P. 54
(b) Poor households in special need of care
5.32 Single-parent and new-arrival households are household groups with unique socio-economic characteristics. Their post-intervention (recurrent cash) poverty rates (37.8% and 36.9% respectively) were higher than the overall average. Similar to working poor households, most of them had dependant children. In terms of social security coverage, the proportion of single-parent poor households receiving CSSA was 68.1%, significantly higher than that of 26.6% in new-arrival poor households.
5.33 The proportion of single-parent poor households with working members were quite low (38.4%), with most of them being either part-timers or underemployed (37.8%). Conceivably, single parents might not be able to participate fully in the labour market due to child-care responsibilities solely taken up by them. On the contrary, the respective proportion of working members in new-arrival poor households was significantly higher (70.4%). However, given the much lower education and skill levels of their working members25 which drag down their employment earnings, these households are still subject to high poverty risks (Figure 5.18).
5.34 Combining household groups of Sections 5.IV(a) and (b), we can analyse the family burden faced by different types of working poor households. Table 5.3 shows that the average household size, average employed person and children per household of the working poor households were 3.4, 1.1
25 Only 30.6% of the employed persons in the poor households in question were new-arrivals.
68.1
100.0
38.4
51.7
92.4
37.8
26.6
83.0
70.4
61.2
95.4
20.7
8.4
31.0
81.2
25.4
59.7
7.9
0
20
40
60
80
100
120
CSSA With-children Working Educational attainmentat lower secondary and
below
Lower-skilled Part-time /underemployed
Single-parent (28 500 poor households) New-arrival (31 700 poor households) Overall (2 386 500 households)
Source: General Household Survey, Census and Statistics Department.
Figure 5.18: Selected socio-economic characteristics of single-parent and new-arrival poor households
Household characteristics Characteristics of working members
(%)
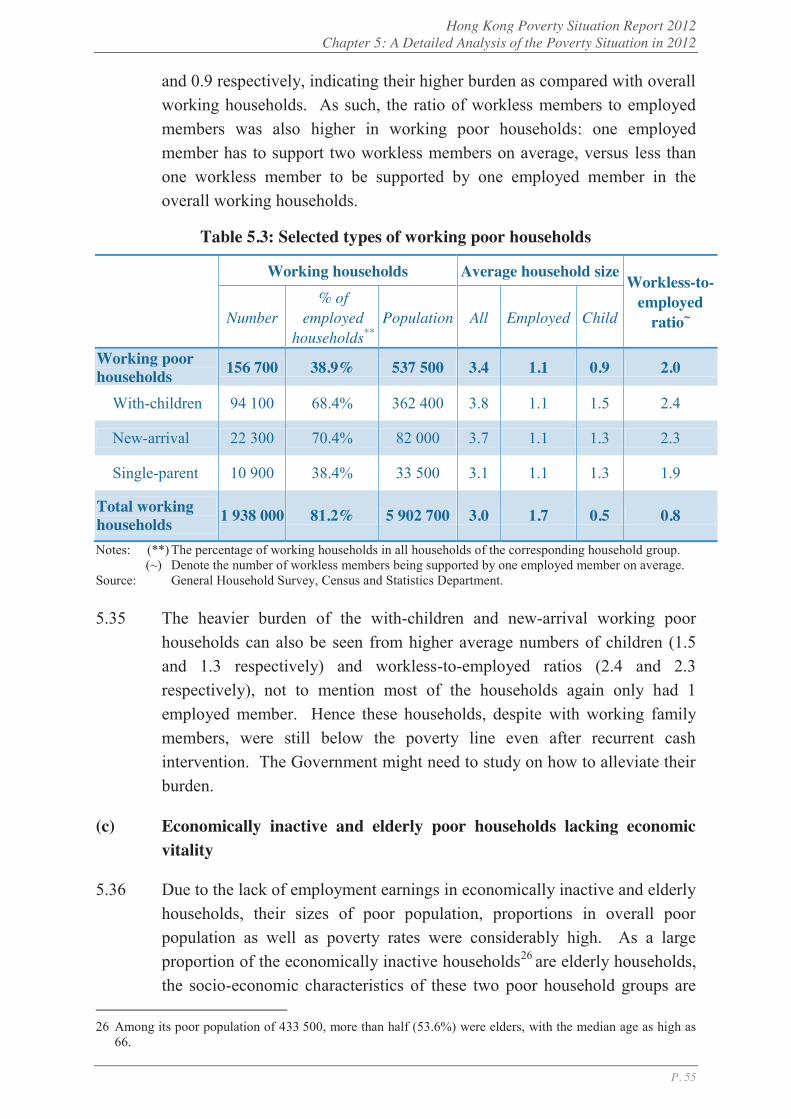
Hong Kong Poverty Situation Report 2012 Chapter 5: A Detailed Analysis of the Poverty Situation in 2012
P. 55
and 0.9 respectively, indicating their higher burden as compared with overall working households. As such, the ratio of workless members to employed members was also higher in working poor households: one employed member has to support two workless members on average, versus less than one workless member to be supported by one employed member in the overall working households.
Table 5.3: Selected types of working poor households
Working households Average household size Workless-to-
employed ratio~
Number
% of employed
households** Population All Employed Child
Working poor households 156 700 38.9% 537 500 3.4 1.1 0.9 2.0
With-children 94 100 68.4% 362 400 3.8 1.1 1.5 2.4
New-arrival 22 300 70.4% 82 000 3.7 1.1 1.3 2.3
Single-parent 10 900 38.4% 33 500 3.1 1.1 1.3 1.9
Total working households 1 938 000 81.2% 5 902 700 3.0 1.7 0.5 0.8
Notes: (**) The percentage of working households in all households of the corresponding household group. (~) Denote the number of workless members being supported by one employed member on average. Source: General Household Survey, Census and Statistics Department.
5.35 The heavier burden of the with-children and new-arrival working poor households can also be seen from higher average numbers of children (1.5 and 1.3 respectively) and workless-to-employed ratios (2.4 and 2.3 respectively), not to mention most of the households again only had 1 employed member. Hence these households, despite with working family members, were still below the poverty line even after recurrent cash intervention. The Government might need to study on how to alleviate their burden.
(c) Economically inactive and elderly poor households lacking economic vitality
5.36 Due to the lack of employment earnings in economically inactive and elderly households, their sizes of poor population, proportions in overall poor population as well as poverty rates were considerably high. As a large proportion of the economically inactive households26 are elderly households, the socio-economic characteristics of these two poor household groups are
26 Among its poor population of 433 500, more than half (53.6%) were elders, with the median age as high as
66.
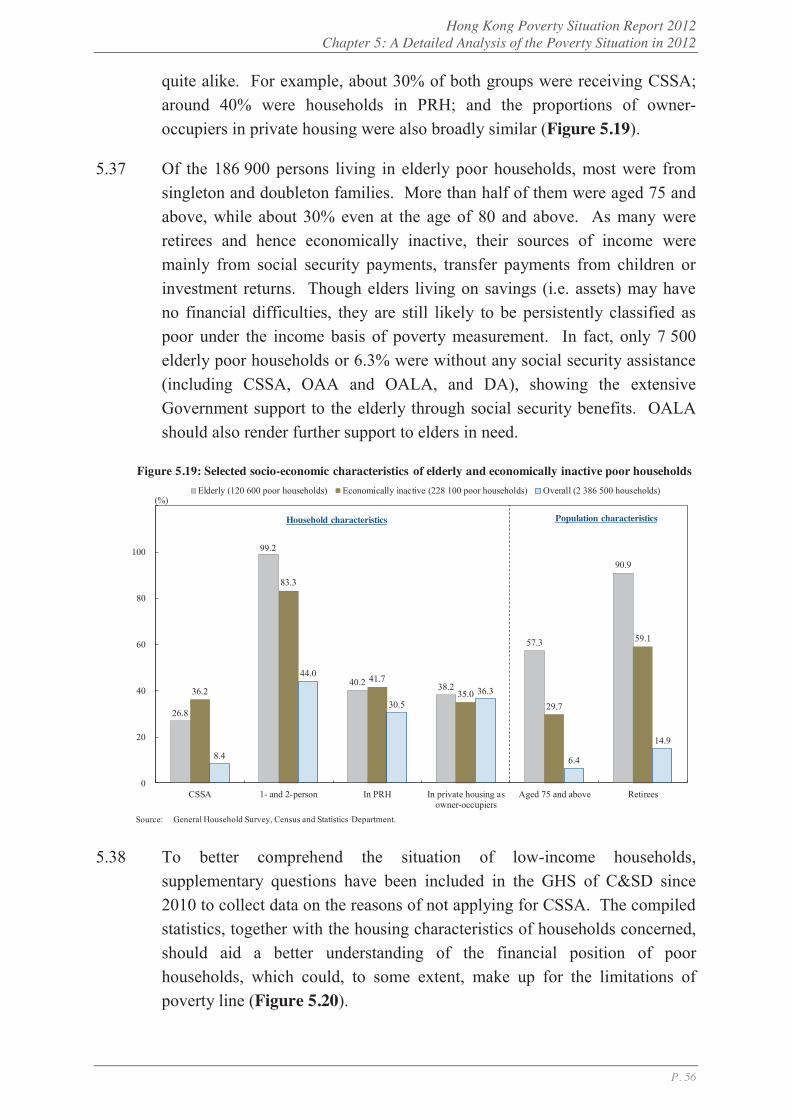
Hong Kong Poverty Situation Report 2012 Chapter 5: A Detailed Analysis of the Poverty Situation in 2012
P. 56
quite alike. For example, about 30% of both groups were receiving CSSA; around 40% were households in PRH; and the proportions of owner-occupiers in private housing were also broadly similar (Figure 5.19).
5.37 Of the 186 900 persons living in elderly poor households, most were from singleton and doubleton families. More than half of them were aged 75 and above, while about 30% even at the age of 80 and above. As many were retirees and hence economically inactive, their sources of income were mainly from social security payments, transfer payments from children or investment returns. Though elders living on savings (i.e. assets) may have no financial difficulties, they are still likely to be persistently classified as poor under the income basis of poverty measurement. In fact, only 7 500 elderly poor households or 6.3% were without any social security assistance (including CSSA, OAA and OALA, and DA), showing the extensive Government support to the elderly through social security benefits. OALA should also render further support to elders in need.
5.38 To better comprehend the situation of low-income households, supplementary questions have been included in the GHS of C&SD since 2010 to collect data on the reasons of not applying for CSSA. The compiled statistics, together with the housing characteristics of households concerned, should aid a better understanding of the financial position of poor households, which could, to some extent, make up for the limitations of poverty line (Figure 5.20).
26.8
99.2
40.2 38.2
57.3
90.9
36.2
83.3
41.7
35.029.7
59.1
8.4
44.0
30.536.3
6.4
14.9
0
20
40
60
80
100
120
CSSA 1- and 2-person In PRH In private housing asowner-occupiers
Aged 75 and above Retirees
Elderly (120 600 poor households) Economically inactive (228 100 poor households) Overall (2 386 500 households)
Source: General Household Survey, Census and Statistics Department.
Figure 5.19: Selected socio-economic characteristics of elderly and economically inactive poor households
Household characteristics Population characteristics
(%)

Hong Kong Poverty Situation Report 2012 Chapter 5: A Detailed Analysis of the Poverty Situation in 2012
P. 57
38.7% (or 156 000) of poor households claimed to have no financial needs. In particular, the proportions for elderly and economically inactive poor households were quite large at 51.2% and 45.0% respectively.
On the other hand, the corresponding proportions for working, new-arrival and single-parent households in poverty were significantly smaller, a possible reflection of their less favourable financial status. The figure for single-parent poor households was as low as 11.0%.
An analysis by housing type shows that 27.3% (or 109 900) of poor households were in private housing as owner-occupiers without mortgages and loans, with elderly and economically inactive poor households both exceeding the overall average, at 37.7% and 33.3% respectively.
(d) 1-person poor households with lower poverty threshold
5.39 1-person households exhibit distinctly different socio-economic characteristics as compared to other households despite their simple household composition, and therefore it is worth exploring their features of poverty. Among 1-person households, more than half of them are workless, and quite a number of them are retired elders (Figure 5.21). Thus, if delineated by the relative poverty line, most of the poor households would naturally be in lack of employment earnings.
-
51.2
11.0
22.7 24.9
58.2
38.2
45.0
29.6
38.7
5.0
37.7
8.6 7.6
13.919.3
23.6
33.3
18.9
27.3
0
10
20
30
40
50
60
70
80
90
100
CSSA Elderly Single-parent New-arrival With-children
Youth Unemployed Economicallyinactive
Working Overall
Non-CSSA households claiming to have no financial needs
Owner-occupiers without mortgages or loans
Note: (-)Source:
Not applicable.General Household Survey, Census and Statistics Department.
Figure 5.20: Poor households without economic needs and those as owner-occupiers without mortgages or loans (%)
Social groups Economic groups
Poor households
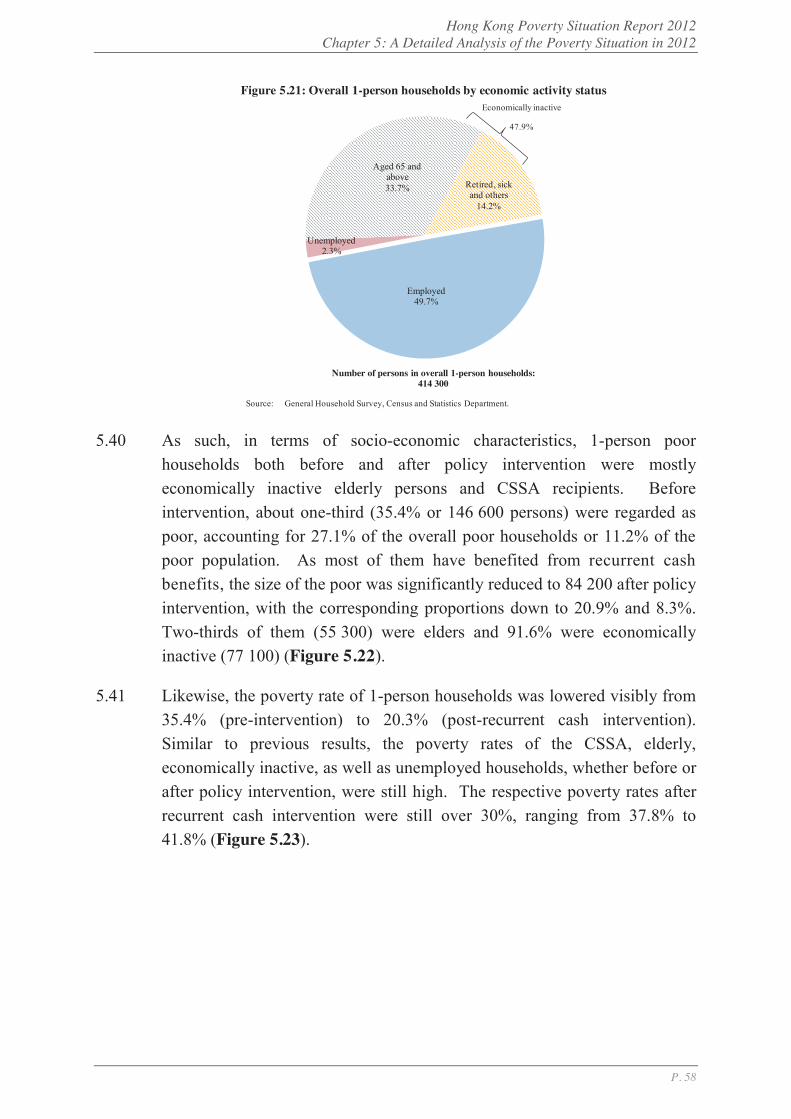
Hong Kong Poverty Situation Report 2012 Chapter 5: A Detailed Analysis of the Poverty Situation in 2012
P. 58
5.40 As such, in terms of socio-economic characteristics, 1-person poor households both before and after policy intervention were mostly economically inactive elderly persons and CSSA recipients. Before intervention, about one-third (35.4% or 146 600 persons) were regarded as poor, accounting for 27.1% of the overall poor households or 11.2% of the poor population. As most of them have benefited from recurrent cash benefits, the size of the poor was significantly reduced to 84 200 after policy intervention, with the corresponding proportions down to 20.9% and 8.3%. Two-thirds of them (55 300) were elders and 91.6% were economically inactive (77 100) (Figure 5.22).
5.41 Likewise, the poverty rate of 1-person households was lowered visibly from 35.4% (pre-intervention) to 20.3% (post-recurrent cash intervention). Similar to previous results, the poverty rates of the CSSA, elderly, economically inactive, as well as unemployed households, whether before or after policy intervention, were still high. The respective poverty rates after recurrent cash intervention were still over 30%, ranging from 37.8% to 41.8% (Figure 5.23).
Employed49.7%
Unemployed2.3%
Aged 65 and above33.7% Retired, sick
and others14.2%
Economically inactive
47.9%
Figure 5.21: Overall 1-person households by economic activity status
Source: General Household Survey, Census and Statistics Department.
Number of persons in overall 1-person households: 414 300
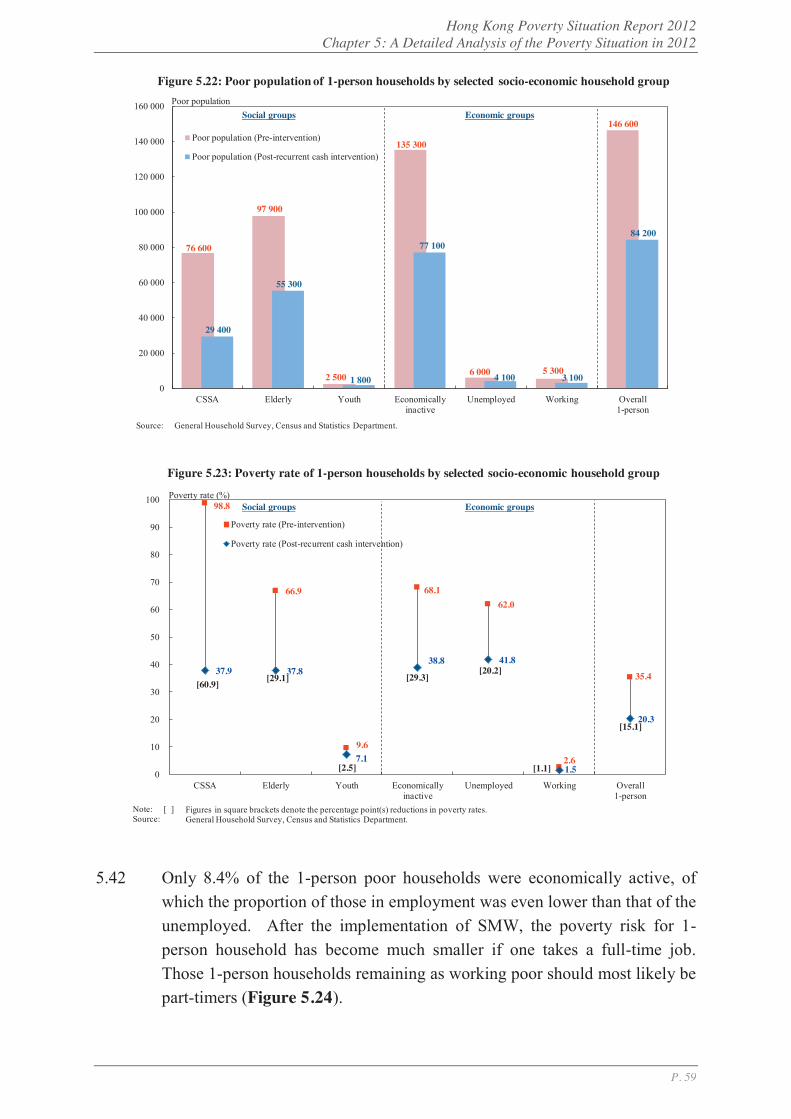
Hong Kong Poverty Situation Report 2012 Chapter 5: A Detailed Analysis of the Poverty Situation in 2012
P. 59
5.42 Only 8.4% of the 1-person poor households were economically active, of which the proportion of those in employment was even lower than that of the unemployed. After the implementation of SMW, the poverty risk for 1-person household has become much smaller if one takes a full-time job. Those 1-person households remaining as working poor should most likely be part-timers (Figure 5.24).
76 600
97 900
2 500
135 300
6 000 5 300
146 600
29 400
55 300
1 800
77 100
4 100 3 100
84 200
0
20 000
40 000
60 000
80 000
100 000
120 000
140 000
160 000
CSSA Elderly Youth Economicallyinactive
Unemployed Working Overall1-person
Poor population (Pre-intervention)
Poor population (Post-recurrent cash intervention)
Source: General Household Survey, Census and Statistics Department.
Social groups Economic groups
Figure 5.22: Poor population of 1-person households by selected socio-economic household groupPoor population
98.8
66.9
9.6
68.1 62.0
2.6
35.4 37.9 37.8
7.1
38.8 41.8
1.5
20.3
0
10
20
30
40
50
60
70
80
90
100
CSSA Elderly Youth Economicallyinactive
Unemployed Working Overall1-person
Poverty rate (Pre-intervention)
Poverty rate (Post-recurrent cash intervention)
Social groups Economic groups
Figure 5.23: Poverty rate of 1-person households by selected socio-economic household group
Poverty rate (%)
Note: [ ]Source:
Figures in square brackets denote the percentage point(s) reductions in poverty rates.General Household Survey, Census and Statistics Department.
[2.5] [1.1]
[15.1]
[20.2][29.3][29.1]
[60.9]
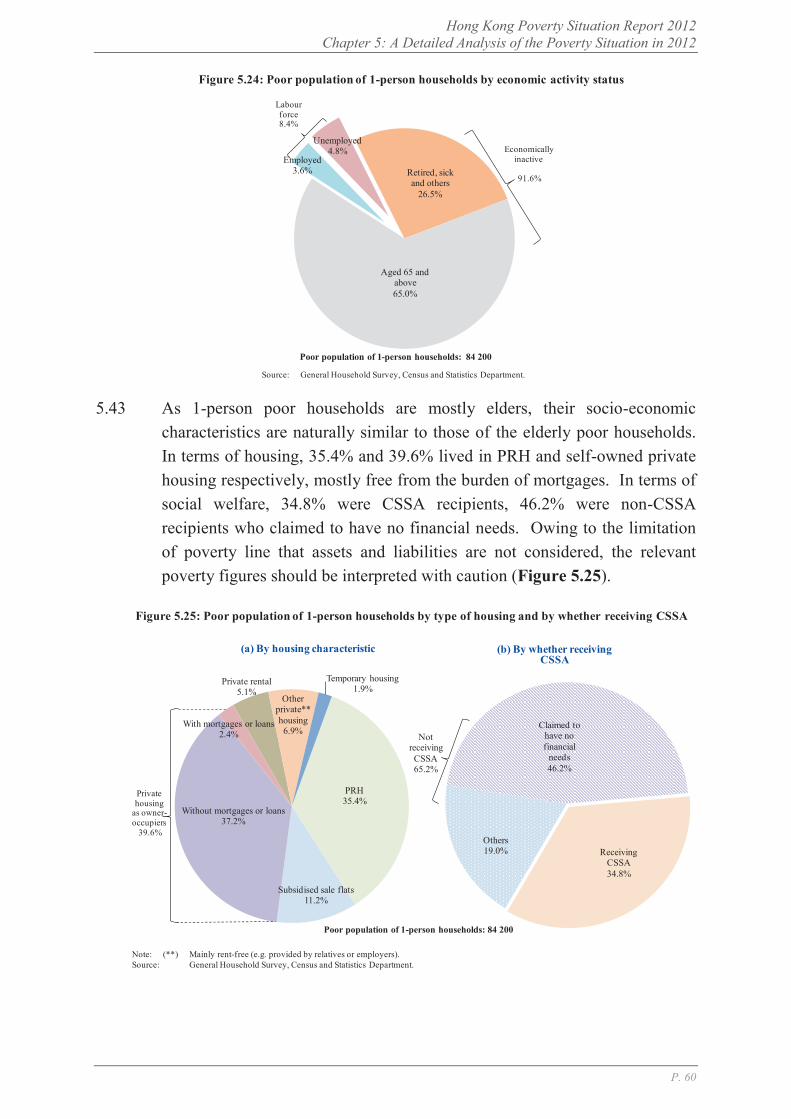
Hong Kong Poverty Situation Report 2012 Chapter 5: A Detailed Analysis of the Poverty Situation in 2012
P. 60
5.43 As 1-person poor households are mostly elders, their socio-economic
characteristics are naturally similar to those of the elderly poor households. In terms of housing, 35.4% and 39.6% lived in PRH and self-owned private housing respectively, mostly free from the burden of mortgages. In terms of social welfare, 34.8% were CSSA recipients, 46.2% were non-CSSA recipients who claimed to have no financial needs. Owing to the limitation of poverty line that assets and liabilities are not considered, the relevant poverty figures should be interpreted with caution (Figure 5.25).
Source: General Household Survey, Census and Statistics Department.
Employed3.6%
Unemployed4.8%
Retired, sick and others
26.5%
Aged 65 and above65.0%
Economically inactive
91.6%
Labour force 8.4%
Figure 5.24: Poor population of 1-person households by economic activity status
Poor population of 1-person households: 84 200
PRH35.4%
Subsidised sale flats11.2%
Without mortgages or loans 37.2%
With mortgages or loans2.4%
Private rental5.1%
Other private** housing6.9%
Temporary housing1.9%
Private housing
as owner-occupiers
39.6%
(a) By housing characteristic
Figure 5.25: Poor population of 1-person households by type of housing and by whether receiving CSSA
Receiving CSSA34.8%
Others19.0%
Claimed to have no financial
needs46.2%
Not receiving CSSA 65.2%
(b) By whether receiving CSSA
Poor population of 1-person households: 84 200
Note: (**)Source:
Mainly rent-free (e.g. provided by relatives or employers).General Household Survey, Census and Statistics Department.
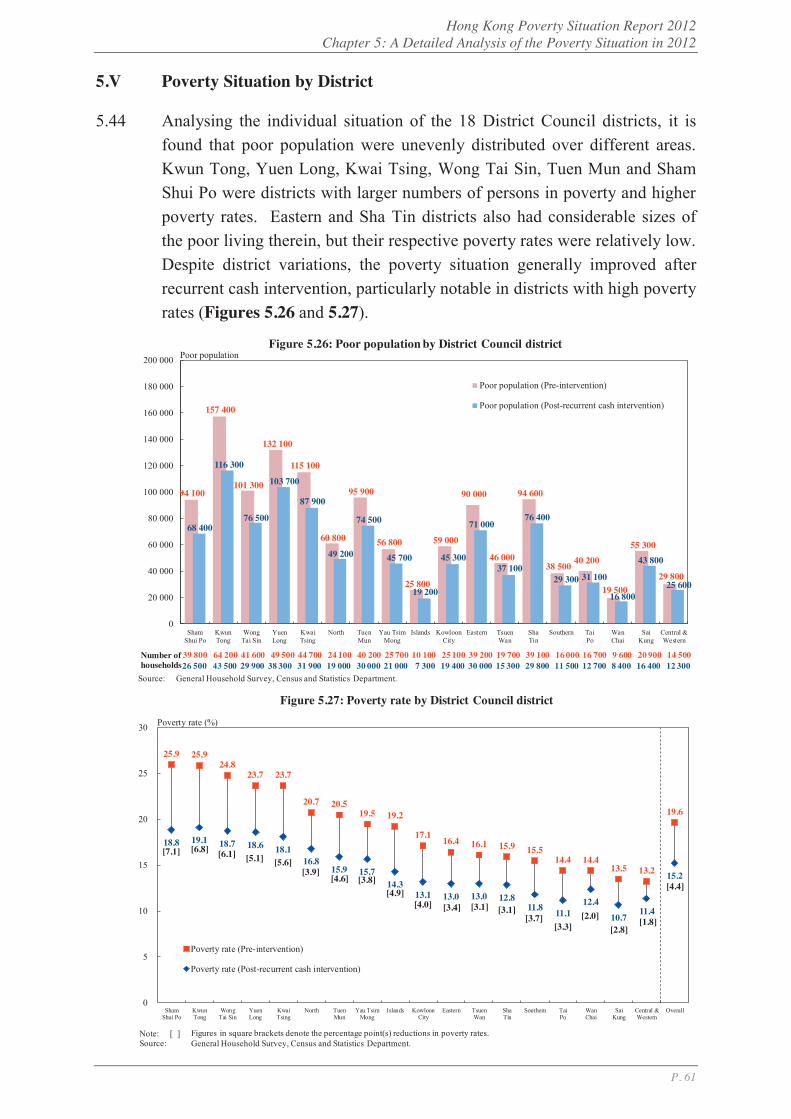
Hong Kong Poverty Situation Report 2012 Chapter 5: A Detailed Analysis of the Poverty Situation in 2012
P. 61
5.V Poverty Situation by District
5.44 Analysing the individual situation of the 18 District Council districts, it is found that poor population were unevenly distributed over different areas. Kwun Tong, Yuen Long, Kwai Tsing, Wong Tai Sin, Tuen Mun and Sham Shui Po were districts with larger numbers of persons in poverty and higher poverty rates. Eastern and Sha Tin districts also had considerable sizes of the poor living therein, but their respective poverty rates were relatively low. Despite district variations, the poverty situation generally improved after recurrent cash intervention, particularly notable in districts with high poverty rates (Figures 5.26 and 5.27).
94 100
157 400
101 300
132 100
115 100
60 800
95 900
56 800
25 800
59 000
90 000
46 000
94 600
38 500 40 200
19 500
55 300
29 800
68 400
116 300
76 500
103 700
87 900
49 200
74 500
45 700
19 200
45 300
71 000
37 100
76 400
29 300 31 100
16 800
43 800
25 600
0
20 000
40 000
60 000
80 000
100 000
120 000
140 000
160 000
180 000
200 000
ShamShui Po
KwunTong
WongTai Sin
YuenLong
KwaiTsing
North TuenMun
Yau TsimMong
Islands KowloonCity
Eastern TsuenWan
ShaTin
Southern TaiPo
WanChai
SaiKung
Central &Western
Poor population (Pre-intervention)
Poor population (Post-recurrent cash intervention)
Source: General Household Survey, Census and Statistics Department.
Figure 5.26: Poor population by District Council districtPoor population
39 800 64 200 41 600 49 500 44 700 24 100 40 200 25 700 10 100 25 100 39 200 19 700 39 100 16 000 16 700 9 600 20 900 14 500 26 500 43 500 29 900 38 300 31 900 19 000 30 000 21 000 7 300 19 400 30 000 15 300 29 800 11 500 12 700 8 400 16 400 12 300
Number of households
25.9 25.924.8
23.7 23.7
20.7 20.519.5 19.2
17.116.4 16.1 15.9 15.5
14.4 14.413.5 13.2
19.6
18.8 19.1 18.7 18.6 18.116.8
15.9 15.714.3
13.1 13.0 13.0 12.811.8 11.1
12.4
10.711.4
15.2
0
5
10
15
20
25
30
ShamShui Po
KwunTong
WongTai Sin
YuenLong
KwaiTsing
North TuenMun
Yau TsimMong
Islands KowloonCity
Eastern TsuenWan
ShaTin
Southern TaiPo
WanChai
SaiKung
Central &Western
Overall
Poverty rate (Pre-intervention)
Poverty rate (Post-recurrent cash intervention)
Figure 5.27: Poverty rate by District Council district
Poverty rate (%)
Note: [ ]Source:
Figures in square brackets denote the percentage point(s) reductions in poverty rates.General Household Survey, Census and Statistics Department.
[7.1]
[1.8]
[4.4]
[2.8][2.0]
[3.3][3.7]
[3.1][3.1][3.4][4.0][4.9]
[3.8][4.6][3.9]
[5.6][5.1][6.1][6.8]
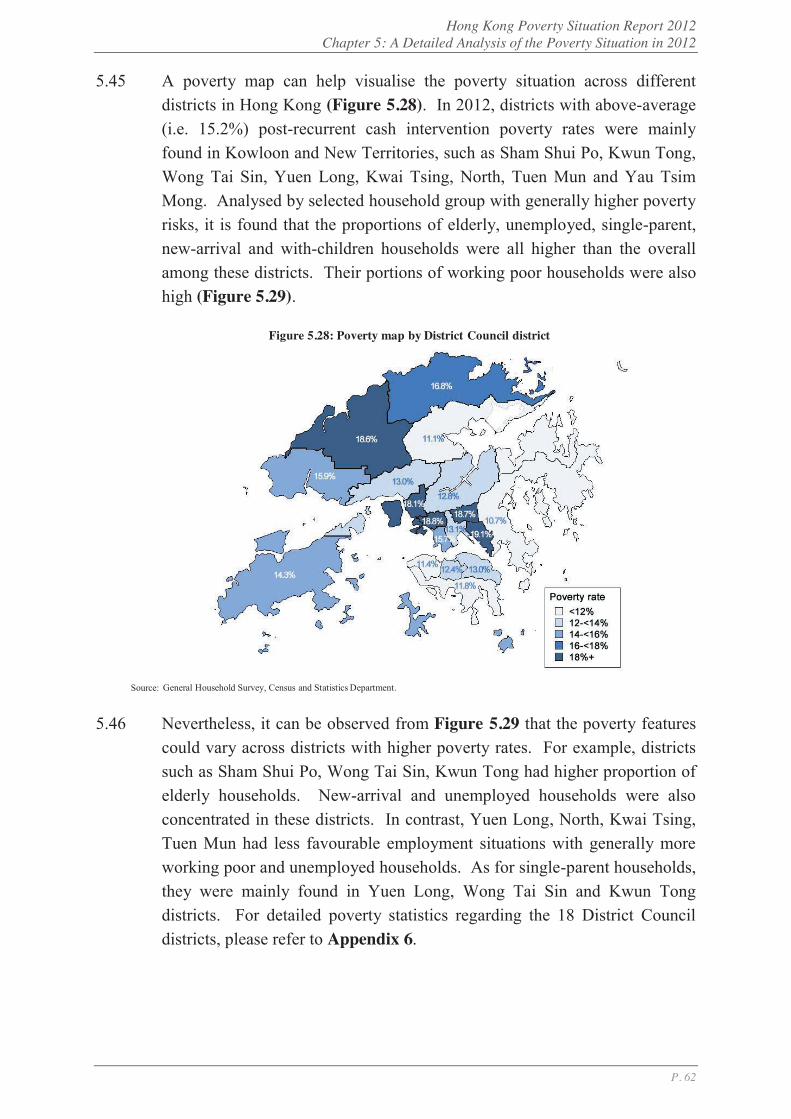
Hong Kong Poverty Situation Report 2012 Chapter 5: A Detailed Analysis of the Poverty Situation in 2012
P. 62
5.45 A poverty map can help visualise the poverty situation across different districts in Hong Kong (Figure 5.28). In 2012, districts with above-average (i.e. 15.2%) post-recurrent cash intervention poverty rates were mainly found in Kowloon and New Territories, such as Sham Shui Po, Kwun Tong, Wong Tai Sin, Yuen Long, Kwai Tsing, North, Tuen Mun and Yau Tsim Mong. Analysed by selected household group with generally higher poverty risks, it is found that the proportions of elderly, unemployed, single-parent, new-arrival and with-children households were all higher than the overall among these districts. Their portions of working poor households were also high (Figure 5.29).
5.46 Nevertheless, it can be observed from Figure 5.29 that the poverty features could vary across districts with higher poverty rates. For example, districts such as Sham Shui Po, Wong Tai Sin, Kwun Tong had higher proportion of elderly households. New-arrival and unemployed households were also concentrated in these districts. In contrast, Yuen Long, North, Kwai Tsing, Tuen Mun had less favourable employment situations with generally more working poor and unemployed households. As for single-parent households, they were mainly found in Yuen Long, Wong Tai Sin and Kwun Tong districts. For detailed poverty statistics regarding the 18 District Council districts, please refer to Appendix 6.
Figure 5.28: Poverty map by District Council district
Source: General Household Survey, Census and Statistics Department.
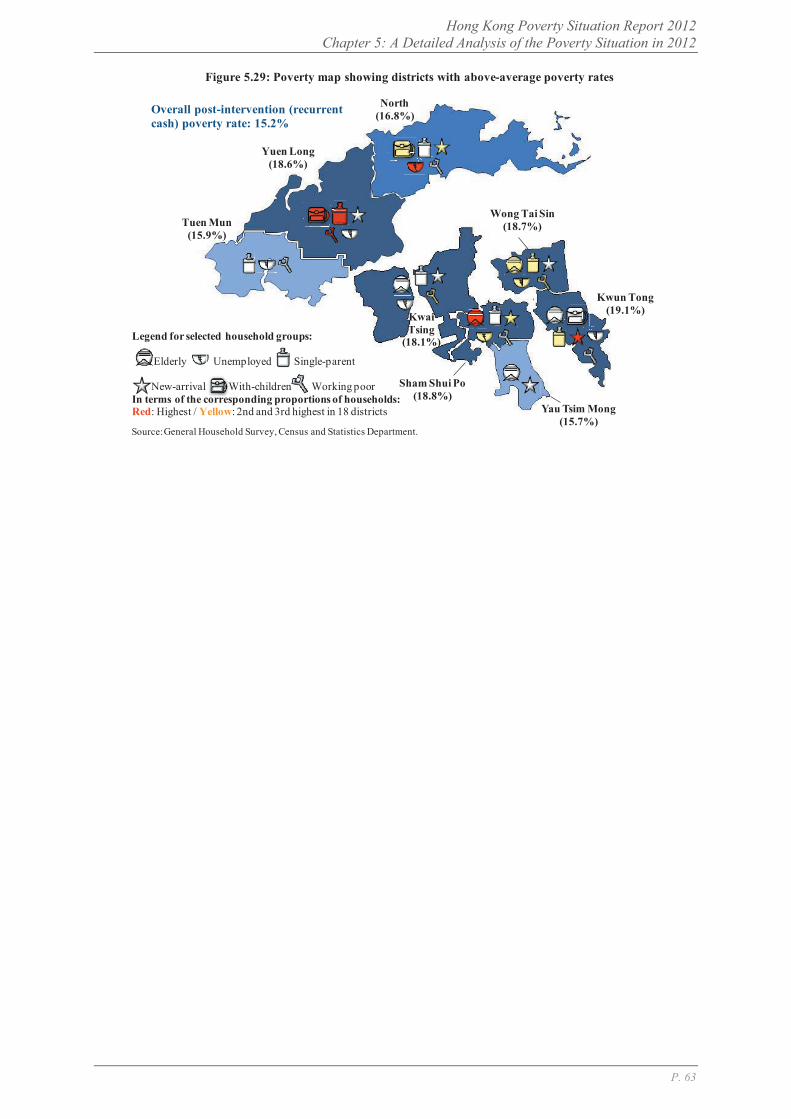
Hong Kong Poverty Situation Report 2012 Chapter 5: A Detailed Analysis of the Poverty Situation in 2012
P. 63
Figure 5.29: Poverty map showing districts with above-average poverty rates
Yau Tsim Mong(15.7%)
Overall post-intervention (recurrent cash) poverty rate: 15.2%
Wong Tai Sin(18.7%)
Kwun Tong(19.1%)Kwai
Tsing(18.1%)
North(16.8%)
Yuen Long(18.6%)
Tuen Mun(15.9%)
Sham Shui Po(18.8%)
Source:General Household Survey, Census and Statistics Department.
Legend for selected household groups:
Elderly Unemployed Single-parent
New-arrival With-children Working poorIn terms of the corresponding proportions of households:Red: Highest / Yellow: 2nd and 3rd highest in 18 districts

Hong Kong Poverty Situation Report 2012 Chapter 5: A Detailed Analysis of the Poverty Situation in 2012
P. 64
Box 5.1
Poverty Situation after Taking into Account In-kind Benefits
Sections 5.II to 5.V mainly focus on the characteristics of households and population still below the poverty line after recurrent cash intervention. As discussed in Box 4.2, the Government has also provided assistance to eligible grassroots through a number of means-tested in-kind benefit schemes (e.g. PRH provision). CoP also agreed that PRH is an important poverty alleviation policy, fulfilling the housing needs of the grassroots. As the foregoing analysis revealed, the poverty rate was much lower in households living in PRH as compared with tenants living in rooms / bedspaces / cocklofts. However, there are concerns that monetising PRH benefit as household income will significantly lower the estimated poor population, even to the situation that “no public rental households will be classified as poor”. To understand the issue, this box article analyses the changes in poverty estimates and the socio-economic characteristics of the poor after the inclusion of in-kind benefits on top of recurrent cash benefits for supplementary information.
2. It is estimated that, after taking into account in-kind benefits, poverty incidence would be further reduced by 131 300 households and 343 700 people as compared with the case where only recurrent cash benefits have been considered. Among the various in-kind benefits being estimated, PRH provision is the major component with the heaviest weighting, which explains why poverty reduction was mainly reflected in PRH households. The poverty rates of the overall and PRH households were lowered by 5.1 and 16.2 percentage points respectively. It should however be pointed out that these estimates are only made on the basis of in-kind benefits quantified as household income. While the livelihood of the grassroots should have improved with the provision of these in-kind benefits, in reality their disposable income in their “pockets” has not increased (Table 5.4).
Table 5.4: Changes in poverty indicators after the inclusion of in-kind benefits2012 Poor households Poor population Poverty rate (%) Before policy intervention In PRH 289 300 723 600 35.2 Overall 540 600 1 312 300 19.6 After policy intervention (recurrent cash) - (I) In PRH 188 900 518 900 25.2 Overall 403 000 1 017 800 15.2 After policy intervention (recurrent cash + in-kind) - (II) In PRH 61 000 185 100 9.0 Overall 271 700 674 200 10.1 Difference in poverty indicators (II) – (I) In PRH -127 900 -333 800 -16.2 (% points) Overall -131 300 -343 700 -5.1 (% points) Source: General Household Survey, Census and Statistics Department.
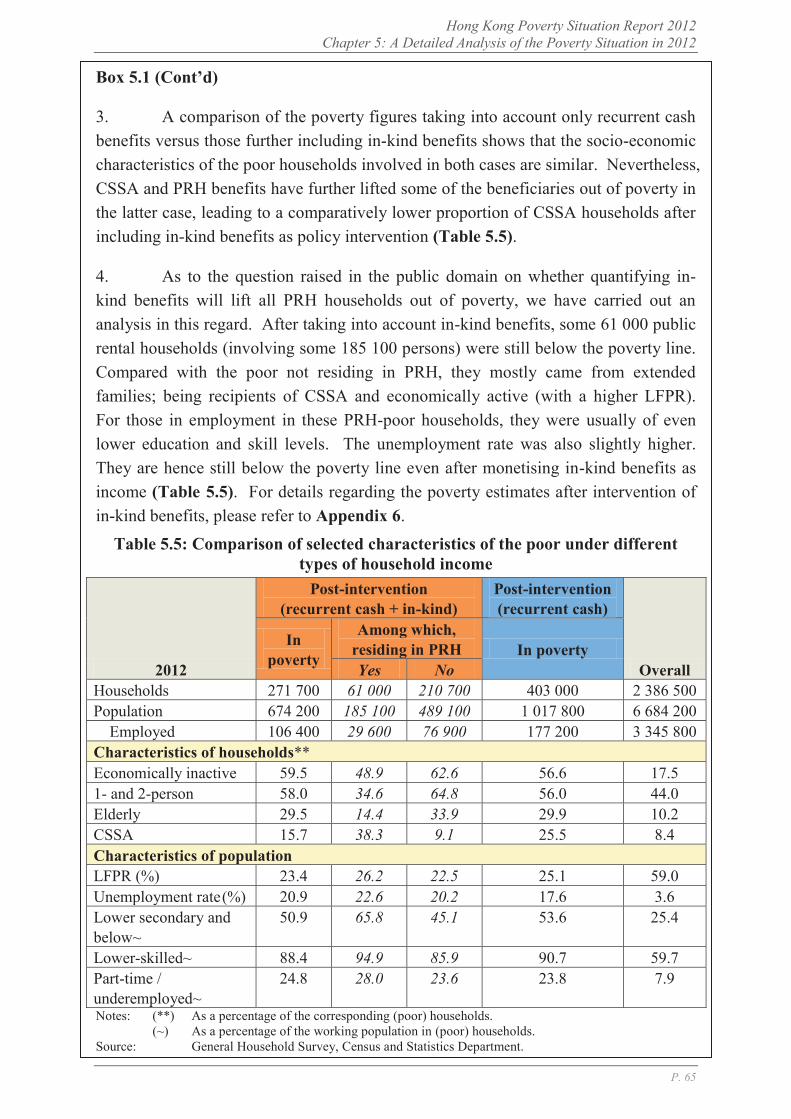
Hong Kong Poverty Situation Report 2012 Chapter 5: A Detailed Analysis of the Poverty Situation in 2012
P. 65
Box 5.1 (Cont’d)
3. A comparison of the poverty figures taking into account only recurrent cash benefits versus those further including in-kind benefits shows that the socio-economic characteristics of the poor households involved in both cases are similar. Nevertheless, CSSA and PRH benefits have further lifted some of the beneficiaries out of poverty in the latter case, leading to a comparatively lower proportion of CSSA households after including in-kind benefits as policy intervention (Table 5.5).
4. As to the question raised in the public domain on whether quantifying in-kind benefits will lift all PRH households out of poverty, we have carried out an analysis in this regard. After taking into account in-kind benefits, some 61 000 public rental households (involving some 185 100 persons) were still below the poverty line. Compared with the poor not residing in PRH, they mostly came from extended families; being recipients of CSSA and economically active (with a higher LFPR). For those in employment in these PRH-poor households, they were usually of even lower education and skill levels. The unemployment rate was also slightly higher. They are hence still below the poverty line even after monetising in-kind benefits as income (Table 5.5). For details regarding the poverty estimates after intervention of in-kind benefits, please refer to Appendix 6.
Table 5.5: Comparison of selected characteristics of the poor under different types of household income
2012
Post-intervention (recurrent cash + in-kind)
Post-intervention (recurrent cash)
Overall
In poverty
Among which, residing in PRH In poverty Yes No
Households 271 700 61 000 210 700 403 000 2 386 500 Population 674 200 185 100 489 100 1 017 800 6 684 200
Employed 106 400 29 600 76 900 177 200 3 345 800 Characteristics of households** Economically inactive 59.5 48.9 62.6 56.6 17.5 1- and 2-person 58.0 34.6 64.8 56.0 44.0 Elderly 29.5 14.4 33.9 29.9 10.2 CSSA 15.7 38.3 9.1 25.5 8.4 Characteristics of population LFPR (%) 23.4 26.2 22.5 25.1 59.0 Unemployment rate (%) 20.9 22.6 20.2 17.6 3.6 Lower secondary and below~
50.9 65.8 45.1 53.6 25.4
Lower-skilled~ 88.4 94.9 85.9 90.7 59.7 Part-time / underemployed~
24.8 28.0 23.6 23.8 7.9
Notes: (**) As a percentage of the corresponding (poor) households. (~) As a percentage of the working population in (poor) households. Source: General Household Survey, Census and Statistics Department.
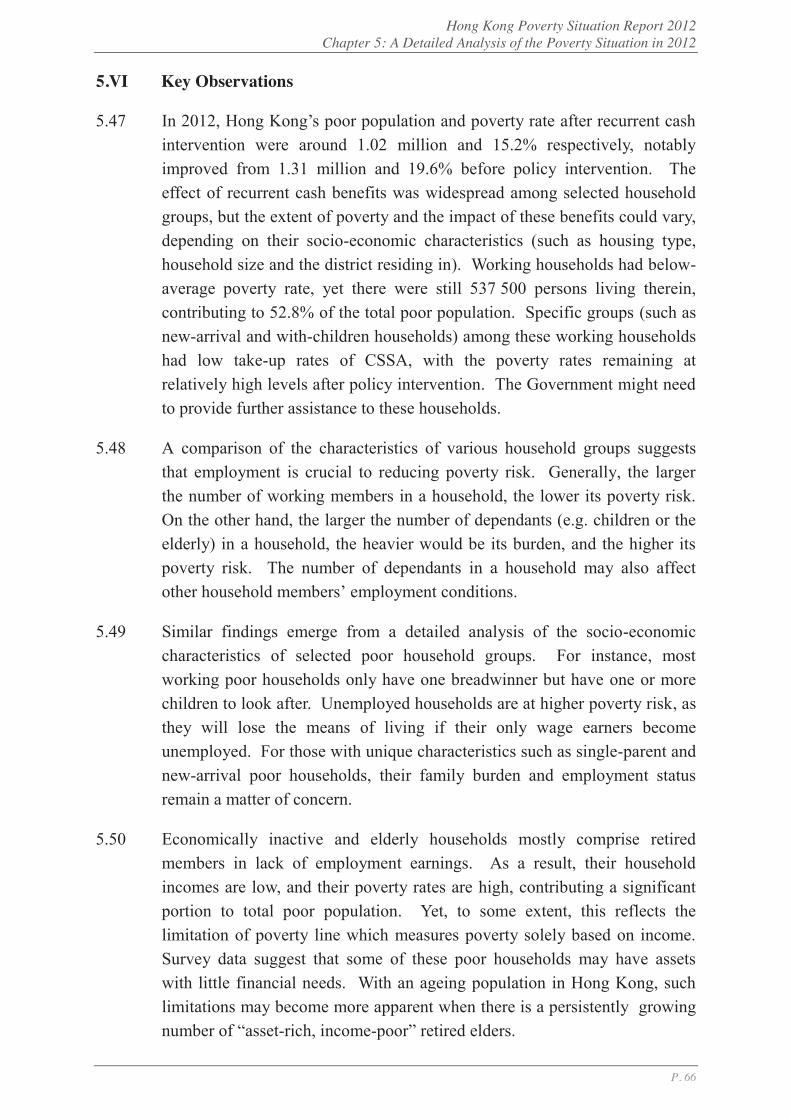
Hong Kong Poverty Situation Report 2012 Chapter 5: A Detailed Analysis of the Poverty Situation in 2012
P. 66
5.VI Key Observations
5.47 In 2012, Hong Kong’s poor population and poverty rate after recurrent cash intervention were around 1.02 million and 15.2% respectively, notably improved from 1.31 million and 19.6% before policy intervention. The effect of recurrent cash benefits was widespread among selected household groups, but the extent of poverty and the impact of these benefits could vary, depending on their socio-economic characteristics (such as housing type, household size and the district residing in). Working households had below-average poverty rate, yet there were still 537 500 persons living therein, contributing to 52.8% of the total poor population. Specific groups (such as new-arrival and with-children households) among these working households had low take-up rates of CSSA, with the poverty rates remaining at relatively high levels after policy intervention. The Government might need to provide further assistance to these households.
5.48 A comparison of the characteristics of various household groups suggests that employment is crucial to reducing poverty risk. Generally, the larger the number of working members in a household, the lower its poverty risk. On the other hand, the larger the number of dependants (e.g. children or the elderly) in a household, the heavier would be its burden, and the higher its poverty risk. The number of dependants in a household may also affect other household members’ employment conditions.
5.49 Similar findings emerge from a detailed analysis of the socio-economic characteristics of selected poor household groups. For instance, most working poor households only have one breadwinner but have one or more children to look after. Unemployed households are at higher poverty risk, as they will lose the means of living if their only wage earners become unemployed. For those with unique characteristics such as single-parent and new-arrival poor households, their family burden and employment status remain a matter of concern.
5.50 Economically inactive and elderly households mostly comprise retired members in lack of employment earnings. As a result, their household incomes are low, and their poverty rates are high, contributing a significant portion to total poor population. Yet, to some extent, this reflects the limitation of poverty line which measures poverty solely based on income. Survey data suggest that some of these poor households may have assets with little financial needs. With an ageing population in Hong Kong, such limitations may become more apparent when there is a persistently growing number of “asset-rich, income-poor” retired elders.
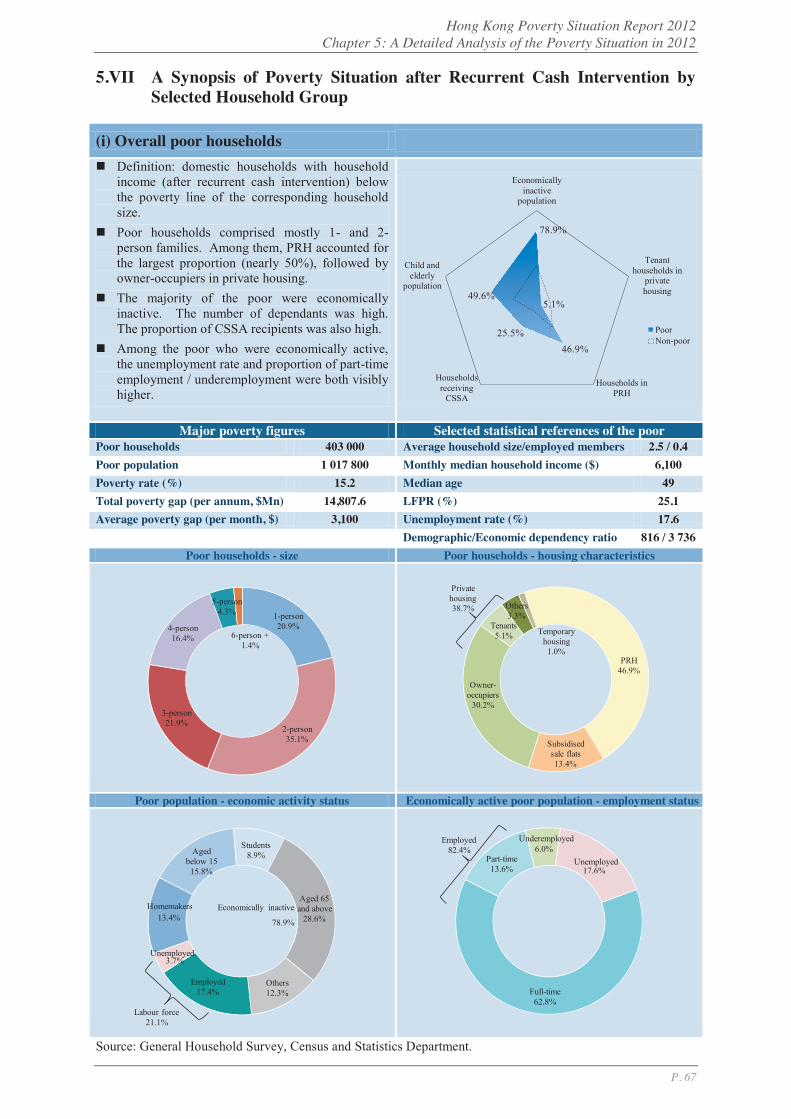
Hong Kong Poverty Situation Report 2012 Chapter 5: A Detailed Analysis of the Poverty Situation in 2012
P. 67
5.VII A Synopsis of Poverty Situation after Recurrent Cash Intervention by Selected Household Group
(i) Overall poor households Definition: domestic households with household
income (after recurrent cash intervention) below the poverty line of the corresponding household size.
Poor households comprised mostly 1- and 2-person families. Among them, PRH accounted for the largest proportion (nearly 50%), followed by owner-occupiers in private housing.
The majority of the poor were economically inactive. The number of dependants was high. The proportion of CSSA recipients was also high.
Among the poor who were economically active, the unemployment rate and proportion of part-time employment / underemployment were both visibly higher.
Major poverty figures Selected statistical references of the poor Poor households 403 000 Average household size/employed members 2.5 / 0.4
Poor population 1 017 800 Monthly median household income ($) 6,100
Poverty rate (%) 15.2 Median age 49
Total poverty gap (per annum, $Mn) 14,807.6 LFPR (%) 25.1
Average poverty gap (per month, $) 3,100 Unemployment rate (%) 17.6
Demographic/Economic dependency ratio 816 / 3 736 Poor households - size Poor households - housing characteristics
Poor population - economic activity status Economically active poor population - employment status
Source: General Household Survey, Census and Statistics Department.
78.9%
5.1%
46.9%25.5%
49.6%
Economicallyinactive
population
Tenanthouseholds in
privatehousing
Households inPRH
Householdsreceiving
CSSA
Child andelderly
population
PoorNon-poor
1-person20.9%
2-person35.1%
3-person21.9%
4-person16.4%
5-person4.3%
6-person +1.4%
PRH46.9%
Subsidised sale flats13.4%
Owner-occupiers
30.2%
Tenants5.1%
Others3.3%
Temporary housing 1.0%
Privatehousing38.7%
13.4%
Aged below 1515.8%
Students8.9%
Aged 65 and above
28.6%
Others12.3%
Employed17.4%
3.7%
Labour force21.1%
Economically inactive
78.9%
Unemployed
Homemakers
Full-time 62.8%
Part-time 13.6%
6.0%
17.6%
Employed82.4%
Unemployed
Underemployed
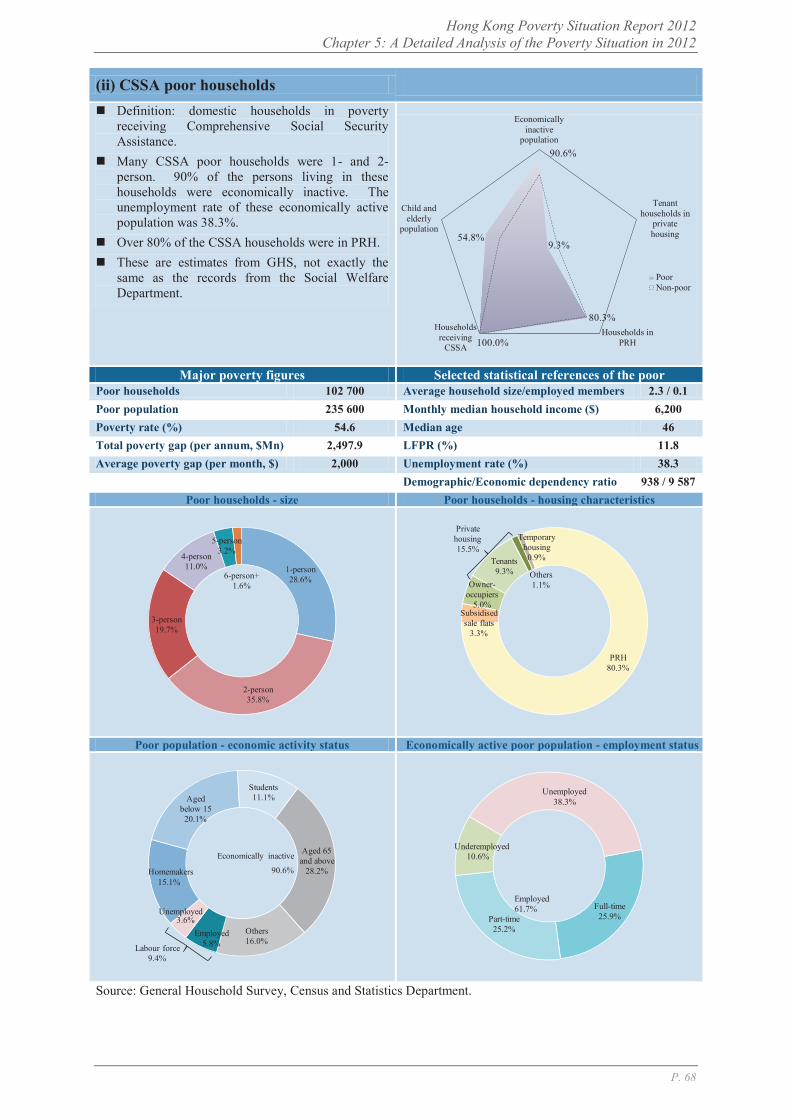
Hong Kong Poverty Situation Report 2012 Chapter 5: A Detailed Analysis of the Poverty Situation in 2012
P. 68
(ii) CSSA poor households Definition: domestic households in poverty
receiving Comprehensive Social Security Assistance.
Many CSSA poor households were 1- and 2-person. 90% of the persons living in these households were economically inactive. The unemployment rate of these economically active population was 38.3%.
Over 80% of the CSSA households were in PRH. These are estimates from GHS, not exactly the
same as the records from the Social Welfare Department.
Major poverty figures Selected statistical references of the poor
Poor households 102 700 Average household size/employed members 2.3 / 0.1 Poor population 235 600 Monthly median household income ($) 6,200 Poverty rate (%) 54.6 Median age 46 Total poverty gap (per annum, $Mn) 2,497.9 LFPR (%) 11.8 Average poverty gap (per month, $) 2,000 Unemployment rate (%) 38.3
Demographic/Economic dependency ratio 938 / 9 587 Poor households - size Poor households - housing characteristics
Poor population - economic activity status Economically active poor population - employment status
Source: General Household Survey, Census and Statistics Department.
90.6%
9.3%
80.3%
100.0%
54.8%
Economicallyinactive
population
Tenanthouseholds in
privatehousing
Households inPRH
Householdsreceiving
CSSA
Child andelderly
population
PoorNon-poor
1-person28.6%
2-person35.8%
3-person19.7%
4-person11.0%
5-person3.2%
6-person+1.6%
PRH80.3%
Subsidised sale flats
3.3%
Owner-occupiers
5.0%
Tenants9.3% Others
1.1%
Temporary housing0.9%
Privatehousing15.5%
15.1%
Aged below 15
20.1%
Students11.1%
Aged 65 and above
28.2%
Others16.0%
Employed5.8%
3.6%
Labour force9.4%
Economically inactive
90.6%Homemakers
Unemployed Full-time25.9%Part-time
25.2%
10.6%
38.3%
Employed61.7%
Unemployed
Underemployed

Hong Kong Poverty Situation Report 2012 Chapter 5: A Detailed Analysis of the Poverty Situation in 2012
P. 69
(iii) Elderly poor households Definition: domestic households in poverty with
all members aged 65 and above. Elderly poor households comprised mostly 1- and
2-person families, with most of them being economically inactive.
Owner-occupiers accounted for a high proportion of the total elderly poor households, most of them without mortgages or loans. This suggests a difference in terms of assets and liabilities between these households in question and other poor household groups.
Major poverty figures Selected statistical references of the poor
Poor households 120 600 Average household size/employed members 1.6 / @ Poor population 186 900 Monthly median household income ($) 3,200 Poverty rate (%) 54.4 Median age 76 Total poverty gap (per annum, $Mn) 3,719.0 LFPR (%) 1.3 Average poverty gap (per month, $) 2,600 Unemployment rate (%) § Demographic/Economic dependency ratio n.a. / 75 094
Poor households - size Poor households - housing characteristics
Poor population - economic activity status Economically active poor population - employment status
Notes: (§) Not released due to large sampling errors. (@) Less than 0.05. Source: General Household Survey, Census and Statistics Department.
98.7%
2.5%
40.2%26.8%
100.0%
Economicallyinactive
population
Tenanthouseholds in
privatehousing
Households inPRH
Householdsreceiving
CSSA
Child andelderly
population
PoorNon-poor
1-person45.9%
2-person53.3%
3-person0.8%
PRH40.2%
Subsidised sale flats13.3%
Owner-occupiers
38.2%
Tenants2.5%
Others4.7%
Temporary housing
1.1%
Privatehousing45.4%
98.7%
Employed1.3%Labour
force1.3%
Unemployed
Economicallyinactive
Full-time54.3%
Part-time41.1%
Employed97.6%
Underemployed &unemployed
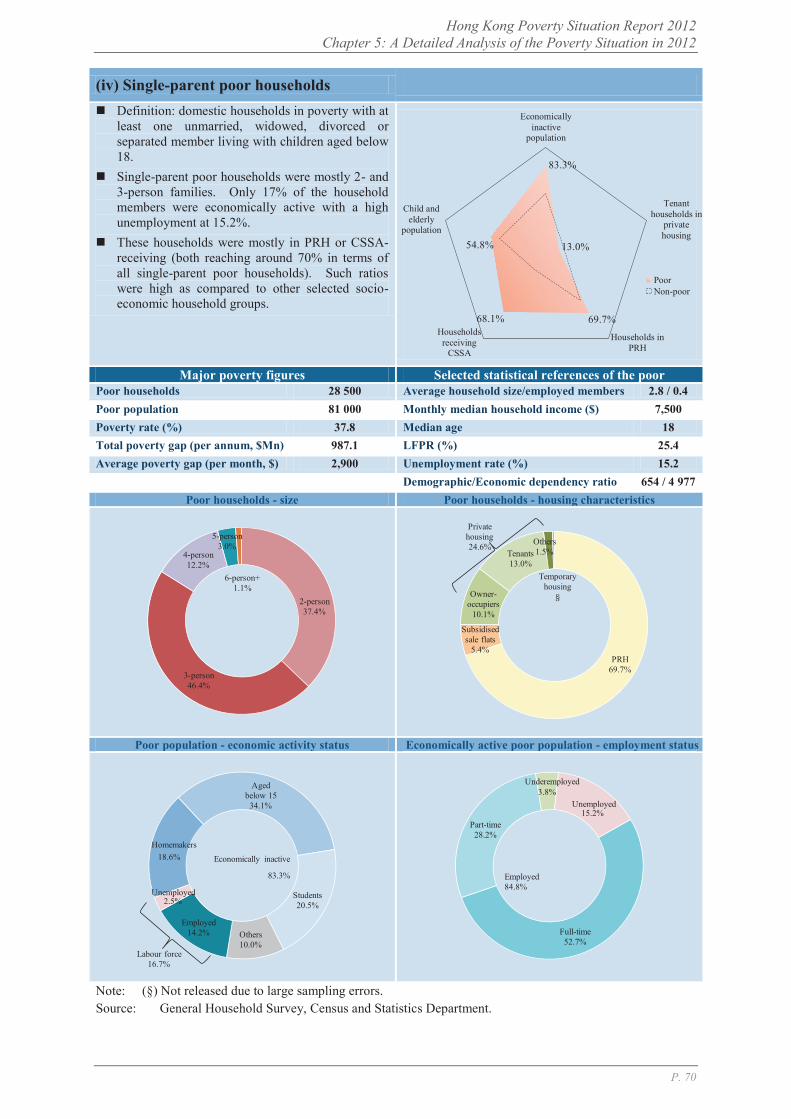
Hong Kong Poverty Situation Report 2012 Chapter 5: A Detailed Analysis of the Poverty Situation in 2012
P. 70
(iv) Single-parent poor households Definition: domestic households in poverty with at
least one unmarried, widowed, divorced or separated member living with children aged below 18.
Single-parent poor households were mostly 2- and 3-person families. Only 17% of the household members were economically active with a high unemployment at 15.2%.
These households were mostly in PRH or CSSA-receiving (both reaching around 70% in terms of all single-parent poor households). Such ratios were high as compared to other selected socio-economic household groups.
Major poverty figures Selected statistical references of the poor Poor households 28 500 Average household size/employed members 2.8 / 0.4 Poor population 81 000 Monthly median household income ($) 7,500 Poverty rate (%) 37.8 Median age 18 Total poverty gap (per annum, $Mn) 987.1 LFPR (%) 25.4 Average poverty gap (per month, $) 2,900 Unemployment rate (%) 15.2
Demographic/Economic dependency ratio 654 / 4 977 Poor households - size Poor households - housing characteristics
Poor population - economic activity status Economically active poor population - employment status
Note: (§) Not released due to large sampling errors. Source: General Household Survey, Census and Statistics Department.
83.3%
13.0%
69.7%68.1%
54.8%
Economicallyinactive
population
Tenanthouseholds in
privatehousing
Households inPRH
Householdsreceiving
CSSA
Child andelderly
population
PoorNon-poor
2-person37.4%
3-person46.4%
4-person12.2%
5-person3.0%
6-person+1.1%
PRH69.7%
Subsidised sale flats
5.4%
Owner-occupiers
10.1%
Tenants13.0%
Others1.5%
Temporary housing
Private housing24.6%
18.6%
Aged below 15
34.1%
Students20.5%
Others10.0%
Employed14.2%
2.5%
Labour force16.7%
Economically inactive
83.3%
Homemakers
Unemployed
Full-time52.7%
Part-time28.2%
3.8%
15.2%
Employed84.8%
Unemployed
Underemployed

Hong Kong Poverty Situation Report 2012 Chapter 5: A Detailed Analysis of the Poverty Situation in 2012
P. 71
(v) New-arrival poor households Definition: domestic households in poverty with at
least one member from the Mainland having resided in Hong Kong for less than seven years.
New-arrival poor households were mostly 3- and 4-person families. The LFPR was nearly 40%, relatively high among the selected household groups. However, as most of them were engaged in lower-skilled jobs, their household income was still relatively low.
Around 60% of the new-arrival poor households were in PRH. Some 19.5% of the households were living in private housing as tenants, quite high as compared to other selected household groups.
Major poverty figures Selected statistical references of the poor
Poor households 31 700 Average household size/employed members 3.5 / 0.8 Poor population 110 800 Monthly median household income ($) 9,300 Poverty rate (%) 36.9 Median age 34 Total poverty gap (per annum, $Mn) 1,276.4 LFPR (%) 39.2 Average poverty gap (per month, $) 3,400 Unemployment rate (%) 12.7
Demographic/Economic dependency ratio 732 / 2 860 Poor households - size Poor households - housing characteristics
Poor population - economic activity status Economically active poor population - employment status
Source: General Household Survey, Census and Statistics Department.
74.1%
19.5%
62.2%
26.6%
45.6%
Economicallyinactive
population
Tenanthouseholds in
privatehousing
Households inPRH
Householdsreceiving
CSSA
Child andelderly
population
PoorNon-poor
1-person0.9%
2-person15.7%
3-person35.0%
4-person34.6%
5-person10.2%
6-person+3.7%
PRH62.2%
Subsidised sale flats
5.5%
Owner-occupiers
9.5%
Tenants19.5%
Others1.7%
Temporary housing
1.5%
Privatehousing30.7%
19.9%
Aged below 1533.9%
Students5.5%
Aged 65 and above
8.0%Others6.8%Employed
22.6%
3.3%
Labour force25.9%
Economically inactive
74.1%
Homemakers
Unemployed
Full-time69.3%
Part-time10.4%
7.6%
12.7%
Employed87.3%
Unemployed
Underemployed

Hong Kong Poverty Situation Report 2012 Chapter 5: A Detailed Analysis of the Poverty Situation in 2012
P. 72
(vi) Poor households with children Definition: domestic households in poverty with at
least one member aged below 18. Poor households with children comprised mostly 3-
and 4-person families with higher dependency ratio. Nearly 80% of the household members were economically inactive conceivably due to child-care responsibilities. For those being economically active, the unemployment rate stood high at 11.7%.
A large share (around 60%) of the poor household group in question were tenant households in PRH.
Major poverty figures Selected statistical references of the poor
Poor households 137 700 Average household size/employed members 3.6 / 0.8 Poor population 500 500 Monthly median household income ($) 9,800 Poverty rate (%) 17.8 Median age 30 Total poverty gap (per annum, $Mn) 5,435.3 LFPR (%) 35.6 Average poverty gap (per month, $) 3,300 Unemployment rate (%) 11.7
Demographic/Economic dependency ratio 628 / 3 141 Poor households - size Poor households - housing characteristics
Poor population - economic activity status Economically active poor population - employment status
Source: General Household Survey, Census and Statistics Department.
75.8%
8.1%
60.6%
29.1%
48.2%
Economicallyinactive
population
Tenanthouseholds in
privatehousing
Households inPRH
Householdsreceiving
CSSA
Child andelderly
population
PoorNon-poor
2-person10.6%
3-person35.0%
4-person38.7%
5-person11.5%
6-person+4.0%
PRH60.6%
Subsidised sale flats10.5%
Owner-occupiers
17.9%
Tenants8.1%
Others1.9%
Temporary housing
1.0%
Private housing27.9%
18.5%
Aged below 15
32.1%
Aged 65 and above
6.2%
Others19.0%
Employed21.3%
2.8%
Labour force24.1%
Economically inactive
75.8%
Homemakers
Unemployed
Full-time69.5%
Part-time12.8%
6.0%
11.7%
Employed88.3%
Underemployed
Unemployed
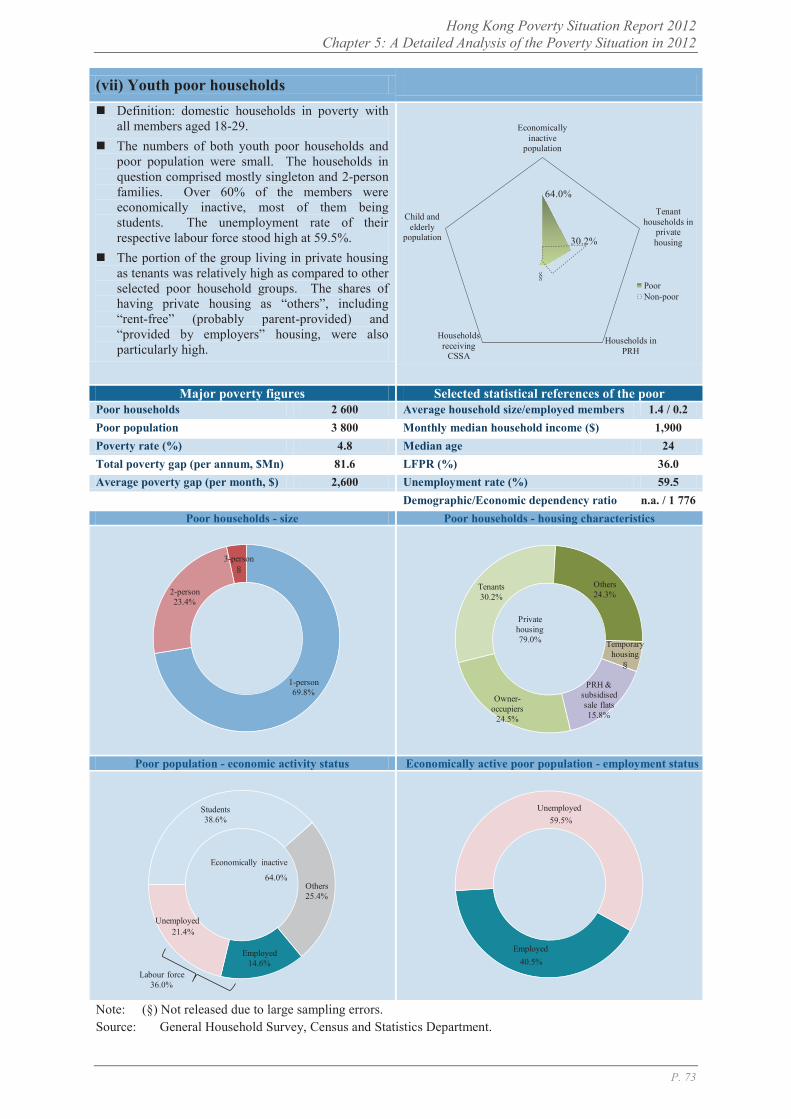
Hong Kong Poverty Situation Report 2012 Chapter 5: A Detailed Analysis of the Poverty Situation in 2012
P. 73
(vii) Youth poor households Definition: domestic households in poverty with
all members aged 18-29. The numbers of both youth poor households and
poor population were small. The households in question comprised mostly singleton and 2-person families. Over 60% of the members were economically inactive, most of them being students. The unemployment rate of their respective labour force stood high at 59.5%.
The portion of the group living in private housing as tenants was relatively high as compared to other selected poor household groups. The shares of having private housing as “others”, including “rent-free” (probably parent-provided) and “provided by employers” housing, were also particularly high.
Major poverty figures Selected statistical references of the poor Poor households 2 600 Average household size/employed members 1.4 / 0.2 Poor population 3 800 Monthly median household income ($) 1,900 Poverty rate (%) 4.8 Median age 24 Total poverty gap (per annum, $Mn) 81.6 LFPR (%) 36.0 Average poverty gap (per month, $) 2,600 Unemployment rate (%) 59.5
Demographic/Economic dependency ratio n.a. / 1 776 Poor households - size Poor households - housing characteristics
Poor population - economic activity status Economically active poor population - employment status
Note: (§) Not released due to large sampling errors. Source: General Household Survey, Census and Statistics Department.
64.0%
30.2%
Economicallyinactive
population
Tenanthouseholds in
privatehousing
Households inPRH
Householdsreceiving
CSSA
Child andelderly
population
PoorNon-poor
1-person69.8%
2-person23.4%
3-person
PRH & subsidised sale flats15.8%
Owner-occupiers
24.5%
Tenants30.2%
Others24.3%
Temporary housing
Privatehousing79.0%
Students38.6%
Others25.4%
Employed14.6%
21.4%
Labour force36.0%
Economically inactive
64.0%
Unemployed
40.5%
59.5%Unemployed
Employed
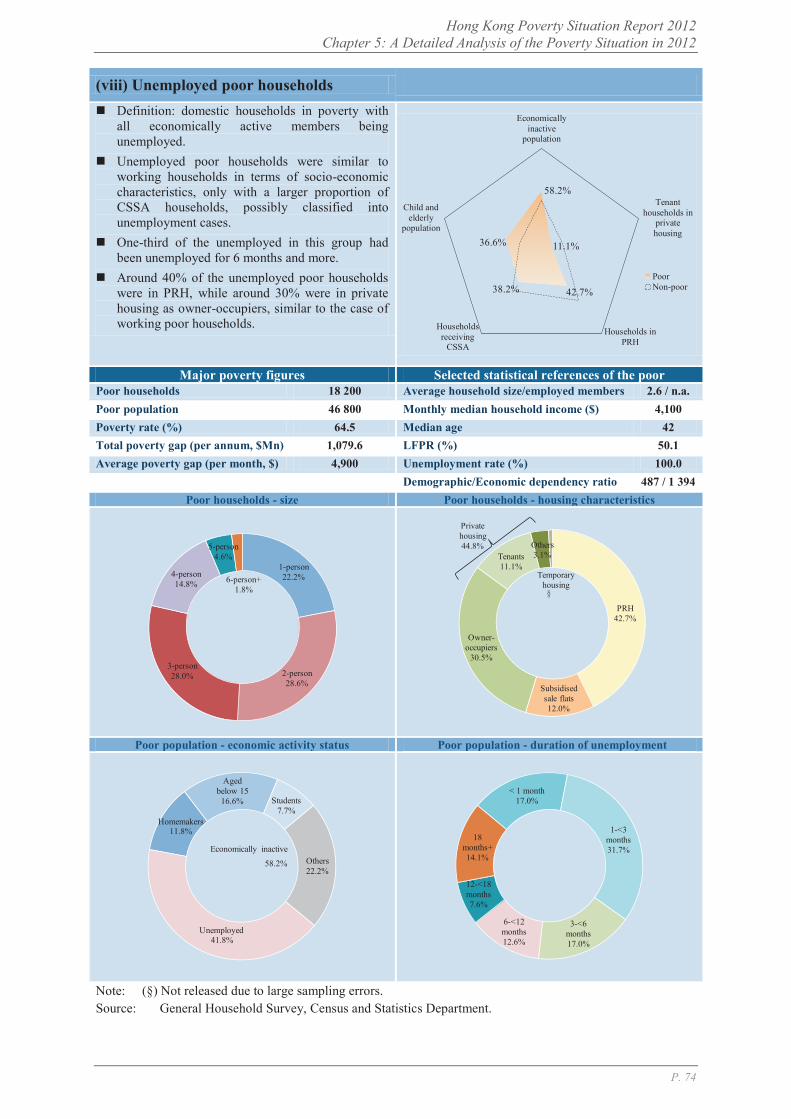
Hong Kong Poverty Situation Report 2012 Chapter 5: A Detailed Analysis of the Poverty Situation in 2012
P. 74
(viii) Unemployed poor households Definition: domestic households in poverty with
all economically active members being unemployed.
Unemployed poor households were similar to working households in terms of socio-economic characteristics, only with a larger proportion of CSSA households, possibly classified into unemployment cases.
One-third of the unemployed in this group had been unemployed for 6 months and more.
Around 40% of the unemployed poor households were in PRH, while around 30% were in private housing as owner-occupiers, similar to the case of working poor households.
Major poverty figures Selected statistical references of the poor
Poor households 18 200 Average household size/employed members 2.6 / n.a. Poor population 46 800 Monthly median household income ($) 4,100 Poverty rate (%) 64.5 Median age 42 Total poverty gap (per annum, $Mn) 1,079.6 LFPR (%) 50.1 Average poverty gap (per month, $) 4,900 Unemployment rate (%) 100.0
Demographic/Economic dependency ratio 487 / 1 394 Poor households - size Poor households - housing characteristics
Poor population - economic activity status Poor population - duration of unemployment
Note: (§) Not released due to large sampling errors. Source: General Household Survey, Census and Statistics Department.
58.2%
11.1%
42.7%38.2%
36.6%
Economicallyinactive
population
Tenanthouseholds in
privatehousing
Households inPRH
Householdsreceiving
CSSA
Child andelderly
population
PoorNon-poor
1-person22.2%
2-person28.6%
3-person28.0%
4-person14.8%
5-person4.6%
6-person+1.8%
PRH42.7%
Subsidised sale flats12.0%
Owner-occupiers
30.5%
Tenants11.1%
Others3.1%
Temporary housing
Private housing44.8%
11.8%
Aged below 1516.6% Students
7.7%
Others22.2%
41.8%
Economically inactive
58.2%
Homemakers
Unemployed
< 1 month17.0%
1-<3 months31.7%
3-<6 months17.0%
6-<12 months12.6%
12-<18 months7.6%
18 months+14.1%
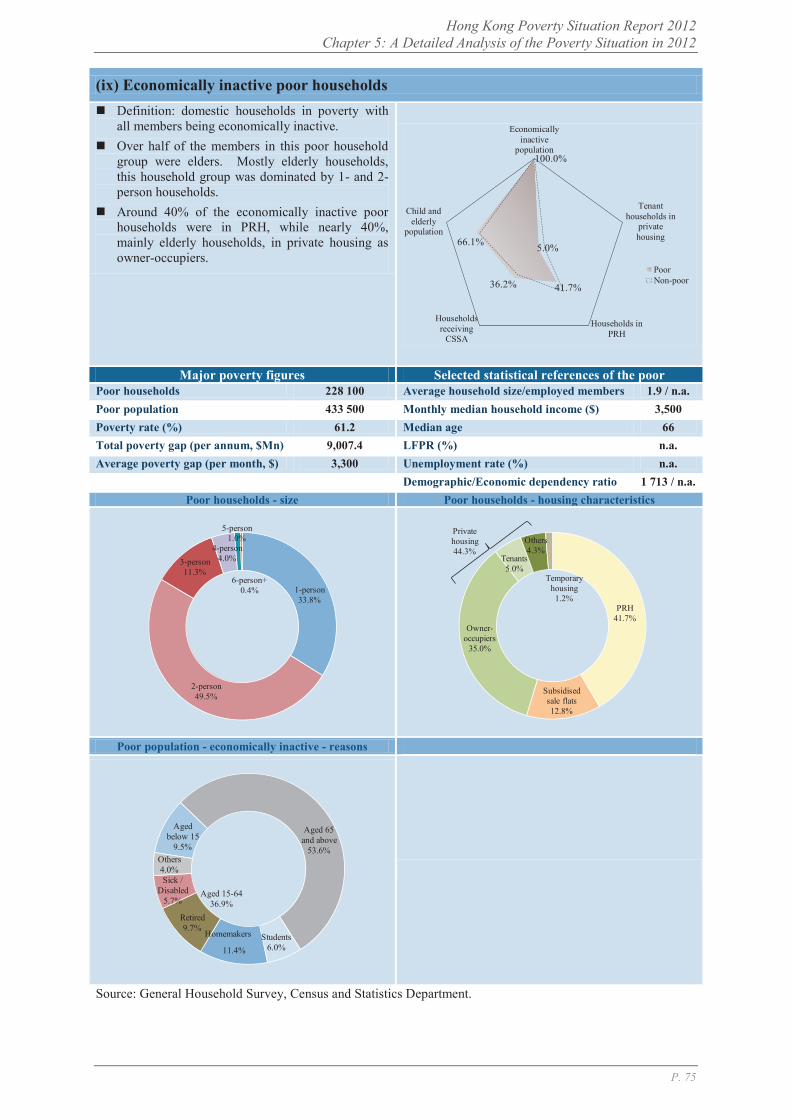
Hong Kong Poverty Situation Report 2012 Chapter 5: A Detailed Analysis of the Poverty Situation in 2012
P. 75
(ix) Economically inactive poor households Definition: domestic households in poverty with
all members being economically inactive. Over half of the members in this poor household
group were elders. Mostly elderly households, this household group was dominated by 1- and 2-person households.
Around 40% of the economically inactive poor households were in PRH, while nearly 40%, mainly elderly households, in private housing as owner-occupiers.
Major poverty figures Selected statistical references of the poor Poor households 228 100 Average household size/employed members 1.9 / n.a. Poor population 433 500 Monthly median household income ($) 3,500 Poverty rate (%) 61.2 Median age 66 Total poverty gap (per annum, $Mn) 9,007.4 LFPR (%) n.a. Average poverty gap (per month, $) 3,300 Unemployment rate (%) n.a.
Demographic/Economic dependency ratio 1 713 / n.a. Poor households - size Poor households - housing characteristics
Poor population - economically inactive - reasons
Source: General Household Survey, Census and Statistics Department.
100.0%
5.0%
41.7%36.2%
66.1%
Economicallyinactive
population
Tenanthouseholds in
privatehousing
Households inPRH
Householdsreceiving
CSSA
Child andelderly
population
PoorNon-poor
1-person33.8%
2-person49.5%
3-person11.3%
4-person4.0%
5-person1.0%
6-person+0.4%
PRH41.7%
Subsidised sale flats12.8%
Owner-occupiers
35.0%
Tenants5.0%
Others4.3%
Temporary housing
1.2%
Privatehousing44.3%
Aged below 15
9.5%
Aged 65 and above
53.6%
Students6.0%11.4%
Retired9.7%
Sick / Disabled
5.7%
Others4.0%
Aged 15-6436.9%
Homemakers

Hong Kong Poverty Situation Report 2012 Chapter 5: A Detailed Analysis of the Poverty Situation in 2012
P. 76
(x) Working poor households Definition: domestic households in poverty with at
least one employed member excluding foreign domestic helpers (FDHs).
Working poor households comprised mostly 3- and 4-person families. Though having at least one household member in employment, the proportions of underemployed, part-timers and unemployed in the overall labour force of this household group were higher than the overall averages.
About 50% of the working poor households were in PRH, while nearly one-fourth of them were owner-occupiers in private housing.
Major poverty figures Selected statistical references of the poor
Poor households 156 700 Average household size/employed members 3.4 / 1.1 Poor population 537 500 Monthly median household income ($) 10,000 Poverty rate (%) 9.1 Median age 38 Total poverty gap (per annum, $Mn) 4,720.6 LFPR (%) 45.9 Average poverty gap (per month, $) 2,500 Unemployment rate (%) 9.3
Demographic/Economic dependency ratio 455 / 1 751 Poor households - size Poor households - housing characteristics
Poor population - economic activity status Economically active poor population - employment status
Source: General Household Survey, Census and Statistics Department.
63.7%
4.7%
54.9%
8.4%
37.5%
Economicallyinactive
population
Tenanthouseholds in
privatehousing
Households inPRH
Householdsreceiving
CSSA
Child andelderly
population
PoorNon-poor
1-person2.0%
2-person14.8%
3-person36.7%
4-person34.6%
5-person9.1%
6-person+2.8%
PRH54.9%
Subsidised sale flats14.6%
Owner-occupiers
23.1%
Tenants4.7%
Others1.9%
Temporary housing0.8%
Privatehousing29.7%
15.0%
Aged below 15
20.8% Students11.3%
Others16.5%
Employed33.0%
3.4%
Labour force36.3%
Economically inactive
63.7%
Homemakers
Unemployed
Full-time69.1%
Part-time15.0%
6.6%
9.3%
Employed90.7%
Unemployed
Underemployed

Hong Kong Poverty Situation Report 2012 Chapter 6: Policy Implications
P. 77
6 Policy Implications
6.1 Setting a poverty line that reflects the special circumstances of Hong Kong is an unprecedented endeavour. This fully signifies the political commitment of the current Government and the significant importance it attaches to tackling poverty.
6.2 After numerous rounds of deliberations by CoP and its Task Force, a consensus was reached on the setting of poverty line and the analytical framework. Apart from being a tool for in-depth analysis and on-going monitoring of Hong Kong’s poverty situation, the poverty line can also help direct the formulation of more appropriate and effective poverty alleviation initiatives especially towards addressing the needs of the grassroots families and low-income individuals.
6.3 Under the poverty line framework proposed by CoP, Hong Kong’s poverty situation improved between 2009 and 2012. In 2012, the poor population after recurrent cash intervention was some 1.02 million and the poverty rate was 15.2%. In comparison with the corresponding figures before policy intervention (about 1.31 million and 19.6% respectively), it is clear that the recurrent cash benefits awarded by the Government indeed have played a crucial role in poverty alleviation.
6.4 This Report also provides a detailed analysis of selected household groups and individuals living below the poverty line in 2012.
Although all the selected groups were able to benefit from the recurrent cash benefits, the poverty rates of certain groups, in particular elderly households (54.4%), single-parent households (37.8%), and new-arrival households (36.9%) remained high after recurrent cash intervention. More effort is still required to alleviate poverty.
Further analysis of the causes of poverty reveals that most of the poor are living in jobless, elderly and economically inactive households. As many of these individuals are retirees in lack of employment earnings, they are likely to be classified as poor given the limitation that the poverty line is set solely with reference to income. Our population is ageing and the number of households comprising elderly retirees is bound to increase in the long-term. By then, the inherent limitations of a poverty line defined without reference to household assets / liabilities may become more apparent.

Hong Kong Poverty Situation Report 2012 Chapter 6: Policy Implications
P. 78
As for the working poor, their education and skill levels are generally low; family burdens are heavy; engagement in part-time jobs / underemployment are common, thereby limiting their employment earnings. In the short-term, although employment earnings can effectively reduce poverty risk given the protection of SMW, education and training and re-training remain the key to improve their upward mobility towards higher-skilled segment and hence their income in the long-term through productivity growth. Furthermore, the issue of enhancing work incentives to encourage self-reliance and divesture of poverty on the part of the grassroots remain high on the policy agenda.
The number of children in a household also has a significant bearing on its poverty risk. As shown in Chapter 5, the more children in a household, the higher the poverty risk. In particular, the burden of childcare may constrain the ability of household members to exploit employment opportunities. In view of this, ways to design measures targeted towards low-income households with children must be considered in formulating new poverty-relief initiatives.
It is evident that poor people from single-parent and new-arrival families are in need of care and concern given their unique social-economic characteristics. A large proportion of single-parent families are CSSA recipients. Their labour force participation rate is far lower than the other household groups, which may reflect their restriction on full-time work following from the responsibility of being the sole caretaker of children. The case of new-arrival poor households is quite the contrary. A higher portion of them are ineligible for CSSA, and their labour force participation rate is relatively high. Yet, employment earnings of such individuals are restricted by relatively low education and skill levels.
6.5 The poverty line is not a poverty alleviation line. Nevertheless, the above findings fully substantiate the perception that there are still a certain number of households and people in the community whose living standards are relatively low and whose available resources are below the economy average. The poverty line may well serve as a tool to identify the needy in the community. It also provides the Government with an objective tool for policy analysis and assessment, with a view to supporting formulation and implementation of appropriate policy initiatives. A case in point is the OALA recently introduced by the Government to assist elderly people with financial needs. The Government can, after assessing the number of beneficiaries and their socio-economic characteristics, quantify the effectiveness of this

Hong Kong Poverty Situation Report 2012 Chapter 6: Policy Implications
P. 79
measure in poverty alleviation in terms of the poverty figures before and after the introduction of OALA.
6.6 Upon the completion of the task of setting the poverty line, the Government will continue in its efforts to provide targeted assistance to various needy groups as early as possible, with a view to achieving the objectives of poverty alleviation and prevention.
6.7 Looking ahead the poverty situation in 2013, we believe that the burden of poor households, especially elderly people and grassroots workers, will be further eased by virtue of steady macroeconomic environment, a labour market virtually in a state of full employment with the SMW rate revised upward to $30 per hour, and a variety of new poverty alleviation initiatives launched by the Government. Such measures include the full launch of OALA, the enhancement of the WITS Scheme, as well as the rolling out of a new round of measures by the CCF. The Government will continue to collect the relevant data for an early update on the poverty situation in 2013. CoP will also be briefed in due course.
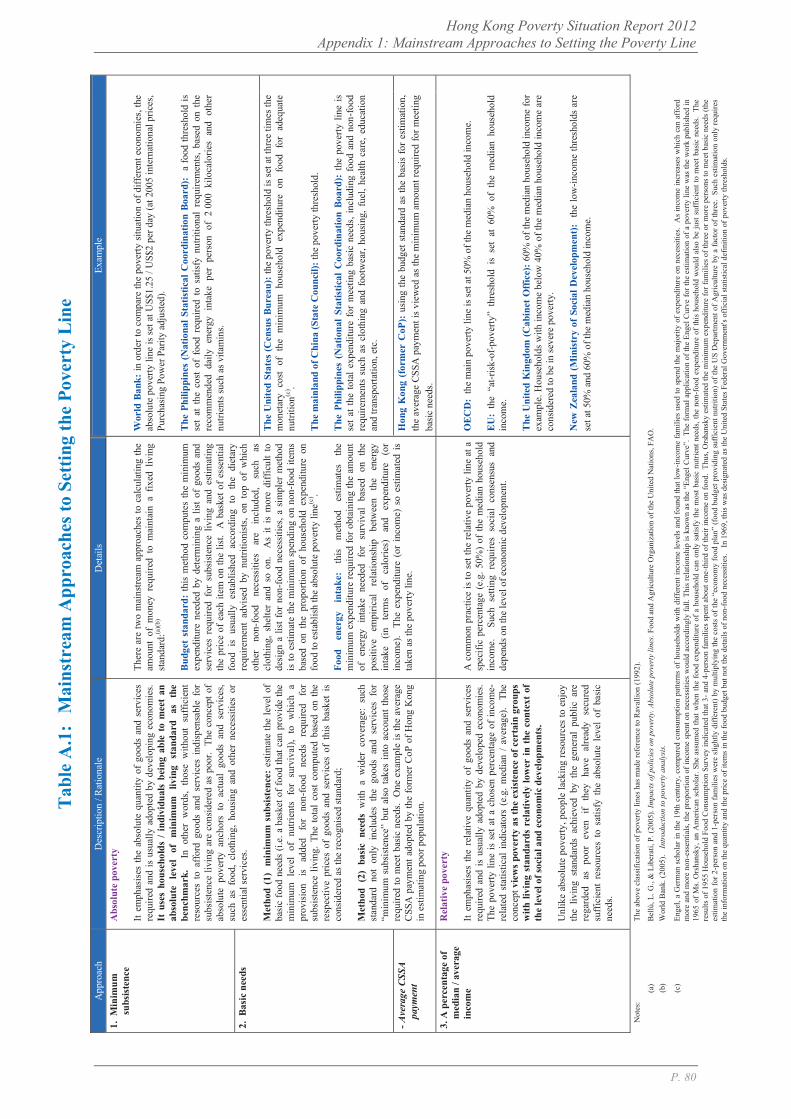
Hong Kong Poverty Situation Report 2012 Appendix 1: Mainstream Approaches to Setting the Poverty Line
P. 80
T
able
A.1
: M
ains
trea
m A
ppro
ache
s to
Setti
ng th
e Po
vert
y L
ine
Exam
ple
Wor
ld B
ank:
in o
rder
to c
ompa
re th
e po
verty
situ
atio
n of
diff
eren
t eco
nom
ies,
the
abso
lute
pov
erty
line
is se
t at U
S$1.
25 /
US$
2 pe
r day
(at 2
005
inte
rnat
iona
l pric
es,
Purc
hasi
ng P
ower
Par
ity a
djus
ted)
. The
Phi
lippi
nes
(Nat
iona
l Sta
tistic
al C
oord
inat
ion
Boar
d):
a fo
od th
resh
old
is
set
at t
he c
ost
of f
ood
requ
ired
to s
atis
fy n
utrit
iona
l re
quire
men
ts,
base
d on
the
re
com
men
ded
daily
ene
rgy
inta
ke p
er p
erso
n of
2 0
00 k
iloca
lorie
s an
d ot
her
nutri
ents
such
as v
itam
ins.
The
Uni
ted
Stat
es (C
ensu
s Bu
reau
): th
e po
verty
thre
shol
d is
set a
t thr
ee ti
mes
the
mon
etar
y co
st of
the
min
imum
hou
seho
ld e
xpen
ditu
re o
n fo
od f
or a
dequ
ate
nutri
tion(c
) .
The
mai
nlan
d of
Chi
na (S
tate
Cou
ncil)
: the
pov
erty
thre
shol
d.
The
Phi
lippi
nes
(Nat
iona
l St
atis
tical
Coo
rdin
atio
n B
oard
): t
he p
over
ty li
ne is
se
t at t
he to
tal e
xpen
ditu
re f
or m
eetin
g ba
sic
need
s, in
clud
ing
food
and
non
-food
re
quire
men
ts s
uch
as c
loth
ing
and
foot
wea
r, ho
usin
g, f
uel,
heal
th c
are,
edu
catio
n an
d tra
nspo
rtatio
n, e
tc.
Hon
g K
ong
(form
er C
oP):
usin
g th
e bu
dget
sta
ndar
d as
the
basi
s fo
r es
timat
ion,
th
e av
erag
e CS
SA p
aym
ent i
s vie
wed
as t
he m
inim
um a
mou
nt re
quire
d fo
r mee
ting
basi
c ne
eds.
OEC
D:
the
mai
n po
verty
line
is se
t at 5
0% o
f the
med
ian
hous
ehol
d in
com
e.
EU
: th
e “a
t-risk
-of-p
over
ty”
thre
shol
d is
set
at
60%
of
the
med
ian
hous
ehol
d in
com
e.
The
Uni
ted
Kin
gdom
(Cab
inet
Off
ice)
: 60%
of t
he m
edia
n ho
useh
old
inco
me
for
exam
ple.
Hou
seho
lds w
ith in
com
e be
low
40%
of t
he m
edia
n ho
useh
old
inco
me
are
cons
ider
ed to
be
in se
vere
pov
erty
. N
ew Z
eala
nd (
Min
istr
y of
Soc
ial D
evel
opm
ent):
th
e lo
w-in
com
e th
resh
olds
are
se
t at 5
0% a
nd 6
0% o
f the
med
ian
hous
ehol
d in
com
e.
The
abov
e cl
assi
ficat
ion
of p
over
ty li
nes h
as m
ade
refe
renc
e to
Rav
allio
n (1
992)
.
Bel
lù, L
. G.,
& L
iber
ati,
P. (2
005)
. Im
pact
s of p
olic
ies o
n po
verty
. Abs
olut
e po
verty
line
s. Fo
od a
nd A
gric
ultu
re O
rgan
izat
ion
of th
e U
nite
d N
atio
ns, F
AO
. W
orld
Ban
k. (2
005)
. In
trodu
ctio
n to
pov
erty
ana
lysis
.
Enge
l, a
Ger
man
sch
olar
in th
e 19
th c
entu
ry, c
ompa
red
cons
umpt
ion
patte
rns
of h
ouse
hold
s w
ith d
iffer
ent i
ncom
e le
vels
and
foun
d th
at lo
w-in
com
e fa
mili
es u
sed
to s
pend
the
maj
ority
of e
xpen
ditu
re o
n ne
cess
ities
. A
s in
com
e in
crea
ses
whi
ch c
an a
ffor
d m
ore
and
mor
e no
n -es
sent
ials
, the
pro
porti
on o
f inc
ome
spen
t on
nece
ssiti
es w
ould
acc
ordi
ngly
fall.
Thi
s re
latio
nshi
p is
kno
wn
as th
e “E
ngel
Cur
ve”.
The
form
al a
pplic
atio
n of
the
Enge
l Cur
ve fo
r the
est
imat
ion
of a
pov
erty
line
was
the
wor
k pu
blis
hed
in
1965
of M
s. O
rsha
nsky
, an
Am
eric
an s
chol
ar. S
he a
ssum
ed th
at w
hen
the
food
exp
endi
ture
of a
hou
seho
ld c
an o
nly
satis
fy th
e m
ost b
asic
nut
rient
nee
ds, t
he n
on-fo
od e
xpen
ditu
re o
f thi
s ho
useh
old
wou
ld a
lso
be ju
st s
uffic
ient
to m
eet b
asic
nee
ds.
The
resu
lts o
f 195
5 H
ouse
hold
Foo
d C
onsu
mpt
ion
Surv
ey in
dica
ted
that
3- a
nd 4
-per
son
fam
ilies
spen
t abo
ut o
ne-th
ird o
f the
ir in
com
e on
food
. Th
us, O
rsha
nsky
est
imat
ed th
e m
inim
um e
xpen
ditu
re fo
r fam
ilies
of t
hree
or m
ore
pers
ons t
o m
eet b
asic
nee
ds (t
he
estim
atio
n fo
r 2-p
erso
n an
d 1-
pers
on fa
mili
es w
ere
slig
htly
diff
eren
t) by
mul
tiply
ing
the
cost
s of
the
“eco
nom
y fo
od p
lan”
(foo
d bu
dget
pro
vidi
ng s
uffic
ient
nut
ritio
n) o
f the
US
Dep
artm
ent o
f Agr
icul
ture
by
a fa
ctor
of t
hree
. Su
ch e
stim
atio
n on
ly re
quire
s th
e in
form
atio
n on
the
quan
tity
and
the
pric
e of
item
s in
the
food
bud
get b
ut n
ot th
e de
tails
of n
on-f
ood
nece
ssiti
es.
In 1
969,
this
was
des
igna
ted
as th
e U
nite
d St
ates
Fed
eral
Gov
ernm
ent's
off
icia
l sta
tistic
al d
efin
ition
of p
over
ty th
resh
olds
.
A c
omm
on p
ract
ice
is to
set
the
rela
tive
pove
rty li
ne a
t a
spec
ific
perc
enta
ge (
e.g.
50%
) of
the
med
ian
hous
ehol
d in
com
e.
Such
set
ting
requ
ires
soci
al c
onse
nsus
and
de
pend
s on
the
leve
l of e
cono
mic
dev
elop
men
t.
Det
ails
Ther
e ar
e tw
o m
ains
tream
app
roac
hes
to c
alcu
latin
g th
e am
ount
of
mon
ey r
equi
red
to m
aint
ain
a fix
ed l
ivin
g st
anda
rd:(a
)(b)
Bud
get
stan
dard
: th
is m
etho
d co
mpu
tes
the
min
imum
ex
pend
iture
nee
ded
by d
eter
min
ing
a lis
t of
good
s an
d se
rvic
es r
equi
red
for
subs
iste
nce
livin
g an
d es
timat
ing
the
pric
e of
eac
h ite
m o
n th
e lis
t. A
bas
ket o
f ess
entia
l fo
od i
s us
ually
est
ablis
hed
acco
rdin
g to
the
die
tary
re
quire
men
t ad
vise
d by
nut
ritio
nist
s, on
top
of
whi
ch
othe
r no
n-fo
od
nece
ssiti
es
are
incl
uded
, su
ch
as
clot
hing
, sh
elte
r an
d so
on.
A
s it
is m
ore
diffi
cult
to
desi
gn a
list
for
non
-food
nec
essit
ies,
a si
mpl
er m
etho
d is
to e
stim
ate
the
min
imum
spe
ndin
g on
non
-food
item
s ba
sed
on t
he p
ropo
rtion
of
hous
ehol
d ex
pend
iture
on
food
to e
stab
lish
the
abso
lute
pov
erty
line
(c) .
Food
en
ergy
in
take
: th
is
met
hod
estim
ates
th
e m
inim
um e
xpen
ditu
re re
quire
d fo
r obt
aini
ng th
e am
ount
of
ene
rgy
inta
ke n
eede
d fo
r su
rviv
al b
ased
on
the
posi
tive
empi
rical
re
latio
nshi
p be
twee
n th
e en
ergy
in
take
(in
te
rms
of
calo
ries)
an
d ex
pend
iture
(o
r in
com
e).
The
expe
nditu
re (
or i
ncom
e) s
o es
timat
ed is
ta
ken
as th
e po
verty
line
.
Des
crip
tion
/ Rat
iona
le
Abs
olut
e po
vert
y It
emph
asis
es th
e ab
solu
te q
uant
ity o
f go
ods
and
serv
ices
re
quire
d an
d is
usu
ally
ado
pted
by
deve
lopi
ng e
cono
mie
s.
It u
ses
hous
ehol
ds /
indi
vidu
als
bein
g ab
le t
o m
eet
an
abso
lute
le
vel
of
min
imum
liv
ing
stan
dard
as
th
e be
nchm
ark.
In
oth
er w
ords
, th
ose
with
out
suffi
cien
t re
sour
ces
to a
fford
goo
ds a
nd s
ervi
ces
indi
spen
sabl
e fo
r su
bsist
ence
livi
ng a
re c
onsid
ered
as
poor
. Th
e co
ncep
t of
abso
lute
pov
erty
anc
hors
to
actu
al g
oods
and
ser
vice
s, su
ch a
s fo
od,
clot
hing
, ho
usin
g an
d ot
her
nece
ssiti
es o
r es
sent
ial s
ervi
ces.
Met
hod
(1) m
inim
um s
ubsi
sten
ce:
estim
ate
the
leve
l of
basi
c fo
od n
eeds
(i.e
. a b
aske
t of f
ood
that
can
pro
vide
the
min
imum
lev
el o
f nu
trien
ts f
or s
urvi
val),
to
whi
ch a
pr
ovis
ion
is ad
ded
for
non-
food
ne
eds
requ
ired
for
subs
isten
ce l
ivin
g. T
he t
otal
cos
t co
mpu
ted
base
d on
the
re
spec
tive
pric
es o
f go
ods
and
serv
ices
of
this
bask
et i
s co
nsid
ered
as t
he re
cogn
ised
stan
dard
; M
etho
d (2
) ba
sic
need
s w
ith a
wid
er c
over
age:
suc
h st
anda
rd n
ot o
nly
incl
udes
the
goo
ds a
nd s
ervi
ces
for
“min
imum
sub
sist
ence
” bu
t al
so ta
kes
into
acc
ount
thos
e re
quire
d to
mee
t bas
ic n
eeds
. O
ne e
xam
ple
is th
e av
erag
e C
SSA
pay
men
t ado
pted
by
the
form
er C
oP o
f Hon
g K
ong
in e
stim
atin
g po
or p
opul
atio
n.
Rel
ativ
e po
vert
y It
emph
asis
es th
e re
lativ
e qu
antit
y of
goo
ds a
nd s
ervi
ces
requ
ired
and
is u
sual
ly a
dopt
ed b
y de
velo
ped
econ
omie
s.
The
pove
rty li
ne is
set
at a
cho
sen
perc
enta
ge o
f in
com
e-re
late
d st
atis
tical
indi
cato
rs (
e.g.
med
ian
/ av
erag
e).
The
conc
ept v
iew
s po
vert
y as
the
exis
tenc
e of
cer
tain
gro
ups
with
livi
ng s
tand
ards
rel
ativ
ely
low
er in
the
con
text
of
the
leve
l of s
ocia
l and
eco
nom
ic d
evel
opm
ents
. U
nlik
e ab
solu
te p
over
ty, p
eopl
e la
ckin
g re
sour
ces
to e
njoy
th
e liv
ing
stan
dard
s ac
hiev
ed b
y th
e ge
nera
l pu
blic
are
re
gard
ed
as
poor
ev
en
if th
ey
have
al
read
y se
cure
d su
ffic
ient
res
ourc
es t
o sa
tisfy
the
abs
olut
e le
vel
of b
asic
ne
eds.
App
roac
h 1.
Min
imum
su
bsis
tenc
e
2. B
asic
nee
ds
- Ave
rage
CSS
A pa
ymen
t 3.
A p
erce
ntag
e of
m
edia
n / a
vera
ge
inco
me
Not
es:
(a)
(b
)
(c
)
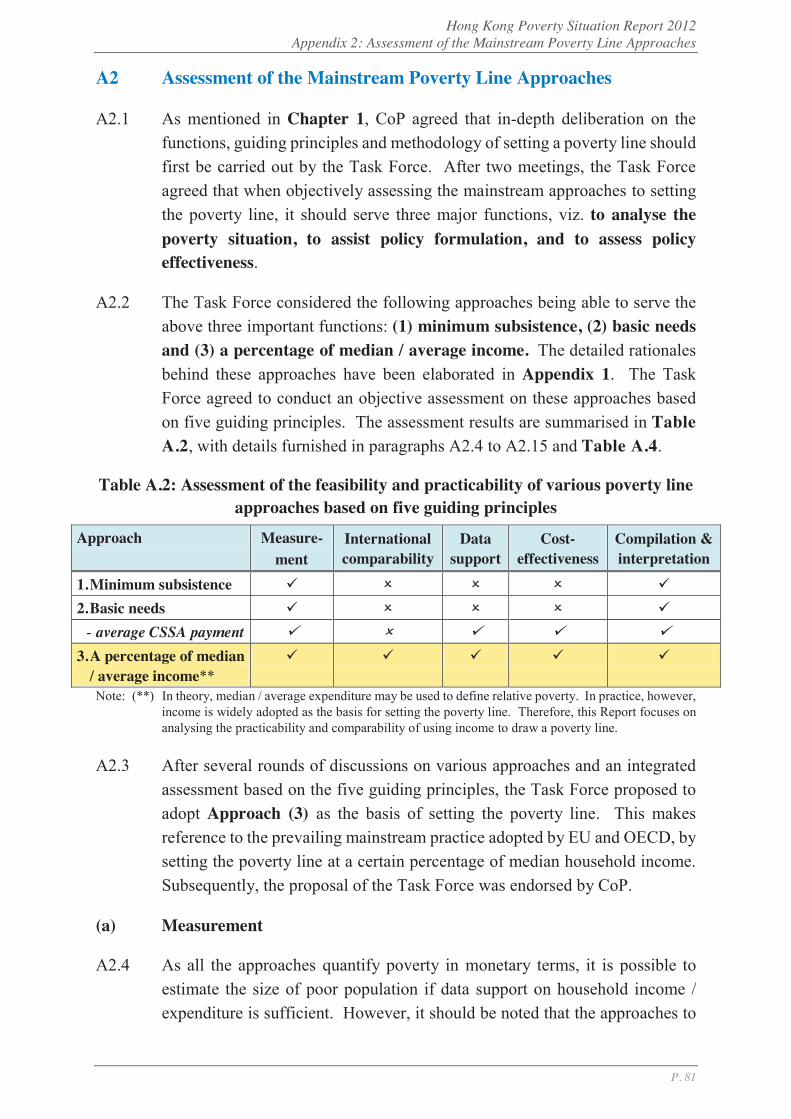
Hong Kong Poverty Situation Report 2012 Appendix 2: Assessment of the Mainstream Poverty Line Approaches
P. 81
A2 Assessment of the Mainstream Poverty Line Approaches
A2.1 As mentioned in Chapter 1, CoP agreed that in-depth deliberation on the functions, guiding principles and methodology of setting a poverty line should first be carried out by the Task Force. After two meetings, the Task Force agreed that when objectively assessing the mainstream approaches to setting the poverty line, it should serve three major functions, viz. to analyse the poverty situation, to assist policy formulation, and to assess policy effectiveness.
A2.2 The Task Force considered the following approaches being able to serve the above three important functions: (1) minimum subsistence, (2) basic needs and (3) a percentage of median / average income. The detailed rationales behind these approaches have been elaborated in Appendix 1. The Task Force agreed to conduct an objective assessment on these approaches based on five guiding principles. The assessment results are summarised in Table A.2, with details furnished in paragraphs A2.4 to A2.15 and Table A.4.
Table A.2: Assessment of the feasibility and practicability of various poverty line approaches based on five guiding principles
Approach Measure- ment
International comparability
Data support
Cost- effectiveness
Compilation & interpretation
1. Minimum subsistence 2. Basic needs
- average CSSA payment 3. A percentage of median
/ average income**
Note: (**) In theory, median / average expenditure may be used to define relative poverty. In practice, however, income is widely adopted as the basis for setting the poverty line. Therefore, this Report focuses on analysing the practicability and comparability of using income to draw a poverty line.
A2.3 After several rounds of discussions on various approaches and an integrated assessment based on the five guiding principles, the Task Force proposed to adopt Approach (3) as the basis of setting the poverty line. This makes reference to the prevailing mainstream practice adopted by EU and OECD, by setting the poverty line at a certain percentage of median household income. Subsequently, the proposal of the Task Force was endorsed by CoP.
(a) Measurement
A2.4 As all the approaches quantify poverty in monetary terms, it is possible to estimate the size of poor population if data support on household income / expenditure is sufficient. However, it should be noted that the approaches to
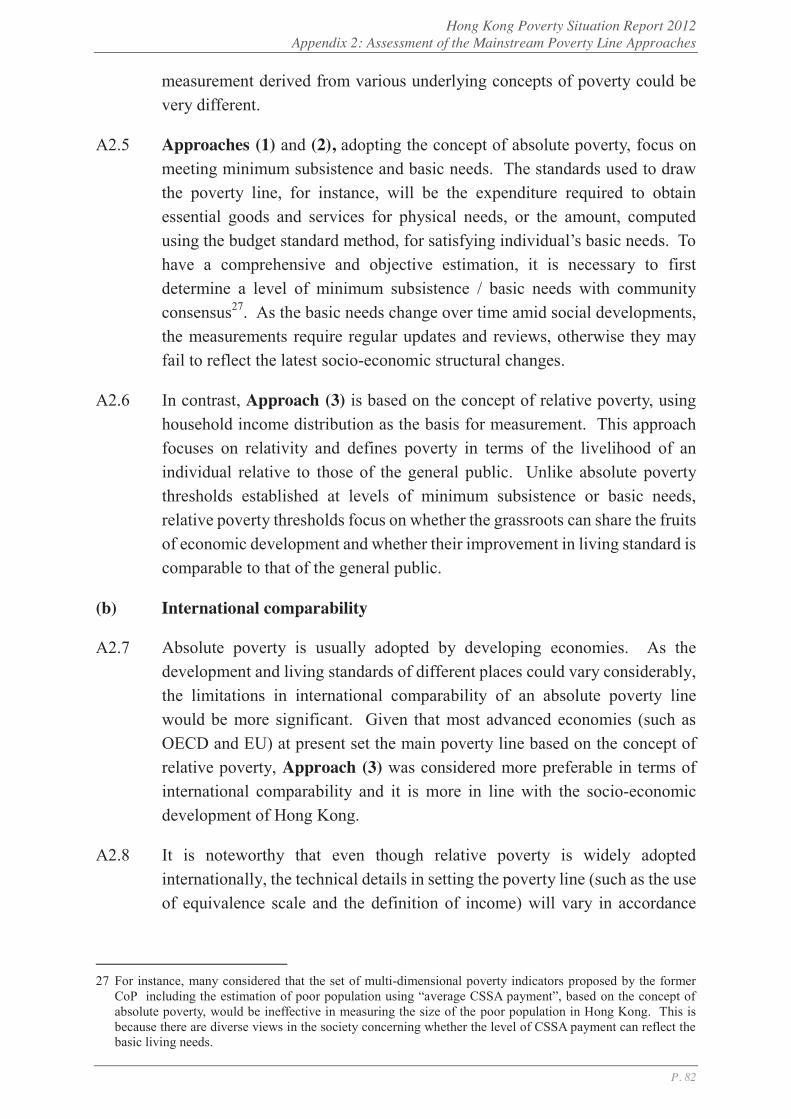
Hong Kong Poverty Situation Report 2012 Appendix 2: Assessment of the Mainstream Poverty Line Approaches
P. 82
measurement derived from various underlying concepts of poverty could be very different.
A2.5 Approaches (1) and (2), adopting the concept of absolute poverty, focus on meeting minimum subsistence and basic needs. The standards used to draw the poverty line, for instance, will be the expenditure required to obtain essential goods and services for physical needs, or the amount, computed using the budget standard method, for satisfying individual’s basic needs. To have a comprehensive and objective estimation, it is necessary to first determine a level of minimum subsistence / basic needs with community consensus27. As the basic needs change over time amid social developments, the measurements require regular updates and reviews, otherwise they may fail to reflect the latest socio-economic structural changes.
A2.6 In contrast, Approach (3) is based on the concept of relative poverty, using household income distribution as the basis for measurement. This approach focuses on relativity and defines poverty in terms of the livelihood of an individual relative to those of the general public. Unlike absolute poverty thresholds established at levels of minimum subsistence or basic needs, relative poverty thresholds focus on whether the grassroots can share the fruits of economic development and whether their improvement in living standard is comparable to that of the general public.
(b) International comparability
A2.7 Absolute poverty is usually adopted by developing economies. As the development and living standards of different places could vary considerably, the limitations in international comparability of an absolute poverty line would be more significant. Given that most advanced economies (such as OECD and EU) at present set the main poverty line based on the concept of relative poverty, Approach (3) was considered more preferable in terms of international comparability and it is more in line with the socio-economic development of Hong Kong.
A2.8 It is noteworthy that even though relative poverty is widely adopted internationally, the technical details in setting the poverty line (such as the use of equivalence scale and the definition of income) will vary in accordance
27 For instance, many considered that the set of multi-dimensional poverty indicators proposed by the former
CoP including the estimation of poor population using “average CSSA payment”, based on the concept of absolute poverty, would be ineffective in measuring the size of the poor population in Hong Kong. This is because there are diverse views in the society concerning whether the level of CSSA payment can reflect the basic living needs.
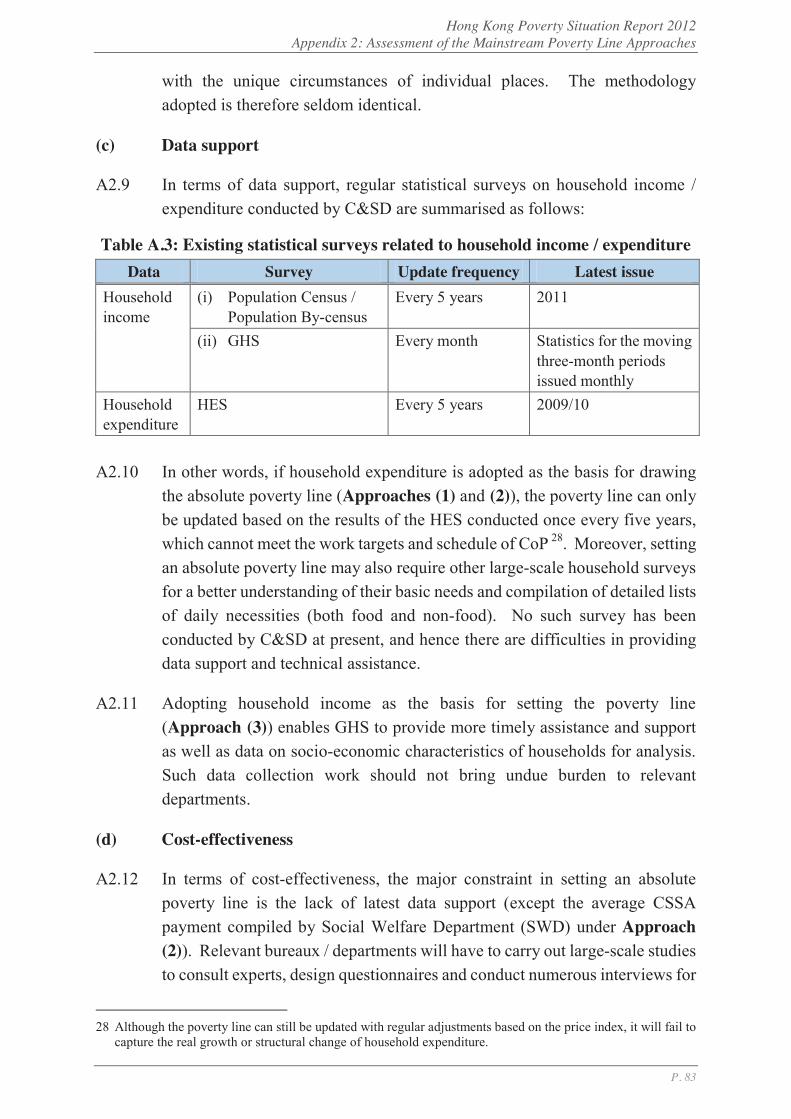
Hong Kong Poverty Situation Report 2012 Appendix 2: Assessment of the Mainstream Poverty Line Approaches
P. 83
with the unique circumstances of individual places. The methodology adopted is therefore seldom identical.
(c) Data support
A2.9 In terms of data support, regular statistical surveys on household income / expenditure conducted by C&SD are summarised as follows:
Table A.3: Existing statistical surveys related to household income / expenditure Data Survey Update frequency Latest issue
Household income
(i) Population Census / Population By-census
Every 5 years 2011
(ii) GHS Every month Statistics for the moving three-month periods issued monthly
Household expenditure
HES Every 5 years 2009/10
A2.10 In other words, if household expenditure is adopted as the basis for drawing
the absolute poverty line (Approaches (1) and (2)), the poverty line can only be updated based on the results of the HES conducted once every five years, which cannot meet the work targets and schedule of CoP 28. Moreover, setting an absolute poverty line may also require other large-scale household surveys for a better understanding of their basic needs and compilation of detailed lists of daily necessities (both food and non-food). No such survey has been conducted by C&SD at present, and hence there are difficulties in providing data support and technical assistance.
A2.11 Adopting household income as the basis for setting the poverty line (Approach (3)) enables GHS to provide more timely assistance and support as well as data on socio-economic characteristics of households for analysis. Such data collection work should not bring undue burden to relevant departments.
(d) Cost-effectiveness
A2.12 In terms of cost-effectiveness, the major constraint in setting an absolute poverty line is the lack of latest data support (except the average CSSA payment compiled by Social Welfare Department (SWD) under Approach (2)). Relevant bureaux / departments will have to carry out large-scale studies to consult experts, design questionnaires and conduct numerous interviews for
28 Although the poverty line can still be updated with regular adjustments based on the price index, it will fail to
capture the real growth or structural change of household expenditure.

Hong Kong Poverty Situation Report 2012 Appendix 2: Assessment of the Mainstream Poverty Line Approaches
P. 84
estimating the level of minimum subsistence. Such work requires substantial resources, both in manpower and time. CoP may not be able to meet the target of establishing a poverty line within 2013.
A2.13 Setting a relative poverty line (Approach (3)), on the other hand, would be comparatively more cost-effective as it basically does not require substantial and additional resources to carry out studies and surveys, and can be updated annually. Bureaux / departments will have more time to provide statistics on the numbers of beneficiaries of various poverty alleviation measures for assessing policy effectiveness.
(e) Compilation and interpretation
A2.14 All the three approaches mentioned above measure poverty in monetary terms and the corresponding statistics compiled should be simple and easy enough to understand under the guiding principle of “compilation and interpretation”. As compared with the 24 multi-dimensional poverty indicators previously compiled and regularly updated by the Government, defining poor population as a general indicator on the basis of a certain percentage of median household income (i.e. Approach (3)) should be easier for the public to understand the overall poverty situation in Hong Kong.
A2.15 It is also worth mentioning that local NGOs (such as Oxfam and HKCSS) have adopted a similar approach to estimate the poverty situation in Hong Kong for public information. The approach has been well recognised. The Task Force was of the view that a poverty line based on further enhancement of this approach would be less controversial.
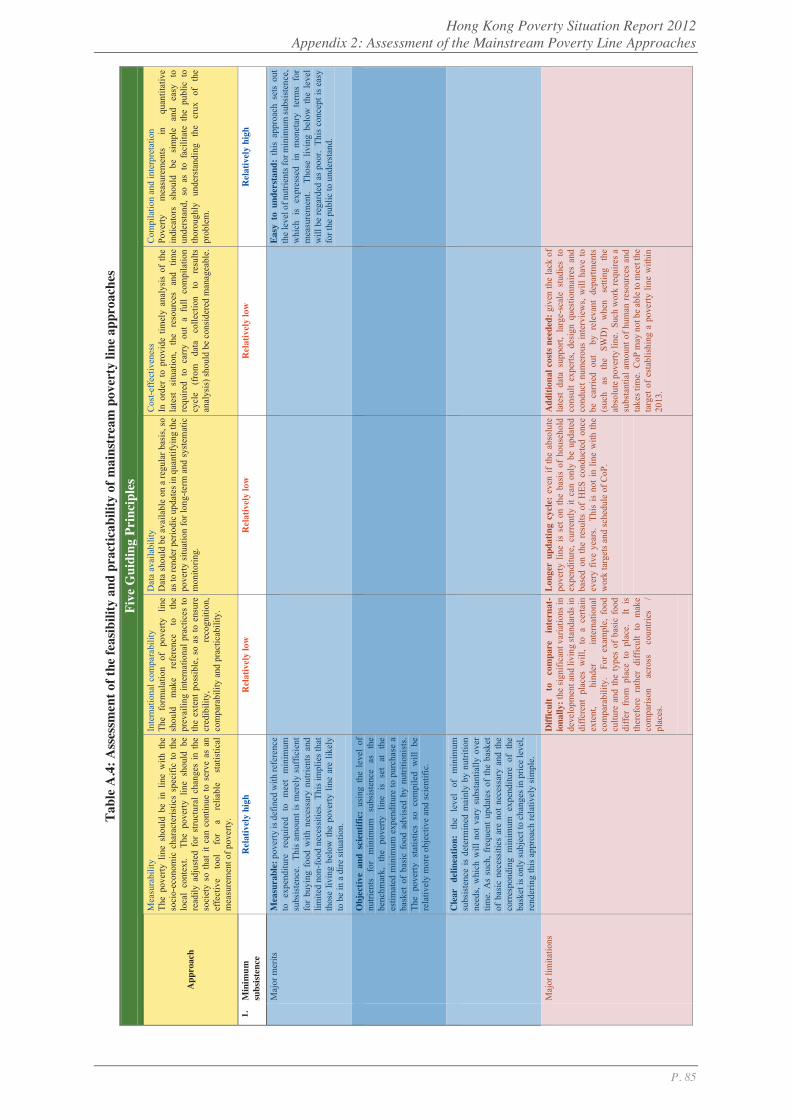
Hong Kong Poverty Situation Report 2012 Appendix 2: Assessment of the Mainstream Poverty Line Approaches
P. 85
Tab
le A
.4: A
sses
smen
t of t
he fe
asib
ility
and
pra
ctic
abili
ty o
f mai
nstr
eam
pov
erty
line
app
roac
hes
Five
Gui
ding
Pri
ncip
les
Com
pila
tion
and
inte
rpre
tatio
n Po
verty
m
easu
rem
ents
in
qu
antit
ativ
e in
dica
tors
sh
ould
be
si
mpl
e an
d ea
sy
to
unde
rsta
nd,
so a
s to
fac
ilita
te t
he p
ublic
to
thor
ough
ly
unde
rsta
ndin
g th
e cr
ux
of
the
prob
lem
.
Rel
ativ
ely
high
Eas
y to
und
erst
and:
thi
s ap
proa
ch s
ets
out
the
leve
l of n
utrie
nts f
or m
inim
um su
bsis
tenc
e,
whi
ch i
s ex
pres
sed
in m
onet
ary
term
s fo
r m
easu
rem
ent.
Tho
se l
ivin
g be
low
the
lev
el
will
be
rega
rded
as
poor
. Th
is c
once
pt is
eas
y fo
r the
pub
lic to
und
erst
and.
Cos
t-effe
ctiv
enes
s In
ord
er t
o pr
ovid
e tim
ely
anal
ysis
of
the
late
st
situ
atio
n,
the
reso
urce
s an
d tim
e re
quire
d to
car
ry o
ut a
ful
l co
mpi
latio
n cy
cle
(from
da
ta
colle
ctio
n to
re
sults
an
alys
is) s
houl
d be
con
side
red
man
agea
ble.
Rel
ativ
ely
low
Add
ition
al c
osts
nee
ded:
giv
en th
e la
ck o
f la
test
dat
a su
ppor
t, la
rge-
scal
e st
udie
s to
co
nsul
t ex
perts
, de
sign
que
stio
nnai
res
and
cond
uct n
umer
ous
inte
rvie
ws,
will
hav
e to
be
car
ried
out
by
rele
vant
dep
artm
ents
(s
uch
as
the
SWD
) w
hen
setti
ng
the
abso
lute
pov
erty
line
. Su
ch w
ork
requ
ires a
su
bsta
ntia
l am
ount
of h
uman
reso
urce
s an
d ta
kes t
ime.
CoP
may
not
be
able
to m
eet t
he
targ
et o
f es
tabl
ishi
ng a
pov
erty
line
with
in
2013
.
Dat
a av
aila
bilit
y D
ata
shou
ld b
e av
aila
ble
on a
regu
lar b
asis
, so
as to
rend
er p
erio
dic
upda
tes i
n qu
antif
ying
the
pove
rty s
ituat
ion
for l
ong-
term
and
sys
tem
atic
m
onito
ring.
Rel
ativ
ely
low
Lon
ger
upda
ting
cycl
e: e
ven
if th
e ab
solu
te
pove
rty l
ine
is s
et o
n th
e ba
sis
of h
ouse
hold
ex
pend
iture
, cur
rent
ly it
can
onl
y be
upd
ated
ba
sed
on t
he r
esul
ts of
HES
con
duct
ed o
nce
ever
y fiv
e ye
ars.
Thi
s is
not i
n lin
e w
ith th
e w
ork
targ
ets a
nd sc
hedu
le o
f CoP
.
Inte
rnat
iona
l com
para
bilit
y Th
e fo
rmul
atio
n of
po
verty
lin
e sh
ould
m
ake
refe
renc
e to
th
e pr
evai
ling
inte
rnat
iona
l pra
ctic
es to
th
e ex
tent
pos
sibl
e, s
o as
to e
nsur
e cr
edib
ility
, re
cogn
ition
, co
mpa
rabi
lity
and
prac
ticab
ility
.
Rel
ativ
ely
low
Diff
icul
t to
co
mpa
re
inte
rnat
- io
nally
: the
sign
ifica
nt v
aria
tions
in
deve
lopm
ent a
nd li
ving
stan
dard
s in
diffe
rent
pla
ces
will
, to
a c
erta
in
exte
nt,
hind
er
inte
rnat
iona
l co
mpa
rabi
lity.
Fo
r ex
ampl
e, f
ood
cultu
re a
nd th
e ty
pes
of b
asic
foo
d di
ffer
from
pla
ce t
o pl
ace.
It
is
ther
efor
e ra
ther
diff
icul
t to
mak
e co
mpa
rison
ac
ross
co
untri
es
/ pl
aces
.
Mea
sura
bilit
y Th
e po
verty
lin
e sh
ould
be
in l
ine
with
the
so
cio-
econ
omic
cha
ract
eris
tics
spec
ific
to th
e lo
cal
cont
ext.
The
pov
erty
lin
e sh
ould
be
read
ily a
djus
ted
for
stru
ctur
al c
hang
es i
n th
e so
ciet
y so
that
it c
an c
ontin
ue to
ser
ve a
s an
ef
fect
ive
tool
fo
r a
relia
ble
stat
istic
al
mea
sure
men
t of p
over
ty.
Rel
ativ
ely
high
Mea
sura
ble:
pov
erty
is d
efin
ed w
ith re
fere
nce
to e
xpen
ditu
re r
equi
red
to m
eet
min
imum
su
bsis
tenc
e. T
his
amou
nt is
mer
ely
suff
icie
nt
for
buyi
ng f
ood
with
nec
essa
ry n
utrie
nts
and
limite
d no
n-fo
od n
eces
sitie
s. T
his i
mpl
ies t
hat
thos
e liv
ing
belo
w th
e po
verty
line
are
like
ly
to b
e in
a d
ire si
tuat
ion.
Obj
ectiv
e an
d sc
ient
ific:
usi
ng t
he l
evel
of
nutri
ents
fo
r m
inim
um
subs
iste
nce
as
the
benc
hmar
k, t
he p
over
ty l
ine
is s
et a
t th
e es
timat
ed m
inim
um e
xpen
ditu
re to
pur
chas
e a
bask
et o
f ba
sic
food
adv
ised
by
nutri
tioni
sts.
Th
e po
verty
sta
tistic
s so
com
pile
d w
ill b
e re
lativ
ely
mor
e ob
ject
ive
and
scie
ntifi
c.
Cle
ar
delin
eatio
n:
the
leve
l of
m
inim
um
subs
iste
nce
is d
eter
min
ed m
ainl
y by
nut
ritio
n ne
eds,
whi
ch w
ill n
ot v
ary
subs
tant
ially
ove
r tim
e. A
s su
ch, f
requ
ent u
pdat
es o
f th
e ba
sket
of
bas
ic n
eces
sitie
s ar
e no
t nec
essa
ry a
nd th
e co
rresp
ondi
ng m
inim
um e
xpen
ditu
re o
f th
e ba
sket
is o
nly
subj
ect t
o ch
ange
s in
pric
e le
vel,
rend
erin
g th
is a
ppro
ach
rela
tivel
y si
mpl
e.
App
roac
h
Min
imum
su
bsis
tenc
e
Maj
or m
erits
Maj
or li
mita
tions
1.
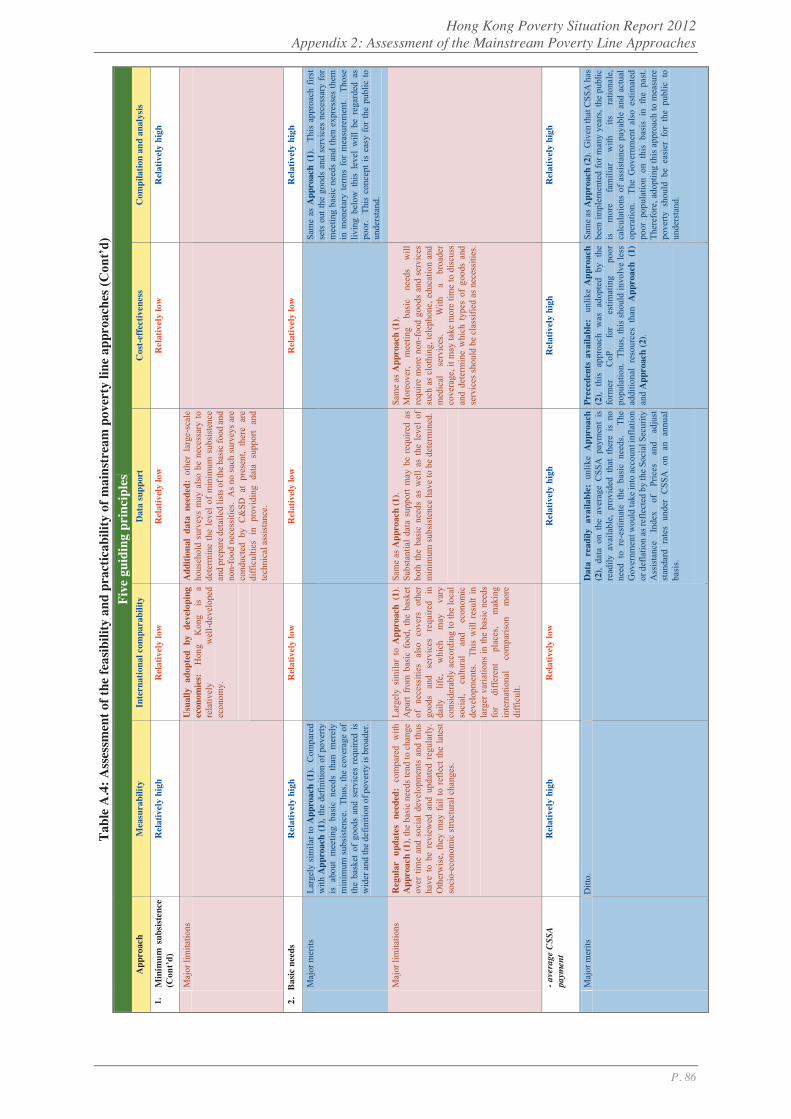
Hong Kong Poverty Situation Report 2012 Appendix 2: Assessment of the Mainstream Poverty Line Approaches
P. 86
Tab
le A
.4: A
sses
smen
t of t
he fe
asib
ility
and
pra
ctic
abili
ty o
f mai
nstr
eam
pov
erty
line
app
roac
hes (
Con
t’d)
Fi
ve g
uidi
ng p
rinc
iple
s C
ompi
latio
n an
d an
alys
is
Rel
ativ
ely
high
Rel
ativ
ely
high
Sam
e as
App
roac
h (1
). T
his
appr
oach
firs
t se
ts o
ut th
e go
ods
and
serv
ices
nec
essa
ry fo
r m
eetin
g ba
sic
need
s an
d th
en e
xpre
sses
them
in
mon
etar
y te
rms
for
mea
sure
men
t. T
hose
liv
ing
belo
w t
his
leve
l w
ill b
e re
gard
ed a
s po
or.
This
con
cept
is e
asy
for
the
publ
ic to
un
ders
tand
.
Rel
ativ
ely
high
Sam
e as
App
roac
h (2
). G
iven
that
CSS
A h
as
been
impl
emen
ted
for m
any
year
s, th
e pu
blic
is
m
ore
fam
iliar
w
ith
its
ratio
nale
, ca
lcul
atio
ns o
f as
sist
ance
pay
able
and
act
ual
oper
atio
n.
The
Gov
ernm
ent
also
est
imat
ed
poor
pop
ulat
ion
on t
his
basi
s in
the
pas
t.
Ther
efor
e, a
dopt
ing
this
app
roac
h to
mea
sure
po
verty
sho
uld
be e
asie
r fo
r th
e pu
blic
to
unde
rsta
nd.
Cos
t-eff
ectiv
enes
s
Rel
ativ
ely
low
Rel
ativ
ely
low
Sam
e as
App
roac
h (1
). M
oreo
ver,
mee
ting
basi
c ne
eds
will
re
quire
mor
e no
n-fo
od g
oods
and
ser
vice
s su
ch a
s cl
othi
ng, t
elep
hone
, edu
catio
n an
d m
edic
al
serv
ices
.
With
a
broa
der
cove
rage
, it m
ay ta
ke m
ore
time
to d
iscu
ss
and
dete
rmin
e w
hich
typ
es o
f go
ods
and
serv
ices
shou
ld b
e cl
assi
fied
as n
eces
sitie
s.
Rel
ativ
ely
high
Prec
eden
ts a
vaila
ble:
un
like
App
roac
h (2
), th
is a
ppro
ach
was
ado
pted
by
the
form
er
CoP
fo
r es
timat
ing
poor
po
pula
tion.
Thu
s, th
is s
houl
d in
volv
e le
ss
addi
tiona
l re
sour
ces
than
App
roac
h (1
) an
d A
ppro
ach
(2).
Dat
a su
ppor
t
Rel
ativ
ely
low
Add
ition
al d
ata
need
ed:
othe
r la
rge-
scal
e ho
useh
old
surv
eys
may
als
o be
nec
essa
ry to
de
term
ine
the
leve
l of
min
imum
sub
sist
ence
an
d pr
epar
e det
aile
d lis
ts o
f the
bas
ic fo
od a
nd
non-
food
nec
essi
ties.
As n
o su
ch su
rvey
s ar
e co
nduc
ted
by C
&SD
at
pres
ent,
ther
e ar
e di
fficu
lties
in
prov
idin
g da
ta s
uppo
rt an
d te
chni
cal a
ssis
tanc
e.
Rel
ativ
ely
low
Sam
e as
App
roac
h (1
). Su
bsta
ntia
l da
ta s
uppo
rt m
ay b
e re
quire
d as
bo
th t
he b
asic
nee
ds a
s w
ell
as t
he l
evel
of
min
imum
subs
iste
nce
have
to b
e de
term
ined
.
Rel
ativ
ely
high
Dat
a re
adily
ava
ilabl
e: u
nlik
e A
ppro
ach
(2),
data
on
the
aver
age
CSS
A p
aym
ent
is re
adily
ava
ilabl
e, p
rovi
ded
that
the
re i
s no
ne
ed t
o re
-est
imat
e th
e ba
sic
need
s. T
he
Gov
ernm
ent w
ould
take
into
acco
unt i
nfla
tion
or d
efla
tion
as re
flect
ed b
y th
e So
cial
Sec
urity
A
ssis
tanc
e In
dex
of
Pric
es
and
adju
st
stan
dard
rat
es u
nder
CSS
A o
n an
ann
ual
basi
s.
Inte
rnat
iona
l com
para
bilit
y
Rel
ativ
ely
low
Usu
ally
ado
pted
by
deve
lopi
ng
econ
omie
s:
Hon
g K
ong
is
a re
lativ
ely
wel
l-dev
elop
ed
econ
omy.
Rel
ativ
ely
low
Larg
ely
sim
ilar
to A
ppro
ach
(1).
A
part
from
bas
ic f
ood,
the
bas
ket
of
nece
ssiti
es
also
co
vers
ot
her
good
s an
d se
rvic
es
requ
ired
in
daily
lif
e,
whi
ch
may
va
ry
cons
ider
ably
acc
ordi
ng to
the
loca
l so
cial
, cu
ltura
l an
d ec
onom
ic
deve
lopm
ents
. Th
is w
ill r
esul
t in
la
rger
var
iatio
ns in
the
basi
c ne
eds
for
diff
eren
t pl
aces
, m
akin
g in
tern
atio
nal
com
paris
on
mor
e di
fficu
lt. R
elat
ivel
y lo
w
Mea
sura
bilit
y
Rel
ativ
ely
high
Rel
ativ
ely
high
Larg
ely
sim
ilar t
o A
ppro
ach
(1).
Com
pare
d w
ith A
ppro
ach
(1),
the
defin
ition
of p
over
ty
is a
bout
mee
ting
basi
c ne
eds
than
mer
ely
min
imum
sub
sist
ence
. Th
us, t
he c
over
age
of
the
bask
et o
f go
ods
and
serv
ices
req
uire
d is
wid
er a
nd th
e de
finiti
on o
f pov
erty
is b
road
er.
Reg
ular
upd
ates
nee
ded:
com
pare
d w
ith
App
roac
h (1
), th
e ba
sic
need
s ten
d to
cha
nge
over
tim
e an
d so
cial
dev
elop
men
ts a
nd th
us
have
to
be r
evie
wed
and
upd
ated
reg
ular
ly.
Oth
erw
ise,
they
may
fai
l to
refle
ct th
e la
test
so
cio-
econ
omic
stru
ctur
al c
hang
es.
Rel
ativ
ely
high
Ditt
o.
App
roac
h
Min
imum
sub
sist
ence
(C
ont’d
)
Maj
or li
mita
tions
2.
Bas
ic n
eeds
Maj
or m
erits
Maj
or li
mita
tions
- ave
rage
CSS
A pa
ymen
t
Maj
or m
erits
1.

Hong Kong Poverty Situation Report 2012 Appendix 2: Assessment of the Mainstream Poverty Line Approaches
P. 87
Tab
le A
.4: A
sses
smen
t of t
he fe
asib
ility
and
pra
ctic
abili
ty o
f mai
nstr
eam
pov
erty
line
app
roac
hes (
Con
t’d)
C
ompi
latio
n an
d an
alys
is
Rel
ativ
ely
Hig
h
Rel
ativ
ely
Hig
h
Eas
y to
und
erst
and:
The
set
ting
of th
e po
verty
lin
e at
a c
erta
in p
erce
ntag
e of
m
edia
n ho
useh
old
inco
me
shou
ld
be
sim
ple
and
easy
eno
ugh
for t
he p
ublic
to
unde
rsta
nd.
The
rela
tive
pove
rty li
ne is
no
t a f
ixed
abs
olut
e liv
ing
stan
dard
, i.e
. th
e le
vel
of m
inim
um s
ubsi
sten
ce,
but
will
adj
ust i
n ac
cord
ance
with
the
leve
l of
econ
omic
dev
elop
men
t.
A
com
mon
ly-u
sed
basi
s in
th
e co
mm
unity
: Som
e N
GO
s in
Hon
g K
ong
(suc
h as
Oxf
am a
nd H
KC
SS) h
ave
been
us
ing
a si
mila
r ap
proa
ch f
or p
over
ty
estim
ates
for
pub
lic in
form
atio
n an
d th
e ap
proa
ch h
as b
een
wel
l rec
ogni
sed.
Five
gui
ding
pri
ncip
les
Cos
t-eff
ectiv
enes
s
Rel
ativ
ely
high
Rel
ativ
ely
high
Subs
tant
ial
addi
tiona
l re
sour
ces
is n
ot
neec
essa
ry:
This
ap
proa
ch
is
mor
e co
st-e
ffect
ive
beca
use
it ba
sica
lly d
oes n
ot
requ
ire s
ubst
antia
l add
ition
al r
esou
rces
to
carry
out
stu
dies
and
sur
veys
, and
can
be
upda
ted
annu
ally
. B
urea
ux /
depa
rtmen
ts
conc
erne
d w
ill h
ave
mor
e tim
e to
com
pile
da
ta o
n th
e nu
mbe
rs o
f be
nefic
iarie
s of
va
rious
pov
erty
alle
viat
ion
mea
sure
s fo
r as
sess
ing
polic
y ef
fect
iven
ess.
Dat
a su
ppor
t
Rel
ativ
ely
high
Rel
ativ
ely
high
Com
patib
le w
ith e
xist
ing
data
: A
t pr
esen
t,
C&
SD
cond
ucts
tw
o su
rvey
s on
ho
useh
old
inco
me,
nam
ely
the
mon
thly
GH
S an
d th
e Po
pula
tion
Cen
sus
/ B
y-ce
nsus
eve
ry 5
yea
rs
(Lat
est d
ata
avai
labl
e: 2
011
Popu
latio
n C
ensu
s).
Ado
ptin
g ho
useh
old
inco
me
as t
he b
asis
for
setti
ng th
e po
verty
line
ena
bles
GH
S to
pro
vide
m
ore
timel
y an
d ap
prop
riate
sup
port
as w
ell a
s da
ta o
n ot
her
soci
o-ec
onom
ic c
hara
cter
istic
s of
ho
useh
olds
for
ana
lysi
s. T
he d
ata
colle
ctio
n w
ork
shou
ld n
ot b
ring
undu
e bu
rden
to re
leva
nt
depa
rtmen
ts. G
HS
cond
ucte
d by
C&
SD c
olle
cts
data
on
basi
c in
com
e an
d ot
her s
ocio
-eco
nom
ic
char
acte
ristic
s of
hou
seho
lds
on a
regu
lar b
asis.
It
can
ther
efor
e pr
ovid
e in
put f
or th
e se
tting
of
the
pove
rty li
ne a
nd th
e es
timat
ion
of d
iffer
ent
type
s of h
ouse
hold
inco
me.
Inte
rnat
iona
l com
para
bilit
y
Rel
ativ
ely
low
Ditt
o.
Rel
ativ
ely
high
Wid
ely
acce
pted
inte
rnat
iona
lly:
Mos
t ad
vanc
ed
econ
omie
s (e
.g.
OEC
D
and
EU)
are
usin
g A
ppro
ach
(3),
whi
ch i
s ba
sed
on
the
conc
ept
of r
elat
ive
pove
rty i
n se
tting
th
e m
ain
pove
rty
line.
A
ppro
ach
(3)
is t
here
fore
mor
e in
tern
atio
nally
co
mpa
rabl
e an
d m
ore
in li
ne w
ith th
e de
velo
pmen
t of
Hon
g K
ong.
Mea
sura
bilit
y
Rel
ativ
ely
high
Ther
e ar
e di
vers
e vi
ews
in th
e so
ciet
y co
ncer
ning
whe
ther
the
leve
l of C
SSA
pa
ymen
t can
refle
ct th
e ba
sic
need
s.
Rel
ativ
ely
high
Mea
sura
ble:
Mea
surin
g po
verty
usi
ng
a pe
rcen
tage
of
m
edia
n or
av
erag
e in
com
e is
bas
ed o
n th
e co
ncep
t of
re
lativ
e po
verty
.
Unl
ike
abso
lute
po
verty
, w
hich
mer
ely
defin
es a
lev
el
of
min
imum
su
bsis
tenc
e,
rela
tive
pove
rty
asse
sses
w
heth
er
the
low
er
segm
ents
of s
ocie
ty c
an e
njoy
the
sam
e liv
ing
stan
dard
s as t
he g
ener
al p
ublic
.
The
poo
r po
pula
tion
alw
ays
exis
ts:
Und
er th
e co
ncep
t of
rela
tive
pove
rty,
the
setti
ng o
f th
e po
verty
lin
e on
the
ba
sis
of
med
ian
hous
ehol
d in
com
e in
dica
tes
that
poo
r po
pula
tion
wou
ld
alw
ays
exis
t un
der
gene
ral c
ondi
tions
. Ev
en i
f th
ere
is a
n ac
ross
-the-
boar
d in
com
e gr
owth
bro
ught
by
a ro
bust
ec
onom
ic
grow
th,
a le
sser
in
com
e gr
owth
at th
e gra
ssro
ots l
evel
rela
tive t
o th
e ov
eral
l le
vel
may
stil
l le
ad t
o an
in
crea
se i
n po
or p
opul
atio
n an
d th
e po
verty
rate
.
App
roac
h
2.
B
asic
nee
ds
– ave
rage
CSS
A pa
ymen
t (C
ont’d
) M
ajor
lim
itatio
ns
3.
A
t a p
erce
ntag
e of
m
edia
n / a
vera
ge
inco
me
Maj
or m
erits
Maj
or li
mita
tions
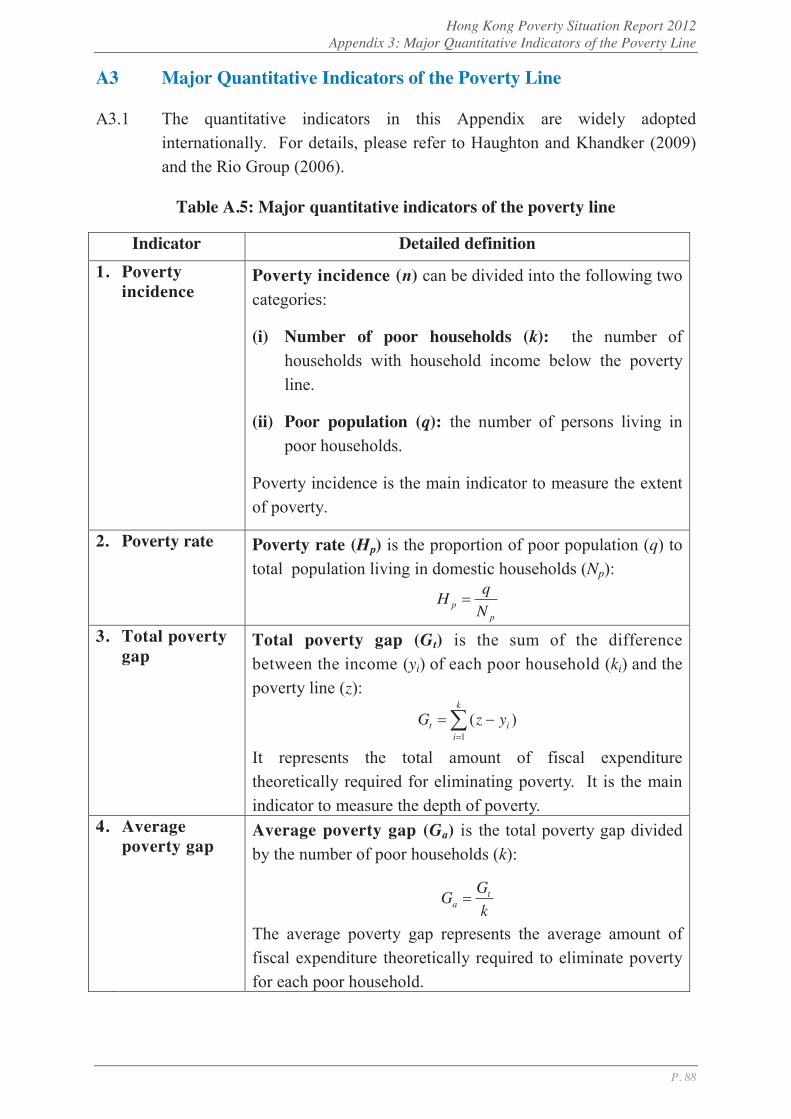
Hong Kong Poverty Situation Report 2012 Appendix 3: Major Quantitative Indicators of the Poverty Line
P. 88
A3 Major Quantitative Indicators of the Poverty Line
A3.1 The quantitative indicators in this Appendix are widely adopted internationally. For details, please refer to Haughton and Khandker (2009) and the Rio Group (2006).
Table A.5: Major quantitative indicators of the poverty line
Indicator Detailed definition 1. Poverty
incidence Poverty incidence (n) can be divided into the following two categories:
(i) Number of poor households (k): the number of households with household income below the poverty line.
(ii) Poor population (q): the number of persons living in poor households.
Poverty incidence is the main indicator to measure the extent of poverty.
2. Poverty rate Poverty rate (Hp) is the proportion of poor population (q) to total population living in domestic households (Np):
pp N
qH
3. Total poverty gap
Total poverty gap (Gt) is the sum of the difference between the income (yi) of each poor household (ki) and the poverty line (z):
k
iit yzG
1)(
It represents the total amount of fiscal expenditure theoretically required for eliminating poverty. It is the main indicator to measure the depth of poverty.
4. Average poverty gap
Average poverty gap (Ga) is the total poverty gap divided by the number of poor households (k):
kGG t
a
The average poverty gap represents the average amount of fiscal expenditure theoretically required to eliminate poverty for each poor household.

Hong Kong Poverty Situation Report 2012 Appendix 4: Policy Intervention - Coverage, Estimation and Limitations
P. 89
A4 Policy Intervention - Coverage, Estimation and Limitations
A4.1 As mentioned in Section 2.I(b) of Chapter 2, household income is employed as the basic measurement unit of the poverty line. Box 2.1 also points out that pre-intervention household income is used to draw the poverty line. Such income, currently available from GHS of C&SD, only includes household members’ own employment and investment income, and other cash income not from welfare transfer (i.e. basic income).
A4.2 Given one of the major functions of the poverty line is to assess the effectiveness of poverty alleviation measures, it is necessary to further estimate the changes in household income before and after policy intervention. The ensuing paragraphs generally describe the coverage of these policy intervention items (Table A.6) and their corresponding estimation methodologies.
A4.I Policy Items Included in the Estimation of Main Poverty Statistics
(a) Taxation
A4.3 Taxation includes (i) salaries tax, (ii) property tax; and (iii) rates and Government rent paid by households.
A4.4 The amount of salaries tax is estimated mainly based on the information provided by respondents of GHS on their household members’ employment earnings and household composition. The amount of property tax is imputed based on reported rental income. The imputation of rates and Government rent are based primarily on the relevant data by type of housing (PRH: the administrative records provided by the Housing Authority and Housing Society; private housing: the 2011 Population Census results).
(b) Recurrent cash benefits
A4.5 Recurrent cash benefits can primarily be categorised into the following types:
Social security payments: including CSSA, OAA, OALA29 and DA. As some GHS respondents are not willing to reveal their social security status of receiving CSSA, C&SD has carried out a reconciliation exercise between the GHS database and SWD’s administrative records in order to obtain a more precise estimation of CSSA payments received by households; and
Other recurrent cash benefits: refer to other Government
29 OALA was implemented on 1 December, 2012.

Hong Kong Poverty Situation Report 2012 Appendix 4: Policy Intervention - Coverage, Estimation and Limitations
P. 90
measures that provide cash assistance to eligible households / persons, such as: Financial Assistance Scheme for Post-secondary Students, WITS Scheme, etc. Since existing surveys for the provision of relevant data of these measures are not available, it is necessary for the corresponding bureaux / departments to provide relevant information from administrative records, including the number of benefited persons / households and their socio-economic characteristics (such as household income, age profiles of residents, etc.) for C&SD’s data imputation. The amount of benefits will be imputed to the income of households / persons estimated to be the beneficiaries.
A4.II Policy Items Regarded as Supplementary Information
(a) Non-recurrent cash benefits (including one-off measures)
A4.6 The Government has provided quite a number of non-recurrent cash benefits (including one-off measures) to the public in recent years. Although CoP considered that the core analytical framework should only cover recurrent cash benefits, the impact of non-recurrent measures on poverty should still be provided as supplementary information. The estimation methodology of the benefits is similar to that of recurrent cash benefits. Box 4.1 of the Report provides an overview of the poverty statistics after factoring in non-recurrent cash benefits for reference.
(b) Means-tested in-kind benefits
A4.7 Whilst CoP considered that the core analytical framework should focus on the impact of recurrent cash policies, it also agreed that means-tested in-kind benefits are also important poverty alleviation measures and thus their effectiveness should also be evaluated as a reference for policy analysis. Box 4.2 and Box 5.1 provide the analysis of poverty statistics after taking these means-tested in-kind benefits into account.
A4.8 Besides the estimation of means-tested in-kind benefits arising from PRH provision, the amount of other means-tested in-kind benefits are also imputed by C&SD based on the socio-economic characteristics of beneficiaries (persons / households) extracted from the administrative records of the respective bureaux and departments. The amount of benefits will then be imputed to the income of the eligible individuals / households.
A4.9 The estimation methodology of PRH benefit is controversial. It also contributes substantially to the sum of all in-kind benefits to be estimated. Please refer to Appendix 5 for details.

Hong Kong Poverty Situation Report 2012 Appendix 4: Policy Intervention - Coverage, Estimation and Limitations
P. 91
Table A.6: Detailed coverage of policy measures recommended by CoP**
Pre-intervention
Taxation (salaries tax and property tax, as well as rates and Government rent)
Cash benefits
Recurrent cash benefits Non-recurrent cash benefits (including one-off measures)
Social security schemes CSSA, OAA, OALA and DA
Other cash benefits School Textbook Assistance Scheme Student Travel Subsidy Scheme Tuition Fee Reimbursement for Project Yi Jin
Students Financial Assistance Scheme for Post-
secondary Students Tertiary Student Finance Scheme - Publicly-
funded Programmes Transport Support Scheme WITS Scheme Grant for Emergency Alarm System Examination Fee Remission Scheme Subsidy Scheme for Internet Access Charges Child Development Fund Targeted Savings
Scheme - Special Financial Incentive
Tax rebate for salaries tax and tax under
personal assessment Rates waiver Rent payments for public housing tenants Additional provision of CSSA, OAA and DA
payments Providing $1,000 allowance to students
receiving CSSA or student financial assistance Electricity charges subsidy “Scheme $6,000” Allowance for New Arrivals from low income
families~ Subsidy for CSSA Recipients Living in
Rented Private Housing (and paying a rent exceeding the maximum rent allowance under CSSA)~
Subsidy for Elderly Tenants in Private Housing~
Subsidy for Low-income Persons who are inadequately housed~
Special Care Subsidy for the Severely Disabled (aged below 60 without receiving CSSA who need constant care and live in the community)~
↓ ↓ Post-intervention (recurrent cash)
Post-intervention (recurrent + non-recurrent cash)
Means-tested in-kind benefits
In-kind benefits PRH provision Kindergarten and Child Care Centre Fee
Remission Scheme School-based After-school Learning and
Support Programmes Medical Fee Waiver Home Environment Improvement Scheme for
the Elderly Building Maintenance Grant Scheme for
Elderly Owners
After-school Learning Support Partnership Pilot Scheme
Subsidy for Elders who are on the Waiting List of Integrated Home Care Services (Ordinary Cases) for Household Cleaning and Escorting Services for Medical Consultations~
School-based Fund (Cross Boundary Learning Activities)~
School Lunch Subsidy~
↓ Post-intervention (recurrent cash + in-kind)
Notes: Included in the estimation of main poverty figures. Estimated as supplementary information. (**) Including policy items estimated for 2009-2012. (~) Schemes under CCF.
Hong Kong Poverty Situation Report 2012 Appendix 4: Policy Intervention - Coverage, Estimation and Limitations
P. 92
A4.III Measures Not Included
A4.10 For universal in-kind benefits without means tests, such as public medical services and education, CoP’s decision was that these measures should not be included in the framework as they are neither targeted nor means-tested and all citizens in the general public are able to enjoy.
A4.IV Limitations
A4.11 CoP understood that estimations of these benefits are subject to the following major limitations:
(i) Estimation subject to statistical errors: data inconsistencies exist in terms of classifications and definitions between the data collected from GHS and administrative records. Also, detailed information regarding some benefit items to be estimated (e.g. the socio-economic characteristics of recipients) is unavailable. All these could give rise to statistical errors;
(ii) Estimation results involve randomness: due to data limitations of GHS (e.g. data on household assets are unavailable), it is not possible to identify exactly the eligible individuals / households from the survey even if detailed profiles are available from administrative records. Only individuals / households with characteristics closest to the eligibility criteria will be randomly selected from the database for imputation. In other words, the resulting estimated poverty figures are only one of the many possible random allocation outcomes;
(iii) Time series data before 2009 are unavailable: due to data limitations, statistics on taxation and benefit transfers before 2009 are not available; and
(iv) Figures different from those regularly released by the Government: all the estimations in this Report are tailor-made for the setting of poverty line and its analytical framework, altering the original household income distributions. Hence, the related statistical figures would naturally deviate, to a certain degree, from those in the “Quarterly Report on General Household Survey” regularly released by C&SD. The two sets of data should not be compared due to their differences in estimation methodologies.
A4.12 Due to the above limitations, the poverty figures should be studied with care to avoid any misinterpretations of the statistics.

Hong Kong Poverty Situation Report 2012 Appendix 5: In-kind Transfer from Provision of Pubic Rental Housing - Estimation and Limitations
P. 93
A5 In-kind Transfer from Provision of Public Rental Housing - Estimation and Limitations
A5.1 As illustrated in Box 4.2, apart from recurrent cash benefits, the Government has also provided various means-tested in-kind benefits, with PRH provision being the most important one. In fact, the share of PRH in total number of quarters in Hong Kong is higher than that in some developed economies30. PRH could undoubtedly alleviate the burden of the grassroots and its effectiveness in alleviating poverty is undisputable. Thus, CoP agreed that its policy effectiveness should also be assessed as supplementary information.
A5.I Estimation Methodology
A5.2 As households in PRH do not obtain actual cash transfers, C&SD adopts the marginal analysis approach to estimate the amount of housing benefits. The concept is that if a PRH unit was leased in a hypothetical open market, the difference between the amount of the market rent and the actual rent paid by the household would be the opportunity cost of PRH provision to the Government and the housing benefit enjoyed by the household.
A5.3 This estimation methodology stems from the concept of opportunity cost, in line with the mainstream international practice (such as OECD and EU). In fact, this methodology of estimating PRH benefits has been adopted before as early as in 2007, when C&SD consulted various sectors (including academia) regarding the estimation methodology for the value of different kinds of social transfers (mainly for the compilation of the Gini Coefficient). The approach has gained wide acceptance during consultation at that time.
A5.4 The estimation methodology of in-kind benefits arising from PRH provision is illustrated below (Figure A.1):
(i) First, the whole territory is divided into some 4 000 street blocks. The two-year average of market rent31 of all PRH units in a street block is then estimated using information provided by R&VD while the two-year average of the actual rent paid by all PRH units in that street block is computed based on information from the Housing Department. The ratio between the two is the estimated average policy intervention ratio for all PRH units in that particular street
30 The share of public housing in the overall number of quarters in Hong Kong is 29%, much higher than that
of other developed economies, including Denmark (19.0%), the UK (18.0%), France (17.0%), Germany (4.6%) and Spain (2.0%).
31 All rents are net of rates, Government rents and management fees.

Hong Kong Poverty Situation Report 2012 Appendix 5: In-kind Transfer from Provision of Pubic Rental Housing - Estimation and Limitations
P. 94
block.
(ii) The market rent of a PRH unit is imputed by multiplying the actual rent paid by the household collected from GHS by the corresponding average policy intervention ratio for that street block. The difference between the imputed market rent and actual rent paid by a particular household is the estimated housing benefit received by that household.
Figure A.1: Methodology of estimating the in-kind transfer of PRH provision
Sources: (1) Housing Department; (2) Rating and Valuation Department; and (3) Census and Statistics Department.
A5.II Limitations
A5.5 CoP acknowledged that the estimation of housing benefits has the following major limitations:
(i) The benefits are not real cash assistance: to some extent, a rise in private rent would increase the estimated housing benefits imputed to PRH households, possibly lifting more households out of poverty. However, the disposable income in their "pockets" does not actually increase.
(ii) Estimated market rent of a PRH unit is not based on actual market transactions: the estimation assumes a PRH unit could be leased in an open market, but such assumption is not achievable.
(iii) Using the two-year average market rent: concerning the estimation
Following international practice, using the opportunity cost approach to estimate the housing benefits of a PRH household
Estimate the: (a) average actual rent(1)
(b) average market rent(2)
of all PRH units in the same street block
The ratio of the two (i.e. (b)/(a)), will be the estimated policy intervention ratio
PRH household’s actual rent paid(3)
= Estimated housing benefits of a household in PRH
Step 1:
Step 2: × (Estimated ratio – 1)

Hong Kong Poverty Situation Report 2012 Appendix 5: In-kind Transfer from Provision of Pubic Rental Housing - Estimation and Limitations
P. 95
of the market rent of a PRH unit, CoP examined whether the rent of a particular year, the average rent of the past two years or of several preceding years32 should be used. Ultimately, CoP decided to adopt taking a two-year average since most private rental flats are of a two-year lease at present. Whilst the choice inherits arbitrariness, the advantage is that the imputed housing benefits could broadly reflect private rental changes and somewhat reduce short-term fluctuations.
32 Using the market rent of a particular year would allow the PRH benefits to better reflect the current
situation but would be subject to larger fluctuations over time especially when the private rental market is volatile. On the other hand, taking the average of the market rents of the past several years can smoothen the series, thereby producing a more stable estimate of the in-kind benefit arisen from PRH provision. However, it would then fail to reflect the latest situation.
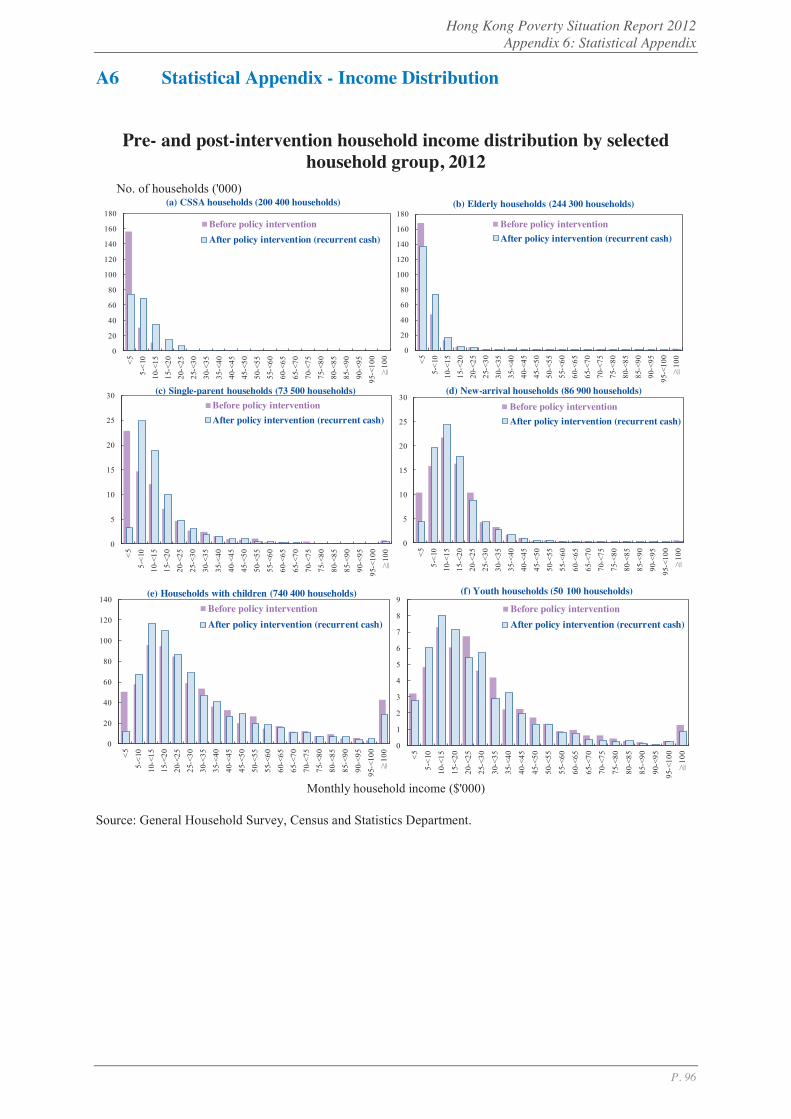
Hong Kong Poverty Situation Report 2012 Appendix 6: Statistical Appendix
P. 96
A6 Statistical Appendix - Income Distribution
Pre- and post-intervention household income distribution by selected
household group, 2012
0
5
10
15
20
25
30
<55-
<10
10-<
1515
-<20
20-<
2525
-<30
30-<
3535
-<40
40-<
4545
-<50
50-<
5555
-<60
60-<
6565
-<70
70-<
7575
-<80
80-<
8585
-<90
90-<
9595
-<10
010
0
Before policy interventionAfter policy intervention (recurrent cash)
(d) New-arrival households (86 900 households)
0
5
10
15
20
25
30
<55-
<10
10-<
1515
-<20
20-<
2525
-<30
30-<
3535
-<40
40-<
4545
-<50
50-<
5555
-<60
60-<
6565
-<70
70-<
7575
-<80
80-<
8585
-<90
90-<
9595
-<10
010
0
Before policy interventionAfter policy intervention (recurrent cash)
(c) Single-parent households (73 500 households)
0
20
40
60
80
100
120
140
160
180
<55-
<10
10-<
1515
-<20
20-<
2525
-<30
30-<
3535
-<40
40-<
4545
-<50
50-<
5555
-<60
60-<
6565
-<70
70-<
7575
-<80
80-<
8585
-<90
90-<
9595
-<10
010
0
Before policy interventionAfter policy intervention (recurrent cash)
(a) CSSA households (200 400 households)
0
20
40
60
80
100
120
140
160
180
<55-
<10
10-<
1515
-<20
20-<
2525
-<30
30-<
3535
-<40
40-<
4545
-<50
50-<
5555
-<60
60-<
6565
-<70
70-<
7575
-<80
80-<
8585
-<90
90-<
9595
-<10
010
0
Before policy interventionAfter policy intervention (recurrent cash)
(b) Elderly households (244 300 households)
0
1
2
3
4
5
6
7
8
9
<5
5-<1
0
10-<
15
15-<
20
20-<
25
25-<
30
30-<
35
35-<
40
40-<
45
45-<
50
50-<
55
55-<
60
60-<
65
65-<
70
70-<
75
75-<
80
80-<
85
85-<
90
90-<
95
95-<
100
100
Before policy interventionAfter policy intervention (recurrent cash)
(f) Youth households (50 100 households)
0
20
40
60
80
100
120
140
<55-
<10
10-<
1515
-<20
20-<
2525
-<30
30-<
3535
-<40
40-<
4545
-<50
50-<
5555
-<60
60-<
6565
-<70
70-<
7575
-<80
80-<
8585
-<90
90-<
9595
-<10
010
0
Before policy interventionAfter policy intervention (recurrent cash)
(e) Households with children (740 400 households)
Monthly household income ($'000)
Source: General Household Survey, Census and Statistics Department.
No. of households ('000)
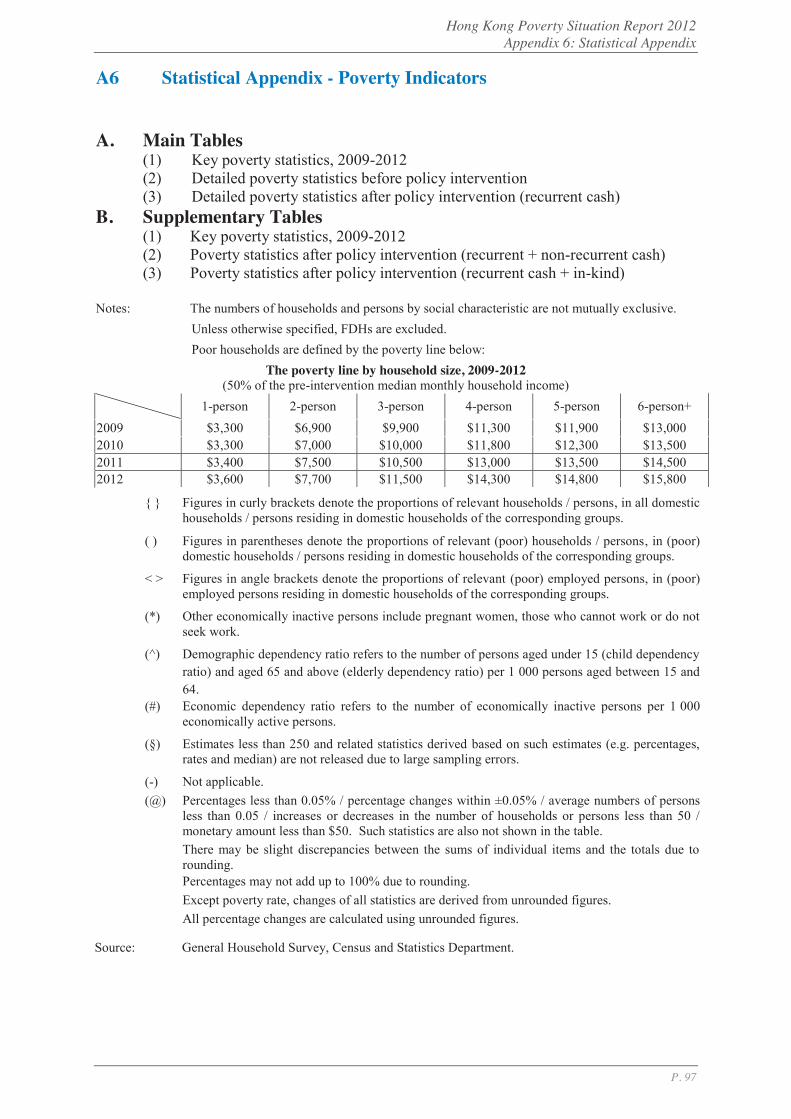
Hong Kong Poverty Situation Report 2012 Appendix 6: Statistical Appendix
P. 97
A6 Statistical Appendix - Poverty Indicators
A. Main Tables
(1) Key poverty statistics, 2009-2012 (2) Detailed poverty statistics before policy intervention (3) Detailed poverty statistics after policy intervention (recurrent cash)
B. Supplementary Tables (1) Key poverty statistics, 2009-2012 (2) Poverty statistics after policy intervention (recurrent + non-recurrent cash) (3) Poverty statistics after policy intervention (recurrent cash + in-kind)
Notes: The numbers of households and persons by social characteristic are not mutually exclusive. Unless otherwise specified, FDHs are excluded. Poor households are defined by the poverty line below:
The poverty line by household size, 2009-2012 (50% of the pre-intervention median monthly household income)
1-person 2-person 3-person 4-person 5-person 6-person+ 2009 $3,300 $6,900 $9,900 $11,300 $11,900 $13,000 2010 $3,300 $7,000 $10,000 $11,800 $12,300 $13,500 2011 $3,400 $7,500 $10,500 $13,000 $13,500 $14,500 2012 $3,600 $7,700 $11,500 $14,300 $14,800 $15,800
{ } Figures in curly brackets denote the proportions of relevant households / persons, in all domestic households / persons residing in domestic households of the corresponding groups.
( ) Figures in parentheses denote the proportions of relevant (poor) households / persons, in (poor) domestic households / persons residing in domestic households of the corresponding groups.
< > Figures in angle brackets denote the proportions of relevant (poor) employed persons, in (poor) employed persons residing in domestic households of the corresponding groups.
(*) Other economically inactive persons include pregnant women, those who cannot work or do not seek work.
(^) Demographic dependency ratio refers to the number of persons aged under 15 (child dependency ratio) and aged 65 and above (elderly dependency ratio) per 1 000 persons aged between 15 and 64.
(#) Economic dependency ratio refers to the number of economically inactive persons per 1 000 economically active persons.
(§) Estimates less than 250 and related statistics derived based on such estimates (e.g. percentages, rates and median) are not released due to large sampling errors.
(-) Not applicable. (@) Percentages less than 0.05% / percentage changes within ±0.05% / average numbers of persons
less than 0.05 / increases or decreases in the number of households or persons less than 50 / monetary amount less than $50. Such statistics are also not shown in the table.
There may be slight discrepancies between the sums of individual items and the totals due to rounding.
Percentages may not add up to 100% due to rounding. Except poverty rate, changes of all statistics are derived from unrounded figures. All percentage changes are calculated using unrounded figures.
Source: General Household Survey, Census and Statistics Department.
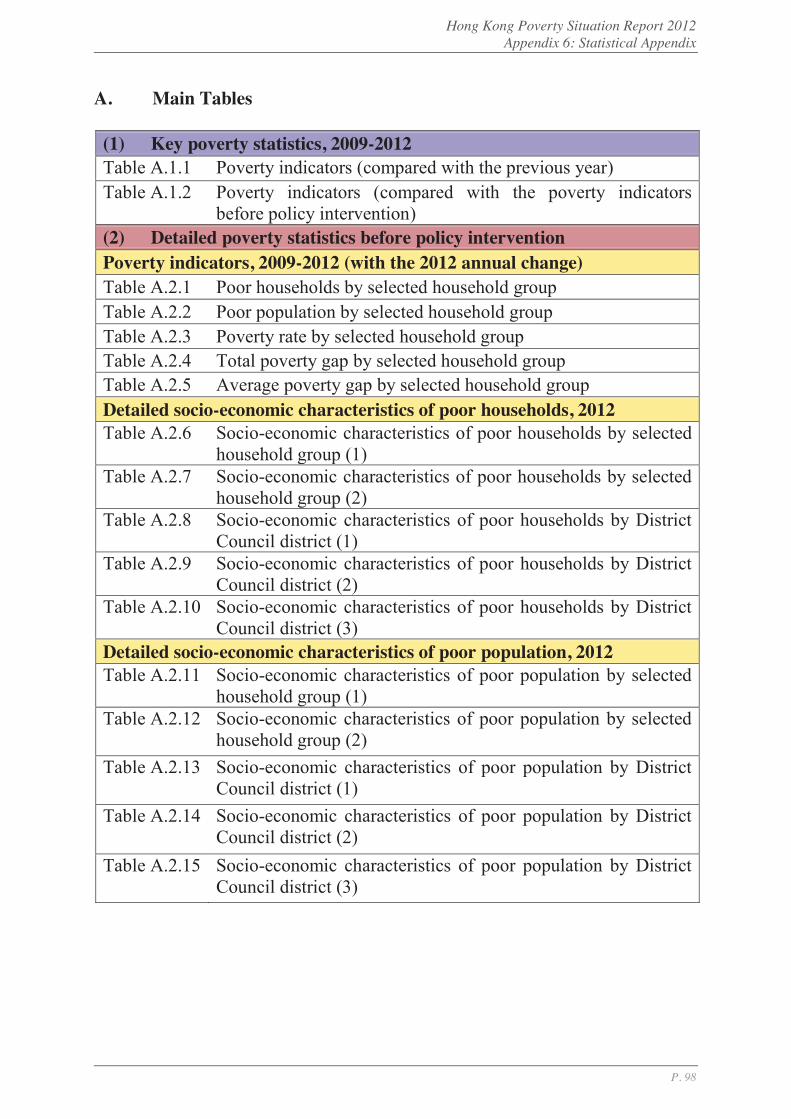
Hong Kong Poverty Situation Report 2012 Appendix 6: Statistical Appendix
P. 98
A. Main Tables (1) Key poverty statistics, 2009-2012 Table A.1.1 Poverty indicators (compared with the previous year) Table A.1.2 Poverty indicators (compared with the poverty indicators
before policy intervention) (2) Detailed poverty statistics before policy intervention Poverty indicators, 2009-2012 (with the 2012 annual change) Table A.2.1 Poor households by selected household group Table A.2.2 Poor population by selected household group Table A.2.3 Poverty rate by selected household group Table A.2.4 Total poverty gap by selected household group Table A.2.5 Average poverty gap by selected household group Detailed socio-economic characteristics of poor households, 2012 Table A.2.6 Socio-economic characteristics of poor households by selected
household group (1) Table A.2.7 Socio-economic characteristics of poor households by selected
household group (2) Table A.2.8 Socio-economic characteristics of poor households by District
Council district (1) Table A.2.9 Socio-economic characteristics of poor households by District
Council district (2) Table A.2.10 Socio-economic characteristics of poor households by District
Council district (3) Detailed socio-economic characteristics of poor population, 2012 Table A.2.11 Socio-economic characteristics of poor population by selected
household group (1) Table A.2.12 Socio-economic characteristics of poor population by selected
household group (2) Table A.2.13 Socio-economic characteristics of poor population by District
Council district (1) Table A.2.14 Socio-economic characteristics of poor population by District
Council district (2) Table A.2.15 Socio-economic characteristics of poor population by District
Council district (3)
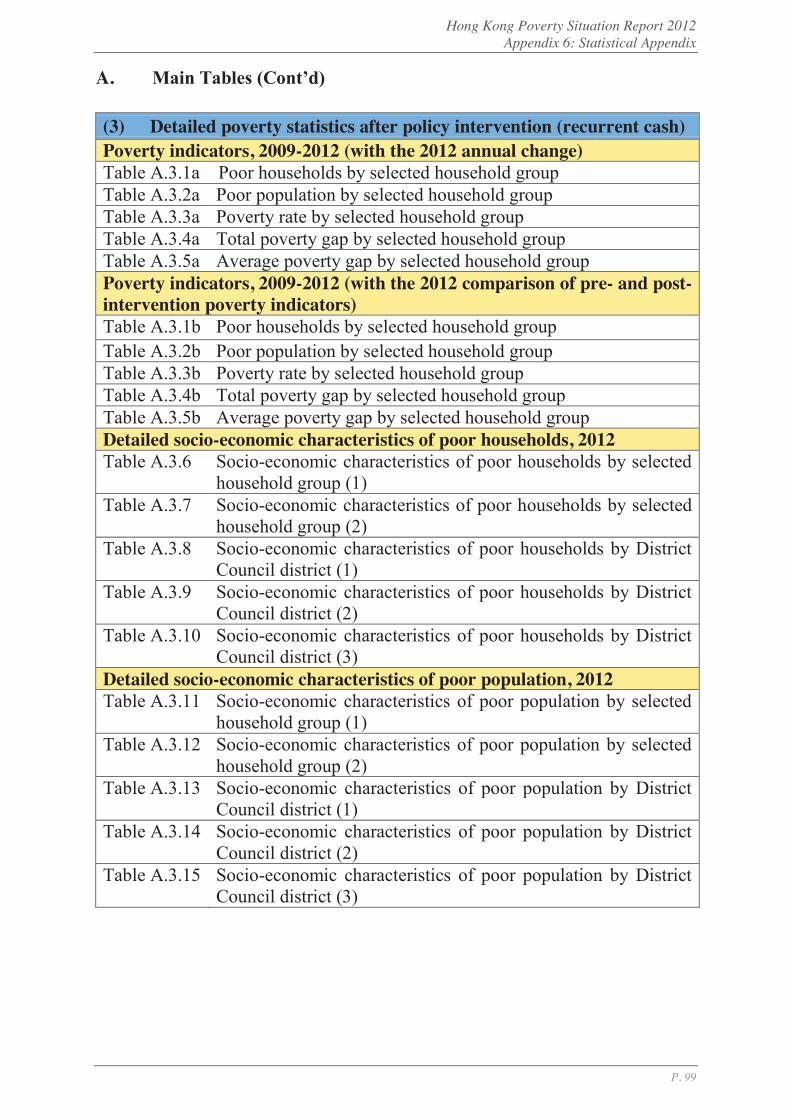
Hong Kong Poverty Situation Report 2012 Appendix 6: Statistical Appendix
P. 99
A. Main Tables (Cont’d) (3) Detailed poverty statistics after policy intervention (recurrent cash) Poverty indicators, 2009-2012 (with the 2012 annual change) Table A.3.1a Poor households by selected household group Table A.3.2a Poor population by selected household group Table A.3.3a Poverty rate by selected household group Table A.3.4a Total poverty gap by selected household group Table A.3.5a Average poverty gap by selected household group Poverty indicators, 2009-2012 (with the 2012 comparison of pre- and post-intervention poverty indicators) Table A.3.1b Poor households by selected household group Table A.3.2b Poor population by selected household group Table A.3.3b Poverty rate by selected household group Table A.3.4b Total poverty gap by selected household group Table A.3.5b Average poverty gap by selected household group Detailed socio-economic characteristics of poor households, 2012 Table A.3.6 Socio-economic characteristics of poor households by selected
household group (1) Table A.3.7 Socio-economic characteristics of poor households by selected
household group (2) Table A.3.8 Socio-economic characteristics of poor households by District
Council district (1) Table A.3.9 Socio-economic characteristics of poor households by District
Council district (2) Table A.3.10 Socio-economic characteristics of poor households by District
Council district (3) Detailed socio-economic characteristics of poor population, 2012 Table A.3.11 Socio-economic characteristics of poor population by selected
household group (1) Table A.3.12 Socio-economic characteristics of poor population by selected
household group (2) Table A.3.13 Socio-economic characteristics of poor population by District
Council district (1) Table A.3.14 Socio-economic characteristics of poor population by District
Council district (2) Table A.3.15 Socio-economic characteristics of poor population by District
Council district (3)
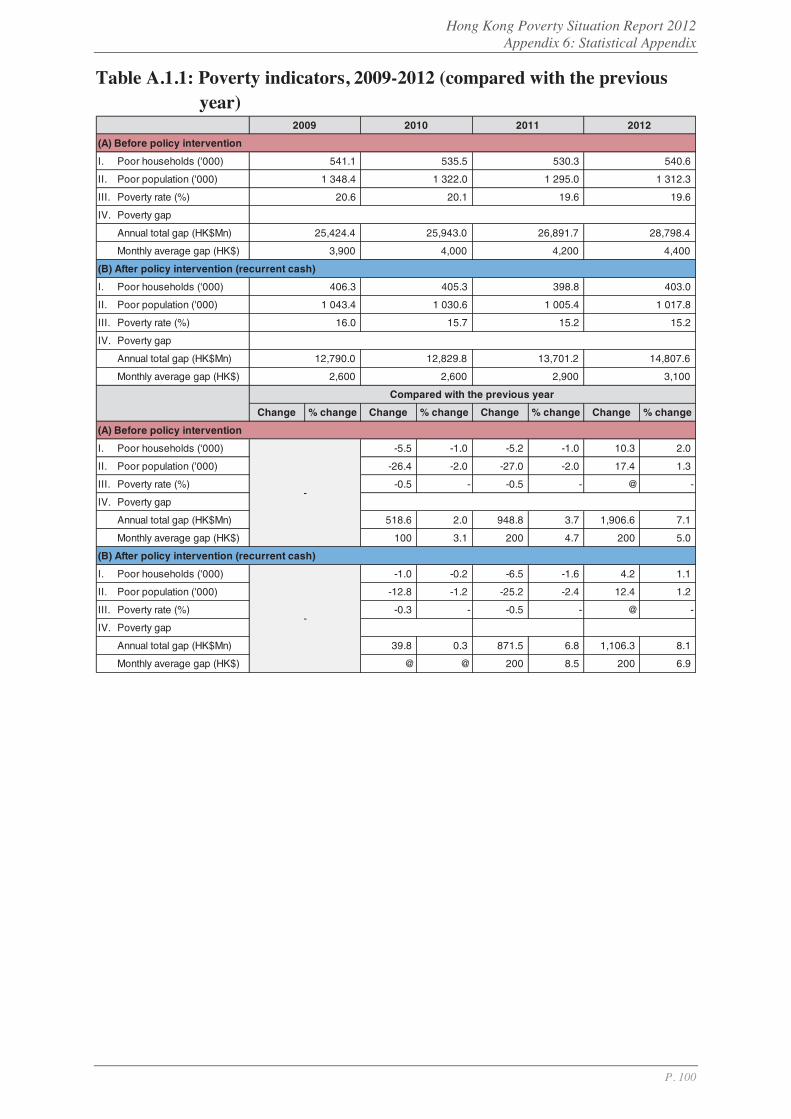
Hong Kong Poverty Situation Report 2012 Appendix 6: Statistical Appendix
P. 100
Table A.1.1: Poverty indicators, 2009-2012 (compared with the previous year)
(A) Before policy intervention
I. Poor households ('000)
II. Poor population ('000)
III. Poverty rate (%) 20.1
IV. Poverty gap
Annual total gap (HK$Mn)
Monthly average gap (HK$) 3,900
(B) After policy intervention (recurrent cash)
I. Poor households ('000)
II. Poor population ('000)
III. Poverty rate (%) 15.2
IV. Poverty gap
Annual total gap (HK$Mn)
Monthly average gap (HK$) 2,900 3,100
Change % change Change % change Change % change Change % change
(A) Before policy intervention
I. Poor households ('000) -5.5 -1.0 -5.2 -1.0 10.3 2.0
II. Poor population ('000) -26.4 -2.0 -27.0 -2.0 17.4 1.3
III. Poverty rate (%) -0.5 - -0.5 - @ -
IV. Poverty gap
Annual total gap (HK$Mn) 518.6 2.0 948.8 3.7 1,906.6 7.1
Monthly average gap (HK$) 100 3.1 200 4.7 200 5.0
(B) After policy intervention (recurrent cash)
I. Poor households ('000) -1.0 -0.2 -6.5 -1.6 4.2 1.1
II. Poor population ('000) -12.8 -1.2 -25.2 -2.4 12.4 1.2
III. Poverty rate (%) -0.3 - -0.5 - @ -
IV. Poverty gap
Annual total gap (HK$Mn) 39.8 0.3 871.5 6.8 1,106.3 8.1
Monthly average gap (HK$) @ @ 200 8.5 200 6.9
13,701.2 14,807.6
1 017.8
15.2
403.0
16.0
12,790.0
2,600
405.3
1 030.6
15.7
12,829.8
2,600
4,000 4,400
28,798.4
406.3
1 043.4
4,200
398.8
1 005.4
26,891.7
530.3
1 295.0
19.6
540.6
1 312.3
19.6
2012
Compared with the previous year
-
-
2009 2010 2011
541.1
1 348.4
20.6
535.5
1 322.0
25,424.4 25,943.0

Hong Kong Poverty Situation Report 2012 Appendix 6: Statistical Appendix
P. 101
Table A.1.2: Poverty indicators, 2009-2012 (compared with the poverty indicators before policy intervention)
(A) Before policy intervention
I. Poor households ('000)
II. Poor population ('000)
III. Poverty rate (%)
IV. Poverty gap
Annual total gap (HK$Mn)
Monthly average gap (HK$) 4,000 4,200 4,400
(B) After policy intervention (recurrent cash)
I. Poor households ('000) 405.3
II. Poor population ('000) 1 030.6
III. Poverty rate (%) 15.7
IV. Poverty gap
Annual total gap (HK$Mn)
Monthly average gap (HK$)
Change % change Change % change Change % change Change % change
I. Poor households ('000) -134.8 -24.9 -130.2 -24.3 -131.5 -24.8 -137.6 -25.5
II. Poor population ('000) -305.0 -22.6 -291.4 -22.0 -289.6 -22.4 -294.5 -22.4
III. Poverty rate (%) -4.6 - -4.4 - -4.4 - -4.4 -
IV. Poverty gap
Annual total gap (HK$Mn) -12,634.4 -49.7 -13,113.2 -50.5 -13,190.5 -49.1 -13,990.8 -48.6
Monthly average gap (HK$) -1,300 -33.0 -1,400 -34.7 -1,400 -32.3 -1,400 -31.0
14,807.6
3,100
398.8
1 005.4
15.2
403.0
1 017.8
15.2
2,600
12,829.8
2,600
13,701.2
2,900
3,900
406.3
1 043.4
16.0
12,790.0
19.6
540.6
1 312.3
19.6
25,424.4 25,943.0 26,891.7 28,798.4
Compared with the poverty indicators before policy intervention
20122009 2010 2011
541.1
1 348.4
20.6
535.5
1 322.0
20.1
530.3
1 295.0
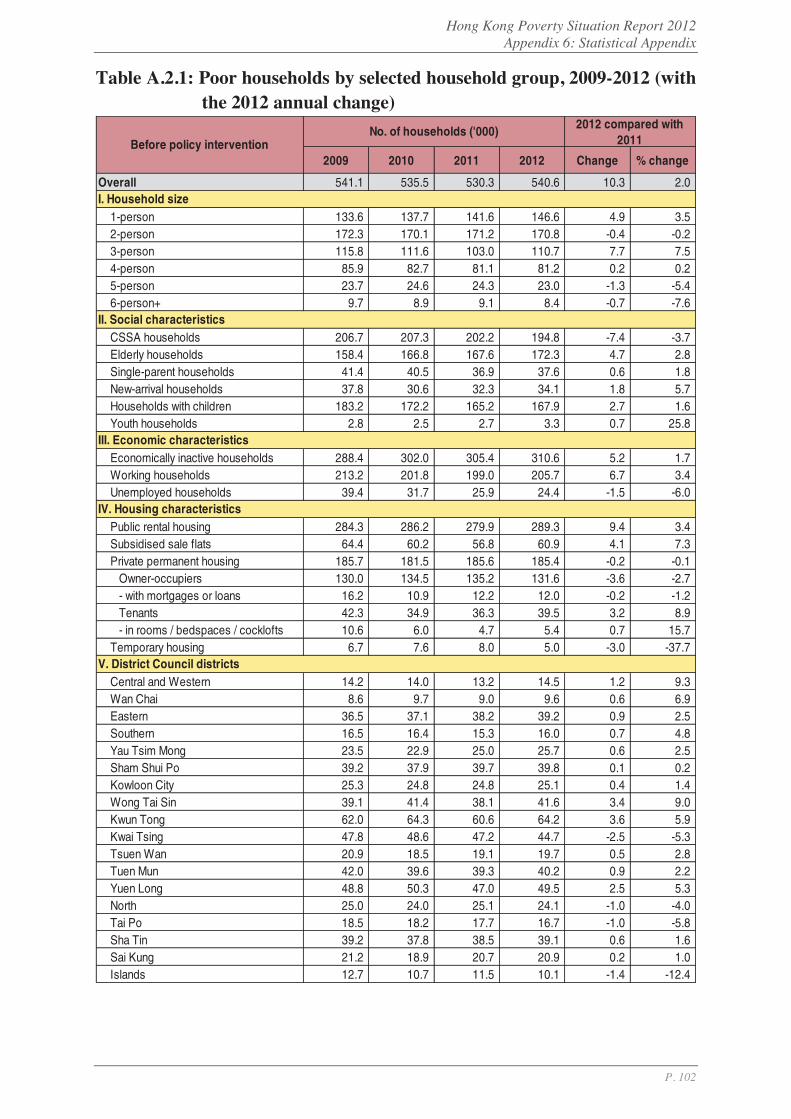
Hong Kong Poverty Situation Report 2012 Appendix 6: Statistical Appendix
P. 102
Table A.2.1: Poor households by selected household group, 2009-2012 (with the 2012 annual change)
2009 2010 2011 2012 Change % change
Overall 541.1 535.5 530.3 540.6 10.3 2.0
1-person 133.6 137.7 141.6 146.6 4.9 3.52-person 172.3 170.1 171.2 170.8 -0.4 -0.23-person 115.8 111.6 103.0 110.7 7.7 7.54-person 85.9 82.7 81.1 81.2 0.2 0.25-person 23.7 24.6 24.3 23.0 -1.3 -5.46-person+ 9.7 8.9 9.1 8.4 -0.7 -7.6
CSSA households 206.7 207.3 202.2 194.8 -7.4 -3.7Elderly households 158.4 166.8 167.6 172.3 4.7 2.8Single-parent households 41.4 40.5 36.9 37.6 0.6 1.8New-arrival households 37.8 30.6 32.3 34.1 1.8 5.7Households with children 183.2 172.2 165.2 167.9 2.7 1.6Youth households 2.8 2.5 2.7 3.3 0.7 25.8
Economically inactive households 288.4 302.0 305.4 310.6 5.2 1.7Working households 213.2 201.8 199.0 205.7 6.7 3.4Unemployed households 39.4 31.7 25.9 24.4 -1.5 -6.0
Public rental housing 284.3 286.2 279.9 289.3 9.4 3.4Subsidised sale flats 64.4 60.2 56.8 60.9 4.1 7.3Private permanent housing 185.7 181.5 185.6 185.4 -0.2 -0.1
Owner-occupiers 130.0 134.5 135.2 131.6 -3.6 -2.7- with mortgages or loans 16.2 10.9 12.2 12.0 -0.2 -1.2Tenants 42.3 34.9 36.3 39.5 3.2 8.9- in rooms / bedspaces / cocklofts 10.6 6.0 4.7 5.4 0.7 15.7
Temporary housing 6.7 7.6 8.0 5.0 -3.0 -37.7
Central and Western 14.2 14.0 13.2 14.5 1.2 9.3Wan Chai 8.6 9.7 9.0 9.6 0.6 6.9Eastern 36.5 37.1 38.2 39.2 0.9 2.5Southern 16.5 16.4 15.3 16.0 0.7 4.8Yau Tsim Mong 23.5 22.9 25.0 25.7 0.6 2.5Sham Shui Po 39.2 37.9 39.7 39.8 0.1 0.2Kowloon City 25.3 24.8 24.8 25.1 0.4 1.4Wong Tai Sin 39.1 41.4 38.1 41.6 3.4 9.0Kwun Tong 62.0 64.3 60.6 64.2 3.6 5.9Kwai Tsing 47.8 48.6 47.2 44.7 -2.5 -5.3Tsuen Wan 20.9 18.5 19.1 19.7 0.5 2.8Tuen Mun 42.0 39.6 39.3 40.2 0.9 2.2Yuen Long 48.8 50.3 47.0 49.5 2.5 5.3North 25.0 24.0 25.1 24.1 -1.0 -4.0Tai Po 18.5 18.2 17.7 16.7 -1.0 -5.8Sha Tin 39.2 37.8 38.5 39.1 0.6 1.6Sai Kung 21.2 18.9 20.7 20.9 0.2 1.0Islands 12.7 10.7 11.5 10.1 -1.4 -12.4
No. of households ('000) 2012 compared with2011Before policy intervention
I. Household size
II. Social characteristics
III. Economic characteristics
IV. Housing characteristics
V. District Council districts
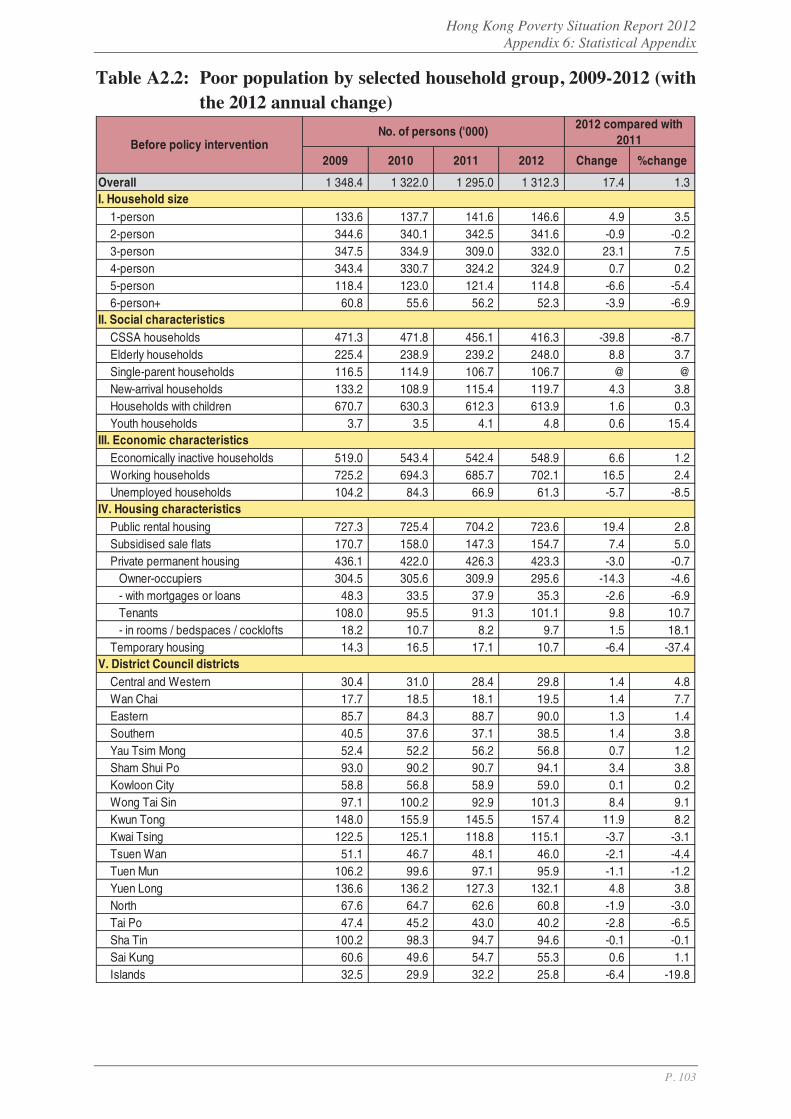
Hong Kong Poverty Situation Report 2012 Appendix 6: Statistical Appendix
P. 103
Table A2.2: Poor population by selected household group, 2009-2012 (with the 2012 annual change)
2009 2010 2011 2012 Change %change
Overall 1 348.4 1 322.0 1 295.0 1 312.3 17.4 1.3
1-person 133.6 137.7 141.6 146.6 4.9 3.52-person 344.6 340.1 342.5 341.6 -0.9 -0.23-person 347.5 334.9 309.0 332.0 23.1 7.54-person 343.4 330.7 324.2 324.9 0.7 0.25-person 118.4 123.0 121.4 114.8 -6.6 -5.46-person+ 60.8 55.6 56.2 52.3 -3.9 -6.9
CSSA households 471.3 471.8 456.1 416.3 -39.8 -8.7Elderly households 225.4 238.9 239.2 248.0 8.8 3.7Single-parent households 116.5 114.9 106.7 106.7 @ @ New-arrival households 133.2 108.9 115.4 119.7 4.3 3.8Households with children 670.7 630.3 612.3 613.9 1.6 0.3Youth households 3.7 3.5 4.1 4.8 0.6 15.4
Economically inactive households 519.0 543.4 542.4 548.9 6.6 1.2Working households 725.2 694.3 685.7 702.1 16.5 2.4Unemployed households 104.2 84.3 66.9 61.3 -5.7 -8.5
Public rental housing 727.3 725.4 704.2 723.6 19.4 2.8Subsidised sale flats 170.7 158.0 147.3 154.7 7.4 5.0Private permanent housing 436.1 422.0 426.3 423.3 -3.0 -0.7
Owner-occupiers 304.5 305.6 309.9 295.6 -14.3 -4.6- with mortgages or loans 48.3 33.5 37.9 35.3 -2.6 -6.9Tenants 108.0 95.5 91.3 101.1 9.8 10.7- in rooms / bedspaces / cocklofts 18.2 10.7 8.2 9.7 1.5 18.1
Temporary housing 14.3 16.5 17.1 10.7 -6.4 -37.4
Central and Western 30.4 31.0 28.4 29.8 1.4 4.8Wan Chai 17.7 18.5 18.1 19.5 1.4 7.7Eastern 85.7 84.3 88.7 90.0 1.3 1.4Southern 40.5 37.6 37.1 38.5 1.4 3.8Yau Tsim Mong 52.4 52.2 56.2 56.8 0.7 1.2Sham Shui Po 93.0 90.2 90.7 94.1 3.4 3.8Kowloon City 58.8 56.8 58.9 59.0 0.1 0.2Wong Tai Sin 97.1 100.2 92.9 101.3 8.4 9.1Kwun Tong 148.0 155.9 145.5 157.4 11.9 8.2Kwai Tsing 122.5 125.1 118.8 115.1 -3.7 -3.1Tsuen Wan 51.1 46.7 48.1 46.0 -2.1 -4.4Tuen Mun 106.2 99.6 97.1 95.9 -1.1 -1.2Yuen Long 136.6 136.2 127.3 132.1 4.8 3.8North 67.6 64.7 62.6 60.8 -1.9 -3.0Tai Po 47.4 45.2 43.0 40.2 -2.8 -6.5Sha Tin 100.2 98.3 94.7 94.6 -0.1 -0.1Sai Kung 60.6 49.6 54.7 55.3 0.6 1.1Islands 32.5 29.9 32.2 25.8 -6.4 -19.8
2012 compared with2011
No. of persons ('000)Before policy intervention
I. Household size
II. Social characteristics
III. Economic characteristics
IV. Housing characteristics
V. District Council districts
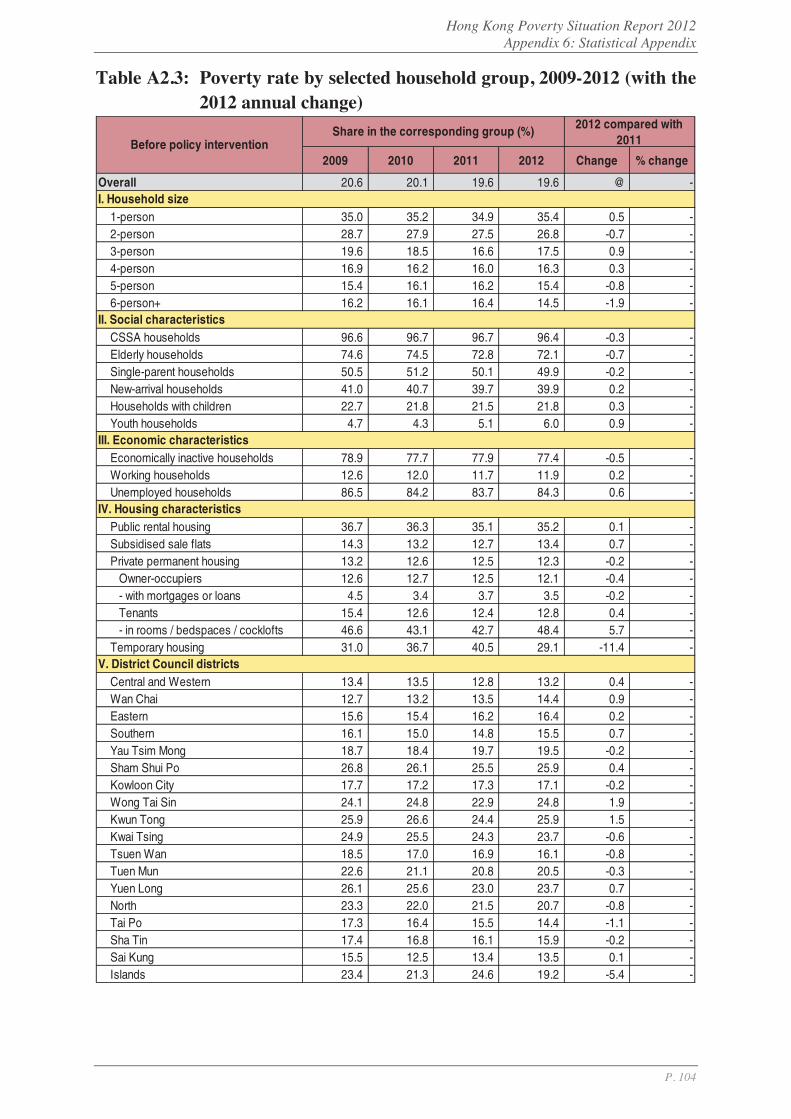
Hong Kong Poverty Situation Report 2012 Appendix 6: Statistical Appendix
P. 104
Table A2.3: Poverty rate by selected household group, 2009-2012 (with the 2012 annual change)
2009 2010 2011 2012 Change % change
Overall 20.6 20.1 19.6 19.6 @ -
1-person 35.0 35.2 34.9 35.4 0.5 -2-person 28.7 27.9 27.5 26.8 -0.7 -3-person 19.6 18.5 16.6 17.5 0.9 -4-person 16.9 16.2 16.0 16.3 0.3 -5-person 15.4 16.1 16.2 15.4 -0.8 -6-person+ 16.2 16.1 16.4 14.5 -1.9 -
CSSA households 96.6 96.7 96.7 96.4 -0.3 -Elderly households 74.6 74.5 72.8 72.1 -0.7 -Single-parent households 50.5 51.2 50.1 49.9 -0.2 -New-arrival households 41.0 40.7 39.7 39.9 0.2 -Households with children 22.7 21.8 21.5 21.8 0.3 -Youth households 4.7 4.3 5.1 6.0 0.9 -
Economically inactive households 78.9 77.7 77.9 77.4 -0.5 -Working households 12.6 12.0 11.7 11.9 0.2 -Unemployed households 86.5 84.2 83.7 84.3 0.6 -
Public rental housing 36.7 36.3 35.1 35.2 0.1 -Subsidised sale flats 14.3 13.2 12.7 13.4 0.7 -Private permanent housing 13.2 12.6 12.5 12.3 -0.2 -
Owner-occupiers 12.6 12.7 12.5 12.1 -0.4 -- with mortgages or loans 4.5 3.4 3.7 3.5 -0.2 -Tenants 15.4 12.6 12.4 12.8 0.4 -- in rooms / bedspaces / cocklofts 46.6 43.1 42.7 48.4 5.7 -
Temporary housing 31.0 36.7 40.5 29.1 -11.4 -
Central and Western 13.4 13.5 12.8 13.2 0.4 -Wan Chai 12.7 13.2 13.5 14.4 0.9 -Eastern 15.6 15.4 16.2 16.4 0.2 -Southern 16.1 15.0 14.8 15.5 0.7 -Yau Tsim Mong 18.7 18.4 19.7 19.5 -0.2 -Sham Shui Po 26.8 26.1 25.5 25.9 0.4 -Kowloon City 17.7 17.2 17.3 17.1 -0.2 -Wong Tai Sin 24.1 24.8 22.9 24.8 1.9 -Kwun Tong 25.9 26.6 24.4 25.9 1.5 -Kwai Tsing 24.9 25.5 24.3 23.7 -0.6 -Tsuen Wan 18.5 17.0 16.9 16.1 -0.8 -Tuen Mun 22.6 21.1 20.8 20.5 -0.3 -Yuen Long 26.1 25.6 23.0 23.7 0.7 -North 23.3 22.0 21.5 20.7 -0.8 -Tai Po 17.3 16.4 15.5 14.4 -1.1 -Sha Tin 17.4 16.8 16.1 15.9 -0.2 -Sai Kung 15.5 12.5 13.4 13.5 0.1 -Islands 23.4 21.3 24.6 19.2 -5.4 -
2012 compared with2011
Share in the corresponding group (%)Before policy intervention
I. Household size
II. Social characteristics
III. Economic characteristics
IV. Housing characteristics
V. District Council districts
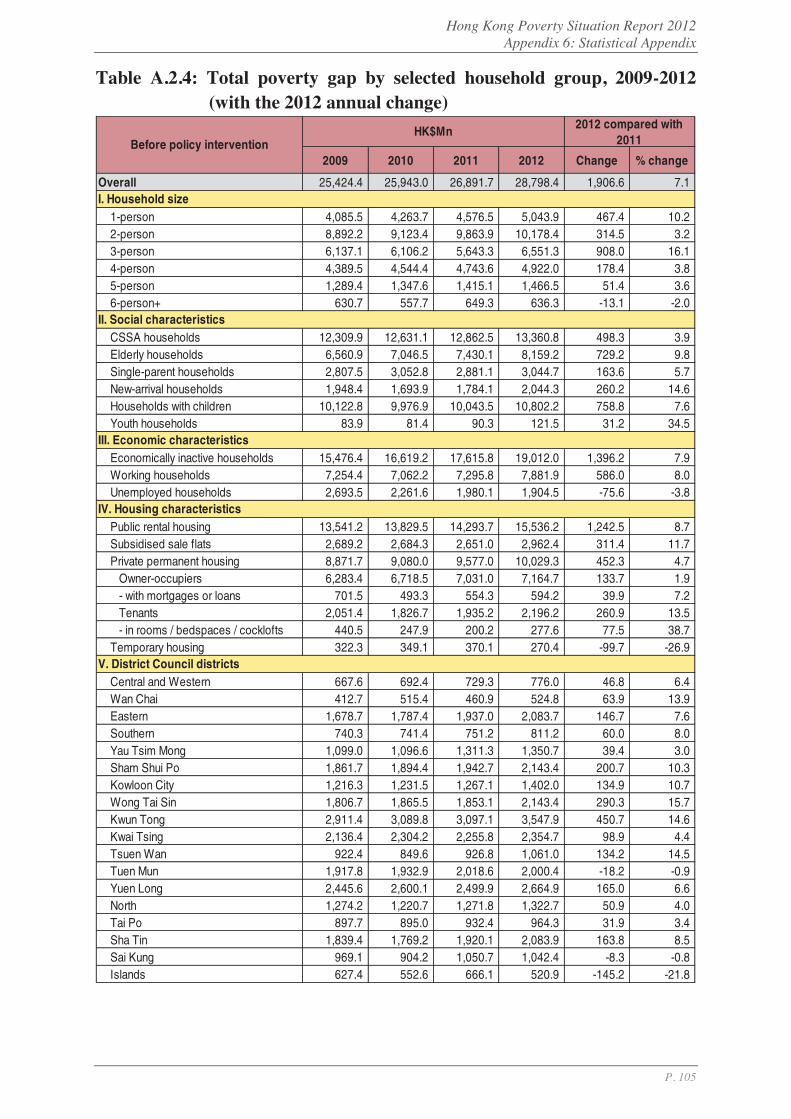
Hong Kong Poverty Situation Report 2012 Appendix 6: Statistical Appendix
P. 105
Table A.2.4: Total poverty gap by selected household group, 2009-2012 (with the 2012 annual change)
2009 2010 2011 2012 Change % change
Overall 25,424.4 25,943.0 26,891.7 28,798.4 1,906.6 7.1
1-person 4,085.5 4,263.7 4,576.5 5,043.9 467.4 10.22-person 8,892.2 9,123.4 9,863.9 10,178.4 314.5 3.23-person 6,137.1 6,106.2 5,643.3 6,551.3 908.0 16.14-person 4,389.5 4,544.4 4,743.6 4,922.0 178.4 3.85-person 1,289.4 1,347.6 1,415.1 1,466.5 51.4 3.66-person+ 630.7 557.7 649.3 636.3 -13.1 -2.0
CSSA households 12,309.9 12,631.1 12,862.5 13,360.8 498.3 3.9Elderly households 6,560.9 7,046.5 7,430.1 8,159.2 729.2 9.8Single-parent households 2,807.5 3,052.8 2,881.1 3,044.7 163.6 5.7New-arrival households 1,948.4 1,693.9 1,784.1 2,044.3 260.2 14.6Households with children 10,122.8 9,976.9 10,043.5 10,802.2 758.8 7.6Youth households 83.9 81.4 90.3 121.5 31.2 34.5
Economically inactive households 15,476.4 16,619.2 17,615.8 19,012.0 1,396.2 7.9Working households 7,254.4 7,062.2 7,295.8 7,881.9 586.0 8.0Unemployed households 2,693.5 2,261.6 1,980.1 1,904.5 -75.6 -3.8
Public rental housing 13,541.2 13,829.5 14,293.7 15,536.2 1,242.5 8.7Subsidised sale flats 2,689.2 2,684.3 2,651.0 2,962.4 311.4 11.7Private permanent housing 8,871.7 9,080.0 9,577.0 10,029.3 452.3 4.7
Owner-occupiers 6,283.4 6,718.5 7,031.0 7,164.7 133.7 1.9- with mortgages or loans 701.5 493.3 554.3 594.2 39.9 7.2Tenants 2,051.4 1,826.7 1,935.2 2,196.2 260.9 13.5- in rooms / bedspaces / cocklofts 440.5 247.9 200.2 277.6 77.5 38.7
Temporary housing 322.3 349.1 370.1 270.4 -99.7 -26.9
Central and Western 667.6 692.4 729.3 776.0 46.8 6.4Wan Chai 412.7 515.4 460.9 524.8 63.9 13.9Eastern 1,678.7 1,787.4 1,937.0 2,083.7 146.7 7.6Southern 740.3 741.4 751.2 811.2 60.0 8.0Yau Tsim Mong 1,099.0 1,096.6 1,311.3 1,350.7 39.4 3.0Sham Shui Po 1,861.7 1,894.4 1,942.7 2,143.4 200.7 10.3Kowloon City 1,216.3 1,231.5 1,267.1 1,402.0 134.9 10.7Wong Tai Sin 1,806.7 1,865.5 1,853.1 2,143.4 290.3 15.7Kwun Tong 2,911.4 3,089.8 3,097.1 3,547.9 450.7 14.6Kwai Tsing 2,136.4 2,304.2 2,255.8 2,354.7 98.9 4.4Tsuen Wan 922.4 849.6 926.8 1,061.0 134.2 14.5Tuen Mun 1,917.8 1,932.9 2,018.6 2,000.4 -18.2 -0.9Yuen Long 2,445.6 2,600.1 2,499.9 2,664.9 165.0 6.6North 1,274.2 1,220.7 1,271.8 1,322.7 50.9 4.0Tai Po 897.7 895.0 932.4 964.3 31.9 3.4Sha Tin 1,839.4 1,769.2 1,920.1 2,083.9 163.8 8.5Sai Kung 969.1 904.2 1,050.7 1,042.4 -8.3 -0.8Islands 627.4 552.6 666.1 520.9 -145.2 -21.8
2012 compared with2011
HK$MnBefore policy intervention
I. Household size
II. Social characteristics
III. Economic characteristics
IV. Housing characteristics
V. District Council districts

Hong Kong Poverty Situation Report 2012 Appendix 6: Statistical Appendix
P. 106
Table A.2.5: Average poverty gap by selected household group, 2009-2012 (with the 2012 annual change)
2009 2010 2011 2012 Change % change
Overall 3,900 4,000 4,200 4,400 200 5.0
1-person 2,500 2,600 2,700 2,900 200 6.52-person 4,300 4,500 4,800 5,000 200 3.43-person 4,400 4,600 4,600 4,900 400 8.04-person 4,300 4,600 4,900 5,000 200 3.55-person 4,500 4,600 4,900 5,300 500 9.66-person+ 5,400 5,200 6,000 6,300 400 6.0
CSSA households 5,000 5,100 5,300 5,700 400 7.8Elderly households 3,500 3,500 3,700 3,900 300 6.8Single-parent households 5,600 6,300 6,500 6,700 300 3.9New-arrival households 4,300 4,600 4,600 5,000 400 8.4Households with children 4,600 4,800 5,100 5,400 300 5.8Youth households 2,500 2,700 2,800 3,000 200 6.9
Economically inactive households 4,500 4,600 4,800 5,100 300 6.1Working households 2,800 2,900 3,100 3,200 100 4.5Unemployed households 5,700 5,900 6,400 6,500 100 2.3
Public rental housing 4,000 4,000 4,300 4,500 200 5.2Subsidised sale flats 3,500 3,700 3,900 4,100 200 4.2Private permanent housing 4,000 4,200 4,300 4,500 200 4.8
Owner-occupiers 4,000 4,200 4,300 4,500 200 4.7- with mortgages or loans 3,600 3,800 3,800 4,100 300 8.5Tenants 4,000 4,400 4,400 4,600 200 4.2- in rooms / bedspaces / cocklofts 3,500 3,500 3,600 4,300 700 19.9
Temporary housing 4,000 3,800 3,900 4,500 700 17.4
Central and Western 3,900 4,100 4,600 4,500 -100 -2.6Wan Chai 4,000 4,400 4,300 4,500 300 6.6Eastern 3,800 4,000 4,200 4,400 200 5.0Southern 3,700 3,800 4,100 4,200 100 3.0Yau Tsim Mong 3,900 4,000 4,400 4,400 @ @ Sham Shui Po 4,000 4,200 4,100 4,500 400 10.1Kowloon City 4,000 4,100 4,300 4,700 400 9.1Wong Tai Sin 3,900 3,800 4,000 4,300 200 6.1Kwun Tong 3,900 4,000 4,300 4,600 300 8.2Kwai Tsing 3,700 3,900 4,000 4,400 400 10.2Tsuen Wan 3,700 3,800 4,000 4,500 500 11.3Tuen Mun 3,800 4,100 4,300 4,100 -100 -3.0Yuen Long 4,200 4,300 4,400 4,500 100 1.3North 4,200 4,200 4,200 4,600 400 8.3Tai Po 4,000 4,100 4,400 4,800 400 9.8Sha Tin 3,900 3,900 4,200 4,400 300 6.8Sai Kung 3,800 4,000 4,200 4,100 -100 -1.8Islands 4,100 4,300 4,800 4,300 -500 -10.7
2012 compared with2011
HK$Before policy intervention
I. Household size
II. Social characteristics
III. Economic characteristics
IV. Housing characteristics
V. District Council districts
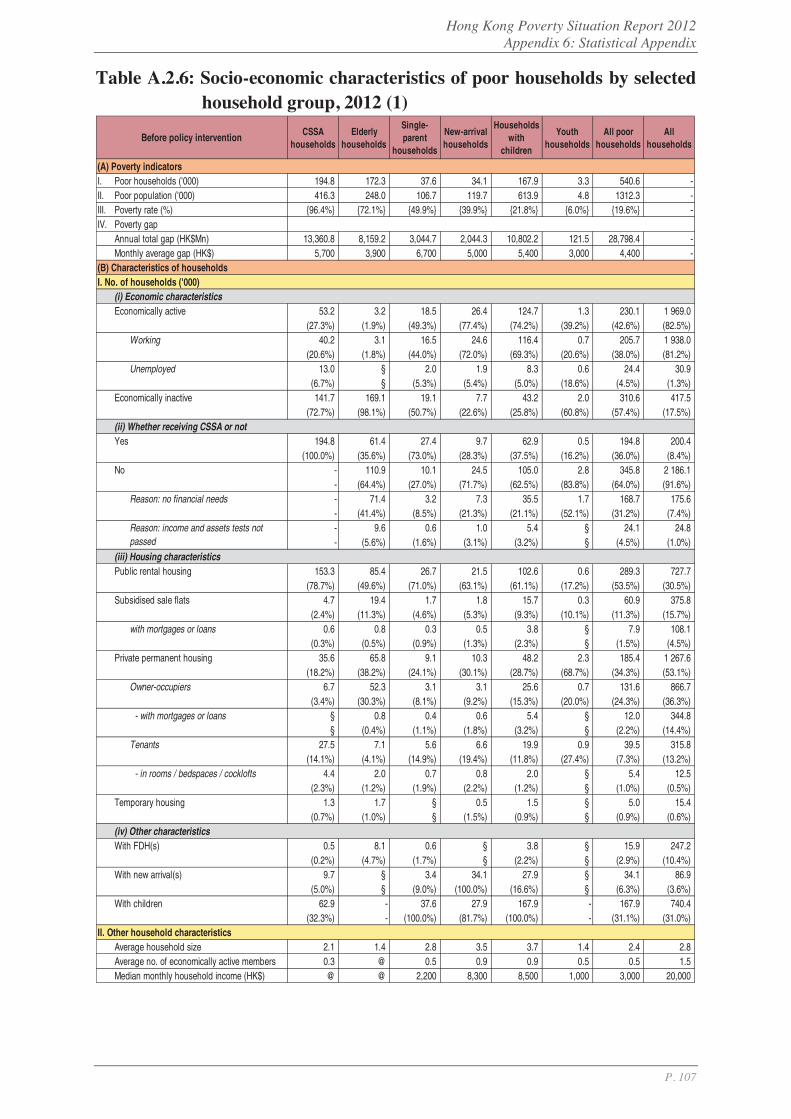
Hong Kong Poverty Situation Report 2012 Appendix 6: Statistical Appendix
P. 107
Table A.2.6: Socio-economic characteristics of poor households by selected household group, 2012 (1)
CSSAhouseholds
Elderlyhouseholds
Single-parent
households
New-arrivalhouseholds
Householdswith
children
Youthhouseholds
All poorhouseholds
Allhouseholds
(A) Poverty indicatorsI. Poor households ('000) 194.8 172.3 37.6 34.1 167.9 3.3 540.6 -II. Poor population ('000) 416.3 248.0 106.7 119.7 613.9 4.8 1312.3 -III. Poverty rate (%) {96.4%} {72.1%} {49.9%} {39.9%} {21.8%} {6.0%} {19.6%} -IV. Poverty gap
Annual total gap (HK$Mn) 13,360.8 8,159.2 3,044.7 2,044.3 10,802.2 121.5 28,798.4 -Monthly average gap (HK$) 5,700 3,900 6,700 5,000 5,400 3,000 4,400 -
(B) Characteristics of householdsI. No. of households ('000)
(i) Economic characteristicsEconomically active 53.2 3.2 18.5 26.4 124.7 1.3 230.1 1 969.0
(27.3%) (1.9%) (49.3%) (77.4%) (74.2%) (39.2%) (42.6%) (82.5%) Working 40.2 3.1 16.5 24.6 116.4 0.7 205.7 1 938.0
(20.6%) (1.8%) (44.0%) (72.0%) (69.3%) (20.6%) (38.0%) (81.2%) Unemployed 13.0 § 2.0 1.9 8.3 0.6 24.4 30.9
(6.7%) § (5.3%) (5.4%) (5.0%) (18.6%) (4.5%) (1.3%) Economically inactive 141.7 169.1 19.1 7.7 43.2 2.0 310.6 417.5
(72.7%) (98.1%) (50.7%) (22.6%) (25.8%) (60.8%) (57.4%) (17.5%) (ii) Whether receiving CSSA or notYes 194.8 61.4 27.4 9.7 62.9 0.5 194.8 200.4
(100.0%) (35.6%) (73.0%) (28.3%) (37.5%) (16.2%) (36.0%) (8.4%) No - 110.9 10.1 24.5 105.0 2.8 345.8 2 186.1
- (64.4%) (27.0%) (71.7%) (62.5%) (83.8%) (64.0%) (91.6%) Reason: no financial needs - 71.4 3.2 7.3 35.5 1.7 168.7 175.6
- (41.4%) (8.5%) (21.3%) (21.1%) (52.1%) (31.2%) (7.4%) - 9.6 0.6 1.0 5.4 § 24.1 24.8 - (5.6%) (1.6%) (3.1%) (3.2%) § (4.5%) (1.0%)
(iii) Housing characteristicsPublic rental housing 153.3 85.4 26.7 21.5 102.6 0.6 289.3 727.7
(78.7%) (49.6%) (71.0%) (63.1%) (61.1%) (17.2%) (53.5%) (30.5%) Subsidised sale flats 4.7 19.4 1.7 1.8 15.7 0.3 60.9 375.8
(2.4%) (11.3%) (4.6%) (5.3%) (9.3%) (10.1%) (11.3%) (15.7%) with mortgages or loans 0.6 0.8 0.3 0.5 3.8 § 7.9 108.1
(0.3%) (0.5%) (0.9%) (1.3%) (2.3%) § (1.5%) (4.5%) Private permanent housing 35.6 65.8 9.1 10.3 48.2 2.3 185.4 1 267.6
(18.2%) (38.2%) (24.1%) (30.1%) (28.7%) (68.7%) (34.3%) (53.1%) Owner-occupiers 6.7 52.3 3.1 3.1 25.6 0.7 131.6 866.7
(3.4%) (30.3%) (8.1%) (9.2%) (15.3%) (20.0%) (24.3%) (36.3%) - with mortgages or loans § 0.8 0.4 0.6 5.4 § 12.0 344.8
§ (0.4%) (1.1%) (1.8%) (3.2%) § (2.2%) (14.4%) Tenants 27.5 7.1 5.6 6.6 19.9 0.9 39.5 315.8
(14.1%) (4.1%) (14.9%) (19.4%) (11.8%) (27.4%) (7.3%) (13.2%) - in rooms / bedspaces / cocklofts 4.4 2.0 0.7 0.8 2.0 § 5.4 12.5
(2.3%) (1.2%) (1.9%) (2.2%) (1.2%) § (1.0%) (0.5%) Temporary housing 1.3 1.7 § 0.5 1.5 § 5.0 15.4
(0.7%) (1.0%) § (1.5%) (0.9%) § (0.9%) (0.6%) (iv) Other characteristicsWith FDH(s) 0.5 8.1 0.6 § 3.8 § 15.9 247.2
(0.2%) (4.7%) (1.7%) § (2.2%) § (2.9%) (10.4%) With new arrival(s) 9.7 § 3.4 34.1 27.9 § 34.1 86.9
(5.0%) § (9.0%) (100.0%) (16.6%) § (6.3%) (3.6%) With children 62.9 - 37.6 27.9 167.9 - 167.9 740.4
(32.3%) - (100.0%) (81.7%) (100.0%) - (31.1%) (31.0%) II. Other household characteristics
Average household size 2.1 1.4 2.8 3.5 3.7 1.4 2.4 2.8Average no. of economically active members 0.3 @ 0.5 0.9 0.9 0.5 0.5 1.5Median monthly household income (HK$) @ @ 2,200 8,300 8,500 1,000 3,000 20,000
Reason: income and assets tests notpassed
Before policy intervention
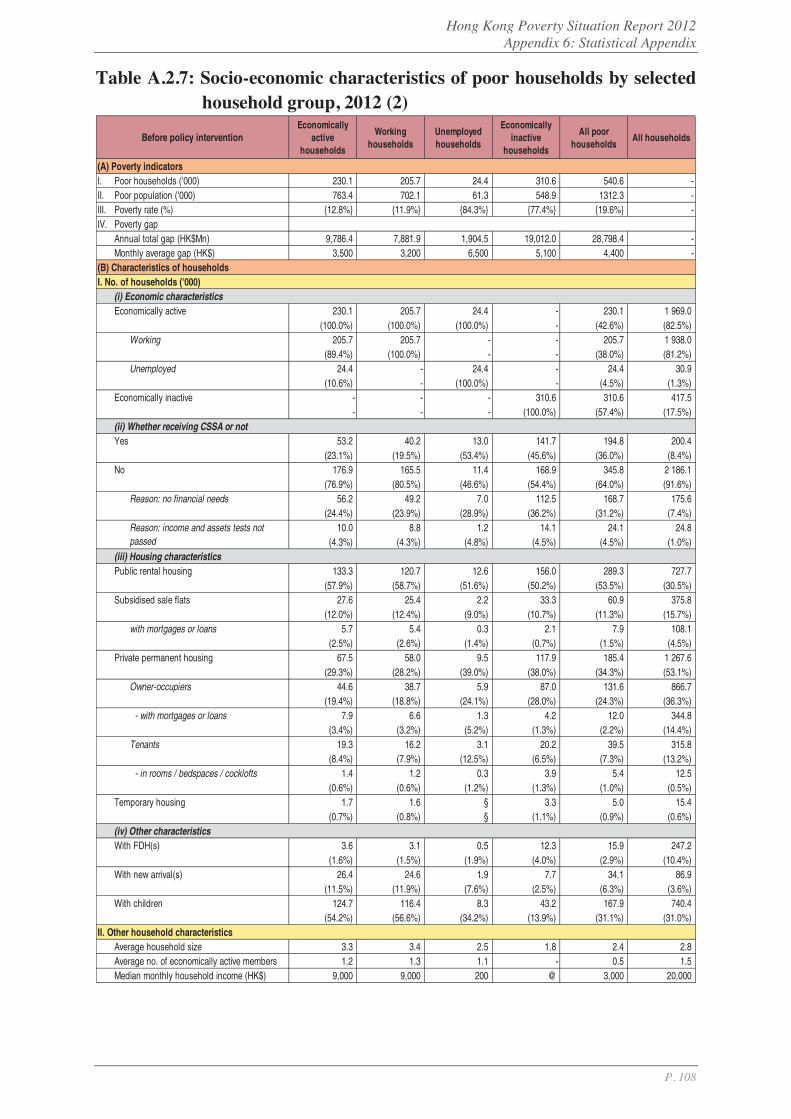
Hong Kong Poverty Situation Report 2012 Appendix 6: Statistical Appendix
P. 108
Table A.2.7: Socio-economic characteristics of poor households by selected household group, 2012 (2)
Economicallyactive
households
Workinghouseholds
Unemployedhouseholds
Economicallyinactive
households
All poorhouseholds
All households
(A) Poverty indicatorsI. Poor households ('000) 230.1 205.7 24.4 310.6 540.6 -II. Poor population ('000) 763.4 702.1 61.3 548.9 1312.3 -III. Poverty rate (%) {12.8%} {11.9%} {84.3%} {77.4%} {19.6%} -IV. Poverty gap
Annual total gap (HK$Mn) 9,786.4 7,881.9 1,904.5 19,012.0 28,798.4 -Monthly average gap (HK$) 3,500 3,200 6,500 5,100 4,400 -
(B) Characteristics of householdsI. No. of households ('000)
(i) Economic characteristicsEconomically active 230.1 205.7 24.4 - 230.1 1 969.0
(100.0%) (100.0%) (100.0%) - (42.6%) (82.5%) Working 205.7 205.7 - - 205.7 1 938.0
(89.4%) (100.0%) - - (38.0%) (81.2%) Unemployed 24.4 - 24.4 - 24.4 30.9
(10.6%) - (100.0%) - (4.5%) (1.3%) Economically inactive - - - 310.6 310.6 417.5
- - - (100.0%) (57.4%) (17.5%) (ii) Whether receiving CSSA or notYes 53.2 40.2 13.0 141.7 194.8 200.4
(23.1%) (19.5%) (53.4%) (45.6%) (36.0%) (8.4%) No 176.9 165.5 11.4 168.9 345.8 2 186.1
(76.9%) (80.5%) (46.6%) (54.4%) (64.0%) (91.6%) Reason: no financial needs 56.2 49.2 7.0 112.5 168.7 175.6
(24.4%) (23.9%) (28.9%) (36.2%) (31.2%) (7.4%) 10.0 8.8 1.2 14.1 24.1 24.8
(4.3%) (4.3%) (4.8%) (4.5%) (4.5%) (1.0%) (iii) Housing characteristicsPublic rental housing 133.3 120.7 12.6 156.0 289.3 727.7
(57.9%) (58.7%) (51.6%) (50.2%) (53.5%) (30.5%) Subsidised sale flats 27.6 25.4 2.2 33.3 60.9 375.8
(12.0%) (12.4%) (9.0%) (10.7%) (11.3%) (15.7%) with mortgages or loans 5.7 5.4 0.3 2.1 7.9 108.1
(2.5%) (2.6%) (1.4%) (0.7%) (1.5%) (4.5%) Private permanent housing 67.5 58.0 9.5 117.9 185.4 1 267.6
(29.3%) (28.2%) (39.0%) (38.0%) (34.3%) (53.1%) Owner-occupiers 44.6 38.7 5.9 87.0 131.6 866.7
(19.4%) (18.8%) (24.1%) (28.0%) (24.3%) (36.3%) - with mortgages or loans 7.9 6.6 1.3 4.2 12.0 344.8
(3.4%) (3.2%) (5.2%) (1.3%) (2.2%) (14.4%) Tenants 19.3 16.2 3.1 20.2 39.5 315.8
(8.4%) (7.9%) (12.5%) (6.5%) (7.3%) (13.2%) - in rooms / bedspaces / cocklofts 1.4 1.2 0.3 3.9 5.4 12.5
(0.6%) (0.6%) (1.2%) (1.3%) (1.0%) (0.5%) Temporary housing 1.7 1.6 § 3.3 5.0 15.4
(0.7%) (0.8%) § (1.1%) (0.9%) (0.6%) (iv) Other characteristicsWith FDH(s) 3.6 3.1 0.5 12.3 15.9 247.2
(1.6%) (1.5%) (1.9%) (4.0%) (2.9%) (10.4%) With new arrival(s) 26.4 24.6 1.9 7.7 34.1 86.9
(11.5%) (11.9%) (7.6%) (2.5%) (6.3%) (3.6%) With children 124.7 116.4 8.3 43.2 167.9 740.4
(54.2%) (56.6%) (34.2%) (13.9%) (31.1%) (31.0%) II. Other household characteristics
Average household size 3.3 3.4 2.5 1.8 2.4 2.8Average no. of economically active members 1.2 1.3 1.1 - 0.5 1.5Median monthly household income (HK$) 9,000 9,000 200 @ 3,000 20,000
Before policy intervention
Reason: income and assets tests notpassed

Hong Kong Poverty Situation Report 2012 Appendix 6: Statistical Appendix
P. 109
Table A.2.8: Socio-economic characteristics of poor households by District Council district, 2012 (1)
Central andWestern
Wan Chai Eastern SouthernYau Tsim
MongSham Shui
PoAll poor
householdsAll
households
(A) Poverty indicatorsI. Poor households ('000) 14.5 9.6 39.2 16.0 25.7 39.8 540.6 -II. Poor population ('000) 29.8 19.5 90.0 38.5 56.8 94.1 1312.3 -III. Poverty rate (%) {13.2%} {14.4%} {16.4%} {15.5%} {19.5%} {25.9%} {19.6%} -IV. Poverty gap
Annual total gap (HK$Mn) 776.0 524.8 2,083.7 811.2 1,350.7 2,143.4 28,798.4 -Monthly average gap (HK$) 4,500 4,500 4,400 4,200 4,400 4,500 4,400 -
(B) Characteristics of householdsI. No. of households ('000)
(i) Economic characteristicsEconomically active 4.1 2.8 13.7 6.5 9.1 15.6 230.1 1 969.0
(28.0%) (29.5%) (35.0%) (40.5%) (35.6%) (39.3%) (42.6%) (82.5%) Working 3.5 2.2 12.6 6.0 8.3 13.8 205.7 1 938.0
(24.1%) (23.2%) (32.2%) (37.2%) (32.2%) (34.6%) (38.0%) (81.2%) Unemployed 0.6 0.6 1.1 0.5 0.9 1.9 24.4 30.9
(3.9%) (6.3%) (2.8%) (3.3%) (3.4%) (4.7%) (4.5%) (1.3%) Economically inactive 10.4 6.8 25.5 9.5 16.5 24.2 310.6 417.5
(72.0%) (70.5%) (65.0%) (59.5%) (64.4%) (60.7%) (57.4%) (17.5%) (ii) Whether receiving CSSA or notYes 1.7 1.4 10.9 4.6 7.0 17.8 194.8 200.4
(11.7%) (14.3%) (27.8%) (28.8%) (27.2%) (44.8%) (36.0%) (8.4%) No 12.8 8.3 28.3 11.4 18.7 22.0 345.8 2 186.1
(88.3%) (85.7%) (72.2%) (71.2%) (72.8%) (55.2%) (64.0%) (91.6%) Reason: no financial needs 9.0 4.9 14.7 5.6 10.0 10.2 168.7 175.6
(62.4%) (50.4%) (37.6%) (34.8%) (39.0%) (25.7%) (31.2%) (7.4%) 0.6 0.8 2.0 0.5 1.6 2.1 24.1 24.8
(3.8%) (8.0%) (5.2%) (3.2%) (6.2%) (5.2%) (4.5%) (1.0%) (iii) Housing characteristicsPublic rental housing 1.1 - 15.9 9.4 1.5 22.7 289.3 727.7
(7.8%) - (40.5%) (58.5%) (5.7%) (57.0%) (53.5%) (30.5%) Subsidised sale flats - - 4.4 2.4 0.7 1.5 60.9 375.8
- - (11.2%) (14.7%) (2.7%) (3.7%) (11.3%) (15.7%) with mortgages or loans - - 0.7 0.6 § 0.4 7.9 108.1
- - (1.9%) (3.5%) § (1.0%) (1.5%) (4.5%) Private permanent housing 13.3 9.6 18.9 4.1 23.3 15.5 185.4 1 267.6
(92.2%) (99.6%) (48.1%) (25.4%) (90.9%) (39.0%) (34.3%) (53.1%) Owner-occupiers 10.3 7.4 14.3 3.2 15.6 8.6 131.6 866.7
(71.2%) (76.7%) (36.6%) (19.8%) (60.7%) (21.5%) (24.3%) (36.3%) - with mortgages or loans 0.4 § 0.8 0.6 0.7 1.0 12.0 344.8
(2.9%) § (2.1%) (3.9%) (2.6%) (2.5%) (2.2%) (14.4%) Tenants 2.1 1.6 2.9 0.6 6.7 5.9 39.5 315.8
(14.7%) (16.4%) (7.4%) (3.6%) (26.0%) (14.8%) (7.3%) (13.2%) - in rooms / bedspaces / cocklofts 0.4 0.7 0.4 § 1.6 1.0 5.4 12.5
(2.8%) (7.0%) (1.0%) § (6.3%) (2.5%) (1.0%) (0.5%) Temporary housing § § § § § § 5.0 15.4
§ § § § § § (0.9%) (0.6%) (iv) Other characteristicsWith FDH(s) 0.9 1.2 1.7 0.7 1.5 0.9 15.9 247.2
(6.2%) (12.6%) (4.3%) (4.1%) (5.8%) (2.2%) (2.9%) (10.4%) With new arrival(s) 0.5 § 1.5 0.4 1.6 3.7 34.1 86.9
(3.4%) § (3.8%) (2.5%) (6.2%) (9.4%) (6.3%) (3.6%) With children 2.2 1.4 8.2 3.7 7.0 11.8 167.9 740.4
(14.9%) (14.6%) (21.0%) (23.4%) (27.2%) (29.7%) (31.1%) (31.0%) II. Other household characteristics
Average household size 2.1 2.0 2.3 2.4 2.2 2.4 2.4 2.8Average no. of economically active members 0.4 0.4 0.4 0.5 0.4 0.5 0.5 1.5Median monthly household income (HK$) 1,100 @ 3,000 3,500 2,000 2,400 3,000 20,000
Before policy intervention
Reason: income and assets tests notpassed
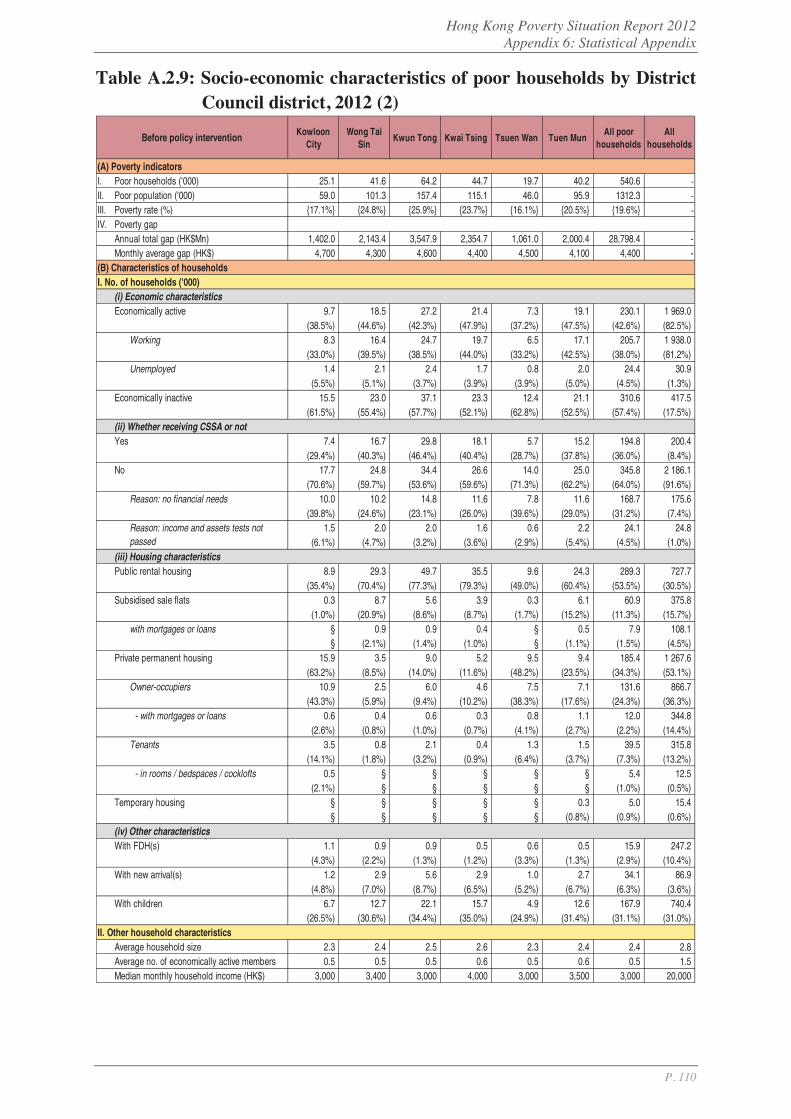
Hong Kong Poverty Situation Report 2012 Appendix 6: Statistical Appendix
P. 110
Table A.2.9: Socio-economic characteristics of poor households by District Council district, 2012 (2)
KowloonCity
Wong TaiSin
Kwun Tong Kwai Tsing Tsuen Wan Tuen MunAll poor
householdsAll
households
(A) Poverty indicatorsI. Poor households ('000) 25.1 41.6 64.2 44.7 19.7 40.2 540.6 -II. Poor population ('000) 59.0 101.3 157.4 115.1 46.0 95.9 1312.3 -III. Poverty rate (%) {17.1%} {24.8%} {25.9%} {23.7%} {16.1%} {20.5%} {19.6%} -IV. Poverty gap
Annual total gap (HK$Mn) 1,402.0 2,143.4 3,547.9 2,354.7 1,061.0 2,000.4 28,798.4 -Monthly average gap (HK$) 4,700 4,300 4,600 4,400 4,500 4,100 4,400 -
(B) Characteristics of householdsI. No. of households ('000)
(i) Economic characteristicsEconomically active 9.7 18.5 27.2 21.4 7.3 19.1 230.1 1 969.0
(38.5%) (44.6%) (42.3%) (47.9%) (37.2%) (47.5%) (42.6%) (82.5%) Working 8.3 16.4 24.7 19.7 6.5 17.1 205.7 1 938.0
(33.0%) (39.5%) (38.5%) (44.0%) (33.2%) (42.5%) (38.0%) (81.2%) Unemployed 1.4 2.1 2.4 1.7 0.8 2.0 24.4 30.9
(5.5%) (5.1%) (3.7%) (3.9%) (3.9%) (5.0%) (4.5%) (1.3%) Economically inactive 15.5 23.0 37.1 23.3 12.4 21.1 310.6 417.5
(61.5%) (55.4%) (57.7%) (52.1%) (62.8%) (52.5%) (57.4%) (17.5%) (ii) Whether receiving CSSA or notYes 7.4 16.7 29.8 18.1 5.7 15.2 194.8 200.4
(29.4%) (40.3%) (46.4%) (40.4%) (28.7%) (37.8%) (36.0%) (8.4%) No 17.7 24.8 34.4 26.6 14.0 25.0 345.8 2 186.1
(70.6%) (59.7%) (53.6%) (59.6%) (71.3%) (62.2%) (64.0%) (91.6%) Reason: no financial needs 10.0 10.2 14.8 11.6 7.8 11.6 168.7 175.6
(39.8%) (24.6%) (23.1%) (26.0%) (39.6%) (29.0%) (31.2%) (7.4%) 1.5 2.0 2.0 1.6 0.6 2.2 24.1 24.8
(6.1%) (4.7%) (3.2%) (3.6%) (2.9%) (5.4%) (4.5%) (1.0%) (iii) Housing characteristicsPublic rental housing 8.9 29.3 49.7 35.5 9.6 24.3 289.3 727.7
(35.4%) (70.4%) (77.3%) (79.3%) (49.0%) (60.4%) (53.5%) (30.5%) Subsidised sale flats 0.3 8.7 5.6 3.9 0.3 6.1 60.9 375.8
(1.0%) (20.9%) (8.6%) (8.7%) (1.7%) (15.2%) (11.3%) (15.7%) with mortgages or loans § 0.9 0.9 0.4 § 0.5 7.9 108.1
§ (2.1%) (1.4%) (1.0%) § (1.1%) (1.5%) (4.5%) Private permanent housing 15.9 3.5 9.0 5.2 9.5 9.4 185.4 1 267.6
(63.2%) (8.5%) (14.0%) (11.6%) (48.2%) (23.5%) (34.3%) (53.1%) Owner-occupiers 10.9 2.5 6.0 4.6 7.5 7.1 131.6 866.7
(43.3%) (5.9%) (9.4%) (10.2%) (38.3%) (17.6%) (24.3%) (36.3%) - with mortgages or loans 0.6 0.4 0.6 0.3 0.8 1.1 12.0 344.8
(2.6%) (0.8%) (1.0%) (0.7%) (4.1%) (2.7%) (2.2%) (14.4%) Tenants 3.5 0.8 2.1 0.4 1.3 1.5 39.5 315.8
(14.1%) (1.8%) (3.2%) (0.9%) (6.4%) (3.7%) (7.3%) (13.2%) - in rooms / bedspaces / cocklofts 0.5 § § § § § 5.4 12.5
(2.1%) § § § § § (1.0%) (0.5%) Temporary housing § § § § § 0.3 5.0 15.4
§ § § § § (0.8%) (0.9%) (0.6%) (iv) Other characteristicsWith FDH(s) 1.1 0.9 0.9 0.5 0.6 0.5 15.9 247.2
(4.3%) (2.2%) (1.3%) (1.2%) (3.3%) (1.3%) (2.9%) (10.4%) With new arrival(s) 1.2 2.9 5.6 2.9 1.0 2.7 34.1 86.9
(4.8%) (7.0%) (8.7%) (6.5%) (5.2%) (6.7%) (6.3%) (3.6%) With children 6.7 12.7 22.1 15.7 4.9 12.6 167.9 740.4
(26.5%) (30.6%) (34.4%) (35.0%) (24.9%) (31.4%) (31.1%) (31.0%) II. Other household characteristics
Average household size 2.3 2.4 2.5 2.6 2.3 2.4 2.4 2.8Average no. of economically active members 0.5 0.5 0.5 0.6 0.5 0.6 0.5 1.5Median monthly household income (HK$) 3,000 3,400 3,000 4,000 3,000 3,500 3,000 20,000
Before policy intervention
Reason: income and assets tests notpassed
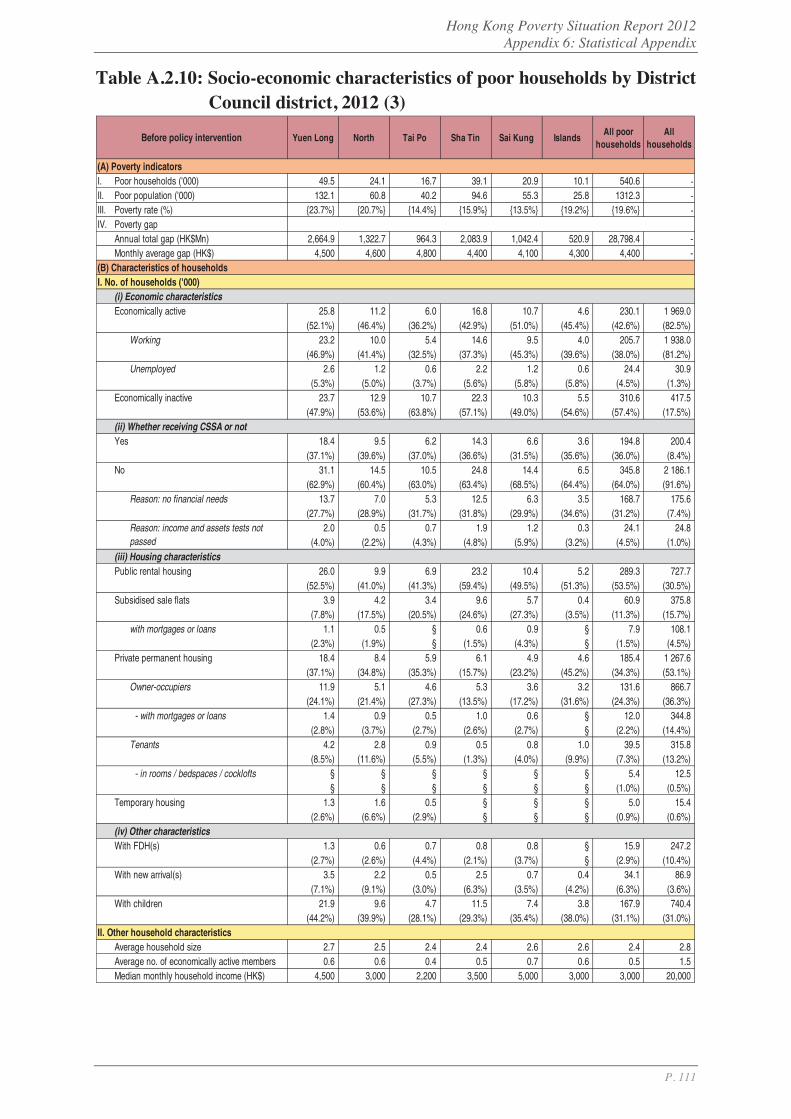
Hong Kong Poverty Situation Report 2012 Appendix 6: Statistical Appendix
P. 111
Table A.2.10: Socio-economic characteristics of poor households by District Council district, 2012 (3)
Yuen Long North Tai Po Sha Tin Sai Kung IslandsAll poor
householdsAll
households
(A) Poverty indicatorsI. Poor households ('000) 49.5 24.1 16.7 39.1 20.9 10.1 540.6 -II. Poor population ('000) 132.1 60.8 40.2 94.6 55.3 25.8 1312.3 -III. Poverty rate (%) {23.7%} {20.7%} {14.4%} {15.9%} {13.5%} {19.2%} {19.6%} -IV. Poverty gap
Annual total gap (HK$Mn) 2,664.9 1,322.7 964.3 2,083.9 1,042.4 520.9 28,798.4 -Monthly average gap (HK$) 4,500 4,600 4,800 4,400 4,100 4,300 4,400 -
(B) Characteristics of householdsI. No. of households ('000)
(i) Economic characteristicsEconomically active 25.8 11.2 6.0 16.8 10.7 4.6 230.1 1 969.0
(52.1%) (46.4%) (36.2%) (42.9%) (51.0%) (45.4%) (42.6%) (82.5%) Working 23.2 10.0 5.4 14.6 9.5 4.0 205.7 1 938.0
(46.9%) (41.4%) (32.5%) (37.3%) (45.3%) (39.6%) (38.0%) (81.2%) Unemployed 2.6 1.2 0.6 2.2 1.2 0.6 24.4 30.9
(5.3%) (5.0%) (3.7%) (5.6%) (5.8%) (5.8%) (4.5%) (1.3%) Economically inactive 23.7 12.9 10.7 22.3 10.3 5.5 310.6 417.5
(47.9%) (53.6%) (63.8%) (57.1%) (49.0%) (54.6%) (57.4%) (17.5%) (ii) Whether receiving CSSA or notYes 18.4 9.5 6.2 14.3 6.6 3.6 194.8 200.4
(37.1%) (39.6%) (37.0%) (36.6%) (31.5%) (35.6%) (36.0%) (8.4%) No 31.1 14.5 10.5 24.8 14.4 6.5 345.8 2 186.1
(62.9%) (60.4%) (63.0%) (63.4%) (68.5%) (64.4%) (64.0%) (91.6%) Reason: no financial needs 13.7 7.0 5.3 12.5 6.3 3.5 168.7 175.6
(27.7%) (28.9%) (31.7%) (31.8%) (29.9%) (34.6%) (31.2%) (7.4%) 2.0 0.5 0.7 1.9 1.2 0.3 24.1 24.8
(4.0%) (2.2%) (4.3%) (4.8%) (5.9%) (3.2%) (4.5%) (1.0%) (iii) Housing characteristicsPublic rental housing 26.0 9.9 6.9 23.2 10.4 5.2 289.3 727.7
(52.5%) (41.0%) (41.3%) (59.4%) (49.5%) (51.3%) (53.5%) (30.5%) Subsidised sale flats 3.9 4.2 3.4 9.6 5.7 0.4 60.9 375.8
(7.8%) (17.5%) (20.5%) (24.6%) (27.3%) (3.5%) (11.3%) (15.7%) with mortgages or loans 1.1 0.5 § 0.6 0.9 § 7.9 108.1
(2.3%) (1.9%) § (1.5%) (4.3%) § (1.5%) (4.5%) Private permanent housing 18.4 8.4 5.9 6.1 4.9 4.6 185.4 1 267.6
(37.1%) (34.8%) (35.3%) (15.7%) (23.2%) (45.2%) (34.3%) (53.1%) Owner-occupiers 11.9 5.1 4.6 5.3 3.6 3.2 131.6 866.7
(24.1%) (21.4%) (27.3%) (13.5%) (17.2%) (31.6%) (24.3%) (36.3%) - with mortgages or loans 1.4 0.9 0.5 1.0 0.6 § 12.0 344.8
(2.8%) (3.7%) (2.7%) (2.6%) (2.7%) § (2.2%) (14.4%) Tenants 4.2 2.8 0.9 0.5 0.8 1.0 39.5 315.8
(8.5%) (11.6%) (5.5%) (1.3%) (4.0%) (9.9%) (7.3%) (13.2%) - in rooms / bedspaces / cocklofts § § § § § § 5.4 12.5
§ § § § § § (1.0%) (0.5%) Temporary housing 1.3 1.6 0.5 § § § 5.0 15.4
(2.6%) (6.6%) (2.9%) § § § (0.9%) (0.6%) (iv) Other characteristicsWith FDH(s) 1.3 0.6 0.7 0.8 0.8 § 15.9 247.2
(2.7%) (2.6%) (4.4%) (2.1%) (3.7%) § (2.9%) (10.4%) With new arrival(s) 3.5 2.2 0.5 2.5 0.7 0.4 34.1 86.9
(7.1%) (9.1%) (3.0%) (6.3%) (3.5%) (4.2%) (6.3%) (3.6%) With children 21.9 9.6 4.7 11.5 7.4 3.8 167.9 740.4
(44.2%) (39.9%) (28.1%) (29.3%) (35.4%) (38.0%) (31.1%) (31.0%) II. Other household characteristics
Average household size 2.7 2.5 2.4 2.4 2.6 2.6 2.4 2.8Average no. of economically active members 0.6 0.6 0.4 0.5 0.7 0.6 0.5 1.5Median monthly household income (HK$) 4,500 3,000 2,200 3,500 5,000 3,000 3,000 20,000
Before policy intervention
Reason: income and assets tests notpassed
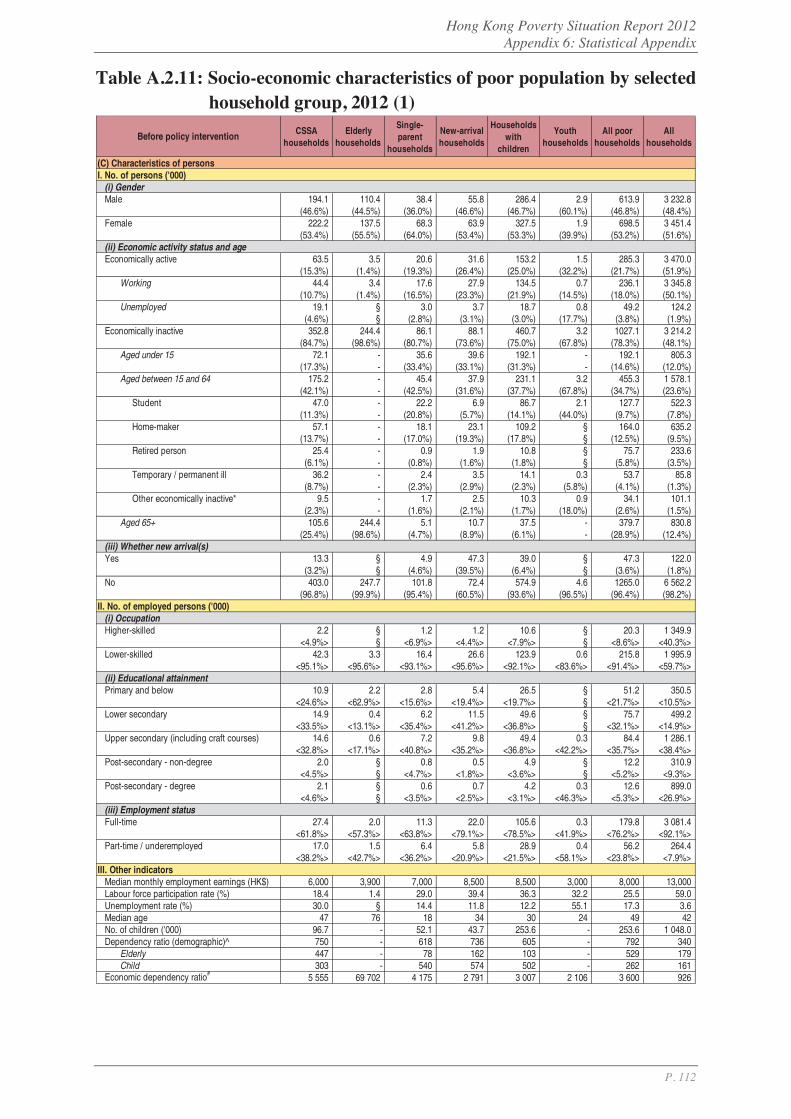
Hong Kong Poverty Situation Report 2012 Appendix 6: Statistical Appendix
P. 112
Table A.2.11: Socio-economic characteristics of poor population by selected household group, 2012 (1)
CSSAhouseholds
Elderlyhouseholds
Single-parent
households
New-arrivalhouseholds
Householdswith
children
Youthhouseholds
All poorhouseholds
Allhouseholds
(C) Characteristics of personsI. No. of persons ('000)
(i) Gender Male 194.1 110.4 38.4 55.8 286.4 2.9 613.9 3 232.8
(46.6%) (44.5%) (36.0%) (46.6%) (46.7%) (60.1%) (46.8%) (48.4%) Female 222.2 137.5 68.3 63.9 327.5 1.9 698.5 3 451.4
(53.4%) (55.5%) (64.0%) (53.4%) (53.3%) (39.9%) (53.2%) (51.6%) (ii) Economic activity status and ageEconomically active 63.5 3.5 20.6 31.6 153.2 1.5 285.3 3 470.0
(15.3%) (1.4%) (19.3%) (26.4%) (25.0%) (32.2%) (21.7%) (51.9%) Working 44.4 3.4 17.6 27.9 134.5 0.7 236.1 3 345.8
(10.7%) (1.4%) (16.5%) (23.3%) (21.9%) (14.5%) (18.0%) (50.1%) Unemployed 19.1 § 3.0 3.7 18.7 0.8 49.2 124.2
(4.6%) § (2.8%) (3.1%) (3.0%) (17.7%) (3.8%) (1.9%) Economically inactive 352.8 244.4 86.1 88.1 460.7 3.2 1027.1 3 214.2
(84.7%) (98.6%) (80.7%) (73.6%) (75.0%) (67.8%) (78.3%) (48.1%) Aged under 15 72.1 - 35.6 39.6 192.1 - 192.1 805.3
(17.3%) - (33.4%) (33.1%) (31.3%) - (14.6%) (12.0%) Aged between 15 and 64 175.2 - 45.4 37.9 231.1 3.2 455.3 1 578.1
(42.1%) - (42.5%) (31.6%) (37.7%) (67.8%) (34.7%) (23.6%) Student 47.0 - 22.2 6.9 86.7 2.1 127.7 522.3
(11.3%) - (20.8%) (5.7%) (14.1%) (44.0%) (9.7%) (7.8%) Home-maker 57.1 - 18.1 23.1 109.2 § 164.0 635.2
(13.7%) - (17.0%) (19.3%) (17.8%) § (12.5%) (9.5%) Retired person 25.4 - 0.9 1.9 10.8 § 75.7 233.6
(6.1%) - (0.8%) (1.6%) (1.8%) § (5.8%) (3.5%) Temporary / permanent ill 36.2 - 2.4 3.5 14.1 0.3 53.7 85.8
(8.7%) - (2.3%) (2.9%) (2.3%) (5.8%) (4.1%) (1.3%) Other economically inactive* 9.5 - 1.7 2.5 10.3 0.9 34.1 101.1
(2.3%) - (1.6%) (2.1%) (1.7%) (18.0%) (2.6%) (1.5%) Aged 65+ 105.6 244.4 5.1 10.7 37.5 - 379.7 830.8
(25.4%) (98.6%) (4.7%) (8.9%) (6.1%) - (28.9%) (12.4%) (iii) Whether new arrival(s)Yes 13.3 § 4.9 47.3 39.0 § 47.3 122.0
(3.2%) § (4.6%) (39.5%) (6.4%) § (3.6%) (1.8%) No 403.0 247.7 101.8 72.4 574.9 4.6 1265.0 6 562.2
(96.8%) (99.9%) (95.4%) (60.5%) (93.6%) (96.5%) (96.4%) (98.2%) II. No. of employed persons ('000)
(i) OccupationHigher-skilled 2.2 § 1.2 1.2 10.6 § 20.3 1 349.9
<4.9%> § <6.9%> <4.4%> <7.9%> § <8.6%> <40.3%> Lower-skilled 42.3 3.3 16.4 26.6 123.9 0.6 215.8 1 995.9
<95.1%> <95.6%> <93.1%> <95.6%> <92.1%> <83.6%> <91.4%> <59.7%> (ii) Educational attainmentPrimary and below 10.9 2.2 2.8 5.4 26.5 § 51.2 350.5
<24.6%> <62.9%> <15.6%> <19.4%> <19.7%> § <21.7%> <10.5%> Lower secondary 14.9 0.4 6.2 11.5 49.6 § 75.7 499.2
<33.5%> <13.1%> <35.4%> <41.2%> <36.8%> § <32.1%> <14.9%> Upper secondary (including craft courses) 14.6 0.6 7.2 9.8 49.4 0.3 84.4 1 286.1
<32.8%> <17.1%> <40.8%> <35.2%> <36.8%> <42.2%> <35.7%> <38.4%> Post-secondary - non-degree 2.0 § 0.8 0.5 4.9 § 12.2 310.9
<4.5%> § <4.7%> <1.8%> <3.6%> § <5.2%> <9.3%> Post-secondary - degree 2.1 § 0.6 0.7 4.2 0.3 12.6 899.0
<4.6%> § <3.5%> <2.5%> <3.1%> <46.3%> <5.3%> <26.9%> (iii) Employment statusFull-time 27.4 2.0 11.3 22.0 105.6 0.3 179.8 3 081.4
<61.8%> <57.3%> <63.8%> <79.1%> <78.5%> <41.9%> <76.2%> <92.1%> Part-time / underemployed 17.0 1.5 6.4 5.8 28.9 0.4 56.2 264.4
<38.2%> <42.7%> <36.2%> <20.9%> <21.5%> <58.1%> <23.8%> <7.9%> III. Other indicators
Median monthly employment earnings (HK$) 6,000 3,900 7,000 8,500 8,500 3,000 8,000 13,000Labour force participation rate (%) 18.4 1.4 29.0 39.4 36.3 32.2 25.5 59.0Unemployment rate (%) 30.0 § 14.4 11.8 12.2 55.1 17.3 3.6Median age 47 76 18 34 30 24 49 42No. of children ('000) 96.7 - 52.1 43.7 253.6 - 253.6 1 048.0 Dependency ratio (demographic)^ 750 - 618 736 605 - 792 340
Elderly 447 - 78 162 103 - 529 179 Child 303 - 540 574 502 - 262 161
Economic dependency ratio# 5 555 69 702 4 175 2 791 3 007 2 106 3 600 926
Before policy intervention
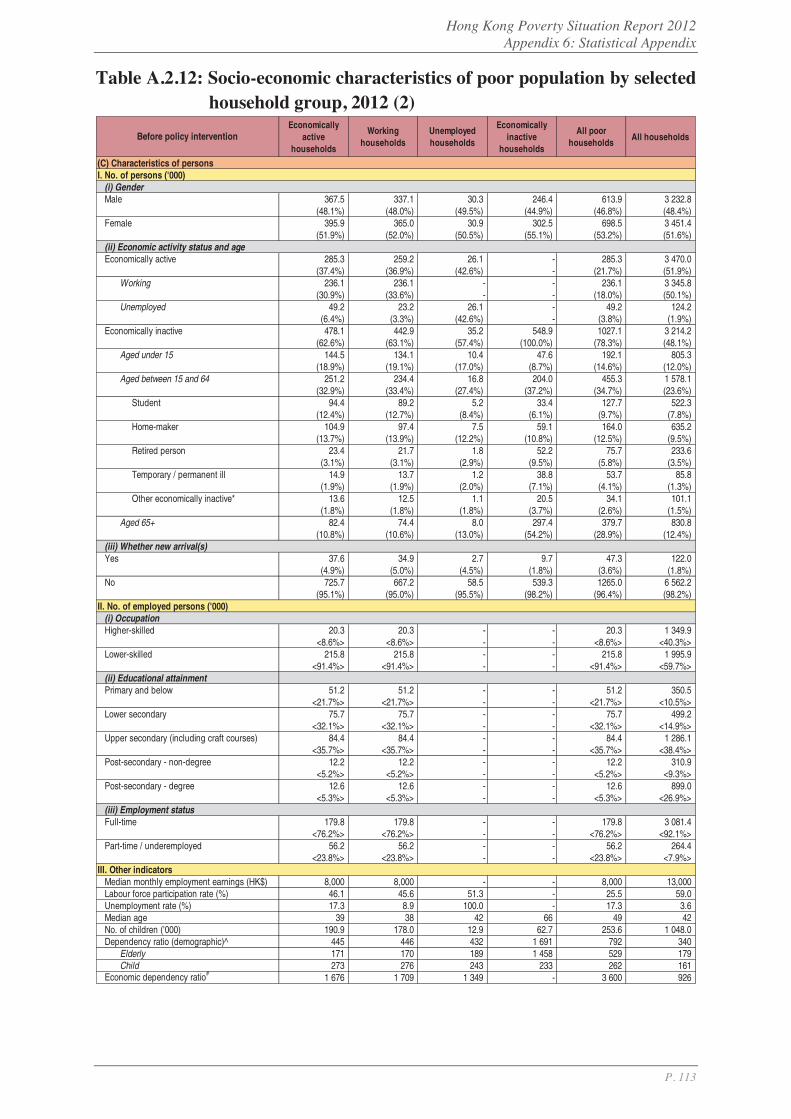
Hong Kong Poverty Situation Report 2012 Appendix 6: Statistical Appendix
P. 113
Table A.2.12: Socio-economic characteristics of poor population by selected household group, 2012 (2)
Economicallyactive
households
Workinghouseholds
Unemployedhouseholds
Economicallyinactive
households
All poorhouseholds
All households
(C) Characteristics of personsI. No. of persons ('000)
(i) Gender Male 367.5 337.1 30.3 246.4 613.9 3 232.8
(48.1%) (48.0%) (49.5%) (44.9%) (46.8%) (48.4%) Female 395.9 365.0 30.9 302.5 698.5 3 451.4
(51.9%) (52.0%) (50.5%) (55.1%) (53.2%) (51.6%) (ii) Economic activity status and ageEconomically active 285.3 259.2 26.1 - 285.3 3 470.0
(37.4%) (36.9%) (42.6%) - (21.7%) (51.9%) Working 236.1 236.1 - - 236.1 3 345.8
(30.9%) (33.6%) - - (18.0%) (50.1%) Unemployed 49.2 23.2 26.1 - 49.2 124.2
(6.4%) (3.3%) (42.6%) - (3.8%) (1.9%) Economically inactive 478.1 442.9 35.2 548.9 1027.1 3 214.2
(62.6%) (63.1%) (57.4%) (100.0%) (78.3%) (48.1%) Aged under 15 144.5 134.1 10.4 47.6 192.1 805.3
(18.9%) (19.1%) (17.0%) (8.7%) (14.6%) (12.0%) Aged between 15 and 64 251.2 234.4 16.8 204.0 455.3 1 578.1
(32.9%) (33.4%) (27.4%) (37.2%) (34.7%) (23.6%) Student 94.4 89.2 5.2 33.4 127.7 522.3
(12.4%) (12.7%) (8.4%) (6.1%) (9.7%) (7.8%) Home-maker 104.9 97.4 7.5 59.1 164.0 635.2
(13.7%) (13.9%) (12.2%) (10.8%) (12.5%) (9.5%) Retired person 23.4 21.7 1.8 52.2 75.7 233.6
(3.1%) (3.1%) (2.9%) (9.5%) (5.8%) (3.5%) Temporary / permanent ill 14.9 13.7 1.2 38.8 53.7 85.8
(1.9%) (1.9%) (2.0%) (7.1%) (4.1%) (1.3%) Other economically inactive* 13.6 12.5 1.1 20.5 34.1 101.1
(1.8%) (1.8%) (1.8%) (3.7%) (2.6%) (1.5%) Aged 65+ 82.4 74.4 8.0 297.4 379.7 830.8
(10.8%) (10.6%) (13.0%) (54.2%) (28.9%) (12.4%) (iii) Whether new arrival(s)Yes 37.6 34.9 2.7 9.7 47.3 122.0
(4.9%) (5.0%) (4.5%) (1.8%) (3.6%) (1.8%) No 725.7 667.2 58.5 539.3 1265.0 6 562.2
(95.1%) (95.0%) (95.5%) (98.2%) (96.4%) (98.2%) II. No. of employed persons ('000)
(i) OccupationHigher-skilled 20.3 20.3 - - 20.3 1 349.9
<8.6%> <8.6%> - - <8.6%> <40.3%> Lower-skilled 215.8 215.8 - - 215.8 1 995.9
<91.4%> <91.4%> - - <91.4%> <59.7%> (ii) Educational attainmentPrimary and below 51.2 51.2 - - 51.2 350.5
<21.7%> <21.7%> - - <21.7%> <10.5%> Lower secondary 75.7 75.7 - - 75.7 499.2
<32.1%> <32.1%> - - <32.1%> <14.9%> Upper secondary (including craft courses) 84.4 84.4 - - 84.4 1 286.1
<35.7%> <35.7%> - - <35.7%> <38.4%> Post-secondary - non-degree 12.2 12.2 - - 12.2 310.9
<5.2%> <5.2%> - - <5.2%> <9.3%> Post-secondary - degree 12.6 12.6 - - 12.6 899.0
<5.3%> <5.3%> - - <5.3%> <26.9%> (iii) Employment statusFull-time 179.8 179.8 - - 179.8 3 081.4
<76.2%> <76.2%> - - <76.2%> <92.1%> Part-time / underemployed 56.2 56.2 - - 56.2 264.4
<23.8%> <23.8%> - - <23.8%> <7.9%> III. Other indicators
Median monthly employment earnings (HK$) 8,000 8,000 - - 8,000 13,000Labour force participation rate (%) 46.1 45.6 51.3 - 25.5 59.0Unemployment rate (%) 17.3 8.9 100.0 - 17.3 3.6Median age 39 38 42 66 49 42No. of children ('000) 190.9 178.0 12.9 62.7 253.6 1 048.0 Dependency ratio (demographic)^ 445 446 432 1 691 792 340
Elderly 171 170 189 1 458 529 179 Child 273 276 243 233 262 161
Economic dependency ratio# 1 676 1 709 1 349 - 3 600 926
Before policy intervention
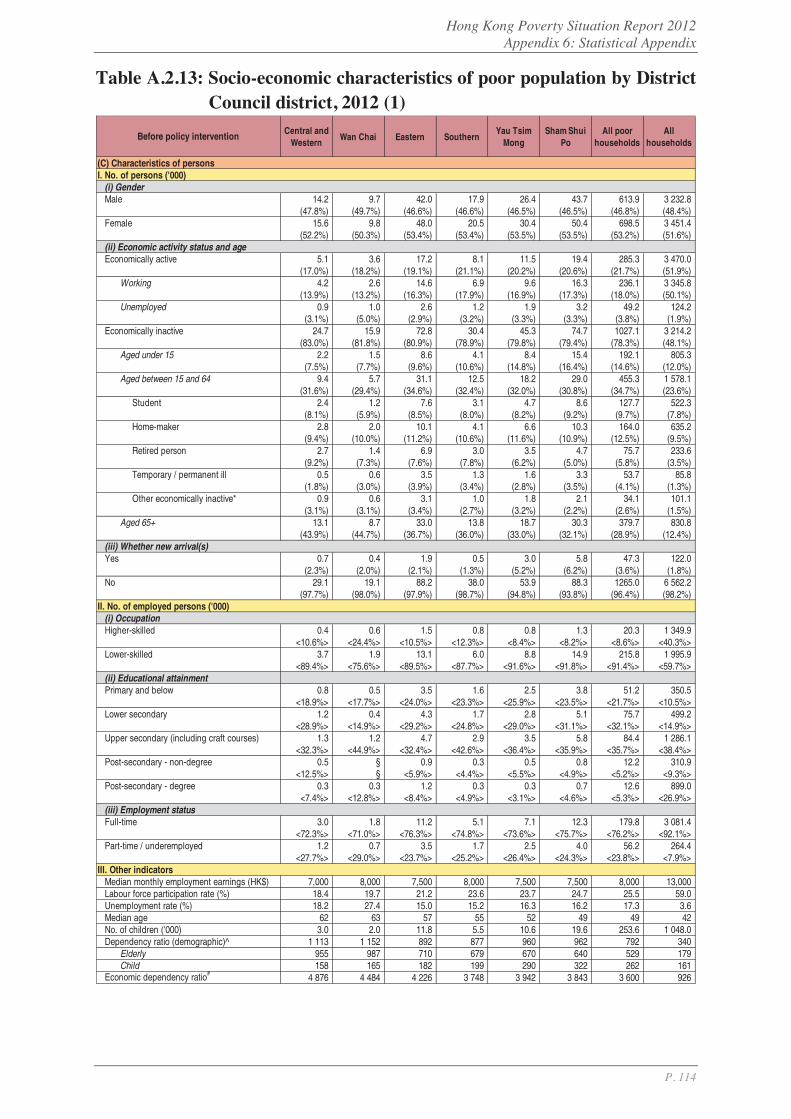
Hong Kong Poverty Situation Report 2012 Appendix 6: Statistical Appendix
P. 114
Table A.2.13: Socio-economic characteristics of poor population by District Council district, 2012 (1)
Central andWestern
Wan Chai Eastern SouthernYau Tsim
MongSham Shui
PoAll poor
householdsAll
households
(C) Characteristics of personsI. No. of persons ('000)
(i) Gender Male 14.2 9.7 42.0 17.9 26.4 43.7 613.9 3 232.8
(47.8%) (49.7%) (46.6%) (46.6%) (46.5%) (46.5%) (46.8%) (48.4%) Female 15.6 9.8 48.0 20.5 30.4 50.4 698.5 3 451.4
(52.2%) (50.3%) (53.4%) (53.4%) (53.5%) (53.5%) (53.2%) (51.6%) (ii) Economic activity status and ageEconomically active 5.1 3.6 17.2 8.1 11.5 19.4 285.3 3 470.0
(17.0%) (18.2%) (19.1%) (21.1%) (20.2%) (20.6%) (21.7%) (51.9%) Working 4.2 2.6 14.6 6.9 9.6 16.3 236.1 3 345.8
(13.9%) (13.2%) (16.3%) (17.9%) (16.9%) (17.3%) (18.0%) (50.1%) Unemployed 0.9 1.0 2.6 1.2 1.9 3.2 49.2 124.2
(3.1%) (5.0%) (2.9%) (3.2%) (3.3%) (3.3%) (3.8%) (1.9%) Economically inactive 24.7 15.9 72.8 30.4 45.3 74.7 1027.1 3 214.2
(83.0%) (81.8%) (80.9%) (78.9%) (79.8%) (79.4%) (78.3%) (48.1%) Aged under 15 2.2 1.5 8.6 4.1 8.4 15.4 192.1 805.3
(7.5%) (7.7%) (9.6%) (10.6%) (14.8%) (16.4%) (14.6%) (12.0%) Aged between 15 and 64 9.4 5.7 31.1 12.5 18.2 29.0 455.3 1 578.1
(31.6%) (29.4%) (34.6%) (32.4%) (32.0%) (30.8%) (34.7%) (23.6%) Student 2.4 1.2 7.6 3.1 4.7 8.6 127.7 522.3
(8.1%) (5.9%) (8.5%) (8.0%) (8.2%) (9.2%) (9.7%) (7.8%) Home-maker 2.8 2.0 10.1 4.1 6.6 10.3 164.0 635.2
(9.4%) (10.0%) (11.2%) (10.6%) (11.6%) (10.9%) (12.5%) (9.5%) Retired person 2.7 1.4 6.9 3.0 3.5 4.7 75.7 233.6
(9.2%) (7.3%) (7.6%) (7.8%) (6.2%) (5.0%) (5.8%) (3.5%) Temporary / permanent ill 0.5 0.6 3.5 1.3 1.6 3.3 53.7 85.8
(1.8%) (3.0%) (3.9%) (3.4%) (2.8%) (3.5%) (4.1%) (1.3%) Other economically inactive* 0.9 0.6 3.1 1.0 1.8 2.1 34.1 101.1
(3.1%) (3.1%) (3.4%) (2.7%) (3.2%) (2.2%) (2.6%) (1.5%) Aged 65+ 13.1 8.7 33.0 13.8 18.7 30.3 379.7 830.8
(43.9%) (44.7%) (36.7%) (36.0%) (33.0%) (32.1%) (28.9%) (12.4%) (iii) Whether new arrival(s)Yes 0.7 0.4 1.9 0.5 3.0 5.8 47.3 122.0
(2.3%) (2.0%) (2.1%) (1.3%) (5.2%) (6.2%) (3.6%) (1.8%) No 29.1 19.1 88.2 38.0 53.9 88.3 1265.0 6 562.2
(97.7%) (98.0%) (97.9%) (98.7%) (94.8%) (93.8%) (96.4%) (98.2%) II. No. of employed persons ('000)
(i) OccupationHigher-skilled 0.4 0.6 1.5 0.8 0.8 1.3 20.3 1 349.9
<10.6%> <24.4%> <10.5%> <12.3%> <8.4%> <8.2%> <8.6%> <40.3%> Lower-skilled 3.7 1.9 13.1 6.0 8.8 14.9 215.8 1 995.9
<89.4%> <75.6%> <89.5%> <87.7%> <91.6%> <91.8%> <91.4%> <59.7%> (ii) Educational attainmentPrimary and below 0.8 0.5 3.5 1.6 2.5 3.8 51.2 350.5
<18.9%> <17.7%> <24.0%> <23.3%> <25.9%> <23.5%> <21.7%> <10.5%> Lower secondary 1.2 0.4 4.3 1.7 2.8 5.1 75.7 499.2
<28.9%> <14.9%> <29.2%> <24.8%> <29.0%> <31.1%> <32.1%> <14.9%> Upper secondary (including craft courses) 1.3 1.2 4.7 2.9 3.5 5.8 84.4 1 286.1
<32.3%> <44.9%> <32.4%> <42.6%> <36.4%> <35.9%> <35.7%> <38.4%> Post-secondary - non-degree 0.5 § 0.9 0.3 0.5 0.8 12.2 310.9
<12.5%> § <5.9%> <4.4%> <5.5%> <4.9%> <5.2%> <9.3%> Post-secondary - degree 0.3 0.3 1.2 0.3 0.3 0.7 12.6 899.0
<7.4%> <12.8%> <8.4%> <4.9%> <3.1%> <4.6%> <5.3%> <26.9%> (iii) Employment statusFull-time 3.0 1.8 11.2 5.1 7.1 12.3 179.8 3 081.4
<72.3%> <71.0%> <76.3%> <74.8%> <73.6%> <75.7%> <76.2%> <92.1%> Part-time / underemployed 1.2 0.7 3.5 1.7 2.5 4.0 56.2 264.4
<27.7%> <29.0%> <23.7%> <25.2%> <26.4%> <24.3%> <23.8%> <7.9%> III. Other indicators
Median monthly employment earnings (HK$) 7,000 8,000 7,500 8,000 7,500 7,500 8,000 13,000Labour force participation rate (%) 18.4 19.7 21.2 23.6 23.7 24.7 25.5 59.0Unemployment rate (%) 18.2 27.4 15.0 15.2 16.3 16.2 17.3 3.6Median age 62 63 57 55 52 49 49 42No. of children ('000) 3.0 2.0 11.8 5.5 10.6 19.6 253.6 1 048.0 Dependency ratio (demographic)^ 1 113 1 152 892 877 960 962 792 340
Elderly 955 987 710 679 670 640 529 179 Child 158 165 182 199 290 322 262 161
Economic dependency ratio# 4 876 4 484 4 226 3 748 3 942 3 843 3 600 926
Before policy intervention

Hong Kong Poverty Situation Report 2012 Appendix 6: Statistical Appendix
P. 115
Table A.2.14: Socio-economic characteristics of poor population by District Council district, 2012 (2)
KowloonCity
Wong TaiSin
Kwun Tong Kwai Tsing Tsuen Wan Tuen MunAll poor
householdsAll
households
(C) Characteristics of personsI. No. of persons ('000)
(i) Gender Male 27.7 48.0 73.6 54.2 21.7 45.2 613.9 3 232.8
(47.0%) (47.4%) (46.7%) (47.1%) (47.1%) (47.1%) (46.8%) (48.4%) Female 31.3 53.3 83.8 60.9 24.4 50.7 698.5 3 451.4
(53.0%) (52.6%) (53.3%) (52.9%) (52.9%) (52.9%) (53.2%) (51.6%) (ii) Economic activity status and ageEconomically active 11.5 22.6 33.2 26.8 9.0 24.0 285.3 3 470.0
(19.4%) (22.4%) (21.1%) (23.3%) (19.5%) (25.0%) (21.7%) (51.9%) Working 9.2 18.6 27.9 22.6 7.6 19.6 236.1 3 345.8
(15.6%) (18.4%) (17.7%) (19.6%) (16.4%) (20.5%) (18.0%) (50.1%) Unemployed 2.3 4.0 5.2 4.2 1.4 4.4 49.2 124.2
(3.9%) (4.0%) (3.3%) (3.6%) (3.0%) (4.6%) (3.8%) (1.9%) Economically inactive 47.5 78.6 124.2 88.3 37.1 71.9 1027.1 3 214.2
(80.6%) (77.6%) (78.9%) (76.7%) (80.5%) (75.0%) (78.3%) (48.1%) Aged under 15 6.6 14.6 25.3 18.3 5.4 13.8 192.1 805.3
(11.2%) (14.4%) (16.1%) (15.9%) (11.6%) (14.4%) (14.6%) (12.0%) Aged between 15 and 64 20.6 32.1 52.9 39.8 14.9 36.3 455.3 1 578.1
(34.9%) (31.7%) (33.6%) (34.5%) (32.4%) (37.9%) (34.7%) (23.6%) Student 5.7 9.1 15.5 11.7 3.9 8.6 127.7 522.3
(9.7%) (9.0%) (9.8%) (10.2%) (8.6%) (9.0%) (9.7%) (7.8%) Home-maker 6.7 11.7 19.5 14.6 4.9 13.6 164.0 635.2
(11.4%) (11.5%) (12.4%) (12.6%) (10.7%) (14.1%) (12.5%) (9.5%) Retired person 4.3 4.2 7.3 5.8 3.4 6.8 75.7 233.6
(7.2%) (4.2%) (4.6%) (5.0%) (7.4%) (7.0%) (5.8%) (3.5%) Temporary / permanent ill 2.3 5.1 7.2 4.9 1.6 4.8 53.7 85.8
(3.8%) (5.0%) (4.6%) (4.2%) (3.4%) (5.0%) (4.1%) (1.3%) Other economically inactive* 1.6 2.0 3.4 2.8 1.1 2.6 34.1 101.1
(2.7%) (2.0%) (2.2%) (2.4%) (2.4%) (2.7%) (2.6%) (1.5%) Aged 65+ 20.3 32.0 46.1 30.3 16.8 21.8 379.7 830.8
(34.5%) (31.6%) (29.3%) (26.3%) (36.5%) (22.7%) (28.9%) (12.4%) (iii) Whether new arrival(s)Yes 1.5 3.7 7.5 4.2 1.5 3.7 47.3 122.0
(2.6%) (3.7%) (4.8%) (3.7%) (3.2%) (3.9%) (3.6%) (1.8%) No 57.5 97.6 149.9 110.8 44.6 92.2 1265.0 6 562.2
(97.4%) (96.3%) (95.2%) (96.3%) (96.8%) (96.1%) (96.4%) (98.2%) II. No. of employed persons ('000)
(i) OccupationHigher-skilled 0.8 1.2 2.2 1.8 0.9 1.3 20.3 1 349.9
<9.0%> <6.5%> <7.8%> <8.0%> <11.8%> <6.7%> <8.6%> <40.3%> Lower-skilled 8.4 17.4 25.7 20.8 6.7 18.3 215.8 1 995.9
<91.0%> <93.5%> <92.2%> <92.0%> <88.2%> <93.3%> <91.4%> <59.7%> (ii) Educational attainmentPrimary and below 2.1 4.4 5.9 4.9 1.2 4.6 51.2 350.5
<22.4%> <23.4%> <21.2%> <21.7%> <16.5%> <23.2%> <21.7%> <10.5%> Lower secondary 2.7 5.8 8.7 8.9 2.5 6.4 75.7 499.2
<29.0%> <31.4%> <31.1%> <39.5%> <33.5%> <32.6%> <32.1%> <14.9%> Upper secondary (including craft courses) 3.3 6.5 10.3 7.0 2.7 6.9 84.4 1 286.1
<35.5%> <34.7%> <36.8%> <30.9%> <35.1%> <35.3%> <35.7%> <38.4%> Post-secondary - non-degree 0.5 1.2 1.7 0.9 0.4 1.0 12.2 310.9
<5.0%> <6.2%> <6.2%> <4.0%> <5.3%> <4.8%> <5.2%> <9.3%> Post-secondary - degree 0.7 0.8 1.3 0.9 0.7 0.8 12.6 899.0
<8.1%> <4.3%> <4.7%> <4.0%> <9.6%> <4.0%> <5.3%> <26.9%> (iii) Employment statusFull-time 7.1 14.0 20.8 17.9 5.8 14.6 179.8 3 081.4
<77.9%> <75.4%> <74.7%> <79.2%> <77.1%> <74.2%> <76.2%> <92.1%> Part-time / underemployed 2.0 4.6 7.1 4.7 1.7 5.1 56.2 264.4
<22.1%> <24.6%> <25.3%> <20.8%> <22.9%> <25.8%> <23.8%> <7.9%> III. Other indicators
Median monthly employment earnings (HK$) 8,000 7,600 7,600 8,000 8,000 7,500 8,000 13,000Labour force participation rate (%) 21.9 26.1 25.1 27.7 22.0 29.2 25.5 59.0Unemployment rate (%) 20.0 17.7 15.8 15.7 15.6 18.2 17.3 3.6Median age 55 50 48 46 55 49 49 42No. of children ('000) 9.7 18.7 33.1 24.3 7.3 17.9 253.6 1 048.0 Dependency ratio (demographic)^ 868 863 856 753 939 601 792 340
Elderly 659 595 558 475 714 371 529 179 Child 209 268 298 278 225 230 262 161
Economic dependency ratio# 4 143 3 473 3 745 3 293 4 132 2 997 3 600 926
Before policy intervention
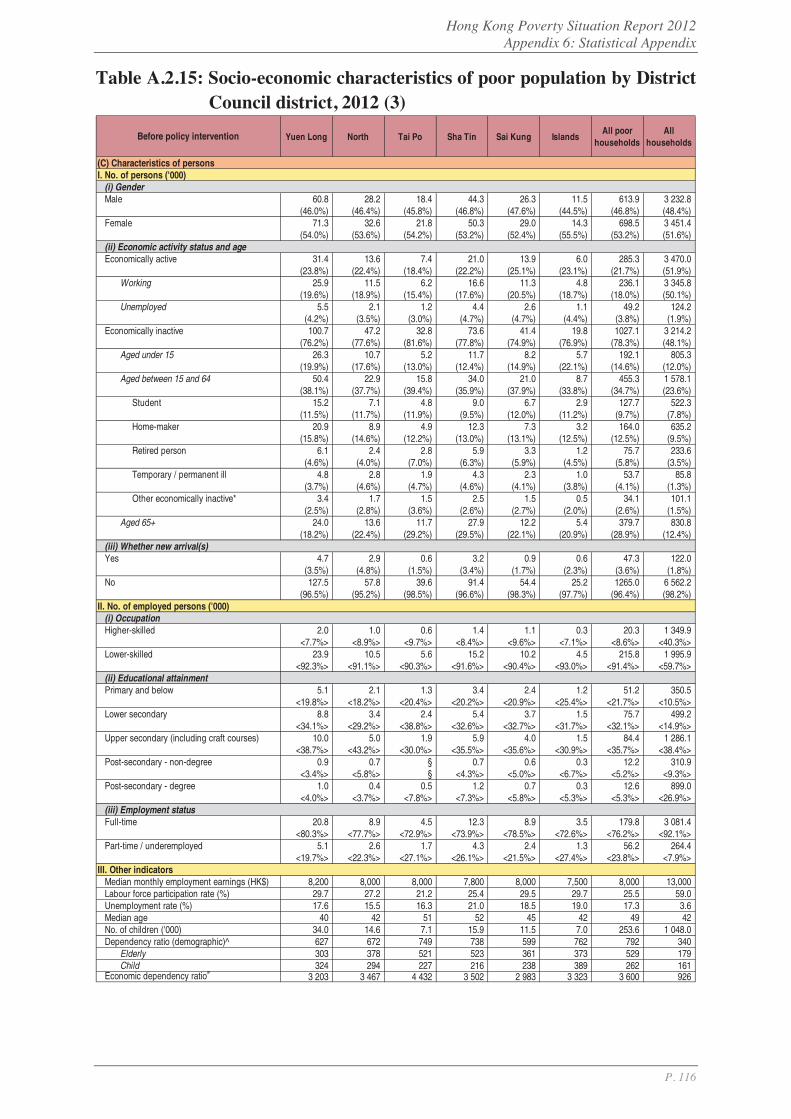
Hong Kong Poverty Situation Report 2012 Appendix 6: Statistical Appendix
P. 116
Table A.2.15: Socio-economic characteristics of poor population by District Council district, 2012 (3)
Yuen Long North Tai Po Sha Tin Sai Kung IslandsAll poor
householdsAll
households
(C) Characteristics of personsI. No. of persons ('000)
(i) Gender Male 60.8 28.2 18.4 44.3 26.3 11.5 613.9 3 232.8
(46.0%) (46.4%) (45.8%) (46.8%) (47.6%) (44.5%) (46.8%) (48.4%) Female 71.3 32.6 21.8 50.3 29.0 14.3 698.5 3 451.4
(54.0%) (53.6%) (54.2%) (53.2%) (52.4%) (55.5%) (53.2%) (51.6%) (ii) Economic activity status and ageEconomically active 31.4 13.6 7.4 21.0 13.9 6.0 285.3 3 470.0
(23.8%) (22.4%) (18.4%) (22.2%) (25.1%) (23.1%) (21.7%) (51.9%) Working 25.9 11.5 6.2 16.6 11.3 4.8 236.1 3 345.8
(19.6%) (18.9%) (15.4%) (17.6%) (20.5%) (18.7%) (18.0%) (50.1%) Unemployed 5.5 2.1 1.2 4.4 2.6 1.1 49.2 124.2
(4.2%) (3.5%) (3.0%) (4.7%) (4.7%) (4.4%) (3.8%) (1.9%) Economically inactive 100.7 47.2 32.8 73.6 41.4 19.8 1027.1 3 214.2
(76.2%) (77.6%) (81.6%) (77.8%) (74.9%) (76.9%) (78.3%) (48.1%) Aged under 15 26.3 10.7 5.2 11.7 8.2 5.7 192.1 805.3
(19.9%) (17.6%) (13.0%) (12.4%) (14.9%) (22.1%) (14.6%) (12.0%) Aged between 15 and 64 50.4 22.9 15.8 34.0 21.0 8.7 455.3 1 578.1
(38.1%) (37.7%) (39.4%) (35.9%) (37.9%) (33.8%) (34.7%) (23.6%) Student 15.2 7.1 4.8 9.0 6.7 2.9 127.7 522.3
(11.5%) (11.7%) (11.9%) (9.5%) (12.0%) (11.2%) (9.7%) (7.8%) Home-maker 20.9 8.9 4.9 12.3 7.3 3.2 164.0 635.2
(15.8%) (14.6%) (12.2%) (13.0%) (13.1%) (12.5%) (12.5%) (9.5%) Retired person 6.1 2.4 2.8 5.9 3.3 1.2 75.7 233.6
(4.6%) (4.0%) (7.0%) (6.3%) (5.9%) (4.5%) (5.8%) (3.5%) Temporary / permanent ill 4.8 2.8 1.9 4.3 2.3 1.0 53.7 85.8
(3.7%) (4.6%) (4.7%) (4.6%) (4.1%) (3.8%) (4.1%) (1.3%) Other economically inactive* 3.4 1.7 1.5 2.5 1.5 0.5 34.1 101.1
(2.5%) (2.8%) (3.6%) (2.6%) (2.7%) (2.0%) (2.6%) (1.5%) Aged 65+ 24.0 13.6 11.7 27.9 12.2 5.4 379.7 830.8
(18.2%) (22.4%) (29.2%) (29.5%) (22.1%) (20.9%) (28.9%) (12.4%) (iii) Whether new arrival(s)Yes 4.7 2.9 0.6 3.2 0.9 0.6 47.3 122.0
(3.5%) (4.8%) (1.5%) (3.4%) (1.7%) (2.3%) (3.6%) (1.8%) No 127.5 57.8 39.6 91.4 54.4 25.2 1265.0 6 562.2
(96.5%) (95.2%) (98.5%) (96.6%) (98.3%) (97.7%) (96.4%) (98.2%) II. No. of employed persons ('000)
(i) OccupationHigher-skilled 2.0 1.0 0.6 1.4 1.1 0.3 20.3 1 349.9
<7.7%> <8.9%> <9.7%> <8.4%> <9.6%> <7.1%> <8.6%> <40.3%> Lower-skilled 23.9 10.5 5.6 15.2 10.2 4.5 215.8 1 995.9
<92.3%> <91.1%> <90.3%> <91.6%> <90.4%> <93.0%> <91.4%> <59.7%> (ii) Educational attainmentPrimary and below 5.1 2.1 1.3 3.4 2.4 1.2 51.2 350.5
<19.8%> <18.2%> <20.4%> <20.2%> <20.9%> <25.4%> <21.7%> <10.5%> Lower secondary 8.8 3.4 2.4 5.4 3.7 1.5 75.7 499.2
<34.1%> <29.2%> <38.8%> <32.6%> <32.7%> <31.7%> <32.1%> <14.9%> Upper secondary (including craft courses) 10.0 5.0 1.9 5.9 4.0 1.5 84.4 1 286.1
<38.7%> <43.2%> <30.0%> <35.5%> <35.6%> <30.9%> <35.7%> <38.4%> Post-secondary - non-degree 0.9 0.7 § 0.7 0.6 0.3 12.2 310.9
<3.4%> <5.8%> § <4.3%> <5.0%> <6.7%> <5.2%> <9.3%> Post-secondary - degree 1.0 0.4 0.5 1.2 0.7 0.3 12.6 899.0
<4.0%> <3.7%> <7.8%> <7.3%> <5.8%> <5.3%> <5.3%> <26.9%> (iii) Employment statusFull-time 20.8 8.9 4.5 12.3 8.9 3.5 179.8 3 081.4
<80.3%> <77.7%> <72.9%> <73.9%> <78.5%> <72.6%> <76.2%> <92.1%> Part-time / underemployed 5.1 2.6 1.7 4.3 2.4 1.3 56.2 264.4
<19.7%> <22.3%> <27.1%> <26.1%> <21.5%> <27.4%> <23.8%> <7.9%> III. Other indicators
Median monthly employment earnings (HK$) 8,200 8,000 8,000 7,800 8,000 7,500 8,000 13,000Labour force participation rate (%) 29.7 27.2 21.2 25.4 29.5 29.7 25.5 59.0Unemployment rate (%) 17.6 15.5 16.3 21.0 18.5 19.0 17.3 3.6Median age 40 42 51 52 45 42 49 42No. of children ('000) 34.0 14.6 7.1 15.9 11.5 7.0 253.6 1 048.0 Dependency ratio (demographic)^ 627 672 749 738 599 762 792 340
Elderly 303 378 521 523 361 373 529 179 Child 324 294 227 216 238 389 262 161
Economic dependency ratio# 3 203 3 467 4 432 3 502 2 983 3 323 3 600 926
Before policy intervention
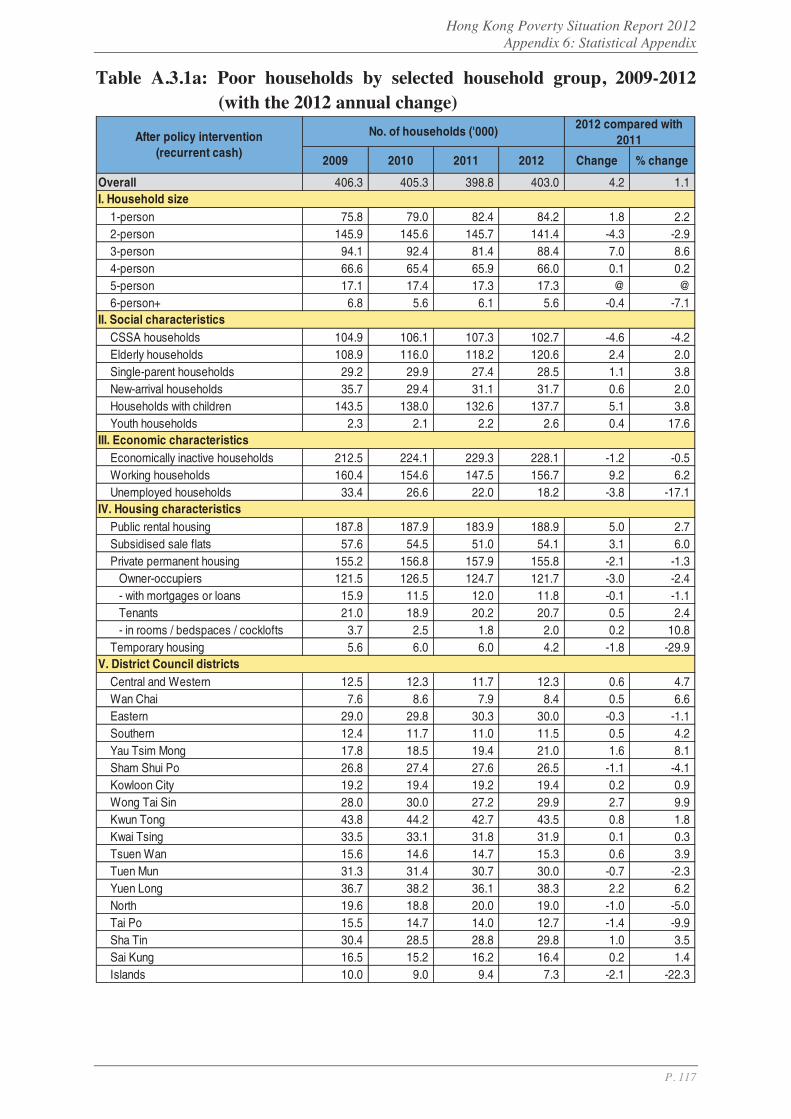
Hong Kong Poverty Situation Report 2012 Appendix 6: Statistical Appendix
P. 117
Table A.3.1a: Poor households by selected household group, 2009-2012 (with the 2012 annual change)
2009 2010 2011 2012 Change % change
Overall 406.3 405.3 398.8 403.0 4.2 1.1
1-person 75.8 79.0 82.4 84.2 1.8 2.22-person 145.9 145.6 145.7 141.4 -4.3 -2.93-person 94.1 92.4 81.4 88.4 7.0 8.64-person 66.6 65.4 65.9 66.0 0.1 0.25-person 17.1 17.4 17.3 17.3 @ @ 6-person+ 6.8 5.6 6.1 5.6 -0.4 -7.1
CSSA households 104.9 106.1 107.3 102.7 -4.6 -4.2Elderly households 108.9 116.0 118.2 120.6 2.4 2.0Single-parent households 29.2 29.9 27.4 28.5 1.1 3.8New-arrival households 35.7 29.4 31.1 31.7 0.6 2.0Households with children 143.5 138.0 132.6 137.7 5.1 3.8Youth households 2.3 2.1 2.2 2.6 0.4 17.6
Economically inactive households 212.5 224.1 229.3 228.1 -1.2 -0.5Working households 160.4 154.6 147.5 156.7 9.2 6.2Unemployed households 33.4 26.6 22.0 18.2 -3.8 -17.1
Public rental housing 187.8 187.9 183.9 188.9 5.0 2.7Subsidised sale flats 57.6 54.5 51.0 54.1 3.1 6.0Private permanent housing 155.2 156.8 157.9 155.8 -2.1 -1.3
Owner-occupiers 121.5 126.5 124.7 121.7 -3.0 -2.4- with mortgages or loans 15.9 11.5 12.0 11.8 -0.1 -1.1Tenants 21.0 18.9 20.2 20.7 0.5 2.4- in rooms / bedspaces / cocklofts 3.7 2.5 1.8 2.0 0.2 10.8
Temporary housing 5.6 6.0 6.0 4.2 -1.8 -29.9
Central and Western 12.5 12.3 11.7 12.3 0.6 4.7Wan Chai 7.6 8.6 7.9 8.4 0.5 6.6Eastern 29.0 29.8 30.3 30.0 -0.3 -1.1Southern 12.4 11.7 11.0 11.5 0.5 4.2Yau Tsim Mong 17.8 18.5 19.4 21.0 1.6 8.1Sham Shui Po 26.8 27.4 27.6 26.5 -1.1 -4.1Kowloon City 19.2 19.4 19.2 19.4 0.2 0.9Wong Tai Sin 28.0 30.0 27.2 29.9 2.7 9.9Kwun Tong 43.8 44.2 42.7 43.5 0.8 1.8Kwai Tsing 33.5 33.1 31.8 31.9 0.1 0.3Tsuen Wan 15.6 14.6 14.7 15.3 0.6 3.9Tuen Mun 31.3 31.4 30.7 30.0 -0.7 -2.3Yuen Long 36.7 38.2 36.1 38.3 2.2 6.2North 19.6 18.8 20.0 19.0 -1.0 -5.0Tai Po 15.5 14.7 14.0 12.7 -1.4 -9.9Sha Tin 30.4 28.5 28.8 29.8 1.0 3.5Sai Kung 16.5 15.2 16.2 16.4 0.2 1.4Islands 10.0 9.0 9.4 7.3 -2.1 -22.3
No. of households ('000) 2012 compared with2011After policy intervention
(recurrent cash)
I. Household size
II. Social characteristics
III. Economic characteristics
IV. Housing characteristics
V. District Council districts

Hong Kong Poverty Situation Report 2012 Appendix 6: Statistical Appendix
P. 118
Table A.3.2a: Poor population by selected household group, 2009-2012 (with the 2012 annual change)
2009 2010 2011 2012 Change %change
Overall 1 043.4 1 030.6 1 005.4 1 017.8 12.4 1.2
1-person 75.8 79.0 82.4 84.2 1.8 2.22-person 291.8 291.1 291.4 282.9 -8.6 -2.93-person 282.3 277.2 244.1 265.2 21.1 8.64-person 266.5 261.4 263.7 264.1 0.4 0.25-person 85.3 87.1 86.4 86.5 @ @ 6-person+ 41.7 34.8 37.3 35.0 -2.3 -6.2
CSSA households 239.0 240.4 238.9 235.6 -3.3 -1.4Elderly households 168.8 180.6 182.2 186.9 4.7 2.6Single-parent households 81.9 83.7 78.3 81.0 2.7 3.4New-arrival households 125.0 103.4 110.1 110.8 0.7 0.6Households with children 521.7 498.2 487.2 500.5 13.2 2.7Youth households 3.2 3.1 3.6 3.8 0.2 5.8
Economically inactive households 409.2 430.0 436.6 433.5 -3.1 -0.7Working households 543.3 527.5 509.4 537.5 28.1 5.5Unemployed households 90.9 73.1 59.4 46.8 -12.6 -21.2
Public rental housing 510.0 510.3 495.7 518.9 23.2 4.7Subsidised sale flats 153.7 142.8 132.8 137.8 5.0 3.8Private permanent housing 367.2 364.5 363.4 352.1 -11.3 -3.1
Owner-occupiers 287.2 290.4 287.6 273.0 -14.6 -5.1- with mortgages or loans 47.1 35.3 37.3 34.3 -3.0 -8.1Tenants 57.2 53.6 52.2 53.8 1.6 3.0- in rooms / bedspaces / cocklofts 8.0 5.7 4.0 4.7 0.7 16.6
Temporary housing 12.5 13.0 13.6 9.1 -4.4 -32.7
Central and Western 26.8 27.4 25.4 25.6 0.2 0.7Wan Chai 15.7 16.6 15.7 16.8 1.1 6.8Eastern 69.6 69.3 71.6 71.0 -0.6 -0.8Southern 31.4 28.1 27.1 29.3 2.2 8.0Yau Tsim Mong 40.7 41.9 44.1 45.7 1.7 3.7Sham Shui Po 70.2 68.3 67.7 68.4 0.7 1.0Kowloon City 45.8 45.2 46.4 45.3 -1.1 -2.4Wong Tai Sin 72.3 77.4 70.5 76.5 6.0 8.5Kwun Tong 110.8 115.7 109.0 116.3 7.4 6.7Kwai Tsing 90.6 89.9 85.6 87.9 2.3 2.7Tsuen Wan 40.0 38.0 38.3 37.1 -1.1 -2.9Tuen Mun 80.8 81.1 78.7 74.5 -4.2 -5.4Yuen Long 103.2 103.7 97.5 103.7 6.2 6.3North 53.6 51.6 51.3 49.2 -2.0 -3.9Tai Po 40.7 36.1 34.5 31.1 -3.4 -10.0Sha Tin 79.3 75.6 72.7 76.4 3.7 5.1Sai Kung 47.1 39.9 43.0 43.8 0.8 1.8Islands 24.8 24.7 26.2 19.2 -7.1 -27.0
No. of persons ('000) 2012 compared with2011After policy intervention
(recurrent cash)
I. Household size
II. Social characteristics
III. Economic characteristics
IV. Housing characteristics
V. District Council districts
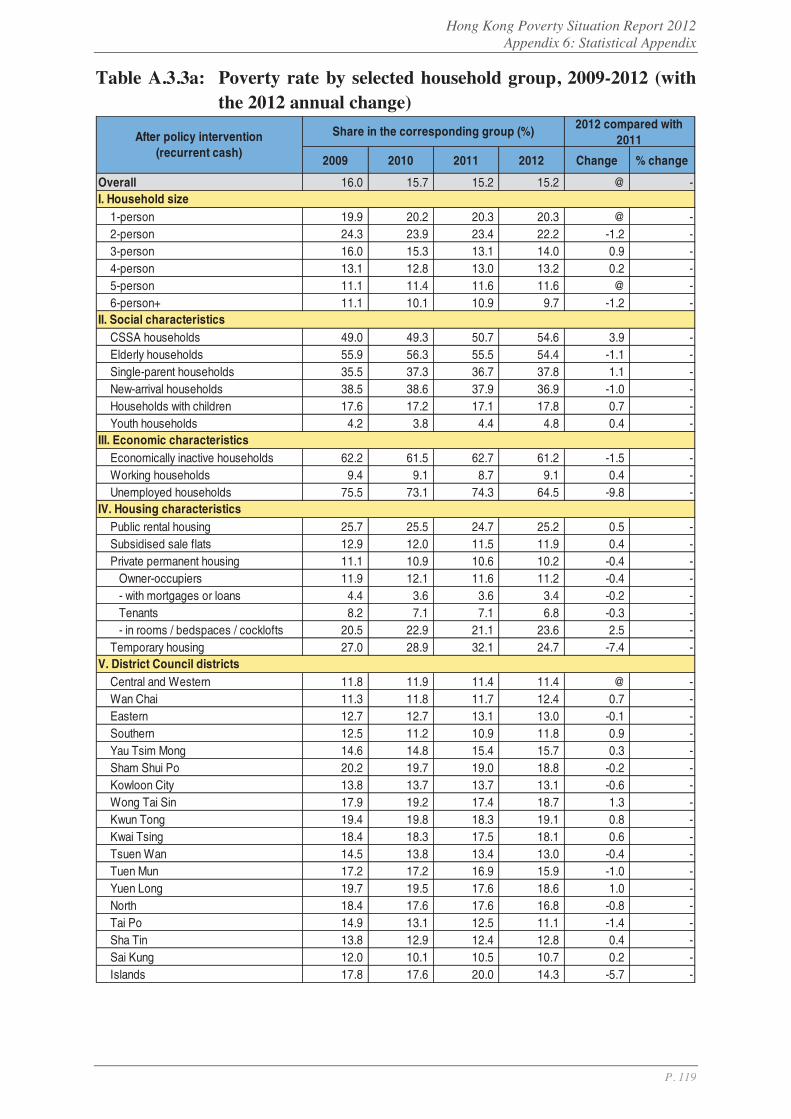
Hong Kong Poverty Situation Report 2012 Appendix 6: Statistical Appendix
P. 119
Table A.3.3a: Poverty rate by selected household group, 2009-2012 (with the 2012 annual change)
2009 2010 2011 2012 Change % change
Overall 16.0 15.7 15.2 15.2 @ -
1-person 19.9 20.2 20.3 20.3 @ -2-person 24.3 23.9 23.4 22.2 -1.2 -3-person 16.0 15.3 13.1 14.0 0.9 -4-person 13.1 12.8 13.0 13.2 0.2 -5-person 11.1 11.4 11.6 11.6 @ -6-person+ 11.1 10.1 10.9 9.7 -1.2 -
CSSA households 49.0 49.3 50.7 54.6 3.9 -Elderly households 55.9 56.3 55.5 54.4 -1.1 -Single-parent households 35.5 37.3 36.7 37.8 1.1 -New-arrival households 38.5 38.6 37.9 36.9 -1.0 -Households with children 17.6 17.2 17.1 17.8 0.7 -Youth households 4.2 3.8 4.4 4.8 0.4 -
Economically inactive households 62.2 61.5 62.7 61.2 -1.5 -Working households 9.4 9.1 8.7 9.1 0.4 -Unemployed households 75.5 73.1 74.3 64.5 -9.8 -
Public rental housing 25.7 25.5 24.7 25.2 0.5 -Subsidised sale flats 12.9 12.0 11.5 11.9 0.4 -Private permanent housing 11.1 10.9 10.6 10.2 -0.4 -
Owner-occupiers 11.9 12.1 11.6 11.2 -0.4 -- with mortgages or loans 4.4 3.6 3.6 3.4 -0.2 -Tenants 8.2 7.1 7.1 6.8 -0.3 -- in rooms / bedspaces / cocklofts 20.5 22.9 21.1 23.6 2.5 -
Temporary housing 27.0 28.9 32.1 24.7 -7.4 -
Central and Western 11.8 11.9 11.4 11.4 @ -Wan Chai 11.3 11.8 11.7 12.4 0.7 -Eastern 12.7 12.7 13.1 13.0 -0.1 -Southern 12.5 11.2 10.9 11.8 0.9 -Yau Tsim Mong 14.6 14.8 15.4 15.7 0.3 -Sham Shui Po 20.2 19.7 19.0 18.8 -0.2 -Kowloon City 13.8 13.7 13.7 13.1 -0.6 -Wong Tai Sin 17.9 19.2 17.4 18.7 1.3 -Kwun Tong 19.4 19.8 18.3 19.1 0.8 -Kwai Tsing 18.4 18.3 17.5 18.1 0.6 -Tsuen Wan 14.5 13.8 13.4 13.0 -0.4 -Tuen Mun 17.2 17.2 16.9 15.9 -1.0 -Yuen Long 19.7 19.5 17.6 18.6 1.0 -North 18.4 17.6 17.6 16.8 -0.8 -Tai Po 14.9 13.1 12.5 11.1 -1.4 -Sha Tin 13.8 12.9 12.4 12.8 0.4 -Sai Kung 12.0 10.1 10.5 10.7 0.2 -Islands 17.8 17.6 20.0 14.3 -5.7 -
Share in the corresponding group (%) 2012 compared with2011After policy intervention
(recurrent cash)
I. Household size
II. Social characteristics
III. Economic characteristics
IV. Housing characteristics
V. District Council districts
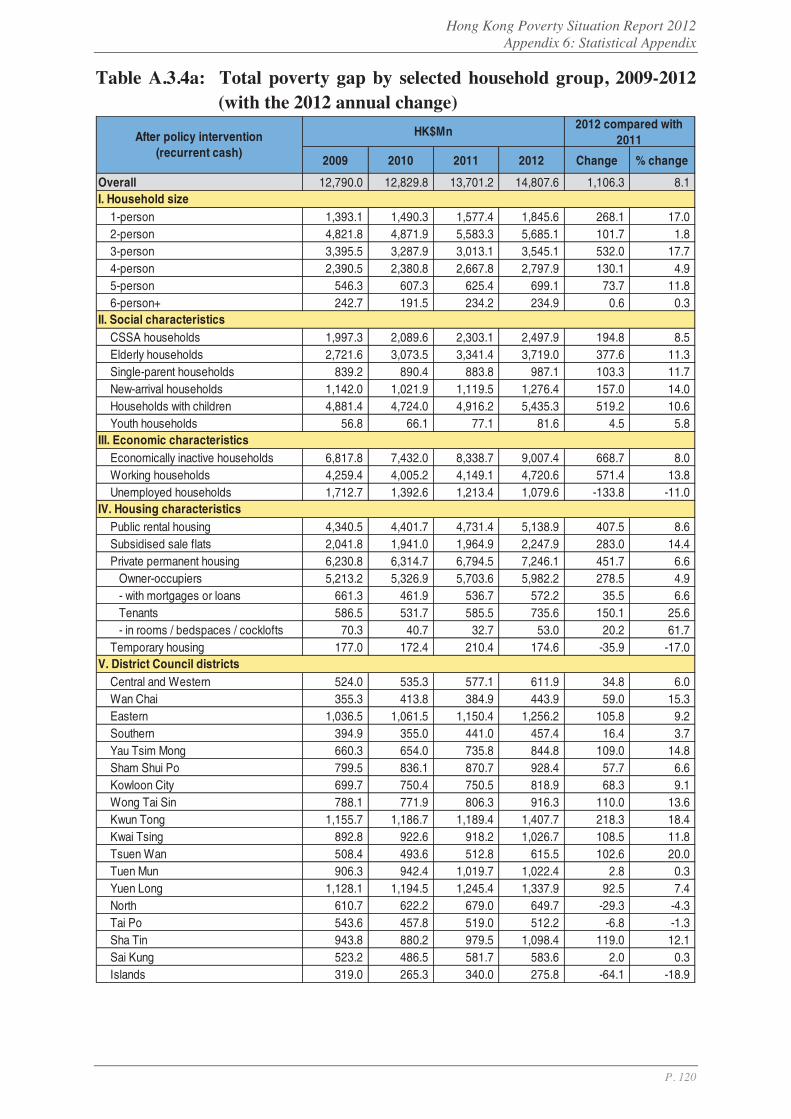
Hong Kong Poverty Situation Report 2012 Appendix 6: Statistical Appendix
P. 120
Table A.3.4a: Total poverty gap by selected household group, 2009-2012 (with the 2012 annual change)
2009 2010 2011 2012 Change % change
Overall 12,790.0 12,829.8 13,701.2 14,807.6 1,106.3 8.1
1-person 1,393.1 1,490.3 1,577.4 1,845.6 268.1 17.02-person 4,821.8 4,871.9 5,583.3 5,685.1 101.7 1.83-person 3,395.5 3,287.9 3,013.1 3,545.1 532.0 17.74-person 2,390.5 2,380.8 2,667.8 2,797.9 130.1 4.95-person 546.3 607.3 625.4 699.1 73.7 11.86-person+ 242.7 191.5 234.2 234.9 0.6 0.3
CSSA households 1,997.3 2,089.6 2,303.1 2,497.9 194.8 8.5Elderly households 2,721.6 3,073.5 3,341.4 3,719.0 377.6 11.3Single-parent households 839.2 890.4 883.8 987.1 103.3 11.7New-arrival households 1,142.0 1,021.9 1,119.5 1,276.4 157.0 14.0Households with children 4,881.4 4,724.0 4,916.2 5,435.3 519.2 10.6Youth households 56.8 66.1 77.1 81.6 4.5 5.8
Economically inactive households 6,817.8 7,432.0 8,338.7 9,007.4 668.7 8.0Working households 4,259.4 4,005.2 4,149.1 4,720.6 571.4 13.8Unemployed households 1,712.7 1,392.6 1,213.4 1,079.6 -133.8 -11.0
Public rental housing 4,340.5 4,401.7 4,731.4 5,138.9 407.5 8.6Subsidised sale flats 2,041.8 1,941.0 1,964.9 2,247.9 283.0 14.4Private permanent housing 6,230.8 6,314.7 6,794.5 7,246.1 451.7 6.6
Owner-occupiers 5,213.2 5,326.9 5,703.6 5,982.2 278.5 4.9- with mortgages or loans 661.3 461.9 536.7 572.2 35.5 6.6Tenants 586.5 531.7 585.5 735.6 150.1 25.6- in rooms / bedspaces / cocklofts 70.3 40.7 32.7 53.0 20.2 61.7
Temporary housing 177.0 172.4 210.4 174.6 -35.9 -17.0
Central and Western 524.0 535.3 577.1 611.9 34.8 6.0Wan Chai 355.3 413.8 384.9 443.9 59.0 15.3Eastern 1,036.5 1,061.5 1,150.4 1,256.2 105.8 9.2Southern 394.9 355.0 441.0 457.4 16.4 3.7Yau Tsim Mong 660.3 654.0 735.8 844.8 109.0 14.8Sham Shui Po 799.5 836.1 870.7 928.4 57.7 6.6Kowloon City 699.7 750.4 750.5 818.9 68.3 9.1Wong Tai Sin 788.1 771.9 806.3 916.3 110.0 13.6Kwun Tong 1,155.7 1,186.7 1,189.4 1,407.7 218.3 18.4Kwai Tsing 892.8 922.6 918.2 1,026.7 108.5 11.8Tsuen Wan 508.4 493.6 512.8 615.5 102.6 20.0Tuen Mun 906.3 942.4 1,019.7 1,022.4 2.8 0.3Yuen Long 1,128.1 1,194.5 1,245.4 1,337.9 92.5 7.4North 610.7 622.2 679.0 649.7 -29.3 -4.3Tai Po 543.6 457.8 519.0 512.2 -6.8 -1.3Sha Tin 943.8 880.2 979.5 1,098.4 119.0 12.1Sai Kung 523.2 486.5 581.7 583.6 2.0 0.3Islands 319.0 265.3 340.0 275.8 -64.1 -18.9
HK$Mn 2012 compared with2011After policy intervention
(recurrent cash)
I. Household size
II. Social characteristics
III. Economic characteristics
IV. Housing characteristics
V. District Council districts

Hong Kong Poverty Situation Report 2012 Appendix 6: Statistical Appendix
P. 121
Table A.3.5a: Average poverty gap by selected household group, 2009-2012 (with the 2012 annual change)
2009 2010 2011 2012 Change % change
Overall 2,600 2,600 2,900 3,100 200 6.9
1-person 1,500 1,600 1,600 1,800 200 14.52-person 2,800 2,800 3,200 3,300 200 4.93-person 3,000 3,000 3,100 3,300 300 8.34-person 3,000 3,000 3,400 3,500 200 4.75-person 2,700 2,900 3,000 3,400 400 11.76-person+ 3,000 2,900 3,200 3,500 300 8.0
CSSA households 1,600 1,600 1,800 2,000 200 13.3Elderly households 2,100 2,200 2,400 2,600 200 9.1Single-parent households 2,400 2,500 2,700 2,900 200 7.6New-arrival households 2,700 2,900 3,000 3,400 400 11.8Households with children 2,800 2,900 3,100 3,300 200 6.5Youth households 2,100 2,600 2,900 2,600 -300 -10.0
Economically inactive households 2,700 2,800 3,000 3,300 300 8.6Working households 2,200 2,200 2,300 2,500 200 7.1Unemployed households 4,300 4,400 4,600 4,900 300 7.3
Public rental housing 1,900 2,000 2,100 2,300 100 5.7Subsidised sale flats 3,000 3,000 3,200 3,500 300 7.9Private permanent housing 3,300 3,400 3,600 3,900 300 8.1
Owner-occupiers 3,600 3,500 3,800 4,100 300 7.5- with mortgages or loans 3,500 3,300 3,700 4,000 300 7.8Tenants 2,300 2,300 2,400 3,000 500 22.7- in rooms / bedspaces / cocklofts 1,600 1,400 1,500 2,200 700 46.0
Temporary housing 2,600 2,400 2,900 3,500 500 18.4
Central and Western 3,500 3,600 4,100 4,100 100 1.3Wan Chai 3,900 4,000 4,100 4,400 300 8.2Eastern 3,000 3,000 3,200 3,500 300 10.4Southern 2,700 2,500 3,300 3,300 @ @ Yau Tsim Mong 3,100 2,900 3,200 3,400 200 6.2Sham Shui Po 2,500 2,500 2,600 2,900 300 11.2Kowloon City 3,000 3,200 3,300 3,500 300 8.2Wong Tai Sin 2,300 2,100 2,500 2,600 100 3.4Kwun Tong 2,200 2,200 2,300 2,700 400 16.3Kwai Tsing 2,200 2,300 2,400 2,700 300 11.5Tsuen Wan 2,700 2,800 2,900 3,400 500 15.5Tuen Mun 2,400 2,500 2,800 2,800 100 2.6Yuen Long 2,600 2,600 2,900 2,900 @ @ North 2,600 2,800 2,800 2,800 @ @ Tai Po 2,900 2,600 3,100 3,400 300 9.5Sha Tin 2,600 2,600 2,800 3,100 200 8.3Sai Kung 2,600 2,700 3,000 3,000 @ @ Islands 2,700 2,500 3,000 3,100 100 4.4
HK$ 2012 compared with2011After policy intervention
(recurrent cash)
I. Household size
II. Social characteristics
III. Economic characteristics
IV. Housing characteristics
V. District Council districts
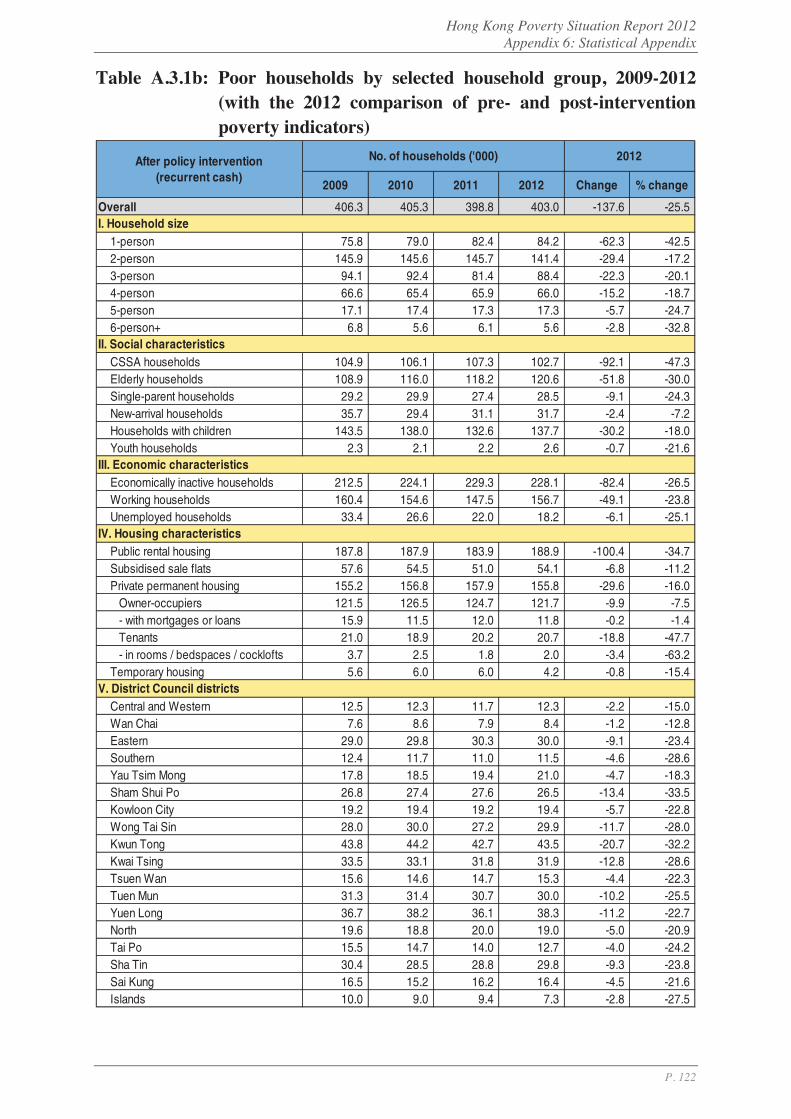
Hong Kong Poverty Situation Report 2012 Appendix 6: Statistical Appendix
P. 122
Table A.3.1b: Poor households by selected household group, 2009-2012 (with the 2012 comparison of pre- and post-intervention poverty indicators)
2009 2010 2011 2012 Change % change
Overall 406.3 405.3 398.8 403.0 -137.6 -25.5
1-person 75.8 79.0 82.4 84.2 -62.3 -42.52-person 145.9 145.6 145.7 141.4 -29.4 -17.23-person 94.1 92.4 81.4 88.4 -22.3 -20.14-person 66.6 65.4 65.9 66.0 -15.2 -18.75-person 17.1 17.4 17.3 17.3 -5.7 -24.76-person+ 6.8 5.6 6.1 5.6 -2.8 -32.8
CSSA households 104.9 106.1 107.3 102.7 -92.1 -47.3Elderly households 108.9 116.0 118.2 120.6 -51.8 -30.0Single-parent households 29.2 29.9 27.4 28.5 -9.1 -24.3New-arrival households 35.7 29.4 31.1 31.7 -2.4 -7.2Households with children 143.5 138.0 132.6 137.7 -30.2 -18.0Youth households 2.3 2.1 2.2 2.6 -0.7 -21.6
Economically inactive households 212.5 224.1 229.3 228.1 -82.4 -26.5Working households 160.4 154.6 147.5 156.7 -49.1 -23.8Unemployed households 33.4 26.6 22.0 18.2 -6.1 -25.1
Public rental housing 187.8 187.9 183.9 188.9 -100.4 -34.7Subsidised sale flats 57.6 54.5 51.0 54.1 -6.8 -11.2Private permanent housing 155.2 156.8 157.9 155.8 -29.6 -16.0
Owner-occupiers 121.5 126.5 124.7 121.7 -9.9 -7.5- with mortgages or loans 15.9 11.5 12.0 11.8 -0.2 -1.4Tenants 21.0 18.9 20.2 20.7 -18.8 -47.7- in rooms / bedspaces / cocklofts 3.7 2.5 1.8 2.0 -3.4 -63.2
Temporary housing 5.6 6.0 6.0 4.2 -0.8 -15.4
Central and Western 12.5 12.3 11.7 12.3 -2.2 -15.0Wan Chai 7.6 8.6 7.9 8.4 -1.2 -12.8Eastern 29.0 29.8 30.3 30.0 -9.1 -23.4Southern 12.4 11.7 11.0 11.5 -4.6 -28.6Yau Tsim Mong 17.8 18.5 19.4 21.0 -4.7 -18.3Sham Shui Po 26.8 27.4 27.6 26.5 -13.4 -33.5Kowloon City 19.2 19.4 19.2 19.4 -5.7 -22.8Wong Tai Sin 28.0 30.0 27.2 29.9 -11.7 -28.0Kwun Tong 43.8 44.2 42.7 43.5 -20.7 -32.2Kwai Tsing 33.5 33.1 31.8 31.9 -12.8 -28.6Tsuen Wan 15.6 14.6 14.7 15.3 -4.4 -22.3Tuen Mun 31.3 31.4 30.7 30.0 -10.2 -25.5Yuen Long 36.7 38.2 36.1 38.3 -11.2 -22.7North 19.6 18.8 20.0 19.0 -5.0 -20.9Tai Po 15.5 14.7 14.0 12.7 -4.0 -24.2Sha Tin 30.4 28.5 28.8 29.8 -9.3 -23.8Sai Kung 16.5 15.2 16.2 16.4 -4.5 -21.6Islands 10.0 9.0 9.4 7.3 -2.8 -27.5
No. of households ('000) 2012After policy intervention(recurrent cash)
I. Household size
II. Social characteristics
III. Economic characteristics
IV. Housing characteristics
V. District Council districts

Hong Kong Poverty Situation Report 2012 Appendix 6: Statistical Appendix
P. 123
Table A.3.2b: Poor population by selected household group, 2009-2012 (with the 2012 comparison of pre- and post-intervention poverty indicators)
2009 2010 2011 2012 Change % change
Overall 1 043.4 1 030.6 1 005.4 1 017.8 -294.5 -22.4
1-person 75.8 79.0 82.4 84.2 -62.3 -42.52-person 291.8 291.1 291.4 282.9 -58.8 -17.23-person 282.3 277.2 244.1 265.2 -66.8 -20.14-person 266.5 261.4 263.7 264.1 -60.8 -18.75-person 85.3 87.1 86.4 86.5 -28.4 -24.76-person+ 41.7 34.8 37.3 35.0 -17.4 -33.2
CSSA households 239.0 240.4 238.9 235.6 -180.7 -43.4Elderly households 168.8 180.6 182.2 186.9 -61.1 -24.6Single-parent households 81.9 83.7 78.3 81.0 -25.8 -24.2New-arrival households 125.0 103.4 110.1 110.8 -8.9 -7.5Households with children 521.7 498.2 487.2 500.5 -113.4 -18.5Youth households 3.2 3.1 3.6 3.8 -1.0 -20.4
Economically inactive households 409.2 430.0 436.6 433.5 -115.4 -21.0Working households 543.3 527.5 509.4 537.5 -164.6 -23.4Unemployed households 90.9 73.1 59.4 46.8 -14.4 -23.6
Public rental housing 510.0 510.3 495.7 518.9 -204.7 -28.3Subsidised sale flats 153.7 142.8 132.8 137.8 -16.9 -10.9Private permanent housing 367.2 364.5 363.4 352.1 -71.3 -16.8
Owner-occupiers 287.2 290.4 287.6 273.0 -22.6 -7.6- with mortgages or loans 47.1 35.3 37.3 34.3 -1.0 -2.9Tenants 57.2 53.6 52.2 53.8 -47.3 -46.8- in rooms / bedspaces / cocklofts 8.0 5.7 4.0 4.7 -4.9 -51.3
Temporary housing 12.5 13.0 13.6 9.1 -1.6 -14.8
Central and Western 26.8 27.4 25.4 25.6 -4.2 -14.2Wan Chai 15.7 16.6 15.7 16.8 -2.7 -13.9Eastern 69.6 69.3 71.6 71.0 -19.0 -21.1Southern 31.4 28.1 27.1 29.3 -9.1 -23.8Yau Tsim Mong 40.7 41.9 44.1 45.7 -11.1 -19.5Sham Shui Po 70.2 68.3 67.7 68.4 -25.8 -27.4Kowloon City 45.8 45.2 46.4 45.3 -13.7 -23.2Wong Tai Sin 72.3 77.4 70.5 76.5 -24.8 -24.5Kwun Tong 110.8 115.7 109.0 116.3 -41.1 -26.1Kwai Tsing 90.6 89.9 85.6 87.9 -27.1 -23.6Tsuen Wan 40.0 38.0 38.3 37.1 -8.9 -19.4Tuen Mun 80.8 81.1 78.7 74.5 -21.5 -22.4Yuen Long 103.2 103.7 97.5 103.7 -28.4 -21.5North 53.6 51.6 51.3 49.2 -11.5 -19.0Tai Po 40.7 36.1 34.5 31.1 -9.1 -22.7Sha Tin 79.3 75.6 72.7 76.4 -18.2 -19.3Sai Kung 47.1 39.9 43.0 43.8 -11.5 -20.8Islands 24.8 24.7 26.2 19.2 -6.7 -25.8
2012No. of persons ('000)After policy intervention(recurrent cash)
I. Household size
II. Social characteristics
III. Economic characteristics
IV. Housing characteristics
V. District Council districts
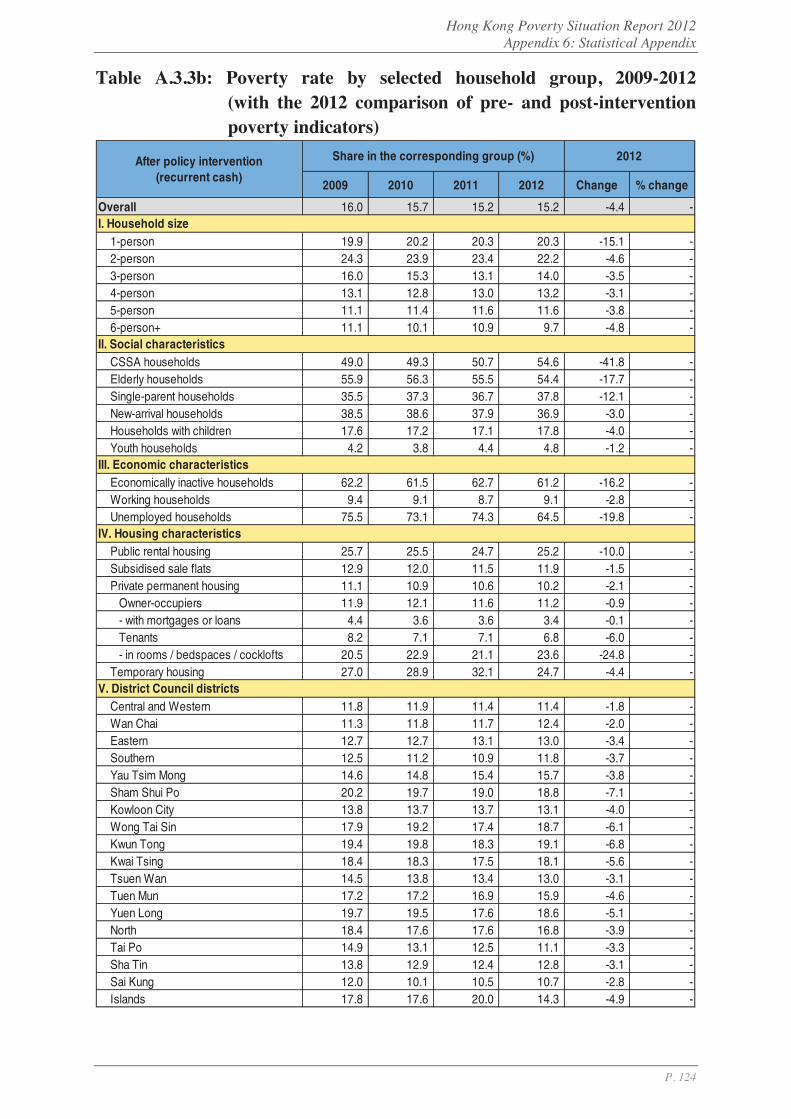
Hong Kong Poverty Situation Report 2012 Appendix 6: Statistical Appendix
P. 124
Table A.3.3b: Poverty rate by selected household group, 2009-2012 (with the 2012 comparison of pre- and post-intervention poverty indicators)
2009 2010 2011 2012 Change % change
Overall 16.0 15.7 15.2 15.2 -4.4 -
1-person 19.9 20.2 20.3 20.3 -15.1 -2-person 24.3 23.9 23.4 22.2 -4.6 -3-person 16.0 15.3 13.1 14.0 -3.5 -4-person 13.1 12.8 13.0 13.2 -3.1 -5-person 11.1 11.4 11.6 11.6 -3.8 -6-person+ 11.1 10.1 10.9 9.7 -4.8 -
CSSA households 49.0 49.3 50.7 54.6 -41.8 -Elderly households 55.9 56.3 55.5 54.4 -17.7 -Single-parent households 35.5 37.3 36.7 37.8 -12.1 -New-arrival households 38.5 38.6 37.9 36.9 -3.0 -Households with children 17.6 17.2 17.1 17.8 -4.0 -Youth households 4.2 3.8 4.4 4.8 -1.2 -
Economically inactive households 62.2 61.5 62.7 61.2 -16.2 -Working households 9.4 9.1 8.7 9.1 -2.8 -Unemployed households 75.5 73.1 74.3 64.5 -19.8 -
Public rental housing 25.7 25.5 24.7 25.2 -10.0 -Subsidised sale flats 12.9 12.0 11.5 11.9 -1.5 -Private permanent housing 11.1 10.9 10.6 10.2 -2.1 -
Owner-occupiers 11.9 12.1 11.6 11.2 -0.9 -- with mortgages or loans 4.4 3.6 3.6 3.4 -0.1 -Tenants 8.2 7.1 7.1 6.8 -6.0 -- in rooms / bedspaces / cocklofts 20.5 22.9 21.1 23.6 -24.8 -
Temporary housing 27.0 28.9 32.1 24.7 -4.4 -
Central and Western 11.8 11.9 11.4 11.4 -1.8 -Wan Chai 11.3 11.8 11.7 12.4 -2.0 -Eastern 12.7 12.7 13.1 13.0 -3.4 -Southern 12.5 11.2 10.9 11.8 -3.7 -Yau Tsim Mong 14.6 14.8 15.4 15.7 -3.8 -Sham Shui Po 20.2 19.7 19.0 18.8 -7.1 -Kowloon City 13.8 13.7 13.7 13.1 -4.0 -Wong Tai Sin 17.9 19.2 17.4 18.7 -6.1 -Kwun Tong 19.4 19.8 18.3 19.1 -6.8 -Kwai Tsing 18.4 18.3 17.5 18.1 -5.6 -Tsuen Wan 14.5 13.8 13.4 13.0 -3.1 -Tuen Mun 17.2 17.2 16.9 15.9 -4.6 -Yuen Long 19.7 19.5 17.6 18.6 -5.1 -North 18.4 17.6 17.6 16.8 -3.9 -Tai Po 14.9 13.1 12.5 11.1 -3.3 -Sha Tin 13.8 12.9 12.4 12.8 -3.1 -Sai Kung 12.0 10.1 10.5 10.7 -2.8 -Islands 17.8 17.6 20.0 14.3 -4.9 -
2012Share in the corresponding group (%)After policy intervention(recurrent cash)
I. Household size
II. Social characteristics
III. Economic characteristics
IV. Housing characteristics
V. District Council districts
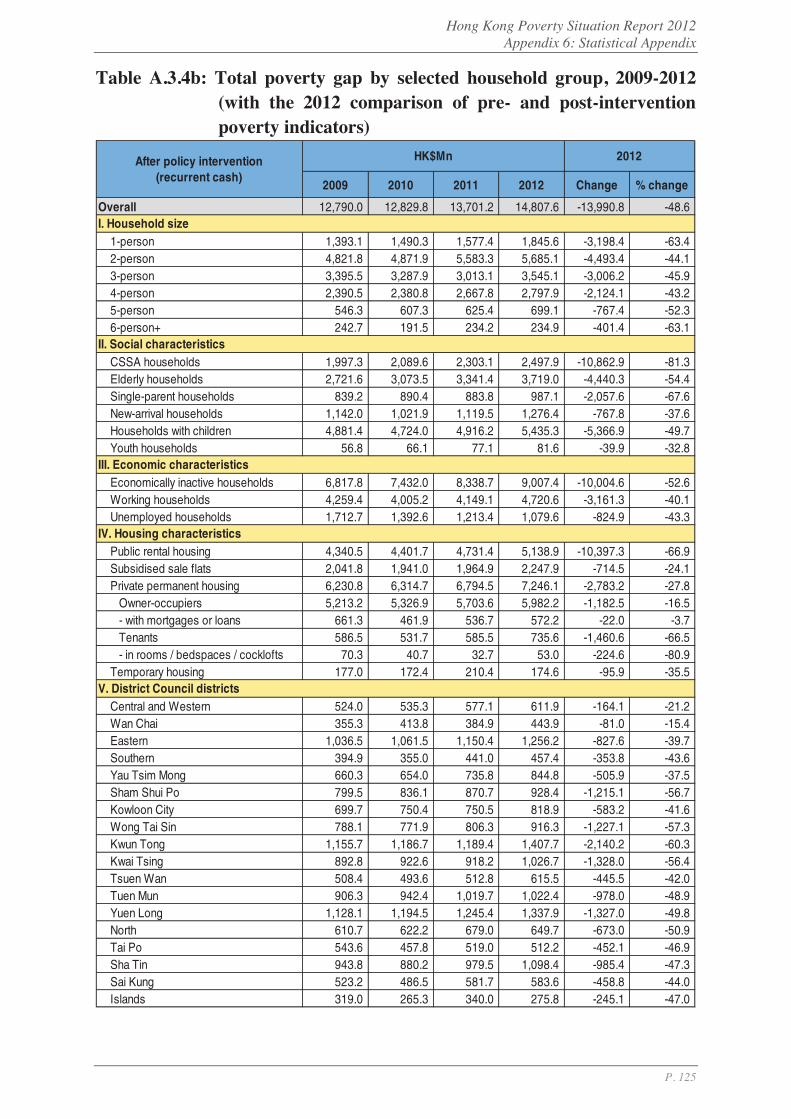
Hong Kong Poverty Situation Report 2012 Appendix 6: Statistical Appendix
P. 125
Table A.3.4b: Total poverty gap by selected household group, 2009-2012 (with the 2012 comparison of pre- and post-intervention poverty indicators)
2009 2010 2011 2012 Change % change
Overall 12,790.0 12,829.8 13,701.2 14,807.6 -13,990.8 -48.6
1-person 1,393.1 1,490.3 1,577.4 1,845.6 -3,198.4 -63.42-person 4,821.8 4,871.9 5,583.3 5,685.1 -4,493.4 -44.13-person 3,395.5 3,287.9 3,013.1 3,545.1 -3,006.2 -45.94-person 2,390.5 2,380.8 2,667.8 2,797.9 -2,124.1 -43.25-person 546.3 607.3 625.4 699.1 -767.4 -52.36-person+ 242.7 191.5 234.2 234.9 -401.4 -63.1
CSSA households 1,997.3 2,089.6 2,303.1 2,497.9 -10,862.9 -81.3Elderly households 2,721.6 3,073.5 3,341.4 3,719.0 -4,440.3 -54.4Single-parent households 839.2 890.4 883.8 987.1 -2,057.6 -67.6New-arrival households 1,142.0 1,021.9 1,119.5 1,276.4 -767.8 -37.6Households with children 4,881.4 4,724.0 4,916.2 5,435.3 -5,366.9 -49.7Youth households 56.8 66.1 77.1 81.6 -39.9 -32.8
Economically inactive households 6,817.8 7,432.0 8,338.7 9,007.4 -10,004.6 -52.6Working households 4,259.4 4,005.2 4,149.1 4,720.6 -3,161.3 -40.1Unemployed households 1,712.7 1,392.6 1,213.4 1,079.6 -824.9 -43.3
Public rental housing 4,340.5 4,401.7 4,731.4 5,138.9 -10,397.3 -66.9Subsidised sale flats 2,041.8 1,941.0 1,964.9 2,247.9 -714.5 -24.1Private permanent housing 6,230.8 6,314.7 6,794.5 7,246.1 -2,783.2 -27.8
Owner-occupiers 5,213.2 5,326.9 5,703.6 5,982.2 -1,182.5 -16.5- with mortgages or loans 661.3 461.9 536.7 572.2 -22.0 -3.7Tenants 586.5 531.7 585.5 735.6 -1,460.6 -66.5- in rooms / bedspaces / cocklofts 70.3 40.7 32.7 53.0 -224.6 -80.9
Temporary housing 177.0 172.4 210.4 174.6 -95.9 -35.5
Central and Western 524.0 535.3 577.1 611.9 -164.1 -21.2Wan Chai 355.3 413.8 384.9 443.9 -81.0 -15.4Eastern 1,036.5 1,061.5 1,150.4 1,256.2 -827.6 -39.7Southern 394.9 355.0 441.0 457.4 -353.8 -43.6Yau Tsim Mong 660.3 654.0 735.8 844.8 -505.9 -37.5Sham Shui Po 799.5 836.1 870.7 928.4 -1,215.1 -56.7Kowloon City 699.7 750.4 750.5 818.9 -583.2 -41.6Wong Tai Sin 788.1 771.9 806.3 916.3 -1,227.1 -57.3Kwun Tong 1,155.7 1,186.7 1,189.4 1,407.7 -2,140.2 -60.3Kwai Tsing 892.8 922.6 918.2 1,026.7 -1,328.0 -56.4Tsuen Wan 508.4 493.6 512.8 615.5 -445.5 -42.0Tuen Mun 906.3 942.4 1,019.7 1,022.4 -978.0 -48.9Yuen Long 1,128.1 1,194.5 1,245.4 1,337.9 -1,327.0 -49.8North 610.7 622.2 679.0 649.7 -673.0 -50.9Tai Po 543.6 457.8 519.0 512.2 -452.1 -46.9Sha Tin 943.8 880.2 979.5 1,098.4 -985.4 -47.3Sai Kung 523.2 486.5 581.7 583.6 -458.8 -44.0Islands 319.0 265.3 340.0 275.8 -245.1 -47.0
2012HK$MnAfter policy intervention(recurrent cash)
I. Household size
II. Social characteristics
III. Economic characteristics
IV. Housing characteristics
V. District Council districts

Hong Kong Poverty Situation Report 2012 Appendix 6: Statistical Appendix
P. 126
Table A.3.5b: Average poverty gap by selected household group, 2009-2012 (with the 2012 comparison of pre- and post-intervention poverty indicators)
2009 2010 2011 2012 Change % change
Overall 2,600 2,600 2,900 3,100 -1,400 -31.0
1-person 1,500 1,600 1,600 1,800 -1,000 -36.32-person 2,800 2,800 3,200 3,300 -1,600 -32.53-person 3,000 3,000 3,100 3,300 -1,600 -32.24-person 3,000 3,000 3,400 3,500 -1,500 -30.15-person 2,700 2,900 3,000 3,400 -2,000 -36.76-person+ 3,000 2,900 3,200 3,500 -2,800 -45.1
CSSA households 1,600 1,600 1,800 2,000 -3,700 -64.5Elderly households 2,100 2,200 2,400 2,600 -1,400 -34.9Single-parent households 2,400 2,500 2,700 2,900 -3,900 -57.2New-arrival households 2,700 2,900 3,000 3,400 -1,600 -32.7Households with children 2,800 2,900 3,100 3,300 -2,100 -38.6Youth households 2,100 2,600 2,900 2,600 -400 -14.3
Economically inactive households 2,700 2,800 3,000 3,300 -1,800 -35.5Working households 2,200 2,200 2,300 2,500 -700 -21.4Unemployed households 4,300 4,400 4,600 4,900 -1,600 -24.3
Public rental housing 1,900 2,000 2,100 2,300 -2,200 -49.3Subsidised sale flats 3,000 3,000 3,200 3,500 -600 -14.5Private permanent housing 3,300 3,400 3,600 3,900 -600 -14.0
Owner-occupiers 3,600 3,500 3,800 4,100 -400 -9.7- with mortgages or loans 3,500 3,300 3,700 4,000 -100 -2.3Tenants 2,300 2,300 2,400 3,000 -1,700 -36.0- in rooms / bedspaces / cocklofts 1,600 1,400 1,500 2,200 -2,100 -48.2
Temporary housing 2,600 2,400 2,900 3,500 -1,100 -23.7
Central and Western 3,500 3,600 4,100 4,100 -300 -7.2Wan Chai 3,900 4,000 4,100 4,400 -100 -3.1Eastern 3,000 3,000 3,200 3,500 -900 -21.3Southern 2,700 2,500 3,300 3,300 -900 -21.1Yau Tsim Mong 3,100 2,900 3,200 3,400 -1,000 -23.4Sham Shui Po 2,500 2,500 2,600 2,900 -1,600 -34.8Kowloon City 3,000 3,200 3,300 3,500 -1,100 -24.3Wong Tai Sin 2,300 2,100 2,500 2,600 -1,700 -40.6Kwun Tong 2,200 2,200 2,300 2,700 -1,900 -41.4Kwai Tsing 2,200 2,300 2,400 2,700 -1,700 -38.9Tsuen Wan 2,700 2,800 2,900 3,400 -1,100 -25.3Tuen Mun 2,400 2,500 2,800 2,800 -1,300 -31.4Yuen Long 2,600 2,600 2,900 2,900 -1,600 -35.1North 2,600 2,800 2,800 2,800 -1,700 -37.9Tai Po 2,900 2,600 3,100 3,400 -1,400 -29.9Sha Tin 2,600 2,600 2,800 3,100 -1,400 -30.8Sai Kung 2,600 2,700 3,000 3,000 -1,200 -28.6Islands 2,700 2,500 3,000 3,100 -1,200 -26.9
2012HK$After policy intervention(recurrent cash)
I. Household size
II. Social characteristics
III. Economic characteristics
IV. Housing characteristics
V. District Council districts
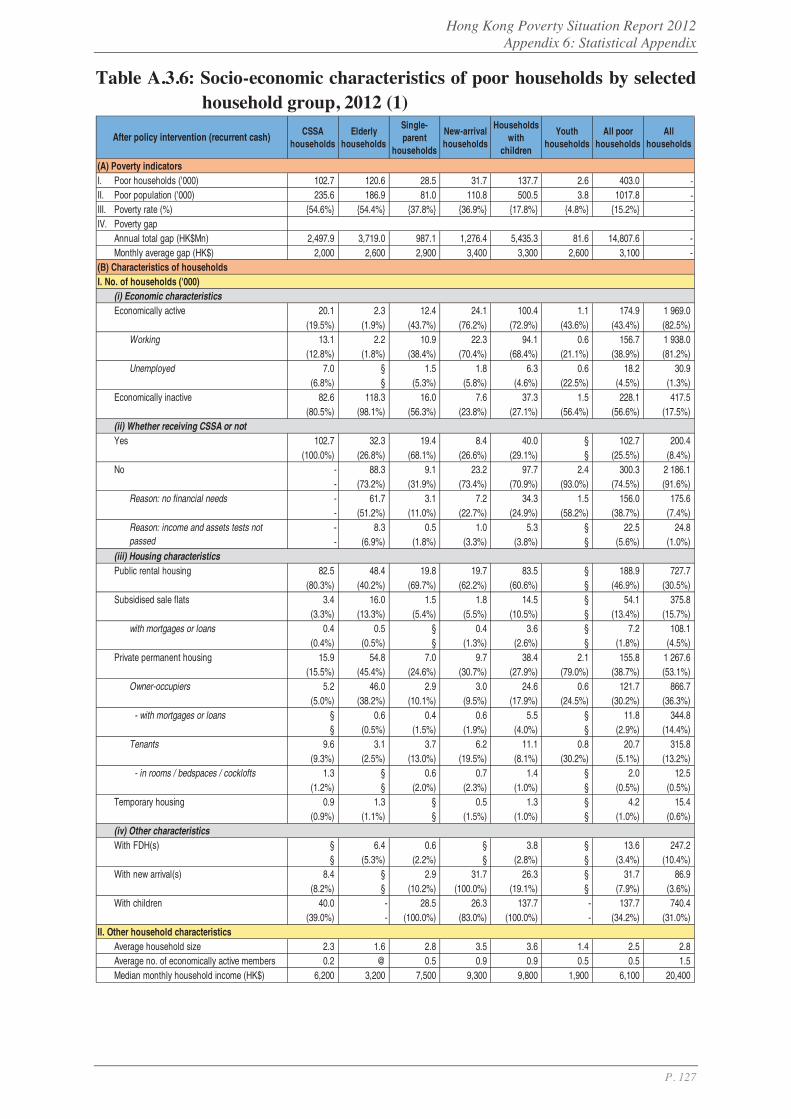
Hong Kong Poverty Situation Report 2012 Appendix 6: Statistical Appendix
P. 127
Table A.3.6: Socio-economic characteristics of poor households by selected household group, 2012 (1)
CSSAhouseholds
Elderlyhouseholds
Single-parent
households
New-arrivalhouseholds
Householdswith
children
Youthhouseholds
All poorhouseholds
Allhouseholds
(A) Poverty indicatorsI. Poor households ('000) 102.7 120.6 28.5 31.7 137.7 2.6 403.0 -II. Poor population ('000) 235.6 186.9 81.0 110.8 500.5 3.8 1017.8 -III. Poverty rate (%) {54.6%} {54.4%} {37.8%} {36.9%} {17.8%} {4.8%} {15.2%} -IV. Poverty gap
Annual total gap (HK$Mn) 2,497.9 3,719.0 987.1 1,276.4 5,435.3 81.6 14,807.6 -Monthly average gap (HK$) 2,000 2,600 2,900 3,400 3,300 2,600 3,100 -
(B) Characteristics of householdsI. No. of households ('000)
(i) Economic characteristicsEconomically active 20.1 2.3 12.4 24.1 100.4 1.1 174.9 1 969.0
(19.5%) (1.9%) (43.7%) (76.2%) (72.9%) (43.6%) (43.4%) (82.5%) Working 13.1 2.2 10.9 22.3 94.1 0.6 156.7 1 938.0
(12.8%) (1.8%) (38.4%) (70.4%) (68.4%) (21.1%) (38.9%) (81.2%) Unemployed 7.0 § 1.5 1.8 6.3 0.6 18.2 30.9
(6.8%) § (5.3%) (5.8%) (4.6%) (22.5%) (4.5%) (1.3%) Economically inactive 82.6 118.3 16.0 7.6 37.3 1.5 228.1 417.5
(80.5%) (98.1%) (56.3%) (23.8%) (27.1%) (56.4%) (56.6%) (17.5%) (ii) Whether receiving CSSA or notYes 102.7 32.3 19.4 8.4 40.0 § 102.7 200.4
(100.0%) (26.8%) (68.1%) (26.6%) (29.1%) § (25.5%) (8.4%) No - 88.3 9.1 23.2 97.7 2.4 300.3 2 186.1
- (73.2%) (31.9%) (73.4%) (70.9%) (93.0%) (74.5%) (91.6%) Reason: no financial needs - 61.7 3.1 7.2 34.3 1.5 156.0 175.6
- (51.2%) (11.0%) (22.7%) (24.9%) (58.2%) (38.7%) (7.4%) - 8.3 0.5 1.0 5.3 § 22.5 24.8 - (6.9%) (1.8%) (3.3%) (3.8%) § (5.6%) (1.0%)
(iii) Housing characteristicsPublic rental housing 82.5 48.4 19.8 19.7 83.5 § 188.9 727.7
(80.3%) (40.2%) (69.7%) (62.2%) (60.6%) § (46.9%) (30.5%) Subsidised sale flats 3.4 16.0 1.5 1.8 14.5 § 54.1 375.8
(3.3%) (13.3%) (5.4%) (5.5%) (10.5%) § (13.4%) (15.7%) with mortgages or loans 0.4 0.5 § 0.4 3.6 § 7.2 108.1
(0.4%) (0.5%) § (1.3%) (2.6%) § (1.8%) (4.5%) Private permanent housing 15.9 54.8 7.0 9.7 38.4 2.1 155.8 1 267.6
(15.5%) (45.4%) (24.6%) (30.7%) (27.9%) (79.0%) (38.7%) (53.1%) Owner-occupiers 5.2 46.0 2.9 3.0 24.6 0.6 121.7 866.7
(5.0%) (38.2%) (10.1%) (9.5%) (17.9%) (24.5%) (30.2%) (36.3%) - with mortgages or loans § 0.6 0.4 0.6 5.5 § 11.8 344.8
§ (0.5%) (1.5%) (1.9%) (4.0%) § (2.9%) (14.4%) Tenants 9.6 3.1 3.7 6.2 11.1 0.8 20.7 315.8
(9.3%) (2.5%) (13.0%) (19.5%) (8.1%) (30.2%) (5.1%) (13.2%) - in rooms / bedspaces / cocklofts 1.3 § 0.6 0.7 1.4 § 2.0 12.5
(1.2%) § (2.0%) (2.3%) (1.0%) § (0.5%) (0.5%) Temporary housing 0.9 1.3 § 0.5 1.3 § 4.2 15.4
(0.9%) (1.1%) § (1.5%) (1.0%) § (1.0%) (0.6%) (iv) Other characteristicsWith FDH(s) § 6.4 0.6 § 3.8 § 13.6 247.2
§ (5.3%) (2.2%) § (2.8%) § (3.4%) (10.4%) With new arrival(s) 8.4 § 2.9 31.7 26.3 § 31.7 86.9
(8.2%) § (10.2%) (100.0%) (19.1%) § (7.9%) (3.6%) With children 40.0 - 28.5 26.3 137.7 - 137.7 740.4
(39.0%) - (100.0%) (83.0%) (100.0%) - (34.2%) (31.0%) II. Other household characteristics
Average household size 2.3 1.6 2.8 3.5 3.6 1.4 2.5 2.8Average no. of economically active members 0.2 @ 0.5 0.9 0.9 0.5 0.5 1.5Median monthly household income (HK$) 6,200 3,200 7,500 9,300 9,800 1,900 6,100 20,400
After policy intervention (recurrent cash)
Reason: income and assets tests notpassed
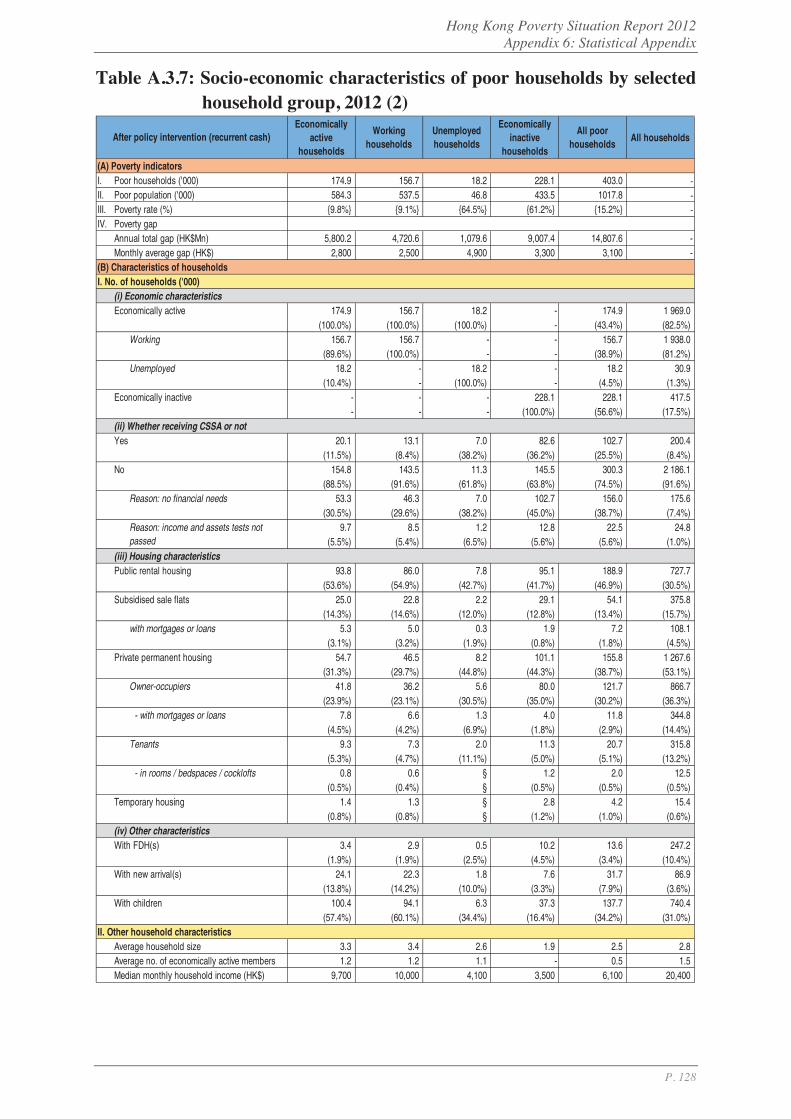
Hong Kong Poverty Situation Report 2012 Appendix 6: Statistical Appendix
P. 128
Table A.3.7: Socio-economic characteristics of poor households by selected household group, 2012 (2)
Economicallyactive
households
Workinghouseholds
Unemployedhouseholds
Economicallyinactive
households
All poorhouseholds
All households
(A) Poverty indicatorsI. Poor households ('000) 174.9 156.7 18.2 228.1 403.0 -II. Poor population ('000) 584.3 537.5 46.8 433.5 1017.8 -III. Poverty rate (%) {9.8%} {9.1%} {64.5%} {61.2%} {15.2%} -IV. Poverty gap
Annual total gap (HK$Mn) 5,800.2 4,720.6 1,079.6 9,007.4 14,807.6 -Monthly average gap (HK$) 2,800 2,500 4,900 3,300 3,100 -
(B) Characteristics of householdsI. No. of households ('000)
(i) Economic characteristicsEconomically active 174.9 156.7 18.2 - 174.9 1 969.0
(100.0%) (100.0%) (100.0%) - (43.4%) (82.5%) Working 156.7 156.7 - - 156.7 1 938.0
(89.6%) (100.0%) - - (38.9%) (81.2%) Unemployed 18.2 - 18.2 - 18.2 30.9
(10.4%) - (100.0%) - (4.5%) (1.3%) Economically inactive - - - 228.1 228.1 417.5
- - - (100.0%) (56.6%) (17.5%) (ii) Whether receiving CSSA or notYes 20.1 13.1 7.0 82.6 102.7 200.4
(11.5%) (8.4%) (38.2%) (36.2%) (25.5%) (8.4%) No 154.8 143.5 11.3 145.5 300.3 2 186.1
(88.5%) (91.6%) (61.8%) (63.8%) (74.5%) (91.6%) Reason: no financial needs 53.3 46.3 7.0 102.7 156.0 175.6
(30.5%) (29.6%) (38.2%) (45.0%) (38.7%) (7.4%) 9.7 8.5 1.2 12.8 22.5 24.8
(5.5%) (5.4%) (6.5%) (5.6%) (5.6%) (1.0%) (iii) Housing characteristicsPublic rental housing 93.8 86.0 7.8 95.1 188.9 727.7
(53.6%) (54.9%) (42.7%) (41.7%) (46.9%) (30.5%) Subsidised sale flats 25.0 22.8 2.2 29.1 54.1 375.8
(14.3%) (14.6%) (12.0%) (12.8%) (13.4%) (15.7%) with mortgages or loans 5.3 5.0 0.3 1.9 7.2 108.1
(3.1%) (3.2%) (1.9%) (0.8%) (1.8%) (4.5%) Private permanent housing 54.7 46.5 8.2 101.1 155.8 1 267.6
(31.3%) (29.7%) (44.8%) (44.3%) (38.7%) (53.1%) Owner-occupiers 41.8 36.2 5.6 80.0 121.7 866.7
(23.9%) (23.1%) (30.5%) (35.0%) (30.2%) (36.3%) - with mortgages or loans 7.8 6.6 1.3 4.0 11.8 344.8
(4.5%) (4.2%) (6.9%) (1.8%) (2.9%) (14.4%) Tenants 9.3 7.3 2.0 11.3 20.7 315.8
(5.3%) (4.7%) (11.1%) (5.0%) (5.1%) (13.2%) - in rooms / bedspaces / cocklofts 0.8 0.6 § 1.2 2.0 12.5
(0.5%) (0.4%) § (0.5%) (0.5%) (0.5%) Temporary housing 1.4 1.3 § 2.8 4.2 15.4
(0.8%) (0.8%) § (1.2%) (1.0%) (0.6%) (iv) Other characteristicsWith FDH(s) 3.4 2.9 0.5 10.2 13.6 247.2
(1.9%) (1.9%) (2.5%) (4.5%) (3.4%) (10.4%) With new arrival(s) 24.1 22.3 1.8 7.6 31.7 86.9
(13.8%) (14.2%) (10.0%) (3.3%) (7.9%) (3.6%) With children 100.4 94.1 6.3 37.3 137.7 740.4
(57.4%) (60.1%) (34.4%) (16.4%) (34.2%) (31.0%) II. Other household characteristics
Average household size 3.3 3.4 2.6 1.9 2.5 2.8Average no. of economically active members 1.2 1.2 1.1 - 0.5 1.5Median monthly household income (HK$) 9,700 10,000 4,100 3,500 6,100 20,400
After policy intervention (recurrent cash)
Reason: income and assets tests notpassed
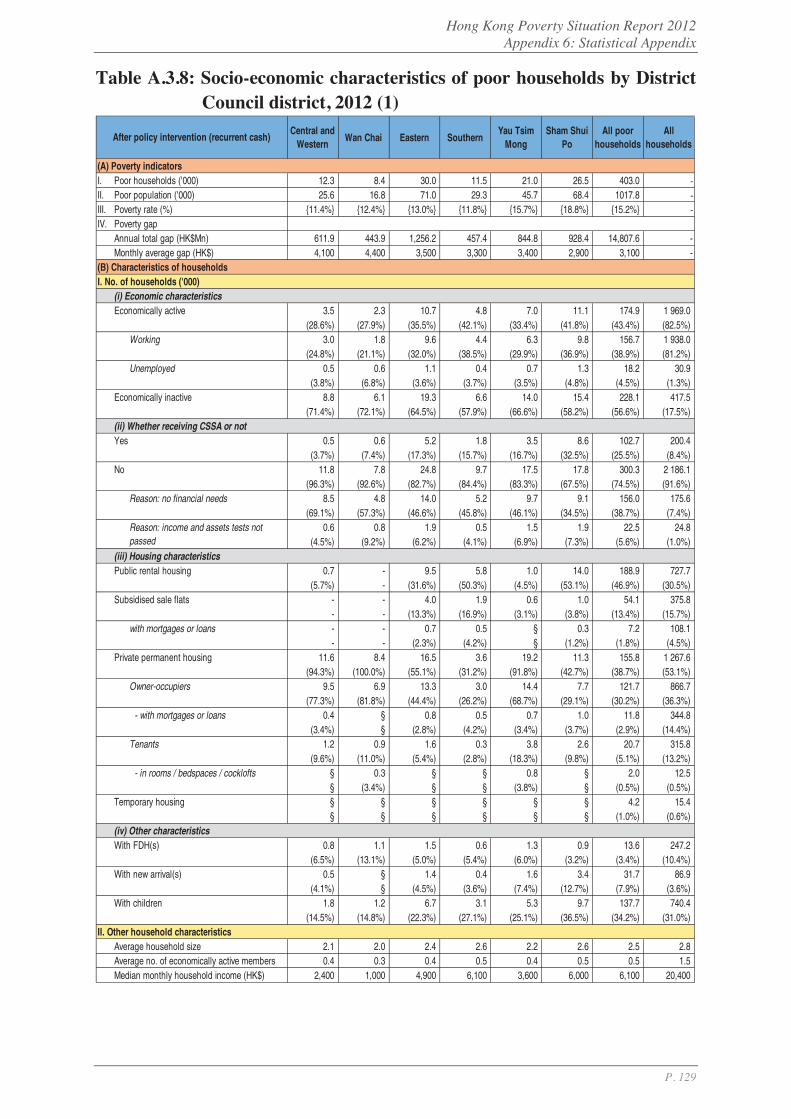
Hong Kong Poverty Situation Report 2012 Appendix 6: Statistical Appendix
P. 129
Table A.3.8: Socio-economic characteristics of poor households by District Council district, 2012 (1)
Central andWestern
Wan Chai Eastern SouthernYau Tsim
MongSham Shui
PoAll poor
householdsAll
households
(A) Poverty indicatorsI. Poor households ('000) 12.3 8.4 30.0 11.5 21.0 26.5 403.0 -II. Poor population ('000) 25.6 16.8 71.0 29.3 45.7 68.4 1017.8 -III. Poverty rate (%) {11.4%} {12.4%} {13.0%} {11.8%} {15.7%} {18.8%} {15.2%} -IV. Poverty gap
Annual total gap (HK$Mn) 611.9 443.9 1,256.2 457.4 844.8 928.4 14,807.6 -Monthly average gap (HK$) 4,100 4,400 3,500 3,300 3,400 2,900 3,100 -
(B) Characteristics of householdsI. No. of households ('000)
(i) Economic characteristicsEconomically active 3.5 2.3 10.7 4.8 7.0 11.1 174.9 1 969.0
(28.6%) (27.9%) (35.5%) (42.1%) (33.4%) (41.8%) (43.4%) (82.5%) Working 3.0 1.8 9.6 4.4 6.3 9.8 156.7 1 938.0
(24.8%) (21.1%) (32.0%) (38.5%) (29.9%) (36.9%) (38.9%) (81.2%) Unemployed 0.5 0.6 1.1 0.4 0.7 1.3 18.2 30.9
(3.8%) (6.8%) (3.6%) (3.7%) (3.5%) (4.8%) (4.5%) (1.3%) Economically inactive 8.8 6.1 19.3 6.6 14.0 15.4 228.1 417.5
(71.4%) (72.1%) (64.5%) (57.9%) (66.6%) (58.2%) (56.6%) (17.5%) (ii) Whether receiving CSSA or notYes 0.5 0.6 5.2 1.8 3.5 8.6 102.7 200.4
(3.7%) (7.4%) (17.3%) (15.7%) (16.7%) (32.5%) (25.5%) (8.4%) No 11.8 7.8 24.8 9.7 17.5 17.8 300.3 2 186.1
(96.3%) (92.6%) (82.7%) (84.4%) (83.3%) (67.5%) (74.5%) (91.6%) Reason: no financial needs 8.5 4.8 14.0 5.2 9.7 9.1 156.0 175.6
(69.1%) (57.3%) (46.6%) (45.8%) (46.1%) (34.5%) (38.7%) (7.4%) 0.6 0.8 1.9 0.5 1.5 1.9 22.5 24.8
(4.5%) (9.2%) (6.2%) (4.1%) (6.9%) (7.3%) (5.6%) (1.0%) (iii) Housing characteristicsPublic rental housing 0.7 - 9.5 5.8 1.0 14.0 188.9 727.7
(5.7%) - (31.6%) (50.3%) (4.5%) (53.1%) (46.9%) (30.5%) Subsidised sale flats - - 4.0 1.9 0.6 1.0 54.1 375.8
- - (13.3%) (16.9%) (3.1%) (3.8%) (13.4%) (15.7%) with mortgages or loans - - 0.7 0.5 § 0.3 7.2 108.1
- - (2.3%) (4.2%) § (1.2%) (1.8%) (4.5%) Private permanent housing 11.6 8.4 16.5 3.6 19.2 11.3 155.8 1 267.6
(94.3%) (100.0%) (55.1%) (31.2%) (91.8%) (42.7%) (38.7%) (53.1%) Owner-occupiers 9.5 6.9 13.3 3.0 14.4 7.7 121.7 866.7
(77.3%) (81.8%) (44.4%) (26.2%) (68.7%) (29.1%) (30.2%) (36.3%) - with mortgages or loans 0.4 § 0.8 0.5 0.7 1.0 11.8 344.8
(3.4%) § (2.8%) (4.2%) (3.4%) (3.7%) (2.9%) (14.4%) Tenants 1.2 0.9 1.6 0.3 3.8 2.6 20.7 315.8
(9.6%) (11.0%) (5.4%) (2.8%) (18.3%) (9.8%) (5.1%) (13.2%) - in rooms / bedspaces / cocklofts § 0.3 § § 0.8 § 2.0 12.5
§ (3.4%) § § (3.8%) § (0.5%) (0.5%) Temporary housing § § § § § § 4.2 15.4
§ § § § § § (1.0%) (0.6%) (iv) Other characteristicsWith FDH(s) 0.8 1.1 1.5 0.6 1.3 0.9 13.6 247.2
(6.5%) (13.1%) (5.0%) (5.4%) (6.0%) (3.2%) (3.4%) (10.4%) With new arrival(s) 0.5 § 1.4 0.4 1.6 3.4 31.7 86.9
(4.1%) § (4.5%) (3.6%) (7.4%) (12.7%) (7.9%) (3.6%) With children 1.8 1.2 6.7 3.1 5.3 9.7 137.7 740.4
(14.5%) (14.8%) (22.3%) (27.1%) (25.1%) (36.5%) (34.2%) (31.0%) II. Other household characteristics
Average household size 2.1 2.0 2.4 2.6 2.2 2.6 2.5 2.8Average no. of economically active members 0.4 0.3 0.4 0.5 0.4 0.5 0.5 1.5Median monthly household income (HK$) 2,400 1,000 4,900 6,100 3,600 6,000 6,100 20,400
After policy intervention (recurrent cash)
Reason: income and assets tests notpassed
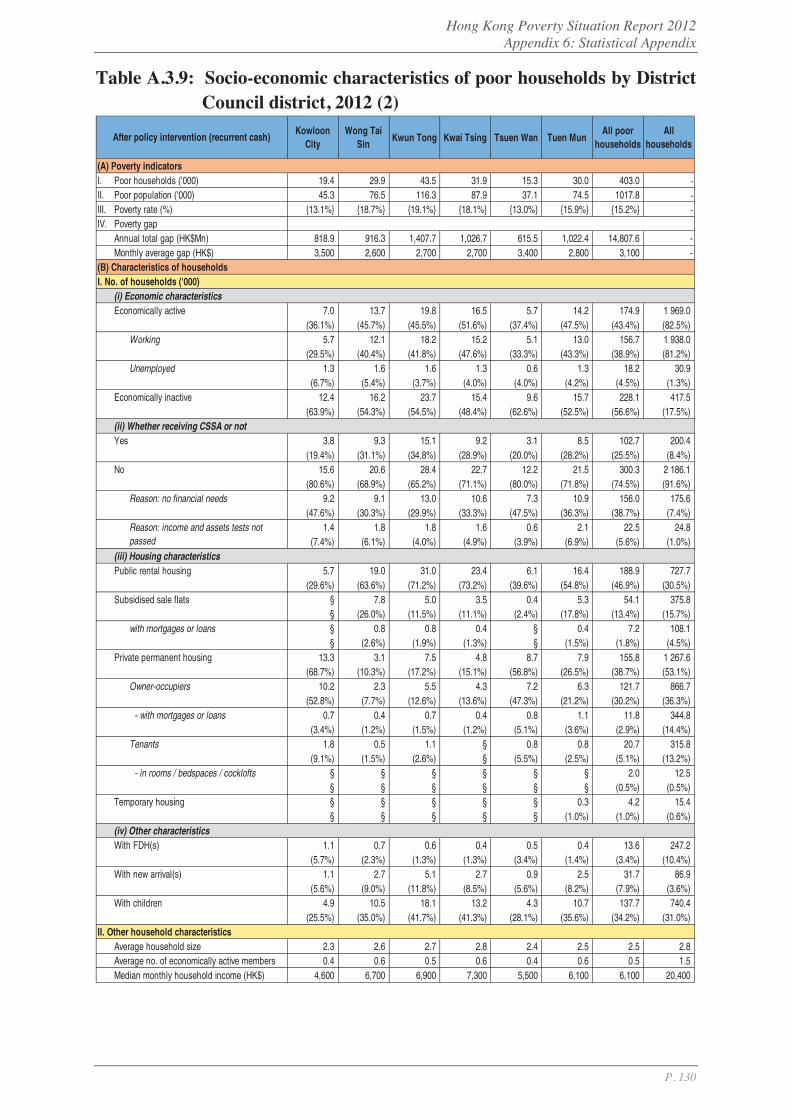
Hong Kong Poverty Situation Report 2012 Appendix 6: Statistical Appendix
P. 130
Table A.3.9: Socio-economic characteristics of poor households by District Council district, 2012 (2)
KowloonCity
Wong TaiSin
Kwun Tong Kwai Tsing Tsuen Wan Tuen MunAll poor
householdsAll
households
(A) Poverty indicatorsI. Poor households ('000) 19.4 29.9 43.5 31.9 15.3 30.0 403.0 -II. Poor population ('000) 45.3 76.5 116.3 87.9 37.1 74.5 1017.8 -III. Poverty rate (%) {13.1%} {18.7%} {19.1%} {18.1%} {13.0%} {15.9%} {15.2%} -IV. Poverty gap
Annual total gap (HK$Mn) 818.9 916.3 1,407.7 1,026.7 615.5 1,022.4 14,807.6 -Monthly average gap (HK$) 3,500 2,600 2,700 2,700 3,400 2,800 3,100 -
(B) Characteristics of householdsI. No. of households ('000)
(i) Economic characteristicsEconomically active 7.0 13.7 19.8 16.5 5.7 14.2 174.9 1 969.0
(36.1%) (45.7%) (45.5%) (51.6%) (37.4%) (47.5%) (43.4%) (82.5%) Working 5.7 12.1 18.2 15.2 5.1 13.0 156.7 1 938.0
(29.5%) (40.4%) (41.8%) (47.6%) (33.3%) (43.3%) (38.9%) (81.2%) Unemployed 1.3 1.6 1.6 1.3 0.6 1.3 18.2 30.9
(6.7%) (5.4%) (3.7%) (4.0%) (4.0%) (4.2%) (4.5%) (1.3%) Economically inactive 12.4 16.2 23.7 15.4 9.6 15.7 228.1 417.5
(63.9%) (54.3%) (54.5%) (48.4%) (62.6%) (52.5%) (56.6%) (17.5%) (ii) Whether receiving CSSA or notYes 3.8 9.3 15.1 9.2 3.1 8.5 102.7 200.4
(19.4%) (31.1%) (34.8%) (28.9%) (20.0%) (28.2%) (25.5%) (8.4%) No 15.6 20.6 28.4 22.7 12.2 21.5 300.3 2 186.1
(80.6%) (68.9%) (65.2%) (71.1%) (80.0%) (71.8%) (74.5%) (91.6%) Reason: no financial needs 9.2 9.1 13.0 10.6 7.3 10.9 156.0 175.6
(47.6%) (30.3%) (29.9%) (33.3%) (47.5%) (36.3%) (38.7%) (7.4%) 1.4 1.8 1.8 1.6 0.6 2.1 22.5 24.8
(7.4%) (6.1%) (4.0%) (4.9%) (3.9%) (6.9%) (5.6%) (1.0%) (iii) Housing characteristicsPublic rental housing 5.7 19.0 31.0 23.4 6.1 16.4 188.9 727.7
(29.6%) (63.6%) (71.2%) (73.2%) (39.6%) (54.8%) (46.9%) (30.5%) Subsidised sale flats § 7.8 5.0 3.5 0.4 5.3 54.1 375.8
§ (26.0%) (11.5%) (11.1%) (2.4%) (17.8%) (13.4%) (15.7%) with mortgages or loans § 0.8 0.8 0.4 § 0.4 7.2 108.1
§ (2.6%) (1.9%) (1.3%) § (1.5%) (1.8%) (4.5%) Private permanent housing 13.3 3.1 7.5 4.8 8.7 7.9 155.8 1 267.6
(68.7%) (10.3%) (17.2%) (15.1%) (56.8%) (26.5%) (38.7%) (53.1%) Owner-occupiers 10.2 2.3 5.5 4.3 7.2 6.3 121.7 866.7
(52.8%) (7.7%) (12.6%) (13.6%) (47.3%) (21.2%) (30.2%) (36.3%) - with mortgages or loans 0.7 0.4 0.7 0.4 0.8 1.1 11.8 344.8
(3.4%) (1.2%) (1.5%) (1.2%) (5.1%) (3.6%) (2.9%) (14.4%) Tenants 1.8 0.5 1.1 § 0.8 0.8 20.7 315.8
(9.1%) (1.5%) (2.6%) § (5.5%) (2.5%) (5.1%) (13.2%) - in rooms / bedspaces / cocklofts § § § § § § 2.0 12.5
§ § § § § § (0.5%) (0.5%) Temporary housing § § § § § 0.3 4.2 15.4
§ § § § § (1.0%) (1.0%) (0.6%) (iv) Other characteristicsWith FDH(s) 1.1 0.7 0.6 0.4 0.5 0.4 13.6 247.2
(5.7%) (2.3%) (1.3%) (1.3%) (3.4%) (1.4%) (3.4%) (10.4%) With new arrival(s) 1.1 2.7 5.1 2.7 0.9 2.5 31.7 86.9
(5.6%) (9.0%) (11.8%) (8.5%) (5.6%) (8.2%) (7.9%) (3.6%) With children 4.9 10.5 18.1 13.2 4.3 10.7 137.7 740.4
(25.5%) (35.0%) (41.7%) (41.3%) (28.1%) (35.6%) (34.2%) (31.0%) II. Other household characteristics
Average household size 2.3 2.6 2.7 2.8 2.4 2.5 2.5 2.8Average no. of economically active members 0.4 0.6 0.5 0.6 0.4 0.6 0.5 1.5Median monthly household income (HK$) 4,600 6,700 6,900 7,300 5,500 6,100 6,100 20,400
After policy intervention (recurrent cash)
Reason: income and assets tests notpassed

Hong Kong Poverty Situation Report 2012 Appendix 6: Statistical Appendix
P. 131
Table A.3.10: Socio-economic characteristics of poor households by District Council district, 2012 (3)
Yuen Long North Tai Po Sha Tin Sai Kung IslandsAll poor
householdsAll
households
(A) Poverty indicatorsI. Poor households ('000) 38.3 19.0 12.7 29.8 16.4 7.3 403.0 -II. Poor population ('000) 103.7 49.2 31.1 76.4 43.8 19.2 1017.8 -III. Poverty rate (%) {18.6%} {16.8%} {11.1%} {12.8%} {10.7%} {14.3%} {15.2%} -IV. Poverty gap
Annual total gap (HK$Mn) 1,337.9 649.7 512.2 1,098.4 583.6 275.8 14,807.6 -Monthly average gap (HK$) 2,900 2,800 3,400 3,100 3,000 3,100 3,100 -
(B) Characteristics of householdsI. No. of households ('000)
(i) Economic characteristicsEconomically active 20.0 8.8 4.5 13.4 8.6 3.3 174.9 1 969.0
(52.2%) (46.3%) (35.2%) (45.0%) (52.3%) (45.5%) (43.4%) (82.5%) Working 18.3 7.9 4.0 11.8 7.7 2.8 156.7 1 938.0
(47.8%) (41.5%) (31.5%) (39.7%) (47.0%) (38.8%) (38.9%) (81.2%) Unemployed 1.7 0.9 0.5 1.6 0.9 0.5 18.2 30.9
(4.4%) (4.8%) (3.7%) (5.4%) (5.3%) (6.7%) (4.5%) (1.3%) Economically inactive 18.3 10.2 8.2 16.4 7.8 4.0 228.1 417.5
(47.8%) (53.7%) (64.8%) (55.0%) (47.7%) (54.5%) (56.6%) (17.5%) (ii) Whether receiving CSSA or notYes 10.8 6.1 3.6 7.9 3.3 1.8 102.7 200.4
(28.3%) (31.9%) (28.6%) (26.6%) (20.3%) (24.9%) (25.5%) (8.4%) No 27.4 13.0 9.0 21.9 13.1 5.5 300.3 2 186.1
(71.7%) (68.1%) (71.4%) (73.4%) (79.7%) (75.1%) (74.5%) (91.6%) Reason: no financial needs 12.7 6.3 5.1 11.6 6.0 3.0 156.0 175.6
(33.1%) (33.0%) (40.2%) (38.9%) (36.5%) (41.0%) (38.7%) (7.4%) 1.8 0.5 0.6 1.8 1.2 0.3 22.5 24.8
(4.8%) (2.7%) (4.8%) (6.0%) (7.0%) (4.4%) (5.6%) (1.0%) (iii) Housing characteristicsPublic rental housing 19.0 7.2 4.5 15.7 6.5 3.4 188.9 727.7
(49.7%) (37.7%) (35.3%) (52.7%) (39.8%) (46.8%) (46.9%) (30.5%) Subsidised sale flats 3.3 3.7 3.0 8.4 5.4 0.4 54.1 375.8
(8.6%) (19.7%) (23.8%) (28.3%) (32.6%) (5.3%) (13.4%) (15.7%) with mortgages or loans 1.0 0.5 § 0.6 0.9 § 7.2 108.1
(2.6%) (2.5%) § (1.9%) (5.3%) § (1.8%) (4.5%) Private permanent housing 14.8 6.7 4.8 5.5 4.5 3.5 155.8 1 267.6
(38.7%) (35.1%) (38.0%) (18.6%) (27.5%) (47.9%) (38.7%) (53.1%) Owner-occupiers 10.9 4.6 4.0 5.1 3.6 2.8 121.7 866.7
(28.4%) (24.4%) (31.8%) (17.2%) (21.8%) (37.9%) (30.2%) (36.3%) - with mortgages or loans 1.3 0.7 0.4 1.1 0.5 § 11.8 344.8
(3.5%) (3.9%) (3.0%) (3.7%) (3.2%) § (2.9%) (14.4%) Tenants 2.0 1.6 0.4 § 0.5 0.4 20.7 315.8
(5.2%) (8.2%) (3.5%) § (3.3%) (5.1%) (5.1%) (13.2%) - in rooms / bedspaces / cocklofts § § § § § § 2.0 12.5
§ § § § § § (0.5%) (0.5%) Temporary housing 1.1 1.4 0.4 § § § 4.2 15.4
(2.9%) (7.4%) (2.9%) § § § (1.0%) (0.6%) (iv) Other characteristicsWith FDH(s) 1.2 0.5 0.5 0.7 0.7 § 13.6 247.2
(3.1%) (2.7%) (4.2%) (2.2%) (4.1%) § (3.4%) (10.4%) With new arrival(s) 3.3 2.1 0.4 2.4 0.6 0.4 31.7 86.9
(8.7%) (10.9%) (3.5%) (8.2%) (3.6%) (5.4%) (7.9%) (3.6%) With children 17.7 8.1 3.7 9.6 6.2 3.0 137.7 740.4
(46.3%) (42.8%) (28.9%) (32.1%) (38.0%) (40.8%) (34.2%) (31.0%) II. Other household characteristics
Average household size 2.7 2.6 2.5 2.6 2.7 2.6 2.5 2.8Average no. of economically active members 0.6 0.6 0.4 0.6 0.7 0.6 0.5 1.5Median monthly household income (HK$) 7,000 6,300 5,100 6,300 6,900 5,400 6,100 20,400
After policy intervention (recurrent cash)
Reason: income and assets tests notpassed
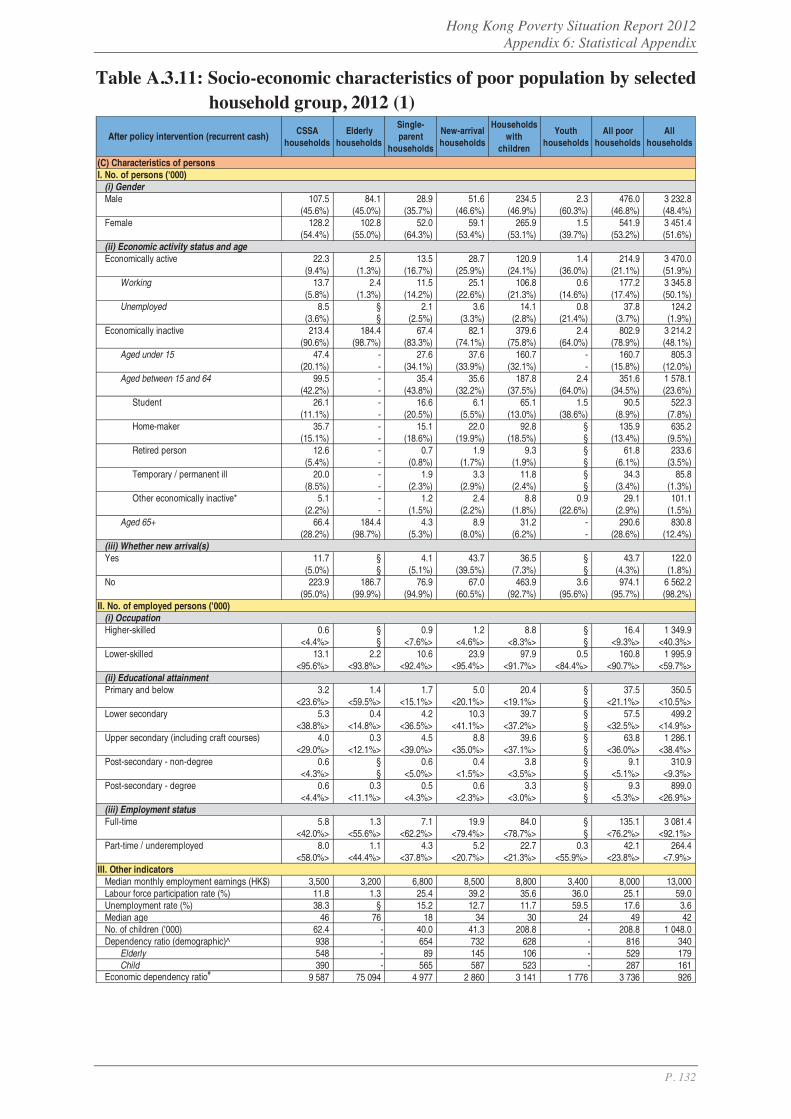
Hong Kong Poverty Situation Report 2012 Appendix 6: Statistical Appendix
P. 132
Table A.3.11: Socio-economic characteristics of poor population by selected household group, 2012 (1)
CSSAhouseholds
Elderlyhouseholds
Single-parent
households
New-arrivalhouseholds
Householdswith
children
Youthhouseholds
All poorhouseholds
Allhouseholds
(C) Characteristics of personsI. No. of persons ('000)
(i) Gender Male 107.5 84.1 28.9 51.6 234.5 2.3 476.0 3 232.8
(45.6%) (45.0%) (35.7%) (46.6%) (46.9%) (60.3%) (46.8%) (48.4%) Female 128.2 102.8 52.0 59.1 265.9 1.5 541.9 3 451.4
(54.4%) (55.0%) (64.3%) (53.4%) (53.1%) (39.7%) (53.2%) (51.6%) (ii) Economic activity status and ageEconomically active 22.3 2.5 13.5 28.7 120.9 1.4 214.9 3 470.0
(9.4%) (1.3%) (16.7%) (25.9%) (24.1%) (36.0%) (21.1%) (51.9%) Working 13.7 2.4 11.5 25.1 106.8 0.6 177.2 3 345.8
(5.8%) (1.3%) (14.2%) (22.6%) (21.3%) (14.6%) (17.4%) (50.1%) Unemployed 8.5 § 2.1 3.6 14.1 0.8 37.8 124.2
(3.6%) § (2.5%) (3.3%) (2.8%) (21.4%) (3.7%) (1.9%) Economically inactive 213.4 184.4 67.4 82.1 379.6 2.4 802.9 3 214.2
(90.6%) (98.7%) (83.3%) (74.1%) (75.8%) (64.0%) (78.9%) (48.1%) Aged under 15 47.4 - 27.6 37.6 160.7 - 160.7 805.3
(20.1%) - (34.1%) (33.9%) (32.1%) - (15.8%) (12.0%) Aged between 15 and 64 99.5 - 35.4 35.6 187.8 2.4 351.6 1 578.1
(42.2%) - (43.8%) (32.2%) (37.5%) (64.0%) (34.5%) (23.6%) Student 26.1 - 16.6 6.1 65.1 1.5 90.5 522.3
(11.1%) - (20.5%) (5.5%) (13.0%) (38.6%) (8.9%) (7.8%) Home-maker 35.7 - 15.1 22.0 92.8 § 135.9 635.2
(15.1%) - (18.6%) (19.9%) (18.5%) § (13.4%) (9.5%) Retired person 12.6 - 0.7 1.9 9.3 § 61.8 233.6
(5.4%) - (0.8%) (1.7%) (1.9%) § (6.1%) (3.5%) Temporary / permanent ill 20.0 - 1.9 3.3 11.8 § 34.3 85.8
(8.5%) - (2.3%) (2.9%) (2.4%) § (3.4%) (1.3%) Other economically inactive* 5.1 - 1.2 2.4 8.8 0.9 29.1 101.1
(2.2%) - (1.5%) (2.2%) (1.8%) (22.6%) (2.9%) (1.5%) Aged 65+ 66.4 184.4 4.3 8.9 31.2 - 290.6 830.8
(28.2%) (98.7%) (5.3%) (8.0%) (6.2%) - (28.6%) (12.4%) (iii) Whether new arrival(s)Yes 11.7 § 4.1 43.7 36.5 § 43.7 122.0
(5.0%) § (5.1%) (39.5%) (7.3%) § (4.3%) (1.8%) No 223.9 186.7 76.9 67.0 463.9 3.6 974.1 6 562.2
(95.0%) (99.9%) (94.9%) (60.5%) (92.7%) (95.6%) (95.7%) (98.2%) II. No. of employed persons ('000)
(i) OccupationHigher-skilled 0.6 § 0.9 1.2 8.8 § 16.4 1 349.9
<4.4%> § <7.6%> <4.6%> <8.3%> § <9.3%> <40.3%> Lower-skilled 13.1 2.2 10.6 23.9 97.9 0.5 160.8 1 995.9
<95.6%> <93.8%> <92.4%> <95.4%> <91.7%> <84.4%> <90.7%> <59.7%> (ii) Educational attainmentPrimary and below 3.2 1.4 1.7 5.0 20.4 § 37.5 350.5
<23.6%> <59.5%> <15.1%> <20.1%> <19.1%> § <21.1%> <10.5%> Lower secondary 5.3 0.4 4.2 10.3 39.7 § 57.5 499.2
<38.8%> <14.8%> <36.5%> <41.1%> <37.2%> § <32.5%> <14.9%> Upper secondary (including craft courses) 4.0 0.3 4.5 8.8 39.6 § 63.8 1 286.1
<29.0%> <12.1%> <39.0%> <35.0%> <37.1%> § <36.0%> <38.4%> Post-secondary - non-degree 0.6 § 0.6 0.4 3.8 § 9.1 310.9
<4.3%> § <5.0%> <1.5%> <3.5%> § <5.1%> <9.3%> Post-secondary - degree 0.6 0.3 0.5 0.6 3.3 § 9.3 899.0
<4.4%> <11.1%> <4.3%> <2.3%> <3.0%> § <5.3%> <26.9%> (iii) Employment statusFull-time 5.8 1.3 7.1 19.9 84.0 § 135.1 3 081.4
<42.0%> <55.6%> <62.2%> <79.4%> <78.7%> § <76.2%> <92.1%> Part-time / underemployed 8.0 1.1 4.3 5.2 22.7 0.3 42.1 264.4
<58.0%> <44.4%> <37.8%> <20.7%> <21.3%> <55.9%> <23.8%> <7.9%> III. Other indicators
Median monthly employment earnings (HK$) 3,500 3,200 6,800 8,500 8,800 3,400 8,000 13,000Labour force participation rate (%) 11.8 1.3 25.4 39.2 35.6 36.0 25.1 59.0Unemployment rate (%) 38.3 § 15.2 12.7 11.7 59.5 17.6 3.6Median age 46 76 18 34 30 24 49 42No. of children ('000) 62.4 - 40.0 41.3 208.8 - 208.8 1 048.0 Dependency ratio (demographic)^ 938 - 654 732 628 - 816 340
Elderly 548 - 89 145 106 - 529 179 Child 390 - 565 587 523 - 287 161
Economic dependency ratio# 9 587 75 094 4 977 2 860 3 141 1 776 3 736 926
After policy intervention (recurrent cash)

Hong Kong Poverty Situation Report 2012 Appendix 6: Statistical Appendix
P. 133
Table A.3.12: Socio-economic characteristics of poor population by selected household group, 2012 (2)
Economicallyactive
households
Workinghouseholds
Unemployedhouseholds
Economicallyinactive
households
All poorhouseholds
All households
(C) Characteristics of personsI. No. of persons ('000)
(i) Gender Male 281.9 258.5 23.4 194.1 476.0 3 232.8
(48.2%) (48.1%) (50.1%) (44.8%) (46.8%) (48.4%) Female 302.4 279.0 23.4 239.4 541.9 3 451.4
(51.8%) (51.9%) (49.9%) (55.2%) (53.2%) (51.6%) (ii) Economic activity status and ageEconomically active 214.9 195.4 19.6 - 214.9 3 470.0
(36.8%) (36.3%) (41.8%) - (21.1%) (51.9%) Working 177.2 177.2 - - 177.2 3 345.8
(30.3%) (33.0%) - - (17.4%) (50.1%) Unemployed 37.8 18.2 19.6 - 37.8 124.2
(6.5%) (3.4%) (41.8%) - (3.7%) (1.9%) Economically inactive 369.4 342.1 27.3 433.5 802.9 3 214.2
(63.2%) (63.7%) (58.2%) (100.0%) (78.9%) (48.1%) Aged under 15 119.4 111.7 7.8 41.2 160.7 805.3
(20.4%) (20.8%) (16.6%) (9.5%) (15.8%) (12.0%) Aged between 15 and 64 191.8 179.8 12.0 159.8 351.6 1 578.1
(32.8%) (33.4%) (25.7%) (36.9%) (34.5%) (23.6%) Student 64.4 60.9 3.6 26.0 90.5 522.3
(11.0%) (11.3%) (7.7%) (6.0%) (8.9%) (7.8%) Home-maker 86.3 80.8 5.5 49.6 135.9 635.2
(14.8%) (15.0%) (11.8%) (11.4%) (13.4%) (9.5%) Retired person 19.7 18.4 1.2 42.1 61.8 233.6
(3.4%) (3.4%) (2.6%) (9.7%) (6.1%) (3.5%) Temporary / permanent ill 9.6 8.7 0.9 24.8 34.3 85.8
(1.6%) (1.6%) (1.8%) (5.7%) (3.4%) (1.3%) Other economically inactive* 11.8 11.0 0.8 17.3 29.1 101.1
(2.0%) (2.0%) (1.8%) (4.0%) (2.9%) (1.5%) Aged 65+ 58.1 50.7 7.5 232.5 290.6 830.8
(10.0%) (9.4%) (15.9%) (53.6%) (28.6%) (12.4%) (iii) Whether new arrival(s)Yes 34.2 31.5 2.7 9.5 43.7 122.0
(5.9%) (5.9%) (5.8%) (2.2%) (4.3%) (1.8%) No 550.1 506.0 44.1 424.0 974.1 6 562.2
(94.1%) (94.1%) (94.2%) (97.8%) (95.7%) (98.2%) II. No. of employed persons ('000)
(i) OccupationHigher-skilled 16.4 16.4 - - 16.4 1 349.9
<9.3%> <9.3%> - - <9.3%> <40.3%> Lower-skilled 160.8 160.8 - - 160.8 1 995.9
<90.7%> <90.7%> - - <90.7%> <59.7%> (ii) Educational attainmentPrimary and below 37.5 37.5 - - 37.5 350.5
<21.1%> <21.1%> - - <21.1%> <10.5%> Lower secondary 57.5 57.5 - - 57.5 499.2
<32.5%> <32.5%> - - <32.5%> <14.9%> Upper secondary (including craft courses) 63.8 63.8 - - 63.8 1 286.1
<36.0%> <36.0%> - - <36.0%> <38.4%> Post-secondary - non-degree 9.1 9.1 - - 9.1 310.9
<5.1%> <5.1%> - - <5.1%> <9.3%> Post-secondary - degree 9.3 9.3 - - 9.3 899.0
<5.3%> <5.3%> - - <5.3%> <26.9%> (iii) Employment statusFull-time 135.1 135.1 - - 135.1 3 081.4
<76.2%> <76.2%> - - <76.2%> <92.1%> Part-time / underemployed 42.1 42.1 - - 42.1 264.4
<23.8%> <23.8%> - - <23.8%> <7.9%> III. Other indicators
Median monthly employment earnings (HK$) 8,000 8,000 - - 8,000 13,000Labour force participation rate (%) 46.2 45.9 50.1 - 25.1 59.0Unemployment rate (%) 17.6 9.3 100.0 - 17.6 3.6Median age 38 38 42 66 49 42No. of children ('000) 154.6 145.0 9.6 54.1 208.8 1 048.0 Dependency ratio (demographic)^ 458 455 487 1 713 816 340
Elderly 160 153 241 1 455 529 179 Child 298 302 246 258 287 161
Economic dependency ratio# 1 719 1 751 1 394 - 3 736 926
After policy intervention (recurrent cash)

Hong Kong Poverty Situation Report 2012 Appendix 6: Statistical Appendix
P. 134
Table A.3.13: Socio-economic characteristics of poor population by District Council district, 2012 (1)
Central andWestern
Wan Chai Eastern SouthernYau Tsim
MongSham Shui
PoAll poor
householdsAll
households
(C) Characteristics of personsI. No. of persons ('000)
(i) Gender Male 12.3 8.2 33.4 13.9 20.9 31.2 476.0 3 232.8
(48.1%) (48.8%) (47.0%) (47.5%) (45.8%) (45.7%) (46.8%) (48.4%) Female 13.3 8.6 37.6 15.4 24.8 37.1 541.9 3 451.4
(51.9%) (51.2%) (53.0%) (52.5%) (54.2%) (54.3%) (53.2%) (51.6%) (ii) Economic activity status and ageEconomically active 4.4 2.8 13.5 6.1 8.7 13.5 214.9 3 470.0
(17.3%) (16.9%) (19.0%) (20.8%) (18.9%) (19.7%) (21.1%) (51.9%) Working 3.7 1.9 11.1 5.0 7.2 11.3 177.2 3 345.8
(14.4%) (11.6%) (15.7%) (17.1%) (15.7%) (16.6%) (17.4%) (50.1%) Unemployed 0.7 0.9 2.4 1.1 1.5 2.1 37.8 124.2
(2.9%) (5.4%) (3.4%) (3.7%) (3.2%) (3.1%) (3.7%) (1.9%) Economically inactive 21.1 13.9 57.5 23.2 37.1 54.9 802.9 3 214.2
(82.7%) (83.1%) (81.0%) (79.2%) (81.1%) (80.3%) (78.9%) (48.1%) Aged under 15 2.0 1.4 7.0 3.4 6.3 12.4 160.7 805.3
(7.8%) (8.3%) (9.8%) (11.5%) (13.7%) (18.2%) (15.8%) (12.0%) Aged between 15 and 64 8.0 5.0 24.7 9.7 14.7 21.5 351.6 1 578.1
(31.4%) (29.7%) (34.8%) (33.0%) (32.2%) (31.4%) (34.5%) (23.6%) Student 1.7 0.9 5.6 2.2 3.5 6.1 90.5 522.3
(6.7%) (5.3%) (7.9%) (7.5%) (7.6%) (8.9%) (8.9%) (7.8%) Home-maker 2.5 1.8 8.1 3.3 5.2 8.4 135.9 635.2
(9.7%) (10.8%) (11.5%) (11.4%) (11.4%) (12.3%) (13.4%) (9.5%) Retired person 2.7 1.5 6.1 2.5 3.2 3.3 61.8 233.6
(10.5%) (8.7%) (8.7%) (8.4%) (6.9%) (4.8%) (6.1%) (3.5%) Temporary / permanent ill 0.3 0.3 2.2 0.9 1.1 2.0 34.3 85.8
(1.3%) (1.5%) (3.1%) (3.0%) (2.5%) (2.9%) (3.4%) (1.3%) Other economically inactive* 0.8 0.6 2.6 0.8 1.8 1.7 29.1 101.1
(3.3%) (3.4%) (3.6%) (2.7%) (3.9%) (2.5%) (2.9%) (1.5%) Aged 65+ 11.1 7.6 25.8 10.2 16.1 20.9 290.6 830.8
(43.5%) (45.1%) (36.4%) (34.7%) (35.2%) (30.6%) (28.6%) (12.4%) (iii) Whether new arrival(s)Yes 0.7 0.4 1.7 0.5 2.9 5.3 43.7 122.0
(2.8%) (2.5%) (2.4%) (1.7%) (6.3%) (7.7%) (4.3%) (1.8%) No 24.9 16.4 69.3 28.8 42.9 63.1 974.1 6 562.2
(97.2%) (97.5%) (97.6%) (98.3%) (93.7%) (92.3%) (95.7%) (98.2%) II. No. of employed persons ('000)
(i) OccupationHigher-skilled 0.5 0.6 1.2 0.7 0.8 1.2 16.4 1 349.9
<12.3%> <30.3%> <11.0%> <13.2%> <11.4%> <10.2%> <9.3%> <40.3%> Lower-skilled 3.2 1.4 9.9 4.4 6.4 10.2 160.8 1 995.9
<87.7%> <69.7%> <89.0%> <86.8%> <88.6%> <89.8%> <90.7%> <59.7%> (ii) Educational attainmentPrimary and below 0.8 0.4 2.6 1.0 1.7 2.9 37.5 350.5
<21.2%> <19.3%> <23.6%> <20.7%> <24.3%> <25.7%> <21.1%> <10.5%> Lower secondary 1.1 § 3.3 1.6 2.0 3.3 57.5 499.2
<28.5%> § <29.5%> <30.9%> <27.2%> <28.7%> <32.5%> <14.9%> Upper secondary (including craft courses) 1.1 1.0 3.3 1.9 2.7 4.1 63.8 1 286.1
<29.9%> <51.3%> <29.5%> <37.1%> <37.5%> <35.9%> <36.0%> <38.4%> Post-secondary - non-degree 0.4 § 0.7 0.3 0.5 0.5 9.1 310.9
<11.4%> § <6.5%> <5.6%> <6.5%> <4.7%> <5.1%> <9.3%> Post-secondary - degree 0.3 0.3 1.2 0.3 0.3 0.6 9.3 899.0
<9.1%> <14.8%> <10.8%> <5.8%> <4.4%> <5.0%> <5.3%> <26.9%> (iii) Employment statusFull-time 2.7 1.4 8.2 3.6 5.3 8.5 135.1 3 081.4
<72.8%> <72.7%> <73.9%> <72.4%> <73.1%> <74.7%> <76.2%> <92.1%> Part-time / underemployed 1.0 0.5 2.9 1.4 1.9 2.9 42.1 264.4
<27.2%> <27.3%> <26.1%> <27.5%> <26.9%> <25.2%> <23.8%> <7.9%> III. Other indicators
Median monthly employment earnings (HK$) 6,500 8,000 7,800 8,000 7,500 7,500 8,000 13,000Labour force participation rate (%) 18.8 18.5 21.1 23.5 21.9 24.1 25.1 59.0Unemployment rate (%) 16.8 31.7 17.7 17.6 17.1 15.8 17.6 3.6Median age 62 63 58 55 56 48 49 42No. of children ('000) 2.5 1.8 9.5 4.6 7.8 15.8 208.8 1 048.0 Dependency ratio (demographic)^ 1 096 1 197 890 862 1 007 974 816 340
Elderly 933 1 016 704 648 732 615 529 179 Child 163 181 186 214 274 359 287 161
Economic dependency ratio# 4 768 4 900 4 258 3 812 4 278 4 068 3 736 926
After policy intervention (recurrent cash)
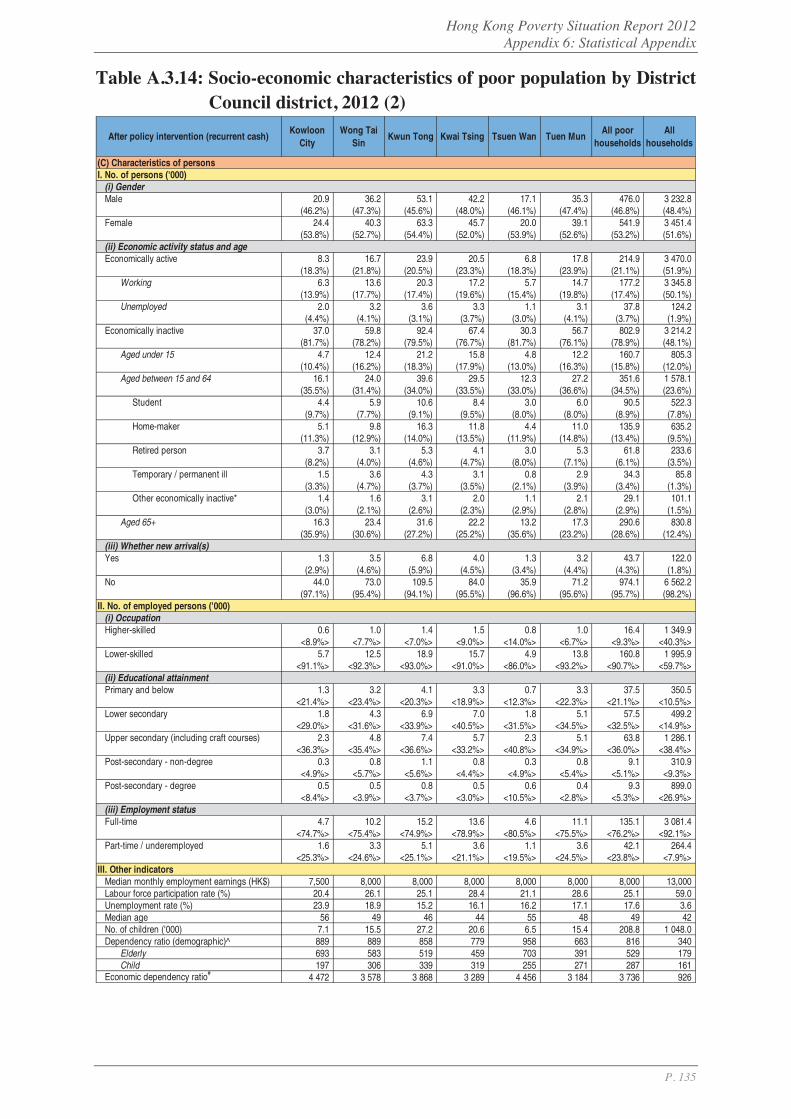
Hong Kong Poverty Situation Report 2012 Appendix 6: Statistical Appendix
P. 135
Table A.3.14: Socio-economic characteristics of poor population by District Council district, 2012 (2)
KowloonCity
Wong TaiSin
Kwun Tong Kwai Tsing Tsuen Wan Tuen MunAll poor
householdsAll
households
(C) Characteristics of personsI. No. of persons ('000)
(i) Gender Male 20.9 36.2 53.1 42.2 17.1 35.3 476.0 3 232.8
(46.2%) (47.3%) (45.6%) (48.0%) (46.1%) (47.4%) (46.8%) (48.4%) Female 24.4 40.3 63.3 45.7 20.0 39.1 541.9 3 451.4
(53.8%) (52.7%) (54.4%) (52.0%) (53.9%) (52.6%) (53.2%) (51.6%) (ii) Economic activity status and ageEconomically active 8.3 16.7 23.9 20.5 6.8 17.8 214.9 3 470.0
(18.3%) (21.8%) (20.5%) (23.3%) (18.3%) (23.9%) (21.1%) (51.9%) Working 6.3 13.6 20.3 17.2 5.7 14.7 177.2 3 345.8
(13.9%) (17.7%) (17.4%) (19.6%) (15.4%) (19.8%) (17.4%) (50.1%) Unemployed 2.0 3.2 3.6 3.3 1.1 3.1 37.8 124.2
(4.4%) (4.1%) (3.1%) (3.7%) (3.0%) (4.1%) (3.7%) (1.9%) Economically inactive 37.0 59.8 92.4 67.4 30.3 56.7 802.9 3 214.2
(81.7%) (78.2%) (79.5%) (76.7%) (81.7%) (76.1%) (78.9%) (48.1%) Aged under 15 4.7 12.4 21.2 15.8 4.8 12.2 160.7 805.3
(10.4%) (16.2%) (18.3%) (17.9%) (13.0%) (16.3%) (15.8%) (12.0%) Aged between 15 and 64 16.1 24.0 39.6 29.5 12.3 27.2 351.6 1 578.1
(35.5%) (31.4%) (34.0%) (33.5%) (33.0%) (36.6%) (34.5%) (23.6%) Student 4.4 5.9 10.6 8.4 3.0 6.0 90.5 522.3
(9.7%) (7.7%) (9.1%) (9.5%) (8.0%) (8.0%) (8.9%) (7.8%) Home-maker 5.1 9.8 16.3 11.8 4.4 11.0 135.9 635.2
(11.3%) (12.9%) (14.0%) (13.5%) (11.9%) (14.8%) (13.4%) (9.5%) Retired person 3.7 3.1 5.3 4.1 3.0 5.3 61.8 233.6
(8.2%) (4.0%) (4.6%) (4.7%) (8.0%) (7.1%) (6.1%) (3.5%) Temporary / permanent ill 1.5 3.6 4.3 3.1 0.8 2.9 34.3 85.8
(3.3%) (4.7%) (3.7%) (3.5%) (2.1%) (3.9%) (3.4%) (1.3%) Other economically inactive* 1.4 1.6 3.1 2.0 1.1 2.1 29.1 101.1
(3.0%) (2.1%) (2.6%) (2.3%) (2.9%) (2.8%) (2.9%) (1.5%) Aged 65+ 16.3 23.4 31.6 22.2 13.2 17.3 290.6 830.8
(35.9%) (30.6%) (27.2%) (25.2%) (35.6%) (23.2%) (28.6%) (12.4%) (iii) Whether new arrival(s)Yes 1.3 3.5 6.8 4.0 1.3 3.2 43.7 122.0
(2.9%) (4.6%) (5.9%) (4.5%) (3.4%) (4.4%) (4.3%) (1.8%) No 44.0 73.0 109.5 84.0 35.9 71.2 974.1 6 562.2
(97.1%) (95.4%) (94.1%) (95.5%) (96.6%) (95.6%) (95.7%) (98.2%) II. No. of employed persons ('000)
(i) OccupationHigher-skilled 0.6 1.0 1.4 1.5 0.8 1.0 16.4 1 349.9
<8.9%> <7.7%> <7.0%> <9.0%> <14.0%> <6.7%> <9.3%> <40.3%> Lower-skilled 5.7 12.5 18.9 15.7 4.9 13.8 160.8 1 995.9
<91.1%> <92.3%> <93.0%> <91.0%> <86.0%> <93.2%> <90.7%> <59.7%> (ii) Educational attainmentPrimary and below 1.3 3.2 4.1 3.3 0.7 3.3 37.5 350.5
<21.4%> <23.4%> <20.3%> <18.9%> <12.3%> <22.3%> <21.1%> <10.5%> Lower secondary 1.8 4.3 6.9 7.0 1.8 5.1 57.5 499.2
<29.0%> <31.6%> <33.9%> <40.5%> <31.5%> <34.5%> <32.5%> <14.9%> Upper secondary (including craft courses) 2.3 4.8 7.4 5.7 2.3 5.1 63.8 1 286.1
<36.3%> <35.4%> <36.6%> <33.2%> <40.8%> <34.9%> <36.0%> <38.4%> Post-secondary - non-degree 0.3 0.8 1.1 0.8 0.3 0.8 9.1 310.9
<4.9%> <5.7%> <5.6%> <4.4%> <4.9%> <5.4%> <5.1%> <9.3%> Post-secondary - degree 0.5 0.5 0.8 0.5 0.6 0.4 9.3 899.0
<8.4%> <3.9%> <3.7%> <3.0%> <10.5%> <2.8%> <5.3%> <26.9%> (iii) Employment statusFull-time 4.7 10.2 15.2 13.6 4.6 11.1 135.1 3 081.4
<74.7%> <75.4%> <74.9%> <78.9%> <80.5%> <75.5%> <76.2%> <92.1%> Part-time / underemployed 1.6 3.3 5.1 3.6 1.1 3.6 42.1 264.4
<25.3%> <24.6%> <25.1%> <21.1%> <19.5%> <24.5%> <23.8%> <7.9%> III. Other indicators
Median monthly employment earnings (HK$) 7,500 8,000 8,000 8,000 8,000 8,000 8,000 13,000Labour force participation rate (%) 20.4 26.1 25.1 28.4 21.1 28.6 25.1 59.0Unemployment rate (%) 23.9 18.9 15.2 16.1 16.2 17.1 17.6 3.6Median age 56 49 46 44 55 48 49 42No. of children ('000) 7.1 15.5 27.2 20.6 6.5 15.4 208.8 1 048.0 Dependency ratio (demographic)^ 889 889 858 779 958 663 816 340
Elderly 693 583 519 459 703 391 529 179 Child 197 306 339 319 255 271 287 161
Economic dependency ratio# 4 472 3 578 3 868 3 289 4 456 3 184 3 736 926
After policy intervention (recurrent cash)
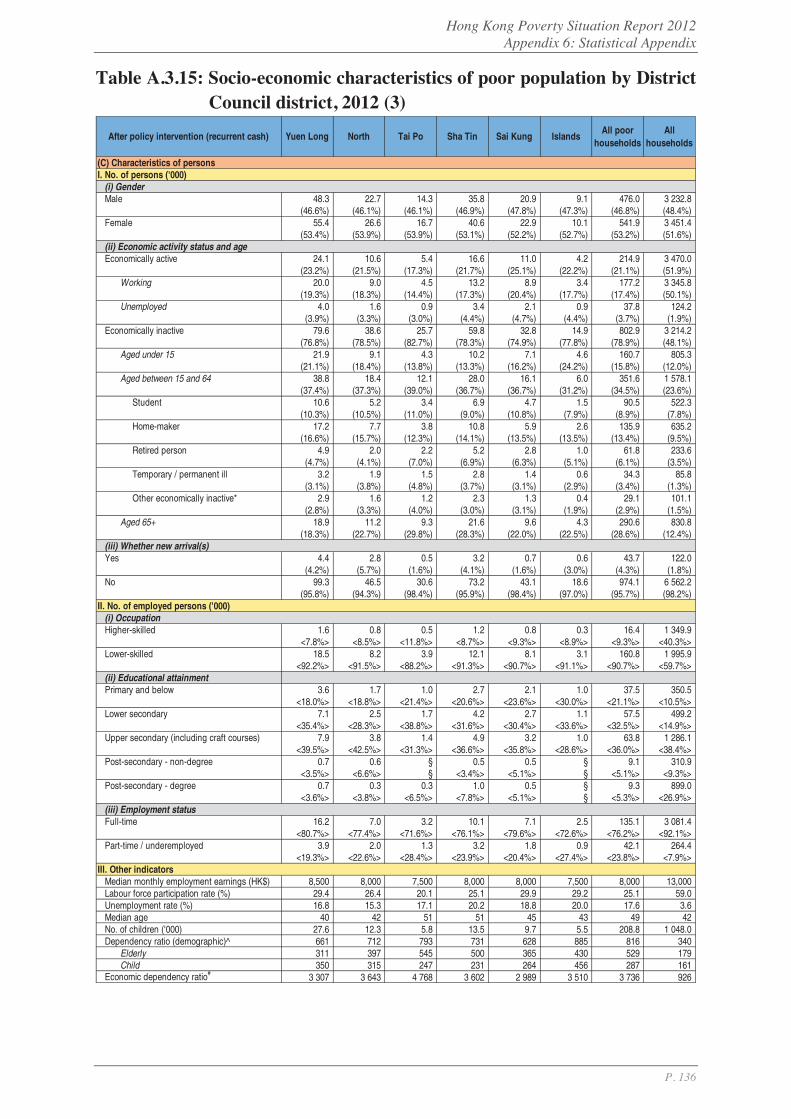
Hong Kong Poverty Situation Report 2012 Appendix 6: Statistical Appendix
P. 136
Table A.3.15: Socio-economic characteristics of poor population by District Council district, 2012 (3)
Yuen Long North Tai Po Sha Tin Sai Kung IslandsAll poor
householdsAll
households
(C) Characteristics of personsI. No. of persons ('000)
(i) Gender Male 48.3 22.7 14.3 35.8 20.9 9.1 476.0 3 232.8
(46.6%) (46.1%) (46.1%) (46.9%) (47.8%) (47.3%) (46.8%) (48.4%) Female 55.4 26.6 16.7 40.6 22.9 10.1 541.9 3 451.4
(53.4%) (53.9%) (53.9%) (53.1%) (52.2%) (52.7%) (53.2%) (51.6%) (ii) Economic activity status and ageEconomically active 24.1 10.6 5.4 16.6 11.0 4.2 214.9 3 470.0
(23.2%) (21.5%) (17.3%) (21.7%) (25.1%) (22.2%) (21.1%) (51.9%) Working 20.0 9.0 4.5 13.2 8.9 3.4 177.2 3 345.8
(19.3%) (18.3%) (14.4%) (17.3%) (20.4%) (17.7%) (17.4%) (50.1%) Unemployed 4.0 1.6 0.9 3.4 2.1 0.9 37.8 124.2
(3.9%) (3.3%) (3.0%) (4.4%) (4.7%) (4.4%) (3.7%) (1.9%) Economically inactive 79.6 38.6 25.7 59.8 32.8 14.9 802.9 3 214.2
(76.8%) (78.5%) (82.7%) (78.3%) (74.9%) (77.8%) (78.9%) (48.1%) Aged under 15 21.9 9.1 4.3 10.2 7.1 4.6 160.7 805.3
(21.1%) (18.4%) (13.8%) (13.3%) (16.2%) (24.2%) (15.8%) (12.0%) Aged between 15 and 64 38.8 18.4 12.1 28.0 16.1 6.0 351.6 1 578.1
(37.4%) (37.3%) (39.0%) (36.7%) (36.7%) (31.2%) (34.5%) (23.6%) Student 10.6 5.2 3.4 6.9 4.7 1.5 90.5 522.3
(10.3%) (10.5%) (11.0%) (9.0%) (10.8%) (7.9%) (8.9%) (7.8%) Home-maker 17.2 7.7 3.8 10.8 5.9 2.6 135.9 635.2
(16.6%) (15.7%) (12.3%) (14.1%) (13.5%) (13.5%) (13.4%) (9.5%) Retired person 4.9 2.0 2.2 5.2 2.8 1.0 61.8 233.6
(4.7%) (4.1%) (7.0%) (6.9%) (6.3%) (5.1%) (6.1%) (3.5%) Temporary / permanent ill 3.2 1.9 1.5 2.8 1.4 0.6 34.3 85.8
(3.1%) (3.8%) (4.8%) (3.7%) (3.1%) (2.9%) (3.4%) (1.3%) Other economically inactive* 2.9 1.6 1.2 2.3 1.3 0.4 29.1 101.1
(2.8%) (3.3%) (4.0%) (3.0%) (3.1%) (1.9%) (2.9%) (1.5%) Aged 65+ 18.9 11.2 9.3 21.6 9.6 4.3 290.6 830.8
(18.3%) (22.7%) (29.8%) (28.3%) (22.0%) (22.5%) (28.6%) (12.4%) (iii) Whether new arrival(s)Yes 4.4 2.8 0.5 3.2 0.7 0.6 43.7 122.0
(4.2%) (5.7%) (1.6%) (4.1%) (1.6%) (3.0%) (4.3%) (1.8%) No 99.3 46.5 30.6 73.2 43.1 18.6 974.1 6 562.2
(95.8%) (94.3%) (98.4%) (95.9%) (98.4%) (97.0%) (95.7%) (98.2%) II. No. of employed persons ('000)
(i) OccupationHigher-skilled 1.6 0.8 0.5 1.2 0.8 0.3 16.4 1 349.9
<7.8%> <8.5%> <11.8%> <8.7%> <9.3%> <8.9%> <9.3%> <40.3%> Lower-skilled 18.5 8.2 3.9 12.1 8.1 3.1 160.8 1 995.9
<92.2%> <91.5%> <88.2%> <91.3%> <90.7%> <91.1%> <90.7%> <59.7%> (ii) Educational attainmentPrimary and below 3.6 1.7 1.0 2.7 2.1 1.0 37.5 350.5
<18.0%> <18.8%> <21.4%> <20.6%> <23.6%> <30.0%> <21.1%> <10.5%> Lower secondary 7.1 2.5 1.7 4.2 2.7 1.1 57.5 499.2
<35.4%> <28.3%> <38.8%> <31.6%> <30.4%> <33.6%> <32.5%> <14.9%> Upper secondary (including craft courses) 7.9 3.8 1.4 4.9 3.2 1.0 63.8 1 286.1
<39.5%> <42.5%> <31.3%> <36.6%> <35.8%> <28.6%> <36.0%> <38.4%> Post-secondary - non-degree 0.7 0.6 § 0.5 0.5 § 9.1 310.9
<3.5%> <6.6%> § <3.4%> <5.1%> § <5.1%> <9.3%> Post-secondary - degree 0.7 0.3 0.3 1.0 0.5 § 9.3 899.0
<3.6%> <3.8%> <6.5%> <7.8%> <5.1%> § <5.3%> <26.9%> (iii) Employment statusFull-time 16.2 7.0 3.2 10.1 7.1 2.5 135.1 3 081.4
<80.7%> <77.4%> <71.6%> <76.1%> <79.6%> <72.6%> <76.2%> <92.1%> Part-time / underemployed 3.9 2.0 1.3 3.2 1.8 0.9 42.1 264.4
<19.3%> <22.6%> <28.4%> <23.9%> <20.4%> <27.4%> <23.8%> <7.9%> III. Other indicators
Median monthly employment earnings (HK$) 8,500 8,000 7,500 8,000 8,000 7,500 8,000 13,000Labour force participation rate (%) 29.4 26.4 20.1 25.1 29.9 29.2 25.1 59.0Unemployment rate (%) 16.8 15.3 17.1 20.2 18.8 20.0 17.6 3.6Median age 40 42 51 51 45 43 49 42No. of children ('000) 27.6 12.3 5.8 13.5 9.7 5.5 208.8 1 048.0 Dependency ratio (demographic)^ 661 712 793 731 628 885 816 340
Elderly 311 397 545 500 365 430 529 179 Child 350 315 247 231 264 456 287 161
Economic dependency ratio# 3 307 3 643 4 768 3 602 2 989 3 510 3 736 926
After policy intervention (recurrent cash)

Hong Kong Poverty Situation Report 2012 Appendix 6: Statistical Appendix
P. 137
B. Supplementary Tables (1) Key poverty statistics, 2009-2012 Table B.1.1 Poverty indicators (compared with the previous year) Table B.1.2 Poverty indicators (compared with the poverty indicators
before policy intervention) (2) Poverty statistics after policy intervention (recurrent + non-
recurrent cash) Poverty indicators, 2009-2012 (with the 2012 annual change) Table B.2.1a Poor households by selected household group Table B.2.2a Poor population by selected household group Table B.2.3a Poverty rate by selected household group Table B.2.4a Total poverty gap by selected household group Table B.2.5a Average poverty gap by selected household group Poverty indicators, 2009-2012 (with the 2012 comparison of pre- and post-intervention poverty indicators) Table B.2.1b Poor households by selected household group Table B.2.2b Poor population by selected household group Table B.2.3b Poverty rate by selected household group Table B.2.4b Total poverty gap by selected household group Table B.2.5b Average poverty gap by selected household group
(3) Poverty statistics after policy intervention (recurrent cash + in-kind) Poverty indicators, 2009-2012 (with the 2012 annual change) Table B.3.1a Poor households by selected household group Table B.3.2a Poor population by selected household group Table B.3.3a Poverty rate by selected household group Table B.3.4a Total poverty gap by selected household group Table B.3.5a Average poverty gap by selected household group Poverty indicators, 2009-2012 (with the 2012 comparison of pre- and post-intervention poverty indicators) Table B.3.1b Poor households by selected household group Table B.3.2b Poor population by selected household group Table B.3.3b Poverty rate by selected household group Table B.3.4b Total poverty gap by selected household group Table B.3.5b Average poverty gap by selected household group

Hong Kong Poverty Situation Report 2012 Appendix 6: Statistical Appendix
P. 138
Table B.1.1: Poverty indicators, 2009-2012 (compared with the previous year)
(A) Before policy intervention
I. Poor households ('000)
II. Poor population ('000)
III. Poverty rate (%)
IV. Poverty gap
Annual total gap (HK$Mn)
Monthly average gap (HK$)
(B) After policy intervention (recurrent + non-recurrent cash)
I. Poor households ('000) 354.2
II. Poor population ('000) 910.0
III. Poverty rate (%) 13.8
IV. Poverty gap
Annual total gap (HK$Mn)
Monthly average gap (HK$)
(C) After policy intervention (recurrent cash + in-kind)
I. Poor households ('000)
II. Poor population ('000)
III. Poverty rate (%)
IV. Poverty gap
Annual total gap (HK$Mn)
Monthly average gap (HK$)
Change % change Change % change Change % change Change % change
(A) Before policy intervention
I. Poor households ('000) -5.5 -1.0 -5.2 -1.0 10.3 2.0
II. Poor population ('000) -26.4 -2.0 -27.0 -2.0 17.4 1.3
III. Poverty rate (%) -0.5 - -0.5 - @ -
IV. Poverty gap
Annual total gap (HK$Mn) 518.6 2.0 948.8 3.7 1,906.6 7.1
Monthly average gap (HK$) 100 3.1 200 4.7 200 5.0
(B) After policy intervention (recurrent + non-recurrent cash)
I. Poor households ('000) -7.0 -1.9 -73.5 -20.7 31.7 11.3
II. Poor population ('000) -26.6 -2.8 -189.8 -20.9 84.7 11.8
III. Poverty rate (%) -0.5 - -2.9 - 1.1 -
IV. Poverty gap
Annual total gap (HK$Mn) -100.5 -0.9 -2,108.1 -19.2 1,960.8 22.2
Monthly average gap (HK$) @ @ @ @ 300 9.8
(C) After policy intervention (recurrent cash + in-kind)
I. Poor households ('000) -6.1 -2.1 -7.6 -2.7 1.2 0.4
II. Poor population ('000) -26.5 -3.7 -24.4 -3.5 -0.9 -0.1
III. Poverty rate (%) -0.5 - -0.4 - -0.1 -
IV. Poverty gap
Annual total gap (HK$Mn) -90.8 -1.0 521.2 5.5 729.5 7.3
Monthly average gap (HK$) @ @ 200 8.5 200 6.9
271.7
674.2
10.1
10,675.3
3,300
270.5
675.1
10.2
9,945.8
3,100
278.1
699.5
10.6
9,424.6
2,800
284.1
726.0
11.1
9,515.4
2,800
10,811.0
2,900
12.0
804.9
312.5
11,058.9
2,600
10,958.3
2,600
8,850.2
2,600
28,798.4
4,400
361.2
936.6
14.3
280.8
720.2
10.9
25,424.4
3,900
25,943.0
4,000
26,891.7
4,200
530.3
1 295.0
19.6
540.6
1 312.3
19.6
2012
Compared with the previous year
-
-
-
2009 2010 2011
541.1
1 348.4
20.6
535.5
1 322.0
20.1
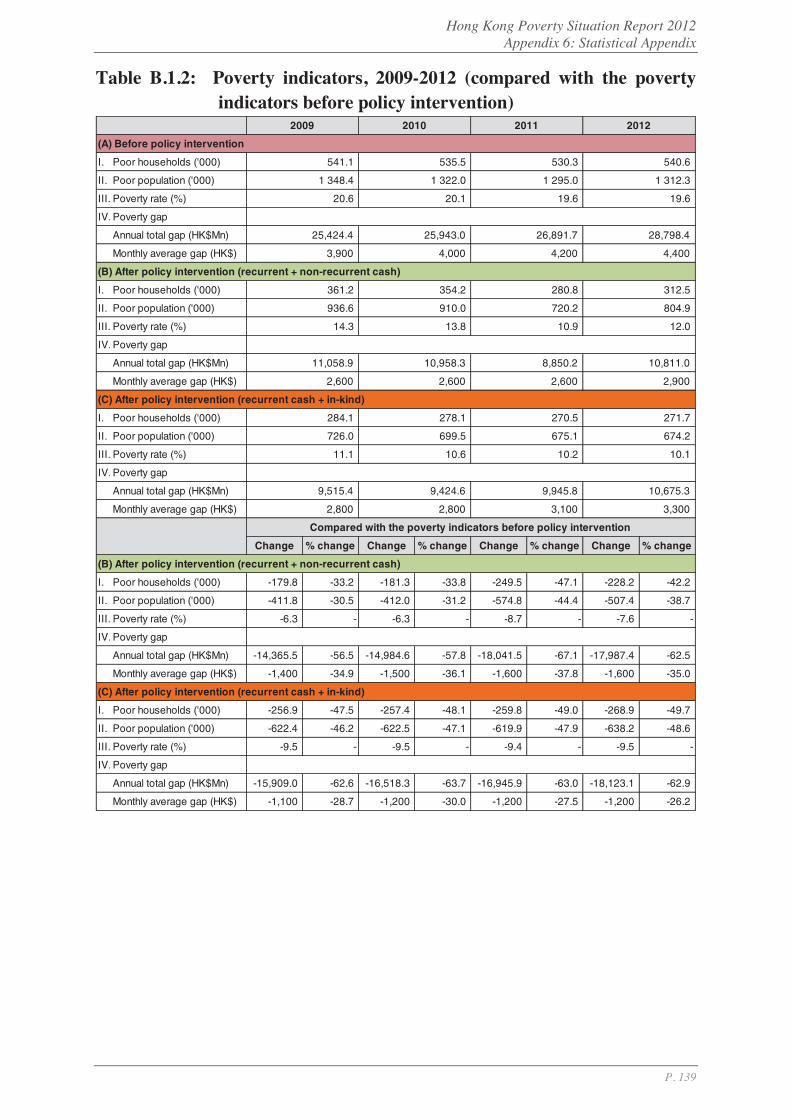
Hong Kong Poverty Situation Report 2012 Appendix 6: Statistical Appendix
P. 139
Table B.1.2: Poverty indicators, 2009-2012 (compared with the poverty indicators before policy intervention)
(A) Before policy intervention
I. Poor households ('000)
II. Poor population ('000) 1 295.0
III. Poverty rate (%)
IV. Poverty gap
Annual total gap (HK$Mn)
Monthly average gap (HK$)
(B) After policy intervention (recurrent + non-recurrent cash)
I. Poor households ('000) 354.2
II. Poor population ('000) 910.0
III. Poverty rate (%)
IV. Poverty gap
Annual total gap (HK$Mn)
Monthly average gap (HK$)
(C) After policy intervention (recurrent cash + in-kind)
I. Poor households ('000) 270.5
II. Poor population ('000) 675.1
III. Poverty rate (%) 10.2
IV. Poverty gap
Annual total gap (HK$Mn)
Monthly average gap (HK$)
Change % change Change % change Change % change Change % change
(B) After policy intervention (recurrent + non-recurrent cash)
I. Poor households ('000) -179.8 -33.2 -181.3 -33.8 -249.5 -47.1 -228.2 -42.2
II. Poor population ('000) -411.8 -30.5 -412.0 -31.2 -574.8 -44.4 -507.4 -38.7
III. Poverty rate (%) -6.3 - -6.3 - -8.7 - -7.6 -
IV. Poverty gap
Annual total gap (HK$Mn) -14,365.5 -56.5 -14,984.6 -57.8 -18,041.5 -67.1 -17,987.4 -62.5
Monthly average gap (HK$) -1,400 -34.9 -1,500 -36.1 -1,600 -37.8 -1,600 -35.0
(C) After policy intervention (recurrent cash + in-kind)
I. Poor households ('000) -256.9 -47.5 -257.4 -48.1 -259.8 -49.0 -268.9 -49.7
II. Poor population ('000) -622.4 -46.2 -622.5 -47.1 -619.9 -47.9 -638.2 -48.6
III. Poverty rate (%) -9.5 - -9.5 - -9.4 - -9.5 -
IV. Poverty gap
Annual total gap (HK$Mn) -15,909.0 -62.6 -16,518.3 -63.7 -16,945.9 -63.0 -18,123.1 -62.9
Monthly average gap (HK$) -1,100 -28.7 -1,200 -30.0 -1,200 -27.5 -1,200 -26.2
10,675.3
3,300
271.7
674.2
10.1
9,515.4
2,800
280.8 312.5
804.9
13.8
720.2
10.9 12.0
2,800
9,424.6
278.1
699.5
10.6
9,945.8
3,100
10,811.0
2,900
284.1
726.0
11.1
11,058.9
2,600
10,958.3
2,600
8,850.2
2,600
28,798.4
4,400
361.2
936.6
14.3
25,424.4
3,900
25,943.0
4,000
26,891.7
4,200
1 348.4
20.6
1 322.0
20.1 19.6
2009 2010 2011
Compared with the poverty indicators before policy intervention
2012
541.1 535.5 530.3 540.6
1 312.3
19.6
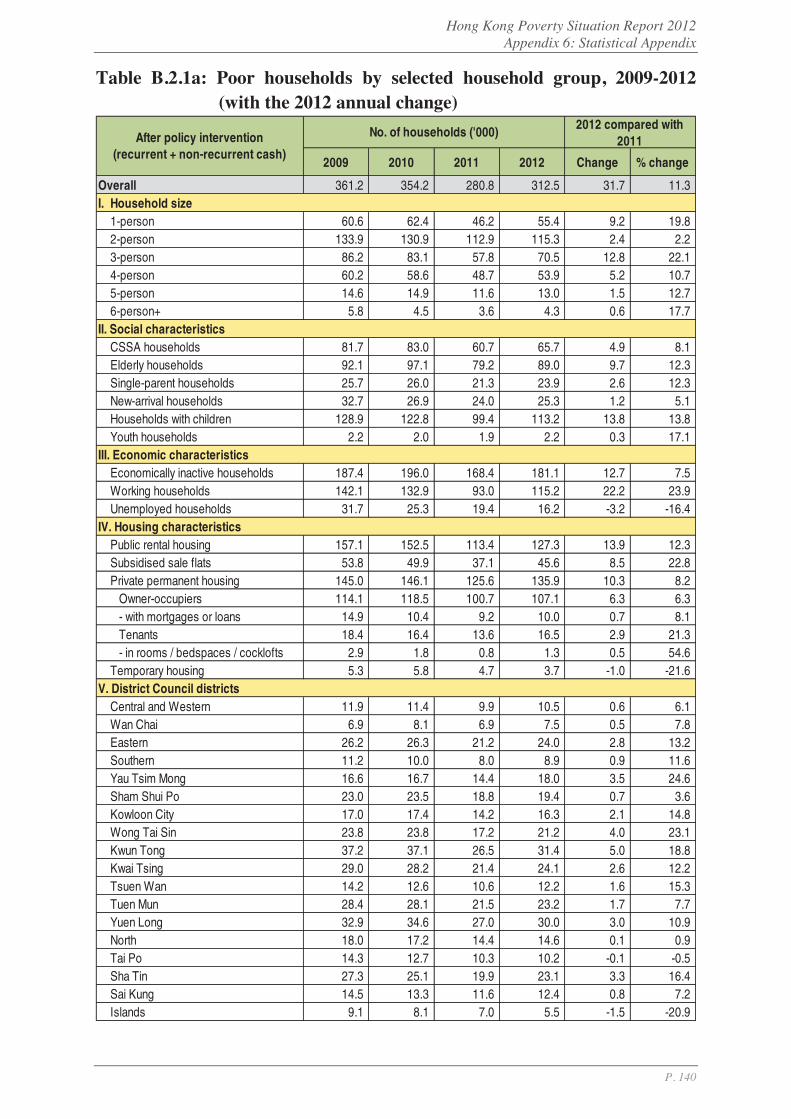
Hong Kong Poverty Situation Report 2012 Appendix 6: Statistical Appendix
P. 140
Table B.2.1a: Poor households by selected household group, 2009-2012 (with the 2012 annual change)
2009 2010 2011 2012 Change % change
Overall 361.2 354.2 280.8 312.5 31.7 11.3I. Household size
1-person 60.6 62.4 46.2 55.4 9.2 19.82-person 133.9 130.9 112.9 115.3 2.4 2.23-person 86.2 83.1 57.8 70.5 12.8 22.14-person 60.2 58.6 48.7 53.9 5.2 10.75-person 14.6 14.9 11.6 13.0 1.5 12.76-person+ 5.8 4.5 3.6 4.3 0.6 17.7
II. Social characteristicsCSSA households 81.7 83.0 60.7 65.7 4.9 8.1Elderly households 92.1 97.1 79.2 89.0 9.7 12.3Single-parent households 25.7 26.0 21.3 23.9 2.6 12.3New-arrival households 32.7 26.9 24.0 25.3 1.2 5.1Households with children 128.9 122.8 99.4 113.2 13.8 13.8Youth households 2.2 2.0 1.9 2.2 0.3 17.1
III. Economic characteristicsEconomically inactive households 187.4 196.0 168.4 181.1 12.7 7.5Working households 142.1 132.9 93.0 115.2 22.2 23.9Unemployed households 31.7 25.3 19.4 16.2 -3.2 -16.4
IV. Housing characteristicsPublic rental housing 157.1 152.5 113.4 127.3 13.9 12.3Subsidised sale flats 53.8 49.9 37.1 45.6 8.5 22.8Private permanent housing 145.0 146.1 125.6 135.9 10.3 8.2
Owner-occupiers 114.1 118.5 100.7 107.1 6.3 6.3- with mortgages or loans 14.9 10.4 9.2 10.0 0.7 8.1Tenants 18.4 16.4 13.6 16.5 2.9 21.3- in rooms / bedspaces / cocklofts 2.9 1.8 0.8 1.3 0.5 54.6
Temporary housing 5.3 5.8 4.7 3.7 -1.0 -21.6V. District Council districts
Central and Western 11.9 11.4 9.9 10.5 0.6 6.1Wan Chai 6.9 8.1 6.9 7.5 0.5 7.8Eastern 26.2 26.3 21.2 24.0 2.8 13.2Southern 11.2 10.0 8.0 8.9 0.9 11.6Yau Tsim Mong 16.6 16.7 14.4 18.0 3.5 24.6Sham Shui Po 23.0 23.5 18.8 19.4 0.7 3.6Kowloon City 17.0 17.4 14.2 16.3 2.1 14.8Wong Tai Sin 23.8 23.8 17.2 21.2 4.0 23.1Kwun Tong 37.2 37.1 26.5 31.4 5.0 18.8Kwai Tsing 29.0 28.2 21.4 24.1 2.6 12.2Tsuen Wan 14.2 12.6 10.6 12.2 1.6 15.3Tuen Mun 28.4 28.1 21.5 23.2 1.7 7.7Yuen Long 32.9 34.6 27.0 30.0 3.0 10.9North 18.0 17.2 14.4 14.6 0.1 0.9Tai Po 14.3 12.7 10.3 10.2 -0.1 -0.5Sha Tin 27.3 25.1 19.9 23.1 3.3 16.4Sai Kung 14.5 13.3 11.6 12.4 0.8 7.2Islands 9.1 8.1 7.0 5.5 -1.5 -20.9
No. of households ('000) 2012 compared with2011After policy intervention
(recurrent + non-recurrent cash)

Hong Kong Poverty Situation Report 2012 Appendix 6: Statistical Appendix
P. 141
Table B.2.2a: Poor population by selected household group, 2009-2012 (with the 2012 annual change)
2009 2010 2011 2012 Change %change
Overall 936.6 910.0 720.2 804.9 84.7 11.8I. Household size
1-person 60.6 62.4 46.2 55.4 9.2 19.82-person 267.7 261.8 225.7 230.6 4.9 2.23-person 258.5 249.2 173.3 211.6 38.3 22.14-person 241.0 234.2 194.9 215.7 20.8 10.75-person 73.0 74.4 57.8 65.2 7.4 12.76-person+ 35.9 28.0 22.2 26.4 4.2 18.8
II. Social characteristicsCSSA households 194.6 197.8 158.0 172.4 14.3 9.1Elderly households 147.0 155.4 129.5 144.9 15.3 11.8Single-parent households 72.2 72.7 61.0 68.1 7.1 11.6New-arrival households 113.3 93.8 84.5 89.0 4.5 5.3Households with children 467.0 442.0 360.6 408.9 48.3 13.4Youth households 3.1 2.8 3.1 3.2 0.2 5.3
III. Economic characteristicsEconomically inactive households 368.3 384.5 340.4 362.2 21.8 6.4Working households 482.5 455.5 326.8 400.8 74.0 22.7Unemployed households 85.8 70.0 53.0 41.9 -11.1 -20.9
IV. Housing characteristicsPublic rental housing 439.5 428.3 329.7 376.9 47.1 14.3Subsidised sale flats 143.1 130.5 94.0 114.9 20.9 22.3Private permanent housing 342.3 339.0 285.8 305.2 19.5 6.8
Owner-occupiers 268.9 271.6 228.9 238.1 9.1 4.0- with mortgages or loans 44.1 31.6 28.7 28.1 -0.6 -2.1Tenants 50.9 47.4 36.4 44.0 7.6 20.7- in rooms / bedspaces / cocklofts 6.7 4.5 2.3 3.2 1.0 43.1
Temporary housing 11.8 12.3 10.7 7.9 -2.8 -26.1V. District Council districts
Central and Western 25.1 25.4 21.0 21.4 0.5 2.3Wan Chai 14.7 15.7 13.4 14.4 0.9 6.8Eastern 63.0 62.1 50.3 56.9 6.6 13.2Southern 28.7 24.0 20.0 22.9 2.9 14.6Yau Tsim Mong 37.7 38.3 32.9 39.7 6.8 20.7Sham Shui Po 61.2 59.1 47.6 52.3 4.7 9.9Kowloon City 40.4 40.4 34.7 38.6 3.9 11.2Wong Tai Sin 62.1 63.7 46.6 56.2 9.5 20.5Kwun Tong 95.9 97.9 69.3 87.4 18.1 26.2Kwai Tsing 80.3 78.3 59.1 68.0 8.9 15.1Tsuen Wan 36.2 33.2 27.7 29.4 1.7 6.2Tuen Mun 74.4 74.2 56.9 59.7 2.8 4.8Yuen Long 93.3 94.8 74.7 83.5 8.9 11.9North 49.7 47.7 38.3 38.8 0.4 1.2Tai Po 38.0 31.0 25.8 26.2 0.4 1.7Sha Tin 71.9 67.0 50.7 60.5 9.9 19.5Sai Kung 41.6 35.0 32.0 34.3 2.4 7.4Islands 22.5 22.1 19.2 14.6 -4.7 -24.2
No. of persons ('000) 2012 compared with2011After policy intervention
(recurrent + non-recurrent cash)
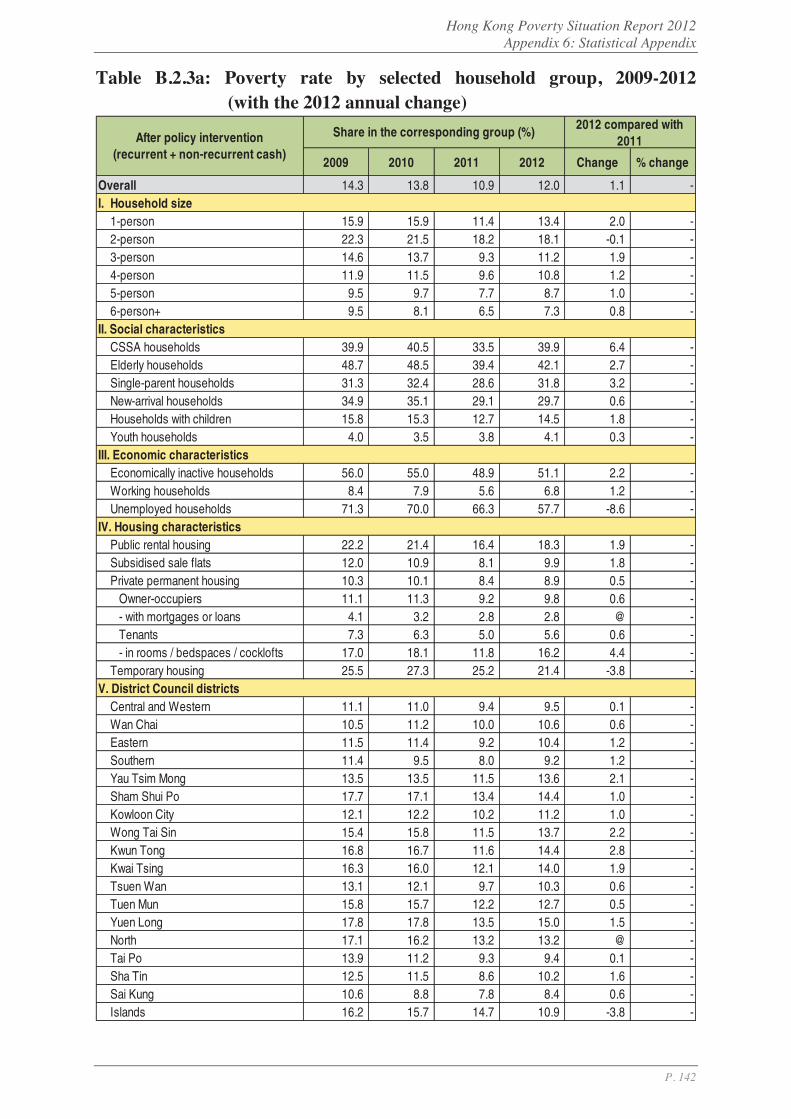
Hong Kong Poverty Situation Report 2012 Appendix 6: Statistical Appendix
P. 142
Table B.2.3a: Poverty rate by selected household group, 2009-2012 (with the 2012 annual change)
2009 2010 2011 2012 Change % change
Overall 14.3 13.8 10.9 12.0 1.1 -I. Household size
1-person 15.9 15.9 11.4 13.4 2.0 -2-person 22.3 21.5 18.2 18.1 -0.1 -3-person 14.6 13.7 9.3 11.2 1.9 -4-person 11.9 11.5 9.6 10.8 1.2 -5-person 9.5 9.7 7.7 8.7 1.0 -6-person+ 9.5 8.1 6.5 7.3 0.8 -
II. Social characteristicsCSSA households 39.9 40.5 33.5 39.9 6.4 -Elderly households 48.7 48.5 39.4 42.1 2.7 -Single-parent households 31.3 32.4 28.6 31.8 3.2 -New-arrival households 34.9 35.1 29.1 29.7 0.6 -Households with children 15.8 15.3 12.7 14.5 1.8 -Youth households 4.0 3.5 3.8 4.1 0.3 -
III. Economic characteristicsEconomically inactive households 56.0 55.0 48.9 51.1 2.2 -Working households 8.4 7.9 5.6 6.8 1.2 -Unemployed households 71.3 70.0 66.3 57.7 -8.6 -
IV. Housing characteristicsPublic rental housing 22.2 21.4 16.4 18.3 1.9 -Subsidised sale flats 12.0 10.9 8.1 9.9 1.8 -Private permanent housing 10.3 10.1 8.4 8.9 0.5 -
Owner-occupiers 11.1 11.3 9.2 9.8 0.6 -- with mortgages or loans 4.1 3.2 2.8 2.8 @ -Tenants 7.3 6.3 5.0 5.6 0.6 -- in rooms / bedspaces / cocklofts 17.0 18.1 11.8 16.2 4.4 -
Temporary housing 25.5 27.3 25.2 21.4 -3.8 -V. District Council districts
Central and Western 11.1 11.0 9.4 9.5 0.1 -Wan Chai 10.5 11.2 10.0 10.6 0.6 -Eastern 11.5 11.4 9.2 10.4 1.2 -Southern 11.4 9.5 8.0 9.2 1.2 -Yau Tsim Mong 13.5 13.5 11.5 13.6 2.1 -Sham Shui Po 17.7 17.1 13.4 14.4 1.0 -Kowloon City 12.1 12.2 10.2 11.2 1.0 -Wong Tai Sin 15.4 15.8 11.5 13.7 2.2 -Kwun Tong 16.8 16.7 11.6 14.4 2.8 -Kwai Tsing 16.3 16.0 12.1 14.0 1.9 -Tsuen Wan 13.1 12.1 9.7 10.3 0.6 -Tuen Mun 15.8 15.7 12.2 12.7 0.5 -Yuen Long 17.8 17.8 13.5 15.0 1.5 -North 17.1 16.2 13.2 13.2 @ -Tai Po 13.9 11.2 9.3 9.4 0.1 -Sha Tin 12.5 11.5 8.6 10.2 1.6 -Sai Kung 10.6 8.8 7.8 8.4 0.6 -Islands 16.2 15.7 14.7 10.9 -3.8 -
Share in the corresponding group (%) 2012 compared with2011After policy intervention
(recurrent + non-recurrent cash)
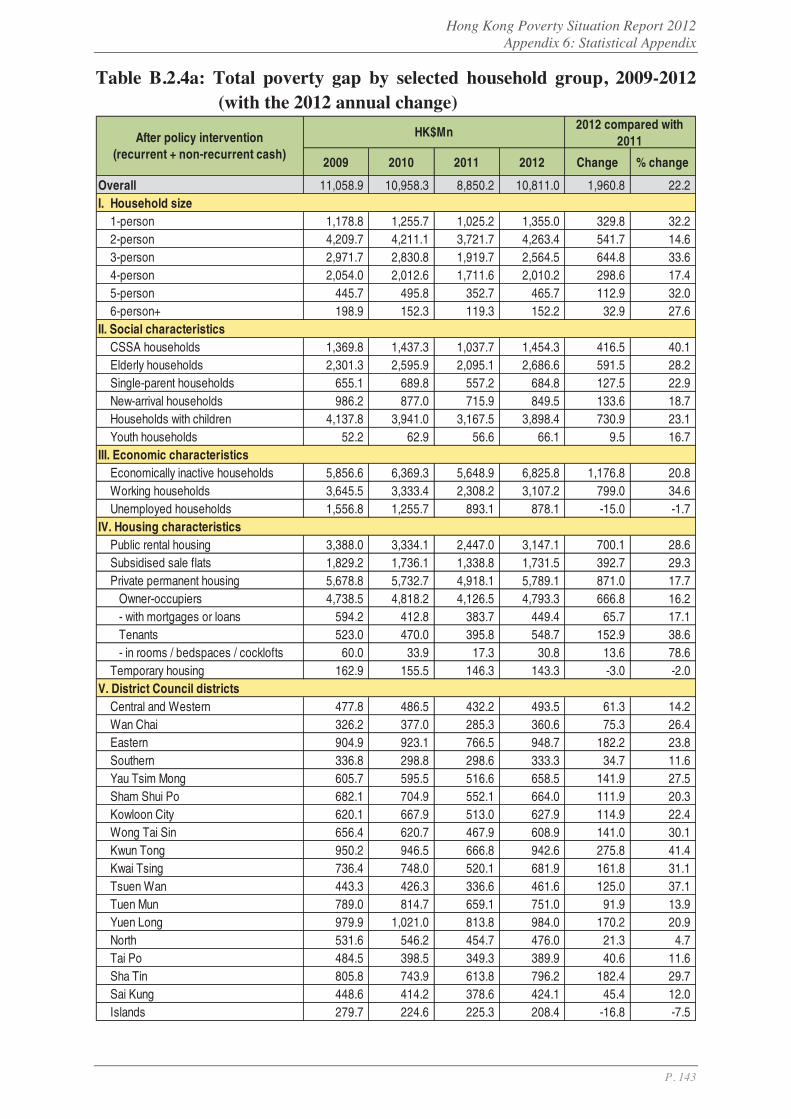
Hong Kong Poverty Situation Report 2012 Appendix 6: Statistical Appendix
P. 143
Table B.2.4a: Total poverty gap by selected household group, 2009-2012 (with the 2012 annual change)
2009 2010 2011 2012 Change % change
Overall 11,058.9 10,958.3 8,850.2 10,811.0 1,960.8 22.2I. Household size
1-person 1,178.8 1,255.7 1,025.2 1,355.0 329.8 32.22-person 4,209.7 4,211.1 3,721.7 4,263.4 541.7 14.63-person 2,971.7 2,830.8 1,919.7 2,564.5 644.8 33.64-person 2,054.0 2,012.6 1,711.6 2,010.2 298.6 17.45-person 445.7 495.8 352.7 465.7 112.9 32.06-person+ 198.9 152.3 119.3 152.2 32.9 27.6
II. Social characteristicsCSSA households 1,369.8 1,437.3 1,037.7 1,454.3 416.5 40.1Elderly households 2,301.3 2,595.9 2,095.1 2,686.6 591.5 28.2Single-parent households 655.1 689.8 557.2 684.8 127.5 22.9New-arrival households 986.2 877.0 715.9 849.5 133.6 18.7Households with children 4,137.8 3,941.0 3,167.5 3,898.4 730.9 23.1Youth households 52.2 62.9 56.6 66.1 9.5 16.7
III. Economic characteristicsEconomically inactive households 5,856.6 6,369.3 5,648.9 6,825.8 1,176.8 20.8Working households 3,645.5 3,333.4 2,308.2 3,107.2 799.0 34.6Unemployed households 1,556.8 1,255.7 893.1 878.1 -15.0 -1.7
IV. Housing characteristicsPublic rental housing 3,388.0 3,334.1 2,447.0 3,147.1 700.1 28.6Subsidised sale flats 1,829.2 1,736.1 1,338.8 1,731.5 392.7 29.3Private permanent housing 5,678.8 5,732.7 4,918.1 5,789.1 871.0 17.7
Owner-occupiers 4,738.5 4,818.2 4,126.5 4,793.3 666.8 16.2- with mortgages or loans 594.2 412.8 383.7 449.4 65.7 17.1Tenants 523.0 470.0 395.8 548.7 152.9 38.6- in rooms / bedspaces / cocklofts 60.0 33.9 17.3 30.8 13.6 78.6
Temporary housing 162.9 155.5 146.3 143.3 -3.0 -2.0V. District Council districts
Central and Western 477.8 486.5 432.2 493.5 61.3 14.2Wan Chai 326.2 377.0 285.3 360.6 75.3 26.4Eastern 904.9 923.1 766.5 948.7 182.2 23.8Southern 336.8 298.8 298.6 333.3 34.7 11.6Yau Tsim Mong 605.7 595.5 516.6 658.5 141.9 27.5Sham Shui Po 682.1 704.9 552.1 664.0 111.9 20.3Kowloon City 620.1 667.9 513.0 627.9 114.9 22.4Wong Tai Sin 656.4 620.7 467.9 608.9 141.0 30.1Kwun Tong 950.2 946.5 666.8 942.6 275.8 41.4Kwai Tsing 736.4 748.0 520.1 681.9 161.8 31.1Tsuen Wan 443.3 426.3 336.6 461.6 125.0 37.1Tuen Mun 789.0 814.7 659.1 751.0 91.9 13.9Yuen Long 979.9 1,021.0 813.8 984.0 170.2 20.9North 531.6 546.2 454.7 476.0 21.3 4.7Tai Po 484.5 398.5 349.3 389.9 40.6 11.6Sha Tin 805.8 743.9 613.8 796.2 182.4 29.7Sai Kung 448.6 414.2 378.6 424.1 45.4 12.0Islands 279.7 224.6 225.3 208.4 -16.8 -7.5
HK$Mn 2012 compared with2011After policy intervention
(recurrent + non-recurrent cash)
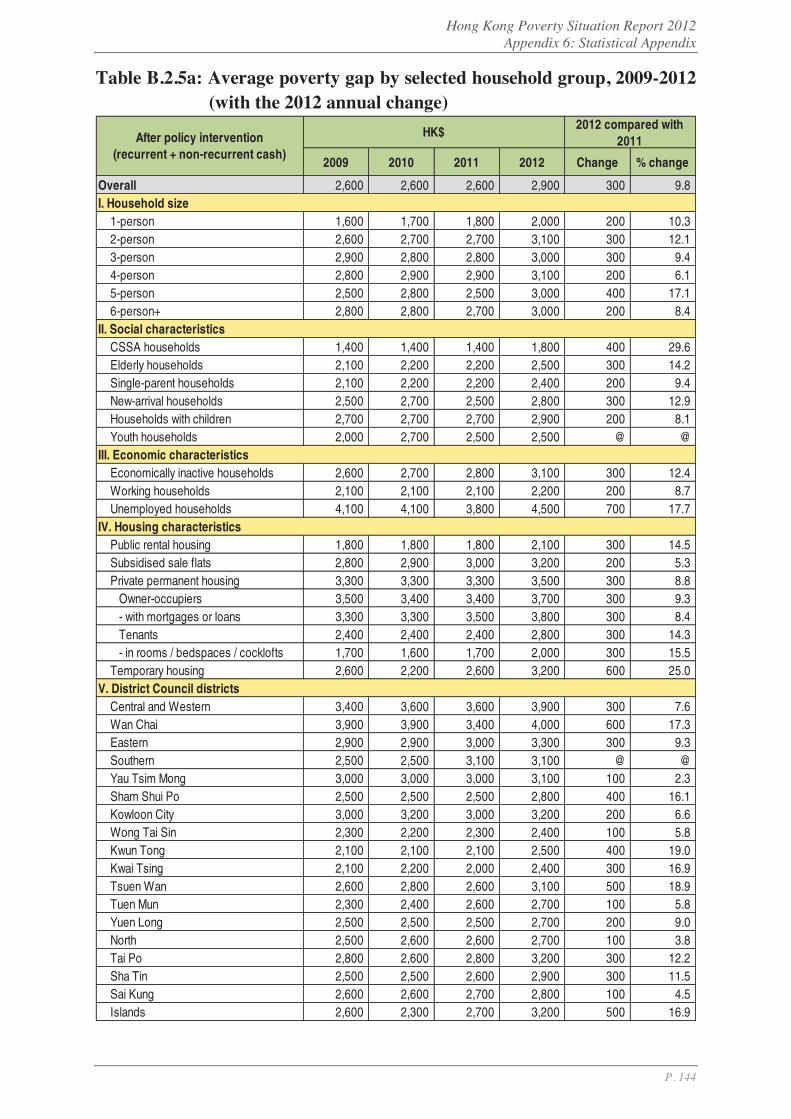
Hong Kong Poverty Situation Report 2012 Appendix 6: Statistical Appendix
P. 144
Table B.2.5a: Average poverty gap by selected household group, 2009-2012 (with the 2012 annual change)
2009 2010 2011 2012 Change % change
Overall 2,600 2,600 2,600 2,900 300 9.8I. Household size
1-person 1,600 1,700 1,800 2,000 200 10.32-person 2,600 2,700 2,700 3,100 300 12.13-person 2,900 2,800 2,800 3,000 300 9.44-person 2,800 2,900 2,900 3,100 200 6.15-person 2,500 2,800 2,500 3,000 400 17.16-person+ 2,800 2,800 2,700 3,000 200 8.4
II. Social characteristicsCSSA households 1,400 1,400 1,400 1,800 400 29.6Elderly households 2,100 2,200 2,200 2,500 300 14.2Single-parent households 2,100 2,200 2,200 2,400 200 9.4New-arrival households 2,500 2,700 2,500 2,800 300 12.9Households with children 2,700 2,700 2,700 2,900 200 8.1Youth households 2,000 2,700 2,500 2,500 @ @
III. Economic characteristicsEconomically inactive households 2,600 2,700 2,800 3,100 300 12.4Working households 2,100 2,100 2,100 2,200 200 8.7Unemployed households 4,100 4,100 3,800 4,500 700 17.7
IV. Housing characteristicsPublic rental housing 1,800 1,800 1,800 2,100 300 14.5Subsidised sale flats 2,800 2,900 3,000 3,200 200 5.3Private permanent housing 3,300 3,300 3,300 3,500 300 8.8
Owner-occupiers 3,500 3,400 3,400 3,700 300 9.3- with mortgages or loans 3,300 3,300 3,500 3,800 300 8.4Tenants 2,400 2,400 2,400 2,800 300 14.3- in rooms / bedspaces / cocklofts 1,700 1,600 1,700 2,000 300 15.5
Temporary housing 2,600 2,200 2,600 3,200 600 25.0V. District Council districts
Central and Western 3,400 3,600 3,600 3,900 300 7.6Wan Chai 3,900 3,900 3,400 4,000 600 17.3Eastern 2,900 2,900 3,000 3,300 300 9.3Southern 2,500 2,500 3,100 3,100 @ @ Yau Tsim Mong 3,000 3,000 3,000 3,100 100 2.3Sham Shui Po 2,500 2,500 2,500 2,800 400 16.1Kowloon City 3,000 3,200 3,000 3,200 200 6.6Wong Tai Sin 2,300 2,200 2,300 2,400 100 5.8Kwun Tong 2,100 2,100 2,100 2,500 400 19.0Kwai Tsing 2,100 2,200 2,000 2,400 300 16.9Tsuen Wan 2,600 2,800 2,600 3,100 500 18.9Tuen Mun 2,300 2,400 2,600 2,700 100 5.8Yuen Long 2,500 2,500 2,500 2,700 200 9.0North 2,500 2,600 2,600 2,700 100 3.8Tai Po 2,800 2,600 2,800 3,200 300 12.2Sha Tin 2,500 2,500 2,600 2,900 300 11.5Sai Kung 2,600 2,600 2,700 2,800 100 4.5Islands 2,600 2,300 2,700 3,200 500 16.9
HK$ 2012 compared with2011After policy intervention
(recurrent + non-recurrent cash)

Hong Kong Poverty Situation Report 2012 Appendix 6: Statistical Appendix
P. 145
Table B.2.1b: Poor households by selected household group, 2009-2012 (with the 2012 comparison of pre- and post-intervention poverty indicators)
2009 2010 2011 2012 Change % change
Overall 361.2 354.2 280.8 312.5 -228.2 -42.2I. Household size
1-person 60.6 62.4 46.2 55.4 -91.2 -62.22-person 133.9 130.9 112.9 115.3 -55.5 -32.53-person 86.2 83.1 57.8 70.5 -40.1 -36.34-person 60.2 58.6 48.7 53.9 -27.3 -33.65-person 14.6 14.9 11.6 13.0 -9.9 -43.26-person+ 5.8 4.5 3.6 4.3 -4.1 -49.3
II. Social characteristicsCSSA households 81.7 83.0 60.7 65.7 -129.2 -66.3Elderly households 92.1 97.1 79.2 89.0 -83.4 -48.4Single-parent households 25.7 26.0 21.3 23.9 -13.7 -36.4New-arrival households 32.7 26.9 24.0 25.3 -8.9 -25.9Households with children 128.9 122.8 99.4 113.2 -54.7 -32.6Youth households 2.2 2.0 1.9 2.2 -1.2 -34.7
III. Economic characteristicsEconomically inactive households 187.4 196.0 168.4 181.1 -129.5 -41.7Working households 142.1 132.9 93.0 115.2 -90.5 -44.0Unemployed households 31.7 25.3 19.4 16.2 -8.2 -33.6
IV. Housing characteristicsPublic rental housing 157.1 152.5 113.4 127.3 -162.0 -56.0Subsidised sale flats 53.8 49.9 37.1 45.6 -15.4 -25.2Private permanent housing 145.0 146.1 125.6 135.9 -49.5 -26.7
Owner-occupiers 114.1 118.5 100.7 107.1 -24.5 -18.6- with mortgages or loans 14.9 10.4 9.2 10.0 -2.0 -16.9Tenants 18.4 16.4 13.6 16.5 -23.0 -58.3- in rooms / bedspaces / cocklofts 2.9 1.8 0.8 1.3 -4.1 -76.1
Temporary housing 5.3 5.8 4.7 3.7 -1.3 -25.7V. District Council districts
Central and Western 11.9 11.4 9.9 10.5 -3.9 -27.2Wan Chai 6.9 8.1 6.9 7.5 -2.1 -22.3Eastern 26.2 26.3 21.2 24.0 -15.2 -38.8Southern 11.2 10.0 8.0 8.9 -7.1 -44.4Yau Tsim Mong 16.6 16.7 14.4 18.0 -7.7 -30.0Sham Shui Po 23.0 23.5 18.8 19.4 -20.4 -51.2Kowloon City 17.0 17.4 14.2 16.3 -8.9 -35.3Wong Tai Sin 23.8 23.8 17.2 21.2 -20.4 -49.1Kwun Tong 37.2 37.1 26.5 31.4 -32.8 -51.0Kwai Tsing 29.0 28.2 21.4 24.1 -20.7 -46.2Tsuen Wan 14.2 12.6 10.6 12.2 -7.4 -37.8Tuen Mun 28.4 28.1 21.5 23.2 -17.0 -42.4Yuen Long 32.9 34.6 27.0 30.0 -19.5 -39.5North 18.0 17.2 14.4 14.6 -9.5 -39.4Tai Po 14.3 12.7 10.3 10.2 -6.5 -38.7Sha Tin 27.3 25.1 19.9 23.1 -16.0 -40.9Sai Kung 14.5 13.3 11.6 12.4 -8.5 -40.7Islands 9.1 8.1 7.0 5.5 -4.6 -45.4
No. of households ('000) 2012After policy intervention(recurrent + non-recurrent cash)
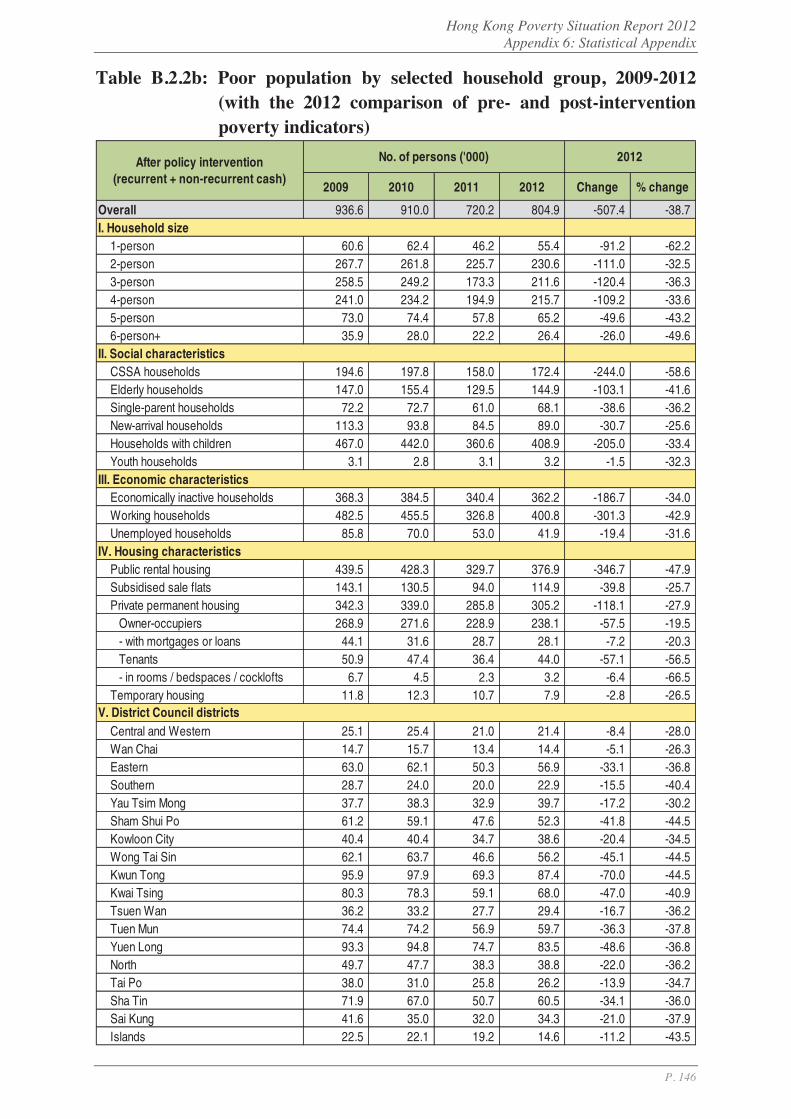
Hong Kong Poverty Situation Report 2012 Appendix 6: Statistical Appendix
P. 146
Table B.2.2b: Poor population by selected household group, 2009-2012 (with the 2012 comparison of pre- and post-intervention poverty indicators)
2009 2010 2011 2012 Change % change
Overall 936.6 910.0 720.2 804.9 -507.4 -38.7I. Household size
1-person 60.6 62.4 46.2 55.4 -91.2 -62.22-person 267.7 261.8 225.7 230.6 -111.0 -32.53-person 258.5 249.2 173.3 211.6 -120.4 -36.34-person 241.0 234.2 194.9 215.7 -109.2 -33.65-person 73.0 74.4 57.8 65.2 -49.6 -43.26-person+ 35.9 28.0 22.2 26.4 -26.0 -49.6
II. Social characteristicsCSSA households 194.6 197.8 158.0 172.4 -244.0 -58.6Elderly households 147.0 155.4 129.5 144.9 -103.1 -41.6Single-parent households 72.2 72.7 61.0 68.1 -38.6 -36.2New-arrival households 113.3 93.8 84.5 89.0 -30.7 -25.6Households with children 467.0 442.0 360.6 408.9 -205.0 -33.4Youth households 3.1 2.8 3.1 3.2 -1.5 -32.3
III. Economic characteristicsEconomically inactive households 368.3 384.5 340.4 362.2 -186.7 -34.0Working households 482.5 455.5 326.8 400.8 -301.3 -42.9Unemployed households 85.8 70.0 53.0 41.9 -19.4 -31.6
IV. Housing characteristicsPublic rental housing 439.5 428.3 329.7 376.9 -346.7 -47.9Subsidised sale flats 143.1 130.5 94.0 114.9 -39.8 -25.7Private permanent housing 342.3 339.0 285.8 305.2 -118.1 -27.9
Owner-occupiers 268.9 271.6 228.9 238.1 -57.5 -19.5- with mortgages or loans 44.1 31.6 28.7 28.1 -7.2 -20.3Tenants 50.9 47.4 36.4 44.0 -57.1 -56.5- in rooms / bedspaces / cocklofts 6.7 4.5 2.3 3.2 -6.4 -66.5
Temporary housing 11.8 12.3 10.7 7.9 -2.8 -26.5
Central and Western 25.1 25.4 21.0 21.4 -8.4 -28.0Wan Chai 14.7 15.7 13.4 14.4 -5.1 -26.3Eastern 63.0 62.1 50.3 56.9 -33.1 -36.8Southern 28.7 24.0 20.0 22.9 -15.5 -40.4Yau Tsim Mong 37.7 38.3 32.9 39.7 -17.2 -30.2Sham Shui Po 61.2 59.1 47.6 52.3 -41.8 -44.5Kowloon City 40.4 40.4 34.7 38.6 -20.4 -34.5Wong Tai Sin 62.1 63.7 46.6 56.2 -45.1 -44.5Kwun Tong 95.9 97.9 69.3 87.4 -70.0 -44.5Kwai Tsing 80.3 78.3 59.1 68.0 -47.0 -40.9Tsuen Wan 36.2 33.2 27.7 29.4 -16.7 -36.2Tuen Mun 74.4 74.2 56.9 59.7 -36.3 -37.8Yuen Long 93.3 94.8 74.7 83.5 -48.6 -36.8North 49.7 47.7 38.3 38.8 -22.0 -36.2Tai Po 38.0 31.0 25.8 26.2 -13.9 -34.7Sha Tin 71.9 67.0 50.7 60.5 -34.1 -36.0Sai Kung 41.6 35.0 32.0 34.3 -21.0 -37.9Islands 22.5 22.1 19.2 14.6 -11.2 -43.5
V. District Council districts
2012No. of persons ('000)After policy intervention(recurrent + non-recurrent cash)
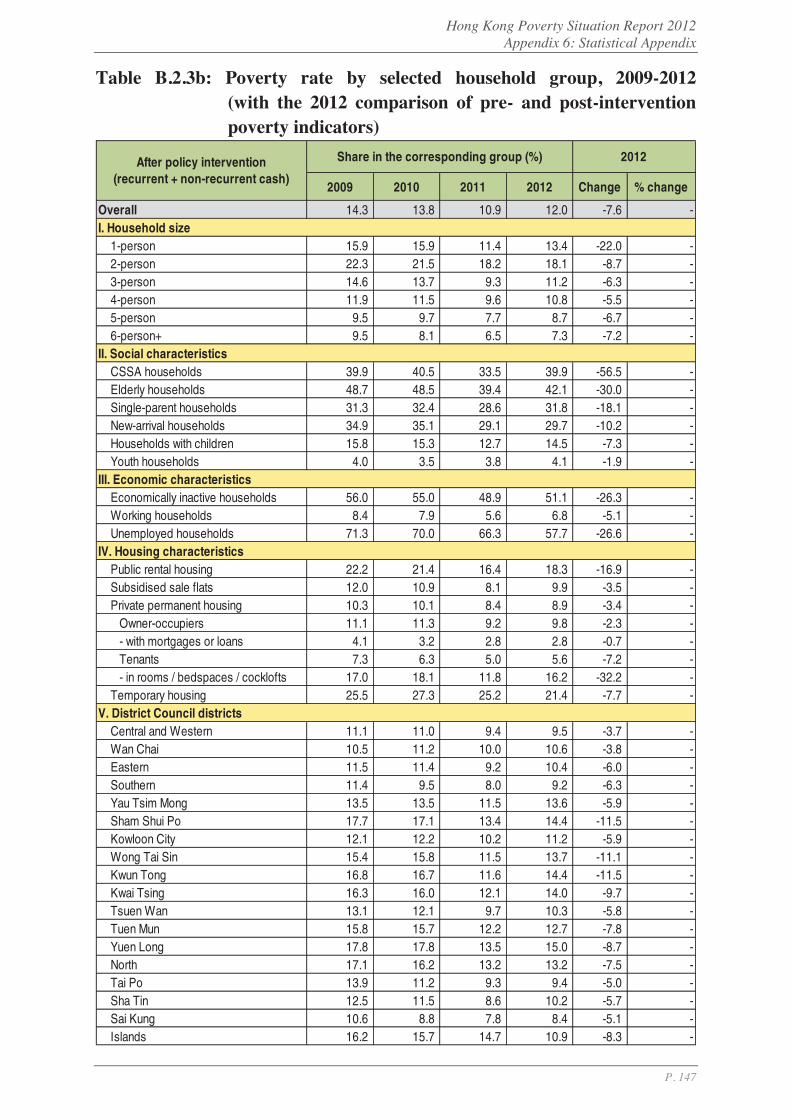
Hong Kong Poverty Situation Report 2012 Appendix 6: Statistical Appendix
P. 147
Table B.2.3b: Poverty rate by selected household group, 2009-2012 (with the 2012 comparison of pre- and post-intervention poverty indicators)
2009 2010 2011 2012 Change % change
Overall 14.3 13.8 10.9 12.0 -7.6 -I. Household size
1-person 15.9 15.9 11.4 13.4 -22.0 -2-person 22.3 21.5 18.2 18.1 -8.7 -3-person 14.6 13.7 9.3 11.2 -6.3 -4-person 11.9 11.5 9.6 10.8 -5.5 -5-person 9.5 9.7 7.7 8.7 -6.7 -6-person+ 9.5 8.1 6.5 7.3 -7.2 -
II. Social characteristicsCSSA households 39.9 40.5 33.5 39.9 -56.5 -Elderly households 48.7 48.5 39.4 42.1 -30.0 -Single-parent households 31.3 32.4 28.6 31.8 -18.1 -New-arrival households 34.9 35.1 29.1 29.7 -10.2 -Households with children 15.8 15.3 12.7 14.5 -7.3 -Youth households 4.0 3.5 3.8 4.1 -1.9 -
III. Economic characteristicsEconomically inactive households 56.0 55.0 48.9 51.1 -26.3 -Working households 8.4 7.9 5.6 6.8 -5.1 -Unemployed households 71.3 70.0 66.3 57.7 -26.6 -
IV. Housing characteristicsPublic rental housing 22.2 21.4 16.4 18.3 -16.9 -Subsidised sale flats 12.0 10.9 8.1 9.9 -3.5 -Private permanent housing 10.3 10.1 8.4 8.9 -3.4 -
Owner-occupiers 11.1 11.3 9.2 9.8 -2.3 -- with mortgages or loans 4.1 3.2 2.8 2.8 -0.7 -Tenants 7.3 6.3 5.0 5.6 -7.2 -- in rooms / bedspaces / cocklofts 17.0 18.1 11.8 16.2 -32.2 -
Temporary housing 25.5 27.3 25.2 21.4 -7.7 -V. District Council districts
Central and Western 11.1 11.0 9.4 9.5 -3.7 -Wan Chai 10.5 11.2 10.0 10.6 -3.8 -Eastern 11.5 11.4 9.2 10.4 -6.0 -Southern 11.4 9.5 8.0 9.2 -6.3 -Yau Tsim Mong 13.5 13.5 11.5 13.6 -5.9 -Sham Shui Po 17.7 17.1 13.4 14.4 -11.5 -Kowloon City 12.1 12.2 10.2 11.2 -5.9 -Wong Tai Sin 15.4 15.8 11.5 13.7 -11.1 -Kwun Tong 16.8 16.7 11.6 14.4 -11.5 -Kwai Tsing 16.3 16.0 12.1 14.0 -9.7 -Tsuen Wan 13.1 12.1 9.7 10.3 -5.8 -Tuen Mun 15.8 15.7 12.2 12.7 -7.8 -Yuen Long 17.8 17.8 13.5 15.0 -8.7 -North 17.1 16.2 13.2 13.2 -7.5 -Tai Po 13.9 11.2 9.3 9.4 -5.0 -Sha Tin 12.5 11.5 8.6 10.2 -5.7 -Sai Kung 10.6 8.8 7.8 8.4 -5.1 -Islands 16.2 15.7 14.7 10.9 -8.3 -
2012Share in the corresponding group (%)After policy intervention(recurrent + non-recurrent cash)

Hong Kong Poverty Situation Report 2012 Appendix 6: Statistical Appendix
P. 148
Table B.2.4b: Total poverty gap by selected household group, 2009-2012 (with the 2012 comparison of pre- and post-intervention poverty indicators)
2009 2010 2011 2012 Change % change
Overall 11,058.9 10,958.3 8,850.2 10,811.0 -17,987.4 -62.5I. Household size
1-person 1,178.8 1,255.7 1,025.2 1,355.0 -3,688.9 -73.12-person 4,209.7 4,211.1 3,721.7 4,263.4 -5,915.0 -58.13-person 2,971.7 2,830.8 1,919.7 2,564.5 -3,986.8 -60.94-person 2,054.0 2,012.6 1,711.6 2,010.2 -2,911.8 -59.25-person 445.7 495.8 352.7 465.7 -1,000.8 -68.26-person+ 198.9 152.3 119.3 152.2 -484.1 -76.1
II. Social characteristicsCSSA households 1,369.8 1,437.3 1,037.7 1,454.3 -11,906.6 -89.1Elderly households 2,301.3 2,595.9 2,095.1 2,686.6 -5,472.6 -67.1Single-parent households 655.1 689.8 557.2 684.8 -2,360.0 -77.5New-arrival households 986.2 877.0 715.9 849.5 -1,194.8 -58.4Households with children 4,137.8 3,941.0 3,167.5 3,898.4 -6,903.9 -63.9Youth households 52.2 62.9 56.6 66.1 -55.4 -45.6
III. Economic characteristicsEconomically inactive households 5,856.6 6,369.3 5,648.9 6,825.8 -12,186.2 -64.1Working households 3,645.5 3,333.4 2,308.2 3,107.2 -4,774.7 -60.6Unemployed households 1,556.8 1,255.7 893.1 878.1 -1,026.4 -53.9
IV. Housing characteristicsPublic rental housing 3,388.0 3,334.1 2,447.0 3,147.1 -12,389.1 -79.7Subsidised sale flats 1,829.2 1,736.1 1,338.8 1,731.5 -1,230.9 -41.6Private permanent housing 5,678.8 5,732.7 4,918.1 5,789.1 -4,240.2 -42.3
Owner-occupiers 4,738.5 4,818.2 4,126.5 4,793.3 -2,371.5 -33.1- with mortgages or loans 594.2 412.8 383.7 449.4 -144.9 -24.4Tenants 523.0 470.0 395.8 548.7 -1,647.4 -75.0- in rooms / bedspaces / cocklofts 60.0 33.9 17.3 30.8 -246.8 -88.9
Temporary housing 162.9 155.5 146.3 143.3 -127.1 -47.0V. District Council districts
Central and Western 477.8 486.5 432.2 493.5 -282.5 -36.4Wan Chai 326.2 377.0 285.3 360.6 -164.2 -31.3Eastern 904.9 923.1 766.5 948.7 -1,135.1 -54.5Southern 336.8 298.8 298.6 333.3 -477.9 -58.9Yau Tsim Mong 605.7 595.5 516.6 658.5 -692.2 -51.2Sham Shui Po 682.1 704.9 552.1 664.0 -1,479.4 -69.0Kowloon City 620.1 667.9 513.0 627.9 -774.1 -55.2Wong Tai Sin 656.4 620.7 467.9 608.9 -1,534.5 -71.6Kwun Tong 950.2 946.5 666.8 942.6 -2,605.3 -73.4Kwai Tsing 736.4 748.0 520.1 681.9 -1,672.8 -71.0Tsuen Wan 443.3 426.3 336.6 461.6 -599.4 -56.5Tuen Mun 789.0 814.7 659.1 751.0 -1,249.4 -62.5Yuen Long 979.9 1,021.0 813.8 984.0 -1,680.9 -63.1North 531.6 546.2 454.7 476.0 -846.7 -64.0Tai Po 484.5 398.5 349.3 389.9 -574.4 -59.6Sha Tin 805.8 743.9 613.8 796.2 -1,287.7 -61.8Sai Kung 448.6 414.2 378.6 424.1 -618.4 -59.3Islands 279.7 224.6 225.3 208.4 -312.4 -60.0
2012HK$MnAfter policy intervention(recurrent + non-recurrent cash)
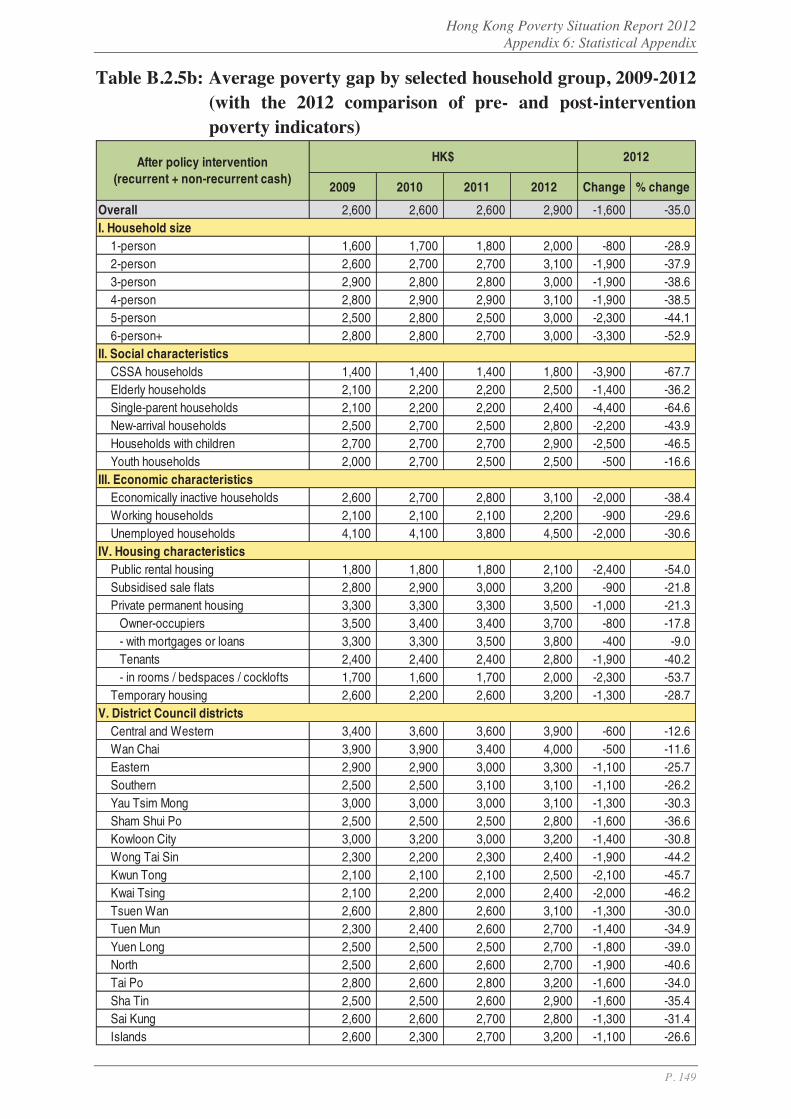
Hong Kong Poverty Situation Report 2012 Appendix 6: Statistical Appendix
P. 149
Table B.2.5b: Average poverty gap by selected household group, 2009-2012 (with the 2012 comparison of pre- and post-intervention poverty indicators)
2009 2010 2011 2012 Change % change
Overall 2,600 2,600 2,600 2,900 -1,600 -35.0I. Household size
1-person 1,600 1,700 1,800 2,000 -800 -28.92-person 2,600 2,700 2,700 3,100 -1,900 -37.93-person 2,900 2,800 2,800 3,000 -1,900 -38.64-person 2,800 2,900 2,900 3,100 -1,900 -38.55-person 2,500 2,800 2,500 3,000 -2,300 -44.16-person+ 2,800 2,800 2,700 3,000 -3,300 -52.9
II. Social characteristicsCSSA households 1,400 1,400 1,400 1,800 -3,900 -67.7Elderly households 2,100 2,200 2,200 2,500 -1,400 -36.2Single-parent households 2,100 2,200 2,200 2,400 -4,400 -64.6New-arrival households 2,500 2,700 2,500 2,800 -2,200 -43.9Households with children 2,700 2,700 2,700 2,900 -2,500 -46.5Youth households 2,000 2,700 2,500 2,500 -500 -16.6
III. Economic characteristicsEconomically inactive households 2,600 2,700 2,800 3,100 -2,000 -38.4Working households 2,100 2,100 2,100 2,200 -900 -29.6Unemployed households 4,100 4,100 3,800 4,500 -2,000 -30.6
IV. Housing characteristicsPublic rental housing 1,800 1,800 1,800 2,100 -2,400 -54.0Subsidised sale flats 2,800 2,900 3,000 3,200 -900 -21.8Private permanent housing 3,300 3,300 3,300 3,500 -1,000 -21.3
Owner-occupiers 3,500 3,400 3,400 3,700 -800 -17.8- with mortgages or loans 3,300 3,300 3,500 3,800 -400 -9.0Tenants 2,400 2,400 2,400 2,800 -1,900 -40.2- in rooms / bedspaces / cocklofts 1,700 1,600 1,700 2,000 -2,300 -53.7
Temporary housing 2,600 2,200 2,600 3,200 -1,300 -28.7V. District Council districts
Central and Western 3,400 3,600 3,600 3,900 -600 -12.6Wan Chai 3,900 3,900 3,400 4,000 -500 -11.6Eastern 2,900 2,900 3,000 3,300 -1,100 -25.7Southern 2,500 2,500 3,100 3,100 -1,100 -26.2Yau Tsim Mong 3,000 3,000 3,000 3,100 -1,300 -30.3Sham Shui Po 2,500 2,500 2,500 2,800 -1,600 -36.6Kowloon City 3,000 3,200 3,000 3,200 -1,400 -30.8Wong Tai Sin 2,300 2,200 2,300 2,400 -1,900 -44.2Kwun Tong 2,100 2,100 2,100 2,500 -2,100 -45.7Kwai Tsing 2,100 2,200 2,000 2,400 -2,000 -46.2Tsuen Wan 2,600 2,800 2,600 3,100 -1,300 -30.0Tuen Mun 2,300 2,400 2,600 2,700 -1,400 -34.9Yuen Long 2,500 2,500 2,500 2,700 -1,800 -39.0North 2,500 2,600 2,600 2,700 -1,900 -40.6Tai Po 2,800 2,600 2,800 3,200 -1,600 -34.0Sha Tin 2,500 2,500 2,600 2,900 -1,600 -35.4Sai Kung 2,600 2,600 2,700 2,800 -1,300 -31.4Islands 2,600 2,300 2,700 3,200 -1,100 -26.6
2012HK$After policy intervention(recurrent + non-recurrent cash)
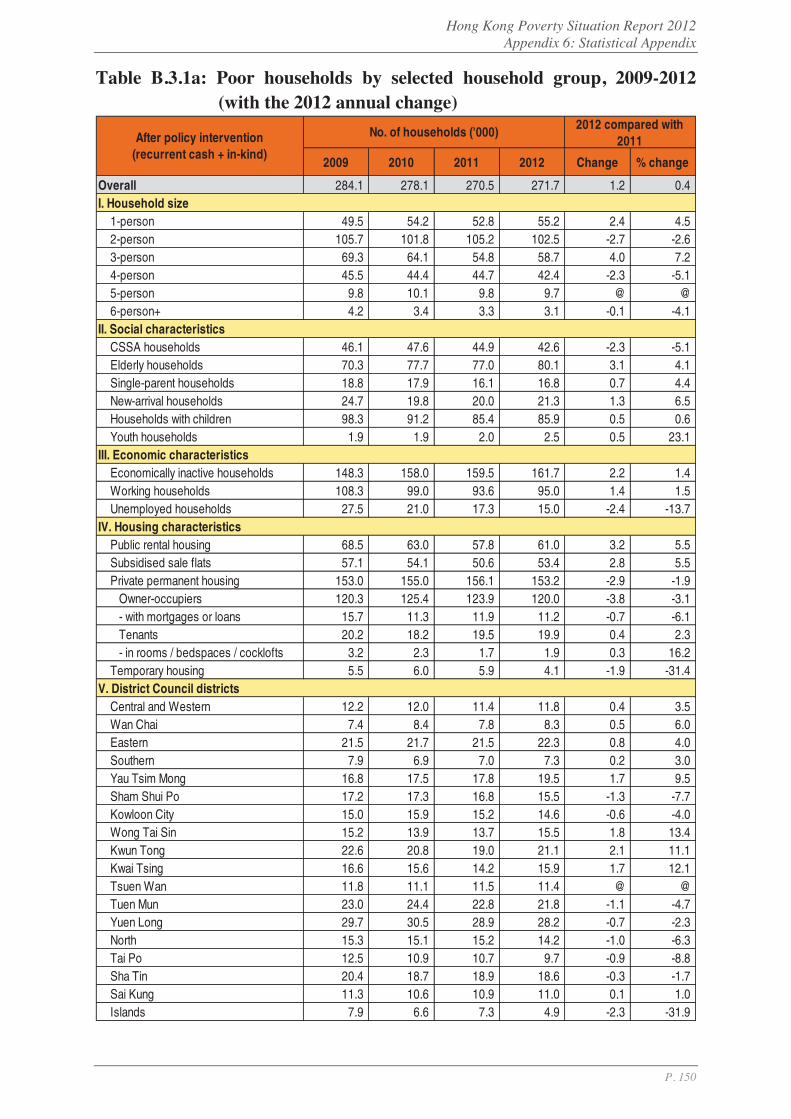
Hong Kong Poverty Situation Report 2012 Appendix 6: Statistical Appendix
P. 150
Table B.3.1a: Poor households by selected household group, 2009-2012 (with the 2012 annual change)
2009 2010 2011 2012 Change % change
Overall 284.1 278.1 270.5 271.7 1.2 0.4I. Household size
1-person 49.5 54.2 52.8 55.2 2.4 4.52-person 105.7 101.8 105.2 102.5 -2.7 -2.63-person 69.3 64.1 54.8 58.7 4.0 7.24-person 45.5 44.4 44.7 42.4 -2.3 -5.15-person 9.8 10.1 9.8 9.7 @ @ 6-person+ 4.2 3.4 3.3 3.1 -0.1 -4.1
II. Social characteristicsCSSA households 46.1 47.6 44.9 42.6 -2.3 -5.1Elderly households 70.3 77.7 77.0 80.1 3.1 4.1Single-parent households 18.8 17.9 16.1 16.8 0.7 4.4New-arrival households 24.7 19.8 20.0 21.3 1.3 6.5Households with children 98.3 91.2 85.4 85.9 0.5 0.6Youth households 1.9 1.9 2.0 2.5 0.5 23.1
III. Economic characteristicsEconomically inactive households 148.3 158.0 159.5 161.7 2.2 1.4Working households 108.3 99.0 93.6 95.0 1.4 1.5Unemployed households 27.5 21.0 17.3 15.0 -2.4 -13.7
IV. Housing characteristicsPublic rental housing 68.5 63.0 57.8 61.0 3.2 5.5Subsidised sale flats 57.1 54.1 50.6 53.4 2.8 5.5Private permanent housing 153.0 155.0 156.1 153.2 -2.9 -1.9
Owner-occupiers 120.3 125.4 123.9 120.0 -3.8 -3.1- with mortgages or loans 15.7 11.3 11.9 11.2 -0.7 -6.1Tenants 20.2 18.2 19.5 19.9 0.4 2.3- in rooms / bedspaces / cocklofts 3.2 2.3 1.7 1.9 0.3 16.2
Temporary housing 5.5 6.0 5.9 4.1 -1.9 -31.4V. District Council districts
Central and Western 12.2 12.0 11.4 11.8 0.4 3.5Wan Chai 7.4 8.4 7.8 8.3 0.5 6.0Eastern 21.5 21.7 21.5 22.3 0.8 4.0Southern 7.9 6.9 7.0 7.3 0.2 3.0Yau Tsim Mong 16.8 17.5 17.8 19.5 1.7 9.5Sham Shui Po 17.2 17.3 16.8 15.5 -1.3 -7.7Kowloon City 15.0 15.9 15.2 14.6 -0.6 -4.0Wong Tai Sin 15.2 13.9 13.7 15.5 1.8 13.4Kwun Tong 22.6 20.8 19.0 21.1 2.1 11.1Kwai Tsing 16.6 15.6 14.2 15.9 1.7 12.1Tsuen Wan 11.8 11.1 11.5 11.4 @ @ Tuen Mun 23.0 24.4 22.8 21.8 -1.1 -4.7Yuen Long 29.7 30.5 28.9 28.2 -0.7 -2.3North 15.3 15.1 15.2 14.2 -1.0 -6.3Tai Po 12.5 10.9 10.7 9.7 -0.9 -8.8Sha Tin 20.4 18.7 18.9 18.6 -0.3 -1.7Sai Kung 11.3 10.6 10.9 11.0 0.1 1.0Islands 7.9 6.6 7.3 4.9 -2.3 -31.9
No. of households ('000) 2012 compared with2011After policy intervention
(recurrent cash + in-kind)

Hong Kong Poverty Situation Report 2012 Appendix 6: Statistical Appendix
P. 151
Table B.3.2a: Poor population by selected household group, 2009-2012 (with the 2012 annual change)
2009 2010 2011 2012 Change %change
Overall 726.0 699.5 675.1 674.2 -0.9 -0.1I. Household size
1-person 49.5 54.2 52.8 55.2 2.4 4.52-person 211.4 203.6 210.4 205.0 -5.4 -2.63-person 208.0 192.4 164.3 176.2 11.9 7.24-person 182.1 177.7 178.7 169.7 -9.1 -5.15-person 49.2 50.6 49.0 48.7 -0.2 -0.56-person+ 25.8 20.9 19.9 19.4 -0.5 -2.6
II. Social characteristicsCSSA households 110.9 114.8 107.4 110.5 3.1 2.9Elderly households 112.1 122.9 122.7 128.2 5.5 4.5Single-parent households 52.5 50.4 45.6 48.0 2.4 5.4New-arrival households 85.1 68.5 68.9 74.0 5.0 7.3Households with children 351.8 326.1 309.9 308.3 -1.6 -0.5Youth households 2.7 2.8 3.2 3.6 0.4 11.4
III. Economic characteristicsEconomically inactive households 290.6 306.7 308.2 314.4 6.1 2.0Working households 362.4 335.4 321.0 321.4 0.5 0.1Unemployed households 73.0 57.4 45.9 38.4 -7.5 -16.4
IV. Housing characteristicsPublic rental housing 200.1 185.2 170.3 185.1 14.8 8.7Subsidised sale flats 152.0 141.6 131.6 135.6 4.0 3.0Private permanent housing 361.7 359.8 359.8 344.8 -15.1 -4.2
Owner-occupiers 283.7 287.6 285.9 268.0 -17.9 -6.3- with mortgages or loans 46.7 34.4 37.2 31.8 -5.4 -14.4Tenants 55.4 51.7 50.7 52.0 1.4 2.7- in rooms / bedspaces / cocklofts 7.3 5.4 3.7 4.6 0.9 23.8
Temporary housing 12.2 12.9 13.3 8.7 -4.6 -34.5V. District Council districts
Central and Western 25.9 26.5 24.2 24.4 0.3 1.0Wan Chai 15.4 16.3 15.5 16.2 0.6 4.0Eastern 49.2 49.5 50.1 51.6 1.5 3.0Southern 19.7 16.5 16.4 18.2 1.8 11.0Yau Tsim Mong 38.4 39.2 40.1 42.2 2.1 5.2Sham Shui Po 45.2 41.6 40.4 41.0 0.6 1.4Kowloon City 35.6 36.5 36.5 33.3 -3.2 -8.8Wong Tai Sin 39.6 37.0 36.5 39.2 2.7 7.5Kwun Tong 57.3 54.1 47.2 55.7 8.5 18.0Kwai Tsing 45.2 43.3 37.2 43.3 6.1 16.5Tsuen Wan 29.4 29.0 29.3 27.2 -2.1 -7.0Tuen Mun 62.4 65.2 61.4 55.7 -5.7 -9.3Yuen Long 84.0 82.8 78.9 76.5 -2.4 -3.1North 42.0 41.5 39.3 37.1 -2.2 -5.7Tai Po 33.0 27.4 26.5 24.7 -1.8 -6.6Sha Tin 53.1 49.3 47.7 47.3 -0.4 -0.8Sai Kung 32.1 26.9 28.9 28.7 -0.2 -0.8Islands 18.5 16.8 19.1 11.8 -7.2 -37.9
No. of persons ('000) 2012 compared with2011After policy intervention
(recurrent cash + in-kind)
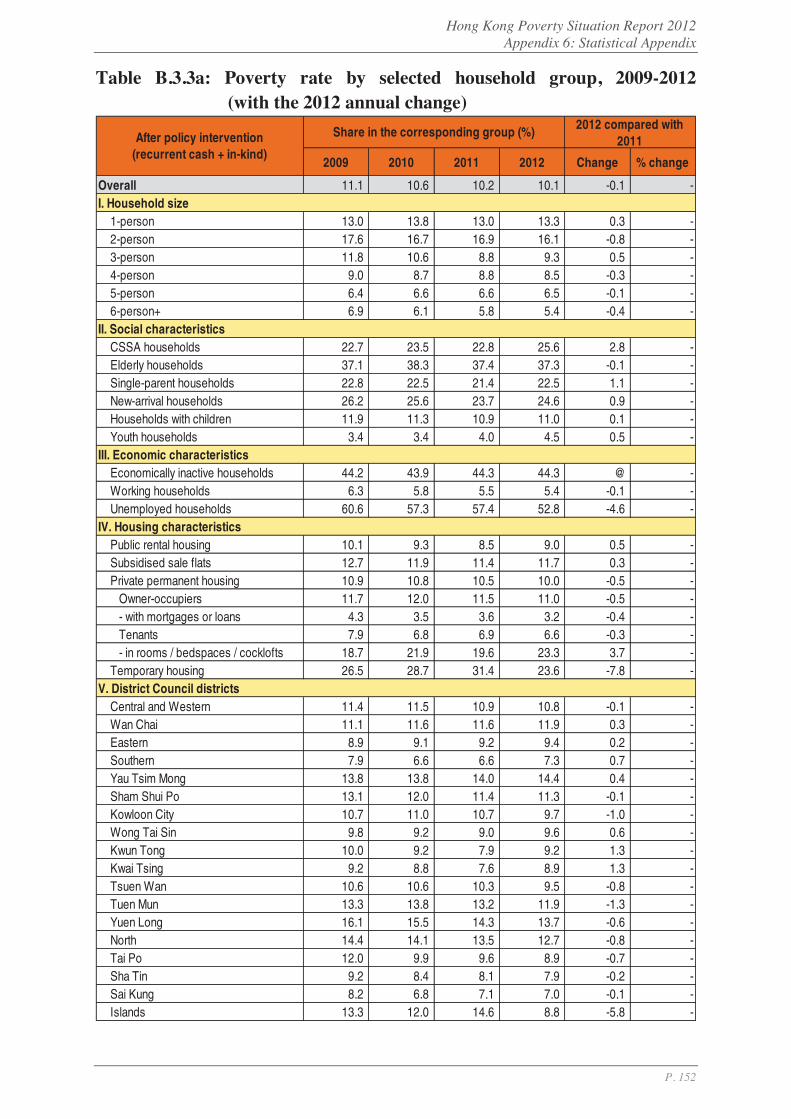
Hong Kong Poverty Situation Report 2012 Appendix 6: Statistical Appendix
P. 152
Table B.3.3a: Poverty rate by selected household group, 2009-2012 (with the 2012 annual change)
2009 2010 2011 2012 Change % change
Overall 11.1 10.6 10.2 10.1 -0.1 -I. Household size
1-person 13.0 13.8 13.0 13.3 0.3 -2-person 17.6 16.7 16.9 16.1 -0.8 -3-person 11.8 10.6 8.8 9.3 0.5 -4-person 9.0 8.7 8.8 8.5 -0.3 -5-person 6.4 6.6 6.6 6.5 -0.1 -6-person+ 6.9 6.1 5.8 5.4 -0.4 -
II. Social characteristicsCSSA households 22.7 23.5 22.8 25.6 2.8 -Elderly households 37.1 38.3 37.4 37.3 -0.1 -Single-parent households 22.8 22.5 21.4 22.5 1.1 -New-arrival households 26.2 25.6 23.7 24.6 0.9 -Households with children 11.9 11.3 10.9 11.0 0.1 -Youth households 3.4 3.4 4.0 4.5 0.5 -
III. Economic characteristicsEconomically inactive households 44.2 43.9 44.3 44.3 @ -Working households 6.3 5.8 5.5 5.4 -0.1 -Unemployed households 60.6 57.3 57.4 52.8 -4.6 -
IV. Housing characteristicsPublic rental housing 10.1 9.3 8.5 9.0 0.5 -Subsidised sale flats 12.7 11.9 11.4 11.7 0.3 -Private permanent housing 10.9 10.8 10.5 10.0 -0.5 -
Owner-occupiers 11.7 12.0 11.5 11.0 -0.5 -- with mortgages or loans 4.3 3.5 3.6 3.2 -0.4 -Tenants 7.9 6.8 6.9 6.6 -0.3 -- in rooms / bedspaces / cocklofts 18.7 21.9 19.6 23.3 3.7 -
Temporary housing 26.5 28.7 31.4 23.6 -7.8 -V. District Council districts
Central and Western 11.4 11.5 10.9 10.8 -0.1 -Wan Chai 11.1 11.6 11.6 11.9 0.3 -Eastern 8.9 9.1 9.2 9.4 0.2 -Southern 7.9 6.6 6.6 7.3 0.7 -Yau Tsim Mong 13.8 13.8 14.0 14.4 0.4 -Sham Shui Po 13.1 12.0 11.4 11.3 -0.1 -Kowloon City 10.7 11.0 10.7 9.7 -1.0 -Wong Tai Sin 9.8 9.2 9.0 9.6 0.6 -Kwun Tong 10.0 9.2 7.9 9.2 1.3 -Kwai Tsing 9.2 8.8 7.6 8.9 1.3 -Tsuen Wan 10.6 10.6 10.3 9.5 -0.8 -Tuen Mun 13.3 13.8 13.2 11.9 -1.3 -Yuen Long 16.1 15.5 14.3 13.7 -0.6 -North 14.4 14.1 13.5 12.7 -0.8 -Tai Po 12.0 9.9 9.6 8.9 -0.7 -Sha Tin 9.2 8.4 8.1 7.9 -0.2 -Sai Kung 8.2 6.8 7.1 7.0 -0.1 -Islands 13.3 12.0 14.6 8.8 -5.8 -
Share in the corresponding group (%) 2012 compared with2011After policy intervention
(recurrent cash + in-kind)
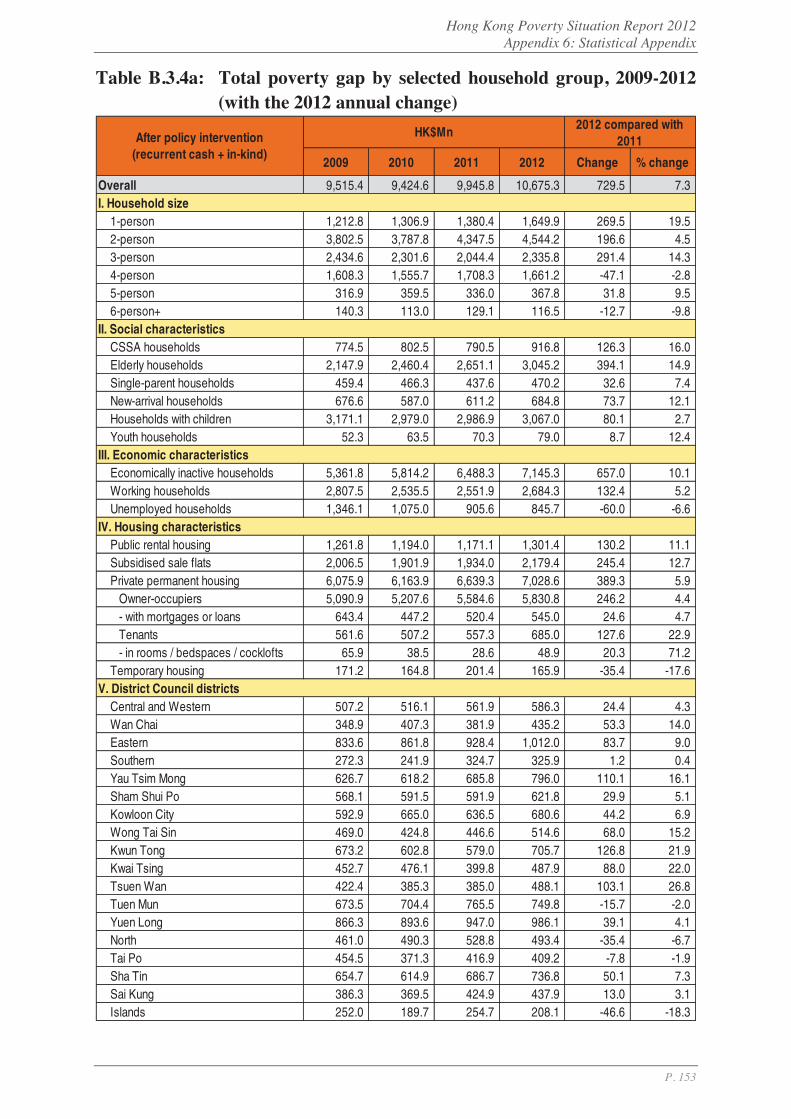
Hong Kong Poverty Situation Report 2012 Appendix 6: Statistical Appendix
P. 153
Table B.3.4a: Total poverty gap by selected household group, 2009-2012 (with the 2012 annual change)
2009 2010 2011 2012 Change % change
Overall 9,515.4 9,424.6 9,945.8 10,675.3 729.5 7.3I. Household size
1-person 1,212.8 1,306.9 1,380.4 1,649.9 269.5 19.52-person 3,802.5 3,787.8 4,347.5 4,544.2 196.6 4.53-person 2,434.6 2,301.6 2,044.4 2,335.8 291.4 14.34-person 1,608.3 1,555.7 1,708.3 1,661.2 -47.1 -2.85-person 316.9 359.5 336.0 367.8 31.8 9.56-person+ 140.3 113.0 129.1 116.5 -12.7 -9.8
II. Social characteristicsCSSA households 774.5 802.5 790.5 916.8 126.3 16.0Elderly households 2,147.9 2,460.4 2,651.1 3,045.2 394.1 14.9Single-parent households 459.4 466.3 437.6 470.2 32.6 7.4New-arrival households 676.6 587.0 611.2 684.8 73.7 12.1Households with children 3,171.1 2,979.0 2,986.9 3,067.0 80.1 2.7Youth households 52.3 63.5 70.3 79.0 8.7 12.4
III. Economic characteristicsEconomically inactive households 5,361.8 5,814.2 6,488.3 7,145.3 657.0 10.1Working households 2,807.5 2,535.5 2,551.9 2,684.3 132.4 5.2Unemployed households 1,346.1 1,075.0 905.6 845.7 -60.0 -6.6
IV. Housing characteristicsPublic rental housing 1,261.8 1,194.0 1,171.1 1,301.4 130.2 11.1Subsidised sale flats 2,006.5 1,901.9 1,934.0 2,179.4 245.4 12.7Private permanent housing 6,075.9 6,163.9 6,639.3 7,028.6 389.3 5.9
Owner-occupiers 5,090.9 5,207.6 5,584.6 5,830.8 246.2 4.4- with mortgages or loans 643.4 447.2 520.4 545.0 24.6 4.7Tenants 561.6 507.2 557.3 685.0 127.6 22.9- in rooms / bedspaces / cocklofts 65.9 38.5 28.6 48.9 20.3 71.2
Temporary housing 171.2 164.8 201.4 165.9 -35.4 -17.6V. District Council districts
Central and Western 507.2 516.1 561.9 586.3 24.4 4.3Wan Chai 348.9 407.3 381.9 435.2 53.3 14.0Eastern 833.6 861.8 928.4 1,012.0 83.7 9.0Southern 272.3 241.9 324.7 325.9 1.2 0.4Yau Tsim Mong 626.7 618.2 685.8 796.0 110.1 16.1Sham Shui Po 568.1 591.5 591.9 621.8 29.9 5.1Kowloon City 592.9 665.0 636.5 680.6 44.2 6.9Wong Tai Sin 469.0 424.8 446.6 514.6 68.0 15.2Kwun Tong 673.2 602.8 579.0 705.7 126.8 21.9Kwai Tsing 452.7 476.1 399.8 487.9 88.0 22.0Tsuen Wan 422.4 385.3 385.0 488.1 103.1 26.8Tuen Mun 673.5 704.4 765.5 749.8 -15.7 -2.0Yuen Long 866.3 893.6 947.0 986.1 39.1 4.1North 461.0 490.3 528.8 493.4 -35.4 -6.7Tai Po 454.5 371.3 416.9 409.2 -7.8 -1.9Sha Tin 654.7 614.9 686.7 736.8 50.1 7.3Sai Kung 386.3 369.5 424.9 437.9 13.0 3.1Islands 252.0 189.7 254.7 208.1 -46.6 -18.3
HK$Mn 2012 compared with2011After policy intervention
(recurrent cash + in-kind)

Hong Kong Poverty Situation Report 2012 Appendix 6: Statistical Appendix
P. 154
Table B.3.5a: Average poverty gap by selected household group, 2009-2012 (with the 2012 annual change)
2009 2010 2011 2012 Change % change
Overall 2,800 2,800 3,100 3,300 200 6.9I. Household size
1-person 2,000 2,000 2,200 2,500 300 14.42-person 3,000 3,100 3,400 3,700 300 7.33-person 2,900 3,000 3,100 3,300 200 6.64-person 2,900 2,900 3,200 3,300 100 2.45-person 2,700 3,000 2,900 3,100 300 10.06-person+ 2,800 2,800 3,300 3,100 -200 -6.0
II. Social characteristicsCSSA households 1,400 1,400 1,500 1,800 300 22.3Elderly households 2,500 2,600 2,900 3,200 300 10.4Single-parent households 2,000 2,200 2,300 2,300 100 2.9New-arrival households 2,300 2,500 2,500 2,700 100 5.2Households with children 2,700 2,700 2,900 3,000 100 2.1Youth households 2,200 2,800 2,900 2,700 -300 -8.8
III. Economic characteristicsEconomically inactive households 3,000 3,100 3,400 3,700 300 8.6Working households 2,200 2,100 2,300 2,400 100 3.6Unemployed households 4,100 4,300 4,400 4,700 400 8.2
IV. Housing characteristicsPublic rental housing 1,500 1,600 1,700 1,800 100 5.3Subsidised sale flats 2,900 2,900 3,200 3,400 200 6.8Private permanent housing 3,300 3,300 3,500 3,800 300 7.9
Owner-occupiers 3,500 3,500 3,800 4,000 300 7.7- with mortgages or loans 3,400 3,300 3,600 4,100 400 11.5Tenants 2,300 2,300 2,400 2,900 500 20.2- in rooms / bedspaces / cocklofts 1,700 1,400 1,400 2,100 700 47.2
Temporary housing 2,600 2,300 2,800 3,400 600 20.1V. District Council districts
Central and Western 3,500 3,600 4,100 4,100 @ @ Wan Chai 3,900 4,000 4,100 4,400 300 7.5Eastern 3,200 3,300 3,600 3,800 200 4.9Southern 2,900 2,900 3,800 3,700 -100 -2.5Yau Tsim Mong 3,100 2,900 3,200 3,400 200 6.0Sham Shui Po 2,800 2,800 2,900 3,300 400 13.8Kowloon City 3,300 3,500 3,500 3,900 400 11.4Wong Tai Sin 2,600 2,500 2,700 2,800 @ @ Kwun Tong 2,500 2,400 2,500 2,800 200 9.7Kwai Tsing 2,300 2,500 2,400 2,600 200 8.8Tsuen Wan 3,000 2,900 2,800 3,600 800 27.1Tuen Mun 2,400 2,400 2,800 2,900 100 2.8Yuen Long 2,400 2,400 2,700 2,900 200 6.6North 2,500 2,700 2,900 2,900 @ @ Tai Po 3,000 2,800 3,300 3,500 200 7.6Sha Tin 2,700 2,700 3,000 3,300 300 9.2Sai Kung 2,900 2,900 3,200 3,300 100 2.0Islands 2,700 2,400 2,900 3,500 600 20.0
HK$ 2012 compared with2011After policy intervention
(recurrent cash + in-kind)
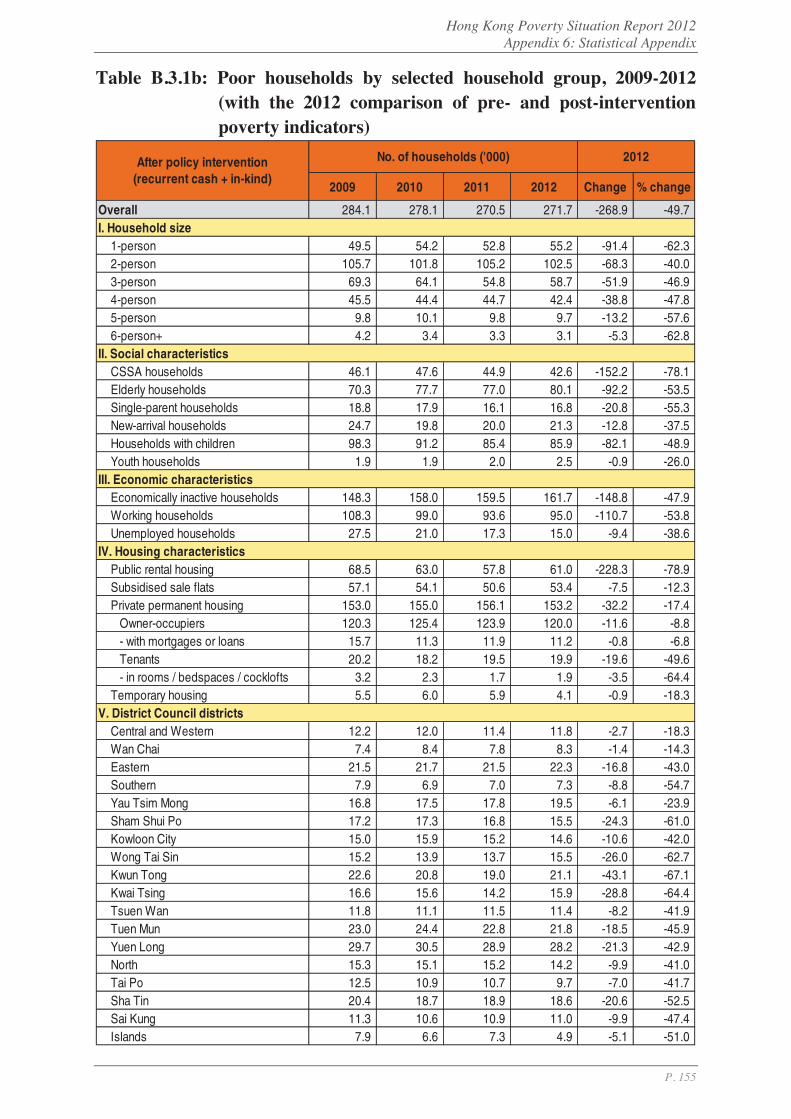
Hong Kong Poverty Situation Report 2012 Appendix 6: Statistical Appendix
P. 155
Table B.3.1b: Poor households by selected household group, 2009-2012 (with the 2012 comparison of pre- and post-intervention poverty indicators)
2009 2010 2011 2012 Change % change
Overall 284.1 278.1 270.5 271.7 -268.9 -49.7I. Household size
1-person 49.5 54.2 52.8 55.2 -91.4 -62.32-person 105.7 101.8 105.2 102.5 -68.3 -40.03-person 69.3 64.1 54.8 58.7 -51.9 -46.94-person 45.5 44.4 44.7 42.4 -38.8 -47.85-person 9.8 10.1 9.8 9.7 -13.2 -57.66-person+ 4.2 3.4 3.3 3.1 -5.3 -62.8
II. Social characteristicsCSSA households 46.1 47.6 44.9 42.6 -152.2 -78.1Elderly households 70.3 77.7 77.0 80.1 -92.2 -53.5Single-parent households 18.8 17.9 16.1 16.8 -20.8 -55.3New-arrival households 24.7 19.8 20.0 21.3 -12.8 -37.5Households with children 98.3 91.2 85.4 85.9 -82.1 -48.9Youth households 1.9 1.9 2.0 2.5 -0.9 -26.0
III. Economic characteristicsEconomically inactive households 148.3 158.0 159.5 161.7 -148.8 -47.9Working households 108.3 99.0 93.6 95.0 -110.7 -53.8Unemployed households 27.5 21.0 17.3 15.0 -9.4 -38.6
IV. Housing characteristicsPublic rental housing 68.5 63.0 57.8 61.0 -228.3 -78.9Subsidised sale flats 57.1 54.1 50.6 53.4 -7.5 -12.3Private permanent housing 153.0 155.0 156.1 153.2 -32.2 -17.4
Owner-occupiers 120.3 125.4 123.9 120.0 -11.6 -8.8- with mortgages or loans 15.7 11.3 11.9 11.2 -0.8 -6.8Tenants 20.2 18.2 19.5 19.9 -19.6 -49.6- in rooms / bedspaces / cocklofts 3.2 2.3 1.7 1.9 -3.5 -64.4
Temporary housing 5.5 6.0 5.9 4.1 -0.9 -18.3V. District Council districts
Central and Western 12.2 12.0 11.4 11.8 -2.7 -18.3Wan Chai 7.4 8.4 7.8 8.3 -1.4 -14.3Eastern 21.5 21.7 21.5 22.3 -16.8 -43.0Southern 7.9 6.9 7.0 7.3 -8.8 -54.7Yau Tsim Mong 16.8 17.5 17.8 19.5 -6.1 -23.9Sham Shui Po 17.2 17.3 16.8 15.5 -24.3 -61.0Kowloon City 15.0 15.9 15.2 14.6 -10.6 -42.0Wong Tai Sin 15.2 13.9 13.7 15.5 -26.0 -62.7Kwun Tong 22.6 20.8 19.0 21.1 -43.1 -67.1Kwai Tsing 16.6 15.6 14.2 15.9 -28.8 -64.4Tsuen Wan 11.8 11.1 11.5 11.4 -8.2 -41.9Tuen Mun 23.0 24.4 22.8 21.8 -18.5 -45.9Yuen Long 29.7 30.5 28.9 28.2 -21.3 -42.9North 15.3 15.1 15.2 14.2 -9.9 -41.0Tai Po 12.5 10.9 10.7 9.7 -7.0 -41.7Sha Tin 20.4 18.7 18.9 18.6 -20.6 -52.5Sai Kung 11.3 10.6 10.9 11.0 -9.9 -47.4Islands 7.9 6.6 7.3 4.9 -5.1 -51.0
No. of households ('000) 2012After policy intervention(recurrent cash + in-kind)
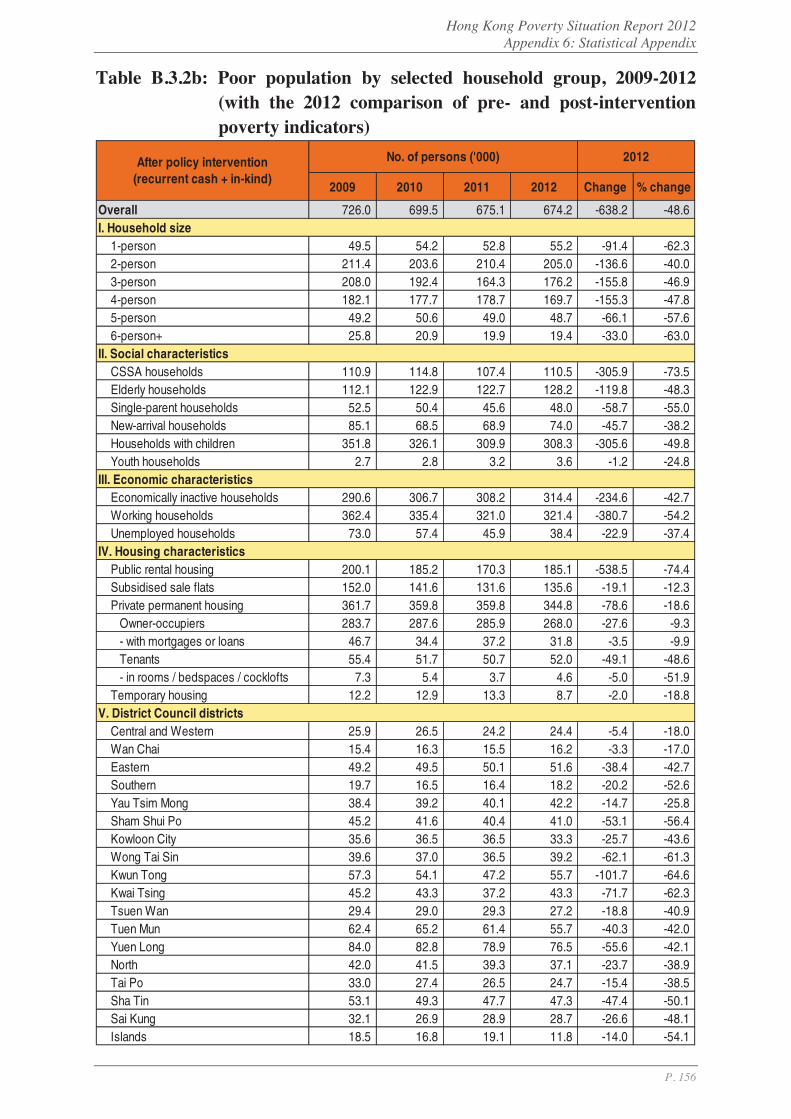
Hong Kong Poverty Situation Report 2012 Appendix 6: Statistical Appendix
P. 156
Table B.3.2b: Poor population by selected household group, 2009-2012 (with the 2012 comparison of pre- and post-intervention poverty indicators)
2009 2010 2011 2012 Change % change
Overall 726.0 699.5 675.1 674.2 -638.2 -48.6I. Household size
1-person 49.5 54.2 52.8 55.2 -91.4 -62.32-person 211.4 203.6 210.4 205.0 -136.6 -40.03-person 208.0 192.4 164.3 176.2 -155.8 -46.94-person 182.1 177.7 178.7 169.7 -155.3 -47.85-person 49.2 50.6 49.0 48.7 -66.1 -57.66-person+ 25.8 20.9 19.9 19.4 -33.0 -63.0
II. Social characteristicsCSSA households 110.9 114.8 107.4 110.5 -305.9 -73.5Elderly households 112.1 122.9 122.7 128.2 -119.8 -48.3Single-parent households 52.5 50.4 45.6 48.0 -58.7 -55.0New-arrival households 85.1 68.5 68.9 74.0 -45.7 -38.2Households with children 351.8 326.1 309.9 308.3 -305.6 -49.8Youth households 2.7 2.8 3.2 3.6 -1.2 -24.8
III. Economic characteristicsEconomically inactive households 290.6 306.7 308.2 314.4 -234.6 -42.7Working households 362.4 335.4 321.0 321.4 -380.7 -54.2Unemployed households 73.0 57.4 45.9 38.4 -22.9 -37.4
IV. Housing characteristicsPublic rental housing 200.1 185.2 170.3 185.1 -538.5 -74.4Subsidised sale flats 152.0 141.6 131.6 135.6 -19.1 -12.3Private permanent housing 361.7 359.8 359.8 344.8 -78.6 -18.6
Owner-occupiers 283.7 287.6 285.9 268.0 -27.6 -9.3- with mortgages or loans 46.7 34.4 37.2 31.8 -3.5 -9.9Tenants 55.4 51.7 50.7 52.0 -49.1 -48.6- in rooms / bedspaces / cocklofts 7.3 5.4 3.7 4.6 -5.0 -51.9
Temporary housing 12.2 12.9 13.3 8.7 -2.0 -18.8V. District Council districts
Central and Western 25.9 26.5 24.2 24.4 -5.4 -18.0Wan Chai 15.4 16.3 15.5 16.2 -3.3 -17.0Eastern 49.2 49.5 50.1 51.6 -38.4 -42.7Southern 19.7 16.5 16.4 18.2 -20.2 -52.6Yau Tsim Mong 38.4 39.2 40.1 42.2 -14.7 -25.8Sham Shui Po 45.2 41.6 40.4 41.0 -53.1 -56.4Kowloon City 35.6 36.5 36.5 33.3 -25.7 -43.6Wong Tai Sin 39.6 37.0 36.5 39.2 -62.1 -61.3Kwun Tong 57.3 54.1 47.2 55.7 -101.7 -64.6Kwai Tsing 45.2 43.3 37.2 43.3 -71.7 -62.3Tsuen Wan 29.4 29.0 29.3 27.2 -18.8 -40.9Tuen Mun 62.4 65.2 61.4 55.7 -40.3 -42.0Yuen Long 84.0 82.8 78.9 76.5 -55.6 -42.1North 42.0 41.5 39.3 37.1 -23.7 -38.9Tai Po 33.0 27.4 26.5 24.7 -15.4 -38.5Sha Tin 53.1 49.3 47.7 47.3 -47.4 -50.1Sai Kung 32.1 26.9 28.9 28.7 -26.6 -48.1Islands 18.5 16.8 19.1 11.8 -14.0 -54.1
No. of persons ('000) 2012After policy intervention(recurrent cash + in-kind)
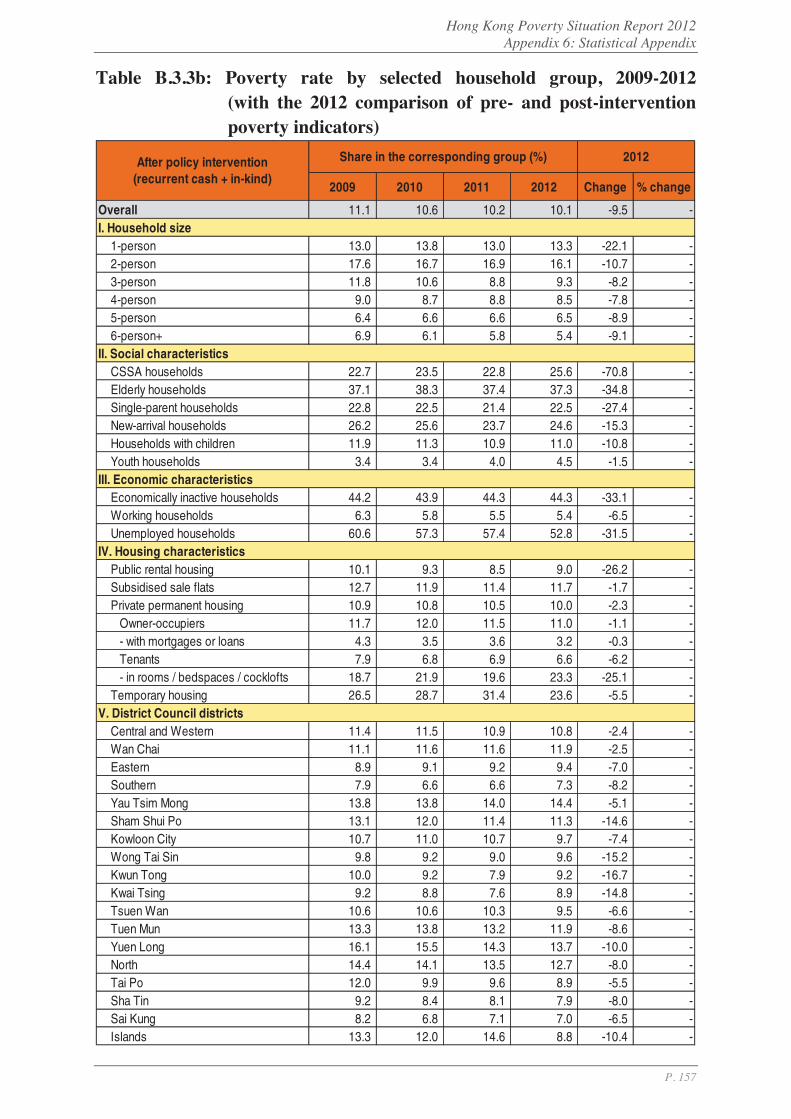
Hong Kong Poverty Situation Report 2012 Appendix 6: Statistical Appendix
P. 157
Table B.3.3b: Poverty rate by selected household group, 2009-2012 (with the 2012 comparison of pre- and post-intervention poverty indicators)
2009 2010 2011 2012 Change % change
Overall 11.1 10.6 10.2 10.1 -9.5 -I. Household size
1-person 13.0 13.8 13.0 13.3 -22.1 -2-person 17.6 16.7 16.9 16.1 -10.7 -3-person 11.8 10.6 8.8 9.3 -8.2 -4-person 9.0 8.7 8.8 8.5 -7.8 -5-person 6.4 6.6 6.6 6.5 -8.9 -6-person+ 6.9 6.1 5.8 5.4 -9.1 -
II. Social characteristicsCSSA households 22.7 23.5 22.8 25.6 -70.8 -Elderly households 37.1 38.3 37.4 37.3 -34.8 -Single-parent households 22.8 22.5 21.4 22.5 -27.4 -New-arrival households 26.2 25.6 23.7 24.6 -15.3 -Households with children 11.9 11.3 10.9 11.0 -10.8 -Youth households 3.4 3.4 4.0 4.5 -1.5 -
III. Economic characteristicsEconomically inactive households 44.2 43.9 44.3 44.3 -33.1 -Working households 6.3 5.8 5.5 5.4 -6.5 -Unemployed households 60.6 57.3 57.4 52.8 -31.5 -
IV. Housing characteristicsPublic rental housing 10.1 9.3 8.5 9.0 -26.2 -Subsidised sale flats 12.7 11.9 11.4 11.7 -1.7 -Private permanent housing 10.9 10.8 10.5 10.0 -2.3 -
Owner-occupiers 11.7 12.0 11.5 11.0 -1.1 -- with mortgages or loans 4.3 3.5 3.6 3.2 -0.3 -Tenants 7.9 6.8 6.9 6.6 -6.2 -- in rooms / bedspaces / cocklofts 18.7 21.9 19.6 23.3 -25.1 -
Temporary housing 26.5 28.7 31.4 23.6 -5.5 -V. District Council districts
Central and Western 11.4 11.5 10.9 10.8 -2.4 -Wan Chai 11.1 11.6 11.6 11.9 -2.5 -Eastern 8.9 9.1 9.2 9.4 -7.0 -Southern 7.9 6.6 6.6 7.3 -8.2 -Yau Tsim Mong 13.8 13.8 14.0 14.4 -5.1 -Sham Shui Po 13.1 12.0 11.4 11.3 -14.6 -Kowloon City 10.7 11.0 10.7 9.7 -7.4 -Wong Tai Sin 9.8 9.2 9.0 9.6 -15.2 -Kwun Tong 10.0 9.2 7.9 9.2 -16.7 -Kwai Tsing 9.2 8.8 7.6 8.9 -14.8 -Tsuen Wan 10.6 10.6 10.3 9.5 -6.6 -Tuen Mun 13.3 13.8 13.2 11.9 -8.6 -Yuen Long 16.1 15.5 14.3 13.7 -10.0 -North 14.4 14.1 13.5 12.7 -8.0 -Tai Po 12.0 9.9 9.6 8.9 -5.5 -Sha Tin 9.2 8.4 8.1 7.9 -8.0 -Sai Kung 8.2 6.8 7.1 7.0 -6.5 -Islands 13.3 12.0 14.6 8.8 -10.4 -
Share in the corresponding group (%) 2012After policy intervention(recurrent cash + in-kind)
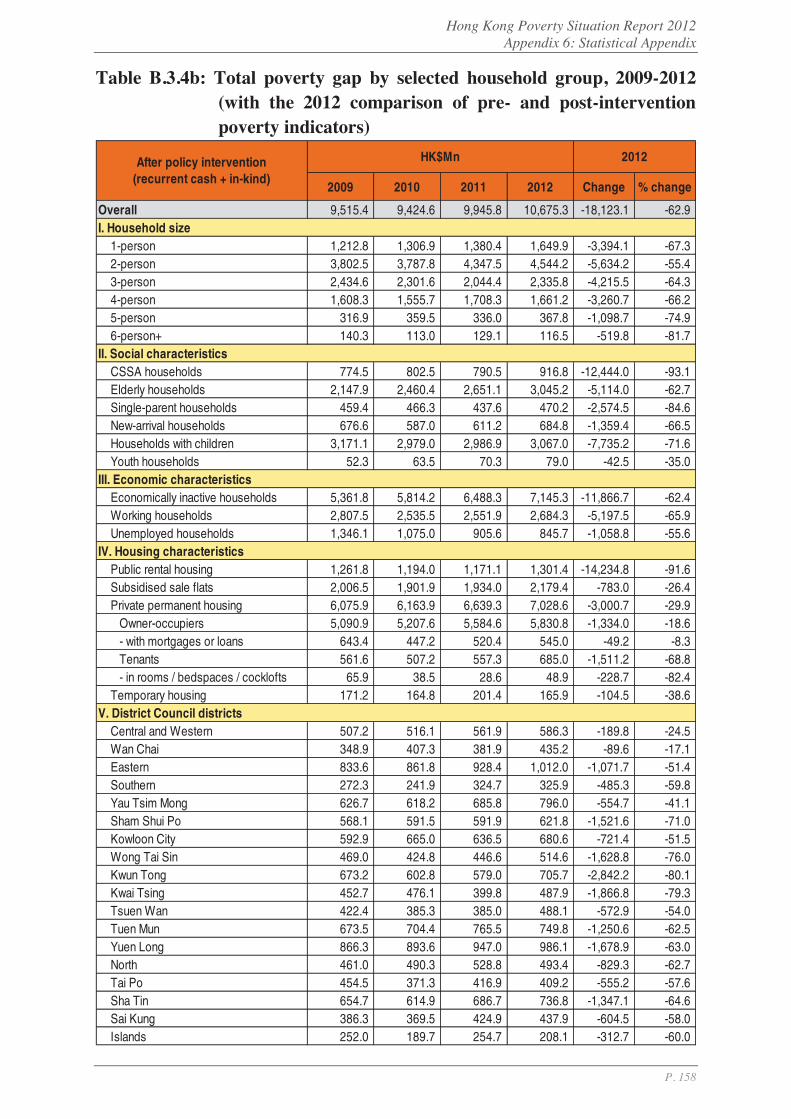
Hong Kong Poverty Situation Report 2012 Appendix 6: Statistical Appendix
P. 158
Table B.3.4b: Total poverty gap by selected household group, 2009-2012 (with the 2012 comparison of pre- and post-intervention poverty indicators)
2009 2010 2011 2012 Change % change
Overall 9,515.4 9,424.6 9,945.8 10,675.3 -18,123.1 -62.9I. Household size
1-person 1,212.8 1,306.9 1,380.4 1,649.9 -3,394.1 -67.32-person 3,802.5 3,787.8 4,347.5 4,544.2 -5,634.2 -55.43-person 2,434.6 2,301.6 2,044.4 2,335.8 -4,215.5 -64.34-person 1,608.3 1,555.7 1,708.3 1,661.2 -3,260.7 -66.25-person 316.9 359.5 336.0 367.8 -1,098.7 -74.96-person+ 140.3 113.0 129.1 116.5 -519.8 -81.7
II. Social characteristicsCSSA households 774.5 802.5 790.5 916.8 -12,444.0 -93.1Elderly households 2,147.9 2,460.4 2,651.1 3,045.2 -5,114.0 -62.7Single-parent households 459.4 466.3 437.6 470.2 -2,574.5 -84.6New-arrival households 676.6 587.0 611.2 684.8 -1,359.4 -66.5Households with children 3,171.1 2,979.0 2,986.9 3,067.0 -7,735.2 -71.6Youth households 52.3 63.5 70.3 79.0 -42.5 -35.0
III. Economic characteristicsEconomically inactive households 5,361.8 5,814.2 6,488.3 7,145.3 -11,866.7 -62.4Working households 2,807.5 2,535.5 2,551.9 2,684.3 -5,197.5 -65.9Unemployed households 1,346.1 1,075.0 905.6 845.7 -1,058.8 -55.6
IV. Housing characteristicsPublic rental housing 1,261.8 1,194.0 1,171.1 1,301.4 -14,234.8 -91.6Subsidised sale flats 2,006.5 1,901.9 1,934.0 2,179.4 -783.0 -26.4Private permanent housing 6,075.9 6,163.9 6,639.3 7,028.6 -3,000.7 -29.9
Owner-occupiers 5,090.9 5,207.6 5,584.6 5,830.8 -1,334.0 -18.6- with mortgages or loans 643.4 447.2 520.4 545.0 -49.2 -8.3Tenants 561.6 507.2 557.3 685.0 -1,511.2 -68.8- in rooms / bedspaces / cocklofts 65.9 38.5 28.6 48.9 -228.7 -82.4
Temporary housing 171.2 164.8 201.4 165.9 -104.5 -38.6V. District Council districts
Central and Western 507.2 516.1 561.9 586.3 -189.8 -24.5Wan Chai 348.9 407.3 381.9 435.2 -89.6 -17.1Eastern 833.6 861.8 928.4 1,012.0 -1,071.7 -51.4Southern 272.3 241.9 324.7 325.9 -485.3 -59.8Yau Tsim Mong 626.7 618.2 685.8 796.0 -554.7 -41.1Sham Shui Po 568.1 591.5 591.9 621.8 -1,521.6 -71.0Kowloon City 592.9 665.0 636.5 680.6 -721.4 -51.5Wong Tai Sin 469.0 424.8 446.6 514.6 -1,628.8 -76.0Kwun Tong 673.2 602.8 579.0 705.7 -2,842.2 -80.1Kwai Tsing 452.7 476.1 399.8 487.9 -1,866.8 -79.3Tsuen Wan 422.4 385.3 385.0 488.1 -572.9 -54.0Tuen Mun 673.5 704.4 765.5 749.8 -1,250.6 -62.5Yuen Long 866.3 893.6 947.0 986.1 -1,678.9 -63.0North 461.0 490.3 528.8 493.4 -829.3 -62.7Tai Po 454.5 371.3 416.9 409.2 -555.2 -57.6Sha Tin 654.7 614.9 686.7 736.8 -1,347.1 -64.6Sai Kung 386.3 369.5 424.9 437.9 -604.5 -58.0Islands 252.0 189.7 254.7 208.1 -312.7 -60.0
HK$Mn 2012After policy intervention(recurrent cash + in-kind)
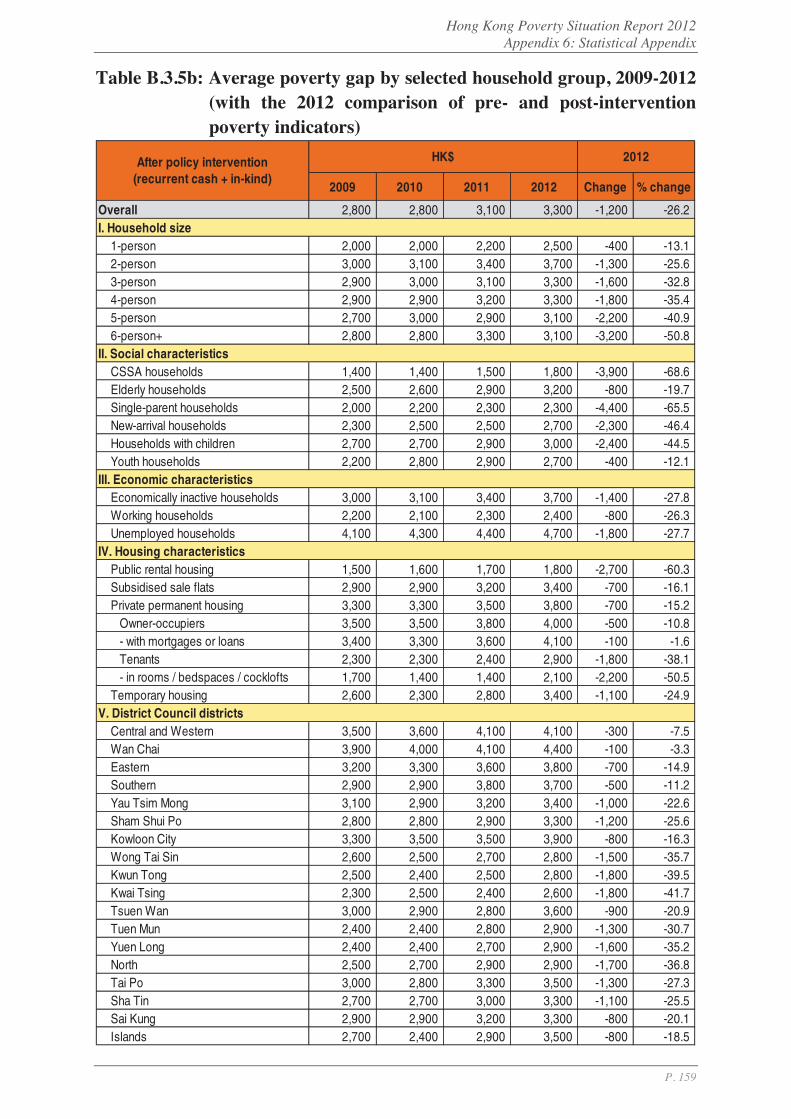
Hong Kong Poverty Situation Report 2012 Appendix 6: Statistical Appendix
P. 159
Table B.3.5b: Average poverty gap by selected household group, 2009-2012 (with the 2012 comparison of pre- and post-intervention poverty indicators)
2009 2010 2011 2012 Change % change
Overall 2,800 2,800 3,100 3,300 -1,200 -26.2I. Household size
1-person 2,000 2,000 2,200 2,500 -400 -13.12-person 3,000 3,100 3,400 3,700 -1,300 -25.63-person 2,900 3,000 3,100 3,300 -1,600 -32.84-person 2,900 2,900 3,200 3,300 -1,800 -35.45-person 2,700 3,000 2,900 3,100 -2,200 -40.96-person+ 2,800 2,800 3,300 3,100 -3,200 -50.8
II. Social characteristicsCSSA households 1,400 1,400 1,500 1,800 -3,900 -68.6Elderly households 2,500 2,600 2,900 3,200 -800 -19.7Single-parent households 2,000 2,200 2,300 2,300 -4,400 -65.5New-arrival households 2,300 2,500 2,500 2,700 -2,300 -46.4Households with children 2,700 2,700 2,900 3,000 -2,400 -44.5Youth households 2,200 2,800 2,900 2,700 -400 -12.1
III. Economic characteristicsEconomically inactive households 3,000 3,100 3,400 3,700 -1,400 -27.8Working households 2,200 2,100 2,300 2,400 -800 -26.3Unemployed households 4,100 4,300 4,400 4,700 -1,800 -27.7
IV. Housing characteristicsPublic rental housing 1,500 1,600 1,700 1,800 -2,700 -60.3Subsidised sale flats 2,900 2,900 3,200 3,400 -700 -16.1Private permanent housing 3,300 3,300 3,500 3,800 -700 -15.2
Owner-occupiers 3,500 3,500 3,800 4,000 -500 -10.8- with mortgages or loans 3,400 3,300 3,600 4,100 -100 -1.6Tenants 2,300 2,300 2,400 2,900 -1,800 -38.1- in rooms / bedspaces / cocklofts 1,700 1,400 1,400 2,100 -2,200 -50.5
Temporary housing 2,600 2,300 2,800 3,400 -1,100 -24.9V. District Council districts
Central and Western 3,500 3,600 4,100 4,100 -300 -7.5Wan Chai 3,900 4,000 4,100 4,400 -100 -3.3Eastern 3,200 3,300 3,600 3,800 -700 -14.9Southern 2,900 2,900 3,800 3,700 -500 -11.2Yau Tsim Mong 3,100 2,900 3,200 3,400 -1,000 -22.6Sham Shui Po 2,800 2,800 2,900 3,300 -1,200 -25.6Kowloon City 3,300 3,500 3,500 3,900 -800 -16.3Wong Tai Sin 2,600 2,500 2,700 2,800 -1,500 -35.7Kwun Tong 2,500 2,400 2,500 2,800 -1,800 -39.5Kwai Tsing 2,300 2,500 2,400 2,600 -1,800 -41.7Tsuen Wan 3,000 2,900 2,800 3,600 -900 -20.9Tuen Mun 2,400 2,400 2,800 2,900 -1,300 -30.7Yuen Long 2,400 2,400 2,700 2,900 -1,600 -35.2North 2,500 2,700 2,900 2,900 -1,700 -36.8Tai Po 3,000 2,800 3,300 3,500 -1,300 -27.3Sha Tin 2,700 2,700 3,000 3,300 -1,100 -25.5Sai Kung 2,900 2,900 3,200 3,300 -800 -20.1Islands 2,700 2,400 2,900 3,500 -800 -18.5
HK$ 2012After policy intervention(recurrent cash + in-kind)

Hong Kong Poverty Situation Report 2012 Glossary
P. 160
Glossary
Glossary Definition Domestic households A domestic household consists of a group of persons
who live together and make common provision for essentials for living. These persons need not be related. If a person makes provision for essentials for living without sharing with other persons, he/she is also regarded as a household. In this case, it is a 1-person household.
CSSA households Refer to domestic households receiving Comprehensive Social Security Assistance.
Elderly households Refer to domestic households with all members aged 65 and above.
Single-parent households
Refer to domestic households with at least one never married, widowed, divorced or separated member living with children aged below 18.
New-arrival households
Refer to domestic households with at least one member from the Mainland having resided in Hong Kong for less than seven years.
Households with children
Refer to domestic households with at least one member aged below 18.
Youth households Refer to domestic households with all members aged 18-29.
Economically active households
Refer to domestic households with at least one member being economically active, excluding foreign domestic helpers.
Economically inactive households
Refer to domestic households with all members being economically inactive.
Unemployed households
Refer to domestic households with all economically active members being unemployed.
Working households Refer to domestic households with at least one employed member, excluding foreign domestic helpers.
Hong Kong Poverty Situation Report 2012 Glossary
P. 161
Glossary Definition Households in private housing
Refer to domestic households residing in private permanent housing.
Households in public rental housing
Refer to domestic households residing in public rental housing.
Households in subsidised sale flats
Refer to domestic households residing in subsidised home ownership housing.
Households in temporary housing
Refer to domestic households residing in temporary housing.
Demographic dependency ratio
Refers to the number of persons aged below 15 (child dependency ratio) and aged 65 and above (elderly dependency ratio) per 1 000 persons aged between 15 and 64.
Economic dependency ratio
Refers to the number of economically inactive person(s) per 1 000 economically active persons.
Economic activity status Domestic households/population can be classified into two main groups: economically active and economically inactive.
Household income The total income earned by all member(s) of the household in the month before enumeration. Household income in the Report can be divided into four types according to the coverage of policy intervention:
(i) Pre-intervention; (ii) Post-intervention (recurrent cash); (iii) Post-intervention (recurrent cash + non-recurrent
cash); and (iv) Post-intervention (recurrent cash + in-kind).
Pre-intervention This income type only includes household members’ employment earnings, investment income and non-social-transfer cash income. In other words, the income is pre-tax income with all cash benefits excluded.
Post-intervention (recurrent cash)
It refers to the household income after tax, including recurrent cash benefits received.
Hong Kong Poverty Situation Report 2012 Glossary
P. 162
Glossary Definition Post-intervention (recurrent + non-recurrent cash)
It refers to the household income after tax, including both recurrent and non-recurrent cash benefits (including one-off measures) received.
Post-intervention (recurrent cash + in-kind)
It refers to the household income after tax, including recurrent cash benefits and in-kind benefits monetised as part of income received.
Policy intervention measures
Under the discussion of CoP, policy intervention measures can broadly be classified into 4 types:
(i) Taxation; (ii) Recurrent-cash benefits; (iii) Non-recurrent cash benefits; and (iv) In-kind benefits.
Taxation Taxation includes salaries tax, property tax, rates, and government rents.
Recurrent cash benefits Refer to cash-based benefits / cash-equivalent supplements recurrently provided by the Government, such as social security benefits and education allowance in cash.
Non-recurrent cash benefits
Refer to the Government’s non-recurrent cash benefits, including one-off measures. Cash measures provided by the Community Care Fund also included.
In-kind benefits Refer to in-kind benefits provided with means tests. The provision of public rental housing by the Government is a typical example.
Persons Only those residing in domestic households (excluding foreign domestic helpers) are counted as persons in this Report.
Economically active persons
The economically active persons, synonymous with the labour force, comprise the employed persons and the unemployed persons.
Economically inactive persons
The economically inactive persons refer to those persons who have not had a job and have not been at work during the seven days before enumeration, excluding persons who have been on leave/holiday during the 7-day period and persons who are unemployed. Persons
Hong Kong Poverty Situation Report 2012 Glossary
P. 163
Glossary Definition such as home-makers, retired persons and all those below the age of 15 are thus included.
Employed persons For a person aged 15 or over to be classified as employed, that person should:
(i) be engaged in performing work for pay or profit during the seven days before enumeration; or
(ii) have formal job attachment (i.e. that the person has continued receipt of wage or salary; or has an assurance or an agreed date of return to job or business; or is in receipt of compensation without obligation to accept another job).
Full-time workers Full-time workers are employed persons who work 35 hours and over during the seven days before enumeration, or those who work less than 35 hours due to leave during the 7-day period.
Part-time workers Part-time workers are employed persons who work less than 35 hours during the seven days before enumeration, excluding those who work less than 35 hours due to leave during the 7-day period and those underemployed.
Underemployed persons
The criteria for an employed person to be classified as underemployed are: involuntarily working less than 35 hours during the seven days before enumeration; and either
(i) has been available for additional work during the seven days before enumeration; or
(ii) has sought additional work during the 30 days before enumeration.
Working short hours is considered involuntary if it is due to slack work, material shortage, mechanical breakdown or inability to find a full-time job. Following this definition, employed persons taking no-pay leave due to slack work during the seven days before enumeration are also classified as underemployed if they worked less than 35 hours or were on leave even for the whole period during the 7-day period.
Unemployed persons For a person aged 15 or over to be classified as

Hong Kong Poverty Situation Report 2012 Glossary
P. 164
Glossary Definition unemployed, that person should:
(i) not have had a job and should not have performed any work for pay or profit during the seven days before enumeration; and
(ii) have been available for work during the seven days before enumeration; and
(iii) have sought work during the 30 days before enumeration.
However, if a person aged 15 or over fulfils the conditions (i) and (ii) above but has not sought work during the 30 days before enumeration because he/she believes that work is not available, he/she is still classified as unemployed, being regarded as a so-called “discouraged worker”. Notwithstanding the above, the following types of persons are also classified as unemployed: (i) persons without a job, have sought work but have
not been available for work because of temporary sickness; and
(ii) persons without a job, have been available for work but have not sought work because they:
have made arrangements to take up a new job or to start business on a subsequent date; or
are expecting to return to their original jobs (e.g. casual workers are usually called back to work when service is need).
Unemployment rate Unemployment rate refers to the proportion of unemployed persons in the labour force.
Median For an ordered data set which is arranged in ascending order (i.e. from the smallest value to the largest value), the median is the value that ranks in the middle of all data in the set. If the total number of data is an even number, the median is the average of the two middle values of the ordered data set.
Percentiles Percentiles are the 99 values that divide an ordered data set into 100 equal parts (in terms of number of observations). In brief, the pth percentile is the value which delineates the lowest p% of all the data, where p
Hong Kong Poverty Situation Report 2012 Glossary
P. 165
Glossary Definition can be any integer value from 1 to 99.
Poverty indicators Quantitative measurements of poverty.
Poverty incidence Refer to the number of poor households and its corresponding number of persons living therein (i.e. poor population), with monthly household income less than the poverty line corresponding to the household size.
Poverty rate Poverty rate is the ratio of poor population to total population living in domestic households.
Poverty gap Poverty gap of a poor household refers to the amount of difference between its household income and the poverty threshold. Total poverty gap is the sum of such differences of all poor households. Divided by the number of poor households yields the average poverty gap.
Poverty line Poverty line is set to define poor households and poor population. In this Report, 50% of median monthly household income before policy intervention by household size is adopted as the poverty line.

Hong Kong Poverty Situation Report 2012 Abbreviations
P. 166
Abbreviations
CoP Commission on Poverty
CCF
C&SD
Community Care Fund
Census and Statistics Department
CE Chief Executive of the Hong Kong Special Administrative Region
CSSA Comprehensive Social Security Assistance
DA Disability Allowance
EU (The) The European Union
FDH Foreign Domestic Helper
GDP Gross Domestic Product
GHS General Household Survey
HES Household Expenditure Survey
HKSAR (The) The Hong Kong Special Administrative Region
HKCSS Hong Kong Council of Social Service
LegCo Legislative Council
LFPR Labour force participation rate
NGOs Non-governmental organisations
OAA / OALA Old Age Allowance / Old Age Living Allowance
OECD Organisation for Economic Co-operation and Development
Oxfam Oxfam Hong Kong
PRH Public rental housing
R&VD Rating and Valuation Department
SMW Statutory minimum wage
SWD Social Welfare Department
The Subcommittee Subcommittee on Poverty under the House Committee of the Legislative Council
The Task Force Social Security and Retirement Protection Task Force
WITS Work Incentive Transport Subsidy
Hong Kong Poverty Situation Report 2012 References
P. 167
References
1. Adamson, P. (2012). Measuring child poverty: New league tables of child poverty in the world's rich countries (Innocenti Report Card 10). Florence, Italy: UNICEF Innocenti Research Centre. Retrieved from http://www.unicef-irc.org/publications/pdf/rc10_eng.pdf
2. Bellù, L. G., & Liberati, P. (2005). Impacts of policies on poverty. Absolute poverty lines. Food and Agriculture Organization of the United Nations, FAO. Retrieved from
http://www.fao.org/docs/up/easypol/316/abslt_pov_lines_005en.pdf 3. Blackwood, D. L., & Lynch, R. G. (1994). The measurement of
inequality and poverty: A policy-maker’s guide to the literature. World Development, 22(4), 567-578.
4. Buhmann, B., Rainwater, L., Schmaus, G., & Smeeding, T. M. (1988). Equivalence scales, well-being, inequality, and poverty: Sensitivity estimates across ten countries using the Luxembourg Income Study (LIS) database. Review of Income and Wealth, 34(2), 115-142.
5. Danziger, S., van der Gaag, J., Taussig, M. K., & Smolensky, E. (1984). The direct measurement of welfare levels: How much does it cost to make ends meet? Review of Economics and Statistics, 66(3), 500-505.
6. Duclos, J. Y., & Araar, A. (2005). Poverty and equity: measurement, policy and estimation with DAD. New York: Springer. Retrieved from http://web.idrc.ca/en/ev-97152-201-1-DO_TOPIC.html
7. Eurostat. (2013, February 8). Glossary: At-risk-of-poverty rate - Statistics Explained. Retrieved from http://epp.eurostat.ec.europa.eu/statistics_explained/index.php/Glossary:At-risk-of-poverty_rate#
8. Eurostat. (n.d.). Income and living conditions. Reference Metadata in Euro SDMX Metadata Structure (ESMS). Retrieved from http://epp.eurostat.ec.europa.eu/cache/ITY_SDDS/en/ilc_esms.htm
9. Fisher, F. M. (1992). The development and history of the poverty thresholds. Social Security Bulletin, 55(4), 3-14. Retrieved from http://www.census.gov/hhes/povmeas/publications/orshansky.html#C1
10. Förster, M., & d’Ercole, M. M. (2009). The OECD approach to measuring income distribution and poverty: Strengths, limits and statistical issues. Paper presented at the Joint Organisation for Economic Co-operation and Development (OECD) / University of Maryland International Conference on measuring poverty, income inequality, and social exclusion: Lessons from Europe. Retrieved from http://umdcipe.org/conferences/oecdumd/conf_papers/Papers/The%2520OECD%2520Approach%2520to%2520Measuring%2520Income%2520D

Hong Kong Poverty Situation Report 2012 References
P. 168
istribution%2520and%2520Poverty.pdf 11. Garner, T., & Short, K. (2003). Personal assessments of minimum income
and expenses: What do they tell us about ‘minimum living’ thresholds and equivalence scales? (BLS Working Papers 379). Retrieved from http://www.bls.gov/ore/pdf/ec050050.pdf
12. Haughton, J., & Khandker, S. R. (2009). Handbook on poverty and inequality. Washington, DC: The World Bank. Retrieved from http://web.worldbank.org/WBSITE/EXTERNAL/TOPICS/EXTPOVERTY/EXTPA/0,,contentMDK:22405907~pagePK:148956~piPK:216618~theSitePK:430367,00.html
13. Kamanou, G., Morduch, J., Isidero, D. P., Gibson, J., Ivo, H., & Ward, M. (2005). Handbook on poverty statistics: Concepts, methods and policy use. The United Nations Statistics Division. Retrieved from http://unstats.un.org/unsd/methods/poverty/pdf/UN_Book%20FINAL%2030%20Dec%2005.pdf
14. Organisation for Economic Co-operation and Development. (2008). Growing unequal? Income distribution and poverty in OECD countries.
15. Organisation for Economic Co-operation and Development. (n.d.). What are equivalence scales? Retrieved from http://www.oecd.org/eco/growth/OECD-Note-EquivalenceScales.pdf
16. Orshansky, M. (1965). Counting the poor: Another look at the poverty profile. Social Security Bulletin, 28(1), 3-29.
17. Perry, B. (2012). Household incomes in New Zealand: Trends in indicators of inequality and hardship 1982 to 2012. Wellington: Ministry of Social Development. Retrieved from http://www.msd.govt.nz/documents/about-msd-and-our-work/publications-resources/monitoring/household-income-report/main-report-2013-4.doc
18. Pittini, A., & Laino, E. (2011). Housing Europe review 2012: The nuts and bolts of European social housing systems. Bruselas: CECODHAS Housing Europe’s Observatory. Retrieved from http://www.housingeurope.eu/www.housingeurope.eu/uploads/file_/HER%202012%20EN%20web2_1.pdf
19. Planning Commission, Government of India. (1993). Report of the expert group on estimation of proportion and number of poor. Retrieved from http://planningcommission.nic.in/reports/publications/pub93_nopoors.pdf
20. Planning Commission, Government of India. (2007, March). Poverty estimates for 2004-05. Retrieved from http://planningcommission.nic.in/news/prmar07.pdf

Hong Kong Poverty Situation Report 2012 References
P. 169
21. Planning Commission, Government of India. (2012, March 20). Supplementary press note on poverty estimates. Retrieved from http://planningcommission.nic.in/news/press_elepov2103.pdf
22. Planning Commission, Government of India. (2012, May 24). Government announces new expert panel on poverty estimates. Retrieved from http://planningcommission.nic.in/news/press_pov2505.pdf
23. Pradhan, M., & Ravallion, M. (2000). Measuring poverty using qualitative perceptions of consumption adequacy. Review of Economics and Statistics, 82(3), 462-471.
24. Ravallion, M. (1992). Poverty comparisons: A guide to concepts and methods, living standards measurement study (World Bank Working Paper No. 88). Washington, DC: World Bank. Retrieved from http://siteresources.worldbank.org/PGLP/Resources/Ravallion1992PovertyComparisons.pdf
25. Ravallion, M., Chen, S., & Sangraula, P. (2009). Dollar a day revisited. World Bank Economic Review, 23(2), 163-184. Retrieved from https://openknowledge.worldbank.org/bitstream/handle/10986/4499/wber_23_2_163.pdf
26. Rio Group. (2006). Compendium of best practices in poverty measurement. Rio de Janeiro. Retrieved from http://www.eclac.org/publicaciones/xml/3/26593/rio_group_compendium.pdf
27. Sen, A. (1976). Poverty: An ordinal approach to measurement. Econometrica, 44(2), 219-231.
28. Sen, A. (1983). Poor, relatively speaking. Oxford Economic Papers, 35(2), 153-169.
29. Statistics Canada. (2012). Low income lines, 2010 to 2011 (Income Research Paper Series). Retrieved from http://www.statcan.gc.ca/pub/75f0002m/75f0002m2013002-eng.pdf
30. The Philippines, National Statistical Coordination Board. (2003, July). Notes on the official poverty statistics in the Philippines. Retrieved from http://www.nscb.gov.ph/technotes/poverty/compilation.asp
31. United Kingdom, HM Government. (2010). State of the nation report: Poverty, worklessness and welfare dependency in the UK. London: Cabinet Office. Retrieved from http://webarchive.nationalarchives.gov.uk/+/http://www.cabinetoffice.gov.uk/media/410872/web-poverty-report.pdf
32. United States Census Bureau. (2010, December). The development of the Orshansky poverty thresholds and their subsequent history as the official
Hong Kong Poverty Situation Report 2012 References
P. 170
U.S. poverty measure. Retrieved from http://www.census.gov/hhes/povmeas/publications/orshansky.html
33. van Praag, B. M. S., Hagenaars, A. J. M., & van Weeren, H. (1982). Poverty in Europe. Review of Income and Wealth, 28(3), 345-359.
34. World Bank. (2005). Introduction to poverty analysis. Retrieved from http://siteresources.worldbank.org/PGLP/Resources/PovertyManual.pdf.
35. World Bank. (2011). Choosing and estimating a poverty line. Retrieved from http://web.worldbank.org/WBSITE/EXTERNAL/TOPICS/EXTPOVERTY/EXTPA/0,,contentMDK:20242879~menuPK:435055~pagePK:148956~piPK:216618~theSitePK:430367,00.html
36. World Bank. (n.d.). Poverty. Retrieved from http://data.worldbank.org/topic/poverty
37. 2012 2 11
http://www.budget.gov.hk/2012/chi/pdf/c_budgetspeech2012-13.pdf 38. 2013 1 16
http://www.policyaddress.gov.hk/2013/chi/pdf/PA2013.pdf 39. 2012 3
http://www.ceo.gov.hk/chi/pdf/manifesto.pdf 40. 2011 12 2
2300 http://www.gov.cn/jrzg/2011-12/02/content_2009471.htm
41. 2013 5 8 CB(2)1090/12-13(01)
http://www.legco.gov.hk/yr12-13/chinese/hc/sub_com/hs51/papers/hs510508cb2-1090-1-c.pdf
42. 2009 11 9CB(2)179/09-10(07)
http://www.legco.gov.hk/yr09-10/chinese/panels/ws/papers/ws1109cb2-179-7-c.pdf
43. 2012 2011
http://www.census2011.gov.hk/pdf/household-income.pdf
44. 2300 2011 11 30http://www.gov.cn/fwxx/sh/2011-

Hong Kong Poverty Situation Report 2012 References
P. 171
11/30/content_2006598.htm 45. 2005 2
CB(2)915/04-05(04)
http://www.legco.gov.hk/yr04-05/chinese/hc/sub_com/hs51/papers/hs510223cb2-915-04-c.pdf
46. 2012 5http://www.oxfam.org.hk/content/98/content_12978tc.pdf