Embed Size (px)
Citation preview

(Draft as at 2021.11.09)
10 November 2021
Commission on Poverty
Paper No. 2/2021-22
Main Analysis of the
Poverty Situation in 2020
Office of the Government Economist
Financial Secretary’s Office
Census and Statistics
Department

I. Main poverty situation and
its trend in 2020
II. Poverty situation analysed
by socio-economic
characteristic and age group
III. Key observations & outlook
2
Main analysis of the poverty situation in 2020 - Outline
https://www.povertyrelief.gov.hk/eng/archives.html
The full Report has been uploaded to CoP’s
website
Hong Kong Poverty Situation Report
2020

3
I. Main poverty situation and its
trend in 2020
Main analytical framework of the poverty line in 2020
Major factors affecting poverty statistics
Poverty line thresholds
Key poverty statistics
Trends of poverty statistics and poverty alleviation effectiveness
Poverty alleviation effectiveness of individual selected measures

Main analytical framework of the poverty line in 20204
1. Relative poverty line
50% of median household income
before policy intervention
2. Policy intervention
3. Poverty statistics
Compare the data before and after
policy intervention:
Poverty indicators:
No. of poor households and the
size of the poor population
Poverty rate
Poverty gap Quantify the impact of policy
intervention in poverty alleviation(can be classified by different household or
individual characteristics)
Post-intervention household income
takes into account all selected
measures, which include three types
of policy intervention measures:
II. Non-recurrent cash measures(including one-off measures, such as extra social security payment, cash
payout of $10,000)
III. Means-tested in-kind benefits(mainly public rental housing)
I
III
II
Pre-intervention (purely theoretical
assumption) household income
Post-intervention (all selected
measures) household income
I. Recurrent cash measures(deducting taxes and including recurrent
cash measures like Comprehensive Social Security Assistance)

5.8 6.5
9.8
10.6
4.8 5.3
10.4 10.6
1
2
3
4
5
6
7
8
9
10
11
12
13
全年
全年
全年
全年
全年
全年
全年
全年
全年
全年
全年
全年
全年 Q1
Q2
Q3
Q4
08 09 10 11 12 13 14 15 16 17 18 19 20 2020
0
Construction
Annual Q1 Q2 Q3 Q4
Overall *
Retail, accommodation andfood services
Import/export and wholesale trade
Percent (%)
(a) Unemployment rate by industry
Overall unemployment rates for quarterly are seasonally adjusted.General Household Survey, Census and Statistics Department.
Note: (*)Source:
-15.6 -7.0
-55.6
-60.9 -51.8 -67.1 -64.0 -62.6
18.5
-6.9
-21.8
-91.9-94.1
-113.4-88.2
-58.3
13.79.5
-14.0
-27.5-23.1
-31.9
-36.4
-17.5
19.548.2 74.3
-8.0
51.1
-9.1-40.6
-56.0
36.143.8
-17.1
-188.3
-117.9
-221.4-229.1
-194.4
-300
-250
-200
-150
-100
-50
0
50
100
Q1 Q2 Q3 Q4
2017 2018 2019 2020 2020
Overall
(b) Employment by industry
Year-on-year change ('000)
Q1 Q2 Q3 Q4Annual Annual Annual Annual
Other sectorsConstructionRetail, accommodation and food servicesImport/export and wholesale trade
5
Major factors affecting poverty statistics in 20201. Macroeconomic situation: being affected by the global COVID-19 pandemic, the Hong Kong
economy experienced a severe recession in 2020, with the labour market deteriorated sharply. The
unemployment rate surged to 6.5% in the fourth quarter of 2020, the highest in 16 years. The annual
unemployment rate averaged at 5.8%, also substantially higher than that of 2.9% in 2019. Total
employment shrank significantly by 0.188 million (or 4.9%) in 2020 over 2019, the largest annual decline
on record. Specifically, the consumption- and tourism-related sectors saw a surge in unemployment rate
and a sharp decrease in employment under the severe disruption brought by the pandemic.
Quarterly overall unemployment rates are seasonally adjusted.
General Households Survey, Census and Statistics Department.
Note: (*)
Source:
46.826.6 13.2
-47.4
24.8
-42.7-70.4
-104.2
-10.7
17.1
-30.3
-141.0
-142.7
-178.7
-158.7 -90.2
36.1 43.8
-17.1
-188.3
-117.9
-221.4-229.1
-194.4
-300
-250
-200
-150
-100
-50
0
50
100
Q1 Q2 Q3 Q4
2017 2018 2019 2020 2020
Higher-skilled
Lower-skilled
Overall
(d) Employment by occupation
Year-on-year change ('000)
Q1 Q2 Q3 Q4Annual Annual Annual Annual
5.8 6.5
3.6
4.2
6.6 6.9
0
1
2
3
4
5
6
7
8
全年
全年
全年
全年
全年
全年
全年
全年
全年
全年
全年
全年
全年 Q1
Q2
Q3
Q4
08 09 10 11 12 13 14 15 16 17 18 19 20 2020
Overall*
Higher-skilled
Lower-skilled
Q1 Q2 Q3 Q4
(c) Unemployment rate by occupation
Percent (%)
Annual
Overall unemployment rates for quarterly are seasonally adjusted.General Household Survey, Census and Statistics Department.
Note: (*)Source:
6
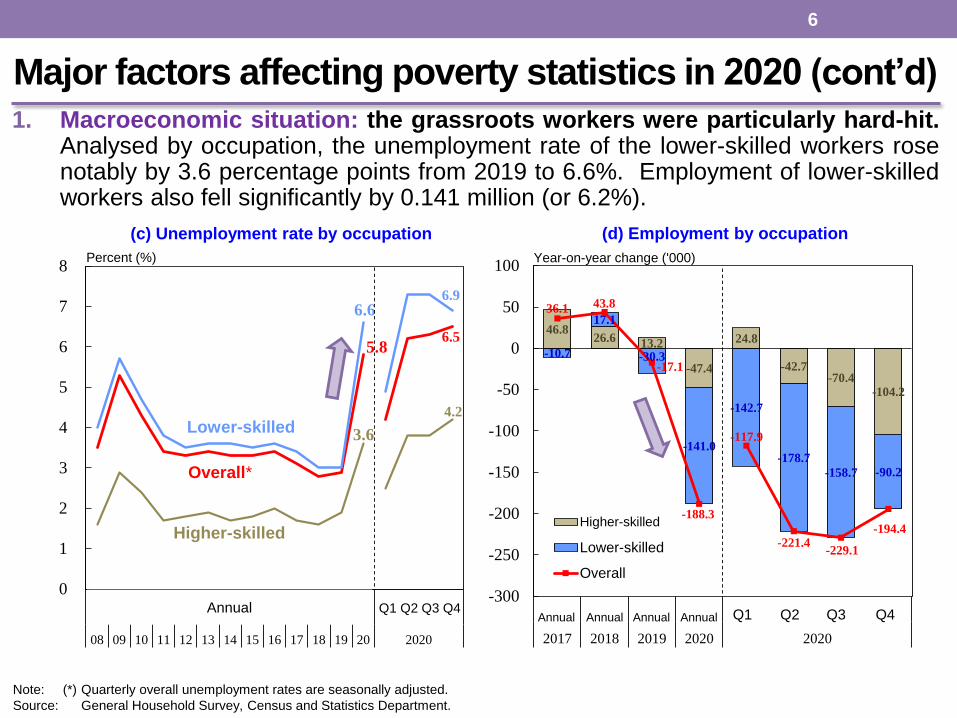
Major factors affecting poverty statistics in 2020 (cont’d)1. Macroeconomic situation: the grassroots workers were particularly hard-hit.
Analysed by occupation, the unemployment rate of the lower-skilled workers rosenotably by 3.6 percentage points from 2019 to 6.6%. Employment of lower-skilledworkers also fell significantly by 0.141 million (or 6.2%).
Quarterly overall unemployment rates are seasonally adjusted.
General Household Survey, Census and Statistics Department.
Note: (*)
Source:

-5.6
-8.1
0.3
-10
-8
-6
-4
-2
0
2
4
6
8
10
08 09 10 11 12 13 14 15 16 17 18 19 20
Median household income of overallhouseholds
Median household income of households inthe lowest three decile groups
Composite consumer price index
Grassroots' household income
Overall household income
(f) Household income
Headline inflation
Year-on-year rate of change (%)
1.3
3.5
0.3
-2
0
2
4
6
8
10
12
08 09 10 11 12 13 14 15 16 17 18 19 20
Overall wages
Average employment earnings of full-timeemployees in the lowest three decile groupsComposite consumer price index
(e) Nominal wages and average employment earnings
Grassroots'employmentearnings
Headline inflation
Year-on-year rate of change (%)
Overall wages
Note: Excluding foreign domestic helpers.Sources: General Household Survey, Monthly Report on the Consumer Price Index, and Labour Earnings Survey,
Census and Statistics Department.
1. Macroeconomic situation: amid the austere economic and labour marketsituations, overall wages registered decelerated growth. In addition, manyfamilies experienced reductions in number of working members and workinghours, which visibly weighed on household income. For 2020 as a whole, themedian monthly household income plunged by 5.6% from a year earlier, and that ofthe grassroots households even fell by 8.1%.
7
Income figures exclude foreign domestic helpers.
General Household Survey, Monthly Report on the Consumer Price Index, and Labour Earnings Survey, Census and Statistics Department.
Major factors affecting poverty statistics in 2020 (cont’d)
Note:
Sources:

2. Structural factors: the structural trends of population ageing and dwindlinghousehold size continued, with rising numbers of singleton and doubletonhouseholds made up of retired elders with no employment income. This will exertcontinuous upward pressures on poverty statistics estimated based on householdincome.
8
Major factors affecting poverty statistics in 2020 (cont’d)
1116 1090 1066 1048 1017 1002 1011 1000 1011 1012 1019 1019
4600 4651 4700 4736 4739 4749 4746 4728 4713 4709 4710 4688
817 836 858 892 931 974 1021 1067 1116 1164 1222 1297
12.5 12.7 13.0 13.4
13.9 14.5
15.1 15.7
16.3 16.9
17.6 18.5
-4
-2
0
2
4
6
8
10
12
14
16
18
20
09 10 11 12 13 14 15 16 17 18 19 20
0
1 000
2 000
3 000
4 000
5 000
6 000
7 000
8 000
9 000
10 000Elderly population (LHS)Population aged 18 to 64 (LHS)Child population (LHS)Proportion of elders in total population (RHS)
132 139 143 146 158 167 180 192 197 209 209 211
83 89 91 97
104 110
118 125 129
138 151 155
2.85 2.83
2.81 2.80 2.78
2.77 2.75
2.72 2.70
2.68 2.66 2.65
0
100
200
300
400
500
600
09 10 11 12 13 14 15 16 17 18 19 20
2.00
2.10
2.20
2.30
2.40
2.50
2.60
2.70
2.80
2.90
3.00
Doubleton elderly households (RHS)
Singleton elderly households (RHS)
Average number of persons
0 0
Number of households ('000)
Average household size (LHS)
Percent (%)Population ('000)
(a) Population figures by age group
Note: Population figures refer to persons in domestic households, excluding foreign domestic helpers and the institutional population.
Source: General Household Survey, Census and Statistics Department.
(b) Average household size of overall households, number of singleton and doubleton elderly households

(40%) (40%) (27%) (31%) (39%) (42%) (37%) (39%) (41%) (37%) (37%) (27%)(25%) (23%)
(45%) (40%) (28%) (21%)(27%) (25%)
(24%)(31%)
(34%)
(53%)
(35%) (37%)
(28%) (29%)(33%) (37%)
(36%) (36%)(34%)
(32%)
(29%)
(20%)
2,100 2,200
3,200 3,100 2,900 2,900
3,300 3,300 3,500
4,100
4,500
6,600
0
1,000
2,000
3,000
4,000
5,000
6,000
7,000
2009 2010 2011 2012 2013 2014 2015 2016 2017 2018 2019 2020
-2.5 6.8 4.81.7 3.1 2.8 2.4 2.2 3.8 2.8
-1.7
-6.1-10-8-6-4-202468
10Annual change in real GDPPercent (%)
Note: ( ) Figures in parentheses denote the proportion of the relevant amount among selected policy intervention measures.Sources: General Household Survey and Quarterly Report on Gross Domestic Product, Census and Statistics Department.
“Scheme $6,000”
Additional two months of allowance of social security payments; one-off special subsidy for “School Textbook Assistance Scheme”
Caring and Sharing Scheme; additional two months of allowance of social security payments, WFA and WITS
All selected measuresNon-recurrent cash
Recurrent cash
In-kind benefits
($, per month)Cash Payout Scheme;Selected AEF measures
3. Government’s policies in poverty alleviation: the amount dedicated to relevant policy intervention
measures reached a record high – besides long-term commitments from recurrent cash policies, the
Government launched a series of one-off counter-cyclical measures in 2020 that were unprecedented
in scale and coverage. While these measures aimed to stabilise the macroeconomic and
employment conditions, they would also relieve the pressures on the grassroots’ livelihood.
9
Major factors affecting poverty statistics in 2020 (cont’d)
Benefitted from the
$10,000 Cash Payout
Scheme and relevant
measures under
Anti-epidemic Fund
(AEF), the estimated
average amount of
transfer per
household went up
appreciably in 2020
Estimated average welfare transfer of all selected measures per household, 2009-2020

• The poverty lines of 1-person households to 4-person households and 6-person-and-abovehouseholds: decreased ranging from 1.8% to 5.0%.
• The poverty line of 5-person households declined notably by 9.5%: mainly attributable to thedrastic fall in the proportion of working households and a significant decrease in the proportion ofhouseholds with two employed members and above among working households.
10
Poverty line thresholds in 2020: recorded declines of varying degrees
Poverty lines by household size, 2009-2020
3,300 3,300 3,400 3,600 3,500 3,500 3,800 4,000 4,000 4,000 4,500 4,400
6,900 7,000 7,500 7,700
8,300 8,500 8,800 9,000 9,800 10,000 10,000
9,500 9,900 10,000
10,500 11,500
12,500 13,000 14,000
15,000 15,000
16,500 16,600 16,000
11,300 11,800
13,000
14,300
15,400 16,400
17,600 18,500
19,900
21,000 21,400
20,800
11,900 12,300
13,500
14,800
16,000
17,000
18,200 19,000
20,300
21,500
22,100
20,000
13,000 13,500
14,500
15,800
17,100
18,800 19,500
20,000
22,500 21,800 23,000
21,900
0
2,000
4,000
6,000
8,000
10,000
12,000
14,000
16,000
18,000
20,000
22,000
24,000
26,000
2009 2010 2011 2012 2013 2014 2015 2016 2017 2018 2019 2020
1-person 2-person 3-person 4-person 5-person 6-person+
($, per month)
Source: General Household Survey, Census and Statistics Department.

Figures in parentheses refer to figures in 2019.
Recurrent cash measures include CSSA/SSA, WFA, etc.; non-recurrent cash measures include tax reduction and rates concessions, Cash
Payout Scheme, various benefits under AEF and other relief measures rolled out in light of the pandemic that can be included in the imputation,
offering additional payments of social security allowance, etc.; means-tested in-kind benefits include PRH, Kindergarten and Child Care Centre
Fee Remission Scheme, etc.
General Household Survey, Census and Statistics Department.
Pre-intervention (purely theoretical assumption)0.703 mn
(0.649 mn)
1.653 mn
(1.491 mn)
23.6%
(21.4%)
• In 2020, the size of the poor population and the poverty rate taking into account all selected measures
(recurrent cash + non-recurrent cash + in-kind benefits) were 0.554 million and 7.9% respectively (fell by
0.088 million and 1.3 percentage points over 2019).
All selected measures alleviated about 1.10 million persons out of poverty, reducing the poverty rate by
15.7 percentage points
(strengthened visibly by 3.5 percentage points from 12.2 percentage points in 2019)
Household income Poor households Poor population Poverty rate
Post-intervention (all selected measures)0.242 mn
(0.287 mn)
0.554 mn
(0.642 mn)
7.9%
(9.2%)
Poverty alleviation impact-0.461 mn
(-0.361 mn)
-1.099 mn
(-0.849 mn)
-15.7%pts
(-12.2%pts)
11
In response to the severe economic recession of Hong Kong in 2020 due to the blow of COVID-19
pandemic, the Government rolled out a large scale of one-off counter-cyclical measures. The poverty
indicators hence improved after policy intervention (all selected measures). But the pre-intervention
poverty situation of last year wouldstill deteriorate noticeably
Notes: ( )
Source:

1 348 1 322 1 295 1 312 1 336 1 325 1 345 1 352 1 3771 406
1 4911 653
644616
472524
564 593 586657 671
638 642554(9.9%)
(9.4%)
(7.1%)(7.8%) (8.4%) (8.8%) (8.6%)
(9.7%) (9.8%)(9.3%) (9.2%)
(7.9%)
(20.6%)(20.1%)(19.6%)(19.6%)(19.9%)(19.6%) (19.7%)(19.9%)(20.1%)(20.4%)
(21.4%)
(23.6%)
200
400
600
800
1 000
1 200
1 400
1 600
1 800
2009 2010 2011 2012 2013 2014 2015 2016 2017 2018 2019 2020
Pre-intervention(purely theoretical
assumption)
Poor population ('000)
Post-intervention(all selected measures)
Figures in parentheses denote the corresponding poverty rates.General Household Survey, Census and Statistics Department.
Note: ( )Source:
Poor households ('000) 2009 2010 2011 2012 2013 2014 2015 2016 2017 2018 2019 2020
Pre-intervention (purely theoretical assumption) 541 536 530 541 555 555 570 582 594 613 649 703
Post-intervention
(all selected measures)253 246 194 216 233 250 250 284 287 276 287 242
12
Poor population and poverty rate, 2009-2020
Taking into account the impact of policy intervention of all selected measures: in
2020, the poverty rate fell by 1.3 percentage points to 7.9% over 2019, and the size
of the poor population decreased by 0.088 million to 0.554 million

The poverty alleviation impact of all selected measures was 15.7 percentage
points in 2020, strengthened substantially from 12.2 percentage points in the
preceding year
13
Poverty alleviation effectiveness of all selected measures, 2009-2020
704 706
823 789 772 731 759696 705
768849
1 099
10.7 10.712.5 11.8 11.5 10.8 11.1 10.2 10.3
11.112.2
15.7
-20
-15
-10
-5
0
5
10
15
20
25
0
500
1000
1500
2000
2009 2010 2011 2012 2013 2014 2015 2016 2017 2018 2019 2020
Scheme $6,000Caring and
Sharing Scheme
$10,000 Cash Payout Scheme
Reduction in
Poor population (LHS)
Poverty rate (RHS)
Reduction in
poor households ('000)2009 2010 2011 2012 2013 2014 2015 2016 2017 2018 2019 2020
All selected measures 288 289 337 324 321 306 320 298 307 337 361 461
Recurrent cash 135 130 131 138 170 173 177 170 174 178 175 188
Additional two months of allowance
Source: General Household Survey, Census and Statistics Department.
Reduction in poorpopulation ('000)
Reduction in poverty rate(Percentage point(s))
2 000
1 500
1 000
500

198 204182 185
4780
55 53 35 31 20 2655
267
580
937
155 184154
165
4670
48 5332 2916 23
393
442
261 266
849
1 099
2.82.9
2.6 2.7
0.61.1
0.7 0.80.5 0.40.2 0.40.7
3.8
8.3
13.4
2.22.6
2.2 2.4
0.61.0
0.6 0.8 0.4 0.40.2 0.3
5.6
6.3
3.7 3.8
12.2
15.7
0
2
4
6
8
10
12
14
16
18
0
100
200
300
400
500
600
700
800
900
1 000
1 100
1 200
綜援 長者
生活津貼
職津 教育津貼傷殘津貼高齡津貼 所有
現金項目
公屋 所有選定
項目
2019 2020 2019 2020 2019 2020 2019 2020
Post-intervention(recurrent cash)
Post-intervention(recurrent + non-recurrent cash)
Post-intervention(in-kind: PRH)
Post-intervention(all selected measures)Reduction in
Population ('000) (Percentage point(s))
CSSA OALA WFAEducation benefits
OAADA Cash measures^
PRH All selected measures
Poor population (LHS)Poverty rate (RHS)
Cash payout&
Figures for 2019 included Caring and Sharing Scheme. Those for 2020 included Cash Payout Scheme and “One-off Allowance for New Arrivals from Low-income Families” Programme.Apart from the major recurrent / non-recurrent cash measures listed in the chart, cash measures also included Public Transport Fare Subsidy Scheme, measures under AEF and other relief measures rolled out in light of the pandemic that can be imputed in the framework (e.g. Special allowance for eligible WFA and SFA households), cash items under CCF, etc.General Household Survey, Census and Statistics Department.
Notes: (&)
(^)
Source:
Poverty alleviation effectiveness of selected measures, 2019-2020
14
The strengthening in impact of all selected policies was mainly attributable to the non-recurrent cash
measures (such as the $10,000 cash payout and the relevant measures under AEF). As for recurrent cash
measures, CSSA and education benefits recorded more noticeable increases in their poverty alleviation
impacts. The former largely reflected the increase in the number of CSSA recipients, and the latter was
due to the effect of Student Grant

15
II. Poverty situation analysed by
socio-economic characteristic and
age group
Key poverty statistics by socio-economic characteristic and age group
Poverty trend by age group
How economic recession affected the poverty situation in 2020
Quantitative decomposition of changes in the overall poverty rate
16
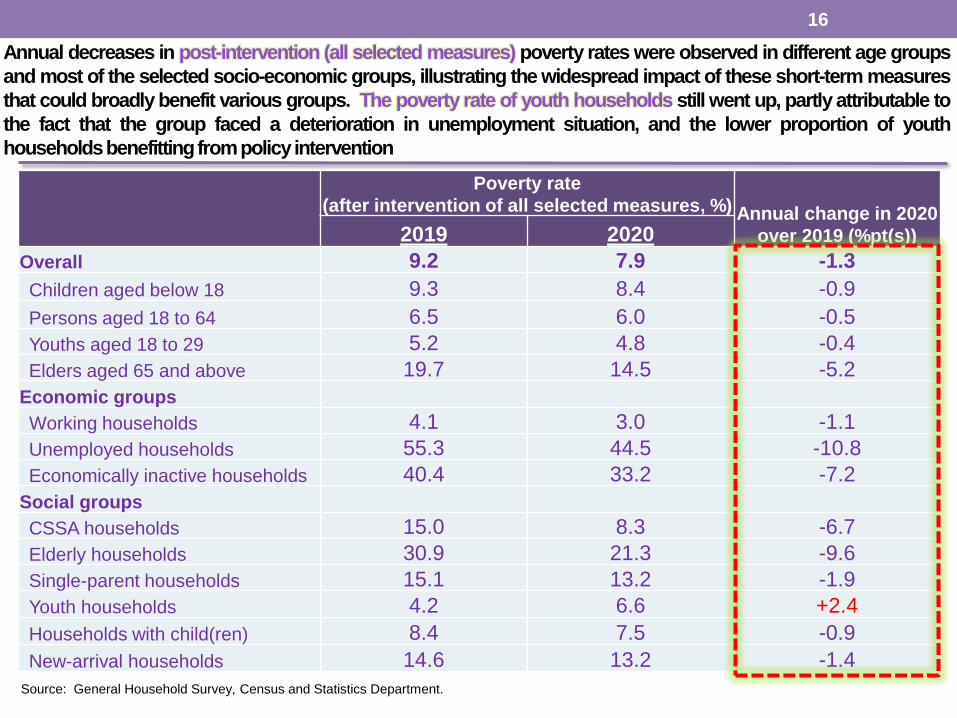
Annual decreases in post-intervention (all selected measures) poverty rates were observed in different age groups
and most of the selected socio-economic groups, illustrating the widespread impact of these short-term measures
that could broadly benefit various groups. The poverty rate of youth households still went up, partly attributable to
the fact that the group faced a deterioration in unemployment situation, and the lower proportion of youth
householdsbenefittingfrompolicy intervention
Source:
Poverty rate
(after intervention of all selected measures, %) Annual change in 2020
over 2019 (%pt(s))2019 2020
Overall 9.2 7.9 -1.3
Children aged below 18 9.3 8.4 -0.9
Persons aged 18 to 64 6.5 6.0 -0.5
Youths aged 18 to 29 5.2 4.8 -0.4
Elders aged 65 and above 19.7 14.5 -5.2
Economic groups
Working households 4.1 3.0 -1.1
Unemployed households 55.3 44.5 -10.8
Economically inactive households 40.4 33.2 -7.2
Social groups
CSSA households 15.0 8.3 -6.7
Elderly households 30.9 21.3 -9.6
Single-parent households 15.1 13.2 -1.9
Youth households 4.2 6.6 +2.4
Households with child(ren) 8.4 7.5 -0.9
New-arrival households 14.6 13.2 -1.4
General Household Survey, Census and Statistics Department.

Non-recurrent measures did help stabilise the poverty situation of children and
youths. Their poverty rates taking into account all selected measures showed
declines instead of increases, to 8.4% and 4.8% respectively
17
Poor population and poverty rate by age, 2009-2020
284265 257 254
242 236 235 229 234 235253
275
128 11891 95 97 100 98 101 113
99 95 86
25.424.3 24.1 24.2 23.7 23.5 23.2 23.0 23.1 23.3
24.927.0
11.510.98.5 9.0 9.5 10.0 9.7 10.1
11.29.8 9.3 8.4
(15)
(10)
(5)
0
5
10
15
20
25
30
0
100
200
300
400
500
600
700
09 10 11 12 13 14 15 16 17 18 19 20
red-PP purple-PPred-rate purple-rate
(a) Children aged below 18
132 133 126 129 127 123 123 122 122 122 123144
58 5437 44 48 48 47 57 55 54 49 44
12.7 12.712.1 12.3 12.2 11.9 11.9 12.2 12.4 12.6 13.1
15.6
5.6 5.23.5
4.1 4.6 4.6 4.65.6 5.6 5.6 5.2 4.8
(10)
(5)
0
5
10
15
20
0
50
100
150
200
250
300
350
400
09 10 11 12 13 14 15 16 17 18 19 20
(b) Youths aged 18 to 29
Poor population ('000) Poverty rate (%)
Pre-intervention(purely theoretical assumption)
Post-intervention(all selected measures)
Poor population (LHS)Poverty rate (RHS)
Poor population ('000) Poverty rate (%)
Source: General Household Survey, Census and Statistics Department.
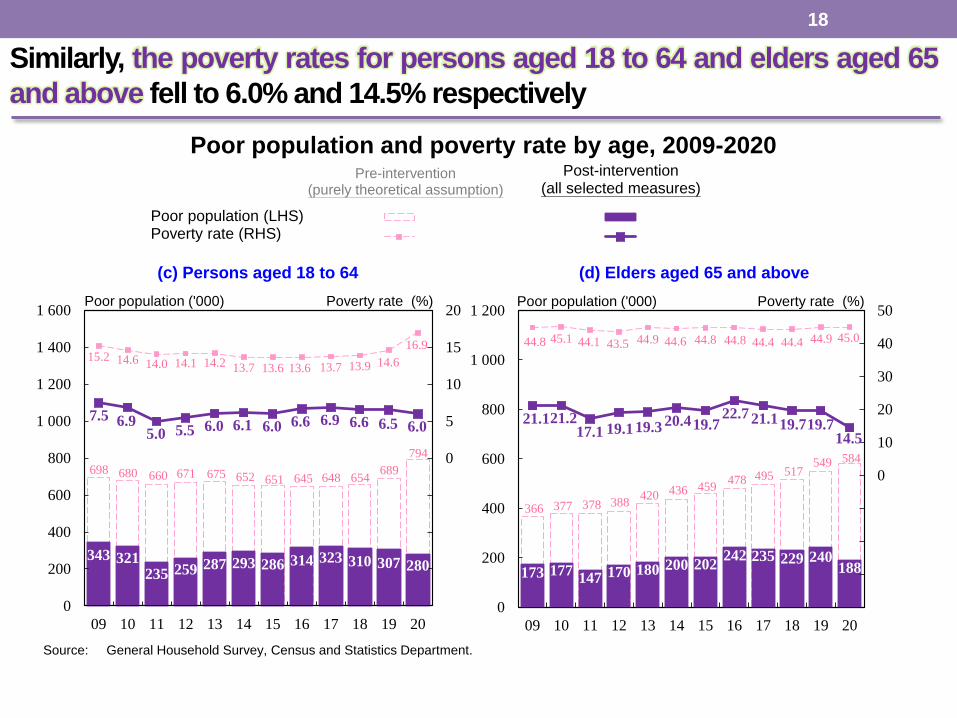
698 680 660 671 675 652 651 645 648 654689
794
343 321 235 259 287 293 286 314 323 310 307 280
15.2 14.6 14.0 14.1 14.2 13.7 13.6 13.6 13.7 13.9 14.6
16.9
7.5 6.9 5.0 5.5 6.0 6.1 6.0 6.6 6.9 6.6 6.5 6.0
(20)
(15)
(10)
(5)
0
5
10
15
20
0
200
400
600
800
1 000
1 200
1 400
1 600
09 10 11 12 13 14 15 16 17 18 19 20
red-PP purple-PPred-rate purple-rate
366 377 378 388420 436 459
478 495 517549 584
173 177147 170 180 200 202
242 235 229 240188
44.8 45.1 44.1 43.5 44.9 44.6 44.8 44.8 44.4 44.4 44.9 45.0
21.121.217.1 19.119.3 20.419.7
22.7 21.119.719.714.5
(40)
(30)
(20)
(10)
0
10
20
30
40
50
0
200
400
600
800
1 000
1 200
09 10 11 12 13 14 15 16 17 18 19 20
(d) Elders aged 65 and above
Poverty rate (%)Poor population ('000)
(c) Persons aged 18 to 64
Pre-intervention(purely theoretical assumption)
Post-intervention(all selected measures)
Poor population (LHS)Poverty rate (RHS)
Poor population ('000) Poverty rate (%)
Source: General Household Survey, Census and Statistics Department.
18
Similarly, the poverty rates for persons aged 18 to 64 and elders aged 65
and above fell to 6.0% and 14.5% respectively
Poor population and poverty rate by age, 2009-2020
725 694 686 702 729 706 705 681 706 714 758
805
320 294 198 227 254 259 245 268 286 271 246
178
12.6 12.0 11.7 11.9 12.3 11.9 11.8 11.5 11.8 11.9
12.6 13.6
5.6 5.1
3.4 3.8 4.3 4.4 4.1 4.5 4.8 4.5 4.1 3.0
(8)
(6)
(4)
(2)
0
2
4
6
8
10
12
14
16
0
200
400
600
800
1 000
1 200
1 400
1 600
1 800
2 000
09 10 11 12 13 14 15 16 17 18 19 20
red PP purple PP
red rate purple rate
104
84
67 61 60
54 50 54 53 52 56
134
6752
37 32 33 34 32 37 37 34 39
72
86.584.2 83.7 84.3 84.7
81.4 81.8 79.4 81.1 80.3 78.882.7
55.9 52.3
46.1 44.1 47.2
51.3 52.4 55.1 56.2
52.0 55.3
44.5
(10)
0
10
20
30
40
50
60
70
80
90
100
0
50
100
150
200
250
300
09 10 11 12 13 14 15 16 17 18 19 20
Pre-intervention(purely theoretical assumption)
Post-intervention(all selected measures)
Poor population (LHS)Poverty rate (RHS)
Poor population ('000) Poverty rate (%) Poor population ('000) Poverty rate (%)
Source: General Household Survey, Census and Statistics Department.
(a) Working households (b) Unemployed households
19
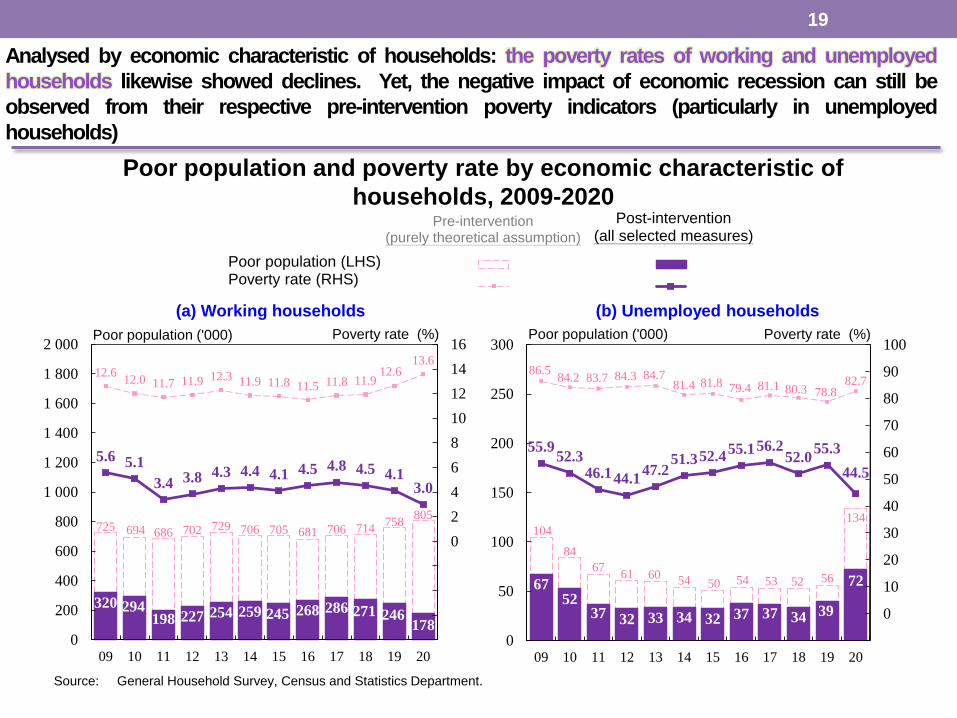
Analysed by economic characteristic of households: the poverty rates of working and unemployed
households likewise showed declines. Yet, the negative impact of economic recession can still be
observed from their respective pre-intervention poverty indicators (particularly in unemployed
households)
Poor population and poverty rate by economic characteristic of
households, 2009-2020

175.2
(+67.2)
70.1
(+37.4)
2 026.2
(-21.1)
1 851.0
(-88.3)
1 600
1 650
1 700
1 750
1 800
1 850
1 900
1 950
2 000
2 050
2 100
0
50
100
150
200
250
300
350
400
450
500
09 10 11 12 13 14 15 16 17 18 19 20
0
Working households (RHS)Working households with employed members all being part-time / underemployed (LHS)Working households with at least onefull-time working member(s) (RHS)Unemployed households (LHS)
Number ofhouseholds ('000)
Number ofhouseholds ('000)
(a) Number of economically active households
None5.3
None8.6
1
49.5
1
51.7
2
35.1
2
31.7
3+
10.1
3+
8.0
0 20 40 60 80 100
(i.e. employed members all being part-time /
underemployed)
Proportion of households (%)
Number of full-time working member(s) in households
(b) The proportion of households with each number offull-time working members among all working households
[+3.4] [+2.1] [-3.4] [-2.1]
2020
2019
Figures in parentheses denote the annual change of number of households, calculated using unrounded figures.
Figures in square brackets denote the annual change in proportion of households in percentage point(s), calculated using unrounded figures.
Figures in curly brackets denote annual change of average number of working members per household, calculated using unrounded figures.
General Household Survey, Census and Statistics Department.
Notes: ( )
[ ]
{ }
Source:
As the employment situation deteriorated notably, the numbers of unemployed households and working
households with all employed members being part-timers or underemployed both increased significantly:
the number and proportion of working households with two and above full-time working members
declined visibly. The income of workinghouseholds wasseverely hard-hit
20
Number of overall economically active households and proportion of working
households by number of full-time working members
Average number
of working
members
per working
household
1.63
1.70
{-0.06}

82.7
[+3.9]
77.9
[+1.1]
13.6
[+1.0]
23.6
[+2.2]
5
10
15
20
25
30
35
40
55
60
65
70
75
80
85
90
09 10 11 12 13 14 15 16 17 18 19 20
Unemployed households (LHS)
Economically inactive households (LHS)
Working households (RHS)
Overall (RHS)
(%) (%)
0 0
Working
households
47 400
29.3%
Unemployed
households
78 400
48.4%
Economically inactive
households
36 100
22.3%
Increase in pre-intervention (purely theoretical
assumption) poor population: 161 900
(b) Increase in pre-intervention (purely theoretical assumption) poor population
by economic characteristic of households
Economically active
households
125 800
77.7%
(a) Pre-intervention (purely theoretical assumption) poverty rate
Poverty statistics refer to statistics before policy intervention (purely theoretical assumption).
Figures in square brackets denote the annual change of poverty rate in percentage point(s), calculated using rounded figures.General Household Survey, Census and Statistics Department.
Notes:
[ ]
Source:
Further analysing the negative impacts of macroeconomic conditions on the poverty situation in 2020
based on the pre-intervention (purely theoretical assumption) situation: the visible increase in the overall
poverty rate was found to be driven mainly by a surge in the number of unemployed households and a
distinct rise in their poverty risk; nearly half of the increase in poor population were from unemployed
households
21
Pre-intervention (purely theoretical assumption) poverty rate and increase in poor population
by economic characteristic of households, 2020

+27 800
-16 000
+11 800
0 100 000 200 000 300 000
Part-time /underemployed
Full-time
Overall
2020
2019
(a) Annual change innumber of working poor persons
5,700
(+12.3)
0
2,000
4,000
6,000
8,000
10,000
12,000
14,000
09 10 11 12 13 14 15 16 17 18 19 20
Overall
Full-time
Part-time / underemployed
($)
9,600 (-7.2)
11,800 (-4.0)
(b) Average monthly employment earnings of working poor persons
Number of pre-intervention (purely theoretical assumption)working poor persons
Figures in parentheses denote the annual change (%) of average monthly employment earnings, calculated using unrounded figures.
Poverty statistics refer to statistics before policy intervention (purely theoretical assumption).
General Household Survey, Census and Statistics Department.
Notes: ( )
Source:
The number of pre-intervention (purely theoretical assumption) working poor persons also increased by 11 800: it
is evident that unemployment led to a decline in the average number of working members per
households. Besides, many of the family members, while still in employment, had to face working
hour cuts or even became underemployed. This also put pressures on their employment earnings
in consequence
22
Changes in the number of pre-intervention (purely theoretical assumption)
working poor persons and their employment earnings, 2020

111 118
79 85
43 74
55 53 30 25 10 14
54
224
376
557
98 108
71 83
42 65
48 53 27 24 8 13
256 283
216 216
511
628
1.8 2.0
1.3 1.4 0.7
1.3 0.9 0.9 0.5 0.4 0.1 0.3
0.9
3.8
6.2
9.4
1.6 1.8 1.2 1.4 0.7 1.1 0.8 0.9
0.4 0.4 0.1 0.2
4.2 4.8
3.6 3.7
8.5
10.6
0
2
4
6
8
10
12
14
16
18
20
22
0
100
200
300
400
500
600
700
800
綜援 長者
生活津貼
職津 教育津貼 傷殘津貼 高齡津貼 所有
現金項目
公屋 所有選定
項目
2019 2020 2019 2020 2019 2020 2019 2020
Post-intervention(recurrent cash)
Post-intervention(recurrent + non-recurrent cash)
Post-intervention(in-kind: PRH)
Post-intervention(all selected measures)Reduction in
Population ('000) (Percentage point(s))
Poor population (LHS)Poverty rate (RHS)
CSSAOALA WFAEducation benefits
OAADA Cash measures^
PRH All selected measures
Cash payout&
Figures for 2019 included Caring and Sharing Scheme. Those for 2020 included Cash Payout Scheme and “One-off Allowance for New Arrivals from Low-income Families” Programme.Apart from the major recurrent / non-recurrent cash measures listed in the chart, cash measures also included Public Transport Fare Subsidy Scheme, measures under AEF and other relief measures rolled out in light of the pandemic that can be imputed in the framework (e.g. Special allowance for eligible WFA and SFA households), cash items under CCF, etc.General Household Survey, Census and Statistics Department.
Notes: (&)
(^)
Source:
23
Poverty alleviation effectiveness of selected measures on working households, 2019-2020
In face of the difficult employment conditions, the Government’s policy intervention measures played a
pivotal role in relieving the burden of working households. Taking into account policy intervention of all
selected measures, the poverty alleviation impact on working households increased to
10.6 percentage points. As such, the post-intervention (all selected measures) poverty rate of working
households showeda decline to 3.0% instead of an increase
0.06 0.080.08
0.080.16
0.17 0.18
-0.47 -0.11
0.77
1.98
-0.6
-0.3
0.0
0.3
0.6
0.9
1.2
1.5
1.8
2.1
2.4
2.7
4.42.8
-1.7 -6.1
2009-2010 2009-2011 2009-2012 2009-2013
Average annual change in real GDP
-0.37
0.12
-1.10
-3.50
-3.6
-3.2
-2.8
-2.4
-2.0
-1.6
-1.2
-0.8
-0.4
0.0
0.4
2009-2012 2012-2018 2018-2019 2019-2020
-0.7 0.3 -0.1 -1.3
@
Percent (%)
(Percentage point(s))
Average annual change in real GDP
(Percentage point(s))Average annual change in poverty alleviation impact of all selected measures
(in terms of change in poverty rate)
Average annual change in post-
intervention (all selected measures)
poverty rate:
Of which:
Population ageing
Dwindlinghousehold size
Economic factors (includingeconomic and labour marketperformance)
Structural factors
Change in poverty alleviation impact of all selected measures
24
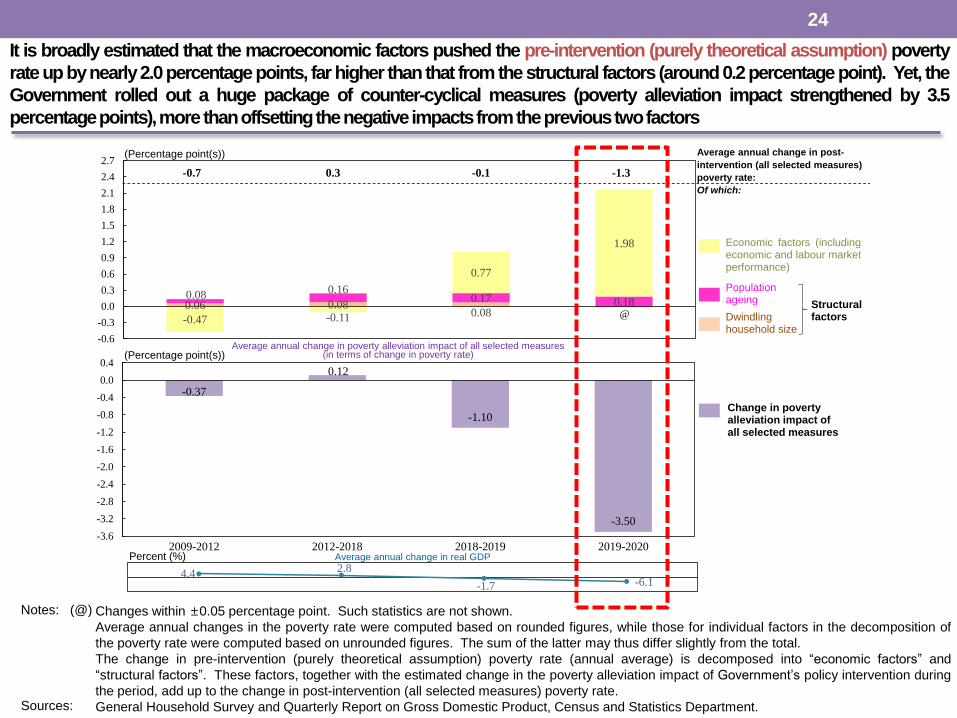
It is broadly estimated that the macroeconomic factors pushed the pre-intervention (purely theoretical assumption) poverty
rate up bynearly2.0percentage points, far higher thanthat from the structural factors (around0.2percentage point). Yet, the
Government rolled out a huge package of counter-cyclical measures (poverty alleviation impact strengthened by 3.5
percentagepoints),morethanoffsettingthenegativeimpactsfromtheprevioustwofactors
Changes within ±0.05 percentage point. Such statistics are not shown.
Average annual changes in the poverty rate were computed based on rounded figures, while those for individual factors in the decomposition of
the poverty rate were computed based on unrounded figures. The sum of the latter may thus differ slightly from the total.
The change in pre-intervention (purely theoretical assumption) poverty rate (annual average) is decomposed into “economic factors” and
“structural factors”. These factors, together with the estimated change in the poverty alleviation impact of Government’s policy intervention during
the period, add up to the change in post-intervention (all selected measures) poverty rate.
General Household Survey and Quarterly Report on Gross Domestic Product, Census and Statistics Department.
Notes: (@)
Sources:
III. Key observations
1. Being affected by the global COVID-19 pandemic, the Hong Kong economy experienced a severe
recession in 2020. Should there be no timely policy intervention by the Government, it would be
inevitable to see a distinct deterioration in the poverty situation. In response to this major
challenge, the Government rolled out a huge package of non-recurrent measures last year to
stabilise the economy and relieve the pressure on the grassroots’ livelihood.
• After policy intervention of all selected policies, the overall poverty rate and the size of the poor
population fell markedly in 2020 over the preceding year. Annual decreases in the poverty rates
were observed in different age groups, genders, and most of the groups classified by household
characteristic, illustrating the widespread impact of the non-recurrent measures that could largely
benefit various groups.
• The poverty alleviation impact of all selected measures strengthened substantially by 3.5
percentage points over 2019 to 15.7 percentage points, mainly as a result of the non-recurrent
measures launched, such as the cash payout of $10,000 and the relevant measures under AEF
(individual effectiveness were 3.8 and 1.1 percentage points respectively). These relieved the
burden of the grassroots and effectively suppressed the surge in poverty rate that would have come
about during the economic downturn. Moreover, the recurrent cash (6.3 percentage points) and in-
kind measures (such as PRH: 3.8 percentage points) continued to play a role in alleviating poverty
and helping the disadvantaged.
2. The macroeconomic conditions could have significant impact on the local poverty situation
• An analysis based on the pre-intervention (purely theoretical assumptions) situation reveals that as
the labour market deteriorated sharply in 2020, the number of unemployed households surged, and
their poverty risk rose distinctly. These would have been the main factors behind the noticeable
deterioration in the overall poverty situation (had there been no timely policy intervention by the
Government). Significant job losses together with reductions in working hours and underemployment
also exacerbated the situation of working poor during the year. All these illustrate that
macroeconomic downturn could have a significant impact on the local poverty situation.
25

III. Outlook• Looking ahead, the poverty situation outlook hinges on the
development of the pandemic across the globe and the pace of
economic recovery in Hong Kong
• If the Hong Kong community can provide widespread support to the implementation of the
vaccination programme and anti-epidemic measures, it would lay a solid foundation for the
economy to swiftly return to the right track, and for the labour market to recover further. This
would help bring relief to the local poverty situation as well, in particular the working poverty
situation. But it should be noted that the performance of post-intervention (all selected
measures) poverty indicators might be affected by the scaling down of one-off measures
after economic recovery.
• The Chief Executive’s 2021 Policy Address delivered in October stated
clearly that it is necessary to continuously improve people’s livelihood
• The Government’s poverty alleviation strategies will focus on four areas in future:
Continue to lift needy elderly out of poverty by providing cash welfare (including merging the Normal and
Higher OALA in the second half of 2022, so that the more lenient asset limits of the Normal OALA will be
adopted across-the-board, and eligible applicants will receive payment at the Higher OALA rate);
Continue to develop our economy, provide training and retraining, encourage employment, and provide
financial support for working households with lower incomes (particularly those with children) through the
WFA Scheme;
Vigorously speed up PRH construction, build more transitional housing and provide cash allowances to
eligible households who have been waiting for PRH for more than three years; and
Strengthen the MPF retirement protection under the principle of shared responsibility.
26