Embed Size (px)
Citation preview
23 December 2020
Commission on Poverty
Paper No. 11th/2020-21
Main Analysis of the
Poverty Situation in 2019
Office of the Government Economist
Financial Secretary’s Office
Census and Statistics
Department

I. Major factors affecting
poverty statistics in 2019
II. Main poverty situation
and its trend in 2019
III. Situation of the working
poor in 2019
IV. Key observations,
outlook & advice sought
2
Poverty situation in 2019 - Outline
Hong Kong Poverty Situation Report
2019
The full Report has been uploaded to CoP’s
websitehttps://www.povertyrelief.gov.hk/eng/archives.html
3
I. Major factors affecting poverty
statistics in 2019
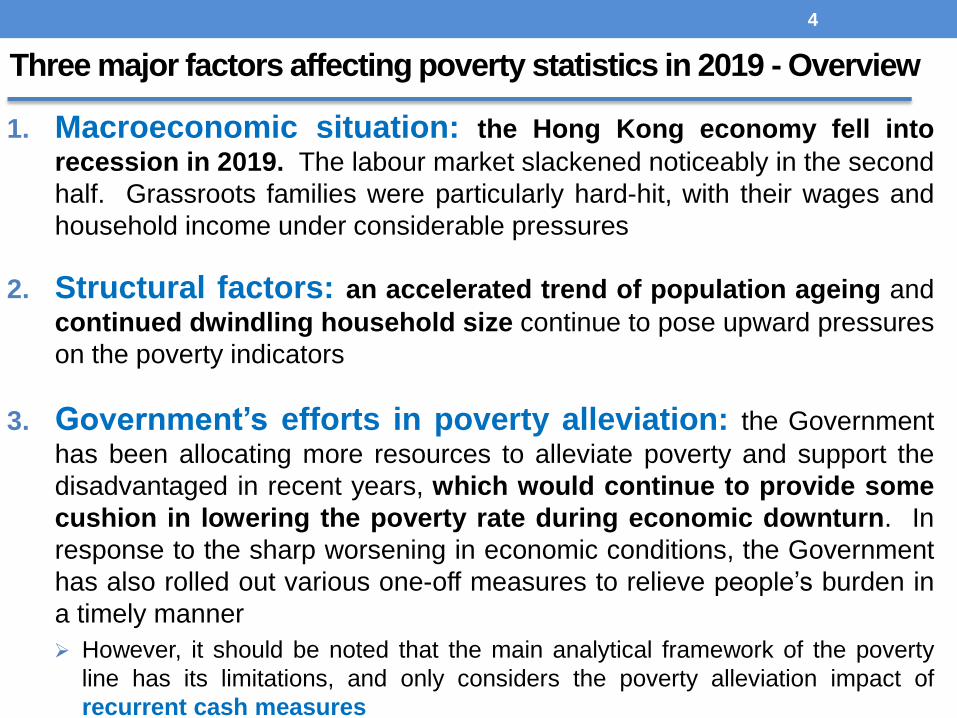
1. Macroeconomic situation: the Hong Kong economy fell into
recession in 2019. The labour market slackened noticeably in the second
half. Grassroots families were particularly hard-hit, with their wages and
household income under considerable pressures
2. Structural factors: an accelerated trend of population ageing and
continued dwindling household size continue to pose upward pressures
on the poverty indicators
3. Government’s efforts in poverty alleviation: the Government
has been allocating more resources to alleviate poverty and support the
disadvantaged in recent years, which would continue to provide some
cushion in lowering the poverty rate during economic downturn. In
response to the sharp worsening in economic conditions, the Government
has also rolled out various one-off measures to relieve people’s burden in
a timely manner
However, it should be noted that the main analytical framework of the poverty
line has its limitations, and only considers the poverty alleviation impact of
recurrent cash measures
4
Three major factors affecting poverty statistics in 2019 - Overview
5
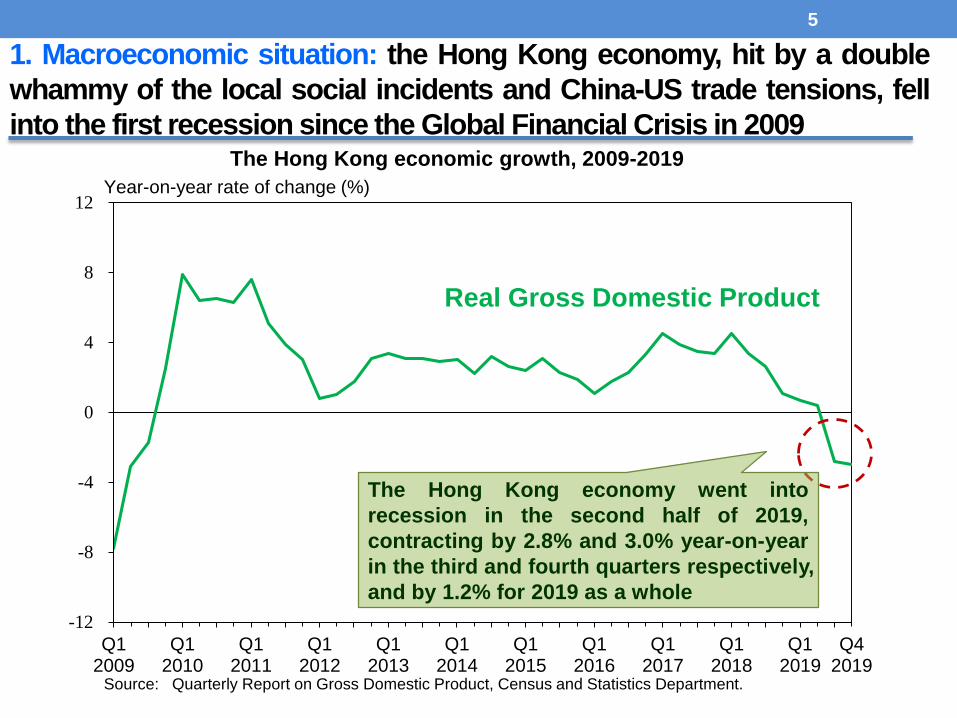
1. Macroeconomic situation: the Hong Kong economy, hit by a double
whammy of the local social incidents and China-US trade tensions, fell
into the first recession since the Global Financial Crisis in 2009
-12
-8
-4
0
4
8
12
Q12009
Q12010
Q12011
Q12012
Q12013
Q12014
Q12015
Q12016
Q12017
Q12018
Q12019
Q42019
Source: Quarterly Report on Gross Domestic Product, Census and Statistics Department.
Real Gross Domestic Product
Year-on-year rate of change (%)
The Hong Kong economy went into
recession in the second half of 2019,
contracting by 2.8% and 3.0% year-on-year
in the third and fourth quarters respectively,
and by 1.2% for 2019 as a whole
The Hong Kong economic growth, 2009-2019
-15.6-7.0
-55.6-48.2
-59.7-64.3
-49.6
18.5
-6.9
-21.8
-8.9
-6.0
-35.8-55.0
33.157.7 60.3
50.2
68.8
82.1
61.5
36.1
43.8
-17.1
-6.9
3.1
-18.0
-43.2
-150
-100
-50
0
50
100
Annual Annual Annual Q1 Q2 Q3 Q4
2017 2018 2019 2019
Other sectors
Retail, accommodation and food services
Import/export and wholesale trade
Overall
(b) Employment
3.3
5.2
2.5
2
3
4
5
6
7
8
Q12008
Q12009
Q12010
Q12011
Q12012
Q12013
Q12014
Q12015
Q12016
Q12017
Q12018
Q12019
(a) Unemployment rate
0
Overall (Seasonally adjusted)
Retail, accommodation andfood services
Q42019
Import/export and wholesale trade
Percent (%) Year-on-year change ('000)
6
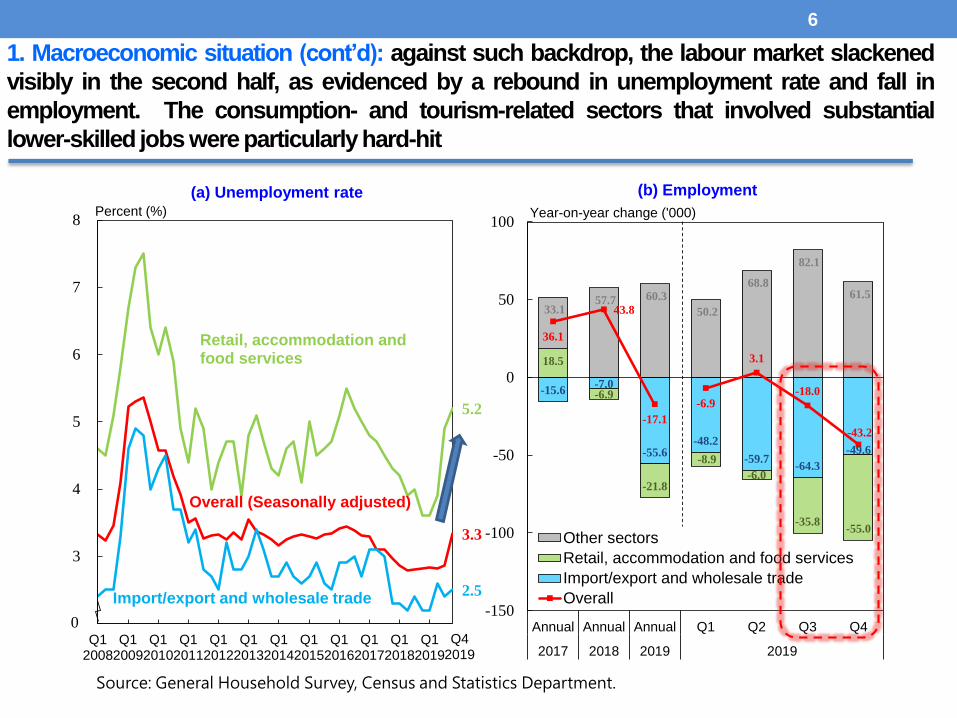
1. Macroeconomic situation (cont’d): against such backdrop, the labour market slackened
visibly in the second half, as evidenced by a rebound in unemployment rate and fall in
employment. The consumption- and tourism-related sectors that involved substantial
lower-skilled jobs were particularly hard-hit
Source: General Household Survey, Census and Statistics Department.
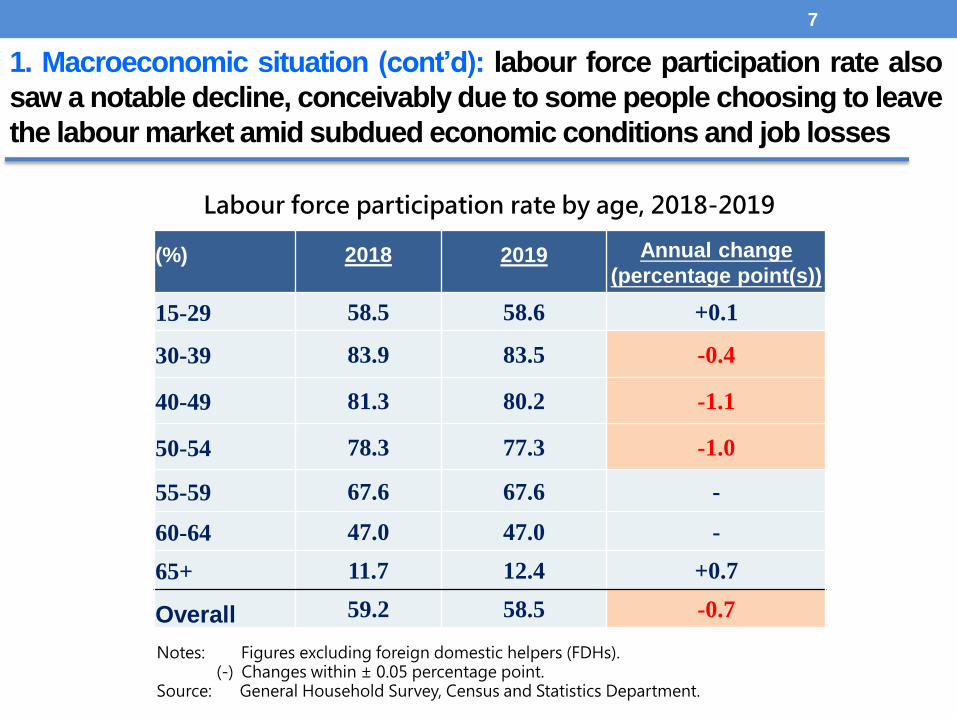
1. Macroeconomic situation (cont’d): labour force participation rate also
saw a notable decline, conceivably due to some people choosing to leave
the labour market amid subdued economic conditions and job losses
7
Notes: Figures excluding foreign domestic helpers (FDHs).(-) Changes within ± 0.05 percentage point.
Source: General Household Survey, Census and Statistics Department.
(%) 2018 2019 Annual change
(percentage point(s))
15-29 58.5 58.6 +0.1
30-39 83.9 83.5 -0.4
40-49 81.3 80.2 -1.1
50-54 78.3 77.3 -1.0
55-59 67.6 67.6 -
60-64 47.0 47.0 -
65+ 11.7 12.4 +0.7
Overall 59.2 58.5 -0.7
Labour force participation rate by age, 2018-2019

1.7
-0.2
2.9
-10
-8
-6
-4
-2
0
2
4
6
8
10
2008 2009 2010 2011 2012 2013 2014 2015 2016 2017 2018 2019
Median household income of overallhouseholds
Median household income ofhouseholds in the lowest three decilegroups
Composite consumer price index
Grassroots' household income
Overall household income
(b) Household income
Headline inflation
Year-on-year rate of change (%)
3.5 3.6
2.9
-2
0
2
4
6
8
10
12
2008 2009 2010 2011 2012 2013 2014 2015 2016 2017 2018 2019
Overall wages
Average employment earnings of full-timeemployees in the lowest three decile groupsComposite consumer price index
整體就業收入
Grassroots'employmentearnings
Headline inflation
Year-on-year rate of change (%)
Overall wages
(a) Nominal wages and average employment earnings
1. Macroeconomic situation (cont’d): labour demand slackened and employmentearnings growth decelerated appreciably. Also coupled with the decrease in theaverage number of working members per household, household income growthcame under pressure, in particular for the grassroots
8
Note: Figures excluded FDHs.Sources: General Household Survey, Monthly Report on the Consumer Price Index, and Labour Earnings Survey,
Census and Statistics Department.
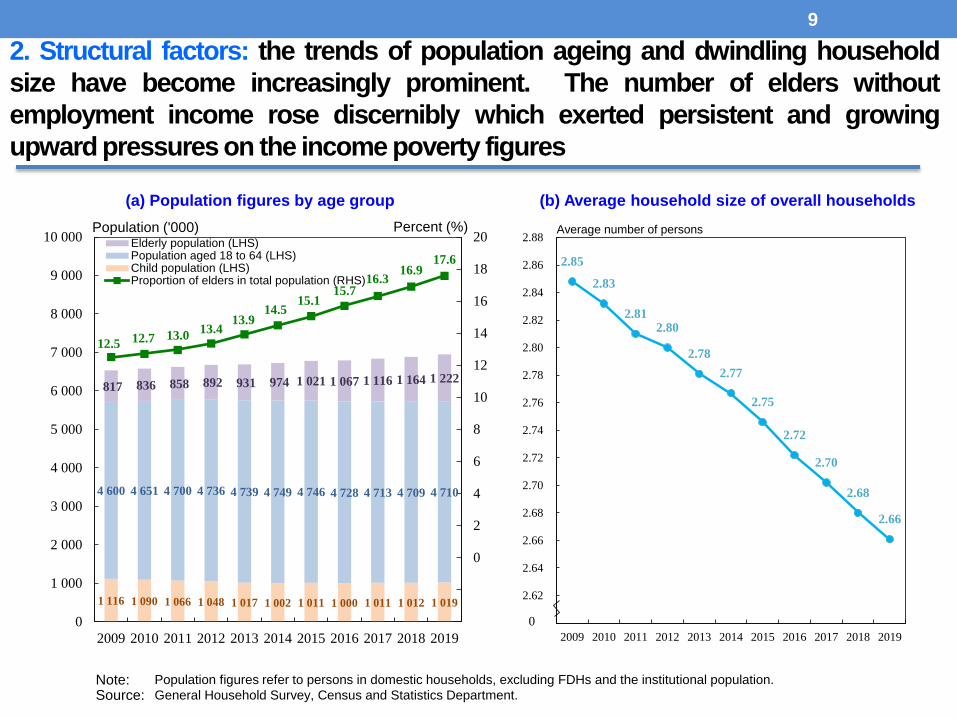
2. Structural factors: the trends of population ageing and dwindling household
size have become increasingly prominent. The number of elders without
employment income rose discernibly which exerted persistent and growing
upward pressures on the income poverty figures
9
(b) Average household size of overall households(a) Population figures by age group
2.85
2.83
2.81 2.80
2.78
2.77
2.75
2.72
2.70
2.68
2.66
2009 2010 2011 2012 2013 2014 2015 2016 2017 2018 2019
2.60
2.62
2.64
2.66
2.68
2.70
2.72
2.74
2.76
2.78
2.80
2.82
2.84
2.86
2.88
Source: General Household Survey, Census and Statistics Department.
(b) Average household size of overall households
Average number of persons
0
16.6 16.8 17.2 17.3 17.4 17.7 18.4 19.2 19.2 20.1 20.3
26.2 26.2 26.4 26.7 27.5 27.627.8 27.8 28.1
28.3 28.8
0
5
10
15
20
25
30
35
40
45
50
2009 2010 2011 2012 2013 2014 2015 2016 2017 2018 2019
2-person households 1-person households
Percent (%)
(b) Share of 1-person and 2-person households within all households
1 116 1 090 1 066 1 048 1 017 1 002 1 011 1 000 1 011 1 012 1 019
4 600 4 651 4 700 4 736 4 739 4 749 4 746 4 728 4 713 4 709 4 710
817 836 858 892 931 974 1 021 1 067 1 116 1 164 1 222
12.5 12.7 13.013.4
13.914.5
15.115.7
16.316.9
17.6
-4
-2
0
2
4
6
8
10
12
14
16
18
20
2009 2010 2011 2012 2013 2014 2015 2016 2017 2018 2019
0
1 000
2 000
3 000
4 000
5 000
6 000
7 000
8 000
9 000
10 000Elderly population (LHS)Population aged 18 to 64 (LHS)Child population (LHS)Proportion of elders in total population (RHS)
Percent (%)
Population figures refer to persons in domestic households, excluding FDHs and the institutional population.
General Household Survey, Census and Statistics Department.
Population ('000)
(a) Population figures by age group
Note:Source:
2,700
300
2,800
300
2,900
300
2,900
400
3,200
500
3,500
500
3,600
500
3,700
600
4,000
600
4,100
700
4,100
900
400
600
500
500
1,200
1,500
1,000
1,300
600
900
400
600
700
1,000
400
900
400
1,000
900
1,400
1,200
1,600
1,200
600
1,300
600
1,400
700
1,400
700
1,400
700
1,600
900
1,700
1,000
1,600
1,000
1,700
1,000
1,900
1,100
1,800
1,100
100
@
100
@
100
@
200
@
200
@
200
@
200
@
200
@
200
@
200
@
200
@
0
1,000
2,000
3,000
4,000
5,000
6,000
7,000
8,000
Recurrent cash Non-recurrent cash In-kind: PRH In-kind: Others
2009 2010 2011 2012 2013 2014 2015 2016 2017 2018 2019
[4,400][4,700]
[5,700] [5,500] [5,500]
[5,700]
[6,100] [6,300]
[1,400][1,400]
[2,500] [2,400]
[2,100] [2,000]
[2,500] [2,500] [2,600]
[7,000]
[5,900]
[3,200]
[7,300]
[3,600]
($, per month)
Poor Non-poor Poor Non-poor Poor Non-poor Poor Non-poor Poor Non-poor Poor Non-poor Poor Non-poor Poor Non-poor Poor Non-poor Poor Non-poor Poor Non-poor
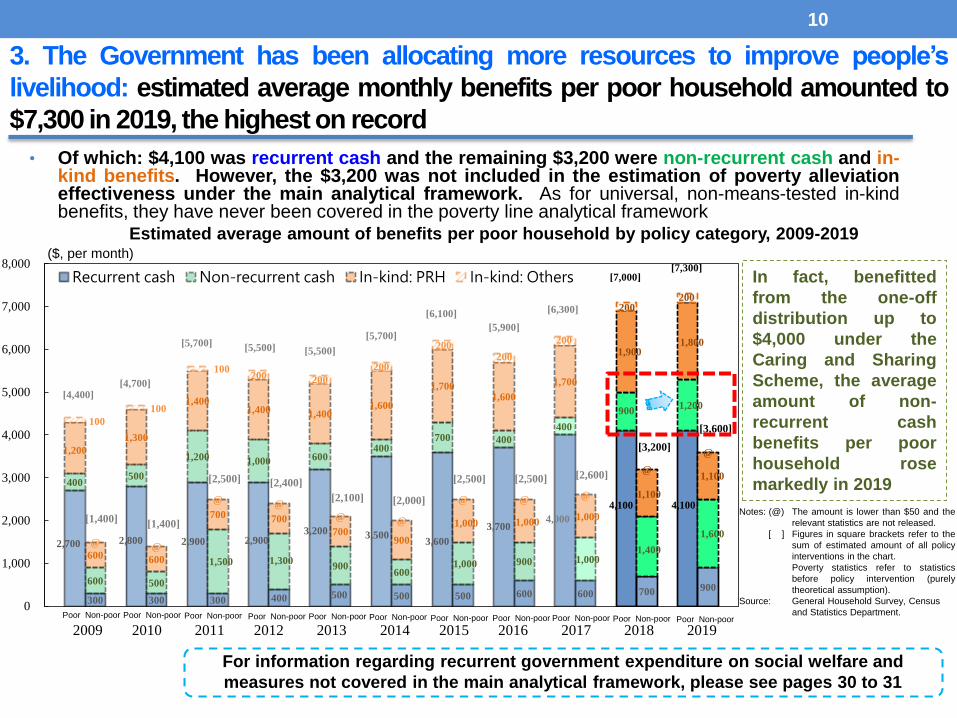
• Of which: $4,100 was recurrent cash and the remaining $3,200 were non-recurrent cash and in-kind benefits. However, the $3,200 was not included in the estimation of poverty alleviationeffectiveness under the main analytical framework. As for universal, non-means-tested in-kindbenefits, they have never been covered in the poverty line analytical framework
10
3. The Government has been allocating more resources to improve people’s
livelihood: estimated average monthly benefits per poor household amounted to
$7,300 in 2019, the highest on record
Estimated average amount of benefits per poor household by policy category, 2009-2019
Notes: (@)
[ ]
Source:
The amount is lower than $50 and the
relevant statistics are not released.
Figures in square brackets refer to the
sum of estimated amount of all policy
interventions in the chart.
Poverty statistics refer to statistics
before policy intervention (purely
theoretical assumption).
General Household Survey, Census
and Statistics Department.
For information regarding recurrent government expenditure on social welfare and
measures not covered in the main analytical framework, please see pages 30 to 31
In fact, benefitted
from the one-off
distribution up to
$4,000 under the
Caring and Sharing
Scheme, the average
amount of non-
recurrent cash
benefits per poor
household rose
markedly in 2019
11
II. Main poverty situation
and its trend in 2019
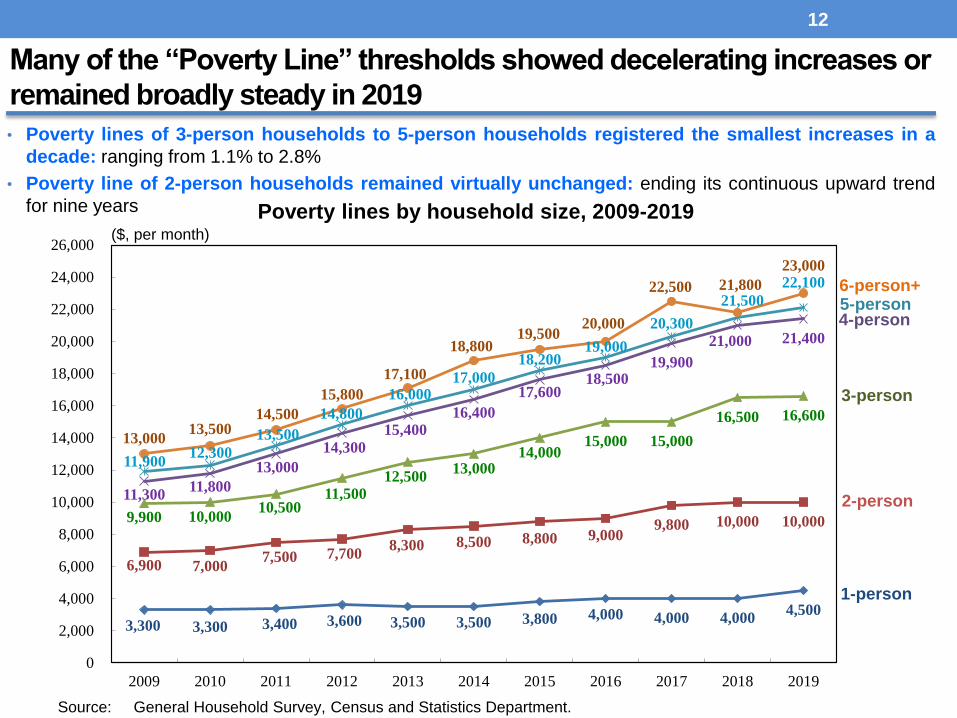
• Poverty lines of 3-person households to 5-person households registered the smallest increases in a
decade: ranging from 1.1% to 2.8%
• Poverty line of 2-person households remained virtually unchanged: ending its continuous upward trend
for nine years
12
Many of the “Poverty Line” thresholds showed decelerating increases or
remained broadly steady in 2019
Poverty lines by household size, 2009-2019
3,300 3,300 3,400 3,600 3,500 3,500 3,800 4,000 4,000 4,000 4,500
6,900 7,000 7,500 7,700
8,300 8,500 8,800 9,000 9,800 10,000 10,000 9,900 10,000
10,500 11,500
12,500 13,000
14,000 15,000 15,000
16,500 16,600
11,300 11,800
13,000
14,300
15,400 16,400
17,600 18,500
19,900
21,000 21,400
11,900 12,300
13,500
14,800
16,000 17,000
18,200 19,000
20,300
21,500
22,100
13,000 13,500
14,500
15,800
17,100
18,800 19,500
20,000
22,500 21,800
23,000
0
2,000
4,000
6,000
8,000
10,000
12,000
14,000
16,000
18,000
20,000
22,000
24,000
26,000
2009 2010 2011 2012 2013 2014 2015 2016 2017 2018 2019
Source: General Household Survey, Census and Statistics Department.
($, per month)
1-person
3-person
4-person5-person6-person+
2-person
13
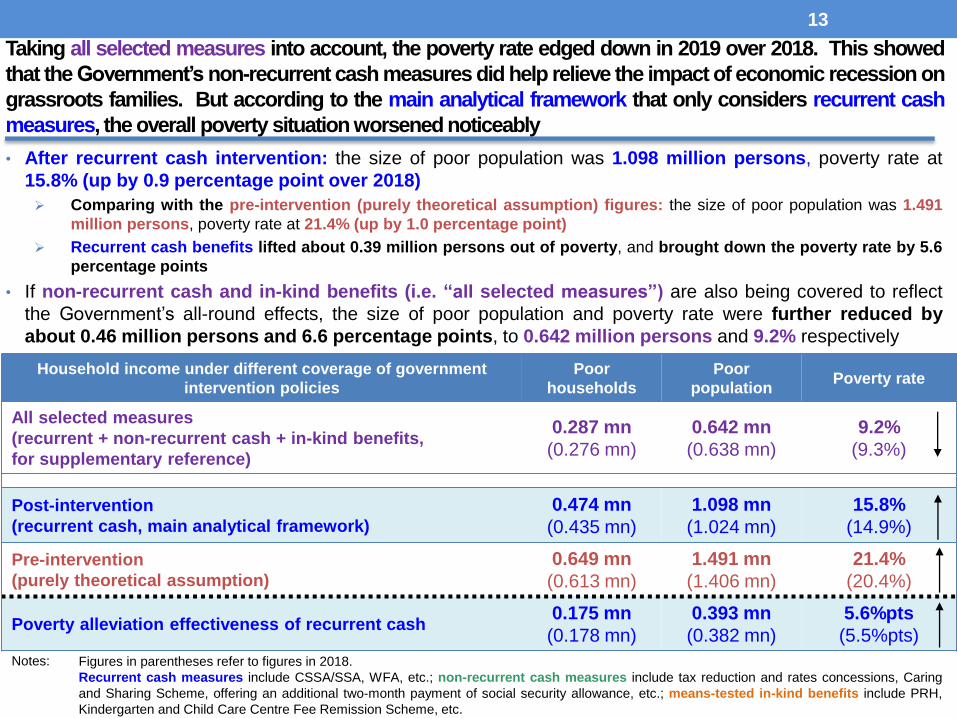
Taking all selected measures into account, the poverty rate edged down in 2019 over 2018. This showed
that the Government’s non-recurrent cash measures did help relieve the impact of economic recession on
grassroots families. But according to the main analytical framework that only considers recurrent cash
measures, the overall poverty situation worsened noticeably
• After recurrent cash intervention: the size of poor population was 1.098 million persons, poverty rate at
15.8% (up by 0.9 percentage point over 2018)
Comparing with the pre-intervention (purely theoretical assumption) figures: the size of poor population was 1.491
million persons, poverty rate at 21.4% (up by 1.0 percentage point)
Recurrent cash benefits lifted about 0.39 million persons out of poverty, and brought down the poverty rate by 5.6
percentage points
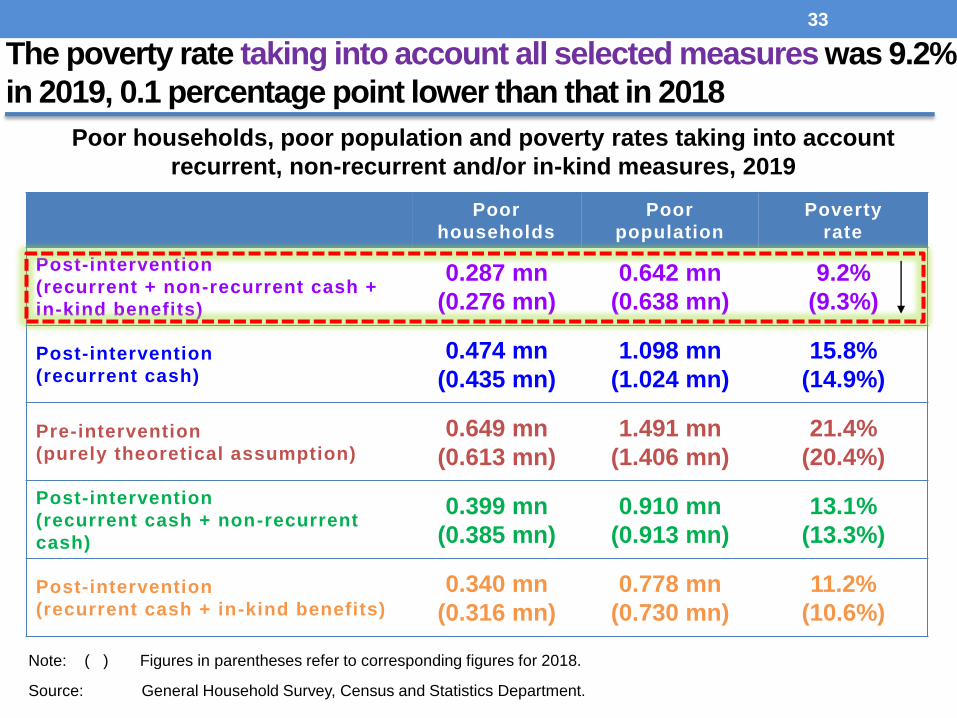
• If non-recurrent cash and in-kind benefits (i.e. “all selected measures”) are also being covered to reflect
the Government’s all-round effects, the size of poor population and poverty rate were further reduced by
about 0.46 million persons and 6.6 percentage points, to 0.642 million persons and 9.2% respectively
Household income under different coverage of government
intervention policies
Poor
households
Poor
populationPoverty rate
All selected measures
(recurrent + non-recurrent cash + in-kind benefits,
for supplementary reference)
0.287 mn
(0.276 mn)
0.642 mn
(0.638 mn)
9.2%
(9.3%)
Post-intervention
(recurrent cash, main analytical framework)
0.474 mn
(0.435 mn)
1.098 mn
(1.024 mn)
15.8%
(14.9%)
Pre-intervention
(purely theoretical assumption)
0.649 mn
(0.613 mn)
1.491 mn
(1.406 mn)
21.4%
(20.4%)
Poverty alleviation effectiveness of recurrent cash0.175 mn
(0.178 mn)
0.393 mn
(0.382 mn)
5.6%pts
(5.5%pts)
Figures in parentheses refer to figures in 2018.
Recurrent cash measures include CSSA/SSA, WFA, etc.; non-recurrent cash measures include tax reduction and rates concessions, Caring
and Sharing Scheme, offering an additional two-month payment of social security allowance, etc.; means-tested in-kind benefits include PRH,
Kindergarten and Child Care Centre Fee Remission Scheme, etc.
Notes:

1 348 1 322 1 295 1 312 1 336 1 325 1 345 1 352 1 3771 406
1 491
1 043 1 031 1 005 1 018 972 962 971 996 1 009 1 0241 098
644 616
472 524 564 593 586
657 671 638 642
0
200
400
600
800
1 000
1 200
1 400
1 600
2009 2010 2011 2012 2013 2014 2015 2016 2017 2018 2019
Post-intervention(recurrent cash)
(20.1%)(20.6%)(19.6%)
Poor population('000)
(16.0%) (15.7%) (15.2%)
Note: ( ) Figures in parentheses refer to the corresponding poverty rates.Source: General Households Survey, Census and Statistics Department.
(19.6%)
(15.2%)
(19.9%)
(14.5%) (14.3%)
(19.7%)(19.6%)
(14.3%)
(19.9%)
(14.7%)
(20.1%)
(14.7%)(14.9%)
(20.4%)
Post-intervention (recurrent cash + non-
recurrent cash + in-kind benefits)
(15.8%)
(21.4%)
(9.9%) (9.4%)
(7.1%)(7.8%)
(8.4%) (8.6%)(8.8%)(9.7%) (9.8%) (9.3%) (9.2%)
Pre-intervention(purely theoretical
assumption)
Poor households ('000) 2009 2010 2011 2012 2013 2014 2015 2016 2017 2018 2019
Pre-intervention (purely theoretical assumption) 541 536 530 541 555 555 570 582 594 613 649
Post-intervention (recurrent cash) 406 405 399 403 385 383 392 412 420 435 474
Post-intervention (recurrent cash+non-recurrent cash+in-kind benefits) 253 246 194 216 233 250 250 284 287 276 287
14
Poor population and poverty rate taking into account all selected measures, 2009-2019
The movement of poverty rate taking into account all selected measures
would be more affected by the Government’s one-off measures
For further supplementary poverty statistics taking into account non-
recurrent cash and/ or in-kind benefits, please see pages 33 to 36
15
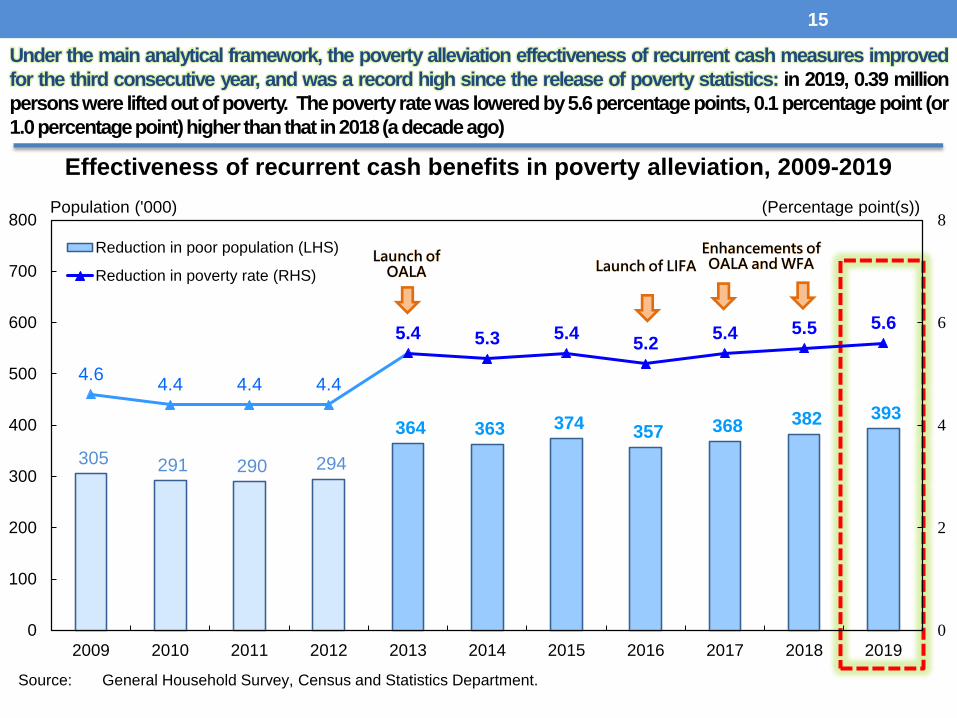
Under the main analytical framework, the poverty alleviation effectiveness of recurrent cash measures improved
for the third consecutive year, and was a record high since the release of poverty statistics: in 2019, 0.39 million
persons were liftedout of poverty. The povertyrate was lowered by5.6 percentage points, 0.1 percentage point (or
1.0percentagepoint)higher thanthat in2018(a decadeago)
Effectiveness of recurrent cash benefits in poverty alleviation, 2009-2019
305 291 290 294
364 363 374357 368 382 393
4.64.4 4.4 4.4
5.4 5.3 5.4 5.2
5.4 5.5 5.6
0
2
4
6
8
0
100
200
300
400
500
600
700
800
2009 2010 2011 2012 2013 2014 2015 2016 2017 2018 2019
Reduction in poor population (LHS)
Reduction in poverty rate (RHS)
Launch of OALA Launch of LIFA
Enhancements of OALA and WFA
Population ('000) (Percentage point(s))
Source: General Household Survey, Census and Statistics Department.
163155 147
154
42 48 43 46
26 3215 16
382393
63
151
252261
2.3 2.22.1 2.2
0.6 0.6 0.6 0.60.3 0.4
0.2 0.2
5.5 5.6
0.9
2.1
3.6 3.7
0
1
2
3
4
5
6
7
0
50
100
150
200
250
300
350
400
450
2016 2017 2018 2019 2016 2017 2018 2019 2016 2017 2018 2019 2016 2017 2018 2019 2016 2017 2018 2019 2016 2017CSSA OALA Education Benefits
LIFA/WFA OAADA All recurrent cash
policies
PRH
Source: General Household Survey, Census and Statistics Department.
Population('000) (Percentage point(s))
Reduction in poor population (LHS)
Reduction in poverty rate (RHS)
In-kind: PRH
2018 2019
Recurrent cash
2018 2019
All non-recurrent cash
policies
Non-recurrent cash
2018 2019
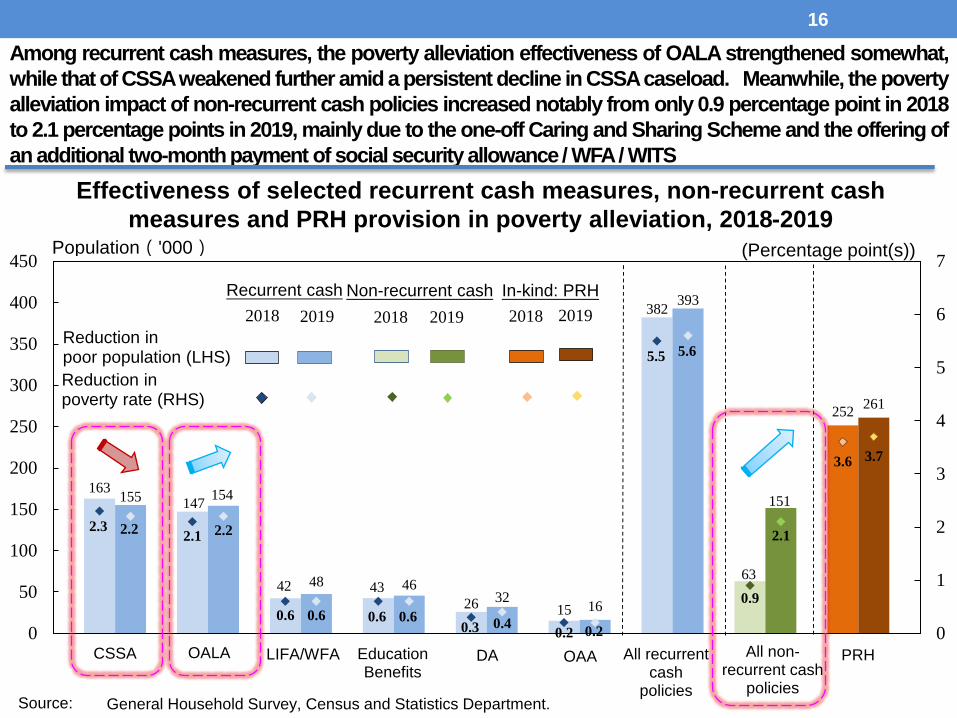
Effectiveness of selected recurrent cash measures, non-recurrent cash
measures and PRH provision in poverty alleviation, 2018-2019
16
Among recurrent cash measures, the poverty alleviation effectiveness of OALA strengthened somewhat,
while that of CSSAweakened further amid a persistent decline in CSSAcaseload. Meanwhile, the poverty
alleviation impact of non-recurrent cash policies increased notably from only 0.9 percentage point in 2018
to 2.1 percentage points in 2019, mainly due to the one-off Caring and Sharing Scheme and the offering of
an additional two-month payment of social security allowance / WFA/ WITS
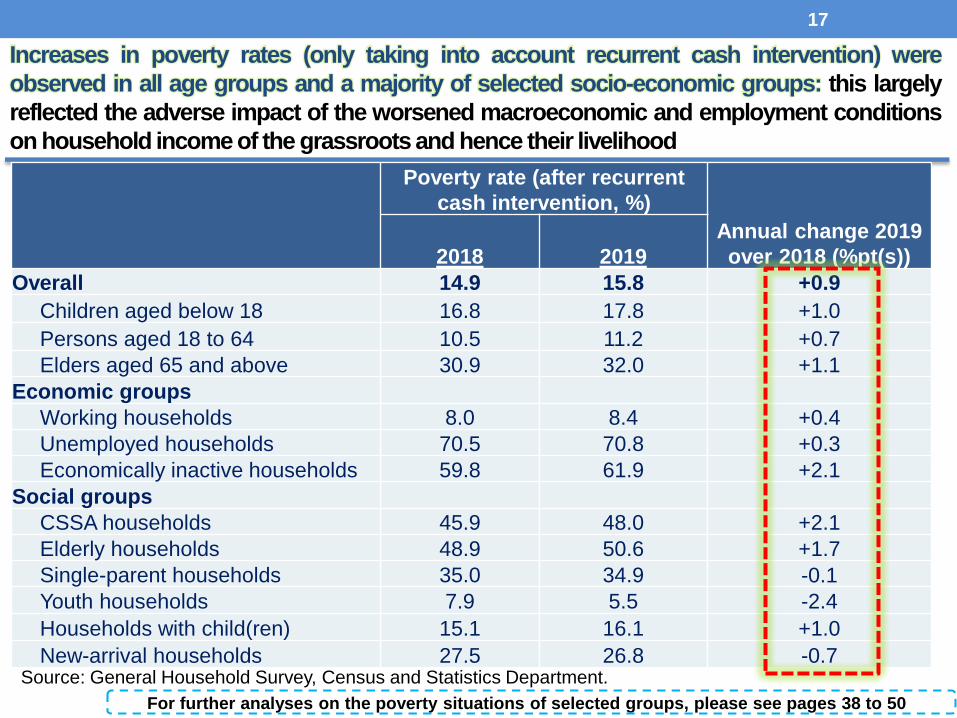
Increases in poverty rates (only taking into account recurrent cash intervention) were
observed in all age groups and a majority of selected socio-economic groups: this largely
reflected the adverse impact of the worsened macroeconomic and employment conditions
on household income of the grassroots and hence their livelihood
17
Poverty rate (after recurrent
cash intervention, %)
Annual change 2019
over 2018 (%pt(s))2018 2019
Overall 14.9 15.8 +0.9
Children aged below 18 16.8 17.8 +1.0
Persons aged 18 to 64 10.5 11.2 +0.7
Elders aged 65 and above 30.9 32.0 +1.1
Economic groups
Working households 8.0 8.4 +0.4
Unemployed households 70.5 70.8 +0.3
Economically inactive households 59.8 61.9 +2.1
Social groups
CSSA households 45.9 48.0 +2.1
Elderly households 48.9 50.6 +1.7
Single-parent households 35.0 34.9 -0.1
Youth households 7.9 5.5 -2.4
Households with child(ren) 15.1 16.1 +1.0
New-arrival households 27.5 26.8 -0.7Source: General Household Survey, Census and Statistics Department.
For further analyses on the poverty situations of selected groups, please see pages 38 to 50
18
III. Situation of the working poor in 2019
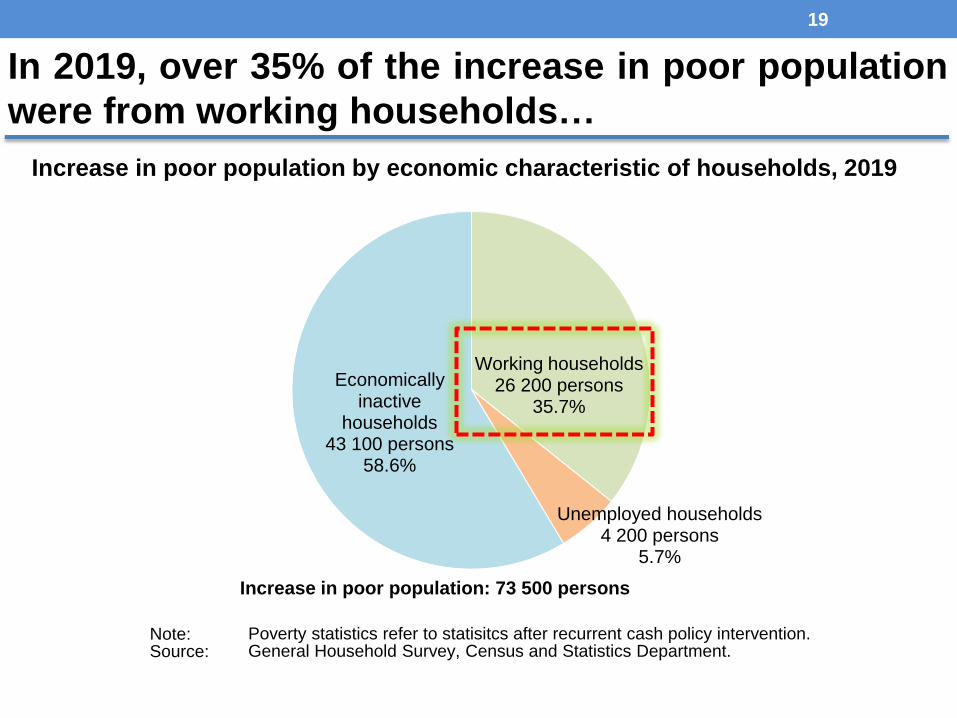
Working households26 200 persons
35.7%
Unemployed households4 200 persons
5.7%
Economically inactive
households43 100 persons
58.6%
Poverty statistics refer to statisitcs after recurrent cash policy intervention.General Household Survey, Census and Statistics Department.
Note:Source:
Increase in poor population: 73 500 persons
In 2019, over 35% of the increase in poor population
were from working households…
19
Increase in poor population by economic characteristic of households, 2019

-5.4
-2.0
+5.5
+6.5
+21.2
+23.7
+4.2
+26.2
+43.1
+73.5
-4.9
+0.6
-0.8
-11.2
+12.1
-11.1
-0.2
-8.3
+18.9
+10.4
- 20 - 10 0 10 20 30 40 50 60 70 80 90
New-arrival
Youth
Single-parent
CSSA
Elderly
With-children
Unemployed
Working
Economically inactive
Overall
Poor population (post-recurrent cash intervention, '000)
Average annual change over the 5-year period of 2014 to 2018 Change in 2019
Source: General Household Survey, Census and Statistics Department.
…which was different from the situation in the past few years, when the increase
was mainly contributed by economically inactive households while the size of the
poor population from working households declined
20
Changes in the size of the post-intervention (recurrent cash) poor population
by selected socio-economic group
-2.5
6.8
4.8
1.7
3.12.8
2.42.2
3.8
2.8
-1.2
2009 2011 2013 2015 2017 2019
-4
-2
0
2
4
6
8
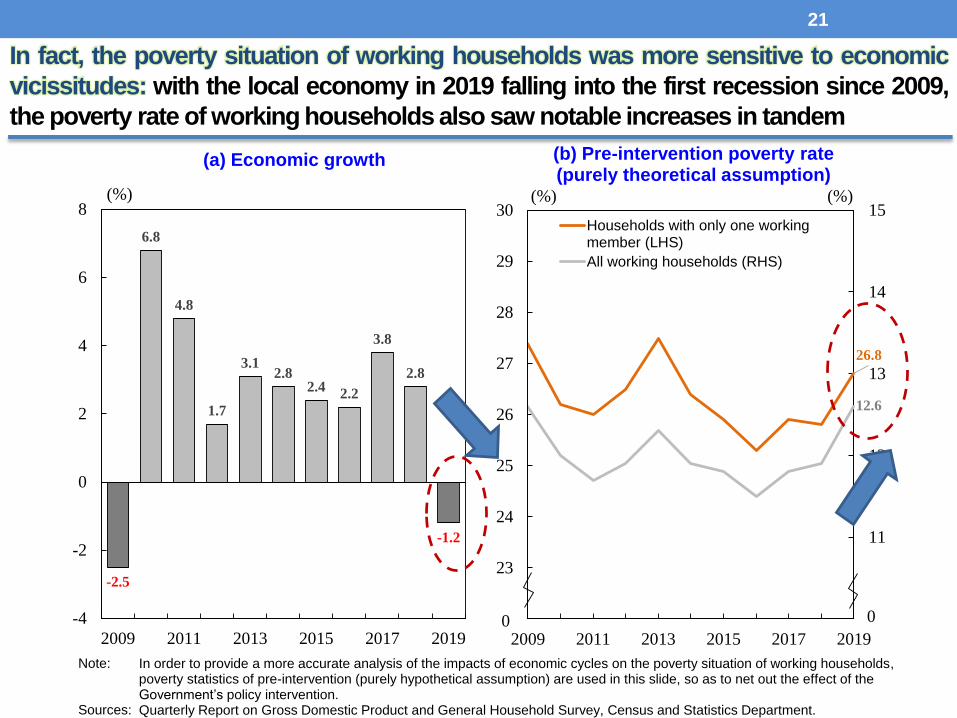
(a) Economic growth
26.8
12.6
10
11
12
13
14
15
22
23
24
25
26
27
28
29
30
2009 2011 2013 2015 2017 2019
Households with only one workingmember (LHS)
All working households (RHS)
(%) (%)
0 0
In order to provide a more accurate analysis of the impacts of economic cycles on the poverty situation of working households, poverty statistics of pre-intervention (purely hypothetical assumption) are used in this slide, so as to net out the effect of the Government’s policy intervention.Quarterly Report on Gross Domestic Product and General Household Survey, Census and Statistics Department.
(%)
(b) Pre-intervention poverty rate(purely theoretical assumption)
Note:
Sources:
In fact, the poverty situation of working households was more sensitive to economic
vicissitudes: with the local economy in 2019 falling into the first recession since 2009,
the poverty rate of working households also saw notable increases in tandem
21
25.8
4.9
0.9
26.8
4.9
0.8
0
5
10
15
20
25
30
1 2 3+
2018
2019
Poverty rate (%)
Number of working members in households
(b) Poverty rate by number of working membersin households
45.8
40.1
14.1
47.4
39.2
13.4
0
10
20
30
40
50
60
1 2 3+
2018
2019
Share of households (%)
[1.7]
[-1.0]
[-0.7]
Number of working members in households
The change in share of households in percentage point(s) are included in square brackets, calculated using unrounded figures.In order to provide a more accurate analysis of the impacts of economic cycles on the poverty situation of working households,poverty statistics of pre-intervention (purely theoretical assumption) are used in this slide, so as to net out the effect of the Government’s policy intervention.General Household Survey, Census and Statistics Department.
Notes: [ ]
Source:
(a) The proportion of households with each number ofworking members among all working households
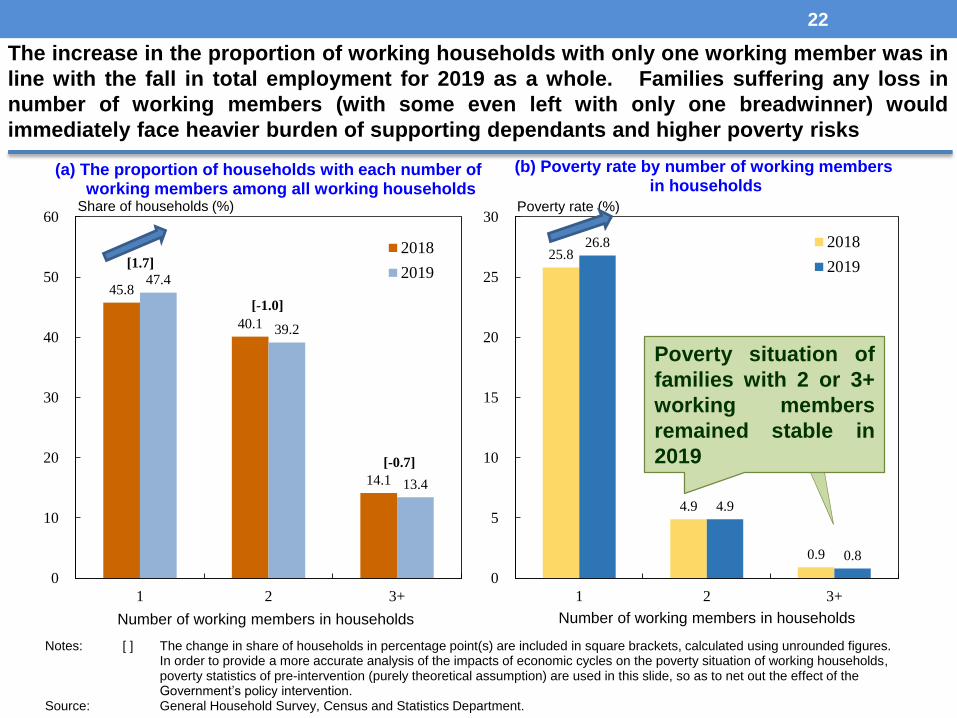
The increase in the proportion of working households with only one working member was in
line with the fall in total employment for 2019 as a whole. Families suffering any loss in
number of working members (with some even left with only one breadwinner) would
immediately face heavier burden of supporting dependants and higher poverty risks
22
Poverty situation of
families with 2 or 3+
working members
remained stable in
2019
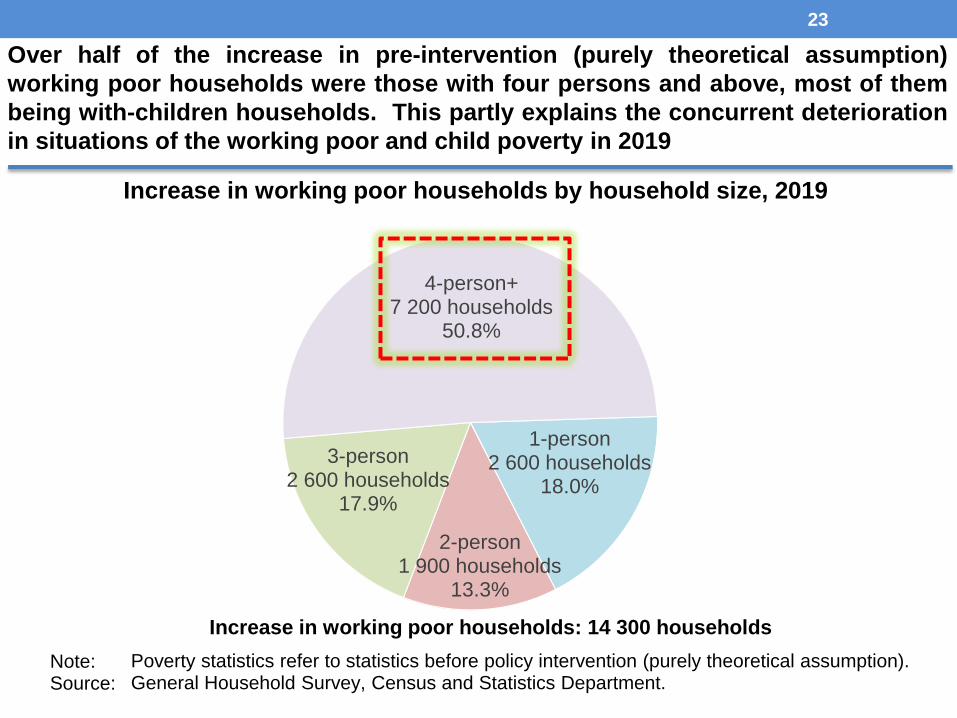
1-person2 600 households
18.0%
2-person1 900 households
13.3%
3-person2 600 households
17.9%
4-person+7 200 households
50.8%
Poverty statistics refer to statistics before policy intervention (purely theoretical assumption).General Household Survey, Census and Statistics Department.
Note:Source:
Increase in working poor households: 14 300 households
Over half of the increase in pre-intervention (purely theoretical assumption)
working poor households were those with four persons and above, most of them
being with-children households. This partly explains the concurrent deterioration
in situations of the working poor and child poverty in 2019
23
Increase in working poor households by household size, 2019
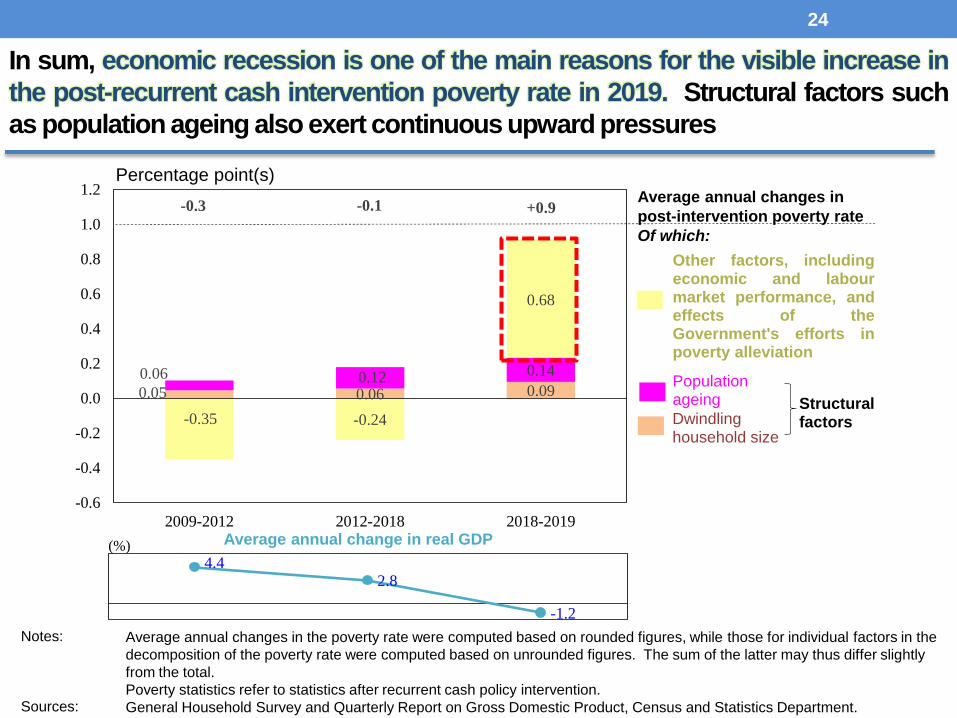
0.05 0.06 0.090.06 0.12 0.14
-0.35 -0.24
0.68
-0.3 -0.1 +0.9
-0.6
-0.4
-0.2
0.0
0.2
0.4
0.6
0.8
1.0
1.2
2009-2012 2012-2018 2018-2019
4.42.8
-1.2-20246
(%) Average annual change in real GDP
Percentage point(s)
Population ageing
Dwindlinghousehold size
Average annual changes in
post-intervention poverty rate
Of which:
Other factors, includingeconomic and labourmarket performance, andeffects of theGovernment's efforts inpoverty alleviation
Structural factors
In sum, economic recession is one of the main reasons for the visible increase in
the post-recurrent cash intervention poverty rate in 2019. Structural factors such
as population ageing also exert continuous upward pressures
24
Average annual changes in the poverty rate were computed based on rounded figures, while those for individual factors in the
decomposition of the poverty rate were computed based on unrounded figures. The sum of the latter may thus differ slightly
from the total.
Poverty statistics refer to statistics after recurrent cash policy intervention.
General Household Survey and Quarterly Report on Gross Domestic Product, Census and Statistics Department.
Notes:
Sources:
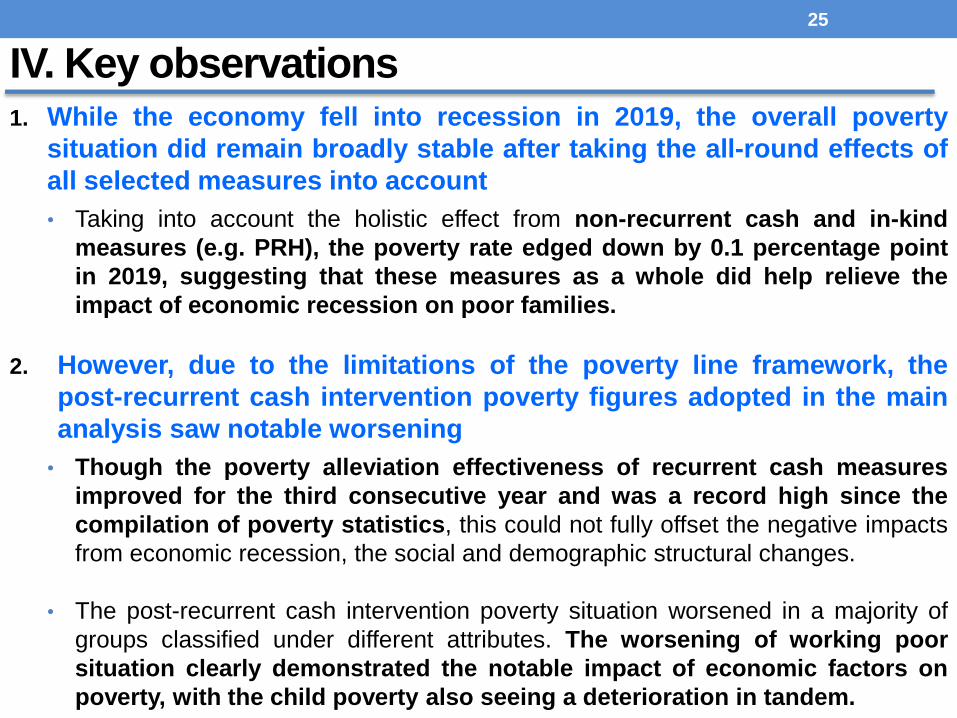
IV. Key observations1. While the economy fell into recession in 2019, the overall poverty
situation did remain broadly stable after taking the all-round effects of
all selected measures into account
• Taking into account the holistic effect from non-recurrent cash and in-kind
measures (e.g. PRH), the poverty rate edged down by 0.1 percentage point
in 2019, suggesting that these measures as a whole did help relieve the
impact of economic recession on poor families.
2. However, due to the limitations of the poverty line framework, the
post-recurrent cash intervention poverty figures adopted in the main
analysis saw notable worsening
• Though the poverty alleviation effectiveness of recurrent cash measures
improved for the third consecutive year and was a record high since the
compilation of poverty statistics, this could not fully offset the negative impacts
from economic recession, the social and demographic structural changes.
• The post-recurrent cash intervention poverty situation worsened in a majority of
groups classified under different attributes. The worsening of working poor
situation clearly demonstrated the notable impact of economic factors on
poverty, with the child poverty also seeing a deterioration in tandem.
25
IV. Outlook• The COVID-19 pandemic has dragged both the global and Hong Kong economies into
unprecedented recession in 2020 and created exceptionally high uncertainties. The labour
market situation deteriorated notably, and in turn impacted further on the livelihood of
grassroots workers and their family members.
• The Government has rolled out a series of support measures in order to provide multi-
faceted support for the needy to weather the impacts of the recession and the pandemic.
Major measures included:
$120 billion worth of counter-cyclical measures rolled out in the 2020/21 Budget (e.g.
$10,000 Cash Payout Scheme);
Total $162.3 billion in Anti-epidemic Fund
• Constrained by the limitation that the “Poverty Line” framework only takes recurrent cash
measures into account, the impact of the above measures could not be completely reflected in
the main poverty statistics, notwithstanding their massive scales and their effects on supporting
Hong Kong’s economy and relieving people’s financial pressures.
• Furthermore, the Chief Executive proposed in her 2020 Policy Address that a trial scheme will be
implemented in mid-2021 to provide cash allowance for around 90 000 eligible households which
have been waiting for PRH for more than three years, and that the Government is committed to
providing 15 000 units of transitional housing in the coming three years. The majority of these
measures, due to the same limitation, will also not be technically reflected in the poverty statistics
under the main analytical framework.
26
Main Analysis of the Poverty
Situation in 2019 –
Supplementary Information
Office of the Government Economist
Financial Secretary’s Office
Census and Statistics
Department
Supplementary information - Outline
(i) Recurrent government expenditure on
social welfare and measures not covered
in the main analytical framework
(ii) Further supplementary poverty statistics
taking into account non-recurrent cash
and/ or in-kind benefits
(iii) Further analyses on the poverty
situations of selected groups
28
29
(i) Recurrent government expenditure on
social welfare and measures not covered in
the main analytical framework
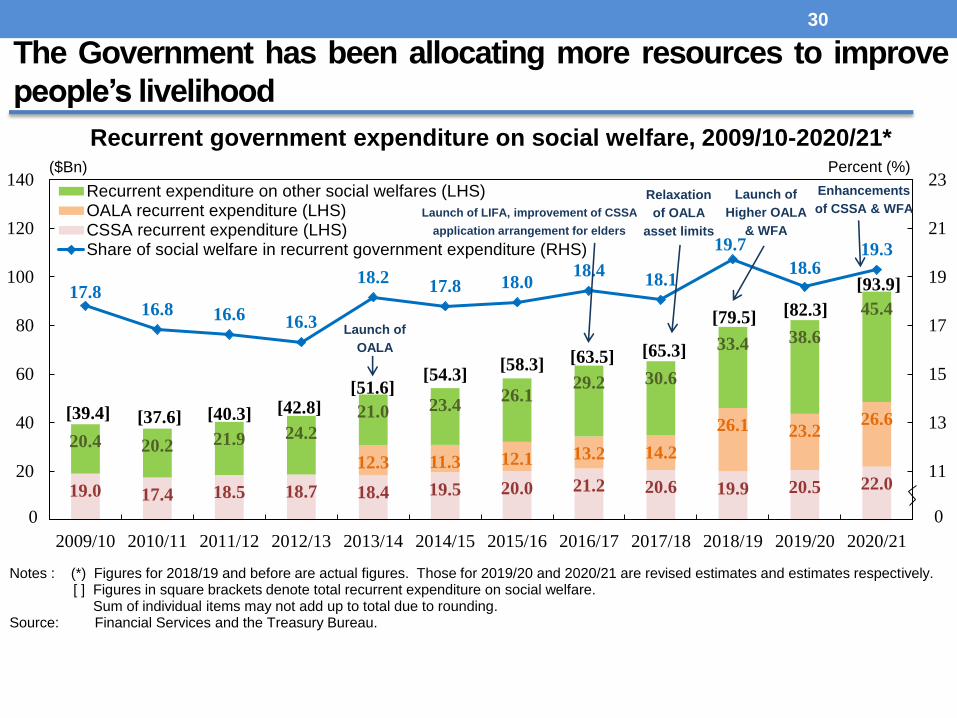
The Government has been allocating more resources to improve
people’s livelihood
30
Recurrent government expenditure on social welfare, 2009/10-2020/21*
19.0 17.4 18.5 18.7 18.4 19.5 20.0 21.2 20.6 19.9 20.5 22.0
12.3 11.3 12.1 13.2 14.2
26.1 23.226.6
20.4 20.2 21.9 24.2
21.0 23.4 26.1
29.2 30.6
33.4 38.6
45.4 17.8
16.8 16.6 16.3
18.217.8 18.0
18.418.1
19.7
18.619.3
9
11
13
15
17
19
21
23
0
20
40
60
80
100
120
140
2009/10 2010/11 2011/12 2012/13 2013/14 2014/15 2015/16 2016/17 2017/18 2018/19 2019/20 2020/21
Recurrent expenditure on other social welfares (LHS)OALA recurrent expenditure (LHS)CSSA recurrent expenditure (LHS)Share of social welfare in recurrent government expenditure (RHS)
($Bn) Percent (%)
00
Launch of
OALA
Launch of LIFA, improvement of CSSA
application arrangement for elders
Relaxation
of OALA
asset limits
Launch of
Higher OALA
& WFA
[39.4] [37.6] [40.3] [42.8][51.6]
[54.3][58.3] [63.5] [65.3]
[79.5]
Notes : (*) Figures for 2018/19 and before are actual figures. Those for 2019/20 and 2020/21 are revised estimates and estimates respectively.[ ] Figures in square brackets denote total recurrent expenditure on social welfare.
Sum of individual items may not add up to total due to rounding.Source: Financial Services and the Treasury Bureau.
[82.3]
[93.9]
Enhancements
of CSSA & WFA
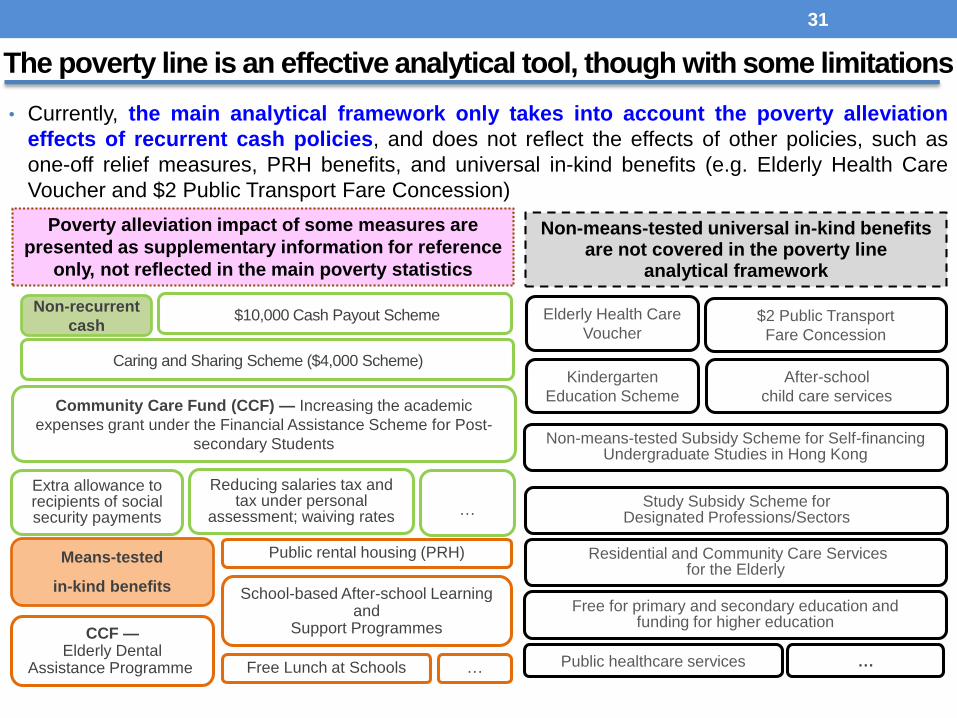
• Currently, the main analytical framework only takes into account the poverty alleviation
effects of recurrent cash policies, and does not reflect the effects of other policies, such as
one-off relief measures, PRH benefits, and universal in-kind benefits (e.g. Elderly Health Care
Voucher and $2 Public Transport Fare Concession)
31
Poverty alleviation impact of some measures are
presented as supplementary information for reference
only, not reflected in the main poverty statistics
Non-means-tested universal in-kind benefits are not covered in the poverty line
analytical framework
Non-recurrent
cash
Extra allowance to recipients of social security payments
Reducing salaries tax and tax under personal
assessment; waiving rates
Caring and Sharing Scheme ($4,000 Scheme)
Means-tested
in-kind benefits
CCF —Elderly Dental
Assistance Programme
Public rental housing (PRH) Residential and Community Care Services for the Elderly
Kindergarten
Education Scheme
School-based After-school Learning and
Support Programmes
$2 Public Transport
Fare Concession
Elderly Health Care
Voucher
Free Lunch at Schools
Community Care Fund (CCF) — Increasing the academic
expenses grant under the Financial Assistance Scheme for Post-
secondary Students
Study Subsidy Scheme for Designated Professions/Sectors
After-school
child care services
Free for primary and secondary education and funding for higher education
Public healthcare services
$10,000 Cash Payout Scheme
Non-means-tested Subsidy Scheme for Self-financing Undergraduate Studies in Hong Kong
……
…
The poverty line is an effective analytical tool, though with some limitations
32
(ii) Further supplementary poverty statistics
taking into account non-recurrent cash
and/ or in-kind benefits
33
The poverty rate taking into account all selected measures was 9.2%
in 2019, 0.1 percentage point lower than that in 2018
Poor
households
Poor
population
Poverty
rate
Post-intervention
(recurrent + non-recurrent cash +
in-kind benefits)
0.287 mn
(0.276 mn)
0.642 mn
(0.638 mn)
9.2%
(9.3%)
Post-intervention
(recurrent cash)
0.474 mn
(0.435 mn)
1.098 mn
(1.024 mn)
15.8%
(14.9%)
Pre-intervention
(purely theoretical assumption)
0.649 mn
(0.613 mn)
1.491 mn
(1.406 mn)
21.4%
(20.4%)
Post-intervention
(recurrent cash + non-recurrent
cash)
0.399 mn
(0.385 mn)
0.910 mn
(0.913 mn)
13.1%
(13.3%)
Post-intervention
(recurrent cash + in-kind benefits)
0.340 mn
(0.316 mn)
0.778 mn
(0.730 mn)
11.2%
(10.6%)
Poor households, poor population and poverty rates taking into account
recurrent, non-recurrent and/or in-kind measures, 2019
Note: ( ) Figures in parentheses refer to corresponding figures for 2018.
Source: General Household Survey, Census and Statistics Department.

48.0 50.6
34.926.8
16.15.5
70.861.9
8.415.0
30.9
15.1 14.68.4 4.2
55.3
40.4
4.1
0 10 20 30 40 50 60 70 80 90
CSSAhouseholds
Elderlyhouseholds
Single-parenthouseholds
New-arrivalhouseholds
Households withchildren
Youthhouseholds
Unemployedhouseholds
Economicallyinactive
households
Workinghouseholds
Poverty rate (%)
Social characteristics Economic characteristics
Source : General Household Survey, Census and Statistics Department.
17.8
11.2 9.7 11.5
32.0
15.8
9.36.5 5.2 6.8
19.7
9.2
0 5
10 15 20 25 30 35 40
Children agedbelow 18
Personsaged 18 to 64
Youthsaged 18-29
Personsaged 30-64
Elders aged65 and above
Overall
Recurrent cash All selected measures
Poverty rate (%)
:
Youthsaged 18 to 29
Persons aged 30 to 64
Of whom:
(a) By age
(b) By socio-economic group
The poverty rates improved further across all selected age and
socio-economic groups after intervention of all selected measures
34
Poverty rate after policy intervention (recurrent cash and all selected
measures) by selected group, 2019
35
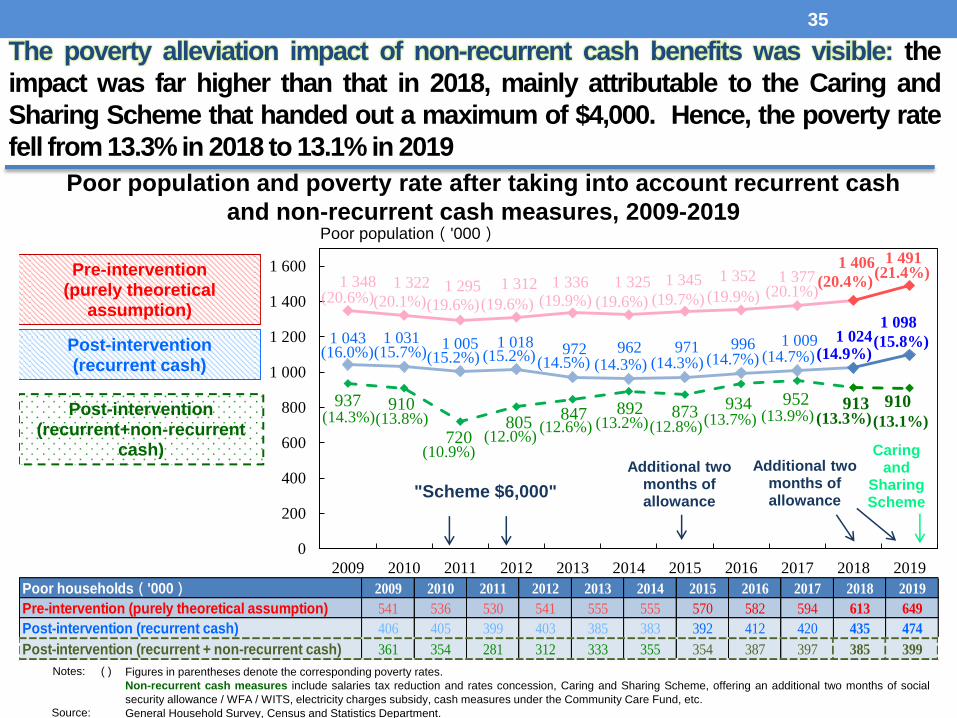
Poor population and poverty rate after taking into account recurrent cash
and non-recurrent cash measures, 2009-2019
The poverty alleviation impact of non-recurrent cash benefits was visible: the
impact was far higher than that in 2018, mainly attributable to the Caring and
Sharing Scheme that handed out a maximum of $4,000. Hence, the poverty rate
fell from 13.3% in 2018 to 13.1% in 2019
1 348 1 322 1 295 1 312 1 336 1 325 1 345 1 352 1 3771 406 1 491
1 043 1 031 1 005 1 018 972 962 971 996 1 009 1 0241 098
937 910
720 805
847 892 873 934 952 913 910
0
200
400
600
800
1 000
1 200
1 400
1 600
2009 2010 2011 2012 2013 2014 2015 2016 2017 2018 2019
(20.1%)(20.6%) (19.6%)
(16.0%)(15.7%)(15.2%)
(14.3%)
(19.6%)
(15.2%)
(13.8%)
(10.9%)(12.0%)
(19.9%)
(12.6%)
(14.5%)
Post-intervention(recurrent+non-recurrent
cash)
(13.2%)
(14.3%)
(19.6%) (19.7%)
(14.3%)
(12.8%)
(20.1%)
(14.7%)
(13.7%)
"Scheme $6,000"
(20.4%)
(14.7%)
(13.9%)
(19.9%)
(14.9%)
(13.3%)(13.1%)
(15.8%)
(21.4%)
Caring and
Sharing Scheme
Additional two months of allowance
Pre-intervention(purely theoretical
assumption)
Poor population('000)
Post-intervention(recurrent cash)
Additional two months of allowance
Notes: .( )
Source:
Figures in parentheses denote the corresponding poverty rates.
Non-recurrent cash measures include salaries tax reduction and rates concession, Caring and Sharing Scheme, offering an additional two months of social
security allowance / WFA / WITS, electricity charges subsidy, cash measures under the Community Care Fund, etc.
General Household Survey, Census and Statistics Department.
Poor households('000) 2009 2010 2011 2012 2013 2014 2015 2016 2017 2018 2019
Pre-intervention (purely theoretical assumption) 541 536 530 541 555 555 570 582 594 613 649
Post-intervention (recurrent cash) 406 405 399 403 385 383 392 412 420 435 474
Post-intervention (recurrent + non-recurrent cash) 361 354 281 312 333 355 354 387 397 385 399
36
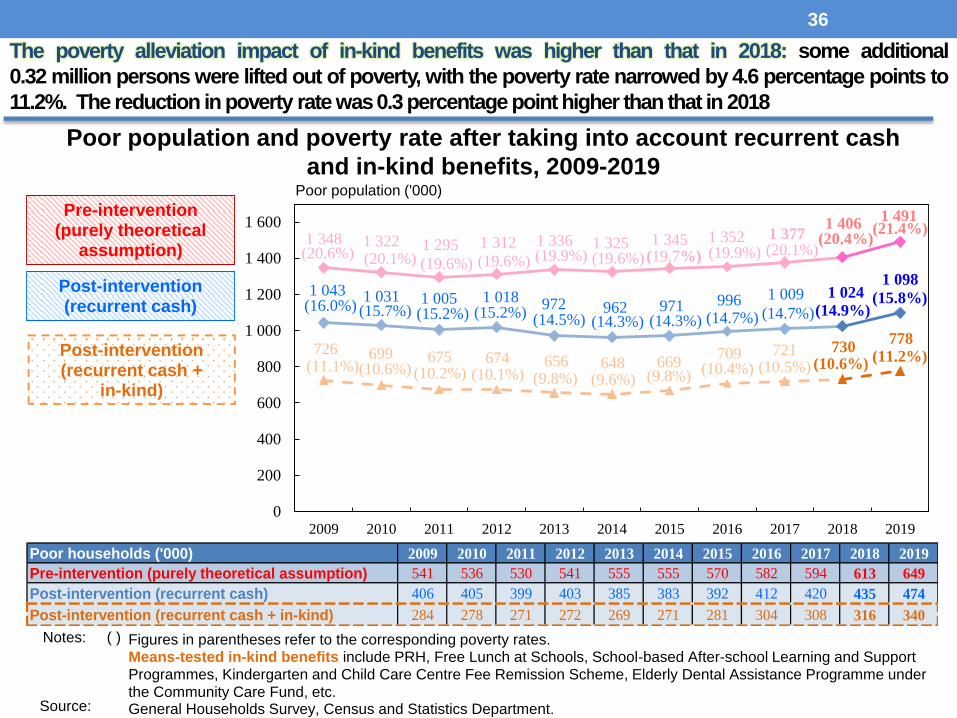
The poverty alleviation impact of in-kind benefits was higher than that in 2018: some additional
0.32 million persons were lifted out of poverty, with the poverty rate narrowed by 4.6 percentage points to
11.2%. The reduction in poverty rate was0.3 percentage point higher than that in 2018
Poor population and poverty rate after taking into account recurrent cash
and in-kind benefits, 2009-2019
1 348 1 322 1 295 1 312 1 336 1 325 1 345 1 352 1 3771 406
1 491
1 043 1 031 1 005 1 018 972 962 971 996 1 009 1 0241 098
726 699 675 674 656 648 669709 721 730
778
0
200
400
600
800
1 000
1 200
1 400
1 600
2009 2010 2011 2012 2013 2014 2015 2016 2017 2018 2019
(20.1%)(20.6%)(19.6%)
(16.0%) (15.7%) (15.2%)
(11.1%)
(19.6%)
(15.2%)
(10.6%) (10.2%) (10.1%)
(19.9%)
(14.5%)
(9.8%)
(14.3%)
(19.7%)
(9.8%)
(19.6%)
(14.3%)
(9.6%)
(19.9%)
(14.7%)
(10.4%)
(20.1%)
(14.7%)
(10.5%)
(14.9%)
(20.4%)
(10.6%)(11.2%)
(15.8%)
(21.4%)Pre-intervention
(purely theoretical assumption)
Post-intervention(recurrent cash)
Post-intervention (recurrent cash +
in-kind)
Poor population ('000)
Figures in parentheses refer to the corresponding poverty rates.Means-tested in-kind benefits include PRH, Free Lunch at Schools, School-based After-school Learning and Support Programmes, Kindergarten and Child Care Centre Fee Remission Scheme, Elderly Dental Assistance Programme under the Community Care Fund, etc.General Households Survey, Census and Statistics Department.
Notes: .( )
Source:
Poor households ('000) 2009 2010 2011 2012 2013 2014 2015 2016 2017 2018 2019
Pre-intervention (purely theoretical assumption) 541 536 530 541 555 555 570 582 594 613 649
Post-intervention (recurrent cash) 406 405 399 403 385 383 392 412 420 435 474
Post-intervention (recurrent cash + in-kind) 284 278 271 272 269 271 281 304 308 316 340
37
(iii) Further analyses on the poverty situations
of selected groups
38
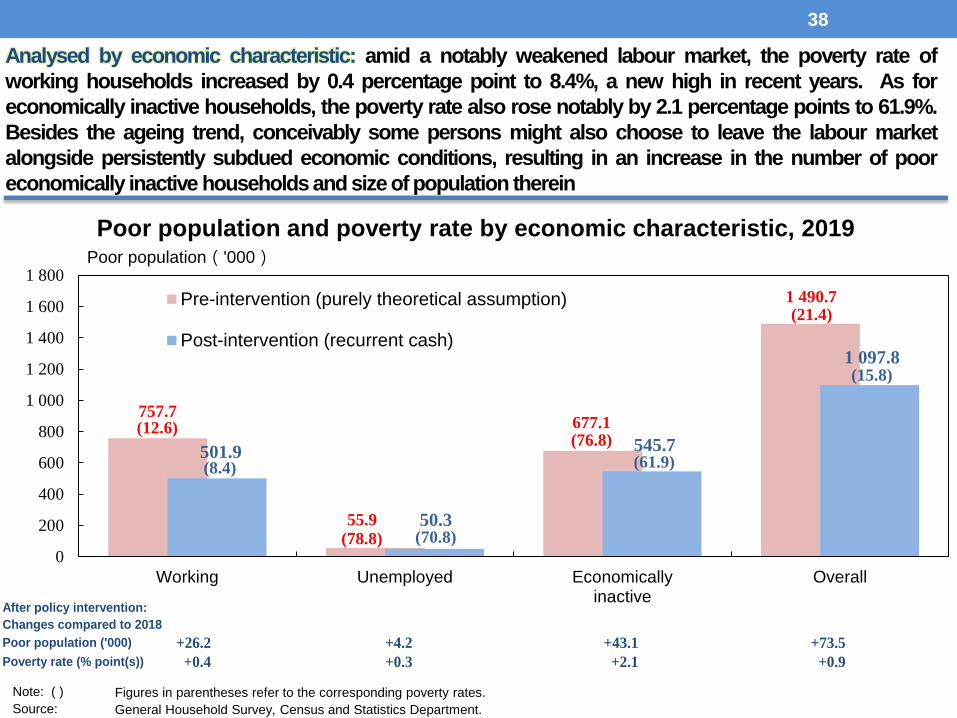
Analysed by economic characteristic: amid a notably weakened labour market, the poverty rate of
working households increased by 0.4 percentage point to 8.4%, a new high in recent years. As for
economically inactive households, the poverty rate also rose notably by 2.1 percentage points to 61.9%.
Besides the ageing trend, conceivably some persons might also choose to leave the labour market
alongside persistently subdued economic conditions, resulting in an increase in the number of poor
economically inactive households and size of population therein
Poor population and poverty rate by economic characteristic, 2019
757.7
55.9
677.1
1 490.7
501.9
50.3
545.7
1 097.8
0
200
400
600
800
1 000
1 200
1 400
1 600
1 800
Working Unemployed Economicallyinactive
Overall
Pre-intervention (purely theoretical assumption)
Post-intervention (recurrent cash)
Poor population('000)
(76.8)
(78.8)
(12.6)
(21.4)
(15.8)
(61.9)
(70.8)
(8.4)
Figures in parentheses refer to the corresponding poverty rates.
General Household Survey, Census and Statistics Department.
Note: ( )
Source:
After policy intervention:
Changes compared to 2018
Poor population ('000) +26.2 +4.2 +43.1 +73.5
Poverty rate (% point(s)) +0.4 +0.3 +2.1 +0.9
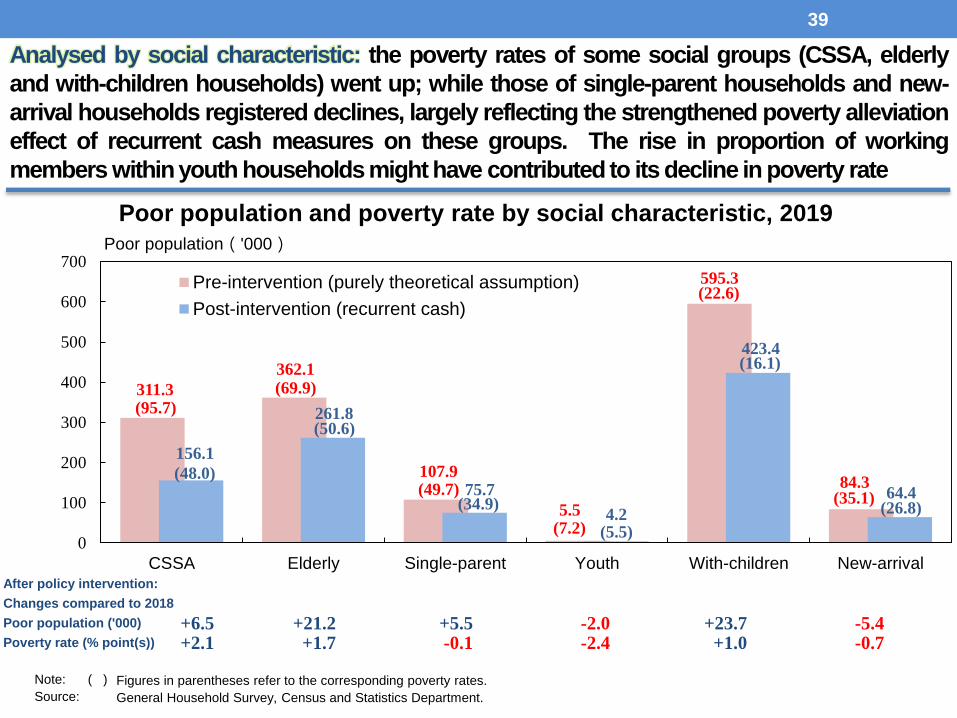
Analysed by social characteristic: the poverty rates of some social groups (CSSA, elderly
and with-children households) went up; while those of single-parent households and new-
arrival households registered declines, largely reflecting the strengthened poverty alleviation
effect of recurrent cash measures on these groups. The rise in proportion of working
members within youth households might have contributed to its decline in poverty rate
39
Poor population and poverty rate by social characteristic, 2019
311.3
362.1
107.9
5.5
595.3
84.3
156.1
261.8
75.7
4.2
423.4
64.4
0
100
200
300
400
500
600
700
CSSA Elderly Single-parent Youth With-children New-arrival
Pre-intervention (purely theoretical assumption)
Post-intervention (recurrent cash)
Poor population('000)
(95.7)
(69.9)
(35.1)
(22.6)
(7.2)
(49.7)(26.8)
(16.1)
(5.5)
(34.9)
(50.6)
(48.0)
Figures in parentheses refer to the corresponding poverty rates.
General Household Survey, Census and Statistics Department.
Note: ( )
Source:
After policy intervention:
Changes compared to 2018
Poor population ('000) +6.5 +21.2 +5.5 -2.0 +23.7 -5.4Poverty rate (% point(s)) +2.1 +1.7 -0.1 -2.4 +1.0 -0.7
284265 257 254 242 236 235 229 234 235 253
222 211 207 209 190 182 182 172 177 170 181
25.4 24.3 24.1 24.2 23.7 23.5 23.2 23.0 23.1 23.3 24.9
19.9 19.3 19.5 19.9 18.6 18.2 18.0 17.2 17.5 16.8 17.8
(40)
(30)
(20)
(10)
0
10
20
30
40
50
60
0
100
200
300
400
500
600
700
800
900
1 000
2009 2010 2011 2012 2013 2014 2015 2016 2017 2018 2019
數 列 3 數 列 2
數 列 4 數 列 1
Pre-intervention(purely theoretical assumption)
Poor population (LHS)Poverty rate (RHS)
Poor population ('000) Poverty rate (%)
Source: General Household Survey, Census and Statistics Department.
Post-intervention(recurrent cash)
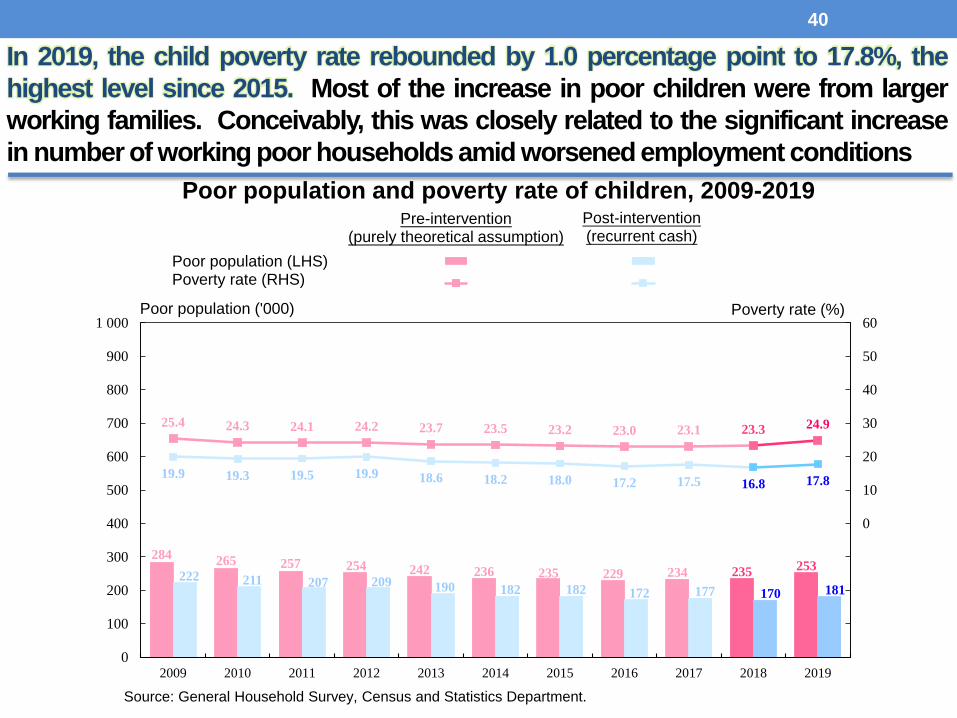
In 2019, the child poverty rate rebounded by 1.0 percentage point to 17.8%, the
highest level since 2015. Most of the increase in poor children were from larger
working families. Conceivably, this was closely related to the significant increase
in number of working poor households amid worsened employment conditions
40
Poor population and poverty rate of children, 2009-2019
32 32
1720
912
9 9
4 5
1 @
65
72
3.2 3.2
1.82.0
0.91.2
0.9 1.0
0.4 0.5
0.1 0.1
6.5
7.1
0
1
2
3
4
5
6
7
8
9
0
10
20
30
40
50
60
70
80Population ('000) (percentage point(s))
OALACSSA DAEducation benefits
LIFA/WFA All recurrent cash benefits
Post-intervention (recurrent cash)
OAA
Reduction in child poverty rate (RHS)
2018 2019
Reduction in the number of poor children (LHS)
2018 2019
Refer to children aged below 18 in households receiving the selected recurrent cash benefit(s).Less than 500 persons.General Household Survey, Census and Statistics Department.
Notes: (*)(@)
Source:
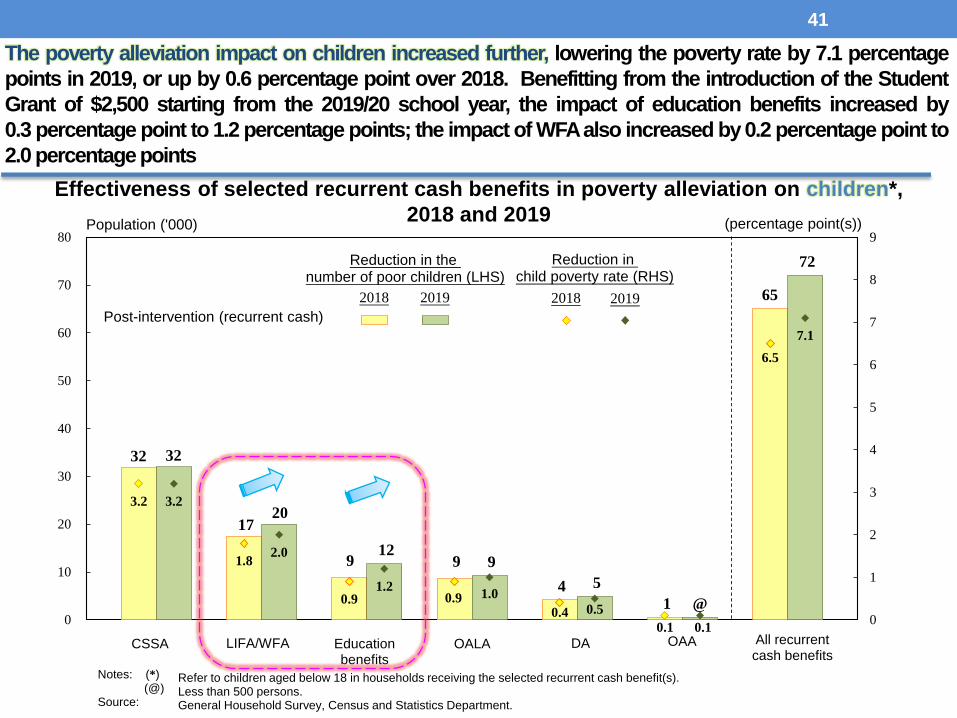
The poverty alleviation impact on children increased further, lowering the poverty rate by 7.1 percentage
points in 2019, or up by 0.6 percentage point over 2018. Benefitting from the introduction of the Student
Grant of $2,500 starting from the 2019/20 school year, the impact of education benefits increased by
0.3 percentage point to 1.2 percentage points; the impact of WFAalso increased by 0.2 percentage point to
2.0 percentage points
41
Effectiveness of selected recurrent cash benefits in poverty alleviation on children*,
2018 and 2019
366 377 378 388420 436
459478 495
517549
283 291 292 297 285 294 308337 340
360391
44.8 45.1 44.1 43.5 44.9 44.6 44.8 44.8 44.4 44.4 44.9
34.6 34.8 34.1 33.330.5 30.0 30.1 31.6 30.5 30.9 32.0
(40)
(30)
(20)
(10)
0
10
20
30
40
50
60
0
100
200
300
400
500
600
700
800
900
1 000
2009 2010 2011 2012 2013 2014 2015 2016 2017 2018 2019
數 列 3 數 列 2數 列 4 數 列 1
Pre-intervention(purely theoretical assumption)
Poor population (LHS)Poverty rate (RHS)
Post-intervention(recurrent cash)
Poor population ('000) Poverty rate (%)
Source: General Household Survey, Census and Statistics Department.
42
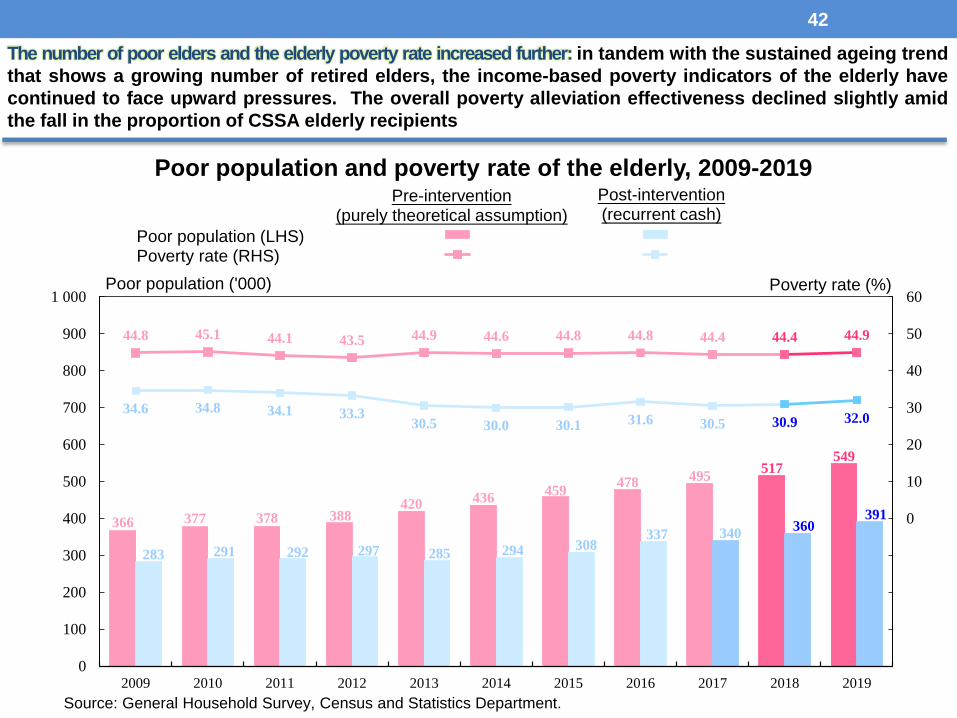
Poor population and poverty rate of the elderly, 2009-2019
The number of poor elders and the elderly poverty rate increased further: in tandem with the sustained ageing trend
that shows a growing number of retired elders, the income-based poverty indicators of the elderly have
continued to face upward pressures. The overall poverty alleviation effectiveness declined slightly amid
the fall in the proportion of CSSA elderly recipients
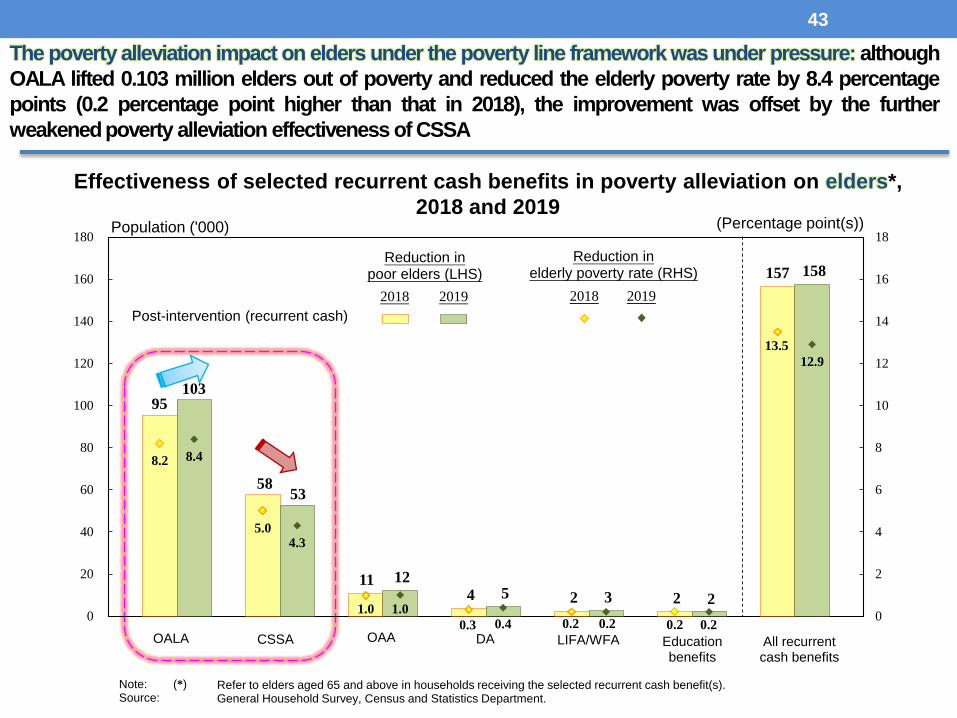
Effectiveness of selected recurrent cash benefits in poverty alleviation on elders*,
2018 and 2019
43
The poverty alleviation impact on elders under the poverty line framework was under pressure: although
OALA lifted 0.103 million elders out of poverty and reduced the elderly poverty rate by 8.4 percentage
points (0.2 percentage point higher than that in 2018), the improvement was offset by the further
weakenedpoverty alleviation effectiveness of CSSA
95103
5853
11 12
4 5 2 3 2 2
157 158
8.2 8.4
5.04.3
1.0 1.0
0.3 0.4 0.2 0.2 0.2 0.2
13.5
12.9
0
2
4
6
8
10
12
14
16
18
0
20
40
60
80
100
120
140
160
180
OALA CSSA DA Education benefits
LIFA/WFA All recurrent cash benefits
OAA
2018 20192018 2019
Population ('000) (Percentage point(s))
Reduction inpoor elders (LHS)
Reduction inelderly poverty rate (RHS)
Post-intervention (recurrent cash)
Note: (*) Source:
Refer to elders aged 65 and above in households receiving the selected recurrent cash benefit(s).General Household Survey, Census and Statistics Department.
The proportion of overall elders receiving Higher OALA was 38.0%.
Population figures refer to resident population. The source of these
figures is different from that in Chart (b).
Social Welfare Department; Demographic Statistics Section, Census
and Statistics Department.
Notes: (*)
Sources:
Before policy intervention (purely theoretical assumption), the
proportion of poor elders receiving Higher OALA was 45.2%.
General Household Survey, Census and Statistics Department.
Note: (*)
Source:
44
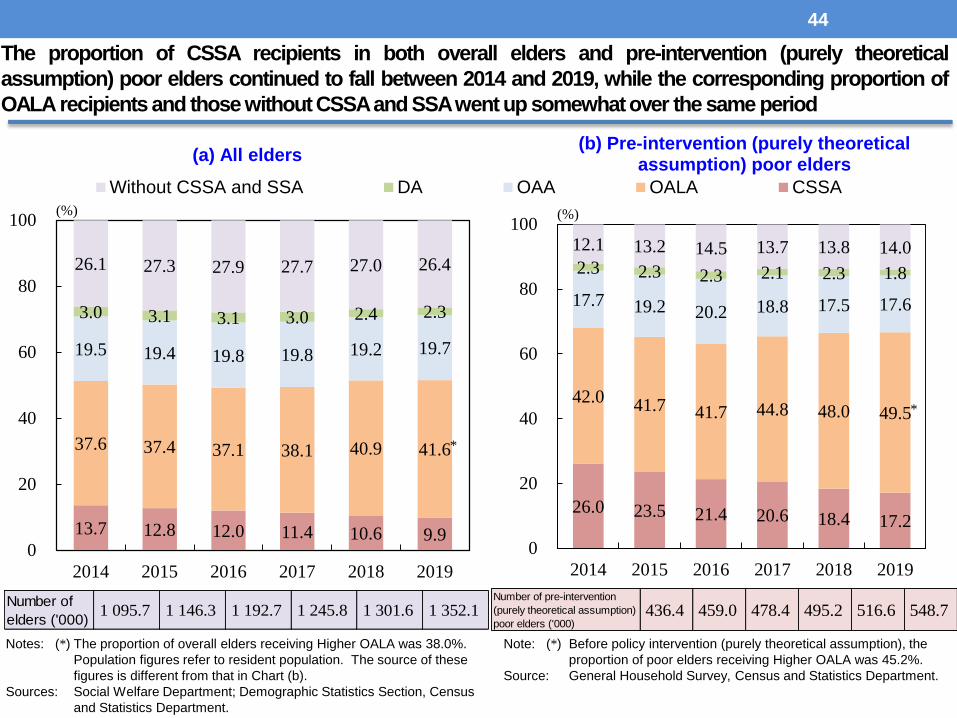
The proportion of CSSA recipients in both overall elders and pre-intervention (purely theoretical
assumption) poor elders continued to fall between 2014 and 2019, while the corresponding proportion of
OALA recipients and those without CSSAand SSAwent up somewhatover the same period
26.0 23.5 21.4 20.6 18.4 17.2
42.0 41.7 41.7 44.8 48.0 49.5
17.7 19.2 20.2 18.8 17.5 17.6
2.3 2.3 2.3 2.1 2.3 1.8
12.1 13.2 14.5 13.7 13.8 14.0
0
20
40
60
80
100
2014 2015 2016 2017 2018 2019
Without CSSA and SSA DA OAA OALA CSSA
(%)
(b) Pre-intervention (purely theoretical assumption) poor elders
(a) All elders
13.7 12.8 12.0 11.4 10.6 9.9
37.6 37.4 37.1 38.1 40.9 41.6
19.5 19.4 19.8 19.8 19.2 19.7
3.0 3.1 3.1 3.0 2.4 2.3
26.1 27.3 27.9 27.7 27.0 26.4
0
20
40
60
80
100
2014 2015 2016 2017 2018 2019
(%)
Number of
elders ('000)1 095.7 1 146.3 1 192.7 1 245.8 1 301.6 1 352.1
*
*
Number of pre-intervention
(purely theoretical assumption)
poor elders ('000)436.4 459.0 478.4 495.2 516.6 548.7
Aged 65 to 69111 300 persons
(28.5%)
Aged 70 and above279 800 persons
(71.5%)
16.3 17.5
39.2
53.4
24.2
2.4
1.6
42.2
3.3
0
20
40
60
80
100
Aged 65 to 69 Aged 70 and above
CSSA OALA
OAA DA
Without CSSA and SSA(%)
(b) Pre-intervention (purely theoretical assumption) poor elders
Figures in parentheses denote the corresponding proportion to overall poor elders.Figures in square brackets denote the poverty rate.General Household Survey, Census and Statistics Department.
Notes: ( )[ ]
Source:
(a) Post-intervention poor elders
[35.1%]
[26.3%]
Overall poor elders: 391 200 persons
150 700 persons 398 000 persons
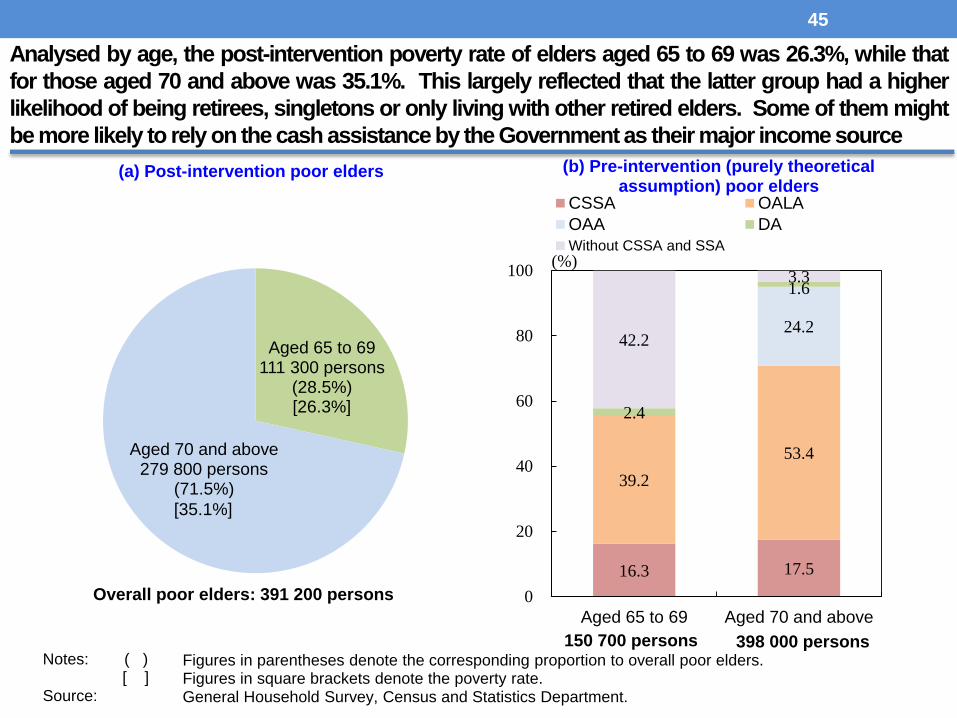
Analysed by age, the post-intervention poverty rate of elders aged 65 to 69 was 26.3%, while that
for those aged 70 and above was 35.1%. This largely reflected that the latter group had a higher
likelihood of being retirees, singletons or only living with other retired elders. Some of them might
be more likely to rely on the cash assistance by the Government as their major income source
45
46
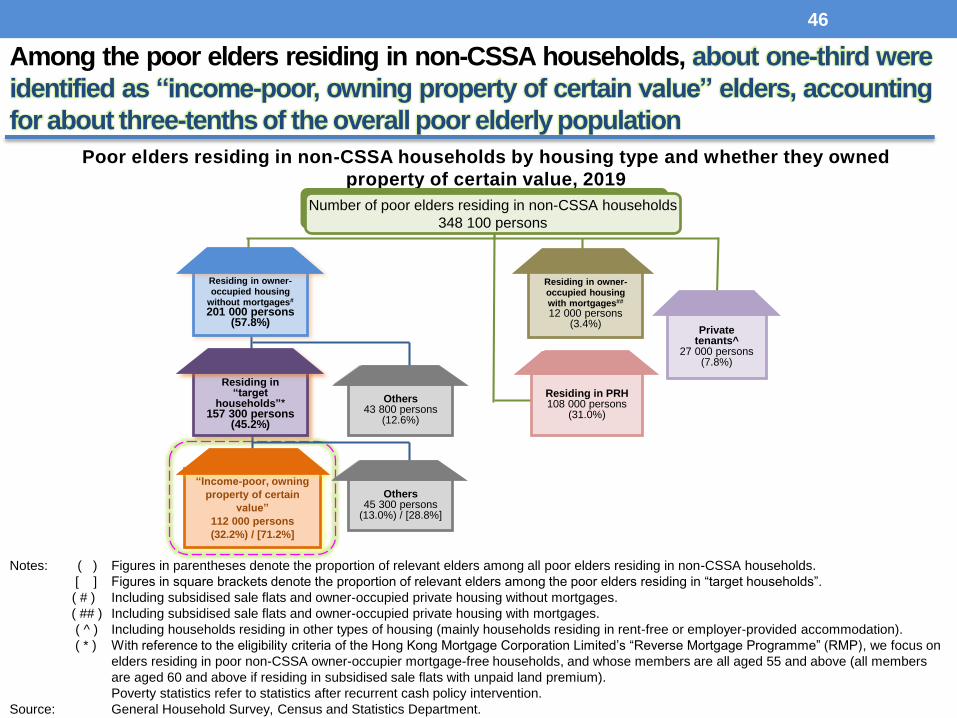
Among the poor elders residing in non-CSSA households, about one-third were
identified as “income-poor, owning property of certain value” elders, accounting
for about three-tenths of the overall poor elderly population
Notes: ( )
[ ]
( # )
( ## )
( ^ )
( * )
Source:
Figures in parentheses denote the proportion of relevant elders among all poor elders residing in non-CSSA households.
Figures in square brackets denote the proportion of relevant elders among the poor elders residing in “target households”.
Including subsidised sale flats and owner-occupied private housing without mortgages.
Including subsidised sale flats and owner-occupied private housing with mortgages.
Including households residing in other types of housing (mainly households residing in rent-free or employer-provided accommodation).
With reference to the eligibility criteria of the Hong Kong Mortgage Corporation Limited’s “Reverse Mortgage Programme” (RMP), we focus on
elders residing in poor non-CSSA owner-occupier mortgage-free households, and whose members are all aged 55 and above (all members
are aged 60 and above if residing in subsidised sale flats with unpaid land premium).
Poverty statistics refer to statistics after recurrent cash policy intervention.
General Household Survey, Census and Statistics Department.
Poor elders residing in non-CSSA households by housing type and whether they owned
property of certain value, 2019
Number of poor elders residing in non-CSSA households
348 100 persons
Residing in owner-occupied housing
without mortgages#
201 000 persons(57.8%)
Residing in owner-occupied housing with mortgages##
12 000 persons(3.4%)
Residing in PRH108 000 persons
(31.0%)
Private tenants^
27 000 persons(7.8%)
“Income-poor, owning
property of certain
value”
112 000 persons
(32.2%) / [71.2%]
Residing in “target
households”*157 300 persons
(45.2%)
Others43 800 persons
(12.6%)
Others45 300 persons
(13.0%) / [28.8%]
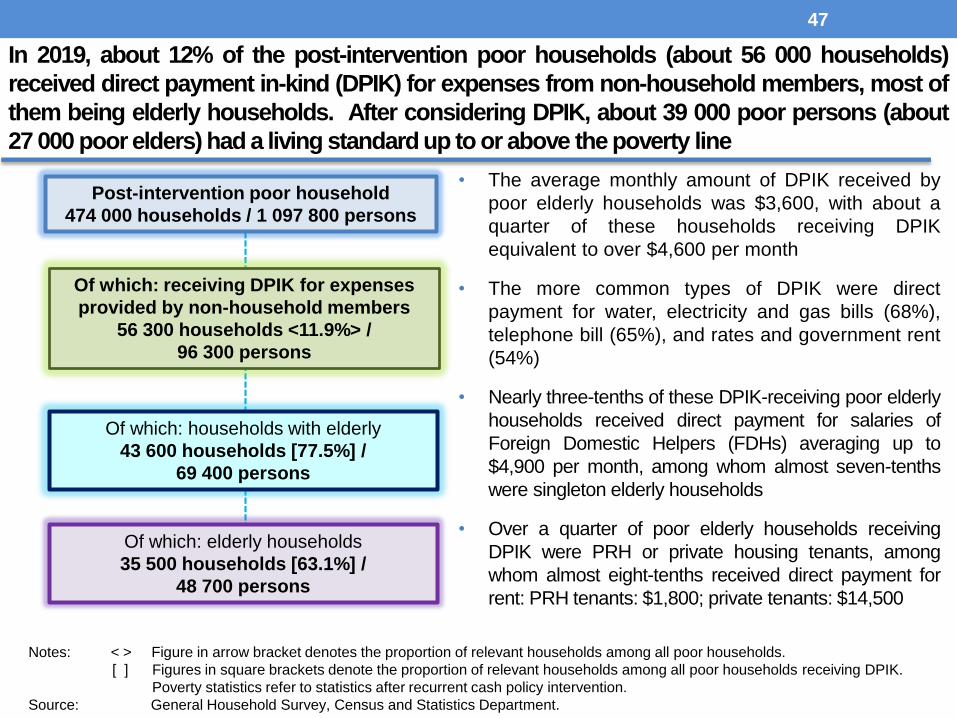
47
• The average monthly amount of DPIK received by
poor elderly households was $3,600, with about a
quarter of these households receiving DPIK
equivalent to over $4,600 per month
• The more common types of DPIK were direct
payment for water, electricity and gas bills (68%),
telephone bill (65%), and rates and government rent
(54%)
• Nearly three-tenths of these DPIK-receiving poor elderly
households received direct payment for salaries of
Foreign Domestic Helpers (FDHs) averaging up to
$4,900 per month, among whom almost seven-tenths
were singleton elderly households
• Over a quarter of poor elderly households receiving
DPIK were PRH or private housing tenants, among
whom almost eight-tenths received direct payment for
rent: PRH tenants: $1,800; private tenants: $14,500
In 2019, about 12% of the post-intervention poor households (about 56 000 households)
received direct payment in-kind (DPIK) for expenses from non-household members, most of
them being elderly households. After considering DPIK, about 39 000 poor persons (about
27 000 poor elders) had a living standard up to or above the poverty line
Of which: receiving DPIK for expenses
provided by non-household members
56 300 households <11.9%> /
96 300 persons
Post-intervention poor household
474 000 households / 1 097 800 persons
Of which: households with elderly
43 600 households [77.5%] /
69 400 persons
Of which: elderly households
35 500 households [63.1%] /
48 700 persons
Notes: < > Figure in arrow bracket denotes the proportion of relevant households among all poor households.
[ ] Figures in square brackets denote the proportion of relevant households among all poor households receiving DPIK.
Poverty statistics refer to statistics after recurrent cash policy intervention.
Source: General Household Survey, Census and Statistics Department.
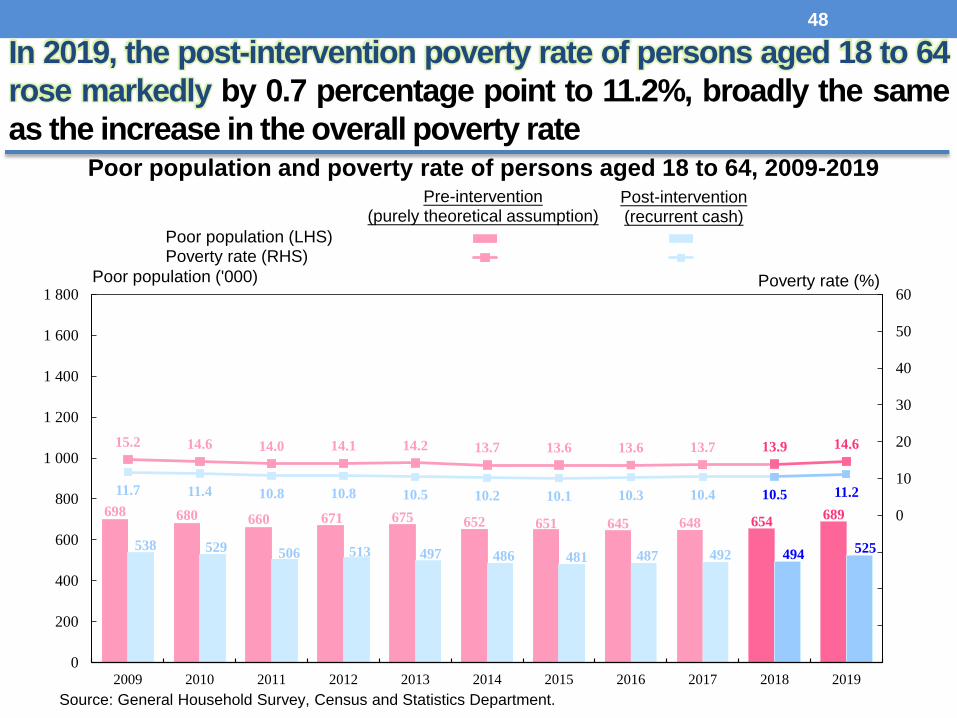
698 680 660 671 675 652 651 645 648 654689
538 529 506 513 497 486 481 487 492 494 525
15.2 14.6 14.0 14.1 14.2 13.7 13.6 13.6 13.7 13.9 14.6
11.7 11.4 10.8 10.8 10.5 10.2 10.1 10.3 10.4 10.5 11.2
(40)
(30)
(20)
(10)
0
10
20
30
40
50
60
0
200
400
600
800
1 000
1 200
1 400
1 600
1 800
2009 2010 2011 2012 2013 2014 2015 2016 2017 2018 2019
數 列 3 數 列 2數 列 4 數 列 1
Pre-intervention(purely theoretical assumption)
Poor population (LHS)Poverty rate (RHS)
Post-intervention(recurrent cash)
Poor population ('000) Poverty rate (%)
Source: General Household Survey, Census and Statistics Department.
48
In 2019, the post-intervention poverty rate of persons aged 18 to 64
rose markedly by 0.7 percentage point to 11.2%, broadly the same
as the increase in the overall poverty ratePoor population and poverty rate of persons aged 18 to 64, 2009-2019
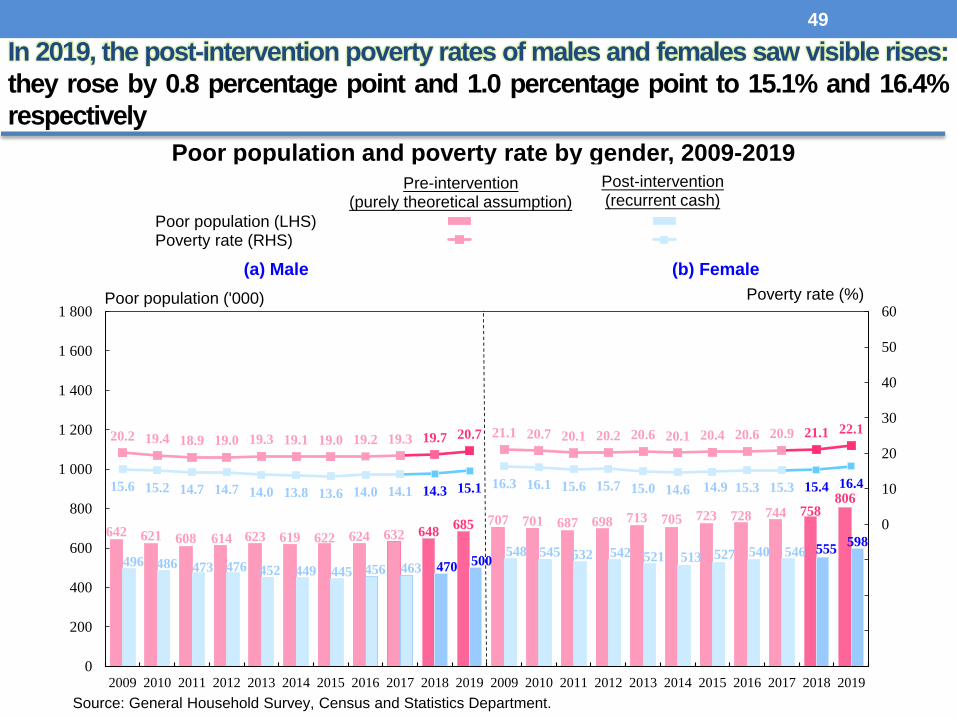
49
In 2019, the post-intervention poverty rates of males and females saw visible rises:
they rose by 0.8 percentage point and 1.0 percentage point to 15.1% and 16.4%
respectively
Poor population and poverty rate by gender, 2009-2019
642 621 608 614 623 619 622 624 632 648685 707 701 687 698 713 705 723 728 744 758
806
496 486 473 476 452 449 445 456 463 470 500548 545 532 542 521 513 527 540 546 555
598
20.2 19.4 18.9 19.0 19.3 19.1 19.0 19.2 19.3 19.7 20.7 21.1 20.7 20.1 20.2 20.6 20.1 20.4 20.6 20.9 21.1 22.1
15.6 15.2 14.7 14.7 14.0 13.8 13.6 14.0 14.1 14.3 15.1 16.3 16.1 15.6 15.7 15.0 14.6 14.9 15.3 15.3 15.4 16.4
(40)
(30)
(20)
(10)
0
10
20
30
40
50
60
0
200
400
600
800
1 000
1 200
1 400
1 600
1 800
2009 2010 2011 2012 2013 2014 2015 2016 2017 2018 2019 2009 2010 2011 2012 2013 2014 2015 2016 2017 2018 2019
數 列 3 數 列 2數 列 4 數 列 1
(a) Male (b) Female
Pre-intervention(purely theoretical assumption)
Poor population (LHS)Poverty rate (RHS)
Post-intervention(recurrent cash)
Poor population ('000) Poverty rate (%)
Source: General Household Survey, Census and Statistics Department.
50
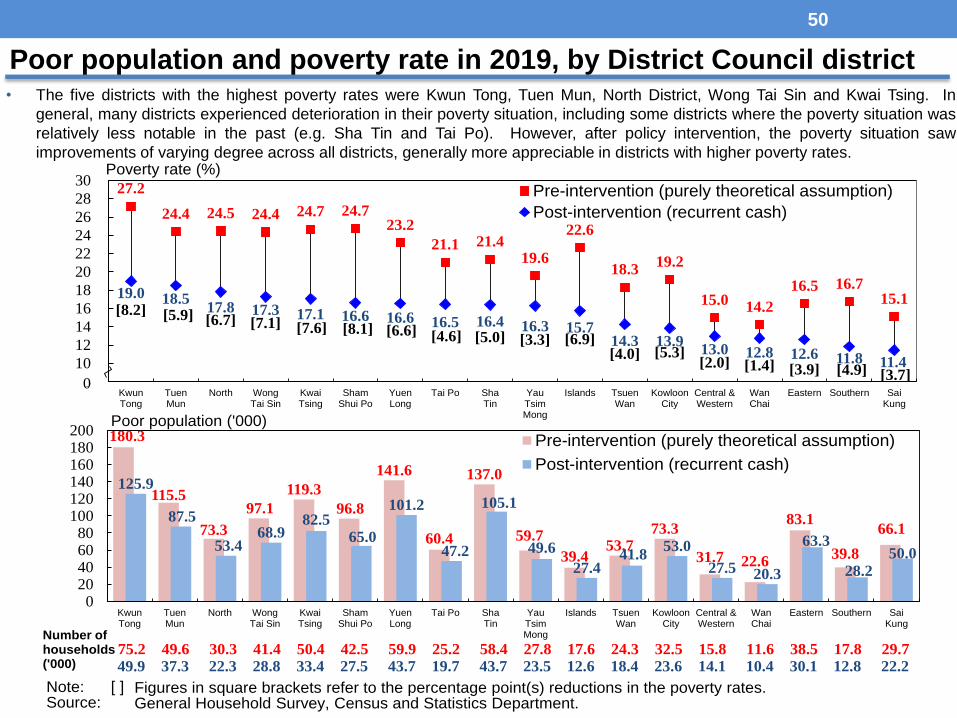
• The five districts with the highest poverty rates were Kwun Tong, Tuen Mun, North District, Wong Tai Sin and Kwai Tsing. In
general, many districts experienced deterioration in their poverty situation, including some districts where the poverty situation was
relatively less notable in the past (e.g. Sha Tin and Tai Po). However, after policy intervention, the poverty situation saw
improvements of varying degree across all districts, generally more appreciable in districts with higher poverty rates.
Poor population and poverty rate in 2019, by District Council district
180.3
115.5
73.3
97.1
119.3
96.8
141.6
60.4
137.0
59.7
39.4 53.7
73.3
31.7 22.6
83.1
39.8
66.1
125.9
87.5
53.4 68.9
82.5
65.0
101.2
47.2
105.1
49.6
27.4 41.8
53.0
27.5 20.3
63.3
28.2
50.0
0 20 40 60 80
100 120 140 160 180 200
KwunTong
TuenMun
North WongTai Sin
KwaiTsing
ShamShui Po
YuenLong
Tai Po ShaTin
YauTsimMong
Islands TsuenWan
KowloonCity
Central &Western
WanChai
Eastern Southern SaiKung
Pre-intervention (purely theoretical assumption)
Post-intervention (recurrent cash)
75.2 49.6 30.3 41.4 50.4 42.5 59.9 25.2 58.4 27.8 17.6 24.3 32.5 15.8 11.6 38.5 17.8 29.749.9 37.3 22.3 28.8 33.4 27.5 43.7 19.7 43.7 23.5 12.6 18.4 23.6 14.1 10.4 30.1 12.8 22.2
27.2
24.4 24.5 24.4 24.7 24.723.2
21.1 21.419.6
22.6
18.319.2
15.014.2
16.5 16.715.119.0 18.5
17.8 17.3 17.1 16.6 16.6 16.5 16.4 16.3 15.714.3 13.9
13.0 12.8 12.6 11.8 11.4
[8.2] [5.9] [6.7] [7.1] [7.6] [8.1] [6.6] [4.6] [5.0] [3.3] [6.9][4.0] [5.3]
[2.0] [1.4] [3.9] [4.9] [3.7]8
10
12
14
16
18
20
22
24
26
28
30
KwunTong
TuenMun
North WongTai Sin
KwaiTsing
ShamShui Po
YuenLong
Tai Po ShaTin
YauTsimMong
Islands TsuenWan
KowloonCity
Central &Western
WanChai
Eastern Southern SaiKung
Pre-intervention (purely theoretical assumption)
Post-intervention (recurrent cash)
0
Poor population ('000)
Poverty rate (%)
Number of households('000)
Figures in square brackets refer to the percentage point(s) reductions in the poverty rates.General Household Survey, Census and Statistics Department.
Note: [ ]Source: