Embed Size (px)
Citation preview

2012 Annual ReportGINEBRA SAN MIGUEL INC.
A SUBSIDIARY OFSAN MIGUEL CORPORATION
25Y E A R S
2012 Annual ReportGINEBRA SAN MIGUEL INC.
A SUBSIDIARY OFSAN MIGUEL CORPORATION
25Y E A R S
GIN
EBRA
SAN
MIG
UEL IN
C.
2012 A
NN
UA
L REPO
RT

Table of Contents
02
01
04
06
08
10
14
15
21
22
MESSAGE TO STOCKHOLDERS
FINANCIAL HIGHLIGHTS
PORTFOLIO OF LIQUOR BRANDS
PORTFOLIO OF NON-ALCOHOLIC BEVERAGES
CORPORATE SOCIAL RESPONSIBILITY
BOARD OF DIRECTORS
CORPORATE GOVERNANCE
REPORT OF THE AUDIT COMMITTEE
FINANCIAL STATEMENTS
MAXIMIZING SYNERGIES
P14,559,183
NET SALES
2012
2011 P15,112,596
NET INCOME (LOSS)
2012
2011
(P849,200)
(P982,160)
STOCKHOLDERS’ EQUITY
2012
2011
Basic Earnings Per Share1
2012
2011
Stockholders’ Equity Per Share1
2012
2011
P6,482,920
P7,338,083
(P3.10)
(P3.56)
P20.08
P22.72
Financial Highlights(In Thousands Pesos, Except Per Share Data)
1Based on the number of shares outstanding at the end of each year
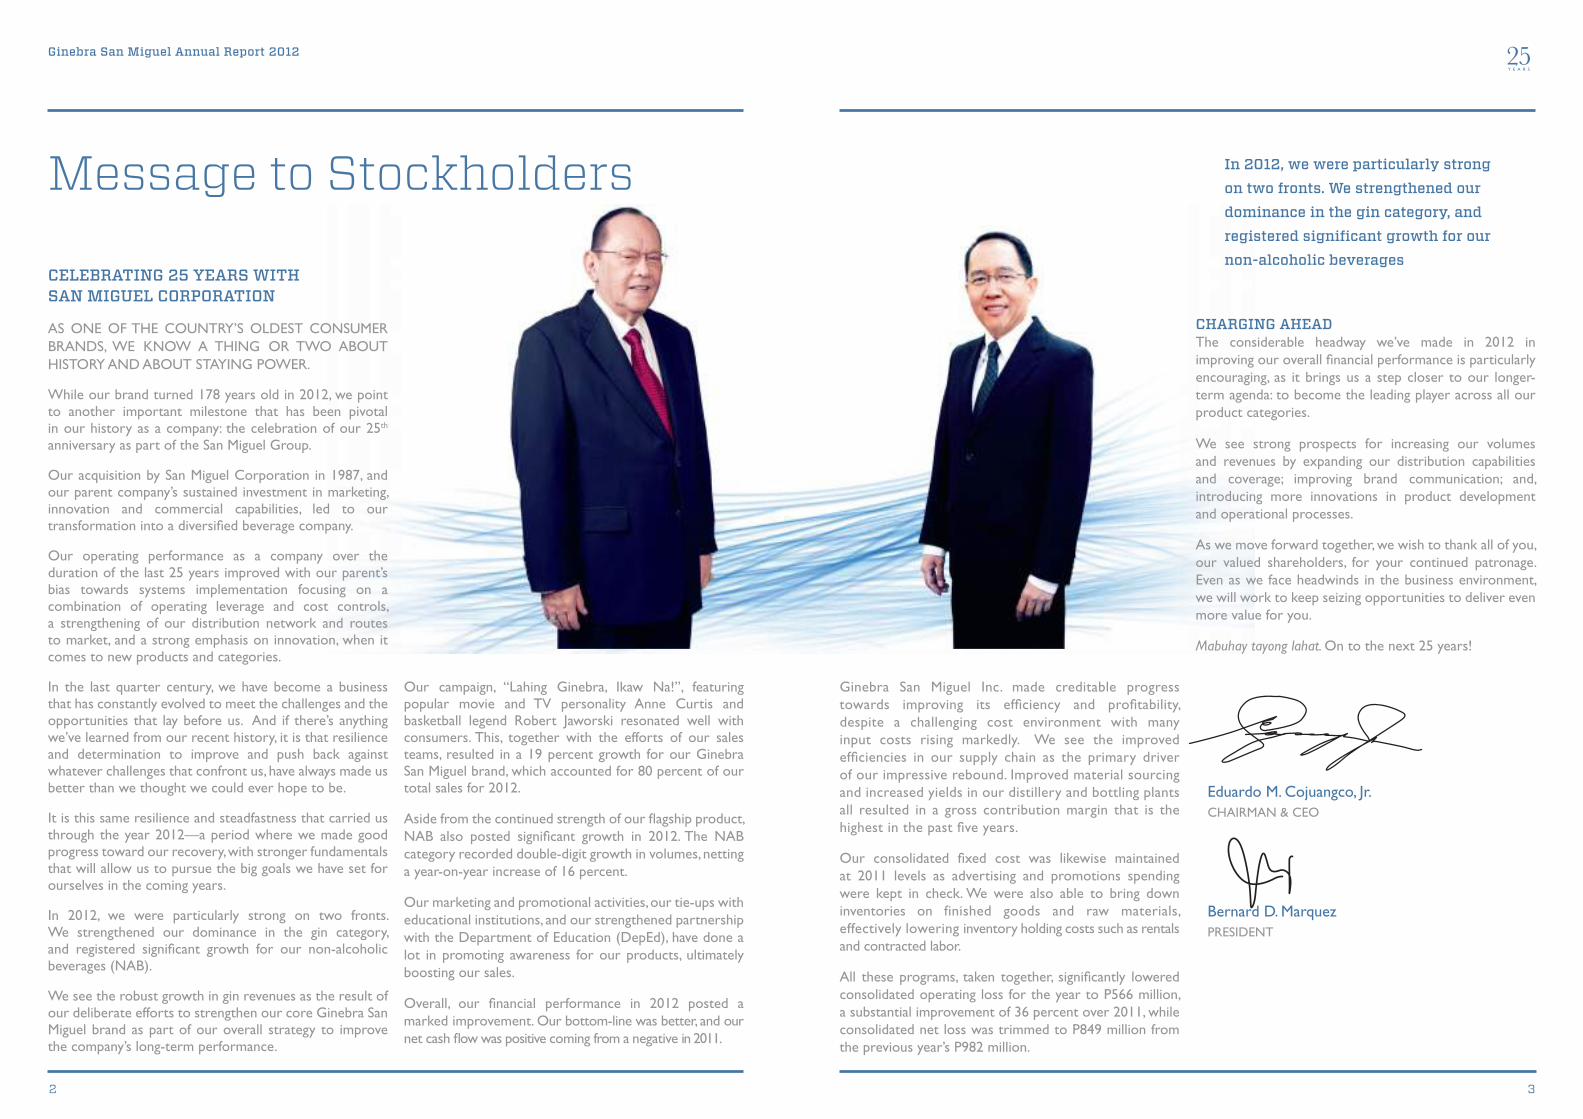
CELEBRATING 25 YEARS WITH SAN MIGUEL CORPORATION
AS ONE OF THE COUNTRY’S OLDEST CONSUMER BRANDS, WE KNOW A THING OR TWO ABOUT HISTORY AND ABOUT STAYING POWER.
While our brand turned 178 years old in 2012, we point to another important milestone that has been pivotal in our history as a company: the celebration of our 25th anniversary as part of the San Miguel Group.
Our acquisition by San Miguel Corporation in 1987, and our parent company’s sustained investment in marketing, innovation and commercial capabilities, led to our transformation into a diversifi ed beverage company.
Our operating performance as a company over the duration of the last 25 years improved with our parent’s bias towards systems implementation focusing on a combination of operating leverage and cost controls, a strengthening of our distribution network and routes to market, and a strong emphasis on innovation, when it comes to new products and categories.
In the last quarter century, we have become a business that has constantly evolved to meet the challenges and the opportunities that lay before us. And if there’s anything we’ve learned from our recent history, it is that resilience and determination to improve and push back against whatever challenges that confront us, have always made us better than we thought we could ever hope to be.
It is this same resilience and steadfastness that carried us through the year 2012—a period where we made good progress toward our recovery, with stronger fundamentals that will allow us to pursue the big goals we have set for ourselves in the coming years.
In 2012, we were particularly strong on two fronts. We strengthened our dominance in the gin category, and registered signifi cant growth for our non-alcoholic beverages (NAB).
We see the robust growth in gin revenues as the result of our deliberate efforts to strengthen our core Ginebra San Miguel brand as part of our overall strategy to improve the company’s long-term performance.
Our campaign, “Lahing Ginebra, Ikaw Na!”, featuring popular movie and TV personality Anne Curtis and basketball legend Robert Jaworski resonated well with consumers. This, together with the efforts of our sales teams, resulted in a 19 percent growth for our Ginebra San Miguel brand, which accounted for 80 percent of our total sales for 2012.
Aside from the continued strength of our fl agship product, NAB also posted signifi cant growth in 2012. The NAB category recorded double-digit growth in volumes, netting a year-on-year increase of 16 percent.
Our marketing and promotional activities, our tie-ups with educational institutions, and our strengthened partnership with the Department of Education (DepEd), have done a lot in promoting awareness for our products, ultimately boosting our sales.
Overall, our fi nancial performance in 2012 posted a marked improvement. Our bottom-line was better, and our net cash fl ow was positive coming from a negative in 2011.
Ginebra San Miguel Inc. made creditable progress towards improving its effi ciency and profi tability, despite a challenging cost environment with many input costs rising markedly. We see the improved effi ciencies in our supply chain as the primary driver of our impressive rebound. Improved material sourcing and increased yields in our distillery and bottling plants all resulted in a gross contribution margin that is the highest in the past fi ve years.
Our consolidated fi xed cost was likewise maintained at 2011 levels as advertising and promotions spending were kept in check. We were also able to bring down inventories on finished goods and raw materials, effectively lowering inventory holding costs such as rentals and contracted labor.
All these programs, taken together, signifi cantly lowered consolidated operating loss for the year to P566 million, a substantial improvement of 36 percent over 2011, while consolidated net loss was trimmed to P849 million from the previous year’s P982 million.
CHARGING AHEAD The considerable headway we’ve made in 2012 in improving our overall fi nancial performance is particularly encouraging, as it brings us a step closer to our longer-term agenda: to become the leading player across all our product categories.
We see strong prospects for increasing our volumes and revenues by expanding our distribution capabilities and coverage; improving brand communication; and, introducing more innovations in product development and operational processes.
As we move forward together, we wish to thank all of you, our valued shareholders, for your continued patronage. Even as we face headwinds in the business environment, we will work to keep seizing opportunities to deliver even more value for you.
Mabuhay tayong lahat. On to the next 25 years!
Eduardo M. Cojuangco, Jr.CHAIRMAN & CEO
Bernard D. MarquezPRESIDENT
In 2012, we were particularly strong on two fronts. We strengthened our dominance in the gin category, and registered signifi cant growth for our non-alcoholic beverages
Ginebra San Miguel Annual Report 2012 25Y E A R S
2 3
Message to Stockholders

Ginebra San Miguel Annual Report 2012
4 5
25Y E A R S
Since joining San Miguel Corporation 25 years ago, we have since evolved into a total beverage company with a diverse liquor and non-alcoholic beverage portfolio.
Today, our strategies revolve around maximizing synergies between our core and newer markets by launching innovative campaigns and products to re-assert our position in the industry.
“Lahing Ginebra, Ikaw Na!”, our omnibus campaign for our flagship Ginebra San Miguel, contributed greatly to the company’s strong showing in 2012.
Designed to be an empowering call to arms for “the new working class,” Lahing Ginebra’s homage to the history and heritage of the company and the brand resonated well with consumers. Lahing Ginebra Ginuman Fest concerts drew estimated crowds of 10,000 per event.
The campaign headlined a roster of brand ambassadors, among them: Robert “Big J” Jaworski, Georgina Wilson, Jhong Hilario, Jugs Jugueta, Teddy Corpuz and Manny
Pacquiao for Ginebra San Miguel; Anne Curtis for G.S.M. Blue; Maja Salvador and Kean Cipriano for G.S.M. Blue Light; Dingdong Dantes for Gran Matador Rich & Smooth; Paulo Avelino for Gran Matador Light, and Solenn Heussaff for Antonov Vodka.
We launched “Orig na Ginebra”, a TV campaign that paid homage to the “living legend”, former Ginebra playing coach Robert Jaworski, and also supported the Philippine Basketball Association’s programs related to the retirement of his iconic no. 7 basketball jersey.
The launch of a new range of flavored, low-proof Ginebra-based gin products also helped revitalize the image of gin among younger consumers. Ginebra San Miguel Flavored Gin in Melon and Dalandan flavors in Angelito bottles; G.S.M. Blue Light and G.S.M. Blue Flavors in Apple, Lychee, Brown Coffee and Mojito varieties, are just a few of the new and exciting additions to the GSM range.
At the same time, G.S.M. Blue continued to hold its highly popular signature events. G.S.M. Blueniversity, a series of mixology seminars held in schools nationwide aimed at teaching Hotel and Restaurant Management students the rudiments of bartending and entertaining with flair, was complemented by its showcase event, the G.S.M. Blue Flair
Maximizing Synergies
Idol contest. Launched in 2007, the flairtending contest has been attracting more and more participants each year and is showing no signs of slowing down.
Rounding out these efforts are the launch of Gran Matador Rich & Smooth; Antonov Vodka Mixed Drinks Cosmopolitan, Kamikaze and Ginger Ale; and Antonov Vodka Schnapps Espresso and Currant.
Other activations and events such as the “Bagong Taon, Bagong Milyon” consumer promo, the “Gran Matador Light Concert Series”, “Antonov Vodka Mixed Drink Bar Tour”, “Let’s Play Ginebra Logo” and “Lucky 7, Win 11 Promo” also contributed to the company’s improved performance.
All of these were promoted across multimedia, with increasing exposure in social media.
For 2013, the company will sustain last year’s gains through the launch of a reinforced “Lahing Ginebra” corporate campaign that highlights the breadth of the GSMI portfolio.
NON-ALCOHOLIC BEVERAGES Activations and consumer promos for our non-alcoholic beverages (NAB) in 2012 were focused on tying in the brands with the company’s social responsibility programs.
Among NAB’s key efforts is the “Iba ang Sigla” campaign, which was done in partnership with the Department of Education (DepEd). Spearheaded by Magnolia Healthtea and Magnolia Fruit Drink, the nationwide school caravan distributed workbooks that promote health and wellness to 20 schools nationwide.
This was complemented by a number of TV “situmercials,” radio and print materials for Magnolia Powdered Fruit Drink featuring actress Jodi Sta. Maria and son Thirdy, and radio, print and out-of-home (OOH) materials for Magnolia Powdered Healthtea, featuring Zia Quizon as brand ambassador.
Magnolia Purewater, on the other hand, teamed-up with the Department of Tourism to promote the “It’s More Fun in the Philippines” campaign highlighting the country’s top tourism destinations — Boracay, Palawan and Manila. Likewise, the brand supported the tourism campaign of the Provincial Government of Albay through the launch of the “Magnolia Purewater 360 Ultra Marathon.”
ENGAGING CONSUMERS IS AT THE HEART OF GINEBRA SAN MIGUEL INC.’S (GSMI) MARKETING STRATEGY, ONE OF THE KEY DRIVERS OF THE COMPANY’S IMPROVED PERFORMANCE IN 2012.

Ginebra San Miguel Annual Report 2012
6 7
25Y E A R S
Portfolio of Liquor Brands
Angelito (250ml)Bilog (350ml)Frasquito (350ml)Frasco (700ml)
Dalandan, Melon (250ml)
Solo (350ml)Long Neck (700ml)Litro (1000ml)
Solo (350ml)Long Neck (700ml)Litro (1000ml)
Solo (350ml)Long Neck (700ml)Litro (1000ml)
Solera Gran Reserva (700ml)
Classic (700ml)
Currant, Espresso (700ml)
(700ml)
Lime, Grenadine, Strawberry, Blue Curacao, Triple Sec (700ml)
(700ml)
(for export only) Gold, Silver, Dark (700ml)
Classic (350ml)Long Neck (700ml)
(375ml)
Kamikaze, Ginger Ale, Apple, Mandarin Orange, Ice, Cosmopolitan (330ml)
Long Neck (700ml)
Apple, Lychee, Mojito, Brown Coffee Long Neck (700ml)
(350ml)
(750ml)
Ginebra San MiguelFlavors
Ginebra San Miguel
Ginebra San MiguelPremium Gin
Ginebra San MiguelFiesta Bilog Bottle
Antonov Vodka
Antonov Vodka Schnapps
Antonov Vodka Mixed Drink
St. George Premium Whisky
Mixx
Don Enrique Mixkila
Tondeña Manila Rum
Vino Kulafu Añejo Rum Oro
Gran Matador Rich & Smooth
Gran Matador Gran Matador Light
G.S.M. Blue G.S.M. Blue Light
G.S.M. Blue Flavors

9
25Y E A R S
Ginebra San Miguel Annual Report 2012
8
Portfolio of Non-Alcoholic Beverages
Grape, Orange, and PineappleReturnable glass bottle (250ml)PET bottle (355ml)
Four Seasons and PapayaPET bottle (355ml)
Apple, Lemon, and StrawberryPET bottle (355ml)Returnable glass bottle (250ml)
Apple, Lemon, Mango (400g, 45g)
PET(355ml, 500ml, 1000ml)
Apple Cranberry, Morning Start, Multi-V (2.4L)
Calamansi, Orange-Mango, Lemon, Orange, Pineapple (35g, 400g)
Magnolia Healthtea
Magnolia Fruit Drink
Magnolia Life Drink
Magnolia Fruit Drink (Powdered)
Magnolia Purewater
Berri (natural fruit juices)
Magnolia Healthtea (Powdered)

10 11
Ginebra San Miguel Annual Report 2012 25Y E A R S
The way we do business has always been guided by our mandate to impact our communities in a positive way.
We believe that giving value to our shareholders includes upholding our commitment to good corporate citizenship—finding ways to uplift our countrymen’s quality of life, and doing our share in making the Filipino dream a reality.
VALUING EDUCATION Recognizing the critical role of education plays in building better communities, GSMI has sent more than a hundred underprivileged youths to school.
Our CSR program on education, our flagship project, grants scholarships to students enrolled in full-time college courses and technical vocational programs. Many of our scholars go on to work at our own facilities.
Corporate Social Responsibility
To celebrate our silver anniversary as a subsidiary of San Miguel Corporation in 2012, we awarded technical-vocational scholarships to 25 underprivileged students under the “25@25” CSR program.
Launched in partnership with the San Miguel Foundation and the Technical Education and Skills Development Authority (TESDA), the program aims to provide beneficiaries with skills in welding, information technology, food and beverage preparation, bartending, and baking and pastry production, among others.
Each scholar received a financial grant covering tuition and related expenses. Candidates chosen were high school graduates 25 years old and below, from a family whose per capita income was not more than P10,000 per month, and who passed written examinations and oral interviews.
To complement these efforts, the company also provided further support in the form of classroom repairs, the donation of educational materials and computers, and
honoraria for day-care teachers in its various host communities.
At the same time, the company partnered with parent company SMC and private foundation AGAPP (Aklat, Gabay, Aruga tungo sa Pag-angat at Pag-asa), to build library-cum-classrooms in public schools in disadvantaged communities. In 2012, we turned over classrooms to Pilar Elementary School in Capiz and Cangalwang Elementary School in Siquijor.
These initiatives form part of our efforts to make a meaningful difference in the lives of our kabarangay.
We see giving back as part of the GSMI heritage, and we remain committed to growing our business consistently and responsibly, mindful of the impact of our operations to the well-being of future generations.
We believe that giving value to our shareholders includes
upholding our commitment to good corporate citizenship
CORPORATE SOCIAL RESPONSIBILITY (CSR) HAS LONG BEEN PART OF THE DAY-TO-DAY OPERATIONS OF OUR MANUFACTURING PLANTS IN CABUYAO, STA. BARBARA, MANDAUE, AND BAGO CITY, AND IS DEEPLY INGRAINED IN OUR CORPORATE CULTURE.

12 13
Ginebra San Miguel Annual Report 2012 25Y E A R S
“The scholarship given to me by GSMI was a valuable gift that encouraged me to pursue my dreams. It gave
me the opportunity to enroll in a Diploma program for Environment and Natural Resource Management,
and obtain units in Masters in Environment and Natural Resource Management. My success would not have
been possible if not for this scholarship. As I work towards promoting environmental sustainability in my own
small way, and as I continue fulfilling my personal and professional goals, I look forward to being able to pay
forward the precious gift that I have received from your company.”
GSMI Scholars Testimonials
“Your generosity has truly inspired young people like me and my fellow former scholars to persevere,
work hard, and be the best in what we do. You’ve made an impact in our lives…”
is an Agricultural Technologist at the City Environment and Natural Resources
Office of San Fernando, La Union. She graduated with a degree in BS Environmental
Science (1996-2000) at Benguet State University in La Trinidad, Benguet.
is a Senior Failure Analysis Engineer at NXP Semiconductors (formerly
Philips Semiconductors) at Kaohsiung City, Taiwan. He graduated with
a degree in BS Electronics and Communications Engineering (2000-
2003) at the University of St. La Salle, Bacolod City.
BERNADETTE LUCAS-VALDEZ
WILFORD PAUL OGHAYON
“The scholarship changed my life. Thank you for supporting my goals and helping me achieve my dreams.
GSMI’s support has been my inspiration in helping others. Allow me to borrow the words of Pangasinan
Congresswoman Kimi Cojuangco which I have embraced: ‘We have been moving mountains long before we
knew we could! Why? Because we believe. We have faith, we believe. We will continue to believe. We will
continue to have faith so we can make lives of people better…’”
works at the Office of public servants of former Congressman Mark Cojuangco and
Congresswoman Kimi Cojuangco of the 5th District of Pangasinan. She graduated
with a degree in BS Information Technology (1996-2000) at Pangasinan State
University College of Engineering & Technology, Urdaneta City.
RHODORA ALCAIDE- MANAOIS

Ginebra San Miguel Annual Report 2012
14 15
25Y E A R S
Corporate Governance
BOARD OF DIRECTORS Compliance with the principles of good corporate governance starts with the Company’s Board of Directors (“Board”). The Board shall have oversight responsibilities for ensuring the presence of adequate and effective control mechanisms in the Company and is primarily responsible for promoting the Company’s long-term success and sustaining competitiveness in a manner consistent with its fiduciary responsibility, which it shall exercise in the best interest of the Company, its stockholders and other stakeholders.
Conformably with the duty and responsibility of the Board as specified in the Company’s Amended Manual on Corporate Governance (“CG Manual”), all the incumbent directors have attended a seminar on Corporate Governance.
Board of DirectorsEduardo M. CojuangCo, jr.ChairMan & CEo
raMon S. angViCE ChairMan
BErnard d. MarquEzPrESidEnt
Board MEMBErS
LEo S. aLVEzgaBriEL S. CLaudioFErdinand K. ConStantinoroBErto V. ongPinMinita V. ChiCo-nazarioangELina S. gutiErrEz
25Y E A R S
17
Ginebra San Miguel Annual Report 2012
16
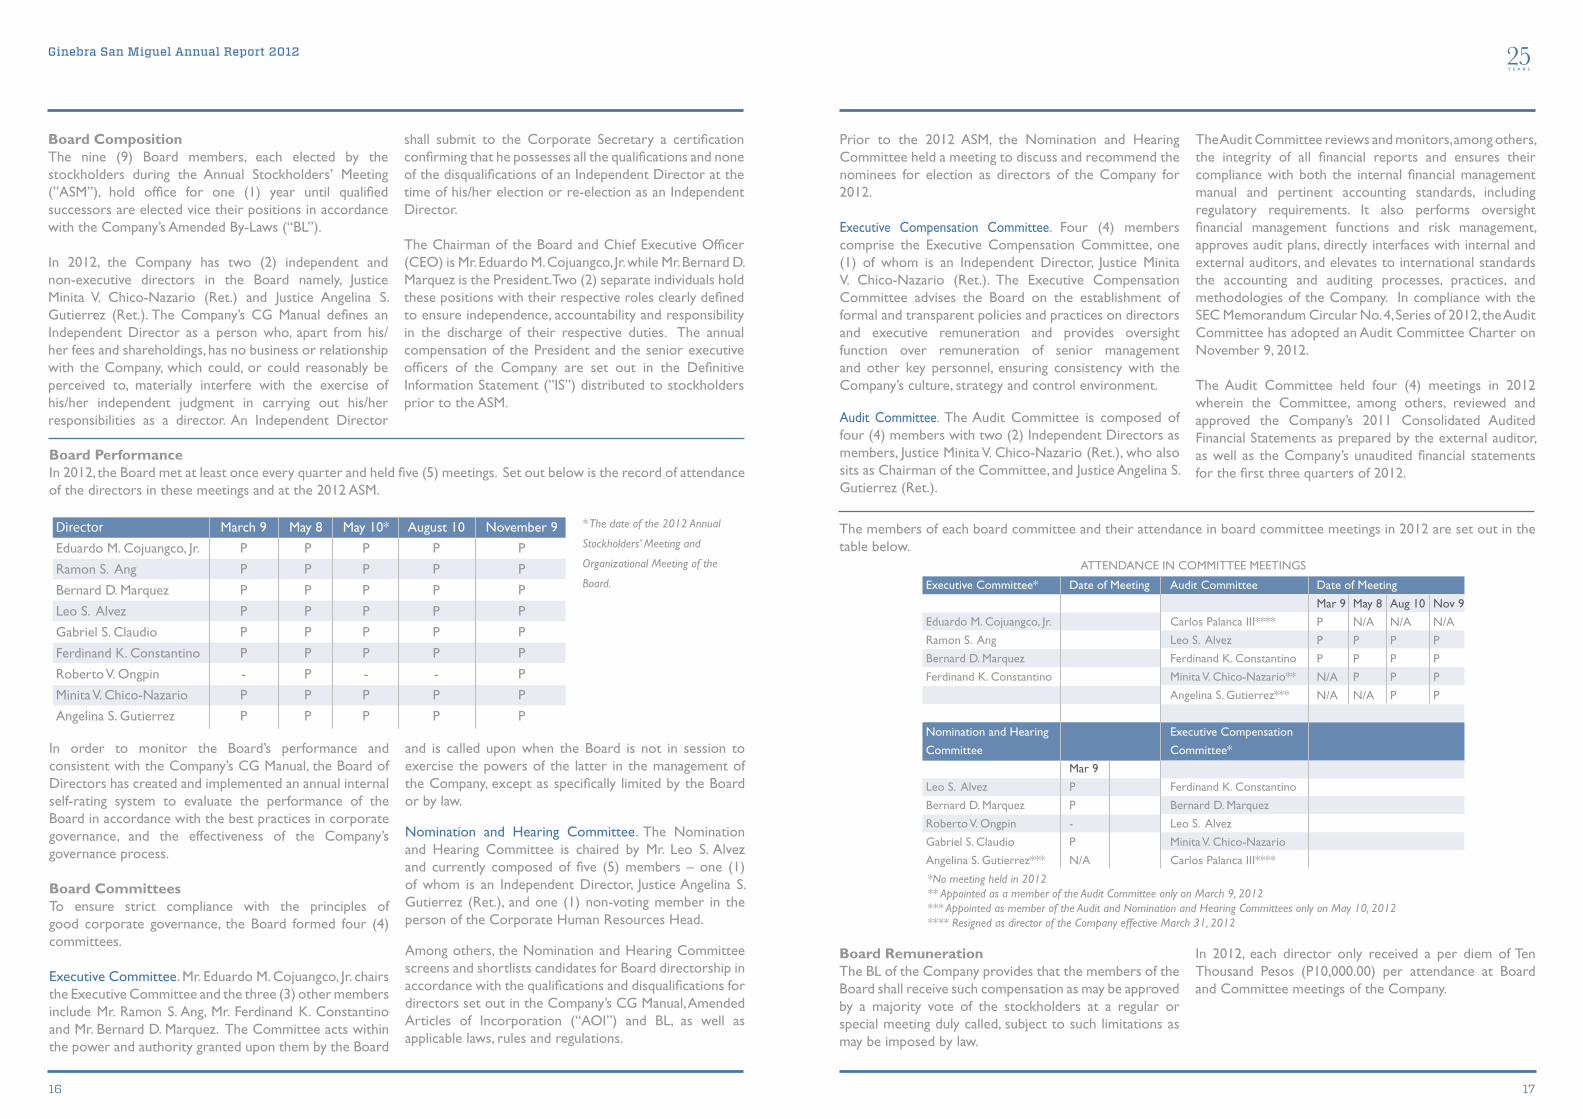
Board CompositionThe nine (9) Board members, each elected by the stockholders during the Annual Stockholders’ Meeting (”ASM”), hold offi ce for one (1) year until qualifi ed successors are elected vice their positions in accordance with the Company’s Amended By-Laws (“BL”).
In 2012, the Company has two (2) independent and non-executive directors in the Board namely, Justice Minita V. Chico-Nazario (Ret.) and Justice Angelina S. Gutierrez (Ret.). The Company’s CG Manual defi nes an Independent Director as a person who, apart from his/her fees and shareholdings, has no business or relationship with the Company, which could, or could reasonably be perceived to, materially interfere with the exercise of his/her independent judgment in carrying out his/her responsibilities as a director. An Independent Director
shall submit to the Corporate Secretary a certifi cation confi rming that he possesses all the qualifi cations and none of the disqualifi cations of an Independent Director at the time of his/her election or re-election as an Independent Director.
The Chairman of the Board and Chief Executive Offi cer (CEO) is Mr. Eduardo M. Cojuangco, Jr. while Mr. Bernard D. Marquez is the President. Two (2) separate individuals hold these positions with their respective roles clearly defi ned to ensure independence, accountability and responsibility in the discharge of their respective duties. The annual compensation of the President and the senior executive offi cers of the Company are set out in the Defi nitive Information Statement (”IS”) distributed to stockholders prior to the ASM.
DirectorEduardo M. Cojuangco, Jr.
Ramon S. Ang
Bernard D. Marquez
Leo S. Alvez
Gabriel S. Claudio
Ferdinand K. Constantino
Roberto V. Ongpin
Minita V. Chico-Nazario
Angelina S. Gutierrez
March 9
P
P
P
P
P
P
-
P
P
May 8
P
P
P
P
P
P
P
P
P
May 10*
P
P
P
P
P
P
-
P
P
August 10
P
P
P
P
P
P
-
P
P
November 9
P
P
P
P
P
P
P
P
P
Board PerformanceIn 2012, the Board met at least once every quarter and held fi ve (5) meetings. Set out below is the record of attendance of the directors in these meetings and at the 2012 ASM.
* The date of the 2012 Annual
Stockholders’ Meeting and
Organizational Meeting of the
Board.
*No meeting held in 2012** Appointed as a member of the Audit Committee only on March 9, 2012*** Appointed as member of the Audit and Nomination and Hearing Committees only on May 10, 2012**** Resigned as director of the Company effective March 31, 2012
In order to monitor the Board’s performance and consistent with the Company’s CG Manual, the Board of Directors has created and implemented an annual internal self-rating system to evaluate the performance of the Board in accordance with the best practices in corporate governance, and the effectiveness of the Company’s governance process.
Board CommitteesTo ensure strict compliance with the principles of good corporate governance, the Board formed four (4) committees.
Executive Committee. Mr. Eduardo M. Cojuangco, Jr. chairs the Executive Committee and the three (3) other members include Mr. Ramon S. Ang, Mr. Ferdinand K. Constantino and Mr. Bernard D. Marquez. The Committee acts within the power and authority granted upon them by the Board
and is called upon when the Board is not in session to exercise the powers of the latter in the management of the Company, except as specifi cally limited by the Board or by law.
Nomination and Hearing Committee. The Nomination and Hearing Committee is chaired by Mr. Leo S. Alvez and currently composed of fi ve (5) members – one (1) of whom is an Independent Director, Justice Angelina S. Gutierrez (Ret.), and one (1) non-voting member in the person of the Corporate Human Resources Head.
Among others, the Nomination and Hearing Committee screens and shortlists candidates for Board directorship in accordance with the qualifi cations and disqualifi cations for directors set out in the Company’s CG Manual, Amended Articles of Incorporation (“AOI”) and BL, as well as applicable laws, rules and regulations.
Prior to the 2012 ASM, the Nomination and Hearing Committee held a meeting to discuss and recommend the nominees for election as directors of the Company for 2012.
Executive Compensation Committee. Four (4) members comprise the Executive Compensation Committee, one (1) of whom is an Independent Director, Justice Minita V. Chico-Nazario (Ret.). The Executive Compensation Committee advises the Board on the establishment of formal and transparent policies and practices on directors and executive remuneration and provides oversight function over remuneration of senior management and other key personnel, ensuring consistency with the Company’s culture, strategy and control environment.
Audit Committee. The Audit Committee is composed of four (4) members with two (2) Independent Directors as members, Justice Minita V. Chico-Nazario (Ret.), who also sits as Chairman of the Committee, and Justice Angelina S. Gutierrez (Ret.).
The Audit Committee reviews and monitors, among others, the integrity of all fi nancial reports and ensures their compliance with both the internal fi nancial management manual and pertinent accounting standards, including regulatory requirements. It also performs oversight fi nancial management functions and risk management, approves audit plans, directly interfaces with internal and external auditors, and elevates to international standards the accounting and auditing processes, practices, and methodologies of the Company. In compliance with the SEC Memorandum Circular No. 4, Series of 2012, the Audit Committee has adopted an Audit Committee Charter on November 9, 2012.
The Audit Committee held four (4) meetings in 2012 wherein the Committee, among others, reviewed and approved the Company’s 2011 Consolidated Audited Financial Statements as prepared by the external auditor, as well as the Company’s unaudited fi nancial statements for the fi rst three quarters of 2012.
The members of each board committee and their attendance in board committee meetings in 2012 are set out in the table below.
Board RemunerationThe BL of the Company provides that the members of the Board shall receive such compensation as may be approved by a majority vote of the stockholders at a regular or special meeting duly called, subject to such limitations as may be imposed by law.
In 2012, each director only received a per diem of Ten Thousand Pesos (P10,000.00) per attendance at Board and Committee meetings of the Company.
Executive Committee*
Eduardo M. Cojuangco, Jr.
Ramon S. Ang
Bernard D. Marquez
Ferdinand K. Constantino
Nomination and Hearing
Committee
Leo S. Alvez
Bernard D. Marquez
Roberto V. Ongpin
Gabriel S. Claudio
Angelina S. Gutierrez***
x
Date of Meeting
Mar 9
P
P
-
P
N/A
Audit Committee
Carlos Palanca III****
Leo S. Alvez
Ferdinand K. Constantino
Minita V. Chico-Nazario**
Angelina S. Gutierrez***
Executive Compensation
Committee*
Ferdinand K. Constantino
Bernard D. Marquez
Leo S. Alvez
Minita V. Chico-Nazario
Carlos Palanca III****
Date of Meeting
Mar 9
P
P
P
N/A
N/A
May 8
N/A
P
P
P
N/A
Aug 10
N/A
P
P
P
P
Nov 9
N/A
P
P
P
P
ATTENDANCE IN COMMITTEE MEETINGS

19
25Y E A R S
Ginebra San Miguel Annual Report 2012
18
ACCOUNTABILITY AND AUDIT
The Audit Committee performs oversight functions to both external and internal auditors. The role and responsibilities of the Audit Committee are clearly defi ned in the Company’s CG Manual.
The external auditor, whose main function is to facilitate the environment of good corporate governance as refl ected in the Company’s fi nancial records and reports, are selected and appointed by the stockholders upon the recommendation of the Audit Committee.
In 2012, the accounting fi rm of Manabat Sanagustin & Co., CPAs (“MSC”) served as the Company’s external auditor. Representatives of MSC are expected to be present at the ASM and will be available to respond to appropriate questions. They also have the opportunity to make a statement if they so desire. In instances when the external auditor suspects fraud or error during its conduct of audit, it is required to disclose and express their fi ndings on the matter.
MSC has been the Company’s external auditor since 2006. As such, the Company complied with the rule on rotation for the signing partner every after fi ve (5) years under Part I (3) (b) (ix) of SRC Rule 68, as amended, with respect to its re-engagement of the said audit fi rm.
The Internal Audit Group, on the other hand, provides an independent and objective assurance that key organizational and procedural controls of the Company are effective, appropriate, and complied with. The Internal Audit Group is also responsible for identifying and evaluating signifi cant risk exposures of the Company and contributes to the improvement of risk management and control systems by assessing adequacy and effectiveness of controls covering the organization’s governance, operations, and information systems. The Internal Audit Group adheres to a group-wide Internal Audit Charter.
Regular audits of the businesses of the Company, its subsidiaries, and support units are conducted according to an annual audit program approved by the Audit Committee. Special audits are also undertaken when and as necessary.
Fees for the services rendered by the external auditor to the Company and its subsidiaries for the last two fi scal years are as follows:
(in Millions, approximate)
DISCLOSURE AND TRANSPARENCY
The Company adheres to full disclosure and transparency to allow the investment community to appreciate the Company’s true fi nancial condition and the quality of its corporate governance.
Ownership StructureThe top twenty (20) preferred and common stockholders of the Company, including the shareholdings of certain record and benefi cial owners who own more than fi ve percent (5%) of its capital stock, its directors and key offi cers, are disclosed annually in its IS distributed to stockholders prior to the ASM.
Financial ReportingThe Company also provides regular updates on its operating performance and other fi nancial information through the Securities and Exchange Commission (“SEC”) and the Philippine Stock Exchange, Inc. (“PSE”). In addition to submitting periodic reportorial requirements, the Company discloses major and market-sensitive information that affect the share price performance as necessary.
The Company’s fi nancial statements conform to Philippine Accounting Standards and Philippine Financial Reporting Standards, which are all in compliance with International Accounting Standards. Consolidated audited fi nancial statements for the latest completed fi nancial year are submitted to the SEC within the prescribed submission dates and are distributed to the stockholders prior to the ASM.
On the other hand, quarterly fi nancial results for the fi rst three quarters of the relevant year are released and are duly disclosed to the SEC and PSE within the prescribed period. The results are also presented to fi nancial and investment analysts through a quarterly analysts’ briefi ng.
In addition to compliance with structured reportorial requirements, the Company discloses in a timely manner market-sensitive information that may affect the share price performance.
2012
2011
Audit Fees
P 7
P 6
Tax Fees
-
-
All Other Fees
-
-
Securities DealingThe Company has adopted a policy that regulates the acquisition and disposal of Company shares by its directors, offi cers and employees, and the use and disclosure of price-sensitive information by such persons. Under the policy, directors, offi cers and employees who have knowledge or are in possession of material non-public information are prohibited from dealing in the Company’s securities prior to disclosure of such information to the public. The policy likewise prescribes the periods before and after public disclosure of structured and non-structured reports during which trading in the Company’s securities by persons who, by virtue of their functions and responsibilities, are considered to have knowledge or possession of material non-public information, is not allowed.
STOCKHOLDERS’ RIGHTS AND STAKEHOLDER RELATIONS
Stockholders’ MeetingStockholders are informed at least fi fteen (15) business days before the scheduled date of the annual meeting. The notice to stockholders also sets the date, time and place of the validation of proxies. The Notice for the 2013 ASM was approximately sent to the stockholders on April 17, 2013.
Voting Rights and Voting ProceduresEach share in the name of the stockholder entitles such stockholder to one (1) vote, which may be exercised in person or by proxy at stockholders’ meetings, including the ASM. Stockholders have the right to elect, remove, and replace directors as well as vote on certain corporate acts in accordance with the Corporation Code. Voting procedures on matters presented for approval to the stockholders in the ASM are set out in the IS.
Pre-emptive RightsStockholders have the right to subscribe to all issues of shares of the Company in proportion to their shareholdings, unless the same is denied in its AOI or an amendment thereto.
Under the Company’s AOI, stockholders do not have pre-emptive rights to subscribe to the convertible preferred shares or to subscribe to the common shares to be issued by the Company upon conversion of the preferred shares and the conversion of any notes issued to redeem such preferred shares. Subject to certain conditions and threshold on the percentage of shares allotted to be issued pursuant to a duly approved stock option, stock
purchase, stock subscription or similar plans (collectively, the “Plans”), stockholders do not have pre-emptive rights to shares issued, sold or disposed of by the Company to its offi cers and/or employees pursuant to such Plans.
Right to Information of Stakeholders and Investor RelationsStockholders are provided, through the Investor Relations Offi ce of the Company and its parent company, San Miguel Corporation (“SMC”), disclosures, announcements, and upon request, with periodic reports fi led with the SEC and PSE.
The Company exercises transparency when dealing with stockholders, customers, employees and trade partners and ensures that these transactions adhere to industry standards and fair business practices in order to establish long-term and mutually benefi cial relationships.
The Company addresses the numerous information requests of the investing community and keeps in touch with minority stockholders through timely disclosures to the PSE, regular quarterly briefi ngs, ASMs, website, emails and telephone calls.
The Company holds combined investors’ briefi ngs with SMC and other SMC subsidiaries and regularly meets with investment and fi nancial analysts.
DividendsHolders of common shares are entitled to receive dividends as the Board may, in its sole discretion, declare from time to time. The Board, however, is required, subject to certain exceptions, to declare dividends when the Company’s retained earnings equal or exceeds its paid-up capital stock.
Holders of preferred shares are entitled to participate and receive dividends as and when declared by the Board to common stockholders as such rate or amount as may be fi xed by the Board. Such right to receive dividends may be cumulative.
No dividends were declared in 2012.
EMPLOYEE RELATIONS
Employees are each provided an Employee Handbook, which contains the policies and guidelines for, as well as duties and responsibilities of the employees of the Company.

Ginebra San Miguel Annual Report 2012
20 21
25Y E A R S
Through internal newsletters, weekly-televised news segments, memos, and emails facilitated by the Human Resources Department and the Corporate Affairs Office of the Company, employees are updated on the material developments within the organization.
Career advancement and developments are also provided by the Company through numerous training programs and seminars. The Company has also initiated activities centered on the safety, health and welfare of its employees. Benefits and privileges accruing to all regular employees are likewise discussed in the Employee Handbook.
CODE OF ETHICS
The Company adheres to a group-wide Code of Ethics that sets out the fundamental standards of conduct and values consistent with the principles of good governance and business practices that shall guide and define the actions and decisions of the directors, management, officers and employees of the Company. It also observes the procedures established for the communication and investigation of concerns regarding the Company’s accounting, internal accounting controls, auditing, and financial reporting matters under a SMC group-wide whistle blowing policy.
COMPLIANCE MONITORING
To ensure adherence to corporate governance principles and best practices, Atty. Virgilio S. Jacinto was designated as Compliance Officer of the Company. The Compliance Officer is responsible for monitoring compliance by the Company with the provisions and requirements of good corporate governance, among others.
WEB SITE
Additional information on the Company may be viewed at www.ginebrasanmiguel.com.
Minita V. Chico-NazarioCHAIRPERSON
INDEPENDENT DIRECTOR
Ferdinand K. ConstantinoMEMBER
The Audit Committee (the “Committee”) assists the Board of Directors in its corporate governance and oversight responsibilities in relation to financial reporting, risk management, internal controls and internal and external audit processes and methodologies. In fulfillment of these responsibilities, the Committee performed the following in 2012:
•endorsed for approval by the stockholders, and the stockholders approved the appointment of Manabat Sanagustin & Co., CPAs as the Company’s independent external auditor for 2012;
• reviewed and approved the terms of engagement of the external auditor, including the audit, audit-related and any non-audit services provided by the external auditor to the Company and the fees for such services, and ensured that the same did not impair the external auditor’s independence and objectivity;
• reviewed and approved the scope of the audit and audit programs of the external auditor as well as the internal audit group of the Company, and have discussed the results of their audit processes and their findings and assessment of the Company’s internal controls and financial reporting systems;
• reviewed, discussed and recommended for approval of the Board of Directors the Company’s annual and quarterly consolidated financial statements, and the reports required to be submitted to regulatory agencies in connection with such consolidated financial statements, to ensure that the information contained in such statements and reports presents a true and balanced assessment of the Company’s position and condition and comply with the regulatory requirements of the Securities and Exchange Commission (“SEC”);
• reviewed the effectiveness and sufficiency of the Company’s financial and internal controls, risk management systems, and control and governance processes, and ensured that, where applicable, necessary measures are taken to address any concern or issue arising therefrom; and
• adopted on November 9, 2012 an Audit Committee Charter, in compliance with the Guidelines for the Assessment of the Performance of Audit Committees of Companies Listed on the Exchange issued by the SEC under SEC Memorandum Circular No. 4, Series of 2012.
All the four members of the Committee, two of whom are independent directors, are satisfied with the scope and appropriateness of the Committee’s mandate and that the Committee substantially met its mandate in 2012.
REPORT OF THE AUDIT COMMITTEEFOR THE YEAR ENDED DECEMBER 31, 2012
Leo S. AlvezMEMBER
Angelina S. GutierrezMEMBER - INDEPENDENT DIRECTOR

Ginebra San Miguel Annual Report 2012 25Y E A R S
22 23
STATEMENT OF MANAGEMENT’S RESPONSIBILITY FOR CONSOLIDATED FINANCIAL STATEMENTS
The management of Ginebra San Miguel Inc. (the “Company”) is responsible for the preparation and fair presentation of the consolidated financial statements for the years ended December 31, 2012, 2011 and 2010, including the additional components attached therein, in accordance with the prescribed financial reporting framework indicated therein. This responsibility includes designing and implementing internal controls relevant to the preparation and fair presentation of consolidated financial statements that are free from material misstatement, whether due to fraud or error, selecting and applying appropriate accounting policies, and making accounting estimates that are reasonable in the circumstances. The Board of Directors reviews and approves the consolidated financial statements and submits the same to the stockholders of the Company. Manabat Sanagustin & Co., CPAs, the independent auditors appointed by the stockholders, has audited the consolidated financial statements of the Company in accordance with Philippine Standards on Auditing, and in its report to the stockholders has expressed its opinion on the fairness of presentation upon completion of such audit.
EDUARDO M. COJUANGCO, JR.
Chairman and Chief Executive Officer
CYNTHIA M. BAROY BERNARD D. MARQUEZ Chief Finance Officer
President and Chief Operating Officer
Manabat Sanagustin & Co., CPAs, a Philippine partnership and a member firm of the KPMG network of independent member firms affiliated with KPMG International Cooperative (“KPMG International”), a Swiss entity.
PRC-BOA Registration No. 0003, Group A, valid until December 31, 2013 SEC Accreditation No. 0004-FR-3, Group A, valid until November 22, 2014 IC Accreditation No. F-0040-R, Group A, valid until September 11, 2014 BSP Accredited, Group A, valid until December 17, 2014
kpmg Manabat Sanagustin & Co., CPAs Telephone +63 (2) 885 7000 The KPMG Center, 9/F Fax +63 (2) 894 1985 6787 Ayala Avenue Internet www.kpmg.com.ph Makati City 1226, Metro Manila, Philippines E-Mail [email protected] Branches: Bacolod · Cebu · Iloilo · Subic
REPORT OF INDEPENDENT AUDITORS The Board of Directors and Stockholders Ginebra San Miguel Inc. 6th Floor, San Miguel Properties Centre St. Francis Street, Ortigas Center Mandaluyong City We have audited the accompanying consolidated financial statements of Ginebra San Miguel Inc. and Subsidiaries which comprise the consolidated statements of financial position as at December 31, 2012 and 2011, and the consolidated statements of income, consolidated statements of comprehensive income, consolidated statements of changes in equity and consolidated statements of cash flows for each of the three years in the period ended December 31, 2012, and notes, comprising a summary of significant accounting policies and other explanatory information. Management’s Responsibility for the Consolidated Financial Statements Management is responsible for the preparation and fair presentation of these consolidated financial statements in accordance with Philippine Financial Reporting Standards, and for such internal control as management determines is necessary to enable the preparation of consolidated financial statements that are free from material misstatement, whether due to fraud or error. Auditors’ Responsibility Our responsibility is to express an opinion on these consolidated financial statements based on our audits. We conducted our audits in accordance with Philippine Standards on Auditing. Those standards require that we comply with ethical requirements and plan and perform the audit to obtain reasonable assurance about whether the consolidated financial statements are free from material misstatement. An audit involves performing procedures to obtain audit evidence about the amounts and disclosures in the consolidated financial statements. The procedures selected depend on the auditors’ judgment, including the assessment of the risks of material misstatement of the consolidated financial statements, whether due to fraud or error. In making those risk assessments, the auditors consider internal control relevant to the entity’s preparation and fair presentation of the consolidated financial statements in order to design audit procedures that are appropriate in the circumstances, but not for the purpose of expressing an opinion on the effectiveness of the entity’s internal control. An audit also includes evaluating the appropriateness of accounting policies used and the reasonableness of accounting estimates made by management, as well as evaluating the overall presentation of the consolidated financial statements. We believe that the audit evidence we have obtained is sufficient and appropriate to provide a basis for our audit opinion.
kpmg
REPORT OF INDEPENDENT AUDITORS The Board of Directors and Stockholders Ginebra San Miguel Inc. We have audited the accompanying consolidated financial statements of Ginebra San Miguel Inc. and Subsidiaries which comprise the consolidated statements of financial position as at December 31, 2012 and 2011, and the consolidated statements of income, consolidated statements of comprehensive income, consolidated statements of changes in equity and consolidated statements of cash flows for each of the three years in the period ended December 31, 2012, and notes, comprising a summary of significant accounting policies and other explanatory information. Management’s Responsibility for the Consolidated Financial Statements Management is responsible for the preparation and fair presentation of these consolidated financial statements in accordance with Philippine Financial Reporting Standards, and for such internal control as management determines is necessary to enable the preparation of consolidated financial statements that are free from material misstatement, whether due to fraud or error. Auditors’ Responsibility Our responsibility is to express an opinion on these consolidated financial statements based on our audits. We conducted our audits in accordance with Philippine Standards on Auditing. Those standards require that we comply with ethical requirements and plan and perform the audit to obtain reasonable assurance about whether the consolidated financial statements are free from material misstatement. An audit involves performing procedures to obtain audit evidence about the amounts and disclosures in the consolidated financial statements. The procedures selected depend on the auditors’ judgment, including the assessment of the risks of material misstatement of the consolidated financial statements, whether due to fraud or error. In making those risk assessments, the auditors consider internal control relevant to the entity’s preparation and fair presentation of the consolidated financial statements in order to design audit procedures that are appropriate in the circumstances, but not for the purpose of expressing an opinion on the effectiveness of the entity’s internal control. An audit also includes evaluating the appropriateness of accounting policies used and the reasonableness of accounting estimates made by management, as well as evaluating the overall presentation of the consolidated financial statements. We believe that the audit evidence we have obtained is sufficient and appropriate to provide a basis for our audit opinion.
kpmg
Opinion In our opinion, the consolidated financial statements present fairly, in all material respects, the consolidated financial position of Ginebra San Miguel Inc. and Subsidiaries as at December 31, 2012 and 2011, and its consolidated financial performance and its consolidated cash flows for each of the three years in the period ended December 31, 2012, in accordance with Philippine Financial Reporting Standards. March 19, 2013 Makati City, Metro Manila

Ginebra San Miguel Annual Report 2012 25Y E A R S
24 25
GINEBRA SAN MIGUEL INC. AND SUBSIDIARIES CONSOLIDATED STATEMENTS OF FINANCIAL POSITION
(In Thousands) December 31 Note 2012 2011 ASSETS Current Assets Cash and cash equivalents 7, 35, 36 P621,530 P366,116 Trade and other receivables - net 4, 8, 15, 29, 35, 36 3,878,832 3,156,620 Inventories 4, 9, 29 6,109,316 6,782,788 Prepaid taxes and other current assets 10, 35, 36 1,335,206 912,541
Total Current Assets 11,944,884 11,218,065 Noncurrent Assets Property, plant and equipment - net 4, 12 7,559,240 6,836,356 Investment properties - net 4, 13 148,926 157,998 Goodwill 4, 5 226,863 - Other intangible asset 4, 11, 14 56,520 58,834 Retirement assets 31 6,488 - Deferred tax assets - net 4, 20 941,679 541,055 Other noncurrent assets - net 4, 8, 15, 29, 35, 36 922,169 737,464
Total Noncurrent Assets 9,861,885 8,331,707 P21,806,769 P19,549,772
LIABILITIES AND EQUITY Current Liabilities Notes payable 16, 35, 36 P9,609,452 P7,931,093 Trade and other payables 17, 29, 30, 35, 36 3,452,442 2,274,044 Income and other taxes payable 80,105 118,484 Current maturities of long-term debt - net of
debt issue costs 18, 35, 36 655,430 373,974 Total Current Liabilities 13,797,429 10,697,595
Noncurrent Liabilities Retirement liabilities 31 - 6,044 Long-term debt - net of current maturities
and debt issue costs 18, 35, 36 1,440,739 1,416,847 Finance lease liabilities - net of current
portion 30, 35, 36 779 - Deferred tax liabilities 5, 20 419 - Other noncurrent liabilities 19, 35, 36 84,483 91,203
Total Noncurrent Liabilities 1,526,420 1,514,094 Total Liabilities 15,323,849 12,211,689
Equity Capital stock 21 399,063 399,063 Additional paid-in capital 21 2,539,447 2,526,625 Cumulative translation adjustments (54,721) (35,936) Retained earnings
Appropriated 21 2,500,000 2,500,000 Unappropriated 21 3,678,540 4,527,740
Treasury stock 21 (2,579,409) (2,579,409) Total Equity 6,482,920 7,338,083
P21,806,769 P19,549,772 See Notes to the Consolidated Financial Statements.
-
GINEBRA SAN MIGUEL INC. AND SUBSIDIARIES CONSOLIDATED STATEMENTS OF INCOME
FOR THE YEARS ENDED DECEMBER 31, 2012, 2011 AND 2010 (In Thousands, Except Per Share Data)
Note 2012 2011 2010
SALES 29 P14,559,183 P15,112,596 P22,688,144
COST OF SALES 22, 29, 37 11,097,738 11,975,335 17,579,137
GROSS PROFIT 3,461,445 3,137,261 5,109,007
SELLING AND MARKETING EXPENSES 23, 29 (2,597,044) (2,491,544) (2,283,675)
GENERAL AND ADMINISTRATIVE EXPENSES 24, 29 (1,526,077) (1,588,139) (1,381,020)
INTEREST EXPENSE 16, 18, 27 (612,050) (446,984) (305,005)
INTEREST INCOME 4,033 4,025 6,999
OTHER INCOME - Net 28 110,912 36,060 190,353
INCOME (LOSS) BEFORE INCOME TAX (1,158,781) (1,349,321) 1,336,659
INCOME TAX EXPENSE (BENEFIT) 20 (309,581) (367,161) 422,805
NET INCOME (LOSS) (P849,200) (P982,160) P913,854
Basic and Diluted Earnings (Loss) Per Share 33 (P3.10) (P3.56) P3.03
See Notes to the Consolidated Financial Statements.

Ginebra San Miguel Annual Report 2012 25Y E A R S
26 27
GINEBRA SAN MIGUEL INC. AND SUBSIDIARIES CONSOLIDATED STATEMENTS OF COMPREHENSIVE INCOME
FOR THE YEARS ENDED DECEMBER 31, 2012, 2011 AND 2010 (In Thousands)
2012 2011 2010
NET INCOME (LOSS) (P849,200) (P982,160) P913,854
EXCHANGE DIFFERENCES ON TRANSLATION OF FOREIGN OPERATIONS (18,785) (26,497) (6,441)
TOTAL COMPREHENSIVE INCOME (LOSS) - NET OF TAX (P867,985) (P1,008,657) P907,413
See Notes to the Consolidated Financial Statements.
GIN
EBR
A S
AN
MIG
UE
L IN
C. A
ND
SU
BSI
DIA
RIE
S C
ON
SOLI
DA
TE
D S
TAT
EMEN
TS
OF
CH
AN
GES
IN E
QU
ITY
FO
R T
HE
YEA
RS
END
ED
DE
CEM
BE
R 3
1, 2
012,
201
1 A
ND
201
0 (In
Tho
usan
ds)
A
ddit
iona
l C
umul
ativ
e
C
apit
al S
tock
P
aid-
in
Tra
nsla
tion
Ret
aine
d E
arni
ngs
Tre
asur
y
Not
e C
omm
on
Pre
ferr
ed
Cap
ital
A
djus
tmen
ts
A
ppro
pria
ted
Una
ppro
pria
ted
Stoc
k T
otal
As
of Ja
nuar
y 1,
201
2
P34
5,62
5 P
53,4
38
P2,
526,
625
(P35
,936
) P
2,50
0,00
0 P
4,52
7,74
0 (P
2,57
9,40
9)
P7,
338,
083
Exc
hang
e di
ffere
nces
on
tran
slat
ion
of
fore
ign
oper
atio
ns/o
ther
co
mpr
ehen
sive
loss
-
-
-
(18,
785)
-
-
-
(1
8,78
5)
Net
loss
for
the
year
-
-
-
-
-
(849
,200
) -
(8
49,2
00)
Tot
al c
ompr
ehen
sive
loss
for
the
year
-
-
-
(18,
785)
-
(8
49,2
00)
-
(867
,985
) Is
suan
ces
of c
apit
al s
tock
34
-
-
12
,822
-
-
-
-
12
,822
As
of D
ecem
ber
31, 2
012
P
345,
625
P53
,438
P
2,53
9,44
7 (P
54,7
21)
P2,
500,
000
P3,
678,
540
(P2,
579,
409)
P
6,48
2,92
0
As
of Ja
nuar
y 1,
201
1
P342
,986
P5
3,43
8 P2
,435
,476
(P
9,43
9)
P2,5
00,0
00
P5,9
91,9
14
(P2,
579,
409)
P8
,734
,966
Exch
ange
diff
eren
ces
on t
rans
latio
n of
fo
reig
n op
erat
ions
/oth
er
com
preh
ensiv
e lo
ss
-
-
-
(2
6,49
7)
-
-
-
(2
6,49
7)
Net
loss
for
the
year
-
-
-
-
-
(9
82,1
60)
-
(982
,160
)
Tot
al c
ompr
ehen
sive
loss
for
the
year
-
-
-
(26,
497)
-
(9
82,1
60)
-
(1,0
08,6
57)
Issu
ance
s of
cap
ital s
tock
21
, 34
2,63
9 -
91
,149
-
-
-
-
93
,788
C
ash
divi
dend
s 21
, 32
-
-
-
-
-
(482
,014
) -
(4
82,0
14)
As
of D
ecem
ber
31, 2
011
P3
45,6
25
P53,
438
P2,5
26,6
25
(P35
,936
)
P2,5
00,0
00
P4,5
27,7
40
(P2,
579,
409)
P7
,338
,083
Forw
ard

Ginebra San Miguel Annual Report 2012 25Y E A R S
28 29
A
ddit
iona
l C
umul
ativ
e
C
apit
al S
tock
P
aid-
in
Tra
nsla
tion
Ret
aine
d E
arni
ngs
Tre
asur
y
Not
e C
omm
on
Pre
ferr
ed
Cap
ital
A
djus
tmen
ts
A
ppro
pria
ted
Una
ppro
pria
ted
Stoc
k T
otal
As
of Ja
nuar
y 1,
201
0
P336
,950
P5
3,43
8 P2
,304
,669
(P
2,99
8)
P1,3
00,0
00
P6,7
54,1
41
(P2,
579,
409)
P8
,166
,791
Exch
ange
diff
eren
ces
on t
rans
latio
n of
fo
reig
n op
erat
ions
/oth
er
com
preh
ensiv
e lo
ss
-
-
-
(6
,441
) -
-
-
(6
,441
) N
et in
com
e fo
r th
e ye
ar
-
-
-
-
-
91
3,85
4 -
91
3,85
4
Tot
al c
ompr
ehen
sive
inco
me
(loss
) for
th
e ye
ar
-
-
-
(6
,441
) -
91
3,85
4 -
90
7,41
3 Is
suan
ces
of c
apita
l sto
ck
21, 3
4 6,
036
-
130,
807
-
-
-
-
136,
843
App
ropr
iatio
ns
21
-
-
-
-
1,20
0,00
0
(1,2
00,0
00)
-
-
Cas
h di
vide
nds
32
-
-
-
-
-
(476
,081
) -
(4
76,0
81)
As
of D
ecem
ber
31, 2
010
P3
42,9
86
P53,
438
P2,4
35,4
76
(P9,
439)
P2
,500
,000
P5
,991
,914
(P
2,57
9,40
9)
P8,7
34,9
66
See
Not
es to
the
Cons
olid
ated
Fin
ancia
l Sta
tem
ents
.
GINEBRA SAN MIGUEL INC. AND SUBSIDIARIES CONSOLIDATED STATEMENTS OF CASH FLOWS
FOR THE YEARS ENDED DECEMBER 31, 2012, 2011 AND 2010 (In Thousands)
Note 2012 2011 2010 CASH FLOWS FROM
OPERATING ACTIVITIES Income (loss) before income tax (P1,158,781) (P1,349,321) P1,336,659 Adjustments for:
Depreciation and amortization 12, 13, 25 707,853 526,009 469,510
Interest expense 16, 18, 27 612,050 446,984 305,005 Impairment losses on
receivables 8, 23, 24 - 178 1,226 Gain on sale of property and
equipment 28 (605) (154) (323) Net unrealized foreign exchange
gain 28 (3,709) (2,399) (44,483) Interest income (4,033) (4,025) (6,999) Net derivative loss (gain) 28 (11,283) 18,253 (70,984)
Operating income (loss) before working capital changes 141,492 (364,475) 1,989,611
Decrease (increase) in: Trade and other receivables (1,299,171) (325,054) (777,223) Inventories 687,134 349,751 (2,075,125) Prepaid taxes and other current
assets (415,228) 149,874 (277,537) Increase (decrease) in:
Trade and other payables 1,279,828 (739,200) 653,689 Other taxes payable (38,379) 3,584 39,284 Retirement liabilities (assets) (12,532) 63,706 (24,199)
Cash generated from (used in) operations 343,144 (861,814) (471,500)
Interest received 4,033 4,025 6,999 Income taxes paid (496) (3,500) (192,804) Net cash flows provided by
(used in) operating activities 346,681 (861,289) (657,305) CASH FLOWS FROM
INVESTING ACTIVITIES Proceeds from sale of property and
equipment 150 336 324 Additions to property, plant and
equipment 12 (311,315) (1,182,873) (1,190,006) Acquisition of a subsidiary, net of
cash and cash equivalents acquired (142,672) - -
Increase in other noncurrent assets (121,354) (69,875) (30,030) Net cash flows used in investing
activities (575,191) (1,252,412) (1,219,712) Forward

Ginebra San Miguel Annual Report 2012 25Y E A R S
30 31
Note 2012 2011 2010
CASH FLOWS FROM FINANCING ACTIVITIES
Proceeds from: Short-term borrowings P129,445,172 P88,406,258 P58,449,594 Issuance of capital stock 28,978 38,855 18,228 Finance lease liabilities 983 - - Noncurrent liabilities - 95,120 - Long-term borrowings - - 1,492,500
Payments of: Short-term borrowings (127,758,709) (85,518,041) (57,255,813) Interest (617,181) (473,895) (264,759) Long-term borrowings (487,424) (121,308) (121,417) Cash dividends (117,975) (353,050) (475,297) Finance lease liabilities (390) (12,227) (15,161)
Net cash flows provided by financing activities 493,454 2,061,712 1,827,875
EFFECT OF EXCHANGE RATE CHANGES ON CASH AND CASH EQUIVALENTS (9,530) (4,525) (31,115)
NET INCREASE (DECREASE) IN CASH AND CASH EQUIVALENTS 255,414 (56,514) (80,257)
CASH AND CASH EQUIVALENTS AT BEGINNING OF YEAR 7 366,116 422,630 502,887
CASH AND CASH EQUIVALENTS AT END OF YEAR 7 P621,530 P366,116 P422,630
See Notes to the Consolidated Financial Statements.
GINEBRA SAN MIGUEL INC. AND SUBSIDIARIES NOTES TO THE CONSOLIDATED FINANCIAL STATEMENTS
(Amounts in Thousands, Except Percentages, Number of Shares and Per Share Data) 1. Reporting Entity
Ginebra San Miguel Inc. (the Parent Company) was incorporated in the Philippines and registered with the Philippine Securities and Exchange Commission (SEC) on July 10, 1987. The accompanying consolidated financial statements comprise the financial statements of the Parent Company and its Subsidiaries (collectively referred to as the “Group”) and the Group’s interests in joint ventures. The Parent Company is a public company under Section 17.2 of the Securities Regulation Code and its shares are listed on the Philippine Stock Exchange (PSE). The Parent Company is engaged in manufacturing and selling of alcoholic and nonalcoholic beverages. The registered office address of the Parent Company is 6th Floor, San Miguel Properties Centre, St. Francis Street, Ortigas Center, Mandaluyong City. San Miguel Corporation (SMC) is the ultimate parent company of the Group. The Parent Company is 77.36% - owned and controlled by SMC.
2. Basis of Preparation Statement of Compliance The consolidated financial statements have been prepared in compliance with Philippine Financial Reporting Standards (PFRS). PFRS are based on International Financial Reporting Standards (IFRS) issued by the International Accounting Standards Board (IASB). PFRS includes statements named PFRS, Philippine Accounting Standards (PAS) and Philippine Interpretations from International Financial Reporting Interpretations Committee (IFRIC) issued by the Financial Reporting Standards Council (FRSC). The accompanying consolidated financial statements were authorized for issue by the Board of Directors (BOD) on March 19, 2013. Basis of Measurement The consolidated financial statements of the Group have been prepared on a historical cost basis of accounting, except for the following: derivative financial instruments are measured at fair value; and defined benefit asset (liability) is measured as the net total of the fair value of the
plan assets, less unrecognized actuarial gains (losses) and the present value of the defined benefit obligation.
Functional and Presentation Currency The consolidated financial statements are presented in Philippine peso, which is the Parent Company’s functional currency. All financial information are rounded off to the nearest thousand (P000), except when otherwise indicated.

Ginebra San Miguel Annual Report 2012 25Y E A R S
32 33
- 2 -
Basis of Consolidation The consolidated financial statements include the accounts of the Parent Company, its subsidiaries and the Group’s interests in joint ventures. The Parent Company owns and controls the following wholly-owned subsidiaries: Name of Subsidiary Country of Incorporation Distileria Bago, Inc. (DBI) Philippines East Pacific Star Bottlers Phils Inc. (EPSBPI) (a) Philippines Agricrops Industries, Inc. (Agricrops) Philippines Healthy Condiments, Inc. (HCI) Philippines Ginebra San Miguel International Ltd. (GSMIL) British Virgin Islands (BVI) Ginebra San Miguel International Holdings Ltd.
(GSMIHL) BVI Global Beverage Holdings Ltd. (GBHL) BVI Siam Holdings Ltd. (SHL) BVI
(a) Consolidated starting January 27, 2012 (Note 5). A subsidiary is an entity controlled by the Group. Control exists when the Group has the power, directly or indirectly, to govern the financial and operating policies of an entity so as to obtain benefit from its activities. In assessing control, potential voting rights that are presently exercisable or convertible are taken into account. The financial statements of the subsidiaries are included in the consolidated financial statements from the date when the Group obtains control, and continue to be consolidated until the date when such control ceases. A joint venture is an entity over whose activities the Group has joint control, established by contractual agreement and requiring unanimous consent for strategic financial and operating decisions. The consolidated financial statements include the Group’s proportionate share of the joint venture’s assets, liabilities, income and expenses on a line by line basis, from the date that joint control commences until the date that joint control ceases. A discussion of the Group’s joint ventures is included in Note 11 to the consolidated financial statements. The consolidated financial statements are prepared for the same reporting period as the Parent Company, using uniform accounting policies for like transactions and other events in similar circumstances. Intragroup balances and transactions, including intragroup unrealized profits and losses, are eliminated in preparing the consolidated financial statements.
- 3 -
3. Significant Accounting Policies The accounting policies set out below have been applied consistently to all periods presented in the consolidated financial statements, except for the changes in accounting policies as explained below. Adoption of Amendments to Standards The FRSC approved the adoption of a number of amendments to standards as part of PFRS. Effective 2012, the Group has adopted the amendments to PFRS 7, Disclosures - Transfers of Financial Assets, which require additional disclosures about transfers of financial assets. The amendments require disclosure of information that enables users of the consolidated financial statements to understand the relationship between transferred financial assets that are not derecognized in their entirety and the associated liabilities; and to evaluate the nature of, and risks associated with, the entity’s continuing involvement in the derecognized financial assets. The amendments are effective for annual periods beginning on or after July 1, 2011. The adoption of these amendments did not have an effect on the consolidated financial statements. Additional disclosures were included in the consolidated financial statements, where applicable. New or Revised Standards, Amendments to Standards and Interpretations Not Yet Adopted A number of new or revised standards, amendments to standards and interpretations are effective for annual periods beginning after January 1, 2012, and have not been applied in preparing the consolidated financial statements. Except as otherwise indicated, none of these is expected to have a significant effect on the consolidated financial statements of the Group. The Group does not plan to adopt these standards early. The Group will adopt the following new or revised standards, amendments to standards and interpretations on the respective effective dates: Presentation of Items of Other Comprehensive Income (Amendments to PAS 1,
Presentation of Financial Statements). The amendments: (a) require that an entity presents separately the items of other comprehensive income that would be reclassified to profit or loss in the future, if certain conditions are met, from those that would never be reclassified to profit or loss; (b) do not change the existing option to present profit or loss and other comprehensive income in two statements; and (c) change the title of the consolidated statement of comprehensive income to consolidated statement of profit or loss and other comprehensive income. However, an entity is still allowed to use other titles. The amendments do not address which items are presented in other comprehensive income or which items need to be reclassified. The requirements of other PFRS continue to apply in this regard. The adoption of the amendments is required for annual periods beginning on or after January 1, 2013. The adoption of the amendments is not expected to have an effect on the consolidated financial statements.

Ginebra San Miguel Annual Report 2012 25Y E A R S
34 35
- 4 -
Disclosures: Offsetting Financial Assets and Financial Liabilities (Amendments to PFRS 7). These amendments include minimum disclosure requirements related to financial assets and financial liabilities that are: (a) offset in the consolidated statements of financial position; or (b) subject to enforceable master netting arrangements or similar agreements. They include a tabular reconciliation of gross and net amounts of financial assets and financial liabilities, separately showing amounts offset and not offset in the consolidated statements of financial position. The adoption of the amendments is required to be retrospectively applied for annual periods beginning on or after January 1, 2013. The adoption of the amendments is not expected to have an effect on the consolidated financial statements.
PFRS 10, Consolidated Financial Statements, introduces a new approach to determining which investees should be consolidated and provides a single model to be applied in the control analysis for all investees. An investor controls an investee when: (a) it is exposed or has rights to variable returns from its involvement with that investee; (b) it has the ability to affect those returns through its power over that investee; and (c) there is a link between power and returns. Control is reassessed as facts and circumstances change. PFRS 10 supersedes PAS 27 (2008), Consolidated and Separate Financial Statements and Philippine Interpretation Standards Interpretation Committee (SIC) - 12, Consolidation - Special Purpose Entities. The adoption of the new standard is required for annual periods beginning on or after January 1, 2013. The adoption of the new standard may result to changes in consolidation conclusion in respect of the Group’s investee and may lead to changes in the current accounting for these investees.
PFRS 11, Joint Arrangements, focuses on the rights and obligations of joint arrangements, rather than the legal form (as is currently the case). The new standard: (a) distinguishes joint arrangements between joint operations and joint ventures; and (b) eliminates the option of using the equity method or proportionate consolidation for jointly controlled entities that are now called joint ventures as it always requires the use of equity method. PFRS 11 supersedes PAS 31, Interests in Joint Ventures and Philippine Interpretation SIC - 13, Jointly Controlled Entities - Non Monetary Contributions by Venturers. The adoption of the new standard is required for annual periods beginning on or after January 1, 2013. The effect of the adoption of the new standard beginning January 1, 2013 will result to the elimination of the option to use proportionate consolidation, which is the current practice of the Group.
- 5 -
PFRS 12, Disclosure of Interests in Other Entities, contains the disclosure requirements for entities that have interests in subsidiaries, joint arrangements (i.e., joint operations or joint ventures), associates and/or unconsolidated structured entities. The new standard provides information that enables users to evaluate: (a) the nature of, and risks associated with, an entity’s interests in other entities; and (b) the effects of those interests on the entity’s financial position, financial performance and cash flows. The adoption of the new standard is required for annual periods beginning on or after January 1, 2013. The Group is currently assessing the disclosure requirements for interests in subsidiaries, joint arrangements, associates and unconsolidated structured entities in comparison with the existing disclosure.
Consolidated Financial Statements, Joint Arrangements and Disclosure of Interests in Other Entities: Transition Guidance (Amendments to PFRS 10, PFRS 11 and PFRS 12). The amendments: (a) simplify the process of adopting PFRS 10 and 11, and provide relief from the disclosures in respect of unconsolidated structured entities; (b) simplify the transition and provide additional relief from the disclosures that could have been onerous depending on the extent of comparative information provided in the consolidated financial statements; and (c) limit the restatement of comparatives to the immediately preceding period; this applies to the full suite of standards. Entities that provide comparatives for more than one period have the option of leaving additional comparative periods unchanged. In addition, the date of the initial application is now defined in PFRS 10 as the beginning of the annual reporting period in which the standard is applied for the first time. At this date, an entity tests whether there is a change in the consolidation conclusion for its investees. The adoption of the amendments is required for annual periods beginning on or after January 1, 2013. The Group is currently assessing the disclosure requirements for consolidated financial statements, joint arrangements and disclosure of interests in other entities in comparison with the existing disclosure.
PFRS 13, Fair Value Measurement, replaces the fair value measurement guidance contained in individual PFRS with a single source of fair value measurement guidance. It defines fair value, establishes a framework for measuring fair value and sets out disclosure requirements for fair value measurements. It explains how to measure fair value when it is required or permitted by other PFRS. It does not introduce new requirements to measure assets or liabilities at fair value nor does it eliminate the practicability exceptions to fair value measurements that currently exist in certain standards. The adoption of the new standard is required for annual periods beginning on or after January 1, 2013. The adoption of the new standard beginning January 1, 2013 is not expected to significantly change the Group’s methodologies in determining fair values.

Ginebra San Miguel Annual Report 2012 25Y E A R S
36 37
- 6 -
PAS 19, Employee Benefits (Amended 2011), includes the following requirements: (a) actuarial gains and losses are recognized immediately in other comprehensive income; this change will remove the corridor method and eliminate the ability of entities to recognize all changes in the defined benefit obligation and in plan assets in profit or loss, which is currently allowed under PAS 19; and (b) expected return on plan assets recognized in profit or loss is calculated based on the rate used to discount the defined benefit obligation. The adoption of the amendments is required to be retrospectively applied for annual periods beginning on or after January 1, 2013. The effect on the Group’s consolidated financial statements of the retrospective application of the amendments to PAS 19 beginning January 1, 2013 is estimated to decrease retirement assets by P6,488 and increase retirement liabilities and other comprehensive loss by P250,595 and P166,094, respectively, and a corresponding decrease to the opening balance of retained earnings amounting to P90,989.
PAS 27, Separate Financial Statements (2011), supersedes PAS 27 (2008). PAS 27 (2011) carries forward the existing accounting and disclosure requirements for separate financial statements, with some minor clarifications. The adoption of the amendments is required for annual periods beginning on or after January 1, 2013.
PAS 28, Investments in Associates and Joint Ventures (2011), supersedes PAS 28 (2008). PAS 28 (2011) makes the following amendments: (a) PFRS 5, Noncurrent Assets Held for Sale and Discontinued Operations, applies to an investment, or a portion of an investment, in an associate or a joint venture that meets the criteria to be classified as held for sale; and (b) on cessation of significant influence or joint control, even if an investment in an associate becomes an investment in a joint venture or vice versa, the entity does not remeasure the retained interest. The adoption of the amendments is required for annual periods beginning on or after January 1, 2013.
Improvements to PFRS 2009-2011 contain amendments to 5 standards with consequential amendments to other standards and interpretations, the adoption of which is not expected to have an effect on the consolidated financial statements.
o Comparative Information beyond Minimum Requirements (Amendments to
PAS 1). These amendments clarify the requirements for comparative information that are disclosed voluntarily and those that are mandatory due to retrospective application of an accounting policy, or retrospective restatement or reclassification of items in the consolidated financial statements. An entity must include comparative information in the related notes to the consolidated financial statements when it voluntarily provides comparative information beyond the minimum required comparative period. The additional comparative period does not need to contain a complete set of consolidated financial statements. On the other hand, supporting notes for the third balance sheet (mandatory when there is a retrospective application of an accounting policy, or retrospective restatement or reclassification of items in the consolidated financial statements) are not required. The adoption of the amendments is required for annual periods beginning on or after January 1, 2013.
- 7 -
o Presentation of the Opening Statement of Financial Position and Related Notes
(Amendments to PAS 1). These amendments clarify that: (a) the opening consolidated statement of financial position is required only if there is: (i) a change in accounting policy; (ii) a retrospective restatement; or (iii) a reclassification which has a material effect upon the information in that consolidated statement of financial position; (b) except for the disclosures required under PAS 8, Accounting Policies, Changes in Accounting Estimates and Errors, notes related to the opening consolidated statement of financial position are no longer required; and (c) the appropriate date for the opening consolidated statement of financial position is the beginning of the preceding period, rather than the beginning of the earliest comparative period presented. This is regardless of whether an entity provides additional comparative information beyond the minimum comparative information requirements. The amendments explain that the requirements for the presentation of notes related to additional comparative information and those related to the opening consolidated statement of financial position are different, because the underlying objectives are different. Consequential amendments have been made to PAS 34, Interim Financial Reporting. The adoption of the amendments is required for annual periods beginning on or after January 1, 2013.
o Classification of Servicing Equipment (Amendments to PAS 16, Property, Plant
and Equipment). These amendments clarify the accounting of spare parts, stand- by equipment and servicing equipment. The definition of ‘property, plant and equipment’ in PAS 16 is now considered in determining whether these items should be accounted for under this standard. If these items do not meet the definition, then they are accounted for using PAS 2, Inventories. The adoption of the amendments is required for annual periods beginning on or after January 1, 2013.
o Income Tax Consequences of Distributions (Amendments to PAS 32, Financial
Instruments Presentation). These amendments clarify that PAS 12, Income Taxes applies to the accounting for income taxes relating to: (a) distributions to holders of an equity instrument; and (b) transaction costs of an equity transaction. These amendments remove a perceived inconsistency between PAS 32 and PAS 12. Before the amendments, PAS 32 indicated that distributions to holders of an equity instrument are recognized directly in equity, net of any related income tax. However, PAS 12 generally requires the tax consequences of dividends to be recognized in profit or loss. A similar consequential amendment has also been made to Philippine Interpretation IFRIC 2, Members’ Share in Co-operative Entities and Similar Instruments. The adoption of the amendments is required for annual periods beginning on or after January 1, 2013.
o Segment Assets and Liabilities (Amendments to PAS 34). These amendments
align the disclosure requirements for segment assets and segment liabilities in interim consolidated financial statements with those in PFRS 8, Operating Segments. PAS 34 now requires the disclosure of a measure of total assets and liabilities for a particular reportable segment. In addition, such disclosure is only required when: (a) the amount is regularly provided to the chief operating decision maker; and (b) there has been a material change from the amount disclosed in the last annual consolidated financial statements for that reportable segment. The adoption of the amendments is required for annual periods beginning on or after January 1, 2013.

Ginebra San Miguel Annual Report 2012 25Y E A R S
38 39
- 8 -
Offsetting Financial Assets and Financial Liabilities (Amendments to PAS 32). These amendments clarify that: (a) an entity currently has a legally enforceable right to set- off if that right is: (i) not contingent on a future event; and (ii) enforceable both in the normal course of business and in the event of default, insolvency or bankruptcy of the entity and all counterparties; and (b) gross settlement is equivalent to net settlement if and only if the gross settlement mechanism has features that: (i) eliminate or result in insignificant credit and liquidity risk; and (ii) process receivables and payables in a single settlement process or cycle. The adoption of the amendments is required to be retrospectively applied for annual periods beginning on or after January 1, 2014. The adoption of the amendments is not expected to have an effect on the consolidated financial statements.
Investment Entities [Amendments to PFRS 10, PFRS 12 and PAS 27 (2011)]. These amendments provide consolidation exception for investment funds and require qualifying investment entities to recognize their investments in controlled entities, as well as investments in associates and joint ventures, in a single line item in the consolidated statement of financial position, measured at fair value through profit or loss; the only exception would be subsidiaries that are considered an extension of the investment entity’s investing activities. However, the parent of an investment entity (that is not itself an investment entity) is still required to consolidate all subsidiaries. This consolidation exception is mandatory. The adoption of the amendments is required for annual periods beginning on or after January 1, 2014.
PFRS 9, Financial Instruments (2010), PFRS 9, (2009). PFRS 9 (2009) introduces new requirements for the classification and measurement of financial assets. Under PFRS 9 (2009), financial assets are classified and measured based on the business model in which they are held and the characteristics of their contractual cash flows. PFRS 9 (2010) introduces additions relating to financial liabilities. The IASB currently has an active project to make limited amendments to the classification and measurement requirements of PFRS 9 and add new requirements to address the impairment of financial assets and hedge accounting. PFRS 9 (2010 and 2009) is effective for annual periods beginning on or after January 1, 2015. The Group conducted an evaluation on the possible financial impact of the adoptions of PFRS 9 and does not plan to adopt this standard early.
Financial Assets and Financial Liabilities Date of Recognition. The Group recognizes a financial asset or a financial liability in the consolidated statements of financial position when it becomes a party to the contractual provisions of the instrument. In the case of a regular way purchase or sale of financial assets, recognition is done using settlement date accounting.
- 9 -
Initial Recognition of Financial Instruments. Financial instruments are recognized initially at fair value of the consideration given (in case of an asset) or received (in case of a liability). The initial measurement of financial instruments, except for those designated as at fair value through profit or loss (FVPL), includes transaction costs. The Group classifies its financial assets in the following categories: held-to-maturity (HTM) investments, available-for-sale (AFS) financial assets, financial assets at FVPL and loans and receivables. The Group classifies its financial liabilities as either financial liabilities at FVPL or other financial liabilities. The classification depends on the purpose for which the investments are acquired and whether they are quoted in an active market. Management determines the classification of its financial assets and financial liabilities at initial recognition and, where allowed and appropriate, re-evaluates such designation at every reporting date. Determination of Fair Value. The fair value of financial instruments traded in active markets at the reporting date is based on their quoted market price or dealer price quotations (bid price for long positions and ask price for short positions), without any deduction for transaction costs. When current bid and ask prices are not available, the price of the most recent transaction provides evidence of the current fair value as long as there is no significant change in economic circumstances since the time of the transaction. For all other financial instruments not listed in an active market, the fair value is determined by using appropriate valuation techniques. Valuation techniques include the discounted cash flow method, comparison to similar instruments for which market observable prices exist, options pricing models and other relevant valuation models. ‘Day 1’ Profit. Where the transaction price in a non-active market is different to the fair value from other observable current market transactions in the same instrument or based on a valuation technique whose variables include only data from observable market, the Group recognizes the difference between the transaction price and the fair value (a ‘Day 1’ profit) in profit or loss unless it qualifies for recognition as some other type of asset. In cases where data used is not observable, the difference between the transaction price and model value is only recognized in profit or loss when the inputs become observable or when the instrument is derecognized. For each transaction, the Group determines the appropriate method of recognizing the ‘Day 1’ profit amount. Financial Assets Financial Assets at FVPL. A financial asset is classified as at FVPL if it is classified as held for trading or is designated as such upon initial recognition. Financial assets are designated as at FVPL if the Group manages such investments and makes purchase and sale decisions based on their fair value in accordance with the Group’s documented risk management or investment strategy. Derivative instruments (including embedded derivatives), except those covered by hedge accounting relationships, are classified under this category. Financial assets are classified as held for trading if they are acquired for the purpose of selling in the near term. Financial assets may be designated by management at initial recognition as at FVPL when any of the following criteria is met: the designation eliminates or significantly reduces the inconsistent treatment that would
otherwise arise from measuring the assets or recognizing gains or losses on a different basis;

Ginebra San Miguel Annual Report 2012 25Y E A R S
40 41
- 10 -
the assets are part of a group of financial assets which are managed and their performances are evaluated on a fair value basis, in accordance with a documented risk management or investment strategy; or
the financial instrument contains an embedded derivative, unless the embedded
derivative does not significantly modify the cash flows or it is clear, with little or no analysis, that it would not be separately recognized.
The Group carries financial assets at FVPL using their fair values. Attributable transaction costs are recognized in profit or loss as incurred. Fair value changes and realized gains or losses are recognized in profit or loss. Fair value changes from derivatives accounted for as part of an effective accounting hedge are recognized in other comprehensive income and presented in the consolidated statements of changes in equity. Any interest earned shall be recognized as part of “Interest income” in the consolidated statements of income. Any dividend income from equity securities classified as at FVPL shall be recognized in profit or loss when the right to receive payment has been established. The Group’s derivative assets are classified under this category (Note 10). The carrying amounts of financial assets under this category amounted to P1,288 and P315 as of December 31, 2012 and 2011, respectively (Note 36). Loans and Receivables. Loans and receivables are non-derivative financial assets with fixed or determinable payments and maturities that are not quoted in an active market. They are not entered into with the intention of immediate or short-term resale and are not designated as AFS financial assets or financial assets at FVPL. Subsequent to initial measurement, loans and receivables are carried at amortized cost using the effective interest rate method, less any impairment in value. Any interest earned on loans and receivables shall be recognized as part of “Interest income” in the consolidated statements of income on an accrual basis. Amortized cost is calculated by taking into account any discount or premium on acquisition and fees that are integral part of the effective interest rate. The periodic amortization is also included as part of “Interest income” in the consolidated statements of income. Gains or losses are recognized in profit or loss when loans and receivables are derecognized or impaired, as well as through the amortization process. Cash includes cash on hand and in banks which are stated at face value. Cash equivalents are short-term, highly liquid investments that are readily convertible to known amounts of cash and are subject to an insignificant risk of changes in value. The Group’s cash and cash equivalents, trade and other receivables and noncurrent receivables and deposits are included in this category (Notes 7, 8 and 15). The combined carrying amounts of financial assets under this category amounted to P4,810,342 and P3,955,406 as of December 31, 2012 and 2011, respectively (Note 36). HTM Investments. HTM investments are quoted non-derivative financial assets with fixed or determinable payments and fixed maturities for which the Group’s management has the positive intention and ability to hold to maturity. Where the Group sells other than an insignificant amount of HTM investments, the entire category would be tainted and reclassified as AFS financial assets. After initial measurement, these investments are measured at amortized cost using the effective interest rate method, less impairment in value. Any interest earned on the HTM investments shall be recognized as part of
- 11 -
“Interest income” in the consolidated statements of income on an accrual basis. Amortized cost is calculated by taking into account any discount or premium on acquisition and fees that are integral part of the effective interest rate. The periodic amortization is also included as part of “Interest income” in the consolidated statements of income. Gains or losses are recognized in profit or loss when the HTM investments are derecognized or impaired, as well as through the amortization process. As of December 31, 2012 and 2011, the Group has no investments accounted for under this category. AFS Financial Assets. AFS financial assets are non-derivative financial assets that are either designated in this category or not classified in any of the other financial asset categories. Subsequent to initial recognition, AFS financial assets are measured at fair value and changes therein, other than impairment losses and foreign currency differences on AFS debt instruments, are recognized in other comprehensive income and presented in the “Fair value reserve” in the consolidated statements of changes in equity. Dividends earned on holding AFS equity securities are recognized as “Dividend income” when the right to receive payment has been established. When individual AFS financial assets are either derecognized or impaired, the related accumulated unrealized gains or losses previously reported in equity are transferred to and recognized in profit or loss. AFS financial assets also include unquoted equity instruments with fair values which cannot be reliably determined. These instruments are carried at cost less impairment in value, if any. As of December 31, 2012 and 2011, the Group has no financial assets accounted for under this category. Financial Liabilities Financial Liabilities at FVPL. Financial liabilities are classified under this category through the fair value option. Derivative instruments (including embedded derivatives) with negative fair values, except those covered by hedge accounting relationships, are also classified under this category. The Group carries financial liabilities at FVPL using their fair values and reports fair value changes in profit or loss. Fair value changes from derivatives accounted for as part of an effective accounting hedge are recognized in other comprehensive income and presented in the consolidated statements of changes in equity. Any interest expense incurred is recognized as part of “Interest expense” in the consolidated statements of income. The Group’s derivative liabilities are classified under this category (Note 17). The carrying amounts of financial liabilities under this category amounted to P413 and P3,619 as of December 31, 2012 and 2011, respectively (Note 36). Other Financial Liabilities. This category pertains to financial liabilities that are not designated or classified as at FVPL. After initial measurement, other financial liabilities are carried at amortized cost using the effective interest rate method. Amortized cost is calculated by taking into account any premium or discount and any directly attributable transaction costs that are considered an integral part of the effective interest rate of the liability.

Ginebra San Miguel Annual Report 2012 25Y E A R S
42 43
- 12 -
The Group’s liabilities arising from its trade or borrowings such as notes payable, trade and other payables, long-term debt, finance lease liabilities and other noncurrent liabilities are included in this category (Notes 16, 17, 18, 19 and 30). The combined carrying amounts of financial liabilities under this category amounted to P15,238,118 and P11,960,939 as of December 31, 2012 and 2011, respectively (Note 36). Debt Issue Costs Debt issue costs are considered as an adjustment to the effective yield of the related debt and are deferred and amortized using the effective interest rate method. When a loan is paid, the related unamortized debt issue costs at the date of repayment are recognized in profit or loss. Derivative Financial Instruments and Hedging Freestanding Derivatives For the purpose of hedge accounting, hedges are classified as either: (a) fair value hedges when hedging the exposure to changes in the fair value of a recognized asset or liability or an unrecognized firm commitment (except for foreign currency risk); (b) cash flow hedges when hedging exposure to variability in cash flows that is either attributable to a particular risk associated with a recognized asset or liability or a highly probable forecast transaction or the foreign currency risk in an unrecognized firm commitment; or (c) hedges of a net investment in foreign operations. At the inception of a hedge relationship, the Group formally designates and documents the hedge relationship to which the Group wishes to apply hedge accounting and the risk management objective and strategy for undertaking the hedge. The documentation includes identification of the hedging instrument, the hedged item or transaction, the nature of the risk being hedged and how the entity will assess the hedging instrument’s effectiveness in offsetting the exposure to changes in the hedged item’s fair value or cash flows attributable to the hedged risk. Such hedges are expected to be highly effective in achieving offsetting changes in fair value or cash flows and are assessed on an ongoing basis to determine that they actually have been highly effective throughout the financial reporting periods for which they were designated. Fair Value Hedge. Derivatives classified as fair value hedges are carried at fair value with corresponding change in fair value recognized in profit or loss. The carrying amount of the hedged asset or liability is also adjusted for changes in fair value attributable to the hedged item and the gain or loss associated with that remeasurement is also recognized in profit or loss. When the hedge ceases to be highly effective, hedge accounting is discontinued and the adjustment to the carrying amount of a hedged financial instrument is amortized immediately. The Group discontinues fair value hedge accounting if the hedging instrument expired, is sold, terminated or exercised, the hedge no longer meets the criteria for hedge accounting or the Group revokes the designation. As of December 31, 2012 and 2011, the Group has no outstanding derivatives accounted for as fair value hedges.
- 13 -
Cash Flow Hedge. Changes in the fair value of a hedging instrument that qualifies as a highly effective cash flow hedge are recognized in other comprehensive income and presented in the consolidated statements of changes in equity. The ineffective portion is immediately recognized in profit or loss. If the hedged cash flow results in the recognition of an asset or a liability, all gains or losses previously recognized directly in equity are transferred from equity and included in the initial measurement of the cost or carrying amount of the asset or liability. Otherwise, for all other cash flow hedges, gains or losses initially recognized in equity are transferred from equity to profit or loss in the same period or periods during which the hedged forecasted transaction or recognized asset or liability affects profit or loss. When the hedge ceases to be highly effective, hedge accounting is discontinued prospectively. The cumulative gain or loss on the hedging instrument that has been reported directly in equity is retained in equity until the forecasted transaction occurs. When the forecasted transaction is no longer expected to occur, any net cumulative gain or loss previously reported in equity is recognized in profit or loss. As of December 31, 2012 and 2011, the Group has no outstanding derivatives accounted for as cash flow hedges. Net Investment Hedge. As of December 31, 2012 and 2011, the Group has no hedge of a net investment in a foreign operation. For derivatives that do not qualify for hedge accounting, any gains or losses arising from changes in fair value of derivatives are taken directly to profit or loss during the year incurred. Embedded Derivatives The Group assesses whether embedded derivatives are required to be separated from host contracts when the Group becomes a party to the contract. An embedded derivative is separated from the host contract and accounted for as a derivative if all of the following conditions are met: (a) the economic characteristics and risks of the embedded derivative are not closely related to the economic characteristics and risks of the host contract; (b) a separate instrument with the same terms as the embedded derivative would meet the definition of a derivative; and (c) the hybrid or combined instrument is not recognized at FVPL. Reassessment only occurs if there is a change in the terms of the contract that significantly modifies the cash flows that would otherwise be required. Derecognition of Financial Assets and Financial Liabilities Financial Assets. A financial asset (or, where applicable, a part of a financial asset or part of a group of similar financial assets) is derecognized when: the rights to receive cash flows from the asset have expired; the Group retains the right to receive cash flows from the asset, but has assumed an
obligation to pay them in full without material delay to a third party under a “pass-through” arrangement; or
the Group has transferred its rights to receive cash flows from the asset and either:
(a) has transferred substantially all the risks and rewards of the asset, or (b) has neither transferred nor retained substantially all the risks and rewards of the asset, but has transferred control of the asset.

Ginebra San Miguel Annual Report 2012 25Y E A R S
44 45
- 14 -
When the Group has transferred its rights to receive cash flows from an asset and has neither transferred nor retained substantially all the risks and rewards of the asset nor transferred control of the asset, the asset is recognized to the extent of the Group’s continuing involvement in the asset. Continuing involvement that takes the form of a guarantee over the transferred asset is measured at the lower of the original carrying amount of the asset and the maximum amount of consideration that the Group could be required to repay. Financial Liabilities. A financial liability is derecognized when the obligation under the liability is discharged, cancelled or expired. When an existing financial liability is replaced by another from the same lender on substantially different terms, or the terms of an existing liability are substantially modified, such an exchange or modification is treated as a derecognition of the original liability and the recognition of a new liability. The difference in the respective carrying amounts is recognized in profit or loss. Impairment of Financial Assets The Group assesses at the reporting date whether a financial asset or group of financial assets is impaired. A financial asset or a group of financial assets is deemed to be impaired if, and only if, there is objective evidence of impairment as a result of one or more events that have occurred after the initial recognition of the asset (an incurred loss event) and that loss event has an impact on the estimated future cash flows of the financial asset or the group of financial assets that can be reliably estimated. Assets Carried at Amortized Cost. For assets carried at amortized cost such as loans and receivables, the Group first assesses whether objective evidence of impairment exists individually for financial assets that are individually significant, or collectively for financial assets that are not individually significant. If no objective evidence of impairment has been identified for a particular financial asset that was individually assessed, the Group includes the asset as part of a group of financial assets pooled according to their credit risk characteristics and collectively assesses the group for impairment. Assets that are individually assessed for impairment and for which an impairment loss is, or continues to be, recognized are not included in the collective impairment assessment. Evidence of impairment for specific impairment purposes may include indications that the borrower or a group of borrowers is experiencing financial difficulty, default or delinquency in principal or interest payments, or may enter into bankruptcy or other form of financial reorganization intended to alleviate the financial condition of the borrower. For collective impairment purposes, evidence of impairment may include observable data on existing economic conditions or industry-wide developments indicating that there is a measurable decrease in the estimated future cash flows of the related assets. If there is objective evidence of impairment, the amount of loss is measured as the difference between the asset’s carrying amount and the present value of estimated future cash flows (excluding future credit losses) discounted at the financial asset’s original effective interest rate (i.e., the effective interest rate computed at initial recognition). Time value is generally not considered when the effect of discounting the cash flows is not material. If a loan or receivable has a variable rate, the discount rate for measuring any impairment loss is the current effective interest rate, adjusted for the original credit risk premium. For collective impairment purposes, impairment loss is computed based on their respective default and historical loss experience.
- 15 -
The carrying amount of the asset shall be reduced either directly or through the use of an allowance account. The impairment loss for the period shall be recognized in profit or loss. If, in a subsequent period, the amount of the impairment loss decreases and the decrease can be related objectively to an event occurring after the impairment was recognized, the previously recognized impairment loss is reversed. Any subsequent reversal of an impairment loss is recognized in profit or loss, to the extent that the carrying amount of the asset does not exceed its amortized cost at the reversal date. AFS Financial Assets. If an AFS financial asset is impaired, an amount comprising the difference between the cost (net of any principal payment and amortization) and its current fair value, less any impairment loss on that financial asset previously recognized in profit or loss, is transferred from equity to profit or loss. Reversals in respect of equity instruments classified as AFS financial assets are not recognized in profit or loss. Reversals of impairment losses on debt instruments are recognized in profit or loss, if the increase in fair value of the instrument can be objectively related to an event occurring after the impairment loss was recognized in profit or loss. In the case of an unquoted equity instrument or of a derivative asset linked to and must be settled by delivery of an unquoted equity instrument, for which its fair value cannot be reliably measured, the amount of impairment loss is measured as the difference between the asset’s carrying amount and the present value of estimated future cash flows from the asset discounted using its historical effective rate of return on the asset. Classification of Financial Instruments between Debt and Equity From the perspective of the issuer, a financial instrument is classified as debt instrument if it provides for a contractual obligation to: deliver cash or another financial asset to another entity; exchange financial assets or financial liabilities with another entity under conditions
that are potentially unfavorable to the Group; or satisfy the obligation other than by the exchange of a fixed amount of cash or another
financial asset for a fixed number of own equity shares. If the Group does not have an unconditional right to avoid delivering cash or another financial asset to settle its contractual obligation, the obligation meets the definition of a financial liability. Offsetting Financial Instruments Financial assets and financial liabilities are offset and the net amount is reported in the consolidated statements of financial position if, and only if, there is a currently enforceable legal right to offset the recognized amounts and there is an intention to settle on a net basis, or to realize the asset and settle the liability simultaneously. This is not generally the case with master netting agreements, and the related assets and liabilities are presented gross in the consolidated statements of financial position. Inventories Finished goods, goods in process and materials and supplies are valued at the lower of cost and net realizable value.

Ginebra San Miguel Annual Report 2012 25Y E A R S
46 47
- 16 -
Costs incurred in bringing each inventory to its present location and conditions are accounted for as follows:
Finished goods and goods in process
- at cost which includes direct materials and labor and a proportion of manufacturing overhead costs based on normal operating capacity but excluding borrowing costs; costs are determined using the moving-average method;
Materials and supplies - at cost using the moving-average method. Net realizable value of finished goods is the estimated selling price in the ordinary course of business, less the estimated costs necessary to make the sale. Net realizable value of goods in process is the estimated selling price in the ordinary course of business, less the estimated costs of completion and the estimated costs necessary to make the sale. Net realizable value of materials and supplies is the current replacement cost. An allowance for inventory losses is provided to write down inventories whenever net realizable value becomes lower than cost due to damage, physical deterioration, obsolescence, changes in price levels or other causes. When inventories are sold, the related allowance is reversed in the same period. Containers (i.e., returnable bottles and shells) are stated at deposit values less any impairment in value. The excess of the acquisition cost of the containers over their deposit value is presented under deferred containers included under “Other noncurrent assets” account in the consolidated statements of financial position and is amortized over the estimated useful lives of ten years. Amortization of deferred containers is included under “Selling and administrative expenses” account in the consolidated statements of income. Business Combination Business combinations are accounted for using the acquisition method as at the acquisition date, which is the date on which control is transferred to the Group. Control is the power to govern the financial and operating policies of an entity so as to obtain benefits from its activities. In assessing control, the Group takes into consideration potential voting rights that currently are exercisable. If the business combination is achieved in stages, the acquisition date fair value of the acquirer’s previously held equity interest in the acquiree is remeasured to fair value at the acquisition date through profit or loss. The Group measures goodwill at the acquisition date as: (a) the fair value of the consideration transferred; plus (b) the recognized amount of any non-controlling interests in the acquiree; plus (c) if the business combination is achieved in stages, the fair value of the existing equity interest in the acquiree; less (d) the net recognized amount (generally fair value) of the identifiable assets acquired and liabilities assumed. When the excess is negative, a bargain purchase gain is recognized immediately in profit or loss. Subsequently, goodwill is measured at cost less any accumulated impairment in value. Goodwill is reviewed for impairment, annually or more frequently, if events or changes in circumstances indicate that the carrying amount may be impaired.
- 17 -
The consideration transferred does not include amounts related to the settlement of pre-existing relationships. Such amounts are generally recognized in profit or loss. Cost related to acquisition, other than those associated with the issue of debt or equity securities, that the Group incurs in connection with a business combination are expensed as incurred. Any contingent consideration payable is measured at fair value at the acquisition date. If the contingent consideration is classified as equity, then it is not remeasured and settlement is accounted for within equity. Otherwise, subsequent changes to the fair value of the contingent consideration are recognized in profit or loss. Goodwill in a Business Combination
Goodwill acquired in a business combination is, from the acquisition date, allocated to each of the cash-generating units, or groups of cash-generating units that are expected to benefit from the synergies of the combination, irrespective of whether other assets or liabilities are assigned to those units or groups of units. Each unit or group of units to which the goodwill is so allocated: represents the lowest level within the Group at which the goodwill is monitored
for internal management purposes; and
is not larger than an operating segment determined in accordance with PFRS 8, Operating Segments.
Impairment is determined by assessing the recoverable amount of the cash- generating unit or group of cash-generating units, to which the goodwill relates. Where the recoverable amount of the cash-generating unit or group of cash-generating units is less than the carrying amount, an impairment loss is recognized. Where goodwill forms part of a cash-generating unit or group of cash-generating units and part of the operation within that unit is disposed of, the goodwill associated with the operation disposed of is included in the carrying amount of the operation when determining the gain or loss on disposal of the operation. Goodwill disposed of in this circumstance is measured based on the relative values of the operation disposed of and the portion of the cash-generating unit retained. An impairment loss with respect to goodwill is not reversed.
Intangible Asset Acquired in a Business Combination The cost of an intangible asset acquired in a business combination is the fair value as at the date of acquisition, determined using discounted cash flows as a result of the asset being owned. Following initial recognition, intangible asset is carried at cost less any accumulated amortization and impairment losses, if any. The useful life of an intangible asset is assessed to be either finite or indefinite. An intangible asset with finite life is amortized over the useful economic life and assessed for impairment whenever there is an indication that the intangible asset may be impaired. The amortization period and the amortization method for an intangible asset with a finite useful life are reviewed at least at each reporting date. A change in the expected useful life or the expected pattern of consumption of future economic benefits embodied in the asset is accounted for as a change in accounting estimates. The amortization expense on intangible asset with finite life is recognized in profit or loss.

Ginebra San Miguel Annual Report 2012 25Y E A R S
48 49
- 18 -
Loss of Control Upon the loss of control, the Group derecognizes the assets and liabilities of the subsidiary, any non-controlling interests and the other components of equity related to the subsidiary. Any surplus or deficit arising on the loss of control is recognized in profit or loss. If the Group retains any interest in the previous subsidiary, then such interest is measured at fair value at the date that control is lost. Subsequently, it is accounted for as an equity-accounted investee or as an AFS financial asset depending on the level of influence retained.
Transactions under Common Control Transactions under common control entered into in contemplation of each other and business combination under common control designed to achieve an overall commercial effect are treated as a single transaction. Transfers of assets between commonly controlled entities are accounted for using the book value accounting. Interest in Joint Venture The Group generally recognizes its interest in joint venture using proportionate consolidation. The Group combines its share in each of the assets, liabilities, income and expenses of the joint venture with similar items, line by line, in its consolidated financial statements. The financial statements of the joint venture are prepared for the same reporting period as the Parent Company, using uniform accounting policies for like transactions and other events in similar circumstances. Adjustments are made to bring into line any dissimilar accounting policies that may exist. The joint venture is proportionately consolidated until the date when the Group ceases to have joint control over the joint venture. Property, Plant and Equipment Property, plant and equipment, except land, are stated at cost less accumulated depreciation and amortization and any accumulated impairment in value. Such cost includes the cost of replacing part of the property, plant and equipment at the time that cost is incurred, if the recognition criteria are met, and excludes the costs of day-to-day servicing. Land is stated at cost less any impairment in value. The initial cost of property, plant and equipment comprises its construction cost or purchase price, including import duties, taxes and any directly attributable costs in bringing the asset to its working condition and location for its intended use. Cost also includes any related asset retirement obligation (ARO). Expenditures incurred after the asset has been put into operation, such as repairs, maintenance and overhaul costs, are normally recognized as expense in the period the costs are incurred. Major repairs are capitalized as part of property, plant and equipment only when it is probable that future economic benefits associated with the items will flow to the Group and the cost of the item can be measured reliably. Construction in progress represents structures under construction and is stated at cost. This includes the costs of construction and other direct costs. Borrowing costs that are directly attributable to the construction of plant and equipment are capitalized during the construction period. Construction in progress is not depreciated until such time that the relevant assets are ready for use.
- 19 -
Depreciation and amortization are computed using the straight-line method over the following estimated useful lives of the assets:
Number of Years Land improvements 5 - 10 Buildings and building improvements 20 - 50 Transportation equipment 5 Machinery and equipment 3 - 40 Furniture, fixtures and office equipment 2 - 5 Other equipment 2 - 5 Leasehold improvements 10 - 30 or
term of the lease, whichever
is shorter The remaining useful lives, residual values, depreciation and amortization method are reviewed and adjusted periodically, if appropriate, to ensure that such periods and method of depreciation and amortization are consistent with the expected pattern of economic benefits from the items of property, plant and equipment. The carrying amounts of property, plant and equipment are reviewed for impairment when events or changes in circumstances indicate that the carrying amounts may not be recoverable. Fully depreciated assets are retained in the accounts until they are no longer in use and no further depreciation and amortization are recognized in profit or loss. An item of property, plant and equipment is derecognized when either it has been disposed of or when it is permanently withdrawn from use and no future economic benefits are expected from its use or disposal. Any gain or loss arising on the retirement and disposal of an item of property, plant and equipment (calculated as the difference between the net disposal proceeds and the carrying amount of the asset) is included in profit or loss in the period of retirement or disposal. Investment Properties Investment properties consist of properties held to earn rentals and/or for capital appreciation but not for sale in the ordinary course of business, used in the production or supply of goods or services or for administrative purposes. Investment properties, except for land, are measured at cost including transaction costs less accumulated depreciation and amortization and any accumulated impairment in value. The carrying amount includes the cost of replacing part of an existing investment property at the time the cost is incurred, if the recognition criteria are met, and excludes the costs of day-to-day servicing of an investment property. Land is stated at cost less any impairment in value.

Ginebra San Miguel Annual Report 2012 25Y E A R S
50 51
- 20 -
Depreciation and amortization are computed using the straight-line method over the following estimated useful lives of the assets:
Number of Years Land improvements 5 - 10 Buildings and building improvements 20 - 50 Machinery and equipment 3 - 40 Other equipment 2 - 5
The useful lives, residual values and depreciation and amortization method are reviewed and adjusted, if appropriate, at each reporting date. Investment property is derecognized either when it has been disposed of or when it is permanently withdrawn from use and no future economic benefit is expected from its disposal. Any gains and losses on the retirement and disposal of investment property are recognized in profit or loss in the period of retirement or disposal. Transfers are made to investment property when, and only when, there is a change in use, evidenced by ending of owner-occupation or commencement of an operating lease to another party. Transfers are made from investment property when, and only when, there is a change in use, evidenced by commencement of the owner-occupation or commencement of development with a view to sell. For a transfer from investment property to owner-occupied property or inventories, the cost of property for subsequent accounting is its carrying amount at the date of change in use. If the property occupied by the Group as an owner-occupied property becomes an investment property, the Group accounts for such property in accordance with the policy stated under property, plant and equipment up to the date of change in use. Intangible Assets Intangible assets acquired separately are measured on initial recognition at cost. The cost of intangible assets acquired in a business combination is its fair value as at the date of acquisition. Subsequently, intangible assets are measured at cost less accumulated amortization and any accumulated impairment losses. Internally generated intangible assets, excluding capitalized development costs, are not capitalized and expenditures are recognized in profit or loss in the year in which the related expenditures are incurred. The useful lives of intangible assets are assessed to be either finite or indefinite. Intangible assets with finite lives are amortized over the useful life and assessed for impairment whenever there is an indication that the intangible assets may be impaired. The amortization period and the amortization method used for an intangible asset with a finite useful life are reviewed at least at each reporting date. Changes in the expected useful life or the expected pattern of consumption of future economic benefits embodied in the asset are accounted for by changing the amortization period or method, as appropriate, and are treated as changes in accounting estimates. The amortization expense on intangible assets with finite lives is recognized in profit or loss consistent with the function of the intangible asset. Goodwill and licenses with indefinite useful lives are tested for impairment annually either individually or at the cash-generating unit level. Such intangibles are not amortized. The useful life of an intangible asset with an indefinite life is reviewed annually to determine whether indefinite life assessment continues to be supportable. If not, the change in the useful life assessment from indefinite to finite is made on a prospective basis.
- 21 -
Gains or losses arising from disposal of an intangible asset are measured as the difference between the net disposal proceeds and the carrying amount of the asset and are recognized in profit or loss when the asset is derecognized. Impairment of Non-financial Assets The carrying amounts of property, plant and equipment, investment properties, deferred containers and idle assets are reviewed for impairment when events or changes in circumstances indicate that the carrying amount may not be recoverable. Intangible assets with indefinite useful lives are tested for impairment annually either individually or at the cash-generating unit level. If any such indication exists, and if the carrying amount exceeds the estimated recoverable amount, the assets or cash-generating units are written down to their recoverable amounts. The recoverable amount of the asset is the greater of fair value less costs to sell and value in use. The fair value less costs to sell is the amount obtainable from the sale of an asset in an arm’s length transaction between knowledgeable, willing parties, less costs of disposal. In assessing value in use, the estimated future cash flows are discounted to their present value using a pre-tax discount rate that reflects current market assessments of the time value of money and the risks specific to the asset. For an asset that does not generate largely independent cash inflows, the recoverable amount is determined for the cash-generating unit to which the asset belongs. Impairment losses are recognized in profit or loss in those expense categories consistent with the function of the impaired asset. An assessment is made at each reporting date as to whether there is any indication that previously recognized impairment losses may no longer exist or may have decreased. If such indication exists, the recoverable amount is estimated. A previously recognized impairment loss is reversed only if there has been a change in the estimates used to determine the asset’s recoverable amount since the last impairment loss was recognized. If that is the case, the carrying amount of the asset is increased to its recoverable amount. That increased amount cannot exceed the carrying amount that would have been determined, net of depreciation and amortization, had no impairment loss been recognized for the asset in prior years. Such reversal is recognized in profit or loss. After such a reversal, the depreciation and amortization charge is adjusted in future periods to allocate the asset’s revised carrying amount, less any residual value, on a systematic basis over its remaining useful life. Provisions Provisions are recognized when: (a) the Group has a present obligation (legal or constructive) as a result of past event; (b) it is probable (i.e., more likely than not) that an outflow of resources embodying economic benefits will be required to settle the obligation; and (c) a reliable estimate can be made of the amount of the obligation. If the effect of the time value of money is material, provisions are determined by discounting the expected future cash flows at a pre-tax rate that reflects current market assessment of the time value of money and those specific to the liability. Where discounting is used, the increase in the provision due to the passage of time is recognized as interest expense. Where some or all of the expenditure required to settle a provision is expected to be reimbursed by another party, the reimbursement shall be recognized when, and only when, it is virtually certain that reimbursement will be received if the entity settles the obligation. The reimbursement shall be treated as a separate asset. The amount recognized for the reimbursement shall not exceed the amount of the provision. Provisions are reviewed at each reporting date and adjusted to reflect the current best estimate.
Ginebra San Miguel Annual Report 2012 25Y E A R S
52 53
- 22 -
Share Capital Common Shares Common shares are classified as equity. Incremental costs directly attributable to the issue of common shares and share options are recognized as a deduction from equity, net of any tax effects. Preferred Shares Preferred shares are classified as equity if they are non-redeemable, or redeemable only at the Parent Company’s option, and any dividends thereon are discretionary. Dividends thereon are recognized as distributions within equity upon approval by the Parent Company’s BOD. Preferred shares are classified as a liability if they are redeemable on a specific date or at the option of the shareholders, or if dividend payments are not discretionary. Dividends thereon are recognized as interest expense in profit or loss as accrued. Treasury Shares Own equity instruments which are reacquired are carried at cost and are deducted from equity. No gain or loss is recognized on the purchase, sale, reissuance or cancellation of the Parent Company’s own equity instruments. When the shares are retired, the capital stock account is reduced by its par value and the excess of cost over par value upon retirement is debited to additional paid-in capital to the extent of the specific or average additional paid-in capital when the shares were issued and to retained earnings for the remaining balance. Revenue Recognition Revenue is recognized to the extent that it is probable that the economic benefits will flow to the Group and the amount of the revenue can be reliably measured. The following specific recognition criteria must also be met before revenue is recognized: Sales. Revenue from the sale of goods in the course of ordinary activities is measured at the fair value of the consideration received or receivable, net of returns, trade discounts and volume rebates. Revenue is recognized when the significant risks and rewards of ownership of the goods have passed to the buyer, which is normally upon delivery, and the amount of revenue can be measured reliably. Interest. Revenue is recognized as the interest accrues, taking into account the effective yield on the asset. Dividend. Revenue is recognized when the Group’s right as a shareholder to receive the payment is established. Rent. Revenue from investment properties is recognized on a straight-line basis over the term of the lease. Rent income is included as part of other income. Others. Revenue is recognized when earned. Cost and Expense Recognition Costs and expenses are recognized upon receipt of goods, utilization of services or at the date they are incurred.
- 23 -
Expenses are also recognized when decrease in future economic benefit related to a decrease in an asset or an increase in a liability that can be measured reliably has arisen. Expenses are recognized on the basis of a direct association between costs incurred and the earning of specific items of income; on the basis of systematic and rational allocation procedures when economic benefits are expected to arise over several accounting periods and the association can only be broadly or indirectly determined; or immediately when an expenditure produces no future economic benefits or when, and to the extent that future economic benefits do not qualify, or cease to qualify, for recognition as an asset. Share-based Payment Transactions The cost of Employee Stock Purchase Plan (ESPP) is measured by reference to the market price at the time of the grant less subscription price. The cost of share-based payment transactions is recognized, together with a corresponding increase in equity, over the period in which the performance and/or service conditions are fulfilled, ending on the date when the relevant employees become fully entitled to the award (“the vesting date”). The cumulative expenses recognized for share-based payment transactions, at each reporting date until the vesting date reflects the extent to which the vesting period has expired and the Parent Company’s best estimate of the number of equity instruments that will ultimately vest. Where the terms of a share-based award are modified, as a minimum, an expense is recognized as if the terms had not been modified. In addition, an expense is recognized for any modification, which increases the total fair value of the share-based payment arrangement, or is otherwise beneficial to the employee as measured at the date of modification. Where an equity-settled award is cancelled, it is treated as if it had vested on the date of cancellation, and any expense not yet recognized for the award is recognized immediately. However, if a new award is substituted for the cancelled award, and designated as a replacement award on the date that it is granted, the cancelled and new awards are treated as if they were a modification of the original award, as described in the previous paragraph. Leases The determination of whether an arrangement is, or contains, a lease is based on the substance of the arrangement and requires an assessment of whether the fulfillment of the arrangement is dependent on the use of a specific asset or assets and the arrangement conveys a right to use the asset. A reassessment is made after the inception of the lease only if one of the following applies: (a) there is a change in contractual terms, other than a renewal or extension of the
arrangement; (b) a renewal option is exercised or extension granted, unless the term of the renewal or
extension was initially included in the lease term; (c) there is a change in the determination of whether fulfillment is dependent on a
specific asset; or (d) there is a substantial change to the asset. Where a reassessment is made, lease accounting shall commence or cease from the date when the change in circumstances gives rise to the reassessment for scenarios (a), (c) or (d) and at the date of renewal or extension period for scenario (b) above.

Ginebra San Miguel Annual Report 2012 25Y E A R S
54 55
- 24 -
Finance Lease Finance leases, which transfer to the Group substantially all the risks and benefits incidental to ownership of the leased item, are capitalized at the inception of the lease at the fair value of the leased property or, if lower, at the present value of the minimum lease payments. Obligations arising from plant assets under finance lease agreements are classified in the consolidated statements of financial position as finance lease liabilities. Lease payments are apportioned between financing charges and reduction of the lease liability so as to achieve a constant rate of interest on the remaining balance of the liability. Financing charges are recognized in profit or loss. Capitalized leased assets are depreciated over the estimated useful life of the assets when there is reasonable certainty that the Group will obtain ownership by the end of the lease term. Operating Lease Group as Lessee. Leases which do not transfer to the Group substantially all the risks and benefits of ownership of the asset are classified as operating leases. Operating lease payments are recognized as an expense in profit or loss on a straight-line basis over the lease term. Associated costs such as maintenance and insurance are expensed as incurred. Group as Lessor. Leases where the Group does not transfer substantially all the risks and benefits of ownership of the assets are classified as operating leases. Rent income from operating leases is recognized as income on a straight-line basis over the lease term. Initial direct costs incurred in negotiating an operating lease are added to the carrying amount of the leased asset and recognized as an expense over the lease term on the same basis as rent income. Contingent rents are recognized as income in the period in which they are earned. Borrowing Costs Borrowing costs are capitalized if they are directly attributable to the acquisition or construction of a qualifying asset. Capitalization of borrowing costs commences when the activities to prepare the asset are in progress and expenditures and borrowing costs are being incurred. Borrowing costs are capitalized until the assets are substantially ready for their intended use. If the carrying amount of the asset exceeds its recoverable amount, an impairment loss is recognized. Research Costs Research costs are expensed as incurred.
- 25 -
Retirement Costs The Parent Company and DBI have separate funded, noncontributory retirement plans, administered by the respective trustees, covering their respective permanent employees. Retirement costs are actuarially determined using the projected unit credit method. This method reflects service rendered by employees up to the date of valuation and incorporates assumptions concerning employees’ projected salaries. Retirement cost includes current service cost, interest cost, expected return on plan assets, amortization of unrecognized past service costs, recognition of actuarial gains and losses, effect of asset limit and effect of any curtailments or settlements. Past service cost is recognized as an expense on a straight-line basis over the average period until the benefits become vested. If the benefits are already vested immediately following the introduction of, or changes to the plan, past service cost is recognized immediately as an expense. Actuarial gains and losses are recognized as income or expense when the net cumulative unrecognized actuarial gains and losses at the end of the previous reporting year exceed the greater of 10% of the present value of the defined benefit obligation and the fair value of plan assets at that date. These gains or losses are recognized over the expected average remaining working lives of the employees participating in the plan. The defined benefit liability is the aggregate of the present value of the defined benefit obligation and actuarial gains and losses not recognized, reduced by past service costs not yet recognized and the fair value of plan assets out of which the obligations are to be settled directly. If such aggregate is negative, the resulting asset is measured at the lower of such aggregate or the aggregate of cumulative unrecognized net actuarial losses and past service costs and the present value of any economic benefits available in the form of reductions in the future contributions to the plan. If the asset is measured at the aggregate of cumulative unrecognized net actuarial losses and past service costs and the present value of any economic benefits available in the form of reductions in the future contributions to the plan, net actuarial losses of the current period and past service costs of the current period are recognized immediately to the extent that they exceed any reduction in the present value of those economic benefits. If there is no change or an increase in the present value of the economic benefits, the entire net actuarial losses of the current period and past service costs of the current period are recognized immediately. Similarly, net actuarial gains of the current period after the deduction of past service costs of the current period exceeding any increase in the present value of the economic benefits stated above are recognized immediately if the asset is measured at the aggregate of cumulative unrecognized net actuarial losses and past service costs and the present value of any economic benefits available in the form of reductions in the future contributions to the plan. If there is no change or a decrease in the present value of the economic benefits, the entire net actuarial gains of the current period after the deduction of past service costs of the current period are recognized immediately. Foreign Currency Foreign Currency Translations Transactions in foreign currencies are translated to the respective functional currencies of Group entities at exchange rates at the dates of the transactions. Monetary assets and liabilities denominated in foreign currencies at the reporting date are retranslated to the functional currency at the exchange rate at that date. The foreign currency gain or loss on monetary items is the difference between amortized cost in the functional currency at the beginning of the year, adjusted for effective interest and payments during the year, and the amortized cost in foreign currency translated at the exchange rate at the end of the reporting date.
Ginebra San Miguel Annual Report 2012 25Y E A R S
56 57
- 26 -
Nonmonetary assets and liabilities denominated in foreign currencies that are measured at fair value are retranslated to the functional currency at the exchange rate at the date that the fair value was determined. Nonmonetary items in a foreign currency that are measured in terms of historical cost are translated using the exchange rate at the date of the transaction. Foreign currency differences arising on retranslation are recognized in profit or loss, except for differences arising on the retranslation of AFS financial assets, a financial liability designated as a hedge of the net investment in a foreign operation that is effective, or qualifying cash flow hedges, which are recognized in other comprehensive income. Foreign Operations The assets and liabilities of foreign operations, including goodwill and fair value adjustments arising on acquisition, are translated to Philippine peso at exchange rates at the reporting date. The income and expenses of foreign operations, excluding foreign operations in hyperinflationary economies, are translated to Philippine peso at average exchange rates for the period. Foreign currency differences are recognized in other comprehensive income, and presented in the foreign currency translation reserve (Translation reserve) in the consolidated statements of changes in equity. However, if the operation is not a wholly-owned subsidiary, then the relevant proportionate share of the translation difference is allocated to the non-controlling interests. When a foreign operation is disposed of such that control, significant influence or joint control is lost, the cumulative amount in the translation reserve related to that foreign operation is reclassified to profit or loss as part of the gain or loss on disposal. When the Group disposes of only part of its interest in a subsidiary that includes a foreign operation while retaining control, the relevant proportion of the cumulative amount is reattributed to non-controlling interests. When the Group disposes of only part of its investment in an associate or joint venture that includes a foreign operation while retaining significant influence or joint control, the relevant proportion of the cumulative amount is reclassified to profit or loss. When the settlement of a monetary item receivable from or payable to a foreign operation is neither planned nor likely in the foreseeable future, foreign exchange gains and losses arising from such a monetary item are considered to form part of a net investment in a foreign operation and are recognized in other comprehensive income, and presented in the “Translation reserve” in the consolidated statements of changes in equity. The functional currency of GSMIL, GSMIHL and SHL is the Philippine peso, while that of Thai San Miguel Liquor Co. Ltd. (TSML) and Thai Ginebra Trading (TGT) is the Thailand Baht (THB). The assets and liabilities of TSML and TGT are translated into the presentation currency of the Parent Company at the rate of exchange ruling at the reporting date and their income and expenses are translated at the average exchange rates for the year. Taxes Current Tax. Current tax is the expected tax payable or receivable on the taxable income or loss for the year, using tax rates enacted or substantively enacted at the reporting date, and any adjustment to tax payable in respect of previous years. Deferred Tax. Deferred tax is recognized in respect of temporary differences between the carrying amounts of assets and liabilities for financial reporting purposes and the amounts used for taxation purposes.
- 27 -
Deferred tax liabilities are recognized for all taxable temporary differences, except: where the deferred tax liability arises from the initial recognition of goodwill or of an
asset or liability in a transaction that is not a business combination and, at the time of the transaction, affects neither the accounting profit nor taxable profit or loss; and
with respect to taxable temporary differences associated with investments in
subsidiaries, associates and interests in joint ventures, where the timing of the reversal of the temporary differences can be controlled and it is probable that the temporary differences will not reverse in the foreseeable future.
Deferred tax assets are recognized for all deductible temporary differences, carryforward benefits of unused tax credits - Minimum Corporate Income Tax (MCIT) and unused tax losses - Net Operating Loss Carry Over (NOLCO), to the extent that it is probable that taxable profit will be available against which the deductible temporary differences, and the carryforward benefits of MCIT and NOLCO can be utilized, except: where the deferred tax asset relating to the deductible temporary difference arises
from the initial recognition of an asset or liability in a transaction that is not a business combination and, at the time of the transaction, affects neither the accounting profit nor taxable profit or loss; and
with respect to deductible temporary differences associated with investments in
subsidiaries, associates and interests in joint ventures, deferred tax assets are recognized only to the extent that it is probable that the temporary differences will reverse in the foreseeable future and taxable profit will be available against which the temporary differences can be utilized.
The carrying amount of deferred tax assets is reviewed at each reporting date and reduced to the extent that it is no longer probable that sufficient taxable profit will be available to allow all or part of the deferred tax asset to be utilized. Unrecognized deferred tax assets are reassessed at each reporting date and are recognized to the extent that it has become probable that future taxable profit will allow the deferred tax asset to be recovered. The measurement of deferred tax reflects the tax consequences that would follow the manner in which the Group expects, at the end of the reporting period, to recover or settle the carrying amount of its assets and liabilities. Deferred tax assets and liabilities are measured at the tax rates that are expected to apply in the year when the asset is realized or the liability is settled, based on tax rates (and tax laws) that have been enacted or substantively enacted at the reporting date. In determining the amount of current and deferred tax, the Group takes into account the impact of uncertain tax positions and whether additional taxes and interest may be due. The Group believes that its accruals for tax liabilities are adequate for all open tax years based on its assessment of many factors, including interpretation of tax laws and prior experience. This assessment relies on estimates and assumptions and may involve a series of judgments about future events. New information may become available that causes the Group to change its judgment regarding the adequacy of existing tax liabilities; such changes to tax liabilities will impact tax expense in the period that such a determination is made.

Ginebra San Miguel Annual Report 2012 25Y E A R S
58 59
- 28 -
Current tax and deferred tax are recognized in profit or loss except to the extent that it relates to a business combination, or items recognized directly in equity or in other comprehensive income. Deferred tax assets and deferred tax liabilities are offset, if a legally enforceable right exists to set off current tax assets against current tax liabilities and the deferred taxes relate to the same taxable entity and the same taxation authority. Value-added Tax (VAT). Revenues, expenses and assets are recognized net of the amount of VAT, except: where the tax incurred on a purchase of assets or services is not recoverable from the
taxation authority, in which case the tax is recognized as part of the cost of acquisition of the asset or as part of the expense item as applicable; and
receivables and payables that are stated with the amount of tax included. The net amount of tax recoverable from, or payable to, the taxation authority is included as part of “Prepaid taxes and other current assets” or “Income and other taxes payable” in the consolidated statements of financial position. Related Parties Parties are considered to be related if one party has the ability, directly or indirectly, to control the other party or exercise significant influence over the other party in making financial and operating decisions. Parties are also considered to be related if they are subject to common control or significant influence. Related parties may be individuals or corporate entities. Transactions between related parties are on an arm’s length basis in a manner similar to transactions with non-related parties. Basic and Diluted Earnings Per Common Share (EPS) Basic EPS is computed by dividing the net income for the period attributable to equity holders of the Parent Company, net of dividends on preferred shares, by the weighted average number of issued and outstanding common shares during the period, with retroactive adjustment for any stock dividends declared. Diluted EPS is computed in the same manner, adjusted for the effects of the shares issuable to employees under the Parent Company’s ESPP which are assumed to be exercised at the date of grant. Where the effect of the assumed conversion of shares issuable to employees under the Parent Company’s stock purchase plan would be anti-dilutive, diluted EPS is not presented. Operating Segments The Group’s operating segments are organized and managed separately according to the nature of the products and services provided, with each segment representing a strategic business unit that offers different products and serves different markets. Financial information on operating segments is presented in Note 6 to the consolidated financial statements. The President (the chief operating decision maker) reviews management reports on a regular basis. The measurement policies the Group used for segment reporting under PFRS 8, are the same as those used in its consolidated financial statements. There have been no changes from prior periods in the measurement methods used to determine reported segment profit or loss. All inter-segment transfers are carried out at arm’s length prices.
- 29 -
Segment revenues, expenses and performance include sales and purchases between business segments and between geographical segments. Such sales and purchases are eliminated in consolidation. Contingencies Contingent liabilities are not recognized in the consolidated financial statements. They are disclosed in the notes to the consolidated financial statements unless the possibility of an outflow of resources embodying economic benefits is remote. Contingent assets are not recognized in the consolidated financial statements but are disclosed in the notes to the consolidated financial statements when an inflow of economic benefits is probable. Events After the Reporting Date Post year-end events that provide additional information about the Group’s financial position at the reporting date (adjusting events) are reflected in the consolidated financial statements. Post year-end events that are not adjusting events are disclosed in the notes to the consolidated financial statements when material.
4. Significant Accounting Judgments, Estimates and Assumptions The preparation of the Group’s consolidated financial statements in accordance with PFRS requires management to make judgments, estimates and assumptions that affect the application of accounting policies and the amounts of assets, liabilities, income and expenses reported in the consolidated financial statements at the reporting date. However, uncertainty about these judgments, estimates and assumptions could result in an outcome that could require a material adjustment to the carrying amount of the affected asset or liability in the future. Judgments and estimates are continually evaluated and are based on historical experience and other factors, including expectations of future events that are believed to be reasonable under the circumstances. Revisions are recognized in the period in which the judgments and estimates are revised and in any future period affected. Judgments In the process of applying the Group’s accounting policies, management has made the following judgments, apart from those involving estimations, which have the most significant effect on the amounts recognized in the consolidated financial statements: Finance Leases - Group as Lessee. TSML and TGT, the Group’s joint ventures in Thailand entered into lease agreements with a Thai bank covering transportation equipment. The Group determined that these are finance leases since the significant risks and rewards of ownership related to those properties are transferred to the Group from the date of the lease agreement. Finance lease liabilities recognized in the consolidated statements of financial position amounted to P963 and P391 as of December 31, 2012 and 2011, respectively (Notes 30 and 35). The carrying amount of transportation equipment under finance lease amounted to P927 and P619 as of December 31, 2012 and 2011, respectively (Note 12). Operating Lease Commitments - Group as Lessor/Lessee. The Group has entered into various lease agreements either as a lessor or a lessee. The Group had determined that it retains all the significant risks and rewards of ownership of the properties leased out on operating leases while the significant risks and rewards for properties leased from third parties are retained by the lessors.
Ginebra San Miguel Annual Report 2012 25Y E A R S
60 61
- 30 -
No rent income was recognized in the consolidated statement of income in 2012. Rent income amounted to P7,500 and P18,000 in 2011 and 2010, respectively (Note 28). Rent expense recognized in the consolidated statements of income amounted to P238,164, P292,996 and P268,921 in 2012, 2011 and 2010, respectively (Notes 22, 23 and 24). Determining Fair Values of Financial Instruments. Where the fair values of financial assets and financial liabilities recognized in the consolidated statements of financial position cannot be derived from active markets, they are determined using a variety of valuation techniques that include the use of mathematical models. The Group uses judgments to select from variety of valuation models and make assumptions regarding considerations of liquidity and model inputs such as correlation and volatility for longer dated financial instruments. The input to these models is taken from observable markets where possible, but where this is not feasible, a degree of judgment is required in establishing fair value. Contingencies. The Group currently has tax assessments, legal and administrative claims. The Group’s estimate of the probable costs for the resolution of these assessments and claims has been developed in consultation with in-house as well as outside legal counsel handling the prosecution and defense of these matters and is based on an analysis of potential results. The Group currently does not believe that these tax assessments, legal and administrative claims will have a material adverse effect on its financial position and financial performance. It is possible, however, that future financial performance could be materially affected by changes in the estimates or in the effectiveness of strategies relating to these proceedings. No accruals were made in relation to these proceedings (Note 37). Estimates and Assumptions The key estimates and assumptions used in the consolidated financial statements are based upon management’s evaluation of relevant facts and circumstances as of the date of the consolidated financial statements. Actual results could differ from such estimates. Allowance for Impairment Losses on Trade and Other Receivables. Provisions are made for specific and groups of accounts, where objective evidence of impairment exists. The Group evaluates these accounts on the basis of factors that affect the collectibility of the accounts. These factors include, but are not limited to, the length of the Group’s relationship with the customers and counterparties, the customers’ current credit status based on third party credit reports and known market forces, average age of accounts, collection experience, and historical loss experience. The amount and timing of recorded expenses for any period would differ if the Group made different judgments or utilized different methodologies. An increase in allowance for impairment losses would increase the recorded selling and marketing expenses and decrease current assets. The allowance for impairment losses amounted to P108,194 and P108,292 as of December 31, 2012 and 2011, respectively. The carrying amounts of trade and other receivables amounted to P3,878,832 and P3,156,620 as of December 31, 2012 and 2011, respectively (Note 8).
- 31 -
Allowance for Inventory Losses. The Group provides an allowance for inventory losses whenever net realizable value becomes lower than cost due to damage, physical deterioration, obsolescence, changes in price levels or other causes. Estimates of net realizable value are based on the most reliable evidence available at the time the estimates are made of the amount the inventories are expected to be realized. These estimates take into consideration fluctuations of price or cost directly relating to events occurring after the reporting date to the extent that such events confirm conditions existing at the reporting date. The allowance account is reviewed periodically to reflect the accurate valuation in the financial records. The carrying amounts of inventories amounted to P6,109,316 and P6,782,788 as of December 31, 2012 and 2011, respectively. The allowance for inventory losses amounted to P79,635 and P75,099 as of December 31, 2012 and 2011, respectively (Note 9). Financial Assets and Financial Liabilities. The Group carries certain financial assets and financial liabilities at fair value which requires extensive use of accounting estimates and judgments. Significant components of fair value measurement were determined using verifiable objective evidence (i.e., foreign exchange rates, interest rates, volatility rates). The amount of changes in fair value would differ if the Group utilized different valuation methodologies and assumptions. Any change in the fair value of these financial assets and financial liabilities would affect profit or loss and equity. Fair values of financial assets and financial liabilities are discussed in Note 36. Estimated Useful Lives of Investment Properties, Property, Plant and Equipment and Deferred Containers. The Group estimates the useful lives of investment properties, property, plant and equipment and deferred containers based on the period over which the assets are expected to be available for use. The estimated useful lives of investment properties, property, plant and equipment and deferred containers are reviewed periodically and are updated if expectations differ from previous estimates due to physical wear and tear, technical or commercial obsolescence and legal or other limits on the use of the assets. In addition, estimation of the useful lives of investment properties, property, plant and equipment and deferred containers is based on collective assessment of industry practice, internal technical evaluation and experience with similar assets. It is possible, however, that future financial performance could be materially affected by changes in estimates brought about by changes in factors mentioned above. The amounts and timing of recorded expenses for any period would be affected by changes in these factors and circumstances. A reduction in the estimated useful lives of investment properties, property, plant and equipment and deferred containers would increase recorded cost of sales, selling and marketing expenses, and general and administrative expenses and decrease noncurrent assets. Investment properties, net of accumulated depreciation amounted to P148,926 and P157,998 as of December 31, 2012 and 2011, respectively (Note 13). Property, plant and equipment, net of accumulated depreciation and amortization amounted to P7,559,240 and P6,836,356 as of December 31, 2012 and 2011, respectively (Note 12). Accumulated depreciation and amortization of investment properties amounted to P659,755 and P650,683 as of December 31, 2012 and 2011, respectively (Note 13). Accumulated depreciation and amortization of property, plant and equipment amounted to P5,933,276 and P5,399,867 as of December 31, 2012 and 2011, respectively (Note 12).

Ginebra San Miguel Annual Report 2012 25Y E A R S
62 63
- 32 -
Deferred containers net of accumulated amortization included as part of “Other noncurrent assets” account in the consolidated statements of financial position amounted to P487,792 and P233,584 as of December 31, 2012 and 2011, respectively (Note 15). Fair Value of Investment Properties. The fair value of investment properties presented for disclosure purposes is based on market values, being the estimated amount for which the properties can be exchanged between a willing buyer and seller in an arm’s length transaction, or based on a most recent sale transaction of a similar property within the same vicinity where the investment properties are located. In the absence of current prices in an active market, the valuations are prepared by considering the aggregate estimated future cash flows expected to be received from leasing out the properties. A yield that reflects the specific risks inherent in the net cash flows is then applied to the net annual cash flows to arrive at the property valuation. Estimated fair values of investment properties amounted to P235,100 as of March 5, 2010 (Note 13). Impairment of Goodwill and License with Indefinite Useful Life. The Group determines whether goodwill and licenses are impaired at least annually. This requires the estimation of the value in use of the cash-generating units to which the goodwill is allocated and the value in use of the licenses. Estimating value in use requires management to make an estimate of the expected future cash flows from the cash-generating unit and from the licenses and to choose a suitable discount rate to calculate the present value of those cash flows. The carrying amount of goodwill as of December 31, 2012 amounted to P226,863 (Note 5). The carrying amounts of license amounted to P56,520 and P58,834 as of December 31, 2012 and 2011, respectively (Note 14). Acquisition Accounting. The Group accounts for acquired businesses using the acquisition method of accounting which requires that the assets acquired and the liabilities assumed are recognized at the date of acquisition based on their respective fair values. The application of the acquisition method requires certain estimates and assumptions especially concerning the determination of the fair values of acquired intangible assets and property, plant and equipment as well as liabilities assumed at the date of the acquisition. Moreover, the useful lives of the acquired intangible assets and property, plant and equipment have to be determined. Accordingly, for significant acquisitions, the Group obtains assistance from valuation specialists. The valuations are based on information available at the acquisition date. The Group’s acquisitions have resulted in goodwill. Total carrying amount of goodwill arising from business combinations in 2012 amounted to P226,863 (Note 5). Realizability of Deferred Tax Assets. The Group reviews its deferred tax assets at each reporting date and reduces the carrying amount to the extent that it is no longer probable that sufficient taxable profit will be available to allow all or part of the deferred tax assets to be utilized. The Group’s assessment on the recognition of deferred tax assets on deductible temporary difference and carryforward benefits of MCIT and NOLCO is based on the projected taxable income in the following periods.
- 33 -
Deferred tax assets amounted to P941,679 and P541,055 as of December 31, 2012 and 2011, respectively (Note 20). Impairment of Non-financial Assets. PFRS requires that an impairment review be performed on property, plant and equipment, investment properties, deferred containers and idle assets when events or changes in circumstances indicate that the carrying amount may not be recoverable. Determining the recoverable amounts of these assets requires the estimation of cash flows expected to be generated from the continued use and ultimate disposition of such assets. While it is believed that the assumptions used in the estimation of fair values reflected in the consolidated financial statements are appropriate and reasonable, significant changes in these assumptions may materially affect the assessment of recoverable amounts and any resulting impairment loss could have a material adverse impact on the financial performance. There were no impairment losses on property, plant and equipment, investment properties and other non-financial assets recognized as of December 31, 2012, 2011 and 2010. The aggregate amount of property, plant and equipment, investment properties, deferred containers and idle assets amounted to P8,208,750 and P7,241,970 as of December 31, 2012 and 2011, respectively (Notes 12, 13 and 15). Present Value of Defined Benefit Obligation. The present value of the retirement liability depends on a number of factors that are determined on an actuarial basis using a number of assumptions. These assumptions are described in Note 31 to the consolidated financial statements and include discount rate, expected return on plan assets and salary increase rate. Actual results that differ from the assumptions are accumulated and amortized over future periods and therefore, generally affect the recognized expense and recorded obligation in such future periods. The assumption of the expected return on plan assets is determined on a uniform basis, taking into consideration the long-term historical returns, asset allocation and future estimates of long-term investment returns. The Group determines the appropriate discount rate at the end of each year. It is the interest rate that should be used to determine the present value of estimated future cash outflows expected to be required to settle the retirement liabilities. In determining the appropriate discount rate, the Group considers the interest rates on government bonds that are denominated in the currency in which the benefits will be paid. The terms to maturity of these bonds should approximate the terms of the related retirement liability. Other key assumptions for retirement liabilities are based in part on current market conditions. While it is believed that the Group’s assumptions are reasonable and appropriate, significant differences in actual experience or significant changes in assumptions may materially affect the Group’s retirement liabilities. The Group has a net cumulative unrecognized actuarial losses amounting to P257,083 and P207,441 as of December 31, 2012 and 2011, respectively (Note 31). Asset Retirement Obligation. Determining asset retirement obligation requires estimation of the cost of dismantling, installations and restoring the leased properties to their original condition. The Group determined that there are no significant asset retirement obligations as of December 31, 2012 and 2011.

Ginebra San Miguel Annual Report 2012 25Y E A R S
64 65
- 34 -
5. Acquisition of a Subsidiary
The following are the developments relating to the Parent Company’s acquisition of a subsidiary in 2012: On January 27, 2012, GSMI acquired 100% of the outstanding capital stock of EPSBPI for P200,000. EPSBPI is a company primarily engaged in the manufacturing and bottling of alcoholic and nonalcoholic beverages. From the date of acquisition, EPSBPI has contributed loss of P44,825 to the Group’s financial performance. If the acquisition had occurred on January 1, 2012, management estimates that the contributed revenue would have been P132,113 and contributed loss for the year would have been P55,345. The following summarizes the recognized amounts of assets acquired and liabilities assumed at the acquisition date: 2012 Assets Cash and cash equivalents P57,328 Trade and other receivables - net 18,141 Inventories 4,324 Prepaid expenses and other current assets 23,723 Property, plant and equipment - net 1,062,986 Other noncurrent assets 96,640 Liabilities Accounts payable and accrued expenses 489,376 Long-term debt 800,000 Deferred tax liabilities 629 Total Identifiable Net Liabilities at Fair Value P26,863
The fair value of the trade and other receivables amounts to P18,141. None of the receivables has been impaired and it is expected that the full amount can be collected. Goodwill was recognized as a result of the acquisition as follows: 2012 Total consideration transferred P200,000 Total identifiable net liabilities at fair value 26,863 Goodwill P226,863
Goodwill arising from the acquisition is attributable to the benefit of expected synergies with the Group’s beverage business, revenue growth, and future development specifically on tolling services with third parties. None of the goodwill recognized is expected to be deductible for tax purposes.
- 35 -
The recoverable amount of goodwill has been determined based on a valuation using cash flow projections covering a five-year period based on long range plans approved by management. Cash flows beyond the five-year period are extrapolated using a constant growth rate determined per individual cash-generating unit. This growth rate is consistent with the long-term average growth rate for the industry. The discount rate applied to after tax cash flow projections is 12% in 2012. The discount rates also impute the risk of the cash-generating units compared to the respective risk of the overall market and equity risk premium. No impairment losses were recognized in 2012. Management believes that any reasonably possible change in the key assumptions on which the recoverable amount is based would not cause its carrying amount to exceed its recoverable amount. The calculations of value in use are most sensitive to the following assumptions: Gross Margins. Gross margins are based on average values achieved in the period
immediately before the budget period. These are increases over the budget period for anticipated efficiency improvements. Values assigned to key assumptions reflect past experience, except for efficiency improvement.
Discount Rates. The Group uses the weighted-average cost of capital as the discount
rate, which reflects management’s estimate of the risk specific to each unit. This is the benchmark used by management to assess operating performance and to evaluate future investments proposals.
Raw Material Price Inflation. Consumer price forecast is obtained from indices
during the budget period from which raw materials are purchased. Values assigned to key assumptions are consistent with external sources of information.
6. Segment Information Operating Segments The reporting format of the Group’s operating segments is determined based on the Group’s risk and rates of return which are affected predominantly by differences in the products produced. The operating businesses are organized and managed separately according to geographical location, with each segment representing a strategic business unit that offers different products and serves different markets. With the acquisition of San Miguel Beverages Inc.’s (SMBI) assets in 2008, the Parent Company ventured back into the manufacturing and distribution of nonalcoholic beverages. The Group is organized into two major operating segments namely alcoholic and nonalcoholic beverages. The alcoholic segment produces and markets alcoholic beverages. The nonalcoholic segment is involved in the production and marketing of nonalcoholic beverages. For each of the operating segments, the Group’s President (the chief operating decision maker) reviews internal management reports on at least monthly basis.
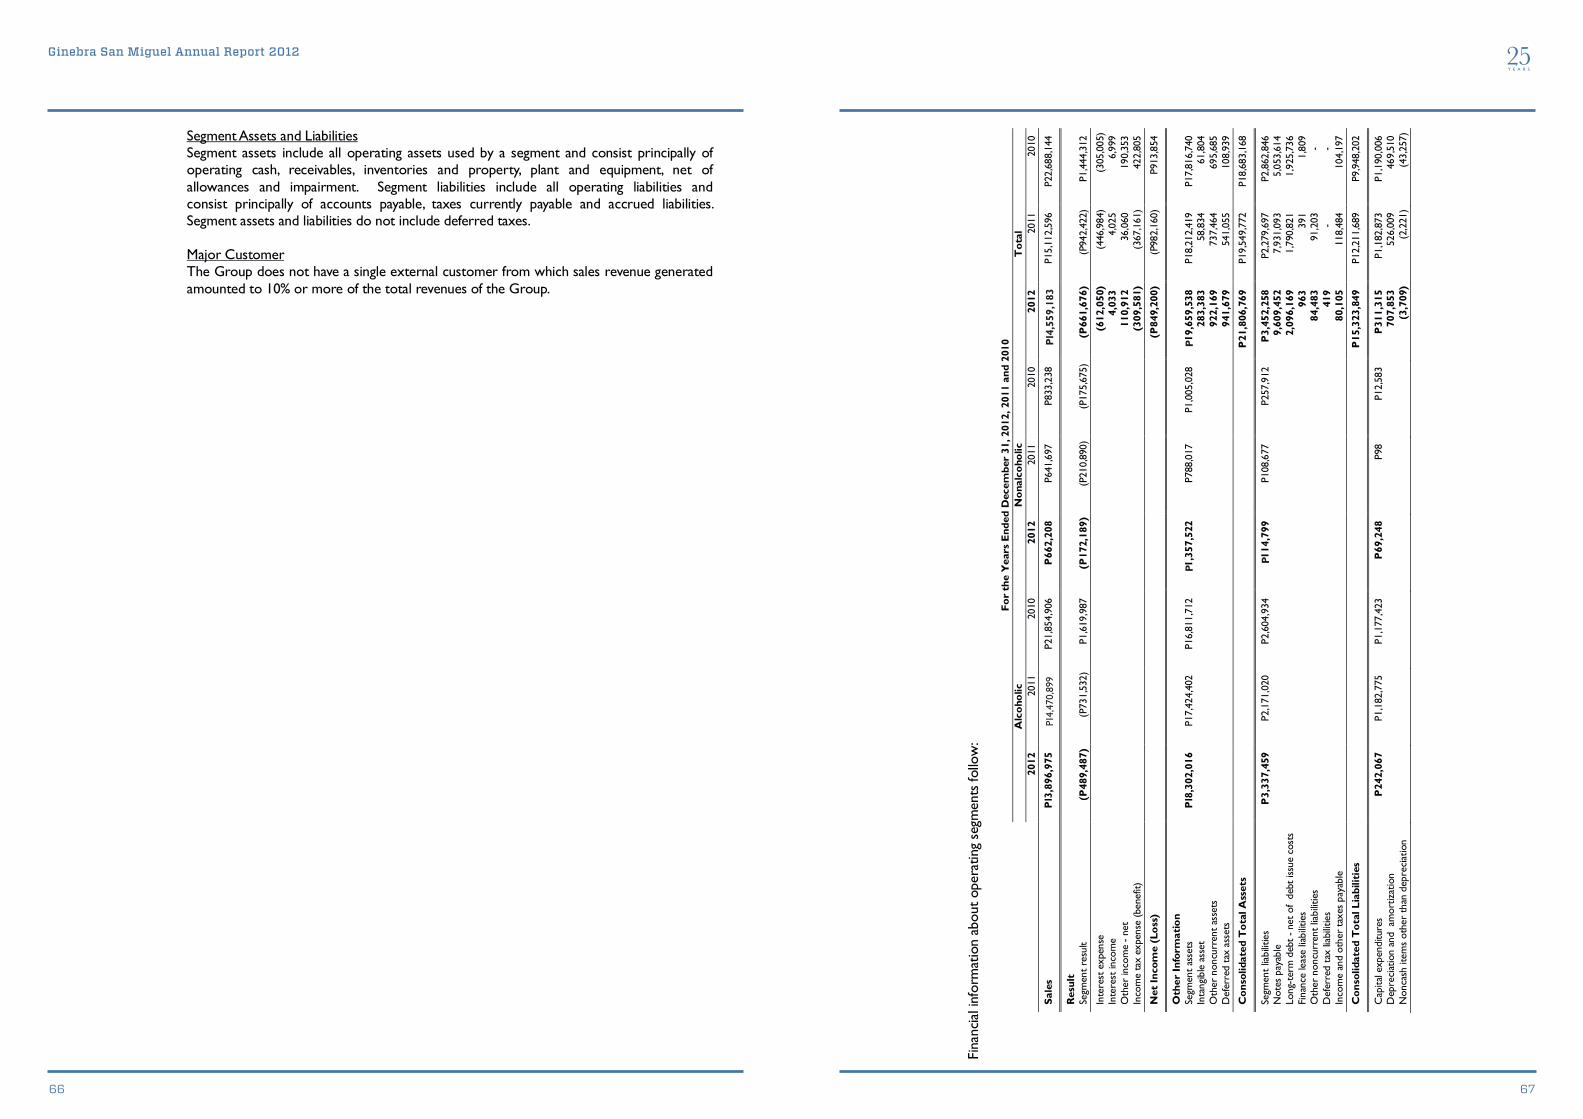
Ginebra San Miguel Annual Report 2012 25Y E A R S
66 67
- 36 -
Segment Assets and Liabilities Segment assets include all operating assets used by a segment and consist principally of operating cash, receivables, inventories and property, plant and equipment, net of allowances and impairment. Segment liabilities include all operating liabilities and consist principally of accounts payable, taxes currently payable and accrued liabilities. Segment assets and liabilities do not include deferred taxes. Major Customer The Group does not have a single external customer from which sales revenue generated amounted to 10% or more of the total revenues of the Group.
- 37
-
Fina
ncia
l inf
orm
atio
n ab
out o
pera
ting
segm
ents
follo
w:
Fo
r th
e Y
ears
End
ed D
ecem
ber
31, 2
012,
201
1 an
d 20
10
A
lcoh
olic
N
onal
coho
lic
Tot
al
20
12
2011
20
10
2012
20
11
2010
20
12
2011
20
10
Sale
s P1
3,89
6,97
5 P1
4,47
0,89
9 P2
1,85
4,90
6 P
662,
208
P641
,697
P8
33,2
38
P14
,559
,183
P1
5,11
2,59
6 P2
2,68
8,14
4
Res
ult
Se
gmen
t re
sult
(P48
9,48
7)
(P73
1,53
2)
P1,6
19,9
87
(P17
2,18
9)
(P21
0,89
0)
(P17
5,67
5)
(P66
1,67
6)
(P94
2,42
2)
P1,4
44,3
12
Inte
rest
exp
ense
(6
12,0
50)
(446
,984
) (3
05,0
05)
Inte
rest
inco
me
4,
033
4,0
25
6,99
9 O
ther
inco
me
- ne
t
11
0,91
2 36
,060
19
0,35
3 In
com
e ta
x ex
pens
e (b
enef
it)
(309
,581
) (3
67,1
61)
422,
805
Net
Inco
me
(Los
s)
(P84
9,20
0)
(P98
2,16
0)
P913
,854
Oth
er In
form
atio
n
Segm
ent
asse
ts
P18,
302,
016
P17,
424,
402
P16,
811,
712
P1,
357,
522
P788
,017
P1
,005
,028
P
19,6
59,5
38
P18,
212,
419
P17,
816,
740
Inta
ngib
le a
sset
28
3,38
3 58
,834
61
,804
O
ther
non
curr
ent
asse
ts
922,
169
737,
464
695,
685
Def
erre
d ta
x as
sets
94
1,67
9 54
1,05
5 10
8,93
9
Con
solid
ated
Tot
al A
sset
s
P21
,806
,769
P1
9,54
9,77
2 P1
8,68
3,16
8
Segm
ent
liabi
litie
s
P3,
337,
459
P2,1
71,0
20
P2,6
04,9
34
P11
4,79
9 P1
08,6
77
P257
,912
P
3,45
2,25
8 P2
,279
,697
P2
,862
,846
N
otes
pay
able
9,
609,
452
7,93
1,09
3 5,
053,
614
Long
-ter
m d
ebt
- net
of
debt
issu
e co
sts
2,09
6,16
9 1,
790,
821
1,92
5,73
6 Fi
nanc
e le
ase
liabi
litie
s
96
3 39
1 1,
809
Oth
er n
oncu
rren
t lia
bilit
ies
84,4
83
91,2
03
-
D
efer
red
tax
liabi
litie
s
41
9 -
-
In
com
e an
d ot
her
taxe
s pa
yabl
e
80
,105
11
8,48
4 10
4,19
7
Con
solid
ated
Tot
al L
iabi
litie
s
P15
,323
,849
P1
2,21
1,68
9 P9
,948
,202
Cap
ital e
xpen
ditu
res
P
242,
067
P1,1
82,7
75
P1,1
77,4
23
P69
,248
P9
8 P1
2,58
3 P
311,
315
P1,1
82,8
73
P1,1
90,0
06
Dep
reci
atio
n an
d a
mor
tizat
ion
707,
853
526,
009
469,
510
Non
cash
item
s ot
her
than
dep
reci
atio
n
(3
,709
) (2
,221
) (4
3,25
7)
P14,
470,
899
P14,55
9,18
3
PP
P

Ginebra San Miguel Annual Report 2012 25Y E A R S
68 69
- 38 -
7. Cash and Cash Equivalents Cash and cash equivalents consist of: 2012 2011 Cash in banks and on hand P554,583 P310,803 Short-term investments 66,947 55,313 P621,530 P366,116
Cash in banks earns interest at the respective bank deposit rates. Short-term investments include demand deposits which can be withdrawn at anytime depending on the immediate cash requirements of the Group and earn interest at the prevailing short-term investment rates.
8. Trade and Other Receivables Trade and other receivables consist of: Note 2012 2011 Trade P3,267,080 P1,957,418 Non-trade 34 482,683 1,025,620 Amounts owed by related parties 29 237,263 281,874 3,987,026 3,264,912 Less allowance for impairment losses (108,194) (108,292) P3,878,832 P3,156,620
Trade receivables are non-interest bearing and are generally on a 60 to 90-day and 30 to 60-day credit terms in 2012 and 2011, respectively. Non-trade receivables consist of advances to suppliers amounting to P127 and P548,840 as of December 31, 2012 and 2011, respectively, and miscellaneous receivables amounting to P482,556 and P476,780 as of December 31, 2012 and 2011, respectively. The movements in the allowance for impairment losses are as follows: Note 2012 2011 Balance at beginning of year P108,292 P174,124 Charges for the year 23, 24 - 178 Reversals and others (98) (66,010) Balance at end of year P108,194 P108,292
P
P
P
P
P
P
P
P
- 39 -
As of December 31, 2012 and 2011, the aging of receivables is as follows:
2012 Trade Non-trade
Owed by Related Parties Total
Current P1,945,652 P60,795 P41,173 P2,047,620 Past due
Less than 30 days 465,978 60,334 3,336 529,648 30 - 60 days 241,346 6,479 11,676 259,501 61 - 90 days 84,289 4,426 33,474 122,189 Over 90 days 529,815 350,649 147,604 1,028,068
P3,267,080 P482,683 P237,263 P3,987,026
2011 Trade Non-trade
Owed by Related Parties Total
Current P1,174,052 P156,285 P24,404 P1,354,741 Past due
Less than 30 days 107,486 87,470 18,716 213,672 30 - 60 days 87,187 71,400 4,024 162,611 61 - 90 days 101,600 8,221 32,933 142,754 Over 90 days 487,093 702,244 201,797 1,391,134
P1,957,418 P1,025,620 P281,874 P3,264,912
Various collaterals for trade receivables such as bank guarantees, time deposit and real estate mortgages are held by the Group for certain credit limits. The Group has settlement arrangements with various terminated dealers for the collection of the outstanding trade receivables over a period from four to fifteen years. The noncurrent portion amounting to P4,280 and P4,780 as of December 31, 2012 and 2011, respectively, is included in trade receivables from terminated dealers under the “Other noncurrent assets” account in the consolidated statements of financial position (Note 15).
9. Inventories Inventories consist of: 2012 2011 Finished goods and goods in process P1,974,680 P2,221,747 Materials and supplies 4,001,339 4,404,525 Containers 133,297 156,516 P6,109,316 P6,782,788
The costs of finished goods, goods in process and materials and supplies amounted to P6,055,654 and P6,701,371 as of December 31, 2012 and 2011, respectively. Containers at deposit value amounted to P133,297 and P156,516 as of December 31, 2012 and 2011, respectively. The allowance for inventory losses amounted to P79,635 and P75,099 as of December 31, 2012 and 2011, respectively.
P
P

Ginebra San Miguel Annual Report 2012 25Y E A R S
70 71
- 40 -
10. Prepaid Taxes and Other Current Assets
Prepaid taxes and other current assets consist of: Note 2012 2011 Prepaid taxes P1,197,381 P851,081 Derivative assets 35, 36 1,288 315 Others 136,537 61,145 P1,335,206 P912,541
Prepaid taxes represent prepayments of excise taxes on alcohol and income taxes.
11. Investments in Joint Ventures GSMI, through GSMIL, has an existing joint venture with Thai Life Group of Companies (Thai Life) covering the ownership and operations of TSML. TSML is a limited company organized under the laws of Thailand of which GSMIL owns 40% ownership interest. TSML holds a license in Thailand to engage in the business of manufacturing alcohol and manufacturing, selling and distributing brandy, wine and distilled spirits products both for domestic and export markets. Through the acquisition by SHL of the 49% ownership interest in Siam Wine Liquor Co., Ltd. (SWL) and SWL’s acquisition of shares representing 10% ownership of the outstanding capital stock of TSML, the Group’s share in TSML increased from 40% to 44.9%. The acquisition was funded through advances made by GSMI to GBHL, which has an existing loan agreement with SWL for the same amount. The Group’s share in the assets, liabilities, income and expenses of TSML as of and for the years ended December 31, 2012, 2011 and 2010 which is included in the Group’s consolidated financial statements is shown below: 2012 2011 2010 Current assets P296,993 P484,252 P516,039 Noncurrent assets 734,609 806,327 893,617 Current liabilities 357,537 424,774 436,078 Noncurrent liabilities 142,369 268,874 309,241 Revenue 443,742 451,868 657,135 Cost of sales 535,264 600,339 816,542 Operating expenses 66,945 84,501 76,285 Other income 812 3,506 11,977 Net loss 157,655 229,466 223,715
P
P
- 41 -
The Group’s share in the cash flows of TSML for the years ended December 31, 2012, 2011 and 2010 is as follows: 2012 2011 2010 Net cash flows used in operating
activities (P37,633) (P208,985) (P373,193) Net cash flows provided by investing
activities 71,719 87,289 374 Net cash flows used in financing
activities (126,505) (40,367) (105,800) GSMI, through GSMIHL, has an existing 40% ownership in the TGT, which was formed as another joint venture with Thai Life. TGT functions as the selling and distribution arm of TSML. Through the acquisition of SWL of the 10% ownership interest in TGT, GSMI group’s share in TGT increased from 40% to 44.9%. The acquisition was funded through advances made by GSMI to GBHL which has an existing loan agreement with SWL for the same amount. The Group’s share in the assets, liabilities, income and expenses of TGT as of and for the years ended December 31, 2012, 2011 and 2010 which is included in the Group’s consolidated financial statements is shown below: 2012 2011 2010 Current assets P43,766 P65,375 P50,903 Noncurrent assets 80 2,725 14,464 Current liabilities 14,405 13,673 15,131 Noncurrent liabilities 84 56 1,622 Revenue 113,247 171,383 231,686 Cost of sales 1,391 2,210 17,106 Operating expenses 38,679 83,476 110,684 Other income 9,195 624 703 Net income 82,372 86,321 104,599
The Group’s share in the cash flows of TGT for the years ended December 31, 2012, 2011 and 2010 is as follows: 2012 2011 2010 Net cash flows provided by operating
activities P104,714 P70,391 P159,246 Net cash flows provided by investing
activities 2,644 11,739 15,355 Net cash flows provided by (used in)
financing activities 28 (1,565) (14,442)
P
P

Ginebra San Miguel Annual Report 2012 25Y E A R S
72 73
- 43 -
Additions in 2012 amounting to P311,315 pertain to acquisitions of Nonalcoholic Beverage electric coolers and crates. Additions in 2011 amounting to P1,182,873 pertain to acquisitions of a bottling facility in Calamba, Laguna and a cassava alcohol facility located at DBI plant. Property, plant and equipment include unutilized machinery and equipment consisting of distillation equipment of the Parent Company stored in DBI plant. Carrying amounts of unutilized machinery and equipment, net of accumulated impairment losses of P269,600, amounted to P193,227 and P197,360 as of December 31, 2012 and 2011, respectively. Depreciation and amortization charged to operations amounted to P650,799, P481,944 and P409,245 in 2012, 2011 and 2010, respectively (Note 25). These amounts include annual amortizations of capitalized interest amounting to P11,034, P9,658 and P8,664 in 2012, 2011 and 2010, respectively. Interest amounting to P9,038, P20,637 and P14,916 were capitalized to machinery and equipment in 2012, 2011 and 2010, respectively (Note 27). The capitalization rate used to determine the amount of interest eligible for capitalization was 5.65% in 2012, 4.97% in 2011 and 5.73% in 2010. As of December 31, 2012 and 2011, the unamortized capitalized borrowing costs amounted to P83,760 and P84,359, respectively. The carrying amount of transportation equipment under finance lease amounted to P927 and P619 as of December 31, 2012 and 2011, respectively (Notes 4 and 30).
13. Investment Properties This account consists of a bottling plant, which includes land and land improvements, buildings and building improvements, machinery and equipment, and other equipment leased by a third party under an operating lease agreement (Note 30). The movements in investment properties are as follows:
Land and Land Improvements
Buildings andBuilding
ImprovementsMachinery and
EquipmentOther
Equipmentr Total
Cost: December 31, 2011 and 2012 P49,297 P116,300 P633,837 P9,247 P808,681
Accumulated depreciation and amortization:
December 31, 2010 17,528 68,180 561,809 9,247 656,764 Additions 31 2,828 3,512 - 6,371 Reclassifications (1) - (12,451 - (12,452)
December 31, 2011 17,558 71,008 552,870 9,247 650,683 Additions 31 3,118 5,923 - 9,072
December 31, 2012 17,589 74,126 558,793 9,247 659,755
Net book value:
December 31, 2011 P31,739 P45,292 P80,967 P - P157,998
December 31, 2012 P31,708 P42,174 P75,044 P - P148,926
Depreciation charged to operations amounted to P9,072, P6,371 and P11,297 for the years ended December 31, 2012, 2011 and 2010, respectively (Note 25). As of March 5, 2010, the fair values of investment properties as determined by an independent firm of appraisers amounted to P235,100. Fair value is based on the estimated market value of the land using the gathered available market evidences and depreciated replacement cost for other assets which have no available market evidences.
PP
P P P P
- 42
-
12. P
rope
rty,
Pla
nt a
nd E
quip
men
t
The
mov
emen
ts in
pro
pert
y, pl
ant a
nd e
quip
men
t are
as
follo
ws:
Land
and
La
nd
Impr
ovem
ents
Bui
ldin
gs a
nd
Bui
ldin
g Im
prov
emen
ts
Tra
nspo
rtat
ion
Equ
ipm
ent
Mac
hine
ry
and
Equ
ipm
ent
Furn
itur
e,
Fixt
ures
an
d O
ffice
E
quip
men
t O
ther
E
quip
men
t Le
aseh
old
Impr
ovem
ents
Con
stru
ctio
n in
Pro
gres
s T
otal
Cos
t:
D
ecem
ber
31, 2
010
P652
,949
P1,2
29,0
42
P224
,757
P7
,192
,673
P8
6,32
1 P5
97,2
14
P12,
170
P1,0
89,4
34
P11,
084,
560
Add
ition
s -
-
-
-
-
-
-
1,18
2,87
3 1,
182,
873
Disp
osal
s/re
clas
sific
atio
ns
266,
644
248,
616
18,3
49
1,37
4,90
2 32
,097
10
5,40
4 5,
278
(2,0
39,2
70)
12,0
20
Cur
renc
y tr
ansl
atio
n ad
just
men
ts
(8,4
38)
(6,0
05)
(1,1
58)
(26,
598)
(4
23)
(522
) (4
3)
(43)
(4
3,23
0)
Dec
embe
r 31
, 201
1 91
1,15
51,
471,
653
241,
948
8,54
0,97
7 11
7,99
5 70
2,09
6 17
,405
232,
994
12,2
36,2
23
Add
ition
s -
-
-
-
-
-
-
311,
315
311,
315
Disp
osal
s/re
clas
sific
atio
ns/
acqu
isiti
on o
f sub
sidi
ary
(8,7
58)
423,
476
4,29
1 62
4,98
5 2,
222
17,3
91
122,
055
(205
,487
) 98
0,17
5 C
urre
ncy
tran
slat
ion
adju
stm
ents
(6
,989
)(4
,963
) (2
84)
(22,
001)
(3
36)
(482
) (3
3)(1
09)
(35,
197)
Dec
embe
r 31
, 201
2 89
5,40
81,
890,
166
245,
955
9,14
3,96
1 11
9,88
1 71
9,00
5 13
9,42
733
8,71
3 13
,492
,516
Acc
umul
ated
dep
reci
atio
n an
d am
orti
zati
on:
D
ecem
ber
31, 2
010
172,
919
500,
938
154,
370
3,60
3,94
3 54
,116
50
7,35
2 5,
283
-
4,
998,
921
Add
ition
s 16
,370
41,8
94
29,6
10
326,
175
21,2
18
44,7
36
1,94
1-
481,
944
Disp
osal
s/re
clas
sific
atio
ns
(9,1
04)
(1,3
58)
(50,
564)
13
,330
(1
,427
) (2
1,28
9)
(1,1
48)
-
(7
1,56
0)
Cur
renc
y tr
ansl
atio
n ad
just
men
ts
(1,2
69)
(981
) (8
41)
(5,8
33)
(321
) (1
84)
(9)
-
(9
,438
)
Dec
embe
r 31
, 201
1 17
8,91
654
0,49
3 13
2,57
5 3,
937,
615
73,5
86
530,
615
6,06
7-
5,39
9,86
7 A
dditi
ons
7,45
257
,455
30
,404
48
5,15
3 20
,654
43
,691
5,
990
-
65
0,79
9 D
ispos
als/
recl
assif
icat
ions
/ ac
quis
ition
of s
ubsi
diar
y (2
,642
)14
7,75
1 (7
,979
) (2
31,8
89)
(3,6
26)
(9,8
54)
(170
)-
(108
,409
) C
urre
ncy
tran
slat
ion
adju
stm
ents
(1
,140
)(1
,021
) (2
25)
(6,0
74)
(292
) (2
20)
(9)
-
(8,9
81)
Dec
embe
r 31
, 201
2 18
2,58
674
4,67
8 15
4,77
5 4,
184,
805
90,3
22
564,
232
11,8
78-
5,
933,
276
Net
boo
k va
lue:
Dec
embe
r 31
, 201
1 P7
32,2
39P9
31,1
60
P109
,373
P4
,603
,362
P4
4,40
9 P1
71,4
81
P11,
338
P232
,994
P6
,836
,356
Dec
embe
r 31
, 201
2 P
712,
822
P1,
145,
488
P91
,180
P
4,95
9,15
6 P
29,5
59
P15
4,77
3 P
127,
549
P33
8,71
3 P
7,55
9,24
0
PP
PP
PP
98 80
P
ss
Equipments
)
08
88
6
4

Ginebra San Miguel Annual Report 2012 25Y E A R S
74 75
- 44 -
14. Other Intangible Asset The movements in other intangible asset with indefinite useful life, including effects of currency translation adjustments, are as follows: 2012 2011 Balance at beginning of year P58,834 P61,804 Reclassifications (200) (397) Currency translation adjustments (2,114) (2,573) Balance at end of year P56,520 P58,834
The Parent Company assessed that the license of TSML to manufacture liquor is an intangible asset with an indefinite useful life since the license allows the Group to operate liquor business in Thailand indefinitely. In addition, the Parent Company and its joint venture partner intend to be in such business indefinitely. The TSML license is reviewed for impairment at least on an annual basis. This requires an estimation of the value in use of the cash-generating units to which the indefinite intangible asset is allocated. Estimating the value in use requires management to make an estimate of the expected future cash flows from the cash-generating unit and to choose a suitable discount rate to calculate the present value of those cash flows. Management assessed that there is no impairment loss in value of the license for the years ended December 31, 2012, 2011 and 2010.
15. Other Noncurrent Assets Other noncurrent assets consist of: Note 2012 2011 Deferred containers - net 4 P487,792 P233,584 Trade receivables referred to legal counsel 35, 36 33,022 34,371 Trade receivables from terminated
dealers - net of current portion 8, 35, 36 4,280 4,780 Advances 11, 29, 35, 36 122,915 242,915 Deposits and others 35, 36 274,160 221,814 P922,169 P737,464
Advances represent outstanding amounts granted to external suppliers. Deposits and others include: (a) idle assets with carrying amount of P12,792 and P14,032 as of December 31, 2012 and 2011, respectively; (b) input taxes on the acquisition of capitalizable assets amounting to P111,604 and P53,709 as of December 31, 2012 and 2011, respectively; and (c) advances by the Parent Company to TSML amounting to P118,393 as of December 31, 2012 and 2011.
P
P
- 45 -
16. Notes Payable This account consists of unsecured short-term peso-denominated borrowings obtained from local banks for working capital requirements. These loans mature in three months or less and bear annual interest rates ranging from 3.40% to 5.75% and 3.50% to 6.87% in 2012 and 2011, respectively. This account also includes 44.9% of the unsecured short-term Thailand Baht- denominated borrowings of TSML which were obtained from banks for working capital requirements. These loans mature in three months or less and bear annual interest ranging from 3.93% to 4.60% in 2012 and 2.05% to 4.97% in 2011. Interest expense on notes payable amounted to P467,583, P324,646 and P246,665 in 2012, 2011 and 2010, respectively (Note 27). The Group’s exposure to interest rate, foreign currency and liquidity risks are discussed in Note 35.
17. Trade and Other Payables Trade and other payables consist of: Note 2012 2011 Trade P2,287,884 P1,646,791 Amounts owed to related parties 29 1,163,961 623,243 Finance lease liabilities - current
portion 30, 35, 36 184 391 Derivative liabilities 35, 36 413 3,619 P3,452,442 P2,274,044
Credit term of trade payables is generally 30 days.
18. Long-term Debt Long-term debt consists of: 2012 2011 Unsecured term notes: Peso-denominated:
Fixed interest rate with maturities up to 2015 (a) P1,239,119 P1,494,691 Floating interest rate based on PDST-F plus
margin, with maturities up to 2018 (b) 685,715 - Foreign currency-denominated:
Floating interest rate based on THBFIX plus margin, with maturities up to 2014 (c) 171,335 296,130
2,096,169 1,790,821
Less current maturities 655,430 373,974
P1,440,739 P1,416,847
P
P
P

Ginebra San Miguel Annual Report 2012 25Y E A R S
76 77
- 46 -
a. On May 25, 2010, the Parent Company entered into unsecured long-term, interest
bearing loans from a local bank amounting to P1,500,000 for the purpose of funding its permanent working capital requirements. On May 31 and August 25, 2010, P300,000 and P1,200,000, respectively, were drawn down from the said credit facility. These loans are carried at amortized cost and bear annual interest rates at Philippine peso fixed-rate of 7.89% and 7.25%, respectively. The loans are payable in equal semi-annual installments which will commence in 2012.
b. GSMI through EPSBPI, recognizes an unsecured, long-term interest bearing loan
with the Development Bank of the Philippines amounting to P800,000. The proceeds of the loan is intended exclusively for the construction of the bottling facilities in Ligao, Albay and Cauayan, Isabela. The loan is payable up to nine years from and after the initial date of borrowing, but in no case later than September 30, 2018 (expiry date of MOA), inclusive of a grace period of two years on principal repayment. The loan is payable in equal quarterly installments on the Principal Repayment Dates, commencing on February 18, 2012. EPSBPI agrees to pay interest on the outstanding principal amount of borrowings on each interest payment date ending per annum equivalent to the higher of benchmark rate plus a spread one percent or the overnight rate. Benchmark rate is the three-month PDST-F rate as displayed in the Philippine Dealing and Exchange Corporation page on the first day of each interest period. While overnight rate means the Bangko Sentral ng Pilipinas overnight reverse repo rate on interest rate settling date.
c. The Parent Company recognizes 44.9% of the unsecured, long-term, interest-bearing loan of TSML from Thai local and foreign banks used to finance TSML’s plant construction and start-up operations. This loan is carried at amortized cost. It bears annual interest rate at the aggregate of applicable Thailand Baht floating-rate fix (THBFIX) and 1.75% per annum. TSML and the creditor entered into an agreement that changed the rate of interest to a fixed rate of 6.41% for the period from January 1 to June 30, 2010. The loan is payable every six months at 5% and 10% of the outstanding loan facilities starting March 14, 2009. The debt agreements contain, among others, covenants relating to merger and consolidation, maintenance of certain financial ratios, working capital requirements, restriction on loans and guarantees, disposal of a substantial portion of assets and significant changes in the general nature of business. The movements in debt issue costs are as follows: 2012 2011 Balance at beginning of year P6,249 P8,287 Amortization (1,981) (2,015) Cumulative translation adjustments and others (34) (23) Balance at end of year P4,234 P6,249
- 47 -
Repayment Schedule As of December 31, 2012, the annual maturities of this long-term debt are as follows:
Year Gross Amount Debt Issue Costs Net 2013 P657,411 P1,981 P655,430 2014 600,134 1,657 598,477 2015 500,001 596 499,405 2016 114,286 - 114,286 2017 114,286 - 114,286 2018 114,285 - 114,285
P2,100,403 P4,234 P2,096,169
19. Other Noncurrent Liabilities Other noncurrent liabilities primarily consist of various loans obtained by TSML for its working capital requirements. The loan is unsecured and bears 3% interest per annum.
20. Income Taxes Deferred tax assets and liabilities arise from the following:
2012 2011 NOLCO P674,974 P329,020 MCIT 127,885 64,558 Impairment losses on non-operating machinery
and equipment 83,448 83,448 Allowance for impairment losses on trade and
other receivables 52,237 52,237 Allowance for write-down of inventories to net
realizable value 20,971 20,971 Past service costs 6,551 4,084 Retirement liabilities - net - 2,242 Derivative liabilities - net - 991 Derivative assets - net (262) - Unrealized foreign exchange gain - net (539) (562) Retirement assets - net (1,946) - Unamortized capitalized borrowing costs (25,128) (19,117) Others 3,069 3,183 P941,260 P541,055
The above amounts are reported in the consolidated statements of financial positions as follows: 2012 2011 Deferred tax assets P941,679 P541,055 Deferred tax liabilities (419) -
P941,260 P541,055
P

Ginebra San Miguel Annual Report 2012 25Y E A R S
78 79
- 48 -
As of December 31, 2012, the NOLCO and MCIT of the Group that can be claimed as deduction from future taxable income and deductible from corporate income tax due, respectively, are as follows:
Year Incurred/Paid Carryforward Benefits Up to NOLCO MCIT
2012 December 31, 2015 P1,158,604 P63,327 2011 December 31, 2014 1,091,311 64,558
P2,249,915 P127,885 The components of income tax expense (benefit) are shown below: 2012 2011 2010 Current P28,039 P536 P386,256 Deferred (337,620) (367,697) 36,549 (P309,581) (P367,161) P422,805
The reconciliation between the statutory income tax rate on income before income tax and the Group’s effective income tax rate is as follows: 2012 2011 2010 Statutory income tax rate 30.00% 30.00% 30.00% Increase (decrease) in income tax rate
resulting from: Interest income subjected to final tax (0.10) (0.10) (0.20) Nondeductible expenses and others (3.18) (2.70) 1.80
Effective income tax rate 26.72% 27.20% 31.60%
21. Equity Common Stock As of December 31, 2012 and 2011, the Parent Company has 460,000,000 authorized common shares with par value of P1 per share. The holders of common shares are entitled to receive dividends as declared from time to time and are entitled to one vote per share at meetings of the Parent Company. As of December 31, 2012 and 2011, the Parent Company offer price is P17.80 and P23.30, respectively. The Parent Company has a total of 939 and 1,129 stockholders. The movements in the number of issued and outstanding common shares are as follows: 2012 2011 Balance at beginning of year P345,625,332 P342,985,932 Issuances during the year - 2,639,400 Issued shares at end of year 345,625,332 345,625,332 Less treasury shares 55,549,391 55,549,391 Issued and outstanding shares at end of year P290,075,941 P290,075,941
30.00%30.00%
27.20%26.72%
30.00%
31.60%
1.80
P
- 49 -
Preferred Shares As of December 31, 2012 and 2011, the Parent Company has 100,000,000 authorized preferred shares with par value of P1 per share. The holders of preferred shares are entitled to participate and receive annual dividends of P1.50 per share which shall be cumulative and payable in arrears on December 31 of each year. In addition, the holders of preferred shares shall receive a special annual dividend equal to the excess of the aggregate dividends paid or to be paid to common shareholders over P1.50 per preferred share per annum. The holders of preferred shares are entitled to vote in the same manner as the holders of common shares. As of December 31, 2012 and 2011, the Parent Company has 32,786,885 outstanding preferred shares. Treasury Shares Details of treasury shares as of December 31, 2012 and 2011 are as follows: Number of Shares Preferred 20,650,700 Common 55,549,391
Unappropriated Retained Earnings No dividends were declared in 2012. Annual dividends amounting to P482,014 and P476,081 (P1.50 per share) were declared by the Parent Company in 2011 and 2010, respectively. Of this amount, P49,180 (P1.50 per share) relates to preferred dividends for 2011 and 2010. The unappropriated retained earnings balance is restricted to the extent of: (a) the acquisition price of the treasury shares amounting to P2,579,409 as of December 31, 2012 and 2011; and (b) undistributed net loss of the subsidiaries and joint ventures amounting to P171,623 in 2012 and undistributed net earnings of the subsidiaries and joint ventures amounting to P200,255 and P143,374 in 2011 and 2010, respectively. Undistributed earnings of the subsidiaries and joint ventures are not available for dividends until declared by the respective investees. Under the Corporation Code of the Philippines (the Code), stock corporations are prohibited from retaining surplus profits in excess of 100% of their paid-up capital stock except when justified by any of the reasons mentioned in the Code. As of December 31, 2010, unappropriated retained earnings were in excess of the paid-up capital. Appropriated Retained Earnings On November 11, 2010, the BOD approved P1,200,000 appropriation for the purpose of capital investment for the expansion of the plant facilities, including but not limited to equipment rehabilitation, to accommodate new product line and the increase in volume requirements in the next three to five years.
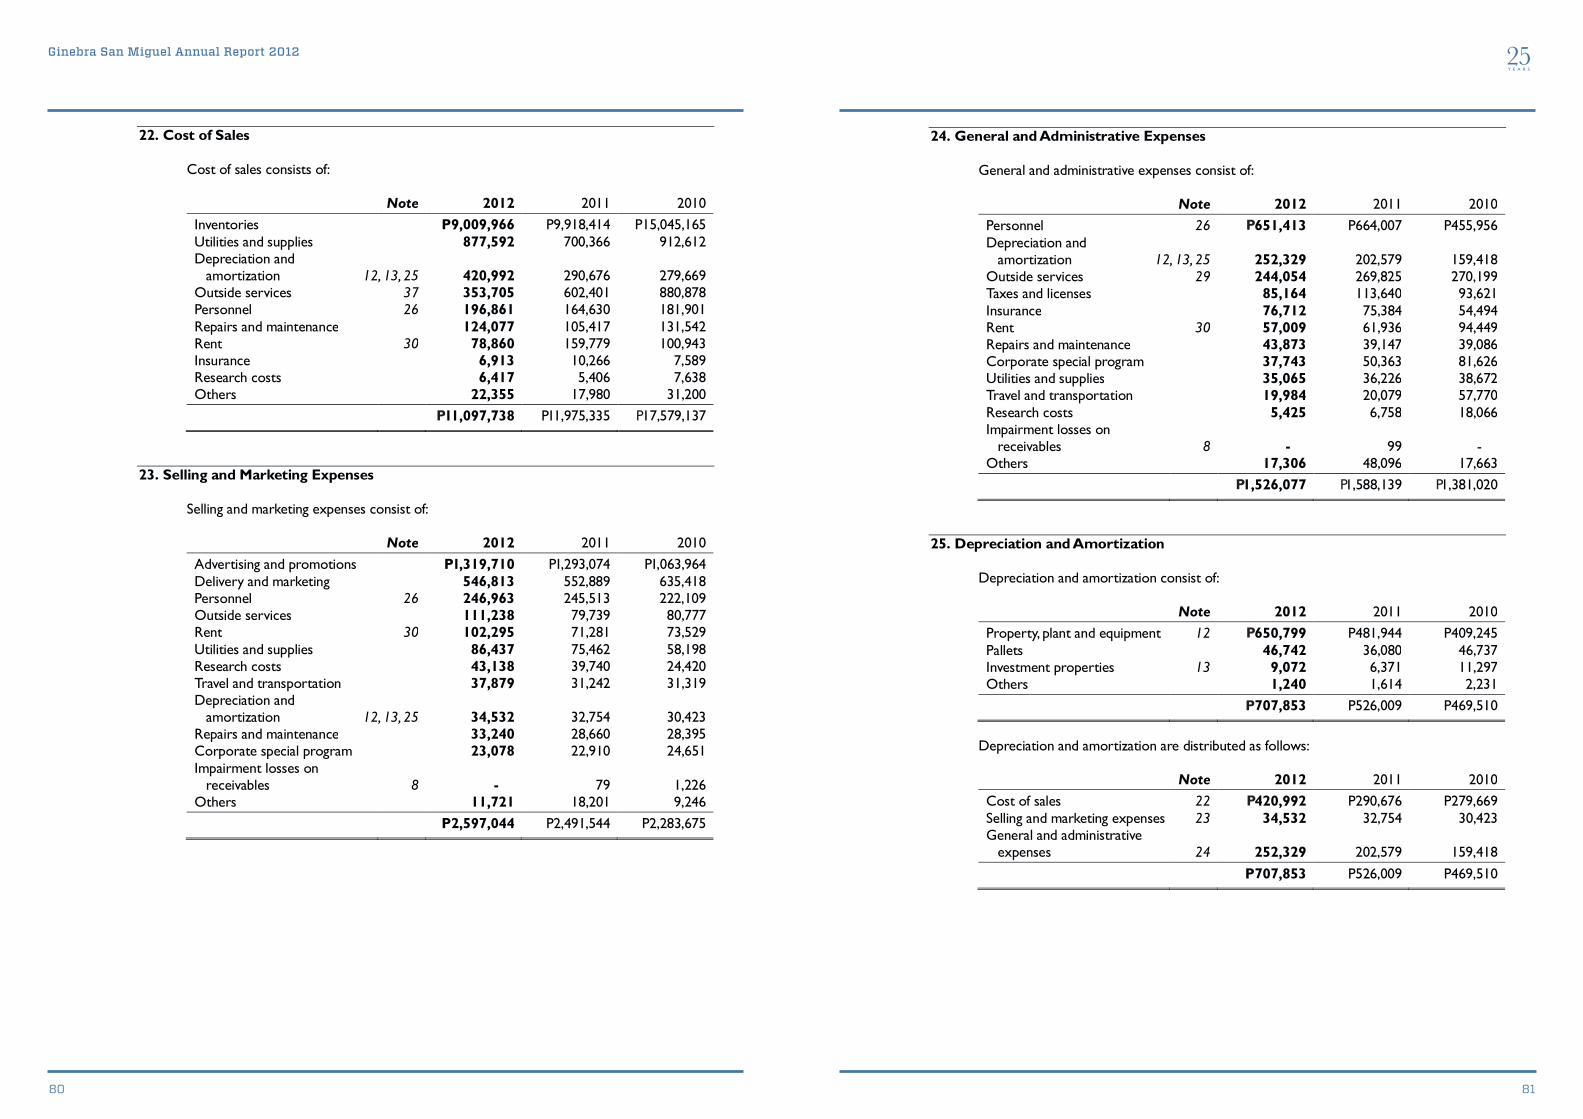
Ginebra San Miguel Annual Report 2012 25Y E A R S
80 81
- 50 -
22. Cost of Sales
Cost of sales consists of: Note 2012 2011 2010 Inventories P9,009,966 P9,918,414 P15,045,165 Utilities and supplies 877,592 700,366 912,612 Depreciation and
amortization 12, 13, 25 420,992 290,676 279,669 Outside services 37 353,705 602,401 880,878 Personnel 26 196,861 164,630 181,901 Repairs and maintenance 124,077 105,417 131,542 Rent 30 78,860 159,779 100,943 Insurance 6,913 10,266 7,589 Research costs 6,417 5,406 7,638 Others 22,355 17,980 31,200 P11,097,738 P11,975,335 P17,579,137
23. Selling and Marketing Expenses Selling and marketing expenses consist of: Note 2012 2011 2010 Advertising and promotions P1,319,710 P1,293,074 P1,063,964 Delivery and marketing 546,813 552,889 635,418 Personnel 26 246,963 245,513 222,109 Outside services 111,238 79,739 80,777 Rent 30 102,295 71,281 73,529 Utilities and supplies 86,437 75,462 58,198 Research costs 43,138 39,740 24,420 Travel and transportation 37,879 31,242 31,319 Depreciation and
amortization 12, 13, 25 34,532 32,754 30,423 Repairs and maintenance 33,240 28,660 28,395 Corporate special program 23,078 22,910 24,651 Impairment losses on
receivables 8 - 79 1,226 Others 11,721 18,201 9,246 P2,597,044 P2,491,544 P2,283,675
PP
- 51 -
24. General and Administrative Expenses General and administrative expenses consist of: Note 2012 2011 2010 Personnel 26 P651,413 P664,007 P455,956 Depreciation and
amortization 12, 13, 25 252,329 202,579 159,418 Outside services 29 244,054 269,825 270,199 Taxes and licenses 85,164 113,640 93,621 Insurance 76,712 75,384 54,494 Rent 30 57,009 61,936 94,449 Repairs and maintenance 43,873 39,147 39,086 Corporate special program 37,743 50,363 81,626 Utilities and supplies 35,065 36,226 38,672 Travel and transportation 19,984 20,079 57,770 Research costs 5,425 6,758 18,066 Impairment losses on
receivables 8 - 99 - Others 17,306 48,096 17,663 P1,526,077 P1,588,139 P1,381,020
25. Depreciation and Amortization Depreciation and amortization consist of: Note 2012 2011 2010 Property, plant and equipment 12 P650,799 P481,944 P409,245 Pallets 46,742 36,080 46,737 Investment properties 13 9,072 6,371 11,297 Others 1,240 1,614 2,231 P707,853 P526,009 P469,510
Depreciation and amortization are distributed as follows: Note 2012 2011 2010 Cost of sales 22 P420,992 P290,676 P279,669 Selling and marketing expenses 23 34,532 32,754 30,423 General and administrative
expenses 24 252,329 202,579 159,418 P707,853 P526,009 P469,510
PPP
P
P
P
P

Ginebra San Miguel Annual Report 2012 25Y E A R S
82 83
- 52 -
26. Personnel Expenses Personnel expenses consist of: Note 2012 2011 2010 Salaries and wages P443,195 P416,952 P414,186 Employee benefits 599,836 593,492 455,427 Retirement costs (benefits) 31 52,206 63,706 (9,647) P1,095,237 P1,074,150 P859,966
Personnel expenses are distributed as follows: Note 2012 2011 2010 Cost of sales 22 P196,861 P164,630 P181,901 Selling and marketing expenses 23 246,963 245,513 222,109 General and administrative
expenses 24 651,413 664,007 455,956 P1,095,237 P1,074,150 P859,966
27. Interest Expense Interest expense consists of: Note 2012 2011 2010 Interest on notes payable 16 P467,583 P324,646 P246,665 Interest on long-term debt 153,505 142,975 73,256 Capitalized borrowing costs 12 (9,038) (20,637) (14,916) P612,050 P446,984 P305,005
28. Other Income Other income and charges consist of: Note 2012 2011 2010 Other income:
Sale of scrap P165,821 P50,263 P47,687 Gain on derivatives 36 11,283 - 70,984 Sale of cassava chips and
ENA crystalline 5,105 140,076 - Foreign exchange gain - net 3,709 2,399 44,483 Gain on sale of property
and equipment 605 154 323 Rent income 30 - 7,500 18,000 Others 39,497 2,357 12,329
226,020 202,749 193,806
Forward
PP
P
P
P
P P
- 53 -
Note 2012 2011 2010 Other charges:
Cost of scrap P81,132 P - P - Cost of cassava chips and
ENA crystalline 7,932 148,436 - Loss on derivatives 36 - 18,253 - Loss on purchase agreement - - 2,821 Others 26,044 - 632
115,108 166,689 3,453
P110,912 P36,060 P190,353
29. Related Party Disclosures The Group, in the normal course of business, purchases products and services from and sells products to related parties. Transactions with related parties are made at normal market prices and terms. An assessment is undertaken at each financial year by examining the financial position of the related party and the market in which the related party operates. Transactions with related parties and the related balances include the following:
Year
Revenue from
Related Parties
Purchases from
Related Parties
Amounts Owed by
Related Parties
Amounts Owed to Related Parties Terms Conditions
Ultimate Parent 2012 P28,059 P189,355 P27,306 P81,714 On demand; Unsecured; Company 2011 21,371 440,686 29,613 118,987 Non-interest No impairment
2010 - 351,301 30,198 95,259 bearing
Under Common 2012 118,199 3,747,307 130,584 1,081,437 On demand; Unsecured; Control 2011 149,816 3,490,444 112,713 503,856 Non-interest No impairment
2010 124,595 3,251,293 200,222 729,722 bearing
Joint Venture 2012 - - 118,393 - On demand; Unsecured; 2011 - - 118,393 - Non-interest No impairment 2010 - - - - bearing
Retirement Plan 2012 - - 77,025 - On demand; Unsecured; 2011 - - 137,025 - Non-interest No impairment 2010 - - 137,025 - bearing
Associates of the 2012 - 21,837 - - On demand; Unsecured; Ultimate Parent 2011 - 23,789 - - Non-interest No impairment Company 2010 - 43,217 - - bearing
2012 - - - 2,600,000 3 months; Unsecured; 2011 - - - 1,300,000 Interest- No impairment 2010 - - - - bearing
Others 2012 653 2,670 2,348 810 On demand; Unsecured; 2011 356 817 2,523 400 Non-interest No impairment 2010 - 929 1,413 4,614 bearing
2012 P146,911 P3,961,169 P355,656 P3,763,961
2011 P171,543 P3,955,736 P400,267 P1,923,243
2010 P124,595 P3,646,740 P368,858 P829,595
PP
P P P P
P P
P

Ginebra San Miguel Annual Report 2012 25Y E A R S
84 85
- 54 -
a. The Group, in the normal course of business, has significant transactions with related
parties pertaining to purchases of containers, bottles and other packaging materials and sale of liquor and by-products. The sales to and purchases from related parties are made at market prices. There have been no guarantees provided or received for any amounts owed by and owed to related parties. The Group has not made any provision for impairment losses relating to amounts owed by related parties for the years ended December 31, 2012, 2011 and 2010.
b. Management fees for the years ended December 31, 2012, 2011 and 2010 amounting
to P164,237, P179,234 and P189,054, respectively, are included in outside services account under “General and administrative expenses” (Note 24).
c. Amounts owed by TSML are included in the “Other noncurrent assets” account in
the consolidated statements of financial position (Note 15).
d. Amounts owed to Bank of Commerce are included in the “Notes Payable” account in the consolidated statements of financial position (Note 16).
e. The compensation of key management personnel of the Group, by benefit type,
follows:
2012 2011 2010 Short-term employee benefits P34,499 P41,524 P42,016 Retirement costs (benefits) 7,778 9,109 (1,675) Share-based payments 576 1,200 851 P42,853 P51,833 P41,192
30. Leasing Agreements Finance Leases Group as Lessee In 2008, TSML and TGT entered into various finance lease agreements with a Thai bank covering automobiles needed for business operations. In 2012, additional finance lease agreement with a Thai Bank was entered into by TSML. As of December 31, 2012 and 2011, the Group’s share in the carrying amount of leased transportation equipment amounted to P927 and P619, respectively (Note 12). The Group’s share in the minimum lease payments for these finance lease liabilities are as follows: 2012
Minimum Lease
Payable Interest Principal Within one year P239 P55 P184 After one year but not more than five years 863 84 779 P1,102 P139 P963
- 55 -
2011
Minimum Lease
Payable Interest Principal Within one year P400 P9 P391
Operating Leases Group as Lessor The Parent Company leases out its investment properties to a third party lessee under an operating lease agreement for a period of five years (Note 13). The lease agreement has been terminated on June 24, 2011. As of December 31, 2010, the future minimum lease receivable under such lease are as follows: 2010 Within one year P7,500 After one year but not more than five years - P7,500
No rent income was recognized in the consolidated statement of income in 2012. Rent income recognized in the consolidated statements of income amounted to P7,500 and P18,000 for the years ended December 31, 2011 and 2010, respectively (Note 28). Group as Lessee a. The Parent Company leases various warehouse facilities under operating leases. These
leases typically run for a period of one year. The Parent Company has the option to renew the lease after expiration of the lease term. Rent expense recognized in the consolidated statements of income amounted to P238,164, P292,996 and P268,921 in 2012, 2011 and 2010, respectively.
b. On December 20, 2008, EPSBPI entered into a lease agreement with Navotas Ridge Realty Corporation (NRRC) for ten years from January 1, 2009 to December 31, 2019 and renewable at the option of EPSBPI upon mutual agreement of both parties. Rental fee amounted to P10 per month until January 31, 2010. Upon commencement of operation of the bottling facility on February 1, 2010, rental fee increased to P99 with a 5% escalation every year until the end of the term. On April 1, 2012, EPSBPI entered into another lease agreement with NRRC for a period of five years from April 1, 2012 to March 31, 2017 and renewable at the option of EPSBPI upon mutual agreement of both parties. Rental fee amounted to P69 per month and subject to 5% escalation every year until the end of the term.
c. On February 24, 2009, EPSBPI entered into a lease agreement with San Miguel Properties, Inc. for ten years from March 1, 2009 to February 28, 2019 and renewable at the option of EPSBPI upon mutual agreement of both parties. Rental fee amounted to P10 per month until February 28, 2010. Upon commencement of the operation of the bottling facility on March 1, 2010, rental is increased to P100 with 5% escalation every year until the end of the term.

Ginebra San Miguel Annual Report 2012 25Y E A R S
86 87
- 56 -
d. On July 15, 2010, EPSBPI entered into a lease agreement with Amberland Corporation for two years from July 30, 2010 to July 29, 2012 and renewable on a yearly basis with 10% escalation upon mutual agreement of both parties. Rental fee amounted to P57 per month plus VAT.
The future minimum non-cancellable lease payables are as follows: 2012 Less than one year P3,665 One year to five years 19,271 More than five years 295 P23,231
31. Retirement Plans The Parent Company and DBI have separate funded, noncontributory, defined benefit retirement plans covering all of their permanent employees. Contributions and costs are determined in accordance with the actuarial studies made for the plans. Annual cost is determined using the projected unit credit method. The Group’s latest actuarial valuation date is December 31, 2012. Valuations are obtained on a periodic basis. The Retirement Plans are registered with the Bureau of Internal Revenue as tax-qualified plans under Republic Act No. 4917, as amended. The control and administration of the Group’s retirement plans are vested in the Board of Trustees (BOT), as appointed by the BOD of the Parent Company and DBI. Majority of the BOT of the Group’s retirement plan, who exercises voting rights over the shares and approve material transactions, are also BOD and officers of the Parent Company and DBI. The Retirement Plans’ accounting and administrative functions are undertaken by the Parent Company’s Retirement Funds Office. Retirement costs (benefits) recognized by the Parent Company in profit or loss amounted to P49,750, P62,099 and (P11,930) in 2012, 2011 and 2010, respectively, while those charged by DBI amounted to P2,456, P1,607 and P2,283 in 2012, 2011 and 2010, respectively. The Group’s annual contribution to the retirement plans consists of payments covering the current service cost and amortization of past service costs. The components of retirement costs recognized in the consolidated statements of income in 2012, 2011 and 2010 are as follows: 2012 2011 2010 Current service cost P52,298 P36,559 P31,751 Interest cost 52,787 47,878 44,066 Past service cost-non vested benefits - 231 231 Expected return on plan assets (59,139) (20,962) (53,218) Amortization of actuarial losses (gains) 6,260 - (32,477) Net retirement costs (benefits) P52,206 P63,706 (P9,647)
Actual return on (losses from) plan assets (P13,025) (P35,317) P208,431
The non vested past service cost is amortized for two years.
PP
P
P
- 57 -
The retirement costs (benefits) are recognized in the following line items in the consolidated statements of income: Note 2012 2011 2010 Cost of sales 22 P10,594 P9,109 P - Selling and marketing expenses 23 12,359 11,460 - General and administrative expenses 24 29,253 43,137 (9,647) P52,206 P63,706 (P9,647)
The reconciliation of the assets and liabilities recognized in the consolidated statements of financial position is as follows:
2012 2011 GSMI DBI Total GSMI DBI Total Present value of defined
benefit obligation P826,386 P49,914 P876,300 P837,637 P51,322 P888,959 Fair value of plan assets 583,335 42,370 625,705 632,608 42,866 675,474
(243,051) (7,544) (250,595) (205,029) (8,456) (213,485) Unrecognized actuarial losses 249,073 8,010 257,083 200,800 6,641 207,441
Retirement assets (liabilities) P6,022 P466 P6,488 (P4,229) (P1,815) (P6,044)
Retirement assets (liabilities) recognized by the Parent Company amounted to P6,022 and (P4,229) as of December 31, 2012 and 2011, respectively, while those recognized by DBI amounted to P466 and (P1,815) as of December 31, 2012 and 2011, respectively. The movements in the present value of defined benefit obligation are as follows: 2012 2011 Balance at beginning of year P888,959 P612,516 Interest cost 52,787 47,878 Current service cost 52,298 36,559 Actuarial losses (gains) (16,263) 213,384 Transfer to other plan (16,394) - Benefits paid (85,087) (21,378) Balance at end of year P876,300 P888,959
The movements in the fair value of plan assets are as follows: 2012 2011 Balance at beginning of year P675,474 P732,169 Contributions by employer 64,737 - Expected return on plan assets 59,139 20,962 Transfer to other plan (16,394) - Actuarial losses (72,164) (56,279) Benefits paid (85,087) (21,378) Balance at end of year P625,705 P675,474
P P P
P P P
P
P
P
(

Ginebra San Miguel Annual Report 2012 25Y E A R S
88 89
- 58 -
The Group’s plan assets consist of the following: In Percentages 2012 2011 Marketable securities 36 28 Fixed income portfolio 37 47 Stock trading portfolio 27 25 100 100
Investments in Marketable Securities As of December 31, 2012 and 2011, the plan assets include 14,213,721 and 9,987,785 common shares, respectively, of the Parent Company with fair market value per share of P17.80 and P23.30, respectively. The plan recognized an unrealized loss on revaluation of marketable securities amounting to P70,254 and P96,714 in 2012 and 2011, respectively. There was no dividend income recognized in 2012. The plan recognized dividend income from the investment in shares of stock amounted to P331 in 2011. Interest in Pooled Funds Investments in pooled funds were established mainly to put together all the retirement funds of the Group to be able to draw, negotiate and obtain the best terms and financial deals for the investments resulting from big volume transactions. Investment income and expenses are allocated to the plans based on the pro-rata share in net assets of the pooled funds. The Plans’ interests in the net assets of the pooled funds were 8.22% of fixed income portfolio and 10.38% of stock trading portfolio. As of December 31, 2012, approximately 4.57% and 1.48% of the Plans’ investments in fixed income portfolio and stock trading portfolio, respectively, represent investment in shares of stock of SMC and its subsidiaries. The BOT approved the percentage of asset to be allocated for fixed income instruments and equities. The Retirement Plan has set maximum exposure limits for each type of permissible investments in marketable securities and deposit instruments. The BOT may, from time to time, in the exercise of its reasonable discretion and taking into account existing investment opportunities, review and revise such allocation and limits. The overall expected rate of return is determined based on historical performance of the investments. The principal actuarial assumptions used to determine retirement benefits are as follows: In Percentages 2012 2011 Discount rate 5 6 Expected rate of return on plan assets 9 9 Salary increase rate 7 7
- 59 -
The historical information for the current and previous four annual periods is as follows:
2012 2011 2010 2009 2008 Present value of the defined
benefit obligation P876,300 P888,959 P612,516 P498,514 P350,424 Fair value of plan assets 625,705 675,474 732,169 540,610 296,299 Excess (deficit) in the plan (250,595) (213,485) 119,653 42,096 (54,125) Experience adjustments on plan
liabilities (16,263) 213,384 69,609 40,770 (16,550) Experience adjustments on plan
assets (72,164) (56,279) (155,213) (129,776) (106,841) The Group does not expect to pay any contribution to the defined benefit plans in 2013. As of December 31, 2012 and 2011, the outstanding balances of the Group’s receivables from GSMIRP amounted to P77,025 and P137,025, respectively, are included as part of “Trade and other receivables” account in the consolidated statements of financial position (Notes 8 and 29). Transactions with the retirement plan are made at normal market prices and terms. Outstanding balances as of December 31, 2012 and 2011 are unsecured and settlements are made in cash. There have been no guarantees provided for any retirement plan receivables. The Group has not made any provision for impairment losses relating to the receivables from the retirement plan for the years ended December 31, 2012, 2011 and 2010.
32. Cash Dividends Cash dividends declared by the Parent Company’s BOD to common and preferred shareholders amounted to P1.50 per share in 2011.
33. Basic and Diluted Earnings (Loss) Per Share Basic and Diluted Earnings (Loss) Per Share is computed as follows: 2012 2011 2010 Net income (loss) (P849,200) (P982,160) P913,854 (a) Less dividends on preferred shares 49,180 49,180 49,180 (b) Net income (loss) available to common
shares (P898,380) (P1,031,340) P864,674
Common shares outstanding at beginning of year (in thousands) 290,076 287,437 281,401
Weighted average number of shares issued during the year (in thousands) - 2,419 3,687
(c) Weighted average number of common shares outstanding (in thousands) - basic and diluted 290,076 289,856 285,088
Basic and Diluted Earnings (Loss) Per Share (b/c) (P3.10) (P3.56) P3.03
(P1,031,340)

Ginebra San Miguel Annual Report 2012 25Y E A R S
90 91
- 60 -
34. Share-based Payment Transactions ESPP Under the ESPP implemented in January 2008, 3,000,000 common shares (inclusive of stock dividends declared or stock splits) of the Parent Company’s unissued common shares have been reserved for the employees of the Group until 2013. A participating employee may acquire at least 500 shares of stock through payroll deductions. On August 7, 2009, the BOD approved the increase in the maximum number of shares that may be subscribed per employee from 5,000 to 15,000 shares. All full-time and permanent employees of the Group, who have been employed for a continuous period of one year prior to the subscription period, will be allowed to subscribe at 15% discount to the weighted average market closing prices of the last quarter immediately preceding the subscription period. The ESPP requires the shares subscribed and stock dividends accruing thereto to be pledged to the Parent Company until the subscription is fully paid. The right to subscribe under the ESPP cannot be assigned or transferred. A participant may sell his shares after the second year from the exercise date. Subscriptions receivable as of December 31, 2012 and 2011 amounted to P138,280 and P158,049, respectively, presented as part of “Non-trade” under the “Trade and other receivables” account in the consolidated statements of financial position (Note 8). The ESPP also allows subsequent withdrawal and cancellation of participants’ subscriptions under certain terms and conditions. The shares pertaining to withdrawn or cancelled subscriptions shall remain issued shares and revert to the pool of shares available under the ESPP. The number of subscribed shares and weighted average exercise price under the ESPP as of December 31, 2011 is 2,639,400 at P26.01. The average market price of the shares granted was P30.60 and P26.49 per share in 2011 and 2010, respectively. The average remaining contractual life of the ESPP was two years as of December 31, 2012.
35. Financial Risk Management Objectives and Policies Objectives and Policies The Group has significant exposure to the following financial risks primarily from its use of financial instruments: Interest Rate Risk Foreign Currency Risk Commodity Price Risk Liquidity Risk Credit Risk
This note presents information about the Group’s exposure to each of the foregoing risks, the Group’s objectives, policies and processes for measuring and managing these risks, and the Group’s management of capital.
- 61 -
The Group’s principal non-trade related financial instruments include cash and cash equivalents, short-term and long-term loans, and derivative instruments. These financial instruments, except derivative instruments, are used mainly for working capital management purposes. The Group’s trade-related financial assets and financial liabilities such as trade and other receivables, noncurrent receivables and deposits, trade and other payables, finance lease liabilities and other noncurrent liabilities arise directly from and are used to facilitate its daily operations. The Group’s commodity forwards are intended mainly for risk management purposes. The Group uses derivatives to manage its exposures to commodity price risks arising from the Group’s operations. The BOD has the overall responsibility for the establishment and oversight of the Group’s risk management framework. The Group’s risk management policies are established to identify and analyze the risks faced by the Group, to set appropriate risk limits and controls, and to monitor risks and adherence to limits. Risk management policies and systems are reviewed regularly to reflect changes in market conditions and the Group’s activities. The Group, through its training and management standards and procedures, aims to develop a disciplined and constructive control environment in which all employees understand their roles and obligations. The Group’s Audit Committee oversees how management monitors compliance with the Group’s risk management policies and procedures, and reviews the adequacy of the risk management framework in relation to the risks faced by the Group. The Group’s Audit Committee is assisted in its oversight role by Internal Audit. Internal Audit undertakes both regular and ad hoc reviews of risk management controls and procedures, the results of which are reported to the Audit Committee. The BOD constituted the Group’s Audit Committee to assist the BOD in fulfilling its oversight responsibility of the Group’s corporate governance process relating to the: (a) quality and integrity of the Group’s financial statements and financial reporting process and the Group’s systems of internal accounting and financial controls; (b) performance of the internal auditors; (c) annual independent audit of the Group’s financial statements, the engagement of the independent auditors and the evaluation of the independent auditors’ qualifications, independence and performance; (d) compliance by the Group with legal and regulatory requirements, including the Group’s disclosure control and procedures; (e) evaluation of management’s process to assess and manage the Group’s enterprise risk issues; and (f) fulfillment of the other responsibilities set out by the BOD. The Audit Committee shall also prepare the reports required to be included in the Group’s annual report. The Group’s accounting policies in relation to derivatives are set out in Note 3 to the consolidated financial statements. Interest Rate Risk Interest rate risk is the risk that future cash flows from a financial instrument (cash flow interest rate risk) or its fair value (fair value interest rate risk) will fluctuate because of changes in market interest rates. The Group’s exposure to changes in interest rates relates primarily to the Group’s long-term borrowings. Borrowings issued at fixed rates expose the Group to fair value interest rate risk. On the other hand, borrowings issued at variable rates expose the Group to cash flow interest rate risk.

Ginebra San Miguel Annual Report 2012 25Y E A R S
92 93
- 62 -
The Group manages its interest cost by using an optimal combination of fixed and variable rate debt instruments. Management is responsible for monitoring the prevailing market-based interest rate and ensures that the mark-up rates charges on its borrowings are optimal and benchmarked against the rates charged by other creditor banks. In managing interest rate, the Group aims to reduce the impact of short-term fluctuations on the Group’s earnings. Over the longer term, however, permanent changes in interest rates would have an impact on profit or loss. The sensitivity to a reasonably possible 1% increase in the interest rates, with all other variables held constant, would have decreased the Group’s profit before tax (through the impact on floating rate borrowings) by P8,729 and P3,538 in 2012 and 2011, respectively. A 1% decrease in the interest rate would have had the equal but opposite effect. These changes are considered to be reasonably possible given the observation of prevailing market conditions in those periods. There is no impact on the Group’s other comprehensive income. As of December 31, 2012 and 2011, terms and maturity profiles of the interest-bearing financial instruments, together with its gross amounts, are shown in the following tables:
December 31,2012 <1 Year 1 - 2
Years 2 - 3
Years 3 - 4
Years 4 - 5
Years Over 5 Years Total
Fixed Rate Philippine peso -
denominated P428,571 P428,571 P385,715 P - P - P - PP1,242,857 Interest rate 7.25% - 7.25% - 7.25% - 7.89% 7.89% 7.89%
Floating Rate Philippine peso -
denominated 114,286 114,286 114,286 114,286 114,286 114,285 685,715 Interest rate PDST - F PDST - F PDST-F PDST - F PDST-F PDST-F +1.00% +1.00% +1.00% +1.00% +1.00% +1.00% Foreign currency-
denominated (expressed in Philippine peso) 114,554 57,277 - - - - 171,831
Interest rate THBFIX THBFIX +1.75% +1.75%
P657,411 P600,134 P500,001 P114,286 P114,286 P114,285 P2,100,403
December 31, 2011 <1 Year 1 - 2
Years 2 - 3
Years 3 - 4
Years 4 - 5
Years Over 5
Years Total
Fixed Rate Philippine peso -
denominated P257,143 P428,571 P428,571 P385,715 P - P - P1,500,000 Interest rate 7.25% - 7.25% - 7.25% - 7.25% - 7.89% 7.89% 7.89% 7.89%
Floating Rate Foreign currency-
denominated (expressed in Philippine peso) 118,828 118,828 59,414 - - - 297,070
Interest rate THBFIX THBFIX THBFIX +1.75% +1.75% +1.75%
P375,971 P547,399 P487,985 P385,715 P - P - P1,797,070
2012
P P P P P P
P
- 63 -
Foreign Currency Risk The Group’s functional currency is the Philippine peso, which is the denomination of the bulk of the Group’s revenues. The Group’s exposure to foreign currency risk results from significant movements in foreign exchange rates that adversely affect the foreign currency-denominated transactions of the Group. The Group’s risk management objective with respect to foreign currency risk is to reduce or eliminate earnings volatility and any adverse impact on equity. The Group enters into foreign currency hedges using a combination of non-derivative and derivative instruments such as foreign currency forwards or swaps to manage its foreign currency risk exposure. Short-term currency forward contracts (deliverable and non-deliverable) and options are entered into to manage foreign currency risks arising from importations, revenue and expense transactions, and other foreign currency-denominated obligations. Currency swaps are entered into to manage foreign currency risks relating to long-term foreign currency-denominated borrowings. Information on the Group’s foreign currency-denominated monetary assets and liabilities and their Philippine peso equivalents are as follows:
2012 2011
US Dollar Peso
Equivalent US Dollar Peso
Equivalent Assets Cash and cash equivalents US$4,657 P191,154 US$3,802 P166,658 Trade and other receivables 1,370 56,233 4,150 181,943 6,027 247,387 7,952 348,601
Liabilities Trade and other payables 1,032 42,348 785 34,421 Notes payable 4,318 177,252 5,621 246,406 Long-term debt (including current
maturities) 4,186 171,831 6,776 297,071 Finance lease liabilities
(including current portion) 23 963 9 391 Other noncurrent liabilities 2,058 84,483 2,080 91,203 11,617 476,877 15,271 669,492
Net foreign currency-denominated monetary liabilities (US$5,590) (P229,490) (US$7,319) (P320,891)
The Group reported net foreign exchange gains amounting to P3,709, P2,399 and P44,483 in 2012, 2011 and 2010, respectively, with the translation of its foreign currency-denominated assets and liabilities. These mainly resulted from the movements of the Philippine peso against the US dollar as shown in the following table:
Philippine Peso
to US Dollar December 31, 2010 43.84 December 31, 2011 43.84 December 31, 2012 41.05
P P
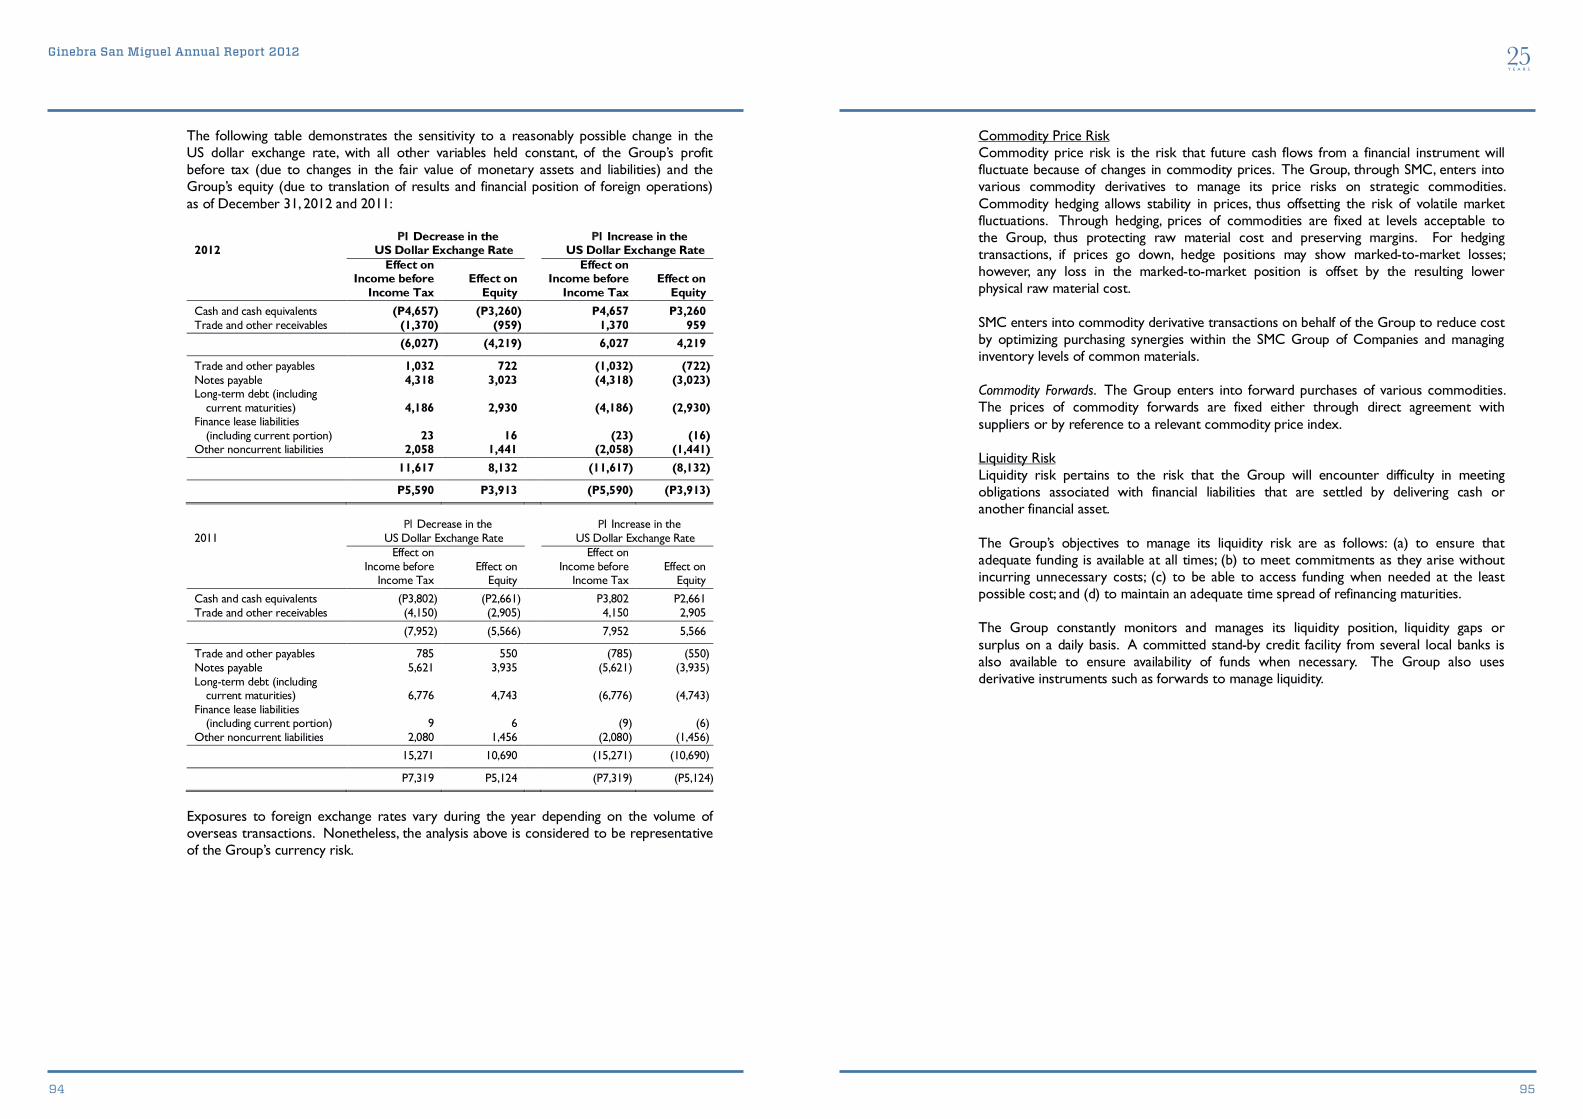
Ginebra San Miguel Annual Report 2012 25Y E A R S
94 95
- 64 -
The following table demonstrates the sensitivity to a reasonably possible change in the US dollar exchange rate, with all other variables held constant, of the Group’s profit before tax (due to changes in the fair value of monetary assets and liabilities) and the Group’s equity (due to translation of results and financial position of foreign operations) as of December 31, 2012 and 2011:
2012 P1 Decrease in the
US Dollar Exchange Rate P1 Increase in the
US Dollar Exchange Rate
Effect on Income before
Income Tax Effect on
Equity
Effect on Income before
Income Tax Effect on
Equity Cash and cash equivalents (P4,657) (P3,260) P4,657 P3,260 Trade and other receivables (1,370) (959) 1,370 959 (6,027) (4,219) 6,027 4,219
Trade and other payables 1,032 722 (1,032) (722) Notes payable 4,318 3,023 (4,318) (3,023) Long-term debt (including
current maturities) 4,186 2,930 (4,186) (2,930) Finance lease liabilities
(including current portion) 23 16 (23) (16) Other noncurrent liabilities 2,058 1,441 (2,058) (1,441) 11,617 8,132 (11,617) (8,132)
P5,590 P3,913 (P5,590) (P3,913)
2011 P1 Decrease in the
US Dollar Exchange Rate P1 Increase in the
US Dollar Exchange Rate
Effect on Income before
Income Tax Effect on
Equity
Effect on Income before
Income Tax Effect on
Equity
Cash and cash equivalents (P3,802) (P2,661) P3,802 P2,661 Trade and other receivables (4,150) (2,905) 4,150 2,905
(7,952) (5,566) 7,952 5,566
Trade and other payables 785 550 (785) (550) Notes payable 5,621 3,935 (5,621) (3,935) Long-term debt (including
current maturities) 6,776 4,743 (6,776) (4,743) Finance lease liabilities
(including current portion) 9 6 (9) (6) Other noncurrent liabilities 2,080 1,456 (2,080) (1,456)
15,271 10,690 (15,271) (10,690)
P7,319 P5,124 (P7,319) (P5,124)
Exposures to foreign exchange rates vary during the year depending on the volume of overseas transactions. Nonetheless, the analysis above is considered to be representative of the Group’s currency risk.
P
P
P
P
- 65 -
Commodity Price Risk Commodity price risk is the risk that future cash flows from a financial instrument will fluctuate because of changes in commodity prices. The Group, through SMC, enters into various commodity derivatives to manage its price risks on strategic commodities. Commodity hedging allows stability in prices, thus offsetting the risk of volatile market fluctuations. Through hedging, prices of commodities are fixed at levels acceptable to the Group, thus protecting raw material cost and preserving margins. For hedging transactions, if prices go down, hedge positions may show marked-to-market losses; however, any loss in the marked-to-market position is offset by the resulting lower physical raw material cost. SMC enters into commodity derivative transactions on behalf of the Group to reduce cost by optimizing purchasing synergies within the SMC Group of Companies and managing inventory levels of common materials. Commodity Forwards. The Group enters into forward purchases of various commodities. The prices of commodity forwards are fixed either through direct agreement with suppliers or by reference to a relevant commodity price index. Liquidity Risk Liquidity risk pertains to the risk that the Group will encounter difficulty in meeting obligations associated with financial liabilities that are settled by delivering cash or another financial asset. The Group’s objectives to manage its liquidity risk are as follows: (a) to ensure that adequate funding is available at all times; (b) to meet commitments as they arise without incurring unnecessary costs; (c) to be able to access funding when needed at the least possible cost; and (d) to maintain an adequate time spread of refinancing maturities. The Group constantly monitors and manages its liquidity position, liquidity gaps or surplus on a daily basis. A committed stand-by credit facility from several local banks is also available to ensure availability of funds when necessary. The Group also uses derivative instruments such as forwards to manage liquidity.

Ginebra San Miguel Annual Report 2012 25Y E A R S
96 97
- 66 -
The table below summarizes the maturity profile of the Group’s financial assets and financial liabilities based on contractual undiscounted payments used for liquidity management as of December 31, 2012 and 2011. 2012
Carrying Amount
Contractual Cash Flow
1 Year or Less
> 1 Year - 2 Years
> 2 Years - 5 Years
Over 5 Years
Financial Assets Cash and cash equivalents P621,530 P621,530 P621,530 P - P - P - Trade and other receivables-net 3,878,832 3,878,832 3,878,832 - - - Derivative assets (included
under “Prepaid expenses and other current assets” account in the consolidated statements of financial position) 1,288 1,288 1,288 - - -
Noncurrent receivables and deposits (included under “Other noncurrent assets - net” account in the consolidated statements of financial position) 309,980 309,980 - 191,587 118,393 -
Financial Liabilities Notes payable 9,609,452 9,665,096 9,665,096 - - - Trade and other payables
(excluding dividends payable) 3,447,051 3,447,051 3,447,051 - - -
Derivative liabilities (included under “Trade and other payables” account in the consolidated statements of financial position) 413 413 413 - - -
Long-term debt (including current maturities) 2,096,169 2,334,231 769,360 671,770 776,910 116,191
Finance lease liabilities (including current portion recognized under “Trade and other payables” account in the consolidated statements of financial position) 963 1,102 239 239 624 -
Other noncurrent liabilities 84,483 91,893 2,432 89,461 - -
PPP- net
- 67 -
2011
Carrying Amount
Contractual Cash Flow
1 Year or Less
> 1 Year - 2 Years
> 2 Years - 5 Years
Over 5 Years
Financial Assets Cash and cash equivalents P366,116 P366,116 P366,116 P - P - P - Trade and other receivables - net 3,156,620 3,156,620 3,156,620 - - -
Derivative assets (included under “Prepaid expenses and other current assets” account in the consolidated statements of financial position) 315 315 315 - - -
Noncurrent receivables and deposits (included under “Other noncurrent assets - net” account in the consolidated statements of financial position) 432,670 432,670 - 314,277 118,393 -
Financial Liabilities Notes payable 7,931,093 7,985,546 7,985,546 - - - Trade and other payables
(excluding dividends payable) 2,147,431 2,147,431 2,147,431 - - -
Derivative liabilities (included under “Trade and other payables” account in the consolidated statements of financial position) 3,619 3,619 3,619 - - -
Long-term debt (including current maturities) 1,790,821 2,077,565 495,361 637,251 944,953 -
Finance lease liabilities (including current portion recognized under “Trade and other payables” account in the consolidated statements of financial position) 391 400 400 - - -
Other noncurrent liabilities 91,203 98,108 2,543 2,791 92,774 - Credit Risk Credit risk is the risk of financial loss to the Group if a customer or counterparty to a financial instrument fails to meet its contractual obligations, and arises principally from the Group’s trade and other receivables. The Group manages its credit risk mainly through the application of transaction limits and close risk monitoring. It is the Group’s policy to enter into transactions with a wide diversity of creditworthy counterparties to mitigate any significant concentration of credit risk. The Group has regular internal control reviews to monitor the granting of credit and management of credit exposures. Trade and Other Receivables The Group’s exposure to credit risk is influenced mainly by the individual characteristics of each customer. However, management also considers the demographics of the Group’s customer base, including the default risk of the industry and country in which customers operate, as these factors may have an influence on the credit risk. Goods are subject to retention of title clauses so that in the event of default, the Group would have a secured claim. Where appropriate, the Group obtains collateral or arranges master netting agreements The Group has established a credit policy under which each new customer is analyzed
.

Ginebra San Miguel Annual Report 2012 25Y E A R S
98 99
- 69 -
The BOD has overall responsibility for monitoring capital in proportion to risk. Profiles for capital ratios are set in the light of changes in the Group’s external environment and the risks underlying the Group’s business, operation and industry. The Group monitors capital on the basis of debt-to-equity ratio, which is calculated as total debt divided by total equity. Total debt is defined as total current liabilities and total noncurrent liabilities, while equity is total equity as shown in the consolidated statements of financial position. There were no changes in the Group’s approach to capital management during the year. The Group is not subject to externally imposed capital requirements.
36. Financial Assets and Financial Liabilities The table below presents a comparison by category of carrying amounts and fair values of the Group’s financial instruments as of December 31, 2012 and 2011:
2012 2011
Carrying Amount Fair Value
Carrying Amount Fair Value
Financial Assets Cash and cash equivalents P621,530 P621,530 P366,116 P366,116 Trade and other receivables - net 3,878,832 3,878,832 3,156,620 3,156,620 Derivative assets (included under
“Prepaid expenses and other current assets” account in the consolidated statements of financial position) 1,288 1,288 315 315
Noncurrent receivables and deposits (included under “Other noncurrent assets - net” account in the consolidated statements of financial position) 309,980 309,980 432,670 432,670
Financial Liabilities Notes payable 9,609,452 9,609,452 7,931,093 7,931,093 Trade and other payables
(excluding dividends payable) 3,447,051 3,447,051 2,147,431 2,147,431 Derivative liabilities (included
under “Trade and other payables” account in the consolidated statements of financial position) 413 413 3,619 3,619
Long-term debt (including current maturities) 2,096,169 2,180,226 1,790,821 1,956,436
Finance lease liabilities (including current portion recognized under “Trade and other payables” account in the consolidated statements of financial position) 963 963 391 391
Other noncurrent liabilities 84,483 84,483 91,203 91,203
- 68 -
individually for creditworthiness before the Group’s standard payment and delivery terms and conditions are offered. The Group ensures that sales on account are made to customers with appropriate credit history. The Group has detailed credit criteria and several layers of credit approval requirements before engaging a particular customer or counterparty. The Group’s review includes external ratings, when available, and in some cases bank references. Purchase limits are established for each customer and are reviewed on a regular basis. Customers that fail to meet the Group’s benchmark creditworthiness may transact with the Group only on a prepayment basis. The Group establishes an allowance for impairment that represents its estimate of incurred losses in respect of trade and other receivables. The main components of this allowance are a specific loss component that relates to individually significant exposures, and a collective loss component established for groups of similar assets in respect of losses that have been incurred but not yet identified. The collective loss allowance is determined based on historical data of payment statistics for similar financial assets. Financial information on the Group’s maximum exposure to credit risk as of December 31, 2012 and 2011, without considering the effects of collaterals and other risk mitigation techniques, is presented below. Note 2012 2011 Cash and cash equivalents 7 P621,530 P366,116 Trade and other receivables - net 8 3,878,832 3,156,620 Derivative assets 10 1,288 315 Noncurrent receivables and deposits 15 309,980 432,670 P4,811,630 P3,955,721
The credit risk for cash and cash equivalents and derivative assets is considered negligible, since the counterparties are reputable entities with high quality external credit ratings. The Group’s exposure to credit risk arises from default of counterparty. Generally, the maximum credit risk exposure of receivables is its carrying amount without considering collaterals or credit enhancements, if any. The Group has no significant concentration of credit risk since the Group deals with a large number of homogenous trade customers. The Group does not execute any credit guarantee in favor of any counterparty. Capital Management The primary objective of the Group’s capital management is to ensure that it maintains a strong credit rating and healthy capital ratios in order to support its businesses and maximize shareholder value. The Group manages its capital structure and makes adjustments in the light of changes in economic conditions. To maintain or adjust the capital structure, the Group may adjust the dividend payment to shareholders, pay-off existing debts, return capital to shareholders or issue new shares. The Group defines capital as paid-in capital stock, additional paid-in capital and retained earnings, both appropriated and unappropriated. Other components of equity such as treasury stock and cumulative translation adjustments are excluded from capital for purposes of capital management.
P
- 67 -
2011
Carrying Amount
Contractual Cash Flow
1 Year or Less
> 1 Year - 2 Years
> 2 Years - 5 Years
Over 5 Years
Financial Assets Cash and cash equivalents P366,116 P366,116 P366,116 P - P - P - Trade and other receivables - net 3,156,620 3,156,620 3,156,620 - - -
Derivative assets (included under “Prepaid expenses and other current assets” account in the consolidated statements of financial position) 315 315 315 - - -
Noncurrent receivables and deposits (included under “Other noncurrent assets - net” account in the consolidated statements of financial position) 432,670 432,670 - 314,277 118,393 -
Financial Liabilities Notes payable 7,931,093 7,985,546 7,985,546 - - - Trade and other payables
(excluding dividends payable) 2,147,431 2,147,431 2,147,431 - - -
Derivative liabilities (included under “Trade and other payables” account in the consolidated statements of financial position) 3,619 3,619 3,619 - - -
Long-term debt (including current maturities) 1,790,821 2,077,565 495,361 637,251 944,953 -
Finance lease liabilities (including current portion recognized under “Trade and other payables” account in the consolidated statements of financial position) 391 400 400 - - -
Other noncurrent liabilities 91,203 98,108 2,543 2,791 92,774 - Credit Risk Credit risk is the risk of financial loss to the Group if a customer or counterparty to a financial instrument fails to meet its contractual obligations, and arises principally from the Group’s trade and other receivables. The Group manages its credit risk mainly through the application of transaction limits and close risk monitoring. It is the Group’s policy to enter into transactions with a wide diversity of creditworthy counterparties to mitigate any significant concentration of credit risk. The Group has regular internal control reviews to monitor the granting of credit and management of credit exposures. Trade and Other Receivables The Group’s exposure to credit risk is influenced mainly by the individual characteristics of each customer. However, management also considers the demographics of the Group’s customer base, including the default risk of the industry and country in which customers operate, as these factors may have an influence on the credit risk. Goods are subject to retention of title clauses so that in the event of default, the Group would have a secured claim. Where appropriate, the Group obtains collateral or arranges master netting agreements The Group has established a credit policy under which each new customer is analyzed

Ginebra San Miguel Annual Report 2012 25Y E A R S
100 101
- 70 -
The following methods and assumptions are used to estimate the fair value of each class of financial instruments: Cash and Cash Equivalents, Trade and Other Receivables and Noncurrent Receivables and Deposits. The carrying amount of cash and cash equivalents and trade and other receivables approximates fair value primarily due to the relatively short-term maturities of these financial instruments. In the case of noncurrent receivables and deposits, the fair value is based on the present value of expected future cash flows using the applicable discount rates based on current market rates of identical or similar quoted instruments. Derivatives. The fair values of forward exchange contracts are calculated by reference to current forward exchange rates. In the case of freestanding currency and commodity derivatives, the fair values are determined based on quoted prices obtained from their respective active markets. Fair values for stand-alone derivative instruments that are not quoted from an active market and for embedded derivatives are based on valuation models used for similar instruments using both observable and non-observable inputs. Notes Payable and Trade and Other Payables. The carrying amount of notes payable and trade and other payables approximates fair value due to the relatively short-term maturities of these financial instruments. Long-term Debt, Finance Lease Liabilities and Other Noncurrent Liabilities. The fair value of interest-bearing fixed-rate loans is based on the discounted value of expected future cash flows using the applicable market rates for similar types of instruments as of reporting date. As of December 31, 2012 and 2011, discount rates used range from 0.68% to 3.40% and 1.72% to 4.06%, respectively. The carrying amounts of floating rate loans with annually interest rate repricing approximate their fair values. Derivative Financial Instruments The Group’s derivative financial instruments according to the type of financial risk being managed and the details of freestanding and embedded derivative financial instruments are discussed below. The Group, through SMC, enters into various commodity derivative contracts to manage its exposure on commodity price risk covering the Group’s requirements on fuel or oil. Derivative Instruments not Designated as Hedges The Group enters into certain derivatives as economic hedges of certain underlying exposures. These include freestanding and embedded derivatives found in host contracts, which are not designated as accounting hedges. Changes in fair value of these instruments are accounted for directly in profit or loss. Details are as follows: Freestanding Derivatives Freestanding derivatives consist of commodity derivatives entered into by SMC on behalf of the Group. Embedded Derivatives The Group’s embedded derivatives include currency forwards embedded in non-financial contracts.
- 71 -
Embedded Currency Forwards As of December 31, 2012 and 2011, the total outstanding notional amount of currency forwards embedded in non-financial contracts amounted to US$1,830 and US$7,502, respectively. These non-financial contracts consist mainly of foreign currency- denominated purchase orders and sales agreements. The embedded forwards are not clearly and closely related to their respective host contracts. As of December 31, 2012 and 2011, the net positive (negative) fair value of these embedded currency forwards amounted to P875 and (P3,304), respectively. For the years ended December 31, 2012, 2011 and 2010, the Group recognized marked-to-market gains (losses) from freestanding and embedded derivatives amounting to P11,283, (P18,253) and P70,984, respectively. Fair Value Changes on Derivatives The net movements in fair value of all derivative instruments for the years ended December 31, 2012 and 2011 are as follows: 2012 2011 Balance at beginning of year (P3,304) P16,986 Net changes in fair value of non-accounting hedges 11,283 (18,253) 7,979 (1,267) Less fair value of settled instruments 7,104 2,037 Balance at end of year P875 (P3,304)
Fair Value Hierarchy Financial assets and liabilities measured at fair value in the consolidated statements of financial position are categorized in accordance with the fair value hierarchy. This hierarchy groups financial assets and financial liabilities into three levels based on the significance of inputs used in measuring the fair value of the financial assets and financial liabilities. The table below analyzes financial instruments carried at fair value, by valuation method as of December 31, 2012 and 2011. The different levels have been defined as follows: Level 1: quoted prices (unadjusted) in active markets for identical assets or
liabilities;
Level 2: inputs other than quoted prices included within Level 1 that are observable for the asset or liability, either directly or indirectly; and
Level 3: inputs for the asset or liability that are not based on observable market data.
2012 Level 1 Level 2 Level 3 Total Financial Assets Derivative assets P - P1,288 P - P1,288 Financial Liabilities Derivative liabilities - 413 - 413
P P
CORPORATE HEAD OFFICEGinebra San Miguel Inc.3rd and 6th FloorsSan Miguel Properties CentreSt. Francis St., Mandaluyong City 1550 Metro Manila, PhilippinesTelephone: (632) 689-9100Fax: (632) 633-2604
SHAREHOLDER SERVICES AND ASSISTANCEThe SMC Stock Transfer Services Corporation serves as the Company’s stock transfer agent and registrar. For inquiries regarding dividend payments, change of address and account status, lost of damaged stock certifi cate, please write or call:
SMC STOCK TRANSFER SERVICE CORPORATION2nd Floor, SMC Head Offi ce40 San Miguel Avenue, Mandaluyong City1550 Metro Manila, PhilippinesTelephone: (632) 632-3450 to 52Email Address: [email protected]
CUSTOMER CAREFor inquiries, orders and suggestions on our products and services, please write or call:
SAN MIGUEL CUSTOMER CARE CENTERSan Miguel Properties Center7 St. Francis Street, Mandaluyong City1550 Metro Manila, PhilippinesTelephone: (632) 632-BLOG (2564)Fax: (632) 632-3299 Mailbox No. 2005#Toll free: 1-800-1888-7621Email: [email protected]
Ginebra San Miguel Annual Report 2012
102
- 72 -
2011 Level 1 Level 2 Level 3 Total Financial Assets Derivative assets P - P315 P - P315 Financial Liabilities Derivative liabilities - 3,619 - 3,619
As of December 31, 2012 and 2011, the Group has no financial instruments valued based on Level 1 and Level 3. During the year, there were no transfers between Level 1 and Level 2 fair value measurements, and no transfers into and out of Level 3 fair value measurements.
37. Other Matters a. Commitments
The Company has a Toll Manufacturing Agreement with third parties for the
production of its liquor and non liquor products. Toll manufacturing expense amounting to P239,492, P463,498 and P721,213, in 2012, 2011 and 2010, respectively, were included as part of outside services under the “Cost of sales” account (Note 22).
The outstanding purchase commitments of the Parent Company as of December 31, 2012 and 2011 amounted to US$84,706 (P3,477,195) and US$79,188 (P3,471,582), respectively.
b. Contingencies
The Group is contingently accountable for liabilities arising from lawsuits or claims (mostly labor related cases) filed by third parties, which are either pending decisions by the courts or are subject to settlement agreements. The outcome of these lawsuits cannot be presently determined. In the opinion of management and its legal counsel, the eventual liability arising from these lawsuits or claims, if any, will not have a material effect on the consolidated financial statements. No provision was recognized in 2012, 2011 and 2010.

2012 Annual ReportGINEBRA SAN MIGUEL INC.
3rd & 6th floorsSan Miguel Properties CentreSt. Francis Street, Mandaluyong City1550 Metro Manila, Philippines
www.ginebrasanmiguel.com
A SUBSIDIARY OFSAN MIGUEL CORPORATION
25Y E A R S
2012 Annual ReportGINEBRA SAN MIGUEL INC.
A SUBSIDIARY OFSAN MIGUEL CORPORATION
25Y E A R S
GIN
EBRA
SAN
MIG
UEL IN
C.
2012 A
NN
UA
L REPO
RT