Embed Size (px)
Citation preview

180 YEARSC E L E B R A T I N G
GINEBRA SAN MIGUEL INC.ANNUAL REPORT 2014
Façade of the Distileria Licorea de Ayala, c. 1900sProducer of first Ginebra San Miguel, 1834 to 1924
Damajuana1834 - 1930s
San Miguel CorporationPhilippines’ largest diversified conglomerate
Façade of La Tondeña, Inc., c. 1950sContinued the tradition of excellence, 1924 to 1987
FrascoOriginal version of Cuatro Cantos, 1930s
3rd and 6th Floors, San Miguel Properties Centre7 St. Francis Street, Mandaluyong City1550 Metro Manila, Philippines
www.ginebrasanmiguel.com
A SUBSIDIARY OFSAN MIGUEL CORPORATION
GINEBRA SAN
MIGU
EL INC.
2014 Annual Report
Celebrating 180 years 1
FINAN
CIAL HIGH
LIGHTS
In Thousands Pesos, Except Per Share Data
1 Exclusive of discontinued operations2 Based on the number of shares outstanding at the end of each year
FINANCIALHIGHLIGHTS
GIN
EBRA
SAN
MIG
UEL
INC.
2014
Ann
ual R
epor
t
TABLE OFCONTENTS
MESSAGE TOSTOCKHOLDERS
PORTFOLIO OFBEVERAGES
180 YEARS OFGINEBRA SAN MIGUEL
DISTILLING THE FILIPINO SPIRIT
A RAY OF HOPE
1
2
4
81014
FINANCIALHIGHLIGHTS
BOARD OF DIRECTORS16CORPORATE GOVERNANCE17
22 REPORT OF THE AUDIT COMMITTEE
23 FINANCIAL STATEMENTS
GIN
EBRA
SAN
MIG
UEL
INC.
2014
Ann
ual R
epor
t
Celebrating 180 years 3
MESSAGE TO
STOCKH
OLDERS
MESSAGE TOSTOCKHOLDERS
Ginebra San Miguel Inc. finally turned the corner in time for our 180th anniversary.
“Our anniversary was not a mere milestone, but a significant achievement.”
In 2014, we regained our footing and reported ₱14.9 billion in revenues, a 9% increase from the previous year. Income from continuing operations before income tax rose by about ₱1.3 billion, to break even this year. With reduced variable costs, gross profit margin rose to 27% ―the highest in more than five years.
Overall, this remarkable recovery is the result of programs we implemented to strengthen both the company’s top- and bottomline.
Last year, we paid homage to the hardworking Filipino through the thematic campaign, ‘Ganado sa Buhay’. It depicted the ordinary Filipino as a hero who presses on despite everyday challenges to give his family a better future. The material was aired on TV and radio, and was supported by on-ground and promotional activities such as Ginumanfest, which is now on its third nationwide installment.
These efforts helped the company reassert its position in different parts of the country, especially in North Luzon where we re-established our dominance. In South Luzon, we continued to encroach on the competition’s market and are primed to reclaim leadership. Shares in the Visayas, on the other hand, nearly doubled as modest gains were realized in the GMA and Mindanao areas.
To mitigate the effects of higher taxes arising from the ad valorem portion of the excise tax, we sought to further improve efficiencies in our operation. We worked to extract higher yield from distillery, driving alcohol costs down 3% from the previous year. Vigilance in monitoring sources of used bottles was also key, allowing us to maintain container cost efficiencies.
Notwithstanding improved operating results, a net loss of about ₱766 million was realized due to the recognition of deferred income taxes incurred in 2011 and 2012.
Still, our path to recovery is clear.
The campaign resonated extremely well with consumers, increasing volumes for the Ginebra San Miguel brand by as much as 9%, and thereby pushing total liquor volumes by 4% from prior year.
Our brand strengthening efforts were also reinforced by our year-long celebration of Ginebra San Miguel’s milestone anniversary, which doubled as an effective promotional strategy for our products. Furthermore, our anniversary theme, “Kabahagi ng Sambayanang Pilipino”, underscored our brand’s value as an integral part of the everyday celebrations and social gatherings.
Other brands also contributed to growth, improving our volumes in key regions. GSM Blue Flavors, a recent addition to the GSM Blue family, was launched via availability and consumption drives mainly in the Eastern part of the Visayas. Vino Kulafu, the country’s dominant Chinese Wine brand, meanwhile continued to perform well in Mindanao and other parts of the Visayas.
We also worked on enhancing our distribution capability and coverage by entering into partnership with new, roving wholesalers who served to extend our reach nationwide.
This year, we are taking bolder steps to outdo, or at the very least, replicate our 2014 performance. We will lay the groundwork to sustaining our volume growth by protecting and further growing our market share, particularly in the gin category. We will also continue to introduce new, exciting brands to meet changing consumer needs.
Primera Light will be our main brandy offering. Since introducing it to the market early this year, consumers have rated it highly for its superior taste, aroma and smoothness. We are also introducing innovations to the GSM Blue brand to strengthen its appeal among young consumers.
We expect competition to further intensify as fresh rounds of tax hikes lie on the horizon and trade borders fall with the ASEAN integration. As such, we will be focusing our efforts on aligning more closely with our customers and consumers, focusing our product portfolio and further growing our markets.
Related to this, we have also divested our stake in the non-alcoholic beverage business and have transferred this to San Miguel Brewery Inc. This will allow us to concentrate on our core strength—liquor.
Fellow stockholders, our achievements this year would not have been possible without your support, and we thank you for your continued commitment to our growth. We’d also like to thank our Board, for their trust and steady guidance, and our employees, for their unwavering dedication.
As we close the book on 2014 and look to the future, it’s worth being reminded that our anniversary was not a mere milestone, but a significant achievement. After all, very few companies in the Philippines today can say they have lasted half as long as ours.
And while we have always been proud of our brand’s heritage and how generations of Filipinos have identified with its credos, we know too that longevity is borne out of an ability to constantly recalibrate, transform, and adapt to the changing markets and the changing times.
We believe we have succeeded in doing exactly that these past few years. With one of our more robust years behind us, and with the next phase of our growth strategy already in place, Ginebra San Miguel is back on familiar ground, determined to deliver on the promise of a new start.
EDUARDO M. COJUANGCO, JR.Chairman & CEO
BERNARD D. MARQUEZPresident
The effects of higher excise taxes, shifting consumer preference, and greater competition in the hard liquor market, have all contributed to years of successive operating losses for our company. We have brands with strong market shares in
numerous categories, but after a thorough assessment of our business and recent performance, we made a conscious effort to focus on winning back the market of
our flagship, Ginebra San Miguel.
LIQUORVOLUMES
GINEBRASAN MIGUEL
VOLUMES
NET REVENUES UP BY
increasefrom
prior year
increasefrom
prior year
4% 9%

GIN
EBRA
SAN
MIG
UEL
INC.
2014
Ann
ual R
epor
t
4 Celebrating 180 years 5
GINEBRA SAN MIGUELAngelito (250ml)Round (350ml)Frasquito (350ml)Frasco (700ml)
* Alcoholic
PORTFOLIO OFBEVERAGES
PORTFO
LIO O
F BEVERAGES

6
GIN
EBRA
SAN
MIG
UEL
INC.
2014
Ann
ual R
epor
t
Celebrating 180 years 7
PORTFO
LIO O
F BEVERAGES
GRAN MATADOR BRANDY SOLERA Solo (350ml)Long Neck (700ml)Litro (1000ml)
GRAN MATADOR LIGHTSolo (350ml)Long Neck (700ml)Litro (1000ml)
* Alcoholic
ANTONOV VODKA (700ml)
ANTONOV VODKA MIXED DRINKIce (330ml)
DON ENRIQUE MIXKILA (700ml)
* Alcoholic
G.S.M. BLUESolo (350ml)Long Neck (700ml)Litro (1000ml)
G.S.M. BLUE FLAVORSSolo (350ml)Long Neck (700ml)
MojitoBrown Coffee
* Alcoholic
VINO KULAFUClassic (350ml)Long Neck (700ml)
* Alcoholic
TONDEÑA MANILA RUMGold, Silver, Dark(700ml)
For Export only
* Alcoholic
MAGNOLIA HEALTHTEARGB (250ml)Apple, Lemon, and Strawberry
MAGNOLIA PUREWATERPET (355ml, 500ml, 1000ml)
BERRI (NATURAL FRUIT JUICES)Apple, Dark Grape, Orange, Tomato, Cranberry (1000ml)
Apple, Orange, Multi V, Dark Grape,Pink Guava (2400ml)
MAGNOLIA FRUIT DRINKRGB (250ml)Grape and OrangePowdered (35g, 400g)Lemonade, Calamansi, Orange-Mango and Valencia Orange
Powdered (35g)Apple and Lemon
Mango (400g)For Export only
* Non-Alcoholic
PREMIUM GIN(750ml)
* Alcoholic
GINEBRA SAN MIGUEL

Celebrating 180 years 9
180 YEARS OF
GINEBRA SAN
MIGU
EL
8
GIN
EBRA
SAN
MIG
UEL
INC.
2014
Ann
ual R
epor
t
Ginebra San Miguel is the Philippines’ pioneering gin.
Ginebra San Miguel de Ayala, as it was previously
known, was first produced on March 10, 1834 by
the Distileria Licorea de Ayala, a distillery located
along Echague Street in Quiapo, Manila, owned by
compatriots Antonio de Ayala and Domingo Roxas.
The brand, already an award winner as early as the
late 1900s, was a drink for the wealthy ― popular
among both peninsulares and insulares.
By 1864, Ginebra’s popularity had trickled down to the working-class. To suit the palate of the masa, Ginebra San Miguel was made stronger and more flavorful. It became an alternative to the colonial version of moonshine, Vino de Nipa.
With its strong alcohol content and soothing flavor, Ginebra San Miguel gained new adherents. By the the turn of the 20th century, the brand became the most sought-after liquor drink by Filipinos and the new colonizers, the Americans.
In 1924, Filipino-Chinese businessman Don Carlos Palanca Sr., owner of La Tondeña distillery, acquired the distillery from the Ayalas. Palanca’s success was such that he became known as the “Alcohol King”; La Tondeña became the country’s leading distiller with Ginebra San Miguel as its flagship liquor brand.
On August 1, 1987, San Miguel Corporation (SMC), the country’s largest brewer with interests in food, packaging, and other businesses, acquired La Tondeña Distillery Inc (LTDI) in a bid to expand its beverage business portfolio.
Under San Miguel Corporation, Ginebra benefitted from access to its new parent company’s vast domestic and international distribution network. Ginebra San Miguel became the country’s leading liquor brand, cornering over 50% of the market, and was heralded as the world’s largest-selling gin.
In 2003, LTDI was renamed Ginebra San Miguel Incorporated (GSMI) in homage to the flagship brand and its roots.
Ginebra San Miguel is the epitome of excellence, reaping accolades both locally and internationally. Every bottle of Ginebra San Miguel goes through a stringent production process to ensure optimal quality.
Today, the brand is synonymous to gin in the Philippines, accounting for over 90% of gin sales in the country. As a testament to the strength of its brand name, variants such as GSM Blue, GSM Blue Flavors, and Ginebra San Miguel Premium Gin, have been introduced to cater to different market segments and different tastes.
Having just marked its 180th anniversary in 2014, the brand endures and continues to weave itself into the fabric of everyday Filipino life.
SAMBAYANANG PILIPINO180-TAON KABAHAGI NG
SAN MIGUEL CORPORATION

Celebrating 180 years 11
DISTILLING TH
E FILIPINO
SPIRIT
10
GIN
EBRA
SAN
MIG
UEL
INC.
2014
Ann
ual R
epor
t
Few brands in the history of philippine business have as strong a connection with their intended market as ginebra san miguel. whether it’s invoked as the name of the world’s largest selling gin, a pop culture reference, or emblazoned on the jerseys of the country’s most popular
basketball team, the iconic ginebra san miguel brand evokes images of hard-working filipinos soldiering on through life’s challenges―
persevering, enduring, and emerging triumphant in the end.
This consistent focus on quality, coupled perhaps with nationalistic pride after the Philippines declared its independence from America in 1946, brought about a major shift in the brand’s advertising. In support of the “Filipino First” policy, the brand abandoned Spanish in favor of Tagalog in its brand messaging.
It’s virtually impossible to come up with an exhaustive history of a 180-year old brand that has outlived two colonial masters, survived two World Wars, the Japanese occupation, and witnessed much of the political
upheaval of more recent vintage. But through advertising, we can piece together the story of how Ginebra San Miguel has become such a part of Filipino culture.
This powerful brand equity was crystallized through many decades of brand building. While the product’s world-class taste is and will always be its primary attribute, the consumers’ affinity—or kinship—with Ginebra
San Miguel is, to a large extent, built on the brand’s ability to embody the ideals and aspirations of generations of Filipinos and imbue these as its own.
A HISTORY OF QUALITYSome of Ginebra San Miguel’s earliest advertisements attest to the product’s quality. Advertising in publications such as Philippine Review tell of its triumphs in expositions in Amsterdam (1883), Paris (1889), and San Francisco (1899), among others. Today, Ginebra continues to reap awards, particularly from the Monde Selection, one of the most renowned international quality awards for the beverage industry.
From that time on, Ginebra San Miguel gained even more followers among the masa, becoming a focal point of celebrations, big and small.
In the 60s, Ginebra San Miguel became popular in fishing villages; fishermen became part of the Ginebra drinker’s demographic. Ad campaigns from this period highlighted their hard work, in the process cementing Ginebra’s status as the perfect drink to celebrate harvests.
This theme—which hewed closely to the everyday struggles of common Filipinos would for many decades come to define not just Ginebra’s primary market, but serve as a blueprint for the brand’s strategy of celebrating the masses, their endeavors, and their contributions to their families and society.
With television and radio becoming the most popular and accessible medium of communication by the 1980s, Ginebra San Miguel was able to reach more consumers and cultivate further its already strong bond with consumers. The brand signed on celebrity endorsers—larger than life personalities that the masa could identify with—and at the same time stuck to universal themes such as friendship and the value of hard work.
DISTILLING THE FILIPINO SPIRIT
THE INDEPENDENT, JAN. 1, 1927Ginebra San Miguel ads transitioned from use of Spanish text to Tagalog text but still conveying the same message, that Filipino celebrations are never complete without Ginebra San Miguel.
PHILIPPINE REVIEW, 1916Early advertisements in Spanish text showcased Ginebra San Miguel as the first gin in the Philippines and the most awarded in quality and taste.
ISANG HIMIG NG PAGSASAMAHAN, 1965 Ginebra San Miguel started to build its kinship with its core consumers, the Filipino masses, as shown in these print advertisements.
ICONS ENDORSING AN ICONHagibis, a popular singing group at the time, became one of its early celebrity endorsers. Its ad-tag “Walang Katapat” recognized the industriousness and abilities of the common Filipino – from the hardworking farmers, fisherfolk to laborers and professionals.
Personalities who have since become part of Filipino pop culture would continue to carry the torch for Ginebra San Miguel years later, among them: Nora Aunor, Joey de Leon, Martin Nievera, Gerry Peñalosa, Rosanna Roces, April Boy Regino in the 90s, and more recently, actress Anne Curtis and boxing icon Manny Pacquiao who represented various sectors of Ginebra San Miguel’s expanding market. Even Pacquiao’s mother, Mommy Dionisia, the archetypal stern but devoted Filipino mom, would figure in one of Manny’s Ginebra commercials.
HAGIBIS IN ‘WALANG KATAPAT’, 1980 Hagibis, the hit-making Filipino band of the disco era was Ginebra’s first music act endorsers.
INUMIN NG TUNAY NA LALAKI, 1969
LIWAYWAY MAGAZINE, JAN. 13, 1947
A BRAND FINDS ITS VOICE

Celebrating 180 years 13
DISTILLING TH
E FILIPINO
SPIRIT
12
GIN
EBRA
SAN
MIG
UEL
INC.
2014
Ann
ual R
epor
t
GINEBRA ‘TO PARE, 2002
GINEBRA SAN MIGUEL BASKETBALL TEAM, 1987
OH MY GIN, 2011
GANADO SA BUHAY, 2014
BILOG ANG MUNDO, 2003
DISTILLING THE FILIPINO SPIRIT
Manny Pacquiao in his first TV advertisement for Ginebra San Miguel.
Manny Pacquiao for Ginebra San Miguel and Anne Curtis for G.S.M. Blue teamed up for Oh My Gin promo.
Launched on the occasion of its 180th anniversary, Ginebra San Miguel championed the working class with the campaign ‘Ganado sa Buhay’, which features their inspiring stories of resiliency and triumph.
ANG BIDA, NAKA-GINEBRA, 2010 Ang Bida, Naka-Ginebra campaign saluted everyday heroes
as epitomized by sports icons Robert Jaworski and Manny Pacquiao, and featuring Mommy Dionisia.
With a catchy jingle, ‘Bilog Ang Mundo’ highlighted the Filipinos’ innate positivism and his aspiration to succeed.
LAHING GINEBRA, IKAW NA, 2012 Ginebra San Miguel paid homage to the Living Legend, former Ginebra basketball team playing coach Robert Jaworski.
BARANGAY GINEBRA ARISES
MESSAGING THAT RESONATES
The 80’s also saw the growth in popularity of the Philippine Basketball Association (PBA). Victories of Philippine teams in the international stage would propel the game to becoming the unofficial national sport and national past time.
As such, for many leading corporations of the era, it was the most powerful and farthest-reaching medium for marketing brands.
Reeling from the disbandment of the fabled Toyota and Crispa franchises, basketball fans yearned for a team whose heroic exploits they truly could identify with. The answer would come in 1985 when the first Ginebra San Miguel squad, led by legendary playing coach Robert “Sonny” Jaworski, debuted in the PBA.
In the years to follow, Ginebra San Miguel, would electrify audiences with feats of hardcourt daring and game-play that dripped excitement. Quite often beating the toughest of odds in the dying seconds of a game, Ginebra San Miguel would cement itself as one of the most popular teams in the league. Its trademark “never-say-die” spirit became a credo for the Filipino masses—making the brand a symbol of triumph over adversity.
Ginebra taglines are some of the most memorable in Philippine mass media, partly because they are catchy and colloquial, but to a larger extent, because they resonate with, and inspire audiences.
In the mid-80s, with the restoration of democracy, the prevailing mood was that of national unity. Ginebra San Miguel declared its loyalty and solidarity with the Filipino nation with a powerful slogan: “Ikaw at Ginebra…Magkasangga!”
Coinciding the celebration of Philippine Independence in 1998, “Ginebra ang Hari” tagline was born, reflecting the position of Ginebra San Miguel as “king”, or the undisputed hard liquor drink in the country.
The intense popularity of its basketball team through the 90s, meanwhile, put the emphasis on brotherhood, unity, resiliency, and overcoming adversity as one—hence, “Barangay Ginebra, Taga-rito Ka.”
While its advertising adopted a decidedly more modern look and flavor in this new century, the brand continued to espouse resiliency—promoting a positive outlook—as in “Bilog ang Mundo (2003)”, and champion the Filipino and his endeavors, as seen in “Ang Bida, Naka-Ginebra” (2010), which celebrated everyday heroes as stars or “bidas”.
With the liquor market evolving and changing with the times, Ginebra San Miguel Inc. kicked into high gear a strategy to capture new markets—in particular, female and young adult drinkers.
With the expansion of its product portfolio came a new slogan, “Lahing Ginebra” (2012), which aimed to share Ginebra San Miguel’s heritage with its new brands and more importantly, its new target markets.
Having survived through 180 years, Ginebra San Miguel today declares that it is “Ganado sa Buhay”. Espousing the same values it has been known for through the decades—resiliency, perseverance, unity—we remain committed, as we have always been, bringing to fore the Filipino’s indomitable spirit.

Celebrating 180 years 1514
GIN
EBRA
SAN
MIG
UEL
INC.
2014
Ann
ual R
epor
tA RAY O
F HO
PE
A RAY OF HOPEGSMI gives 180 scholars a chance at a better life
Kristin de Castro, Liezl de La Rosa and Danreb Bacelonia are like millions of Filipinos who struggle everyday to make ends meet. Instead of losing hope, they view their hardship as a challenge to improve their lives.
The three are proud graduates of Ginebra San Miguel Inc.’s Technopreneur program, a special education grant given to 180 scholars from eight different regions, to commemorate the company’s 180th anniversary. Under the program, scholars underwent eight months of training in bartending and entrepreneurship at the Technical Education Skills Development Authority (TESDA), a program partner.
The program, while indeed unique to Ginebra San Miguel’s 180th anniversary year, is but part of GSMI’s continuing advocacy to provide educational opportunities for underprivileged but deserving students.
What sets this program apart from other GSMI scholarship grants is that it has a livelihood component. At the end of the program, the scholars were given mobile bars complete with GSMI products so they could start their own business and practice using what they’ve learned.
Ginebra San Miguel has always been a brand that hard-working Filipinos can identify with. The company understands the value of education and how it can transform not just the life of one person, but also that of his family. GSMI is committed to provide its scholars the skills and the opportunity to a better future.
Kristin is a mother of four. Her husband, Roldan works as a delivery truck driver. Already struggling to provide for their children, Roldan was
laid off. “I felt helpless because I had no skills that could help me find work. Who would hire a mother of four who didn’t even have the chance to go to
college?” Kristin shares.
She says the GSMI scholarship was a much-needed lifeline.
Liezl is also raising a family of four on her husband’s meager paycheck as a messenger. “There are times when I had to go out and offer manicure and pedicure services. It was difficult, but I have to stay strong
for my family,” says Liezl.
She was determined to complete the program because she also wanted to serve as an example to her eldest daughter who is also a scholar.
Danreb for his part, used to take odd jobs to feed himself. At age eight, he sold vegetables in the market. He was working as a janitor in a mall when he learned about GSMI’s program. He saw it as an opportunity to support his aunts, siblings and also his mother ― with whom he was reunited with at the
time of his TESDA training.
This is such a blessing. I can help my husband with our expenses, and to have a partner such as
Ginebra is really something big!
I persevered in my studies because I want to help my mother and my siblings. I also want to show my gratitude to my aunts who raised me, as they are now getting old.
I am working hard so that when I have my own family someday, they won’t have to go through the same
hardships I’ve had to endure.
I want her to see me as a role model ― someone who works hard and doesn’t give up. I want her to see how
much I value education. For my graduation, I invited my parents to attend. I want them to see me go up the stage
and be proud of me.
Celebrating 180 years 17
CORPO
RATE GOVERN
ANCE
16
GIN
EBRA
SAN
MIG
UEL
INC.
2014
Ann
ual R
epor
t
CORPORATEGOVERNANCE
Ginebra San Miguel Inc. (the “Company”) recognizes that good governance plays a vital role in creating and sustaining shareholder value. On August 6, 2002, it institutionalized the principles of good corporate governance in the entire organization by establishing and implementing a Manual on Corporate Governance (the “Manual”). The Manual has been consistently updated in order to make the provisions thereof current and consistent with the issuances, rules and circulars of the Securities and Exchange Commission (the “SEC”). In 2014, the Company amended the Manual twice in order to align the provisions thereof with the recent Memorandum Circulars issued by the SEC.
The Board of Directors, Management, Officers, employees and shareholders believe that corporate governance is a necessary component of what constitutes sound strategic business management and ultimately in attaining the corporate goals and objectives of the Company. They undertake every effort to create awareness thereof within the organization.
Compliance with the principles of good corporate governance starts with the Company’s Board of Directors (“Board”). The Board is responsible for promoting the Company’s long-term success and sustaining competitiveness in a manner consistent with its fiduciary responsibility, which it shall exercise in the best interest of the Company, its stockholders and other stakeholders, as well as in formulating the Company’s vision, mission, corporate values, strategic objectives, policies and procedures that shall guide its activities. The Board also has oversight responsibilities for ensuring the presence of adequate and effective control mechanisms in the Company.
Committed to their obligations set forth in the Manual, all incumbent directors have attended an annual seminar on corporate governance conducted by SEC-accredited providers in compliance with SEC Memorandum Circular No. 20, Series of 2013, to keep them updated on the relevant laws, rules, regulations, circulars and issuances of regulatory bodies.
Board Composition
The Board of the Company is composed of nine (9) directors, each elected annually by the stockholders during the Regular Stockholders’ Meeting (“RSM”). They hold office for one (1) year until qualified successors are elected vice their positions in accordance with the Company’s Amended By-Laws (“By-Laws”).
Independent Directors. By way of compliance with Section 38 of the Securities Regulation Code (SRC) and Article 3(A) of SEC Memorandum Circular No. 6, Series of 2009, the stockholders, during the 2014 RSM of the Company on May 8, 2014, elected two (2) independent and non-executive directors to the Board namely, Justice Minita V. Chico-Nazario (Ret.) and Justice Angelina S. Gutierrez (Ret.). On November 6, 2014, the Board elected Justice Francisco H. Villaruz, Jr. (Ret.) vice Justice Gutierrez who resigned as Independent Director of the Company effective October 8, 2014 by reason of her appointment as member of the Judicial and Bar Council.
The Company’s Independent Directors, apart from their fees and shareholdings, have no business or relationship with the Company, which could, or could reasonably be perceived to, materially interfere with the exercise of their independent judgment in carrying out their responsibilities as directors.
Chairman and President. The Chairman of the Board and Chief Executive Officer is Mr. Eduardo M. Cojuangco, Jr., while Mr. Bernard D. Marquez is the President. Two (2) separate individuals hold these positions with their respective roles clearly defined to ensure independence, accountability and responsibility in the discharge of their respective duties.
BOARD OF DIRECTORS
BOARD OFDIRECTORS
* Director Gutierrez resigned as Independent Director effective October 8, 2014.** Director Villaruz was elected as Independent Director on November 6, 2014 vice Director Gutierrez.
EDUARDO M. COJUANGCO, JR.CHAIRMAN & CEO
RAMON S. ANGVICE CHAIRMAN
BERNARD D. MARQUEZPRESIDENT
FERDINAND K. CONSTANTINOJOSEPH N. PINEDALEO S. ALVEZGABRIEL S. CLAUDIOMINITA V. CHICO-NAZARIOANGELINA S. GUTIERREZ *
FRANCISCO H. VILLARUZ, JR. **
BOARD MEMBERS
Celebrating 180 years 19
CORPO
RATE GOVERN
ANCE
18
GIN
EBRA
SAN
MIG
UEL
INC.
2014
Ann
ual R
epor
t
Audit Committee. The Audit Committee performs oversight functions to both external and internal auditors. The role and responsibilities of the Audit Committee are clearly defined in the Company’s Manual and Audit Committee Charter.
External Auditor. The external auditor, whose main function is to facilitate an environment of good corporate governance as reflected in the Company’s financial records and reports, are selected and appointed by the stockholders upon the recommendation of the Audit Committee.
In 2014, the auditing firm of R.G. Manabat & Co. (formerly Manabat Sanagustin & Co., CPAs) served as the Company’s external auditor. Representatives of the said firm are expected to be present at the RSM and will be available to respond to appropriate questions. They also have the opportunity to make a statement, if they so desire. In instances when the external auditor suspects fraud or error during its conduct of audit, it is required to disclose and express its findings on the matter.
R.G. Manabat & Co. has been the Company’s external auditor since 2006. Accordingly, the Company complied with the rule on rotation for the signing partner every after five (5) years under Part I (3) (b) (ix) of SRC Rule 68, as amended, with respect to its re-engagement of the said audit firm.
Fee for the services rendered by the external auditor to the Company and its subsidiaries in connection with the Company’s annual financial statements and other statutory and regulatory filings for 2014 (inclusive of retainer fees and out-of-pocket expenses) amounted to about P 7 million.
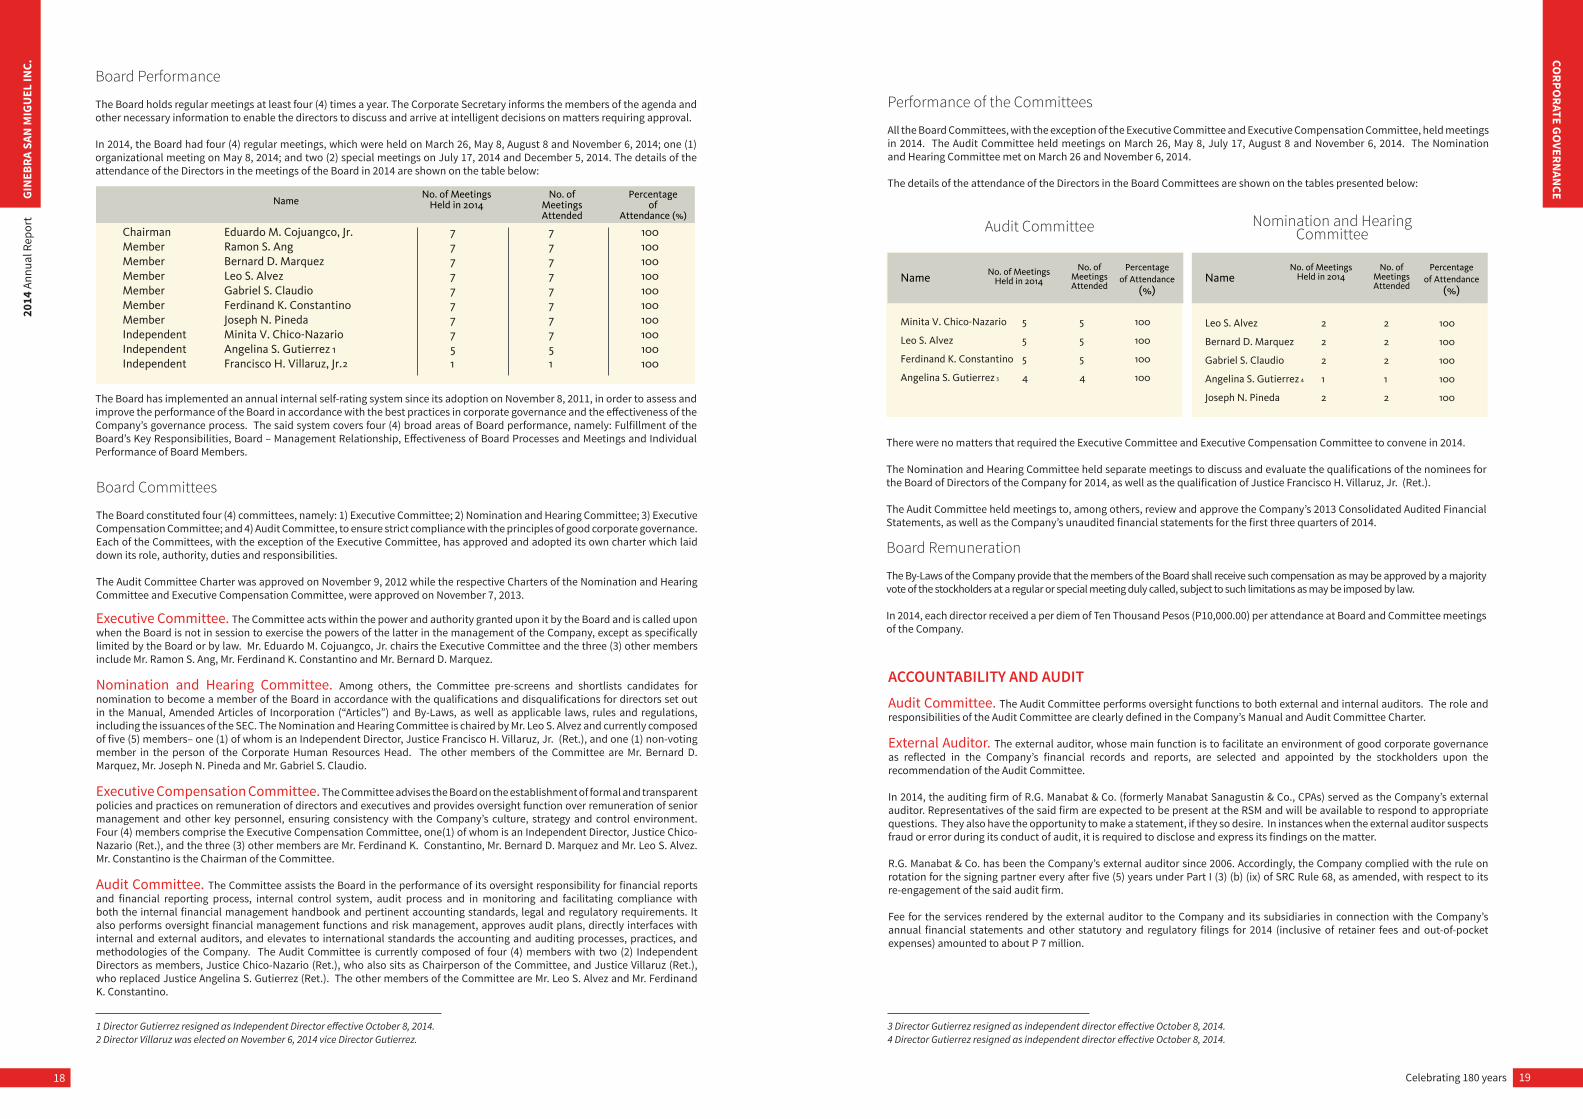
There were no matters that required the Executive Committee and Executive Compensation Committee to convene in 2014.
The Nomination and Hearing Committee held separate meetings to discuss and evaluate the qualifications of the nominees for the Board of Directors of the Company for 2014, as well as the qualification of Justice Francisco H. Villaruz, Jr. (Ret.).
The Audit Committee held meetings to, among others, review and approve the Company’s 2013 Consolidated Audited Financial Statements, as well as the Company’s unaudited financial statements for the first three quarters of 2014.
Board Remuneration
The By-Laws of the Company provide that the members of the Board shall receive such compensation as may be approved by a majority vote of the stockholders at a regular or special meeting duly called, subject to such limitations as may be imposed by law.
In 2014, each director received a per diem of Ten Thousand Pesos (P10,000.00) per attendance at Board and Committee meetings of the Company.
Performance of the Committees
All the Board Committees, with the exception of the Executive Committee and Executive Compensation Committee, held meetings in 2014. The Audit Committee held meetings on March 26, May 8, July 17, August 8 and November 6, 2014. The Nomination and Hearing Committee met on March 26 and November 6, 2014. The details of the attendance of the Directors in the Board Committees are shown on the tables presented below:
Audit Committee Nomination and Hearing Committee
Name NameNo. of Meetings Held in 2014
No. of Meetings Held in 2014
No. of Meetings Attended
No. of Meetings Attended
Percentage of Attendance
(%)
Percentage of Attendance
(%)
Minita V. Chico-Nazario
Leo S. Alvez
Ferdinand K. Constantino
Angelina S. Gutierrez
Leo S. Alvez
Bernard D. Marquez
Gabriel S. Claudio
Angelina S. Gutierrez
Joseph N. Pineda
5
5
5
4
2
2
2
1
2
100
100
100
100
100
100
100
100
100
5
5
5
4
2
2
2
1
2
3 Director Gutierrez resigned as independent director effective October 8, 2014.4 Director Gutierrez resigned as independent director effective October 8, 2014.
ACCOUNTABILITY AND AUDIT
The Board has implemented an annual internal self-rating system since its adoption on November 8, 2011, in order to assess and improve the performance of the Board in accordance with the best practices in corporate governance and the effectiveness of the Company’s governance process. The said system covers four (4) broad areas of Board performance, namely: Fulfillment of the Board’s Key Responsibilities, Board – Management Relationship, Effectiveness of Board Processes and Meetings and Individual Performance of Board Members.
Board Committees
The Board constituted four (4) committees, namely: 1) Executive Committee; 2) Nomination and Hearing Committee; 3) Executive Compensation Committee; and 4) Audit Committee, to ensure strict compliance with the principles of good corporate governance. Each of the Committees, with the exception of the Executive Committee, has approved and adopted its own charter which laid down its role, authority, duties and responsibilities.
The Audit Committee Charter was approved on November 9, 2012 while the respective Charters of the Nomination and Hearing Committee and Executive Compensation Committee, were approved on November 7, 2013.
Executive Committee. The Committee acts within the power and authority granted upon it by the Board and is called upon when the Board is not in session to exercise the powers of the latter in the management of the Company, except as specifically limited by the Board or by law. Mr. Eduardo M. Cojuangco, Jr. chairs the Executive Committee and the three (3) other members include Mr. Ramon S. Ang, Mr. Ferdinand K. Constantino and Mr. Bernard D. Marquez.
Nomination and Hearing Committee. Among others, the Committee pre-screens and shortlists candidates for nomination to become a member of the Board in accordance with the qualifications and disqualifications for directors set out in the Manual, Amended Articles of Incorporation (“Articles”) and By-Laws, as well as applicable laws, rules and regulations, including the issuances of the SEC. The Nomination and Hearing Committee is chaired by Mr. Leo S. Alvez and currently composed of five (5) members– one (1) of whom is an Independent Director, Justice Francisco H. Villaruz, Jr. (Ret.), and one (1) non-voting member in the person of the Corporate Human Resources Head. The other members of the Committee are Mr. Bernard D. Marquez, Mr. Joseph N. Pineda and Mr. Gabriel S. Claudio.
Executive Compensation Committee. The Committee advises the Board on the establishment of formal and transparent policies and practices on remuneration of directors and executives and provides oversight function over remuneration of senior management and other key personnel, ensuring consistency with the Company’s culture, strategy and control environment. Four (4) members comprise the Executive Compensation Committee, one(1) of whom is an Independent Director, Justice Chico-Nazario (Ret.), and the three (3) other members are Mr. Ferdinand K. Constantino, Mr. Bernard D. Marquez and Mr. Leo S. Alvez. Mr. Constantino is the Chairman of the Committee.
Audit Committee. The Committee assists the Board in the performance of its oversight responsibility for financial reports and financial reporting process, internal control system, audit process and in monitoring and facilitating compliance with both the internal financial management handbook and pertinent accounting standards, legal and regulatory requirements. It also performs oversight financial management functions and risk management, approves audit plans, directly interfaces with internal and external auditors, and elevates to international standards the accounting and auditing processes, practices, and methodologies of the Company. The Audit Committee is currently composed of four (4) members with two (2) Independent Directors as members, Justice Chico-Nazario (Ret.), who also sits as Chairperson of the Committee, and Justice Villaruz (Ret.), who replaced Justice Angelina S. Gutierrez (Ret.). The other members of the Committee are Mr. Leo S. Alvez and Mr. Ferdinand K. Constantino.
ChairmanMemberMemberMemberMemberMemberMemberIndependentIndependentIndependent
1 Director Gutierrez resigned as Independent Director effective October 8, 2014.2 Director Villaruz was elected on November 6, 2014 vice Director Gutierrez.
NameNo. of Meetings
Held in 2014No. of
Meetings Attended
Percentage of
Attendance (%)
7777777751
7777777751
100100100100100100100100100100
Eduardo M. Cojuangco, Jr.Ramon S. AngBernard D. MarquezLeo S. AlvezGabriel S. ClaudioFerdinand K. ConstantinoJoseph N. PinedaMinita V. Chico-NazarioAngelina S. GutierrezFrancisco H. Villaruz, Jr.
12
3 4
Board Performance
The Board holds regular meetings at least four (4) times a year. The Corporate Secretary informs the members of the agenda and other necessary information to enable the directors to discuss and arrive at intelligent decisions on matters requiring approval.
In 2014, the Board had four (4) regular meetings, which were held on March 26, May 8, August 8 and November 6, 2014; one (1) organizational meeting on May 8, 2014; and two (2) special meetings on July 17, 2014 and December 5, 2014. The details of the attendance of the Directors in the meetings of the Board in 2014 are shown on the table below:
Celebrating 180 years 21
CORPO
RATE GOVERN
ANCE
20
GIN
EBRA
SAN
MIG
UEL
INC.
2014
Ann
ual R
epor
t
CODE OF ETHICS
COMPLIANCE MONITORING
WEBSITE
The Company adheres to the SMC group-wide Code of Ethics that sets out the fundamental standards of conduct and values consistent with the principles of good governance and business practices that shall guide and define the actions and decisions of the directors, management, officers and employees of the Company. It also observes the procedures established for the communication and investigation of concerns regarding the Company’s accounting, internal accounting controls, auditing, and financial reporting matters under a SMC group-wide Whistle Blowing Policy.
The Compliance Officer is tasked to ensure adherence to corporate governance principles and best practices and has direct reporting responsibilities to the Chairman of the Board. The Company’s Compliance Officer is Atty. Virgilio S. Jacinto. He is responsible for monitoring compliance by the Company with the provisions and requirements of good corporate governance, among others.
Additional information on the Company may be viewed at www.ginebrasanmiguel.com.
EMPLOYEE RELATIONS
The Company recognizes the importance of its people as shown in its corporate value of “Respect for our People”. This value is summed up in the statement “We are committed to maintain a work environment that encourages trust, openness and mutual respect, regardless of rank or title. We promote a healthy work and life balance and provide opportunities for professional and personal growth. Our people are our strength.”
The Company ensures compliance with general labor standards, inclusive of occupational health and safety standards in the workplace.
It is also the Company’s policy to promote career advancement and development through the numerous training programs and seminars implemented by and/or facilitated by the Company’s Human Resources Department. In this connection, the Company launched an Employee Education Program (EDPRO) which supports employee efforts on continuous learning and self-improvement. Subject to certain conditions, the Company through the EDPRO may subsidize the educational expenses of qualified employees who are pursuing undergraduate, post-graduate or technical-vocational courses.
Under the Company’s Articles, stockholders do not have pre-emptive rights to subscribe to the convertible preferred shares or to subscribe to the common shares to be issued by the Company upon conversion of the preferred shares and the conversion of any notes issued to redeem such preferred shares. Subject to certain conditions and threshold on the percentage of shares allotted to be issued pursuant to a duly approved stock option, stock purchase, stock subscription or similar plans (collectively, the “Plans”), stockholders do not have pre-emptive rights to shares issued, sold or disposed of by the Company to its officers and/or employees pursuant to such Plans.
Right to Information of Stakeholders and Investor RelationsStockholders are provided, through the Investor Relations Office of the Company and its parent company, San Miguel Corporation, disclosures, announcements, and upon request, with periodic reports filed with the SEC and PSE.
The Company exercises transparency when dealing with stockholders, customers, employees and trade partners and ensures that these transactions adhere to industry standards and fair business practices in order to establish long-term and mutually beneficial relationships.
The Company addresses the information requests of the investing community and keeps in touch with minority stockholders through timely disclosures to the SEC and PSE, regular quarterly investors’ briefings, RSM, Company website, emails and telephone calls.
The Company holds combined investors’ briefings with SMC and other SMC subsidiaries, and regularly meets with investment and financial analysts.
DividendsHolders of common shares are entitled to receive dividends as the Board may, in its sole discretion, declare from time to time. The Board, however, is required, subject to certain exceptions, to declare dividends when the Company’s retained earnings equal or exceeds its paid-up capital stock. Holders of preferred shares are entitled to participate and receive dividends as and when declared by the Board to common stockholders as such rate or amount as may be fixed by the Board. Such right to receive dividends may be cumulative. No dividends were declared in 2014.
Internal Auditor. The Internal Audit Group of the Company, which is referred to as the Ginebra San Miguel Group Audit (“GSM Group Audit”), provides an independent and objective assurance that the risk management, control and governance processes of the Company and its subsidiaries are adequate and functioning. It is also responsible for identifying and evaluating significant risk exposures of the Company and contributes to the improvement of risk management and control systems by assessing adequacy and effectiveness of controls covering the organization’s governance, operations, and information systems. The GSM Group Audit has its own Internal Audit Charter which sets forth the policy, purpose, scope of work, responsibility and authority, independence and standards of audit practice of the said audit group.
Regular audits of the businesses of the Company, its subsidiaries, and support units are conducted according to an annual audit program prepared by the GSM Group Audit and approved by the Audit Committee. Special audits are also undertaken when and as necessary.
The Company adheres to full disclosure and transparency to allow the investment community to appreciate the Company’s true financial condition and the quality of its corporate governance.
Ownership StructureThe top twenty (20) common and preferred stockholders of the Company, including the shareholdings of certain record and beneficial owners who own more than five percent (5%) of its capital stock, its directors and key officers, are disclosed annually in its Information Statement (“IS”) which is distributed to the stockholders prior to the RSM.
Financial ReportingThe Company apprises the investing public on its operating performance and financial information through the timely submission of its disclosures and reportorial requirements with the SEC and the Philippine Stock Exchange, Inc. (the “PSE”). As may be necessary, it also discloses with the SEC and PSE such other major and market-sensitive information that affects the share price performance.
The Company’s financial statements conform to Philippine Accounting Standards and Philippine Financial Reporting Standards, which are all in compliance with International Accounting Standards. Consolidated audited financial statements for the latest completed financial year are submitted to the SEC and form part of the IS distributed to the stockholders prior to the RSM.
On the other hand, quarterly financial results for the first three quarters of the relevant year are released and are duly disclosed to the SEC and PSE within the prescribed period. The results are also presented to financial and investment analysts through a quarterly investors’ briefing.
Securities DealingThe Company has adopted a policy that mandates the directors, officers and employees of the Company and its subsidiaries (“GSMI Group”) to exercise extreme caution when dealing in the Company’s securities and ensure that such dealings comply with this policy, as well as the requirements of the Securities Regulation Code. It sets out the conditions and rules under which the directors, officers and employees of the GSMI Group shall deal in securities of the Company. Under the policy, directors, officers and employees who have knowledge or are in possession of material non-public information are prohibited from dealing in the Company’s securities prior to disclosure of such information to the public. The policy likewise prescribes the periods before and after public disclosure of structured and non-structured reports during which trading in the Company’s securities by persons who, by virtue of their functions and responsibilities, are considered to have knowledge or possession of material non-public information, is not allowed.
DISCLOSURE AND TRANSPARENCY
STOCKHOLDERS’ RIGHTS AND STAKEHOLDER RELATIONS
Stockholders’ MeetingStockholders are informed of the RSM at least fifteen (15) business days before the scheduled date of the meeting. The notice to stockholders also sets the date, time and place of the validation of proxies. The notice for the 2014 RSM was approximately sent to the stockholders on April 11, 2014.
Voting Rights and Voting ProceduresEach share, whether common or preferred, in the name of the stockholder, entitles such stockholder to one (1) vote, which may be exercised in person or by proxy at stockholders’ meetings, including the RSM. Stockholders have the right to elect, remove, and replace directors as well as vote on certain corporate acts in accordance with the Corporation Code. Voting procedures on matters presented for approval to the stockholders in the RSM are set out in the IS.
Pre-emptive RightsStockholders have the right to subscribe to all issues of shares of the Company in proportion to their shareholdings, unless the same is denied in its Articles or an amendment thereto.
Celebrating 180 years 2322
GIN
EBRA
SAN
MIG
UEL
INC.
2014
Ann
ual R
epor
t
REPORT OF THE AUDIT COMMITTEEFor the year ended December 31, 2014
The role of the Audit Committee (the “Committee”) as provided in the Company’s Amended Manual on Corporate Governance and Audit Committee Charter is to assist the Board of Directors in fulfilling its oversight responsibility on the Company’s corporate governance processes relating to financial statements and financial reporting process, risk management, internal control system, audit processes, and compliance with accounting standards, legal and regulatory requirements. In fulfillment of these responsibilities, the Committee performed the following in 2014:
Recommended to the Board of Directors and endorsed for approval by the stockholders, the appointment of R.G. Manabat & Co., as the Company’s independent external auditor for 2014;
Reviewed and approved the terms of engagement of the external auditor, including the audit, audit-related and any non-audit services provided by the external auditor to the Company and the fees for such services, and ensured that the same did not impair the external auditor’s independence and objectivity;
Reviewed and approved the scope of the audit and audit programs of the external auditor as well as the internal audit group of the Company, and have discussed the results of their respective audit processes and their findings and assessment of the Company’s internal controls and financial reporting systems;
Reviewed, discussed and recommended for approval of the Board of Directors the Company’s quarterly and annual consolidated financial statements, and the reports required to be submitted to regulatory agencies in connection with such consolidated financial statements, to ensure that the information contained in such statements and reports presents a true and balanced assessment of the Company’s position and condition and that such statements and reports comply with the regulatory requirements of the Securities and Exchange Commission (SEC) and the Philippine Stock Exchange, Inc. (PSE);
Reviewed, discussed and recommended for approval of the Board of Directors the filing of the Company’s Corporate Governance Guidelines for Listed Companies Disclosure Template with the PSE, in compliance with the requirement of the said regulatory agency;
Reviewed, discussed and recommended for approval of the Board of Directors the amendments to the Company’s Amended Manual on Corporate Governance in order to align the provisions thereof with the prevailing SEC Memorandum Circulars affecting the duties of the Compliance Officer, Corporate Secretary and Directors, requirement relating to Director’s attendance in Board Meetings and to comply with SEC Memorandum Circular No. 9, Series of 2014, which pertains to the Amendments to the Revised Code of Corporate Governance; and
Reviewed the adequacy, effectiveness and sufficiency of the Company’s financial and internal controls, risk management systems, and control and governance processes, and ensured that, where applicable, necessary measures are taken to address any concern or issue arising therefrom.
•
•
•
•
•
•
•
The Audit Committee is satisfied with the scope and appropriateness of the Committee’s mandate and that the Committee substantially met its mandate in 2014.
MINITA V. CHICO-NAZARIOChairperson
Independent Director
LEO S. ALVEZ Member
*ANGELINA S. GUTIERREZ Member – Independent Director
FERDINAND K. CONSTANTINO Member
* Angelina S. Gutierrez, who was a member of the Audit Committee in 2014, resigned as Independent Director of the Company effective October 8, 2014, in the light of her appointment as member of the Judicial and Bar Council.
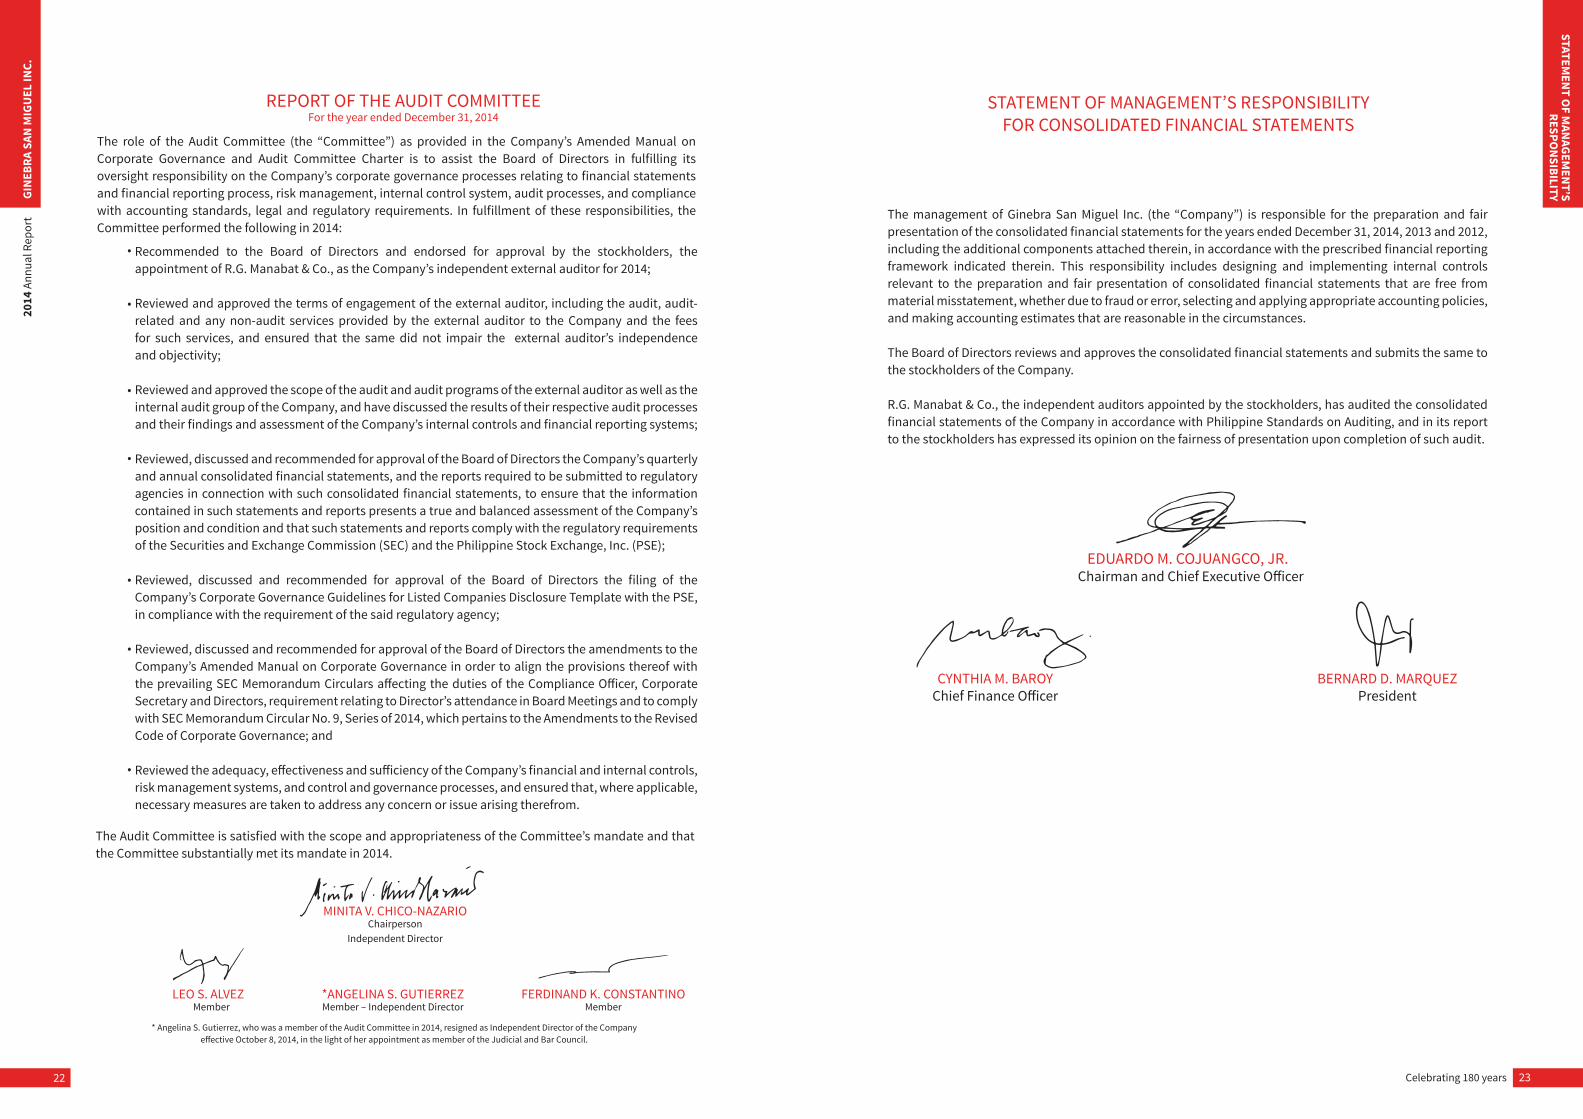
STATEMENT OF MANAGEMENT’S RESPONSIBILITYFOR CONSOLIDATED FINANCIAL STATEMENTS
The management of Ginebra San Miguel Inc. (the “Company”) is responsible for the preparation and fair presentation of the consolidated financial statements for the years ended December 31, 2014, 2013 and 2012, including the additional components attached therein, in accordance with the prescribed financial reporting framework indicated therein. This responsibility includes designing and implementing internal controls relevant to the preparation and fair presentation of consolidated financial statements that are free from material misstatement, whether due to fraud or error, selecting and applying appropriate accounting policies, and making accounting estimates that are reasonable in the circumstances.
The Board of Directors reviews and approves the consolidated financial statements and submits the same to the stockholders of the Company.
R.G. Manabat & Co., the independent auditors appointed by the stockholders, has audited the consolidated financial statements of the Company in accordance with Philippine Standards on Auditing, and in its report to the stockholders has expressed its opinion on the fairness of presentation upon completion of such audit.
EDUARDO M. COJUANGCO, JR. Chairman and Chief Executive Officer
CYNTHIA M. BAROYChief Finance Officer
BERNARD D. MARQUEZ President
STATEMEN
T OF M
ANAGEM
ENT’S
RESPON
SIBILITY
Celebrating 180 years 25
FINAN
CIAL STATEMEN
TS
24
GIN
EBRA
SAN
MIG
UEL
INC.
2014
Ann
ual R
epor
t
REPORT O
F INDEPEN
DENT
AUDITO
RS
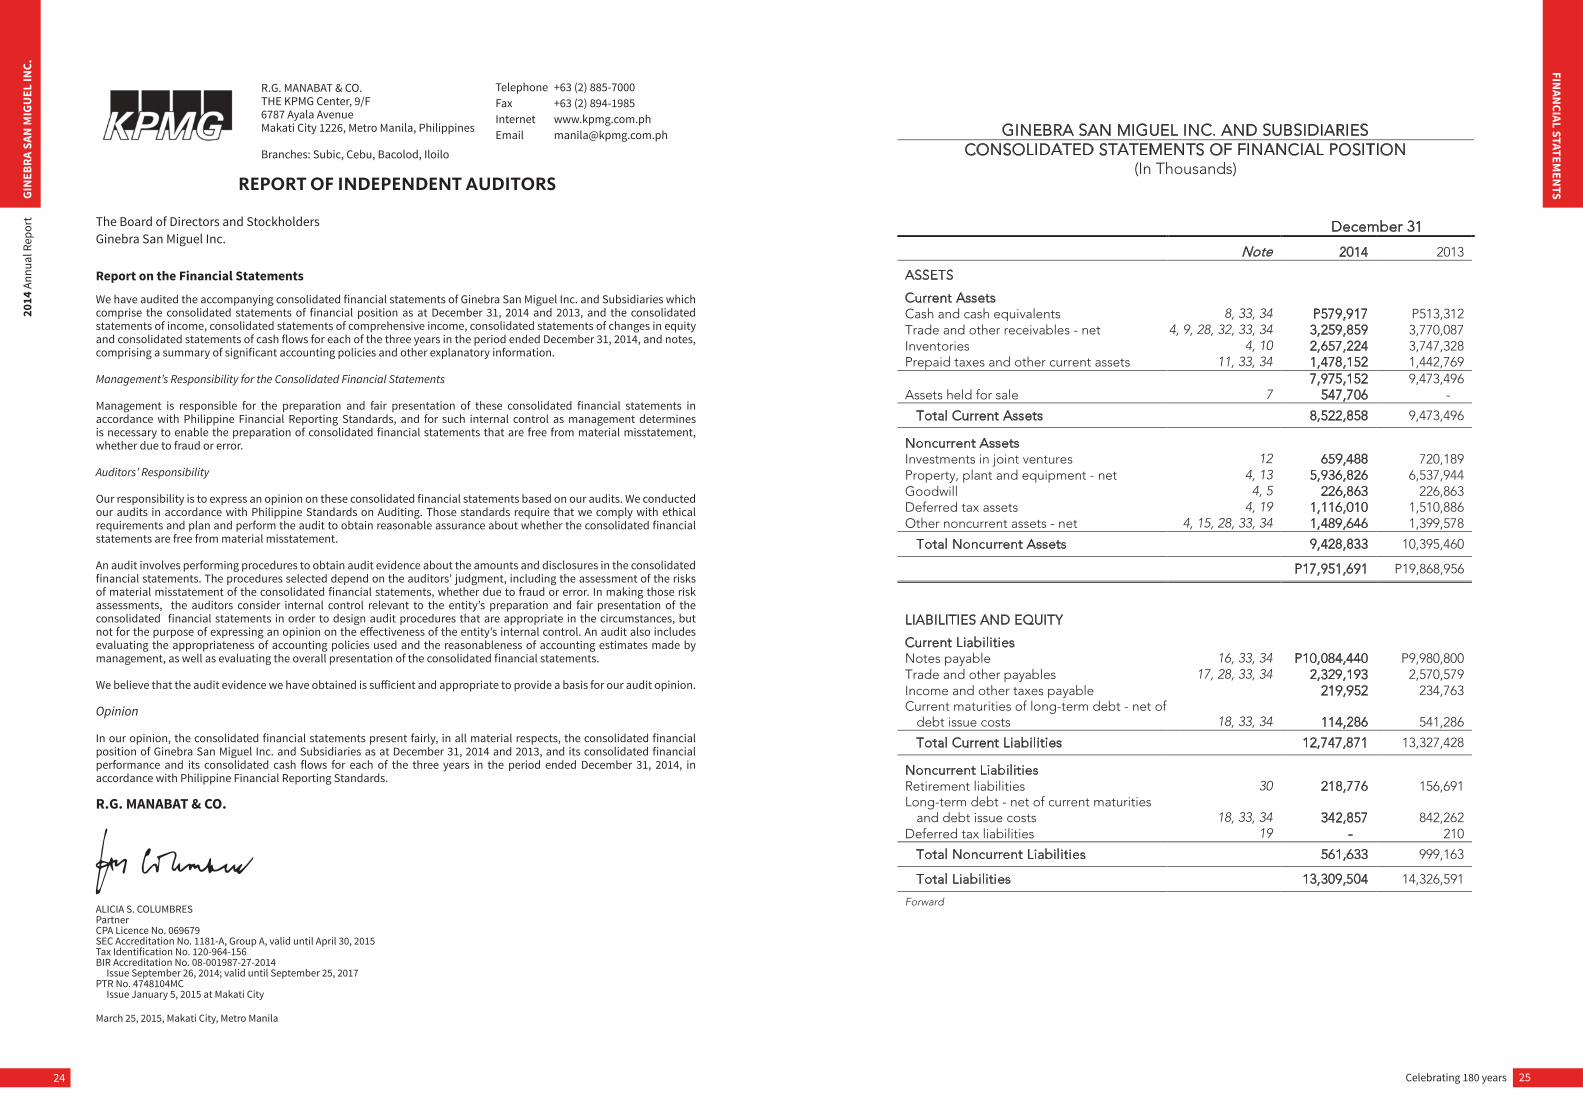
REPORT OF INDEPENDENT AUDITORS
The Board of Directors and StockholdersGinebra San Miguel Inc.
We have audited the accompanying consolidated financial statements of Ginebra San Miguel Inc. and Subsidiaries which comprise the consolidated statements of financial position as at December 31, 2014 and 2013, and the consolidated statements of income, consolidated statements of comprehensive income, consolidated statements of changes in equity and consolidated statements of cash flows for each of the three years in the period ended December 31, 2014, and notes, comprising a summary of significant accounting policies and other explanatory information.
Management’s Responsibility for the Consolidated Financial Statements
Management is responsible for the preparation and fair presentation of these consolidated financial statements in accordance with Philippine Financial Reporting Standards, and for such internal control as management determines is necessary to enable the preparation of consolidated financial statements that are free from material misstatement, whether due to fraud or error.
Auditors’ Responsibility
Our responsibility is to express an opinion on these consolidated financial statements based on our audits. We conducted our audits in accordance with Philippine Standards on Auditing. Those standards require that we comply with ethical requirements and plan and perform the audit to obtain reasonable assurance about whether the consolidated financial statements are free from material misstatement.
An audit involves performing procedures to obtain audit evidence about the amounts and disclosures in the consolidated financial statements. The procedures selected depend on the auditors’ judgment, including the assessment of the risks of material misstatement of the consolidated financial statements, whether due to fraud or error. In making those risk assessments, the auditors consider internal control relevant to the entity’s preparation and fair presentation of the consolidated financial statements in order to design audit procedures that are appropriate in the circumstances, but not for the purpose of expressing an opinion on the effectiveness of the entity’s internal control. An audit also includes evaluating the appropriateness of accounting policies used and the reasonableness of accounting estimates made by management, as well as evaluating the overall presentation of the consolidated financial statements.
We believe that the audit evidence we have obtained is sufficient and appropriate to provide a basis for our audit opinion.
Opinion
In our opinion, the consolidated financial statements present fairly, in all material respects, the consolidated financial position of Ginebra San Miguel Inc. and Subsidiaries as at December 31, 2014 and 2013, and its consolidated financial performance and its consolidated cash flows for each of the three years in the period ended December 31, 2014, in accordance with Philippine Financial Reporting Standards.
R.G. MANABAT & CO.
R.G. MANABAT & CO.THE KPMG Center, 9/F6787 Ayala AvenueMakati City 1226, Metro Manila, Philippines
Branches: Subic, Cebu, Bacolod, Iloilo
Telephone FaxInternetEmail
+63 (2) 885-7000+63 (2) [email protected]
Report on the Financial Statements
ALICIA S. COLUMBRESPartnerCPA Licence No. 069679SEC Accreditation No. 1181-A, Group A, valid until April 30, 2015Tax Identification No. 120-964-156BIR Accreditation No. 08-001987-27-2014 Issue September 26, 2014; valid until September 25, 2017PTR No. 4748104MC Issue January 5, 2015 at Makati City
March 25, 2015, Makati City, Metro Manila
GINEBRA SAN MIGUEL INC. AND SUBSIDIARIES CONSOLIDATED STATEMENTS OF FINANCIAL POSITION
(In Thousands)
December 31
Note 2014 2013
ASSETS
Current Assets Cash and cash equivalents 8, 33, 34 P579,917 P513,312 Trade and other receivables - net 4, 9, 28, 32, 33, 34 3,259,859 3,770,087 Inventories 4, 10 2,657,224 3,747,328 Prepaid taxes and other current assets 11, 33, 34 1,478,152 1,442,769 7,975,152 9,473,496 Assets held for sale 7 547,706 -
Total Current Assets 8,522,858 9,473,496
Noncurrent Assets Investments in joint ventures 12 659,488 720,189 Property, plant and equipment - net 4, 13 5,936,826 6,537,944 Goodwill 4, 5 226,863 226,863 Deferred tax assets 4, 19 1,116,010 1,510,886 Other noncurrent assets - net 4, 15, 28, 33, 34 1,489,646 1,399,578
Total Noncurrent Assets 9,428,833 10,395,460
P17,951,691 P19,868,956
LIABILITIES AND EQUITY
Current Liabilities Notes payable 16, 33, 34 P10,084,440 P9,980,800 Trade and other payables 17, 28, 33, 34 2,329,193 2,570,579 Income and other taxes payable 219,952 234,763 Current maturities of long-term debt - net of
debt issue costs 18, 33, 34 114,286 541,286
Total Current Liabilities 12,747,871 13,327,428
Noncurrent Liabilities Retirement liabilities 30 218,776 156,691 Long-term debt - net of current maturities
and debt issue costs 18, 33, 34 342,857 842,262 Deferred tax liabilities 19 - 210
Total Noncurrent Liabilities 561,633 999,163
Total Liabilities 13,309,504 14,326,591
Forward
Celebrating 180 years 27
FINAN
CIAL STATEMEN
TS
26
GIN
EBRA
SAN
MIG
UEL
INC.
2014
Ann
ual R
epor
t
December 31
Note 2014 2013
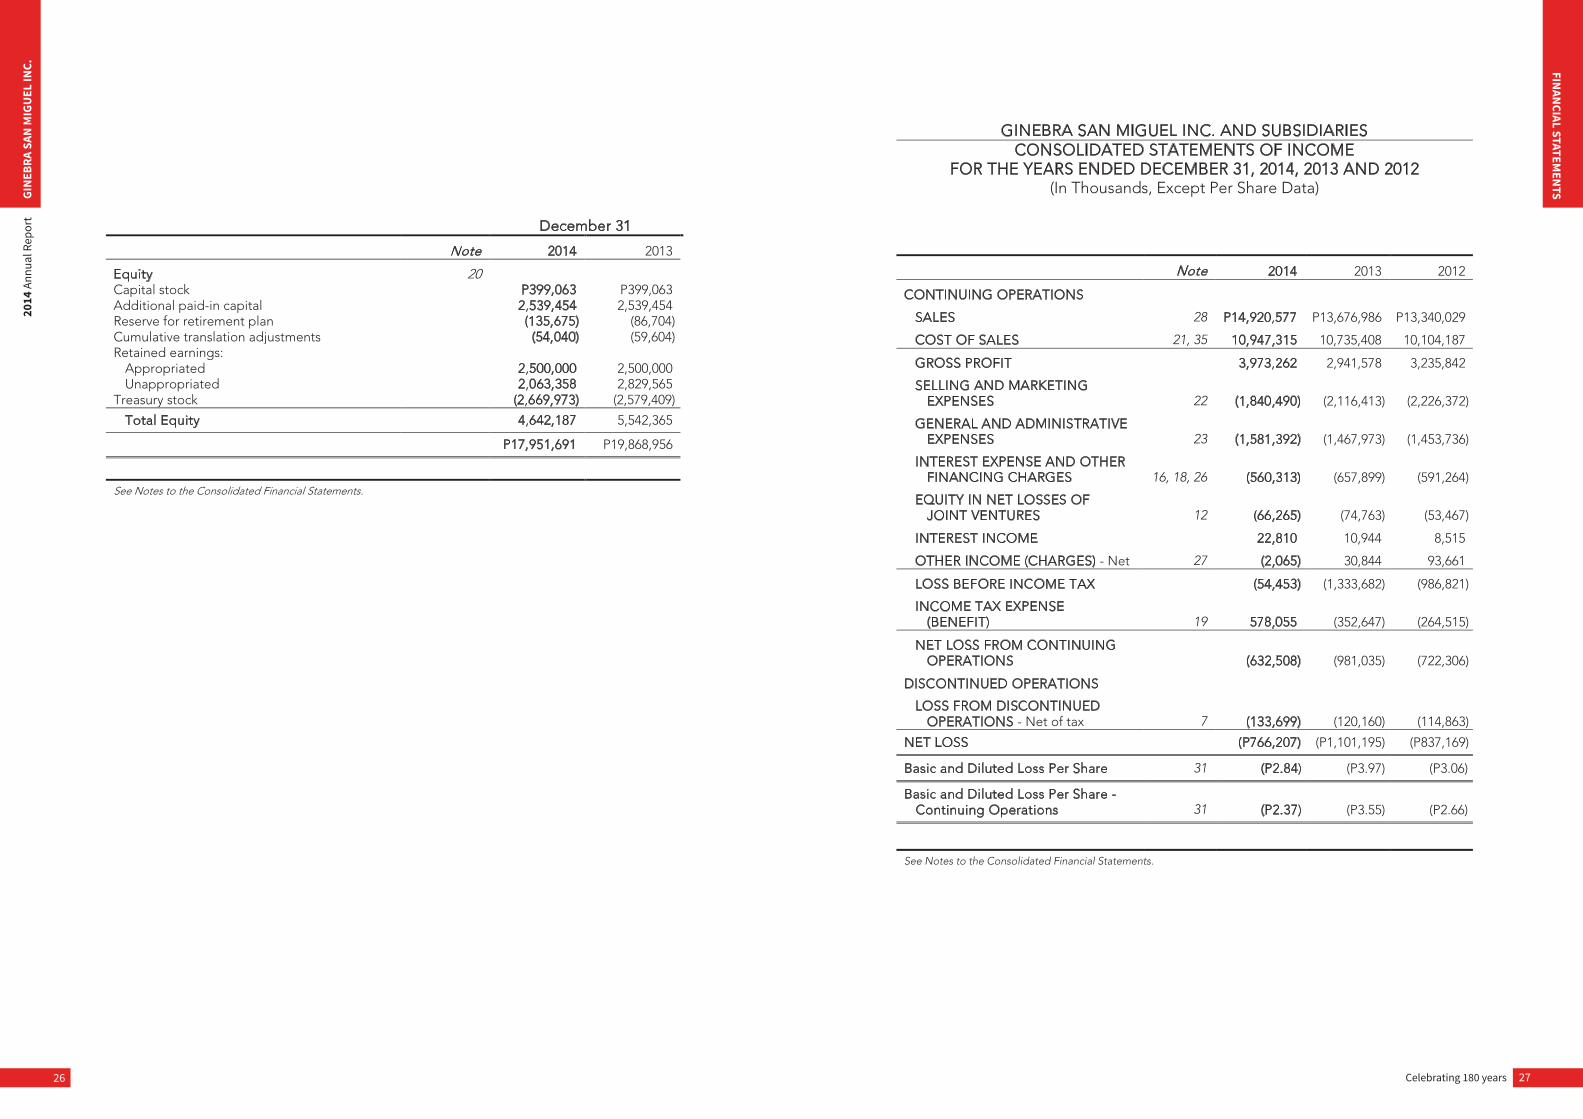
Equity 20 Capital stock P399,063 P399,063 Additional paid-in capital 2,539,454 2,539,454 Reserve for retirement plan (135,675) (86,704) Cumulative translation adjustments (54,040) (59,604) Retained earnings:
Appropriated 2,500,000 2,500,000 Unappropriated 2,063,358 2,829,565
Treasury stock (2,669,973) (2,579,409)
Total Equity 4,642,187 5,542,365
P17,951,691 P19,868,956
See Notes to the Consolidated Financial Statements.
GINEBRA SAN MIGUEL INC. AND SUBSIDIARIES CONSOLIDATED STATEMENTS OF INCOME
FOR THE YEARS ENDED DECEMBER 31, 2014, 2013 AND 2012 (In Thousands, Except Per Share Data)
Note 2014 2013 2012
CONTINUING OPERATIONS
SALES 28 P14,920,577 P13,676,986 P13,340,029
COST OF SALES 21, 35 10,947,315 10,735,408 10,104,187
GROSS PROFIT 3,973,262 2,941,578 3,235,842
SELLING AND MARKETING EXPENSES 22 (1,840,490) (2,116,413) (2,226,372)
GENERAL AND ADMINISTRATIVE EXPENSES 23 (1,581,392) (1,467,973) (1,453,736)
INTEREST EXPENSE AND OTHER FINANCING CHARGES 16, 18, 26 (560,313) (657,899) (591,264)
EQUITY IN NET LOSSES OF JOINT VENTURES 12 (66,265) (74,763) (53,467)
INTEREST INCOME 22,810 10,944 8,515
OTHER INCOME (CHARGES) - Net 27 (2,065) 30,844 93,661
LOSS BEFORE INCOME TAX (54,453) (1,333,682) (986,821)
INCOME TAX EXPENSE (BENEFIT) 19 578,055 (352,647) (264,515)
NET LOSS FROM CONTINUING OPERATIONS (632,508) (981,035) (722,306)
DISCONTINUED OPERATIONS
LOSS FROM DISCONTINUED OPERATIONS - Net of tax 7 (133,699) (120,160) (114,863)
NET LOSS (P766,207) (P1,101,195) (P837,169)
Basic and Diluted Loss Per Share 31 (P2.84) (P3.97) (P3.06)
Basic and Diluted Loss Per Share - Continuing Operations 31 (P2.37) (P3.55) (P2.66)
See Notes to the Consolidated Financial Statements.
Celebrating 180 years 29
FINAN
CIAL STATEMEN
TS
28
GIN
EBRA
SAN
MIG
UEL
INC.
2014
Ann
ual R
epor
t
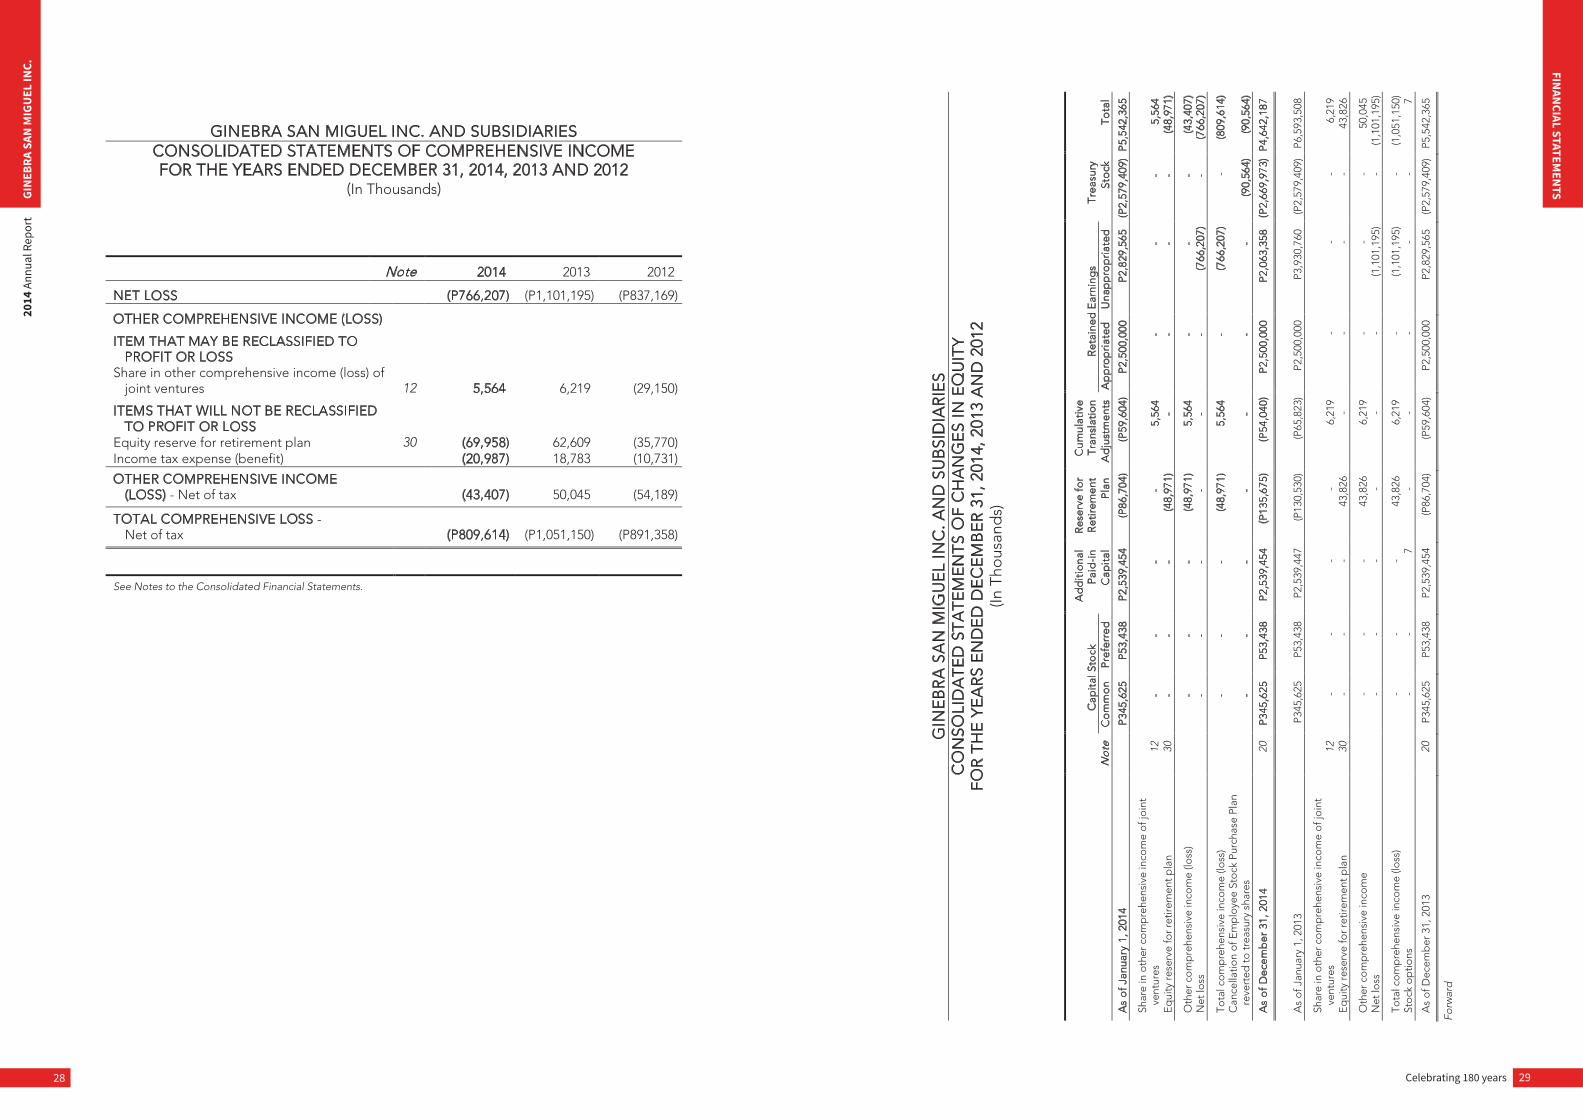
GINEBRA SAN MIGUEL INC. AND SUBSIDIARIES CONSOLIDATED STATEMENTS OF COMPREHENSIVE INCOME FOR THE YEARS ENDED DECEMBER 31, 2014, 2013 AND 2012
(In Thousands)
Note 2014 2013 2012
NET LOSS (P766,207) (P1,101,195) (P837,169)
OTHER COMPREHENSIVE INCOME (LOSS)
ITEM THAT MAY BE RECLASSIFIED TO PROFIT OR LOSS
Share in other comprehensive income (loss) of joint ventures 12 5,564 6,219 (29,150)
ITEMS THAT WILL NOT BE RECLASSIFIED TO PROFIT OR LOSS
Equity reserve for retirement plan 30 (69,958) 62,609 (35,770) Income tax expense (benefit) (20,987) 18,783 (10,731)
OTHER COMPREHENSIVE INCOME (LOSS) - Net of tax (43,407) 50,045 (54,189)
TOTAL COMPREHENSIVE LOSS - Net of tax (P809,614) (P1,051,150) (P891,358)
See Notes to the Consolidated Financial Statements.
GIN
EB
RA
SA
N M
IGU
EL
INC
. AN
D S
UB
SID
IAR
IES
CO
NSO
LID
AT
ED
ST
AT
EM
EN
TS
OF
CH
AN
GE
S IN
EQ
UIT
Y FO
R T
HE
YE
AR
S E
ND
ED
DE
CE
MB
ER
31,
201
4, 2
013
AN
D 2
012
(In T
hous
and
s)
Ad
dit
iona
l R
eser
ve f
or
Cum
ulat
ive
C
apit
al S
tock
P
aid
-in
Ret
irem
ent
Tra
nsla
tio
n R
etai
ned
Ear
ning
s T
reas
ury
No
te
Co
mm
on
Pre
ferr
ed
Cap
ital
P
lan
Ad
just
men
ts
Ap
pro
pri
ated
U
nap
pro
pri
ated
St
ock
T
ota
l
As
of
Janu
ary
1, 2
014
P
345,
625
P53
,438
P
2,53
9,45
4 (P
86,7
04)
(P59
,604
) P
2,50
0,00
0 P
2,82
9,56
5 (P
2,57
9,40
9)
P5,
542,
365
Shar
e in
oth
er c
om
pre
hens
ive
inco
me
of j
oin
t ve
ntur
es
12
-
-
-
-
5,56
4 -
-
-
5,56
4 E
qui
ty re
serv
e fo
r ret
irem
ent p
lan
30
-
-
-
(48,
971)
-
-
-
-
(4
8,97
1)
Oth
er c
om
pre
hens
ive
inco
me
(loss
)
-
-
-
(4
8,97
1)
5,56
4 -
-
-
(43,
407)
N
et lo
ss
-
-
-
-
-
-
(7
66,2
07)
-
(7
66,2
07)
Tota
l co
mp
rehe
nsiv
e in
com
e (lo
ss)
-
-
-
(48,
971)
5,
564
-
(7
66,2
07)
-
(809
,614
) C
ance
llatio
n o
f Em
plo
yee
Sto
ck P
urch
ase
Plan
re
vert
ed to
trea
sury
sha
res
-
-
-
-
-
-
-
(90,
564)
(9
0,56
4)
As
of
Dec
emb
er 3
1, 2
014
20
P34
5,62
5 P
53,4
38
P2,
539,
454
(P13
5,67
5)
(P54
,040
) P
2,50
0,00
0 P
2,06
3,35
8 (P
2,66
9,97
3)
P4,
642,
187
As
of J
anua
ry 1
, 201
3
P345
,625
P5
3,43
8 P2
,539
,447
(P
130,
530)
(P
65,8
23)
P2,5
00,0
00
P3,9
30,7
60
(P2,
579,
409)
P6
,593
,508
Shar
e in
oth
er c
om
pre
hens
ive
inco
me
of j
oin
t ve
ntur
es
12
-
-
-
-
6,21
9 -
-
-
6,
219
Eq
uity
rese
rve
for r
etire
men
t pla
n
30
-
-
-
43,8
26
-
-
-
-
43,8
26
Oth
er c
om
pre
hens
ive
inco
me
-
-
-
43
,826
6,
219
-
-
-
50,0
45
Net
loss
-
-
-
-
-
-
(1,1
01,1
95)
-
(1,1
01,1
95)
Tota
l co
mp
rehe
nsiv
e in
com
e (lo
ss)
-
-
-
43
,826
6,
219
-
(1,1
01,1
95)
-
(1,0
51,1
50)
Sto
ck o
ptio
ns
-
-
7
-
-
-
-
-
7
As
of D
ecem
ber
31,
201
3 20
P3
45,6
25
P53,
438
P2,5
39,4
54
(P86
,704
) (P
59,6
04)
P2,5
00,0
00
P2,8
29,5
65
(P2,
579,
409)
P5
,542
,365
Forw
ard
Celebrating 180 years 31
FINAN
CIAL STATEMEN
TS
30
GIN
EBRA
SAN
MIG
UEL
INC.
2014
Ann
ual R
epor
t
Ad
dit
iona
l R
eser
ve f
or
Cum
ulat
ive
C
apit
al S
tock
P
aid
-in
Ret
irem
ent
Tra
nsla
tio
n R
etai
ned
Ear
ning
s T
reas
ury
No
te
Co
mm
on
Pre
ferr
ed
Cap
ital
P
lan
Ad
just
men
ts
Ap
pro
pri
ated
U
nap
pro
pri
ated
St
ock
T
ota
l
As
of J
anua
ry 1
, 201
2
P345
,625
P5
3,43
8 P2
,526
,625
(P
105,
491)
(P
36,6
73)
P2,5
00,0
00
P4,7
67,9
29
(P2,
579,
409)
P7
,472
,044
Sh
are
in o
ther
co
mp
rehe
nsiv
e lo
ss o
f jo
int v
entu
res
12
-
-
-
-
(29,
150)
-
-
-
(2
9,15
0)
Eq
uity
rese
rve
for r
etire
men
t pla
n
-
-
-
(2
5,03
9)
-
-
-
-
(25,
039)
Oth
er c
om
pre
hens
ive
loss
-
-
-
(25,
039)
(2
9,15
0)
-
-
-
(54,
189)
N
et lo
ss
-
-
-
-
-
-
(8
37,1
69)
-
(837
,169
)
Tota
l co
mp
rehe
nsiv
e lo
ss
-
-
-
(2
5,03
9)
(29,
150)
-
(8
37,1
69)
-
(891
,358
) St
ock
op
tions
-
-
12,8
22
-
-
-
-
-
12,8
22
As
of D
ecem
ber
31,
201
2
P345
,625
P5
3,43
8 P2
,539
,447
(P
130,
530)
(P
65,8
23)
P2,5
00,0
00
P3,9
30,7
60
(P2,
579,
409)
P6
,593
,508
See
Not
es to
the
Con
solid
ated
Fin
anci
al S
tate
men
ts.
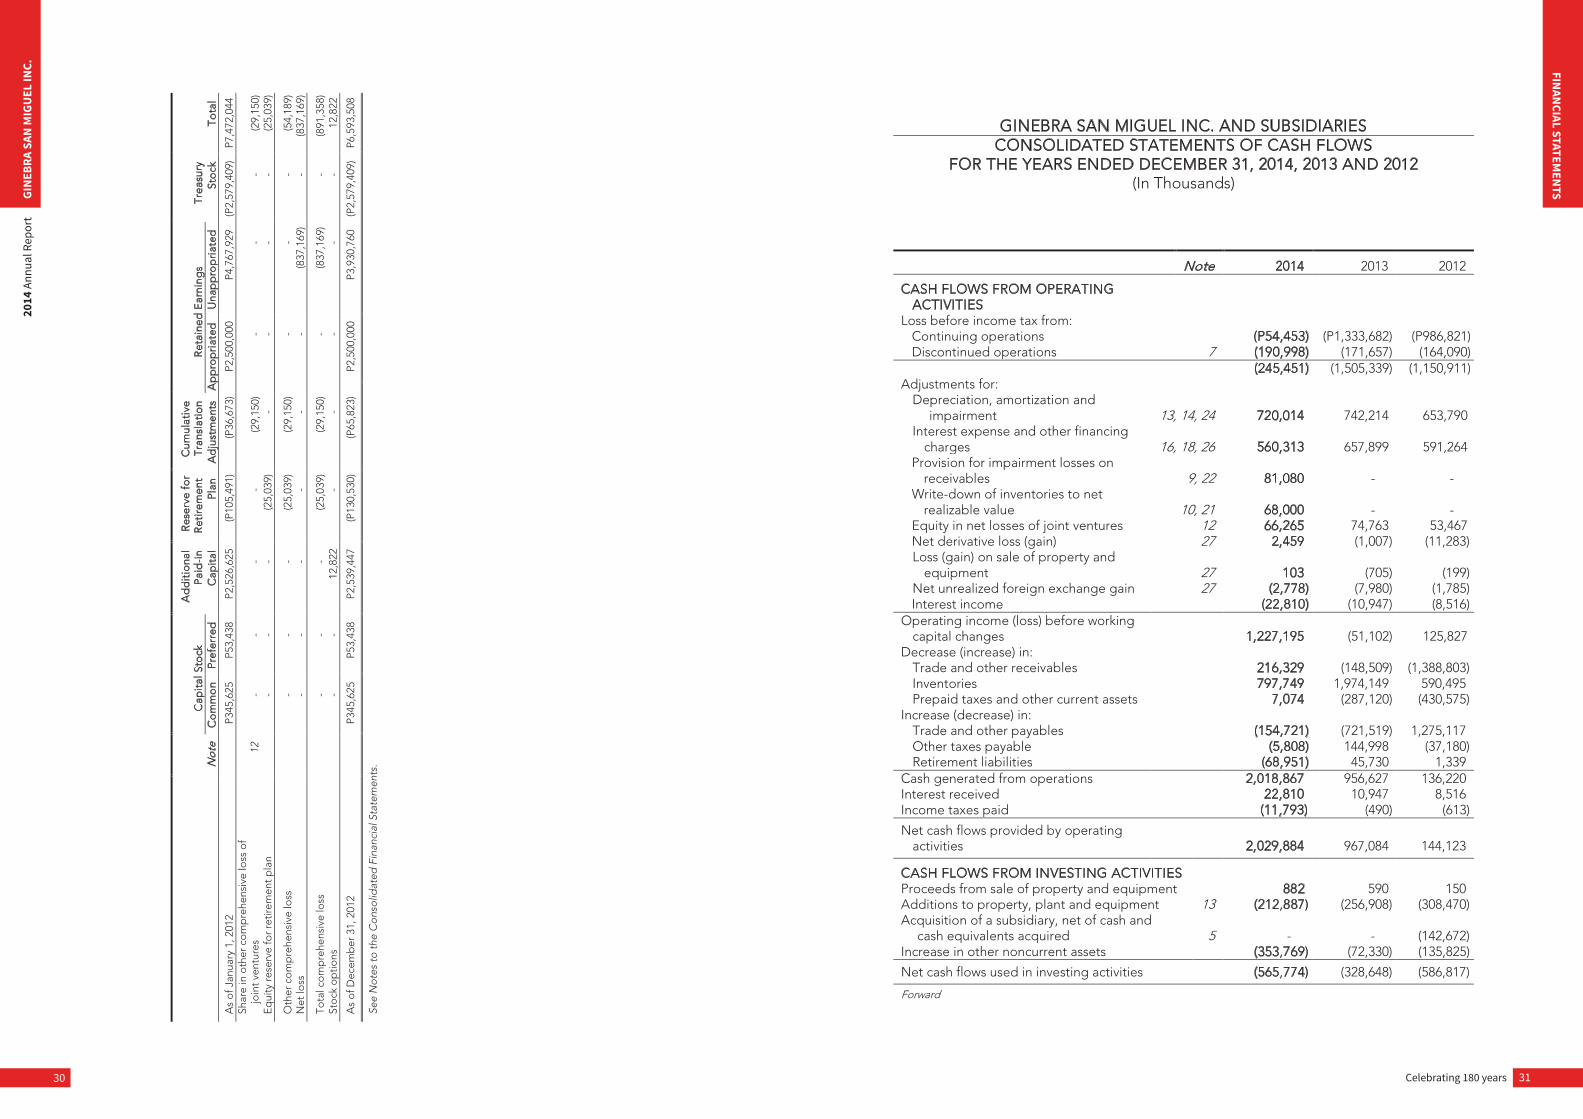
GINEBRA SAN MIGUEL INC. AND SUBSIDIARIES CONSOLIDATED STATEMENTS OF CASH FLOWS
FOR THE YEARS ENDED DECEMBER 31, 2014, 2013 AND 2012 (In Thousands)
Note 2014 2013 2012
CASH FLOWS FROM OPERATING ACTIVITIES
Loss before income tax from: Continuing operations (P54,453) (P1,333,682) (P986,821) Discontinued operations 7 (190,998) (171,657) (164,090)
(245,451) (1,505,339) (1,150,911) Adjustments for:
Depreciation, amortization and impairment 13, 14, 24 720,014 742,214 653,790
Interest expense and other financing charges 16, 18, 26 560,313 657,899 591,264
Provision for impairment losses on receivables 9, 22 81,080 - -
Write-down of inventories to net realizable value 10, 21 68,000 - -
Equity in net losses of joint ventures 12 66,265 74,763 53,467 Net derivative loss (gain) 27 2,459 (1,007) (11,283) Loss (gain) on sale of property and
equipment 27 103 (705) (199) Net unrealized foreign exchange gain 27 (2,778) (7,980) (1,785) Interest income (22,810) (10,947) (8,516)
Operating income (loss) before working capital changes 1,227,195 (51,102) 125,827
Decrease (increase) in: Trade and other receivables 216,329 (148,509) (1,388,803) Inventories 797,749 1,974,149 590,495 Prepaid taxes and other current assets 7,074 (287,120) (430,575)
Increase (decrease) in: Trade and other payables (154,721) (721,519) 1,275,117 Other taxes payable (5,808) 144,998 (37,180) Retirement liabilities (68,951) 45,730 1,339
Cash generated from operations 2,018,867 956,627 136,220 Interest received 22,810 10,947 8,516 Income taxes paid (11,793) (490) (613)
Net cash flows provided by operating activities 2,029,884 967,084 144,123
CASH FLOWS FROM INVESTING ACTIVITIES Proceeds from sale of property and equipment 882 590 150 Additions to property, plant and equipment 13 (212,887) (256,908) (308,470) Acquisition of a subsidiary, net of cash and
cash equivalents acquired 5 - - (142,672) Increase in other noncurrent assets (353,769) (72,330) (135,825)
Net cash flows used in investing activities (565,774) (328,648) (586,817)
Forward
Celebrating 180 years 33
FINAN
CIAL STATEMEN
TS
32
GIN
EBRA
SAN
MIG
UEL
INC.
2014
Ann
ual R
epor
t
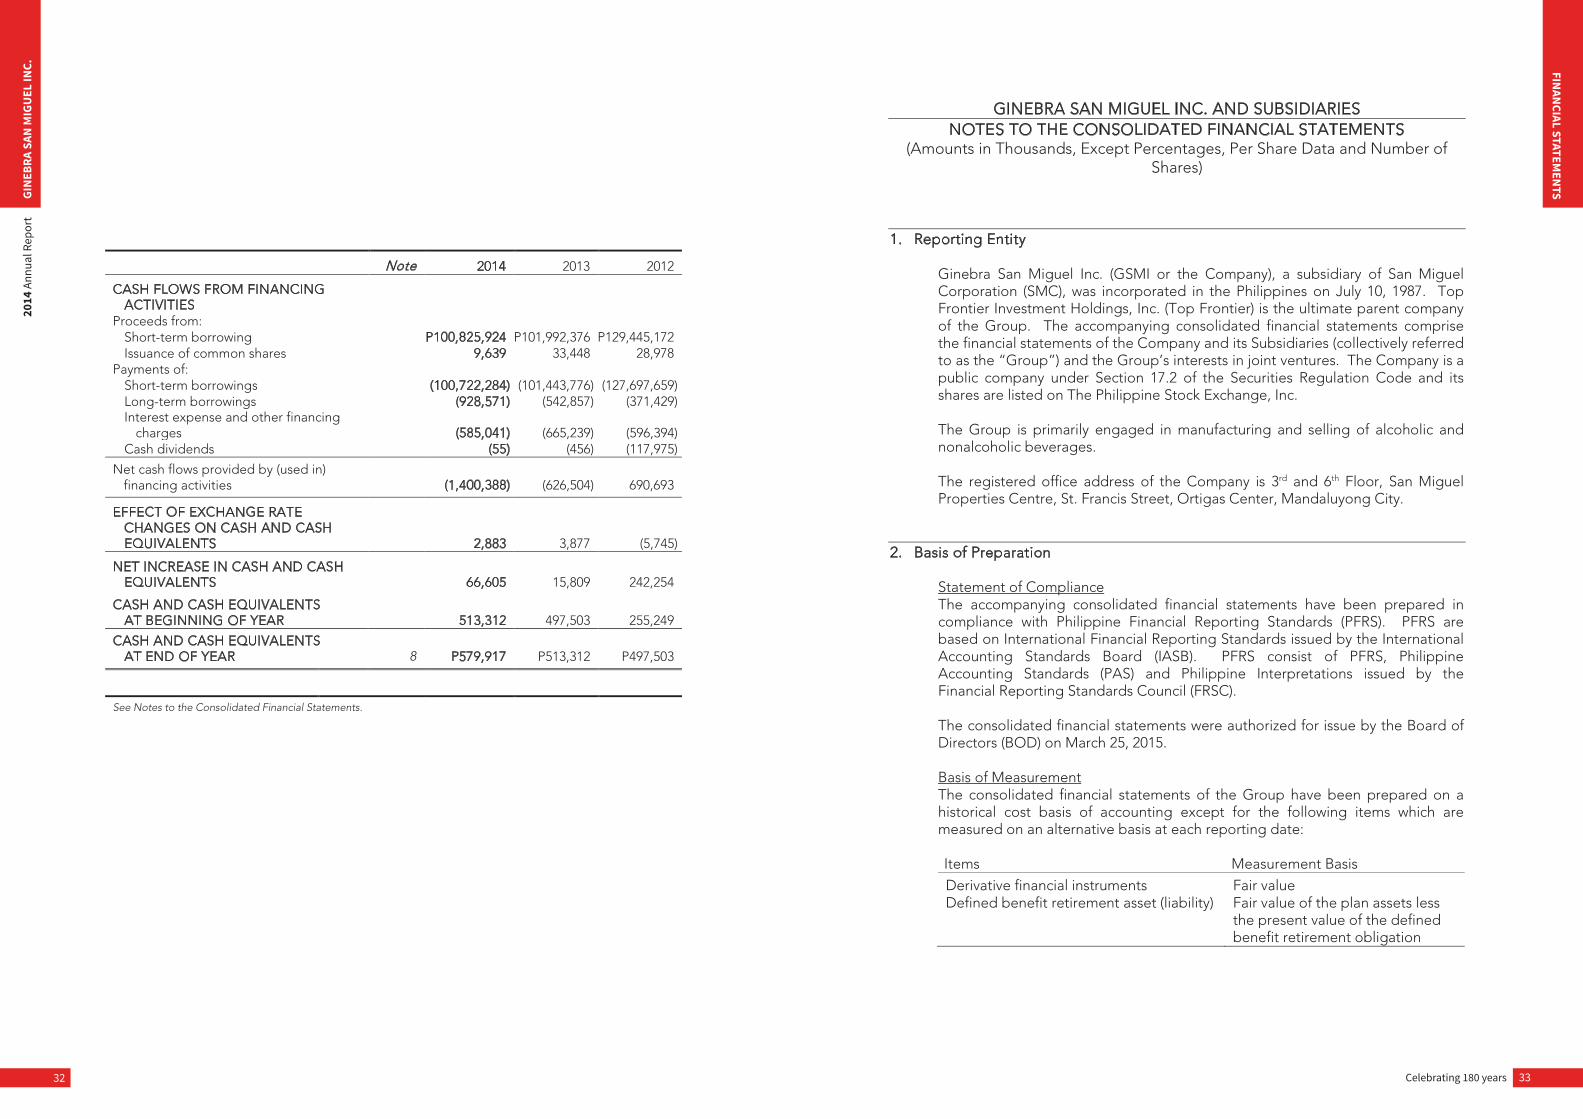
Note 2014 2013 2012
CASH FLOWS FROM FINANCING ACTIVITIES
Proceeds from: Short-term borrowing P100,825,924 P101,992,376 P129,445,172 Issuance of common shares 9,639 33,448 28,978
Payments of: Short-term borrowings (100,722,284) (101,443,776) (127,697,659) Long-term borrowings (928,571) (542,857) (371,429) Interest expense and other financing
charges (585,041) (665,239) (596,394) Cash dividends (55) (456) (117,975)
Net cash flows provided by (used in) financing activities (1,400,388) (626,504) 690,693
EFFECT OF EXCHANGE RATE CHANGES ON CASH AND CASH EQUIVALENTS 2,883 3,877 (5,745)
NET INCREASE IN CASH AND CASH EQUIVALENTS 66,605 15,809 242,254
CASH AND CASH EQUIVALENTS AT BEGINNING OF YEAR 513,312 497,503 255,249
CASH AND CASH EQUIVALENTS AT END OF YEAR 8 P579,917 P513,312 P497,503
See Notes to the Consolidated Financial Statements.
GINEBRA SAN MIGUEL INC. AND SUBSIDIARIES NOTES TO THE CONSOLIDATED FINANCIAL STATEMENTS
(Amounts in Thousands, Except Percentages, Per Share Data and Number of Shares)
1. Reporting Entity
Ginebra San Miguel Inc. (GSMI or the Company), a subsidiary of San Miguel Corporation (SMC), was incorporated in the Philippines on July 10, 1987. Top Frontier Investment Holdings, Inc. (Top Frontier) is the ultimate parent company of the Group. The accompanying consolidated financial statements comprise the financial statements of the Company and its Subsidiaries (collectively referred to as the “Group”) and the Group’s interests in joint ventures. The Company is a public company under Section 17.2 of the Securities Regulation Code and its shares are listed on The Philippine Stock Exchange, Inc. The Group is primarily engaged in manufacturing and selling of alcoholic and nonalcoholic beverages. The registered office address of the Company is 3rd and 6th Floor, San Miguel Properties Centre, St. Francis Street, Ortigas Center, Mandaluyong City.
2. Basis of Preparation Statement of Compliance The accompanying consolidated financial statements have been prepared in compliance with Philippine Financial Reporting Standards (PFRS). PFRS are based on International Financial Reporting Standards issued by the International Accounting Standards Board (IASB). PFRS consist of PFRS, Philippine Accounting Standards (PAS) and Philippine Interpretations issued by the Financial Reporting Standards Council (FRSC). The consolidated financial statements were authorized for issue by the Board of Directors (BOD) on March 25, 2015. Basis of Measurement The consolidated financial statements of the Group have been prepared on a historical cost basis of accounting except for the following items which are measured on an alternative basis at each reporting date: Items Measurement Basis Derivative financial instruments Fair value Defined benefit retirement asset (liability) Fair value of the plan assets less
the present value of the defined benefit retirement obligation
Celebrating 180 years 35
FINAN
CIAL STATEMEN
TS
34
GIN
EBRA
SAN
MIG
UEL
INC.
2014
Ann
ual R
epor
t
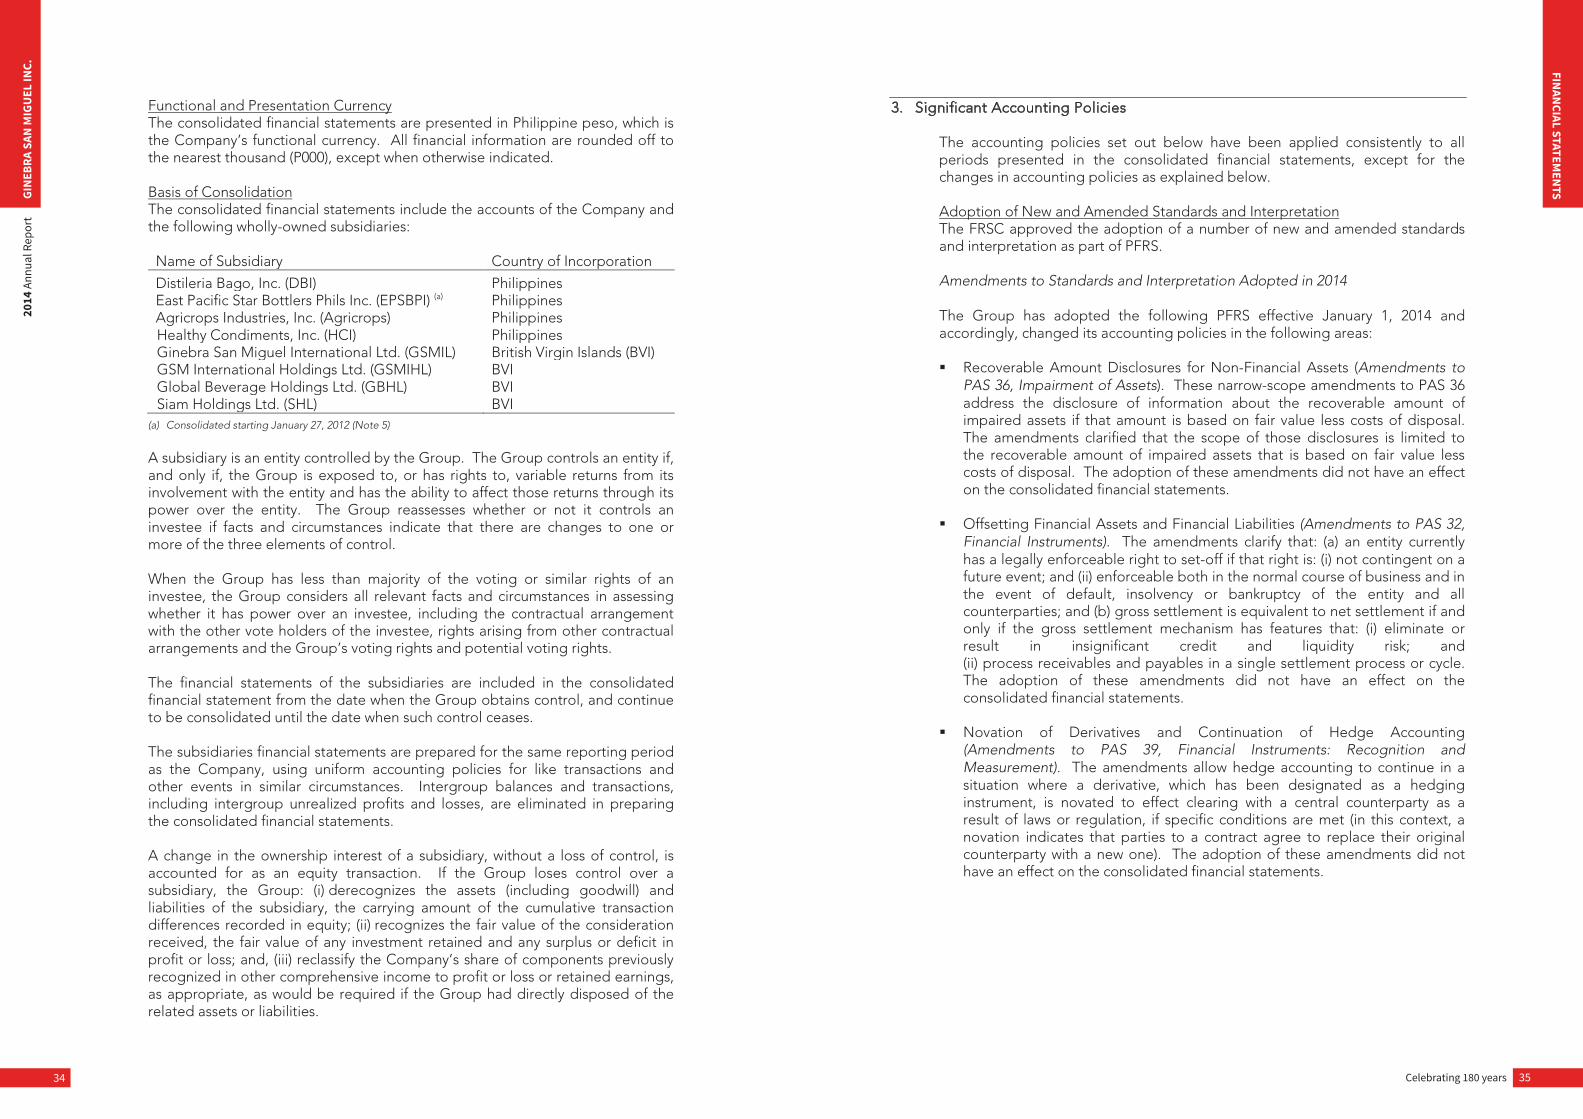
Functional and Presentation Currency The consolidated financial statements are presented in Philippine peso, which is the Company’s functional currency. All financial information are rounded off to the nearest thousand (P000), except when otherwise indicated. Basis of Consolidation The consolidated financial statements include the accounts of the Company and the following wholly-owned subsidiaries:
Name of Subsidiary Country of Incorporation
Distileria Bago, Inc. (DBI) Philippines East Pacific Star Bottlers Phils Inc. (EPSBPI) (a) Philippines Agricrops Industries, Inc. (Agricrops) Philippines Healthy Condiments, Inc. (HCI) Philippines Ginebra San Miguel International Ltd. (GSMIL) British Virgin Islands (BVI) GSM International Holdings Ltd. (GSMIHL) BVI Global Beverage Holdings Ltd. (GBHL) BVI Siam Holdings Ltd. (SHL) BVI
(a) Consolidated starting January 27, 2012 (Note 5)
A subsidiary is an entity controlled by the Group. The Group controls an entity if, and only if, the Group is exposed to, or has rights to, variable returns from its involvement with the entity and has the ability to affect those returns through its power over the entity. The Group reassesses whether or not it controls an investee if facts and circumstances indicate that there are changes to one or more of the three elements of control. When the Group has less than majority of the voting or similar rights of an investee, the Group considers all relevant facts and circumstances in assessing whether it has power over an investee, including the contractual arrangement with the other vote holders of the investee, rights arising from other contractual arrangements and the Group’s voting rights and potential voting rights. The financial statements of the subsidiaries are included in the consolidated financial statement from the date when the Group obtains control, and continue to be consolidated until the date when such control ceases. The subsidiaries financial statements are prepared for the same reporting period as the Company, using uniform accounting policies for like transactions and other events in similar circumstances. Intergroup balances and transactions, including intergroup unrealized profits and losses, are eliminated in preparing the consolidated financial statements. A change in the ownership interest of a subsidiary, without a loss of control, is accounted for as an equity transaction. If the Group loses control over a subsidiary, the Group: (i) derecognizes the assets (including goodwill) and liabilities of the subsidiary, the carrying amount of the cumulative transaction differences recorded in equity; (ii) recognizes the fair value of the consideration received, the fair value of any investment retained and any surplus or deficit in profit or loss; and, (iii) reclassify the Company’s share of components previously recognized in other comprehensive income to profit or loss or retained earnings, as appropriate, as would be required if the Group had directly disposed of the related assets or liabilities.
3. Significant Accounting Policies The accounting policies set out below have been applied consistently to all periods presented in the consolidated financial statements, except for the changes in accounting policies as explained below. Adoption of New and Amended Standards and Interpretation The FRSC approved the adoption of a number of new and amended standards and interpretation as part of PFRS. Amendments to Standards and Interpretation Adopted in 2014 The Group has adopted the following PFRS effective January 1, 2014 and accordingly, changed its accounting policies in the following areas: Recoverable Amount Disclosures for Non-Financial Assets (Amendments to
PAS 36, Impairment of Assets). These narrow-scope amendments to PAS 36 address the disclosure of information about the recoverable amount of impaired assets if that amount is based on fair value less costs of disposal. The amendments clarified that the scope of those disclosures is limited to the recoverable amount of impaired assets that is based on fair value less costs of disposal. The adoption of these amendments did not have an effect on the consolidated financial statements.
Offsetting Financial Assets and Financial Liabilities (Amendments to PAS 32, Financial Instruments). The amendments clarify that: (a) an entity currently has a legally enforceable right to set-off if that right is: (i) not contingent on a future event; and (ii) enforceable both in the normal course of business and in the event of default, insolvency or bankruptcy of the entity and all counterparties; and (b) gross settlement is equivalent to net settlement if and only if the gross settlement mechanism has features that: (i) eliminate or result in insignificant credit and liquidity risk; and (ii) process receivables and payables in a single settlement process or cycle. The adoption of these amendments did not have an effect on the consolidated financial statements.
Novation of Derivatives and Continuation of Hedge Accounting
(Amendments to PAS 39, Financial Instruments: Recognition and Measurement). The amendments allow hedge accounting to continue in a situation where a derivative, which has been designated as a hedging instrument, is novated to effect clearing with a central counterparty as a result of laws or regulation, if specific conditions are met (in this context, a novation indicates that parties to a contract agree to replace their original counterparty with a new one). The adoption of these amendments did not have an effect on the consolidated financial statements.
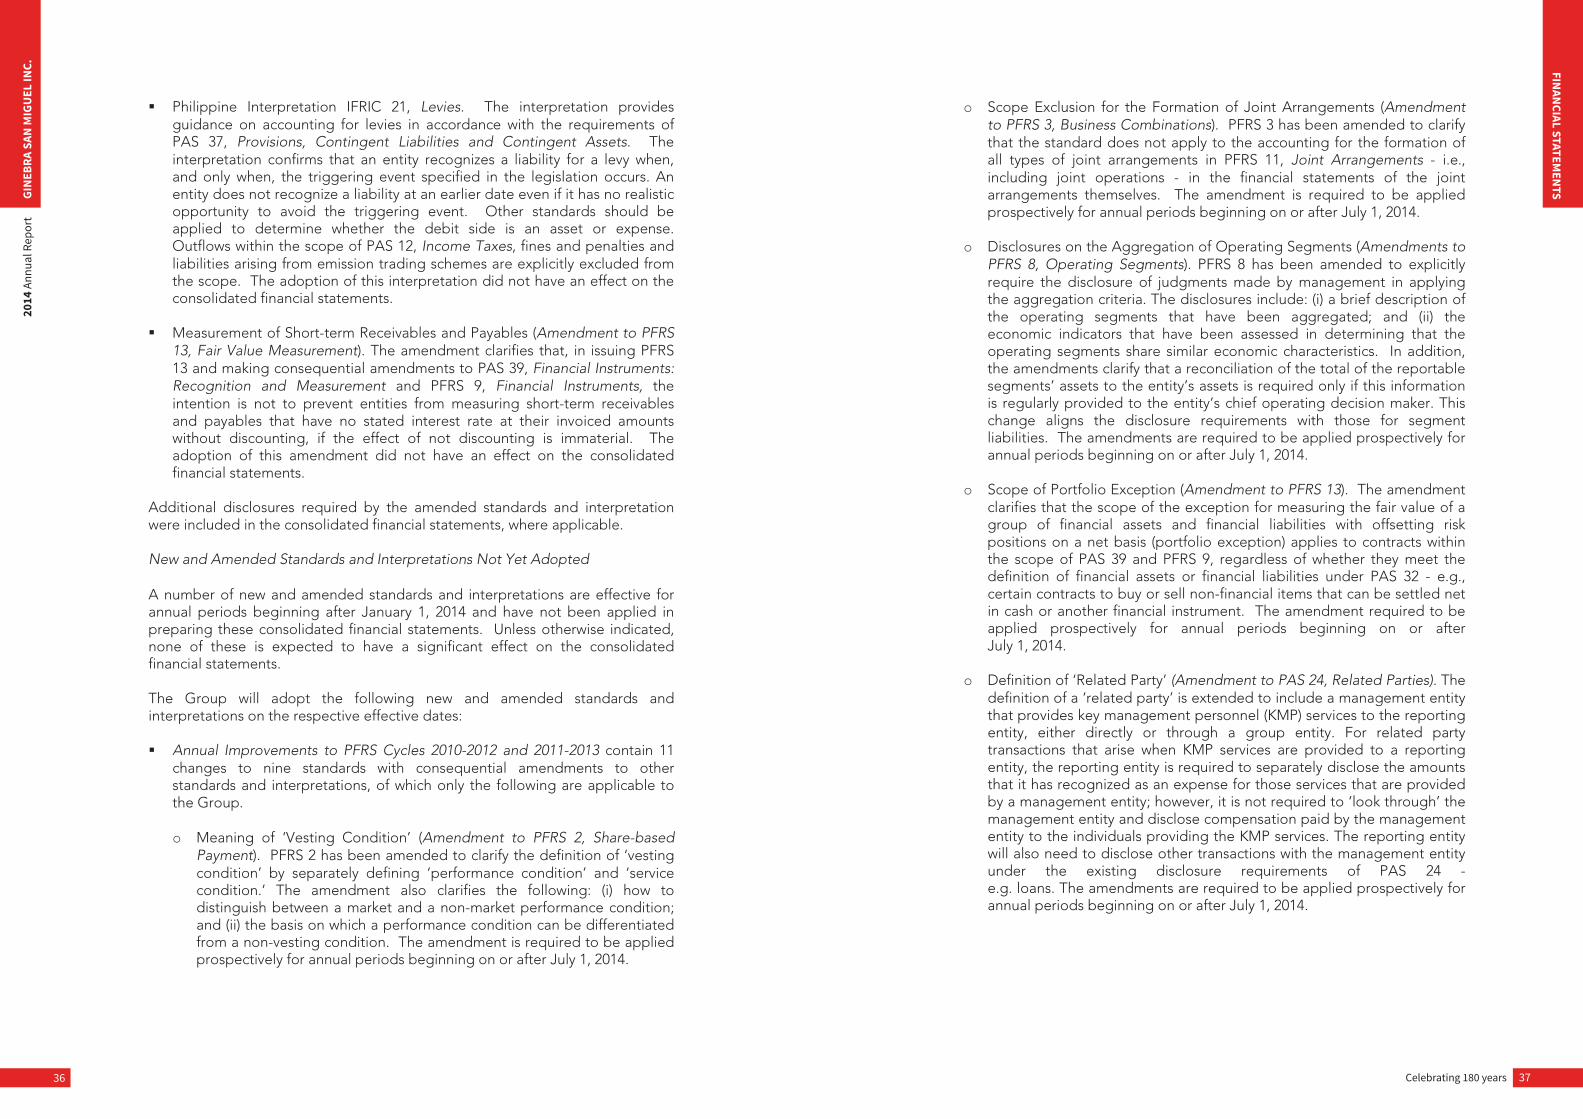
Celebrating 180 years 37
FINAN
CIAL STATEMEN
TS
36
GIN
EBRA
SAN
MIG
UEL
INC.
2014
Ann
ual R
epor
t
Philippine Interpretation IFRIC 21, Levies. The interpretation provides guidance on accounting for levies in accordance with the requirements of PAS 37, Provisions, Contingent Liabilities and Contingent Assets. The interpretation confirms that an entity recognizes a liability for a levy when, and only when, the triggering event specified in the legislation occurs. An entity does not recognize a liability at an earlier date even if it has no realistic opportunity to avoid the triggering event. Other standards should be applied to determine whether the debit side is an asset or expense. Outflows within the scope of PAS 12, Income Taxes, fines and penalties and liabilities arising from emission trading schemes are explicitly excluded from the scope. The adoption of this interpretation did not have an effect on the consolidated financial statements.
Measurement of Short-term Receivables and Payables (Amendment to PFRS
13, Fair Value Measurement). The amendment clarifies that, in issuing PFRS 13 and making consequential amendments to PAS 39, Financial Instruments: Recognition and Measurement and PFRS 9, Financial Instruments, the intention is not to prevent entities from measuring short-term receivables and payables that have no stated interest rate at their invoiced amounts without discounting, if the effect of not discounting is immaterial. The adoption of this amendment did not have an effect on the consolidated financial statements.
Additional disclosures required by the amended standards and interpretation were included in the consolidated financial statements, where applicable. New and Amended Standards and Interpretations Not Yet Adopted A number of new and amended standards and interpretations are effective for annual periods beginning after January 1, 2014 and have not been applied in preparing these consolidated financial statements. Unless otherwise indicated, none of these is expected to have a significant effect on the consolidated financial statements. The Group will adopt the following new and amended standards and interpretations on the respective effective dates:
Annual Improvements to PFRS Cycles 2010-2012 and 2011-2013 contain 11
changes to nine standards with consequential amendments to other standards and interpretations, of which only the following are applicable to the Group. o Meaning of ‘Vesting Condition’ (Amendment to PFRS 2, Share-based
Payment). PFRS 2 has been amended to clarify the definition of ‘vesting condition’ by separately defining ‘performance condition’ and ‘service condition.’ The amendment also clarifies the following: (i) how to distinguish between a market and a non-market performance condition; and (ii) the basis on which a performance condition can be differentiated from a non-vesting condition. The amendment is required to be applied prospectively for annual periods beginning on or after July 1, 2014.
o Scope Exclusion for the Formation of Joint Arrangements (Amendment to PFRS 3, Business Combinations). PFRS 3 has been amended to clarify that the standard does not apply to the accounting for the formation of all types of joint arrangements in PFRS 11, Joint Arrangements - i.e., including joint operations - in the financial statements of the joint arrangements themselves. The amendment is required to be applied prospectively for annual periods beginning on or after July 1, 2014.
o Disclosures on the Aggregation of Operating Segments (Amendments to PFRS 8, Operating Segments). PFRS 8 has been amended to explicitly require the disclosure of judgments made by management in applying the aggregation criteria. The disclosures include: (i) a brief description of the operating segments that have been aggregated; and (ii) the economic indicators that have been assessed in determining that the operating segments share similar economic characteristics. In addition, the amendments clarify that a reconciliation of the total of the reportable segments’ assets to the entity’s assets is required only if this information is regularly provided to the entity’s chief operating decision maker. This change aligns the disclosure requirements with those for segment liabilities. The amendments are required to be applied prospectively for annual periods beginning on or after July 1, 2014.
o Scope of Portfolio Exception (Amendment to PFRS 13). The amendment clarifies that the scope of the exception for measuring the fair value of a group of financial assets and financial liabilities with offsetting risk positions on a net basis (portfolio exception) applies to contracts within the scope of PAS 39 and PFRS 9, regardless of whether they meet the definition of financial assets or financial liabilities under PAS 32 - e.g., certain contracts to buy or sell non-financial items that can be settled net in cash or another financial instrument. The amendment required to be applied prospectively for annual periods beginning on or after July 1, 2014.
o Definition of ‘Related Party’ (Amendment to PAS 24, Related Parties). The definition of a ‘related party’ is extended to include a management entity that provides key management personnel (KMP) services to the reporting entity, either directly or through a group entity. For related party transactions that arise when KMP services are provided to a reporting entity, the reporting entity is required to separately disclose the amounts that it has recognized as an expense for those services that are provided by a management entity; however, it is not required to ‘look through’ the management entity and disclose compensation paid by the management entity to the individuals providing the KMP services. The reporting entity will also need to disclose other transactions with the management entity under the existing disclosure requirements of PAS 24 - e.g. loans. The amendments are required to be applied prospectively for annual periods beginning on or after July 1, 2014.
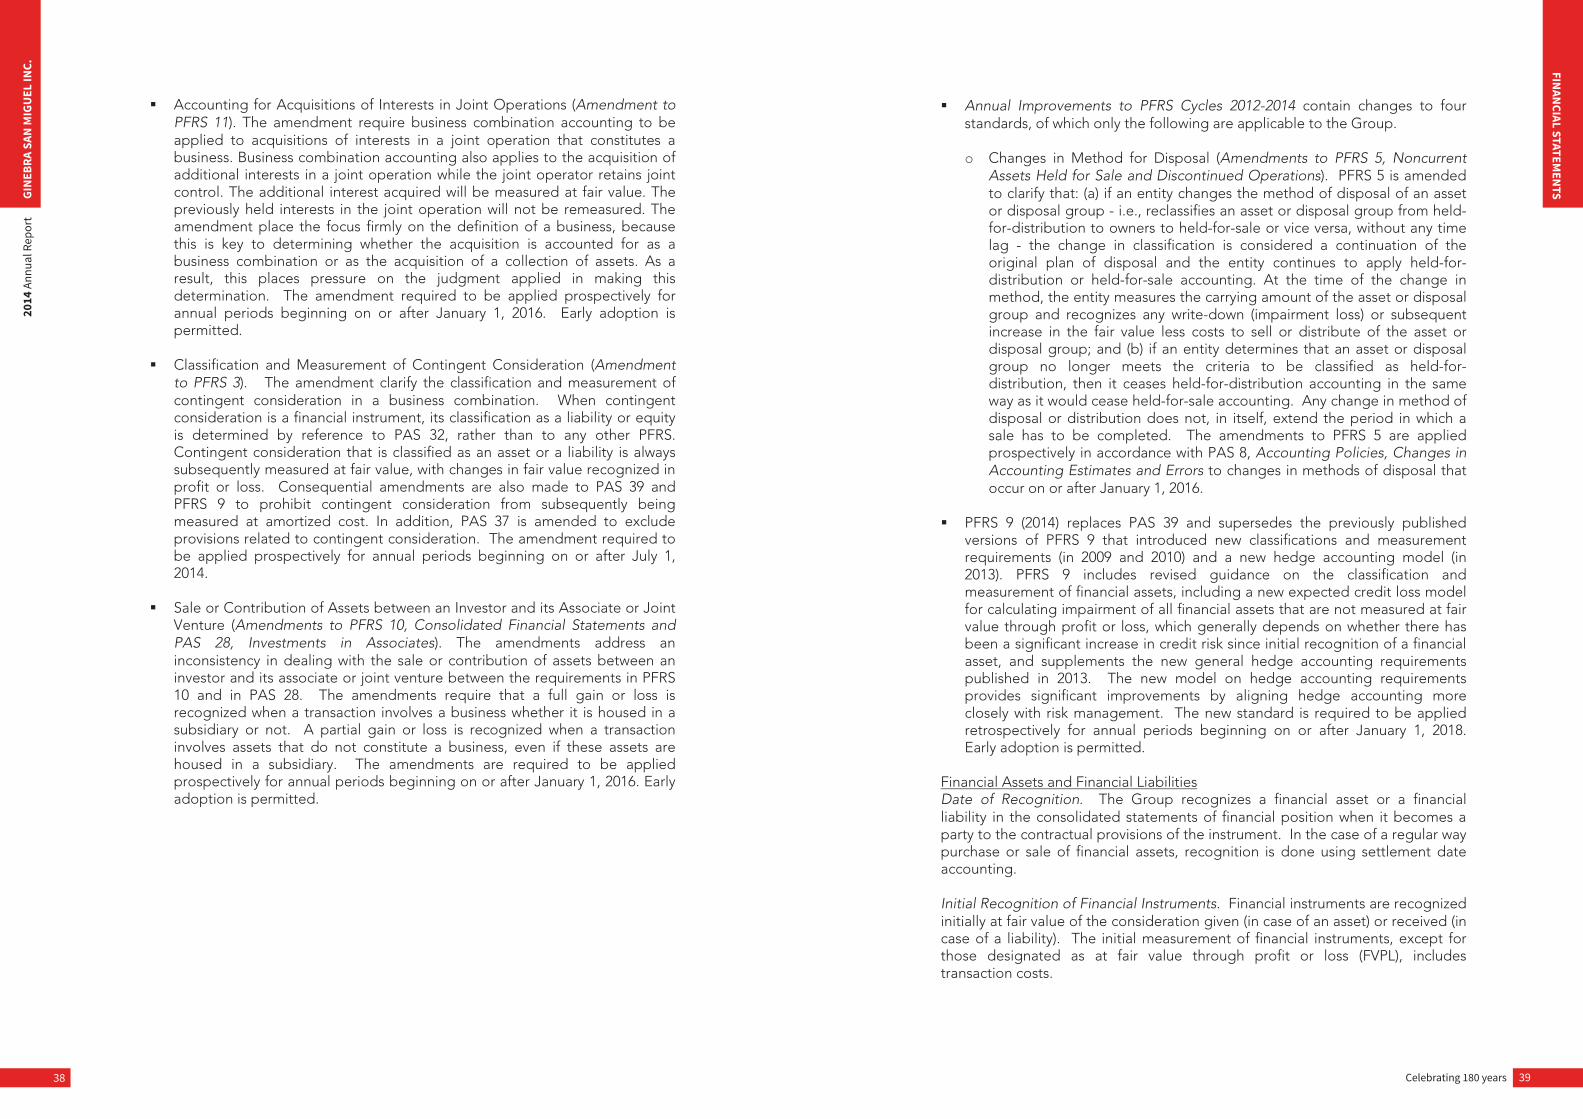
Celebrating 180 years 39
FINAN
CIAL STATEMEN
TS
38
GIN
EBRA
SAN
MIG
UEL
INC.
2014
Ann
ual R
epor
t
Accounting for Acquisitions of Interests in Joint Operations (Amendment to PFRS 11). The amendment require business combination accounting to be applied to acquisitions of interests in a joint operation that constitutes a business. Business combination accounting also applies to the acquisition of additional interests in a joint operation while the joint operator retains joint control. The additional interest acquired will be measured at fair value. The previously held interests in the joint operation will not be remeasured. The amendment place the focus firmly on the definition of a business, because this is key to determining whether the acquisition is accounted for as a business combination or as the acquisition of a collection of assets. As a result, this places pressure on the judgment applied in making this determination. The amendment required to be applied prospectively for annual periods beginning on or after January 1, 2016. Early adoption is permitted.
Classification and Measurement of Contingent Consideration (Amendment
to PFRS 3). The amendment clarify the classification and measurement of contingent consideration in a business combination. When contingent consideration is a financial instrument, its classification as a liability or equity is determined by reference to PAS 32, rather than to any other PFRS. Contingent consideration that is classified as an asset or a liability is always subsequently measured at fair value, with changes in fair value recognized in profit or loss. Consequential amendments are also made to PAS 39 and PFRS 9 to prohibit contingent consideration from subsequently being measured at amortized cost. In addition, PAS 37 is amended to exclude provisions related to contingent consideration. The amendment required to be applied prospectively for annual periods beginning on or after July 1, 2014.
Sale or Contribution of Assets between an Investor and its Associate or Joint
Venture (Amendments to PFRS 10, Consolidated Financial Statements and PAS 28, Investments in Associates). The amendments address an inconsistency in dealing with the sale or contribution of assets between an investor and its associate or joint venture between the requirements in PFRS 10 and in PAS 28. The amendments require that a full gain or loss is recognized when a transaction involves a business whether it is housed in a subsidiary or not. A partial gain or loss is recognized when a transaction involves assets that do not constitute a business, even if these assets are housed in a subsidiary. The amendments are required to be applied prospectively for annual periods beginning on or after January 1, 2016. Early adoption is permitted.
Annual Improvements to PFRS Cycles 2012-2014 contain changes to four standards, of which only the following are applicable to the Group. o Changes in Method for Disposal (Amendments to PFRS 5, Noncurrent
Assets Held for Sale and Discontinued Operations). PFRS 5 is amended to clarify that: (a) if an entity changes the method of disposal of an asset or disposal group - i.e., reclassifies an asset or disposal group from held-for-distribution to owners to held-for-sale or vice versa, without any time lag - the change in classification is considered a continuation of the original plan of disposal and the entity continues to apply held-for-distribution or held-for-sale accounting. At the time of the change in method, the entity measures the carrying amount of the asset or disposal group and recognizes any write-down (impairment loss) or subsequent increase in the fair value less costs to sell or distribute of the asset or disposal group; and (b) if an entity determines that an asset or disposal group no longer meets the criteria to be classified as held-for-distribution, then it ceases held-for-distribution accounting in the same way as it would cease held-for-sale accounting. Any change in method of disposal or distribution does not, in itself, extend the period in which a sale has to be completed. The amendments to PFRS 5 are applied prospectively in accordance with PAS 8, Accounting Policies, Changes in Accounting Estimates and Errors to changes in methods of disposal that occur on or after January 1, 2016.
PFRS 9 (2014) replaces PAS 39 and supersedes the previously published
versions of PFRS 9 that introduced new classifications and measurement requirements (in 2009 and 2010) and a new hedge accounting model (in 2013). PFRS 9 includes revised guidance on the classification and measurement of financial assets, including a new expected credit loss model for calculating impairment of all financial assets that are not measured at fair value through profit or loss, which generally depends on whether there has been a significant increase in credit risk since initial recognition of a financial asset, and supplements the new general hedge accounting requirements published in 2013. The new model on hedge accounting requirements provides significant improvements by aligning hedge accounting more closely with risk management. The new standard is required to be applied retrospectively for annual periods beginning on or after January 1, 2018. Early adoption is permitted.
Financial Assets and Financial Liabilities Date of Recognition. The Group recognizes a financial asset or a financial liability in the consolidated statements of financial position when it becomes a party to the contractual provisions of the instrument. In the case of a regular way purchase or sale of financial assets, recognition is done using settlement date accounting. Initial Recognition of Financial Instruments. Financial instruments are recognized initially at fair value of the consideration given (in case of an asset) or received (in case of a liability). The initial measurement of financial instruments, except for those designated as at fair value through profit or loss (FVPL), includes transaction costs.
Celebrating 180 years 41
FINAN
CIAL STATEMEN
TS
40
GIN
EBRA
SAN
MIG
UEL
INC.
2014
Ann
ual R
epor
t
Financial Assets The Group classifies its financial assets, at initial recognition, in the following categories: financial assets at FVPL, loans and receivables, available-for-sale (AFS) financial assets and held-to-maturity (HTM) investments. The classification depends on the purpose for which the investments are acquired and whether they are quoted in an active market. Management determines the classification of its financial assets and financial liabilities at initial recognition and, where allowed and appropriate, re-evaluates such designation at every reporting date. Financial Assets at FVPL. A financial asset is classified as at FVPL if it is classified as held for trading or is designated as such upon initial recognition. Financial assets are designated as at FVPL if the Group manages such investments and makes purchase and sale decisions based on their fair value in accordance with the documented risk management or investment strategy of the Group. Derivative instruments (including embedded derivatives), except those covered by hedge accounting relationships, are classified under this category. Financial assets are classified as held for trading if they are acquired for the purpose of selling in the near term. Financial assets may be designated by management at initial recognition as at FVPL, when any of the following criteria is met: the designation eliminates or significantly reduces the inconsistent treatment
that would otherwise arise from measuring the assets or recognizing gains or losses on a different basis;
the assets are part of a group of financial assets which are managed and their
performances are evaluated on a fair value basis, in accordance with a documented risk management or investment strategy; or
the financial instrument contains an embedded derivative, unless the
embedded derivative does not significantly modify the cash flows or it is clear, with little or no analysis, that it would not be separately recognized.
The Group carries financial assets at FVPL using their fair values. Attributable transaction costs are recognized in profit or loss as incurred. Fair value changes and realized gains or losses are recognized in profit or loss. Fair value changes from derivatives accounted for as part of an effective cash flow hedge are recognized in other comprehensive income and presented in the consolidated statements of changes in equity. Any interest earned is recognized as part of “Interest income” account in the consolidated statements of income. Any dividend income from equity securities classified as at FVPL is recognized in profit or loss when the right to receive payment has been established. The Group’s derivative assets are classified under this category (Notes 11 and 34). Loans and Receivables. Loans and receivables are non-derivative financial assets with fixed or determinable payments and maturities that are not quoted in an active market. They are not entered into with the intention of immediate or short-term resale and are not designated as AFS financial assets or financial assets at FVPL.
Subsequent to initial measurement, loans and receivables are carried at amortized cost using the effective interest method, less any impairment loss. Any interest earned on loans and receivables is recognized as part of “Interest income” account in the consolidated statements of income on an accrual basis. Amortized cost is calculated by taking into account any discount or premium on acquisition and fees that are an integral part of the effective interest rate. The periodic amortization is also included as part of “Interest income” account in the consolidated statements of income. Gains or losses are recognized in profit or loss when loans and receivables are derecognized or impaired. Cash includes cash on hand and in banks which are stated at face value. Cash equivalents are short-term, highly liquid investments that are readily convertible to known amounts of cash and are subject to an insignificant risk of changes in value. The Group’s cash and cash equivalents, trade and other receivables and noncurrent receivables and deposits are included under this category (Notes 8, 9, 15 and 34). The Group has no financial assets classified as HTM investments and AFS financial assets as of December 31, 2014 and 2013. ‘Day 1’ Profit. Where the transaction price in a non-active market is different from the fair value of other observable current market transactions in the same instrument or based on a valuation technique whose variables include only data from observable market, the Group recognizes the difference between the transaction price and the fair value (a ‘Day 1’ profit) in profit or loss unless it qualifies for recognition as some other type of asset. In cases where data used is not observable, the difference between the transaction price and model value is only recognized in profit or loss when the inputs become observable or when the instrument is derecognized. For each transaction, the Group determines the appropriate method of recognizing the ‘Day 1’ profit amount. Financial Liabilities The Group classifies its financial liabilities, at initial recognition, in the following categories: financial liabilities at FVPL and other financial liabilities, as appropriate. The Group determines the classification of its financial liabilities at initial recognition and, where allowed and appropriate, re-evaluates this designation at each financial year-end. All financial liabilities are recognized initially at fair value and, in the case of loans and borrowings, net of directly attributable transaction costs. Financial Liabilities at FVPL. Financial liabilities are classified under this category through the fair value option. Derivative instruments (including embedded derivatives) with negative fair values, except those covered by hedge accounting relationships, are also classified under this category. The Group carries financial liabilities at FVPL using their fair values and reports fair value changes in profit or loss. Fair value changes from derivatives accounted for as part of an effective accounting hedge are recognized in other comprehensive income and presented in the consolidated statements of changes in equity. Any interest expense incurred is recognized as part of “Interest expense and other financing charges” account in the consolidated statements of income.
Celebrating 180 years 43
FINAN
CIAL STATEMEN
TS
42
GIN
EBRA
SAN
MIG
UEL
INC.
2014
Ann
ual R
epor
t
The Group’s derivative liabilities are classified under this category (Notes 17 and 34). Other Financial Liabilities. This category pertains to financial liabilities that are not designated or classified as at FVPL. After initial recognition, other financial liabilities are subsequently measured at amortized cost using the effective interest method. Amortized cost is calculated by taking into account any premium or discount and any directly attributable transaction costs that are considered an integral part of the effective interest rate of the liability. The effective interest rate amortization is included in interest expense in profit or loss. Gains and losses are recognized in profit or loss when the liabilities are derecognized as well as the amortization process. The Group’s liabilities arising from its trade or borrowings such as notes payable, trade and other payables and long-term debt are included under this category (Notes 16, 17, 18 and 34). Derivative Financial Instrument and Hedging Embedded Derivatives The Group assesses whether embedded derivatives are required to be separated from the host contracts when the Group becomes a party to the contract. An embedded derivative is separated from the host contract and accounted for as a derivative if all of the following conditions are met: a) the economic characteristics and risks of the embedded derivative are not closely related to the economic characteristics and risks of the host contract; b) a separate instrument with the same terms as the embedded derivative would meet the definition of a derivative; and c) the hybrid or combined instrument is not recognized as at FVPL. Reassessment only occurs if there is a change in the terms of the contract that significantly modifies the cash flows that would otherwise be required. Derecognition of Financial Assets and Financial Liabilities Financial Assets. A financial asset (or, where applicable, a part of a financial asset or part of a group of similar financial assets) is primarily derecognized when: o the rights to receive cash flows from the asset have expired; or
o the Group has transferred its rights to receive cash flows from the asset or
has assumed an obligation to pay them in full without material delay to a third party under a “pass-through” arrangement; and either: (a) has transferred substantially all the risks and rewards of the asset; or (b) has neither transferred nor retained substantially all the risks and rewards of the asset, but has transferred control of the asset.
When the Group has transferred its rights to receive cash flows from an asset or has entered into a pass-through arrangement, it evaluates if and to what extent it has retained the risks and rewards of ownership. When it has neither transferred nor retained substantially all the risks and rewards of the asset nor transferred control of the asset, the Group continues to recognize the transferred asset to the extent of the Group’s continuing involvement. In that case, the Group also recognizes the associated liability. The transferred asset and the associated liability are measured on the basis that reflects the rights and obligations that the Group has retained. Financial Liabilities. A financial liability is derecognized when the obligation under the liability is discharged or cancelled, or expires. When an existing financial liability is replaced by another from the same lender on substantially different terms, or the terms of an existing liability are substantially modified, such an exchange or modification is treated as a derecognition of the original liability and the recognition of a new liability. The difference in the respective carrying amounts is recognized in profit or loss. Impairment of Financial Assets The Group assesses, at the reporting date, whether there is objective evidence that a financial asset or group of financial assets is impaired. A financial asset or a group of financial assets is deemed to be impaired if, and only if, there is objective evidence of impairment as a result of one or more events that have occurred after the initial recognition of the asset (an incurred loss event) and that loss event has an impact on the estimated future cash flows of the financial asset or the group of financial assets that can be reliably estimated. Assets Carried at Amortized Cost. For financial assets carried at amortized cost such as loans and receivables, the Group first assesses whether impairment exists individually for financial assets that are individually significant, or collectively for financial assets that are not individually significant. If no objective evidence of impairment has been identified for a particular financial asset that was individually assessed, the Group includes the asset as part of a group of financial assets with similar credit risk characteristics and collectively assesses the group for impairment. Assets that are individually assessed for impairment and for which an impairment loss is, or continues to be, recognized are not included in the collective impairment assessment. Evidence of impairment for specific impairment purposes may include indications that the borrower or a group of borrowers is experiencing financial difficulty, default or delinquency in principal or interest payments, or may enter into bankruptcy or other form of financial reorganization intended to alleviate the financial condition of the borrower. For collective impairment purposes, evidence of impairment may include observable data on existing economic conditions or industry-wide developments indicating that there is a measurable decrease in the estimated future cash flows of the related assets.
Celebrating 180 years 45
FINAN
CIAL STATEMEN
TS
44
GIN
EBRA
SAN
MIG
UEL
INC.
2014
Ann
ual R
epor
t
If there is objective evidence of impairment, the amount of loss is measured as the difference between the asset’s carrying amount and the present value of estimated future cash flows (excluding future credit losses) discounted at the financial asset’s original effective interest rate (i.e., the effective interest rate computed at initial recognition). Time value is generally not considered when the effect of discounting the cash flows is not material. If a loan or receivable has a variable rate, the discount rate for measuring any impairment loss is the current effective interest rate, adjusted for the original credit risk premium. For collective impairment purposes, impairment loss is computed based on their respective default and historical loss experience. The carrying amount of the asset is reduced either directly or through the use of an allowance account. The impairment loss for the period is recognized in profit or loss. If, in a subsequent period, the amount of the impairment loss decreases and the decrease can be related objectively to an event occurring after the impairment was recognized, the previously recognized impairment loss is reversed. Any subsequent reversal of an impairment loss is recognized in profit or loss, to the extent that the carrying amount of the asset does not exceed its amortized cost at the reversal date. Classification of Financial Instruments between Debt and Equity From the perspective of the issuer, a financial instrument is classified as debt instrument if it provides for a contractual obligation to: deliver cash or another financial asset to another entity; exchange financial assets or financial liabilities with another entity under
conditions that are potentially unfavorable to the Group; or satisfy the obligation other than by the exchange of a fixed amount of cash or
another financial asset for a fixed number of own equity shares. If the Group does not have an unconditional right to avoid delivering cash or another financial asset to settle its contractual obligation, the obligation meets the definition of a financial liability. Debt Issue Costs Debt issue costs are considered as an adjustment to the effective yield of the related debt and are deferred and amortized using the effective interest rate method. When a loan is paid, the related unamortized debt issue costs at the date of repayment are recognized in profit or loss. Offsetting Financial Instruments Financial assets and financial liabilities are offset and the net amount is reported in the consolidated statements of financial position if, and only if, there is a currently enforceable legal right to offset the recognized amounts and there is an intention to settle on a net basis, or to realize the asset and settle the liability simultaneously. This is not generally the case with master netting agreements, and the related assets and liabilities are presented gross in the consolidated statements of financial position.
Inventories Finished goods and materials and supplies are valued at the lower of cost and net realizable value. Costs incurred in bringing each inventory to its present location and condition are accounted for as follows:
Finished goods - at cost, which includes direct materials and labor and a proportion of manufacturing overhead costs based on normal operating capacity but excluding borrowing costs; costs are determined using the moving-average method.
Materials and supplies - at cost, using the moving-average method.
Finished Goods. Net realizable value is the estimated selling price in the ordinary course of business, less the estimated costs necessary to make the sale. Materials and Supplies. Net realizable value is the current replacement cost. Any write-down of inventories to net realizable value and all losses of inventories are recognized as expense in the year of write-down or loss occurrence. The amount of reversals, if any, of write-down of inventories arising from an increase in net realizable value are recognized as reduction in the amount of inventories recognized as expense in the year in which the reversal occurs. Containers (i.e., Returnable Bottles and Shells). These are stated at deposit values less any impairment in value. The excess of the acquisition cost of the containers over their deposit value is presented under deferred containers included under “Other noncurrent assets” account in the consolidated statements of financial position and is amortized over the estimated useful lives of ten years. Amortization of deferred containers is included under “General and administrative expenses” account in the consolidated statements of income. Assets Held for Sale and Discontinued Operation The Group classifies noncurrent assets, or disposal groups comprising assets and liabilities as held for sale or distribution, if their carrying amounts will be recovered primarily through sale or distribution rather than through continuing use. The assets or disposal groups are generally measured at the lower of their carrying amount and fair value less costs to sell or distribute, except for some assets which are covered by other standards. Any impairment loss on a disposal group is allocated first to goodwill, and then to the remaining assets and liabilities on pro rata basis, except that no loss is allocated to inventories, financial assets and deferred tax assets, which continue to be measured in accordance with the Group’s accounting policies. Impairment losses on initial classification as held for sale or distribution and subsequent gains and losses on remeasurement are recognized in profit or loss. Gains are not recognized in excess of any cumulative impairment losses. The criteria for held for sale or distribution is regarded as met only when the sale or distribution is highly probable and the asset or disposal group is available for immediate sale or distribution in its present condition. Actions required to complete the sale or distribution should indicate that it is unlikely that significant changes to the sale will be made or that the sale will be withdrawn.
Celebrating 180 years 47
FINAN
CIAL STATEMEN
TS
46
GIN
EBRA
SAN
MIG
UEL
INC.
2014
Ann
ual R
epor
t
Property, plant and equipment once classified as held for sale or distribution are not depreciated. Assets and liabilities classified as held for sale or distribution are presented separately as current items in the consolidated statements of financial position. A discontinued operation is a component of the Company’s business, the operations and cash flows of which can be clearly distinguished from the rest of the Company and which: (1) represent a separate major line of business or geographic area of operations; (2) is part of a single coordinated plan to dispose a separate major line of business or graphic area of operations; or (3) is a subsidiary acquired exclusively with a view to re-sale. Classification as a discontinued operation occurs at the earlier of disposal or when the operation meets the criteria to be classified as held for sale. When an operation is classified as a discontinued operation, the comparative consolidated statements of income are re-presented as if the operation had been discontinued from the start of the comparative period. Discontinued operations are excluded from the results of continuing operations and are presented as a single amount as “Loss from discontinued operations - net of tax” in the consolidated statements of income. Business Combination Business combinations are accounted for using the acquisition method as at the acquisition date. The cost of an acquisition is measured as the aggregate of the consideration transferred, measured at acquisition date fair value and the amount of any non-controlling interests in the acquiree. For each business combination, the Group elects whether to measure the non-controlling interests in the acquiree at fair value or at proportionate share of the acquiree’s identifiable net assets. Acquisition-related costs are expensed as incurred and included as part of “General and administrative expenses” account in the consolidated statements of income. When the Group acquires a business, it assesses the financial assets and financial liabilities assumed for appropriate classification and designation in accordance with the contractual terms, economic circumstances and pertinent conditions as at the acquisition date. If the business combination is achieved in stages, the acquisition date fair value of the acquirer’s previously held equity interest in the acquiree is remeasured at the acquisition date fair values and any resulting gain or loss is recognized in profit or loss. The Group measures goodwill at the acquisition date as: a) the fair value of the consideration transferred; plus b) the recognized amount of any non-controlling interests in the acquiree; plus c) if the business combination is achieved in stages, the fair value of the existing equity interest in the acquiree; less d) the net recognized amount (generally fair value) of the identifiable assets acquired and liabilities assumed. When the excess is negative, a bargain purchase gain is recognized immediately in profit or loss. Subsequently, goodwill is measured at cost less any accumulated impairment in value. Goodwill is reviewed for impairment, annually or more frequently, if events or changes in circumstances indicate that the carrying amount may be impaired.
The consideration transferred does not include amounts related to the settlement of pre-existing relationships. Such amounts are generally recognized in profit or loss. Costs related to the acquisition, other than those associated with the issue of debt or equity securities that the Group incurs in connection with a business combination, are expensed as incurred. Any contingent consideration payable is measured at fair value at the acquisition date. If the contingent consideration is classified as equity, it is not remeasured and settlement is accounted for within equity. Otherwise, subsequent changes to the fair value of the contingent consideration are recognized in profit or loss.
Goodwill in a Business Combination
Goodwill acquired in a business combination is, from the acquisition date, allocated to each of the cash-generating units, or groups of cash-generating units that are expected to benefit from the synergies of the combination, irrespective of whether other assets or liabilities are assigned to those units or groups of units. Each unit or group of units to which the goodwill is so allocated: o represents the lowest level within the Group at which the goodwill is
monitored for internal management purposes; and o is not larger than an operating segment determined in accordance with
PFRS 8. Impairment is determined by assessing the recoverable amount of the cash-generating unit or group of cash-generating units, to which the goodwill relates. Where the recoverable amount of the cash-generating unit or group of cash-generating units is less than the carrying amount, an impairment loss is recognized. Where goodwill forms part of a cash-generating unit or group of cash-generating units and part of the operation within that unit is disposed of, the goodwill associated with the operation disposed of is included in the carrying amount of the operation when determining the gain or loss on disposal of the operation. Goodwill disposed of in this circumstance is measured based on the relative values of the operation disposed of and the portion of the cash-generating unit retained. An impairment loss with respect to goodwill is not reversed.
Transactions under Common Control Transactions under common control entered into in contemplation of each other and business combination under common control designed to achieve an overall commercial effect are treated as a single transaction. Transfers of assets between commonly controlled entities are accounted for using book value accounting. Investments in Joint Ventures A joint venture is a type of joint arrangement whereby the parties that have joint control of the arrangement have rights to the net assets of the joint venture. Joint control is the contractually agreed sharing of control of an arrangement, which exists only when decisions about the relevant activities require unanimous consent of the parties sharing control.
Celebrating 180 years 49
FINAN
CIAL STATEMEN
TS
48
GIN
EBRA
SAN
MIG
UEL
INC.
2014
Ann
ual R
epor
t
The considerations made in determining joint control is similar to those necessary to determine control over subsidiaries. The Group’s investments in joint ventures are accounted for using the equity method. Under the equity method, the investment in joint venture is initially recognized at cost. The carrying amount of the investment is adjusted to recognize the changes in the Group’s share of net assets of the joint venture since the acquisition date. Goodwill relating to the joint venture is included in the carrying amount of the investment and is neither amortized nor individually tested for impairment. The Group’s share in profit or loss of joint venture is recognized as “Equity in net losses of joint ventures” account in the consolidated statements of income. Adjustments to the carrying amount may also be necessary for changes in the Group’s proportionate interest in the joint venture arising from changes in the joint venture’s other comprehensive income. The Group’s share of those changes is recognized as “Share in other comprehensive income (loss) of joint ventures” account in the consolidated statements of comprehensive income. Unrealized gains and losses resulting from transactions between the Group and the joint venture are eliminated to the extent of the interest in the joint venture. When the Group’s share of losses in a joint venture equals or exceeds its interest in the joint ventures, the Group does not recognize further losses, unless it has incurred obligation or made payments on behalf of the joint venture. After application of the equity method, the Group determines whether it is necessary to recognize an impairment loss with respect to the Group’s net investment in the joint venture. At each reporting date, the Group determines whether there is objective evidence that the investment in the joint venture is impaired. If there is such evidence, the Group recalculates the amount of impairment as the difference between the recoverable amount and carrying amount of the joint venture. Such impairment loss is recognized as part of “Equity in net losses of joint ventures” account in the consolidated statements of income. Upon loss of joint control over the joint venture, the Group measures and recognizes any retained investment at fair value. Any difference between the carrying amount of the joint venture upon loss of joint control and the fair value of the retained investment and proceeds from disposal is recognized in profit or loss. The financial statements of the joint venture are prepared for the same reporting period as the Group. When necessary, adjustments are made to bring the accounting policies in line with those of the Group. Property, Plant and Equipment Property, plant and equipment, except land and construction in progress, are stated at cost less accumulated depreciation and amortization and any accumulated impairment in value. Such cost includes the cost of replacing part of the property, plant and equipment at the time that cost is incurred, if the recognition criteria are met, and excludes the costs of day-to-day servicing. Land is stated at cost less any impairment in value.
The initial cost of property, plant and equipment comprises of its construction cost or purchase price, including import duties, taxes and any directly attributable costs in bringing the asset to its working condition and location for its intended use. Cost also includes any related asset retirement obligation (ARO). Expenditures incurred after the asset has been put into operation, such as repairs, maintenance and overhaul costs, are normally recognized as expense in the period the costs are incurred. Major repairs are capitalized as part of property, plant and equipment only when it is probable that future economic benefits associated with the items will flow to the Group and the cost of the items can be measured reliably. Construction in progress (CIP) represents structures under construction and is stated at cost. This includes the costs of construction and other direct costs. Borrowing costs that are directly attributable to the construction of plant and equipment are capitalized during the construction period. CIP is not depreciated until such time that the relevant assets are ready for use. Depreciation and amortization, which commences when the assets are available for their intended use, are computed using the straight-line method over the following estimated useful lives of the assets:
Number of Years
Land improvements 5 - 10 Buildings and building improvements 20 - 50 Transportation equipment 5 Machinery and equipment 3 - 40 Furniture, fixtures and office equipment 2 - 5 Other equipment 2 - 5 Leasehold improvements 10 - 30 or
term of the lease, whichever is
shorter The remaining useful lives, residual values, and depreciation and amortization methods are reviewed and adjusted periodically, if appropriate, to ensure that such periods and methods of depreciation and amortization are consistent with the expected pattern of economic benefits from the items of property, plant and equipment. The carrying amounts of property, plant and equipment are reviewed for impairment when events or changes in circumstances indicate that the carrying amounts may not be recoverable. Fully depreciated assets are retained in the accounts until they are no longer in use. An item of property, plant and equipment is derecognized when either it has been disposed of or when it is permanently withdrawn from use and no future economic benefits are expected from its use or disposal. Any gain or loss arising from the retirement and disposal of an item of property, plant and equipment (calculated as the difference between the net disposal proceeds and the carrying amount of the asset) is included in profit or loss in the period of retirement and disposal.
Celebrating 180 years 51
FINAN
CIAL STATEMEN
TS
50
GIN
EBRA
SAN
MIG
UEL
INC.
2014
Ann
ual R
epor
t
Investment Property Investment property consists of property held to earn rentals and/or for capital appreciation but not for sale in the ordinary course of business, used in the production or supply of goods or services or for administrative purposes. Investment property, except for land, is measured at cost including transaction costs less accumulated depreciation and amortization and any accumulated impairment in value. The carrying amount includes the cost of replacing part of an existing investment property at the time the cost is incurred, if the recognition criteria are met, and excludes the costs of day-to-day servicing of an investment property. Land is stated at cost less any impairment in value. Depreciation and amortization, which commences when the assets are available for their intended use, are computed using the straight-line method over the following estimated useful lives of the assets:
Number of
Years
Land improvements 5 - 10 Buildings and building improvements 20 - 50 Machinery and equipment 3 - 40 Other equipment 2 - 5
The useful lives, residual values and depreciation and amortization method are reviewed and adjusted, if appropriate, at each reporting date.
Investment property is derecognized either when it has been disposed of or when it is permanently withdrawn from use and no future economic benefit is expected from its disposal. Any gains and losses on the retirement and disposal of investment property are recognized in profit or loss in the period of retirement and disposal. Transfers are made to investment property when, and only when, there is a change in use, evidenced by ending of owner-occupation or commencement of an operating lease to another party. Transfers are made from investment property when, and only when, there is a change in use, evidenced by commencement of the owner-occupation or commencement of development with a view to sell. For a transfer from investment property to owner-occupied property or inventories, the cost of property for subsequent accounting is its carrying amount at the date of change in use. If the property occupied by the Group as an owner-occupied property becomes an investment property, the Group accounts for such property in accordance with the policy stated under property, plant and equipment up to the date of change in use.
Impairment of Non-financial Assets The carrying amounts of investments in joint venture, property, plant and equipment, deferred containers and idle assets are reviewed for impairment when events or changes in circumstances indicate that the carrying amount may not be recoverable. Intangible assets with indefinite useful lives are tested for impairment annually either individually or at the cash-generating unit level. If any such indication exists, and if the carrying amount exceeds the estimated recoverable amount, the assets or cash-generating units are written down to their recoverable amounts. The recoverable amount of the asset is the greater of fair value less costs to sell and value in use. The fair value less costs to sell is the amount obtainable from the sale of an asset in an arm’s length transaction between knowledgeable, willing parties, less costs of disposal. In assessing value in use, the estimated future cash flows are discounted to their present value using a pre-tax discount rate that reflects current market assessments of the time value of money and the risks specific to the asset. For an asset that does not generate largely independent cash inflows, the recoverable amount is determined for the cash-generating unit to which the asset belongs. Impairment losses are recognized in profit or loss in those expense categories consistent with the function of the impaired asset. An assessment is made at each reporting date as to whether there is any indication that previously recognized impairment losses may no longer exist or may have decreased. If such indication exists, the recoverable amount is estimated. A previously recognized impairment loss is reversed only if there has been a change in the estimates used to determine the asset’s recoverable amount since the last impairment loss was recognized. If that is the case, the carrying amount of the asset is increased to its recoverable amount. That increased amount cannot exceed the carrying amount that would have been determined, net of depreciation and amortization, had no impairment loss been recognized for the asset in prior years. Such reversal is recognized in profit or loss. After such a reversal, the depreciation and amortization charge is adjusted in future periods to allocate the asset’s revised carrying amount, less any residual value, on a systematic basis over its remaining useful life. Fair Value Measurements The Group measures a number of financial and non-financial assets and liabilities at fair value at each reporting date. Fair value is the price that would be received to sell an asset or paid to transfer a liability in an orderly transaction between market participants at the measurement date. The fair value measurement is based on the presumption that the transaction to sell the asset or transfer the liability takes place either in the principal market for the asset or liability, or in the absence of a principal market, in the most advantageous market for the asset or liability. The principal or most advantageous market must be accessible to the Group. The fair value of an asset or liability is measured using the assumptions that market participants would use when pricing the asset or liability, assuming that market participants act in their best economic interest. The Group uses valuation techniques that are appropriate in the circumstances and for which sufficient data are available to measure fair value, maximizing the use of relevant observable inputs and minimizing the use of unobservable inputs.
Celebrating 180 years 53
FINAN
CIAL STATEMEN
TS
52
GIN
EBRA
SAN
MIG
UEL
INC.
2014
Ann
ual R
epor
t
All assets and liabilities for which fair value is measured or disclosed in the consolidated financial statements are categorized within the fair value hierarchy, described as follows, based on the lowest level input that is significant to the fair value measurement as a whole: Level 1: quoted prices (unadjusted) in active markets for identical assets or
liabilities;
Level 2: inputs other than quoted prices included within Level 1 that are observable for the asset or liability, either directly or indirectly; and
Level 3: inputs for the asset or liability that are not based on observable market data.
For assets and liabilities that are recognized in the consolidated financial statements on a recurring basis, the Group determines whether transfers have occurred between levels in the hierarchy by re-assessing the categorization at the end of each reporting period. For purposes of the fair value disclosure, the Group has determined classes of assets and liabilities on the basis of the nature, characteristics and risks of the asset or liability and the level of the fair value hierarchy. Provisions Provisions are recognized when: (a) the Group has a present obligation (legal or constructive) as a result of past events; (b) it is probable (i.e., more likely than not) that an outflow of resources embodying economic benefits will be required to settle the obligation; and (c) a reliable estimate can be made of the amount of the obligation. If the effect of the time value of money is material, provisions are determined by discounting the expected future cash flows at a pre-tax rate that reflects current market assessment of the time value of money and the risks specific to the liability. Where discounting is used, the increase in the provision due to the passage of time is recognized as interest expense. Where some or all of the expenditure required to settle a provision is expected to be reimbursed by another party, the reimbursement is recognized as a separate asset only when it is virtually certain that reimbursement will be received. The amount recognized for the reimbursement shall not exceed the amount of the provision. Provisions are reviewed at each reporting date and adjusted to reflect the current best estimate. Share Capital Common Shares Common shares are classified as equity. Incremental costs directly attributable to the issue of common shares and share options are recognized as a deduction from equity, net of any tax effects. Preferred Shares Preferred shares are classified as equity if they are non-redeemable, or redeemable only at the Company’s option, and any dividends thereon are discretionary. Dividends thereon are recognized as distributions within equity upon approval by the BOD of the Company.
Preferred shares are classified as a liability if they are redeemable on a specific date or at the option of the shareholders, or if dividend payments are not discretionary. Dividends thereon are recognized as interest expense in profit or loss as accrued. Treasury Shares Own equity instruments which are reacquired are carried at cost and deducted from equity. No gain or loss is recognized on the purchase, sale, reissuance or cancellation of the Company’s own equity instruments. When the shares are retired, the capital stock account is reduced by its par value and the excess of cost over par value upon retirement is debited to additional paid-in capital to the extent of the specific or average additional paid-in capital when the shares were issued and to retained earnings for the remaining balance. Revenue Recognition Revenue is recognized to the extent that it is probable that the economic benefits associated with the transaction will flow to the Group and the amount of revenue can be reliably measured. The following specific recognition criteria must also be met before revenue is recognized: Revenue from Sale of Goods Revenue from sale of goods in the course of ordinary activities is measured at the fair value of the consideration received or receivable, net of returns, trade discounts and volume rebates. Revenue is recognized when the significant risks and rewards of ownership of the goods have passed to the buyer, which is normally upon delivery and the amount of revenue can be measured reliably. Revenue from Services Revenue is recognized upon satisfactory performance of services which is manufacturing and bottling of nonalcoholic beverages in favor of the customer where such production inputs are in the name of the customer. Others Interest income is recognized as the interest accrues, taking into account the effective yield on the asset. Dividend income is recognized when the Group’s right as a shareholder to receive the payment is established. Rent income is recognized on a straight-line basis over the term of the lease. Cost and Expense Recognition Costs and expenses are recognized upon receipt of goods, utilization of services or at the date they are incurred. Expenses are also recognized when a decrease in future economic benefit related to a decrease in an asset or an increase in a liability that can be measured reliably has arisen. Expenses are recognized on the basis of a direct association between costs incurred and the earning of specific items of income; on the basis of systematic and rational allocation procedures when economic benefits are expected to arise over several accounting periods and the association can only be broadly or indirectly determined; or immediately when an expenditure produces no future economic benefits or when, and to the extent that future economic benefits do not qualify, or cease to qualify, for recognition as an asset.
Celebrating 180 years 55
FINAN
CIAL STATEMEN
TS
54
GIN
EBRA
SAN
MIG
UEL
INC.
2014
Ann
ual R
epor
t
Share-based Payment Transactions The cost of Employee Stock Purchase Plan (ESPP) is measured by reference to the market price at the time of the grant less subscription price. The cost of share-based payment transactions is recognized, together with a corresponding increase in equity, over the period in which the performance and/or service conditions are fulfilled, ending on the date when the relevant employees become fully entitled to the award (the “vesting date”). The cumulative expenses recognized for share-based payment transactions at each reporting date until the vesting date reflect the extent to which the vesting period has expired and the Company’s best estimate of the number of equity instruments that will ultimately vest. Where the terms of a share-based award are modified, as a minimum, an expense is recognized as if the terms had not been modified. In addition, an expense is recognized for any modification, which increases the total fair value of the share-based payment arrangement, or is otherwise beneficial to the employee as measured at the date of modification. Where an equity-settled award is cancelled, it is treated as if it had vested on the date of cancellation, and any expense not yet recognized for the award is recognized immediately. However, if a new award is substituted for the cancelled award, and designated as a replacement award on the date that it is granted, the cancelled and new awards are treated as if they were a modification of the original award. Leases The determination of whether an arrangement is, or contains, a lease is based on the substance of the arrangement and requires an assessment of whether the fulfillment of the arrangement is dependent on the use of a specific asset or assets and the arrangement conveys a right to use the asset. A reassessment is made after the inception of the lease only if one of the following applies: (a) there is a change in contractual terms, other than a renewal or extension of
the arrangement; (b) a renewal option is exercised or an extension is granted, unless the term of
the renewal or extension was initially included in the lease term; (c) there is a change in the determination of whether fulfillment is dependent on
a specific asset; or (d) there is a substantial change to the asset. Where a reassessment is made, lease accounting shall commence or cease from the date when the change in circumstances gives rise to the reassessment for scenarios (a), (c) or (d), and at the date of renewal or extension period for scenario (b) above. Operating Lease Group as Lessee. Leases which do not transfer to the Group substantially all the risks and rewards of ownership of the asset are classified as operating leases. Operating lease payments are recognized as an expense in profit or loss on a straight-line basis over the lease term. Associated costs such as maintenance and insurance are expensed as incurred.
Group as Lessor. Leases where the Group does not transfer substantially all the risks and rewards of ownership of the assets are classified as operating leases. Rent income from operating leases is recognized as income on a straight-line basis over the lease term. Initial direct costs incurred in negotiating an operating lease are added to the carrying amount of the leased asset and recognized as an expense over the lease term on the same basis as rent income. Contingent rents are recognized as income in the period in which they are earned. Borrowing Costs Borrowing costs are capitalized if they are directly attributable to the acquisition or construction of a qualifying asset. Capitalization of borrowing costs commences when the activities to prepare the asset are in progress and expenditures and borrowing costs are being incurred. Borrowing costs are capitalized until the assets are substantially ready for their intended use. Research Costs Research costs are expensed as incurred. Employee Benefits Short-term Employee Benefits Short-term employee benefits are expensed as the related service is provided. A liability is recognized for the amount expected to be paid if the Group has a present legal or constructive obligation to pay this amount as a result of past service provided by the employee and the obligation can be estimated reliably. Retirement Costs The Company and DBI have separate funded, noncontributory retirement plans, administered by the respective trustees, covering their respective permanent employees. The cost of providing benefits under the defined benefit retirement plan is actuarially determined using the projected unit credit method. Projected unit credit method reflects services rendered by employees to the date of valuation and incorporates assumptions concerning employees’ projected salaries. Actuarial gains and losses are recognized in full in the period in which they occur in other comprehensive income. Such actuarial gains and losses are also immediately recognized in equity and are not reclassified to profit or loss in subsequent period. The net defined benefit retirement liability or asset is the aggregate of the present value of the amount of future benefit that employees have earned in return for their service in the current and prior periods, reduced by the fair value of plan assets (if any), adjusted for any effect of limiting a net defined benefit asset to the asset ceiling. The asset ceiling is the present value of economic benefits available in the form of reductions in future contributions to the plan. Defined benefit costs comprise of the following: Service costs Net interest on the net defined benefit retirement liability or asset Remeasurements of net defined benefit retirement liability or asset Service costs which include current service costs, past service costs and gains or losses on non-routine settlements are recognized as expense in profit or loss. Past service costs are recognized when plan amendment or curtailment occurs. These amounts are calculated periodically by independent qualified actuary using the projected unit credit method.
Celebrating 180 years 57
FINAN
CIAL STATEMEN
TS
56
GIN
EBRA
SAN
MIG
UEL
INC.
2014
Ann
ual R
epor
t
Net interest on the net defined benefit retirement liability or asset is the change during the period as a result of contributions and benefit payments, which is determined by applying the discount rate based on the government bonds to the net defined benefit retirement liability or asset. Net interest on the net defined benefit retirement liability or asset is recognized as expense or income in profit or loss as part of retirement cost. Remeasurements of net defined benefit retirement liability or asset comprising actuarial gains and losses, return on plan assets, and the effect of the asset ceiling (excluding net interest) are recognized immediately in other comprehensive income in the period in which they arise. When the benefits of a plan are changed, or when a plan is curtailed, the resulting change in benefit that relates to past service or the gain or loss on curtailment is recognized immediately in profit or loss. The Group recognizes gains and losses on the settlement of a defined benefit retirement plan when the settlement occurs. Foreign Currency Foreign Currency Translations Transactions in foreign currencies are translated to the respective functional currencies of the Group entities at exchange rates at the dates of the transactions. Monetary assets and monetary liabilities denominated in foreign currencies at the reporting date are retranslated to the functional currency at the exchange rate at that date. The foreign currency gain or loss on monetary items is the difference between amortized cost in the functional currency at the beginning of the year, adjusted for effective interest and payments during the year, and the amortized cost in foreign currency translated at the exchange rate at the reporting date. Nonmonetary assets and nonmonetary liabilities denominated in foreign currencies that are measured at fair value are retranslated to the functional currency at the exchange rate at the date the fair value was determined. Nonmonetary items in foreign currencies that are measured in terms of historical cost are translated using the exchange rate at the date of the transaction. Foreign currency differences arising on retranslation are recognized in profit or loss, except for differences arising on the retranslation of AFS financial assets, a financial liability designated as an effective hedge of the net investment in a foreign operation or qualifying cash flow hedges, which are recognized in other comprehensive income. Foreign Operations The assets and liabilities of foreign operations and fair value adjustments arising on acquisition, are translated to Philippine peso at exchange rates at the reporting date. The income and expenses of foreign operations, excluding foreign operations in hyperinflationary economies, are translated to Philippine peso at average exchange rates for the period.
Foreign currency differences are recognized in other comprehensive income and presented in the “Cumulative translation adjustments” account in the consolidated statements of changes in equity. When a foreign operation is disposed of such that control or joint control is lost, the cumulative amount in the cumulative translation adjustments related to that foreign operation is reclassified to profit or loss as part of the gain or loss on disposal. When the Group disposes of only part of its investment in joint venture that includes a foreign operation while retaining joint control, the relevant proportion of the cumulative amount is reclassified to profit or loss. When the settlement of a monetary item receivable from or payable to a foreign operation is neither planned nor likely to occur in the foreseeable future, foreign exchange gains and losses arising from such a monetary item are considered to form part of a net investment in a foreign operation and are recognized in other comprehensive income and presented in the “Cumulative translation adjustments” account in the consolidated statements of changes in equity. The functional currency of GSMIL, GSMIHL and SHL is the Philippine peso, while that of Thai San Miguel Liquor Co. Ltd. (TSML) and Thai Ginebra Trading (TGT) is the Thailand Baht (THB). The assets and liabilities of TSML and TGT are translated into the presentation currency of the Company at the rate of exchange ruling at the reporting date and their income and expenses are translated at the average exchange rates for the year. Taxes Current Tax. Current tax is the expected tax payable or receivable on the taxable income or loss for the year, using tax rates enacted or substantively enacted at the reporting date, and any adjustment to tax payable in respect of previous years. Deferred Tax. Deferred tax is recognized in respect of temporary differences between the carrying amounts of assets and liabilities for financial reporting purposes and the amounts used for taxation purposes. Deferred tax liabilities are recognized for all taxable temporary differences, except: where the deferred tax liability arises from the initial recognition of goodwill
or of an asset or liability in a transaction that is not a business combination and, at the time of the transaction, affects neither the accounting profit nor taxable profit or loss; and
with respect to taxable temporary differences associated with investments in
subsidiaries and interests in joint ventures, where the timing of the reversal of the temporary differences can be controlled and it is probable that the temporary differences will not reverse in the foreseeable future.
Celebrating 180 years 59
FINAN
CIAL STATEMEN
TS
58
GIN
EBRA
SAN
MIG
UEL
INC.
2014
Ann
ual R
epor
t
Deferred tax assets are recognized for all deductible temporary differences, carryforward benefits of unused tax credits - Minimum Corporate Income Tax (MCIT) and unused tax losses - Net Operating Loss Carry Over (NOLCO), to the extent that it is probable that taxable profit will be available against which the deductible temporary differences, and the carryforward benefits of MCIT and NOLCO can be utilized, except: where the deferred tax asset relating to the deductible temporary difference
arises from the initial recognition of an asset or liability in a transaction that is not a business combination and, at the time of the transaction, affects neither the accounting profit nor taxable profit or loss; and
with respect to deductible temporary differences associated with investments
in subsidiaries and interests in joint ventures, deferred tax assets are recognized only to the extent that it is probable that the temporary differences will reverse in the foreseeable future and taxable profit will be available against which the temporary differences can be utilized.
The carrying amount of deferred tax assets is reviewed at each reporting date and reduced to the extent that it is no longer probable that sufficient taxable profit will be available to allow all or part of the deferred tax asset to be utilized. Unrecognized deferred tax assets are reassessed at each reporting date and are recognized to the extent that it has become probable that future taxable profit will allow the deferred tax asset to be recovered. The measurement of deferred tax reflects the tax consequences that would follow the manner in which the Group expects, at the end of the reporting period, to recover or settle the carrying amount of its assets and liabilities. Deferred tax assets and liabilities are measured at the tax rates that are expected to apply in the year when the asset is realized or the liability is settled, based on tax rates (and tax laws) that have been enacted or substantively enacted at the reporting date. In determining the amount of current and deferred tax, the Group takes into account the impact of uncertain tax positions and whether additional taxes and interest may be due. The Group believes that its accruals for tax liabilities are adequate for all open tax years based on its assessment of many factors, including interpretation of tax laws and prior experience. This assessment relies on estimates and assumptions and may involve a series of judgments about future events. New information may become available that causes the Group to change its judgment regarding the adequacy of existing tax liabilities; such changes to tax liabilities will impact tax expense in the period that such a determination is made. Current tax and deferred tax are recognized in profit or loss except to the extent that it relates to a business combination, or items recognized directly in equity or in other comprehensive income. Deferred tax assets and deferred tax liabilities are offset, if a legally enforceable right exists to set off current tax assets against current tax liabilities and the deferred taxes relate to the same taxable entity and the same taxation authority.
Value-added Tax (VAT). Revenues, expenses and assets are recognized net of the amount of VAT, except: where the tax incurred on a purchase of assets or services is not recoverable
from the taxation authority, in which case the tax is recognized as part of the cost of acquisition of the asset or as part of the expense item as applicable; and
receivables and payables that are stated with the amount of tax included. The net amount of tax recoverable from, or payable to, the taxation authority is included as part of “Prepaid taxes and other current assets” or “Income and other taxes payable” accounts in the consolidated statements of financial position. Related Parties Parties are considered to be related if one party has the ability, directly or indirectly, to control the other party or exercise significant influence over the other party in making financial and operating decisions. Parties are also considered to be related if they are subject to common control and significant influence. Related parties may be individuals or corporate entities. Transactions between related parties are on an arm’s length basis in a manner similar to transactions with non-related parties. Basic and Diluted Earnings Per Common Share (EPS) Basic EPS is computed by dividing the net income (loss) for the period attributable to equity holders of the Company, net of dividends on preferred shares, by the weighted average number of issued and outstanding common shares during the period, with retroactive adjustment for any stock dividends declared. Diluted EPS is computed in the same manner, adjusted for the effects of the shares issuable to employees and executives under the ESPP of the Company, which are assumed to be exercised at the date of grant. Where the effect of the assumed conversion of shares issuable to employees and executives under the stock purchase plan of the Company would be anti-dilutive, diluted EPS is not presented. Operating Segments The Group’s operating segments are organized and managed separately according to the nature of the products and services provided, with each segment representing a strategic business unit that offers different products and serves different markets. Financial information on operating segments is presented in Note 6 to the consolidated financial statements. The President (the chief operating decision maker) reviews management reports on a regular basis. The measurement policies the Group used for segment reporting under PFRS 8 are the same as those used in the consolidated financial statements. There have been no changes in the measurement methods used to determine reported segment profit or loss from prior periods. All inter-segment transfers are carried out at arm’s length prices.
Celebrating 180 years 61
FINAN
CIAL STATEMEN
TS
60
GIN
EBRA
SAN
MIG
UEL
INC.
2014
Ann
ual R
epor
t
Contingencies Contingent liabilities are not recognized in the consolidated financial statements. They are disclosed in the notes to the consolidated financial statements unless the possibility of an outflow of resources embodying economic benefits is remote. Contingent assets are not recognized in the consolidated financial statements but are disclosed in the notes to the consolidated financial statements when an inflow of economic benefits is probable. Events After the Reporting Date Post year-end events that provide additional information about the Group’s financial position at the reporting date (adjusting events) are reflected in the consolidated financial statements. Post year-end events that are not adjusting events are disclosed in the notes to the consolidated financial statements when material.
4. Significant Accounting Judgments, Estimates and Assumptions The preparation of the consolidated financial statements in accordance with PFRS requires management to make judgments, estimates and assumptions that affect the application of accounting policies and the amounts of assets, liabilities, income and expenses reported in the consolidated financial statements at the reporting date. However, uncertainty about these judgments, estimates and assumptions could result in an outcome that could require a material adjustment to the carrying amount of the affected asset or liability in the future. Judgments and estimates are continually evaluated and are based on historical experience and other factors, including expectations of future events that are believed to be reasonable under the circumstances. Revisions are recognized in the period in which the judgments and estimates are revised and in any future period affected. Judgments In the process of applying the Group’s accounting policies, management has made the following judgments, apart from those involving estimations, which have the most significant effect on the amounts recognized in the consolidated financial statements: Operating Lease Commitments - Group as Lessor/Lessee. The Group has entered into various lease agreements either as a lessor or a lessee. The Group had determined that it retains all the significant risks and rewards of ownership of the property leased out on operating leases while the significant risks and rewards for property leased from third parties are retained by the lessors. Rent income recognized in the consolidated statements of income amounted to P8,072 in 2014 (Notes 27 and 29). Rent expense recognized in the consolidated statements of income from continuing and discontinued operations amounted to P153,827, P166,032 and P233,768 in 2014, 2013 and 2012, respectively (Notes 21, 22, 23 and 29).
Classification of Joint Arrangements. The Group has determined that it has rights only to the net assets of TSML and TGT based on the structure, legal form, contractual terms and other facts and circumstances of the arrangement. As such, the Group classified its joint arrangements as joint ventures (Note 12). Distinguishing between Property, Plant and Equipment and Investment Property The Group determines whether a property qualifies as an investment property. In making its judgment, the Group considers whether the property generates cash flows largely independent of the other assets held by an entity. Owner-occupied property generate cash flows that are attributable not only to the property but also to other assets used in the production or supply process. Some property comprises a portion that is held to earn rental or for capital appreciation and another portion that is held for use in the production and supply of goods and services or for administrative purposes. If these portions can be sold separately (or lease out separately under finance lease), the Group accounts for the portions separately. If the portion cannot be sold separately, the property is accounted for as investment property only if an insignificant portion is held for use in the production or supply of goods or services or for administrative purposes. Judgment is applied in determining whether ancillary services are so significant that a property does not qualify as investment property. The Group considers each property separately in making its judgment. As a result of the change in use of investment property, from being held to earn rental to owner-occupied, the investment property was transferred to property, plant and equipment in 2013. Contingencies. The Group is currently involved in various pending claims and lawsuits which could be decided in favor of or against the Group. The Group’s estimate of the probable costs for the resolution of these pending claims and lawsuits has been developed in consultation with in-house as well as outside legal counsel handling the prosecution and defense of these matters and is based on an analysis of potential results. The Group currently does not believe that these pending claims and lawsuits will have a material adverse effect on its financial position and financial performance. It is possible, however, that future financial performance could be materially affected by the changes in the estimates or in the effectiveness of strategies relating to these proceedings. No accruals were made in relation to these proceedings (Note 35). Estimates and Assumptions The key estimates and assumptions used in the consolidated financial statements are based upon management’s evaluation of relevant facts and circumstances as of the date of the consolidated financial statements. Actual results could differ from such estimates. Fair Value Measurements. A number of the Group’s accounting policies and disclosures require the measurement of fair values for both financial and non-financial assets and liabilities.
Celebrating 180 years 63
FINAN
CIAL STATEMEN
TS
62
GIN
EBRA
SAN
MIG
UEL
INC.
2014
Ann
ual R
epor
t
The Group has an established control framework with respect to the measurement of fair values. This includes a valuation team that has overall responsibility for overseeing all significant fair value measurements, including Level 3 fair values. The valuation team regularly reviews significant unobservable inputs and valuation adjustments. If third party information is used to measure fair values, then the valuation team assesses the evidence obtained to support the conclusion that such valuations meet the requirements of PFRS, including the level in the fair value hierarchy in which such valuations should be classified. The Group uses market observable data when measuring the fair value of an asset or liability. Fair values are categorized into different levels in a fair value hierarchy based on the inputs used in the valuation techniques (Note 3). If the inputs used to measure the fair value of an asset or a liability can be categorized in different levels of the fair value hierarchy, then the fair value measurement is categorized in its entirety in the same level of the fair value hierarchy based on the lowest level input that is significant to the entire measurement. The Group recognizes transfers between levels of the fair value hierarchy at the end of the reporting period during which the change has occurred. The methods and assumptions used to estimate the fair values for both financial and non-financial assets and liabilities are discussed in Note 34. Allowance for Impairment Losses on Trade and Other Receivables. Provisions are made for specific and groups of accounts, where objective evidence of impairment exists. The Group evaluates these accounts on the basis of factors that affect the collectability of the accounts. These factors include, but are not limited to, the length of the Group’s relationship with the customers and counterparties, the current credit status based on third party credit reports and known market forces, average age of accounts, collection experience and historical loss experience. The amount and timing of the recorded expenses for any period would differ if the Group made different judgments or utilized different methodologies. An increase in the allowance for impairment losses would increase the recorded selling and marketing expenses and decrease current assets. The allowance for impairment losses on trade and other receivables amounted to P189,274 and P108,194 as of December 31, 2014 and 2013, respectively (Note 9). The carrying amounts of trade and other receivables amounted to P3,259,859 and P3,770,087 as of December 31, 2014 and 2013, respectively (Note 9). Write-down of Inventory. The Group writes-down the cost of inventory to net realizable value whenever net realizable value becomes lower than cost due to damage, physical deterioration, obsolescence, changes in price levels or other causes.
Estimates of net realizable value are based on the most reliable evidence available at the time the estimates are made of the amount the inventories are expected to be realized. These estimates take into consideration fluctuations of price or cost directly relating to events occurring after the reporting date to the extent that such events confirm conditions existing at the reporting date. The write-down of inventories amounted to P137,904 and P69,904 as of December 31, 2014 and 2013, respectively. The carrying amount of inventories amounted to P2,657,224 and P3,747,328 as of December 31, 2014 and 2013, respectively (Note 10). Estimated Useful Lives of Property, Plant and Equipment and Deferred Containers. The Group estimates the useful lives of property, plant and equipment and deferred containers based on the period over which the assets are expected to be available for use. The estimated useful lives of property, plant and equipment and deferred containers are reviewed periodically and are updated if expectations differ from previous estimates due to physical wear and tear, technical or commercial obsolescence and legal or other limits on the use of the assets. In addition, estimation of the useful lives of property, plant and equipment and deferred containers is based on collective assessment of industry practice, internal technical evaluation and experience with similar assets. It is possible, however, that future financial performance could be materially affected by changes in estimates brought about by changes in factors mentioned above. The amounts and timing of recorded expenses for any period would be affected by changes in these factors and circumstances. A reduction in the estimated useful lives of property, plant and equipment and deferred containers would increase the recorded cost of sales, selling and marketing expenses, general and administrative expenses and decrease noncurrent assets. Property, plant and equipment, net of accumulated depreciation and amortization amounted to P6,244,426 and P6,845,544 as of December 31, 2014 and 2013, respectively. Accumulated depreciation and amortization of property, plant and equipment amounted to P6,885,820 and P6,645,143 as of December 31, 2014 and 2013, respectively (Note 13). Deferred containers, net of accumulated amortization, included as part of “Other noncurrent assets” account in the consolidated statements of financial position amounted to P334,548 and P551,217 as of December 31, 2014 and 2013, respectively (Note 15). Impairment of Goodwill with Indefinite Useful Life. The Group determines whether goodwill is impaired at least annually. This requires the estimation of value in use of the cash-generating units to which the goodwill is allocated. Estimating value in use requires management to make an estimate of the expected future cash flows from the cash-generating unit and to choose a suitable discount rate to calculate the present value of those cash flows. The carrying amount of goodwill amounted to P226,863 as of December 31, 2014 and 2013 (Note 5).
Celebrating 180 years 65
FINAN
CIAL STATEMEN
TS
64
GIN
EBRA
SAN
MIG
UEL
INC.
2014
Ann
ual R
epor
t
Acquisition Accounting. The Group accounts for acquired businesses using the acquisition method of accounting which requires that the assets acquired and the liabilities assumed are recognized at the date of acquisition based on their respective fair values. The application of the acquisition method requires certain estimates and assumptions concerning the determination of the fair values of acquired intangible assets and property, plant and equipment, as well as liabilities assumed at the acquisition date. Moreover, the useful lives of the acquired intangible assets and property, plant and equipment have to be determined. Accordingly, for significant acquisitions, the Group obtains assistance from valuation specialists. The valuations are based on information available at the acquisition date. The Group’s acquisitions have resulted in goodwill. The carrying amount of goodwill arising from business combinations in 2012 amounted to P226,863 (Note 5). Realizability of Deferred Tax Assets. The Group reviews its deferred tax assets at each reporting date and reduces the carrying amount to the extent that it is no longer probable that sufficient taxable profit will be available to allow all or part of the deferred tax assets to be utilized. The Group’s assessment on the recognition of deferred tax assets on deductible temporary difference and carryforward benefits of MCIT and NOLCO is based on the projected taxable income in the following periods. Deferred tax assets amounted to P1,116,010 and P1,510,886 as of December 31, 2014 and 2013, respectively (Note 19). Impairment of Non-financial Assets. PFRS requires that an impairment review be performed on investments in joint ventures, property, plant and equipment, deferred containers and idle assets when events or changes in circumstances indicate that the carrying amount may not be recoverable. Determining the recoverable amounts of these assets requires the estimation of cash flows expected to be generated from the continued use and ultimate disposition of such assets. While it is believed that the assumptions used in the estimation of fair values reflected in the consolidated financial statements are appropriate and reasonable, significant changes in these assumptions may materially affect the assessment of recoverable amounts and any resulting impairment loss could have a material adverse impact on the financial performance. Accumulated impairment losses on property, plant and equipment amounted to P307,600 as of December 31, 2014 and 2013 (Note 13). The combined carrying amounts of investments in joint ventures, property, plant and equipment, deferred containers and idle assets amounted to P6,930,862 and P7,820,902 as of December 31, 2014 and 2013, respectively (Notes 12, 13 and 15). Present Value of Defined Benefit Retirement Obligation. The present value of the defined benefit retirement obligation depends on a number of factors that are determined on an actuarial basis using a number of assumptions. These assumptions are described in Note 30 to the consolidated financial statements and include discount rate and salary increase rate.
The Group determines the appropriate discount rate at the end of each reporting period. It is the interest rate that should be used to determine the present value of estimated future cash outflows expected to be required to settle the retirement obligations. In determining the appropriate discount rate, the Group considers the interest rates on government bonds that are denominated in the currency in which the benefits will be paid. The terms to maturity of these bonds should approximate the terms of the related retirement obligation. Other key assumptions for the defined benefit retirement obligation are based in part on current market conditions. While it is believed that the Group’s assumptions are reasonable and appropriate, significant differences in actual experience or significant changes in assumptions may materially affect the Group’s defined benefit retirement obligation. The present value of defined benefit retirement obligation amounted to P763,688 and P844,432 as of December 31, 2014 and 2013, respectively (Note 30). Asset Retirement Obligation. Determining the ARO requires estimation of the costs of dismantling, installing and restoring leased properties to their original condition. The Group determined that there are no significant ARO as of December 31, 2014 and 2013. While it is believed that the assumptions used in the estimation of such costs are reasonable, significant changes in these assumptions may materially affect the recorded expense or obligation in future periods.
5. Goodwill On January 27, 2012, GSMI acquired 100% of the outstanding capital stock of EPSBPI for P200,000. EPSBPI, which is considered a CGU, is a company primarily engaged in the manufacturing and bottling of alcoholic and nonalcoholic beverages. Goodwill was recognized as a result of the acquisition as follows:
2012
Total consideration transferred P200,000 Total identifiable net liabilities at fair value 26,863
Goodwill P226,863
Goodwill arising from the acquisition is attributable to the benefit of expected synergies with the Group’s beverage business, revenue growth and future development specifically on tolling services with third parties.
Celebrating 180 years 67
FINAN
CIAL STATEMEN
TS
66
GIN
EBRA
SAN
MIG
UEL
INC.
2014
Ann
ual R
epor
t
The recoverable amount of goodwill has been determined based on a valuation using cash flow projections covering a five-year period based on long range plans approved by management. Cash flows beyond the five-year period are extrapolated using a constant growth rate determined per individual cash-generating unit. This growth rate is consistent with the long-term average growth rate for the industry. The discount rate applied to after tax cash flow projections is 12% in 2014 and 2013. The discount rate also imputes the risk of the cash-generating units compared to the respective risk of the overall market and equity risk premium. No impairment loss was recognized in 2014 and 2013. Management believes that any reasonably possible change in the key assumptions on which the recoverable amount is based would not cause its carrying amount to exceed its recoverable amount. The calculations of value in use are most sensitive to the following assumptions: Gross Margins. Gross margins are based on average values achieved in the
period immediately before the budget period. These are increases over the budget period for anticipated efficiency improvements. Values assigned to key assumptions reflect past experience, except for efficiency improvement.
Discount Rates. The Group uses the weighted-average cost of capital as the discount rate, which reflects management’s estimate of the risk specific to each unit. This is the benchmark used by management to assess operating performance and to evaluate future investments proposals.
Raw Material Price Inflation. Consumer price forecast is obtained from indices during the budget period from which raw materials are purchased. Values assigned to key assumptions are consistent with external sources of information.
6. Segment Information Operating Segments The reporting format of the Group’s operating segments is determined based on the Group’s risks and rates of return which are affected predominantly by differences in the products and services produced. The operating businesses are organized and managed separately according to the nature of the products produced and services provided, with each segment representing a strategic business unit that offers different products and serves different markets. The Group is organized into two major operating segments namely alcoholic and nonalcoholic beverages (NAB). The alcoholic segment produces and markets alcoholic beverages. The nonalcoholic segment is involved in the production and marketing of NAB. For each of the operating segments, the chief operating decision maker reviews internal management reports on at least monthly basis.
Segment Assets and Liabilities Segment assets include all operating assets used by a segment and consist primarily of operating cash, receivables, inventories, assets held for sale and property, plant and equipment, net of allowances, accumulated depreciation and amortization, and impairment. Segment liabilities include all operating liabilities and consist primarily of trade and other payables and income and other taxes payable. Segment assets and liabilities do not include deferred taxes. Major Customer The Group does not have a single external customer from which sales revenue generated amounted to 10% or more of the total revenues of the Group. The Group’s revenue from external customers and noncurrent assets are mainly in the Philippines.
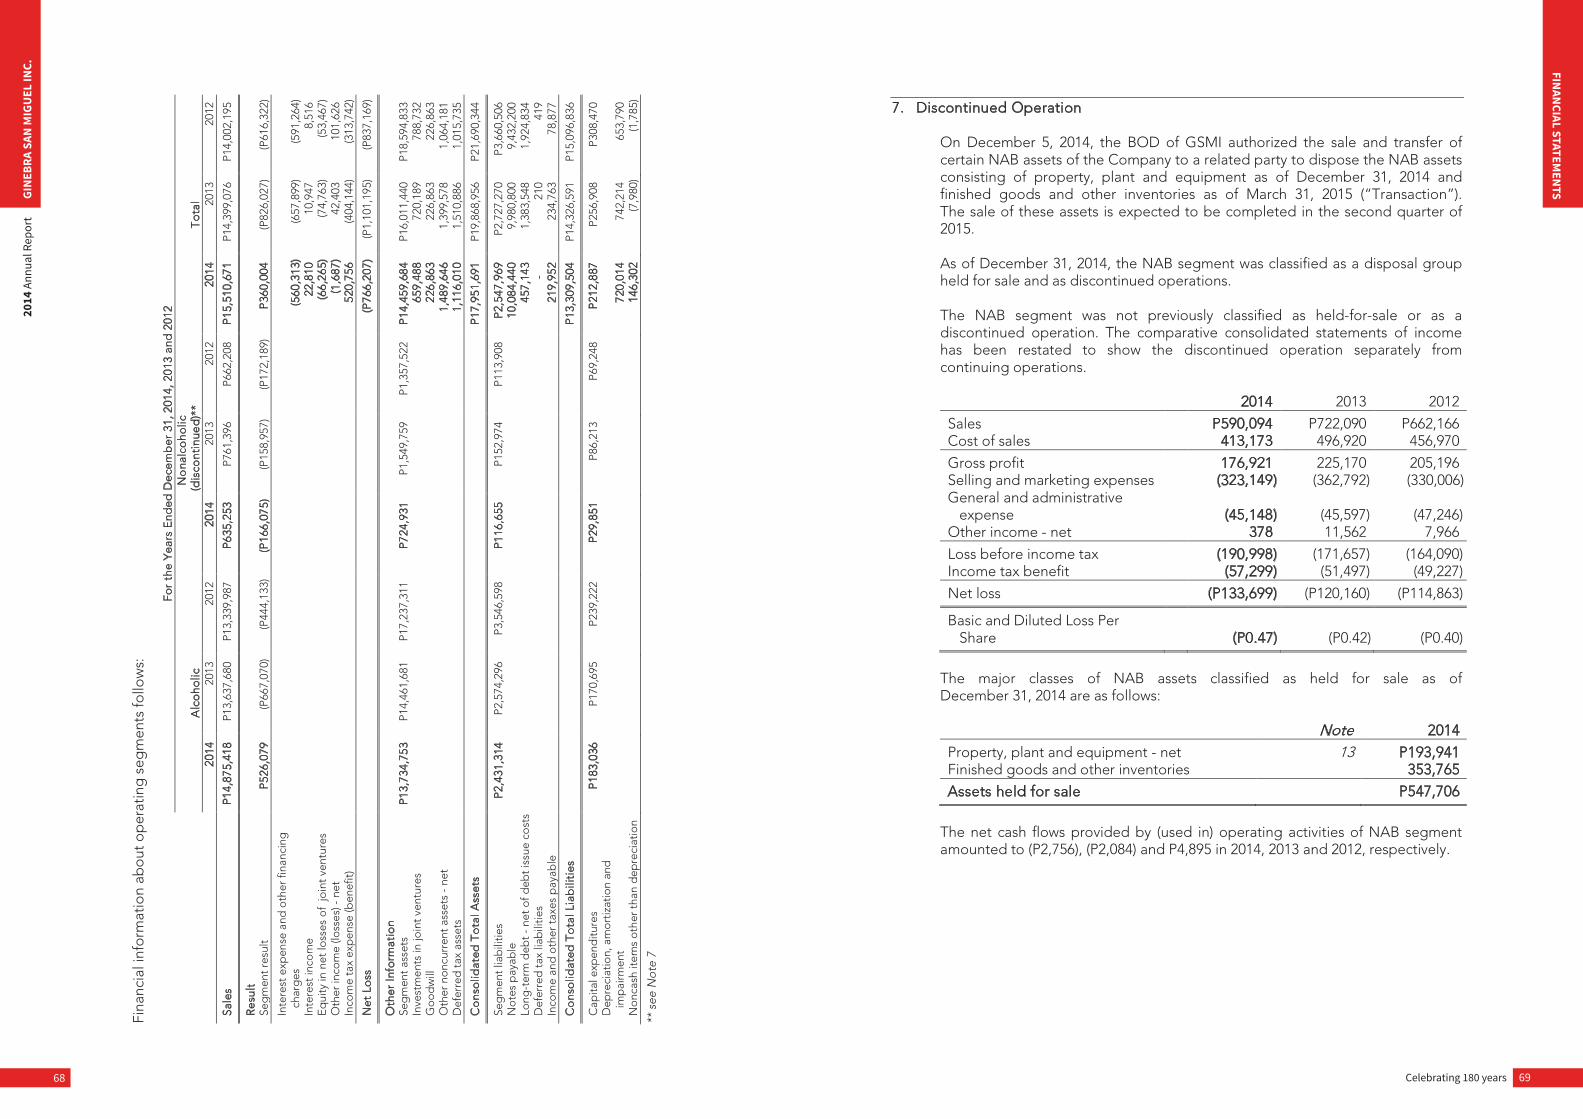
Celebrating 180 years 69
FINAN
CIAL STATEMEN
TS
68
GIN
EBRA
SAN
MIG
UEL
INC.
2014
Ann
ual R
epor
t
Fina
ncia
l inf
orm
atio
n ab
out
op
erat
ing
seg
men
ts fo
llow
s:
For
the
Yea
rs E
nded
Dec
emb
er
31, 2
014,
201
3 an
d 2
012
A
lco
holic
N
ona
lco
holic
(dis
cont
inue
d)*
* T
ota
l
2014
20
13
2012
20
14
2013
20
12
2014
20
13
2012
Sale
s P
14,8
75,4
18
P13,
637,
680
P13,
339,
987
P63
5,25
3 P7
61,3
96
P662
,208
P
15,5
10,6
71
P14,
399,
076
P14,
002,
195
Res
ult
Se
gm
ent r
esul
t P
526,
079
(P66
7,07
0)
(P44
4,13
3)
(P16
6,07
5)
(P15
8,95
7)
(P17
2,18
9)
P36
0,00
4 (P
826,
027)
(P
616,
322)
Inte
rest
exp
ense
and
oth
er fi
nanc
ing
ch
arg
es
(560
,313
) (6
57,8
99)
(591
,264
) In
tere
st in
com
e
22
,810
10
,947
8,
516
Eq
uity
in n
et lo
sses
of
join
t ven
ture
s
(6
6,26
5)
(74,
763)
(5
3,46
7)
Oth
er in
com
e (lo
sses
) - n
et
(1,6
87)
42,4
03
101,
626
Inco
me
tax
exp
ense
(ben
efit)
52
0,75
6 (4
04,1
44)
(313
,742
)
Net
Lo
ss
(P76
6,20
7)
(P1,
101,
195)
(P
837,
169)
Oth
er In
form
atio
n
Seg
men
t ass
ets
P13
,734
,753
P1
4,46
1,68
1 P1
7,23
7,31
1 P
724,
931
P1,5
49,7
59
P1,3
57,5
22
P14
,459
,684
P1
6,01
1,44
0 P1
8,59
4,83
3 In
vest
men
ts in
join
t ve
ntur
es
659,
488
720,
189
788,
732
Go
od
will
22
6,86
3 22
6,86
3 22
6,86
3 O
ther
non
curr
ent a
sset
s -
net
1,48
9,64
6 1,
399,
578
1,06
4,18
1 D
efer
red
tax
asse
ts
1,11
6,01
0 1,
510,
886
1,01
5,73
5
Co
nso
lidat
ed T
ota
l Ass
ets
P17
,951
,691
P1
9,86
8,95
6 P2
1,69
0,34
4
Seg
men
t lia
bili
ties
P2,
431,
314
P2,5
74,2
96
P3,5
46,5
98
P11
6,65
5 P1
52,9
74
P113
,908
P
2,54
7,96
9 P2
,727
,270
P3
,660
,506
N
ote
s p
ayab
le
10,0
84,4
40
9,98
0,80
0 9,
432,
200
Long
-ter
m d
ebt
- ne
t of d
ebt i
ssue
co
sts
457,
143
1,38
3,54
8 1,
924,
834
Def
erre
d ta
x lia
bili
ties
-
21
0 41
9 In
com
e an
d o
ther
taxe
s p
ayab
le
219,
952
234,
763
78,8
77
Co
nso
lidat
ed T
ota
l Lia
bili
ties
P
13,3
09,5
04
P14,
326,
591
P15,
096,
836
Cap
ital e
xpen
ditu
res
P18
3,03
6 P1
70,6
95
P239
,222
P
29,8
51
P86,
213
P69,
248
P21
2,88
7 P2
56,9
08
P308
,470
D
epre
ciat
ion,
am
ortiz
atio
n an
d
imp
airm
ent
720,
014
742,
214
653,
790
No
ncas
h ite
ms
othe
r tha
n d
epre
ciat
ion
146,
302
(7,9
80)
(1,7
85)
** s
ee N
ote
7
7. Discontinued Operation On December 5, 2014, the BOD of GSMI authorized the sale and transfer of certain NAB assets of the Company to a related party to dispose the NAB assets consisting of property, plant and equipment as of December 31, 2014 and finished goods and other inventories as of March 31, 2015 (“Transaction”). The sale of these assets is expected to be completed in the second quarter of 2015. As of December 31, 2014, the NAB segment was classified as a disposal group held for sale and as discontinued operations. The NAB segment was not previously classified as held-for-sale or as a discontinued operation. The comparative consolidated statements of income has been restated to show the discontinued operation separately from continuing operations.
2014 2013 2012
Sales P590,094 P722,090 P662,166 Cost of sales 413,173 496,920 456,970
Gross profit 176,921 225,170 205,196 Selling and marketing expenses (323,149) (362,792) (330,006) General and administrative
expense (45,148) (45,597) (47,246) Other income - net 378 11,562 7,966
Loss before income tax (190,998) (171,657) (164,090) Income tax benefit (57,299) (51,497) (49,227)
Net loss (P133,699) (P120,160) (P114,863)
Basic and Diluted Loss Per Share (P0.47) (P0.42) (P0.40)
The major classes of NAB assets classified as held for sale as of December 31, 2014 are as follows:
Note 2014
Property, plant and equipment - net 13 P193,941 Finished goods and other inventories 353,765
Assets held for sale P547,706
The net cash flows provided by (used in) operating activities of NAB segment amounted to (P2,756), (P2,084) and P4,895 in 2014, 2013 and 2012, respectively.
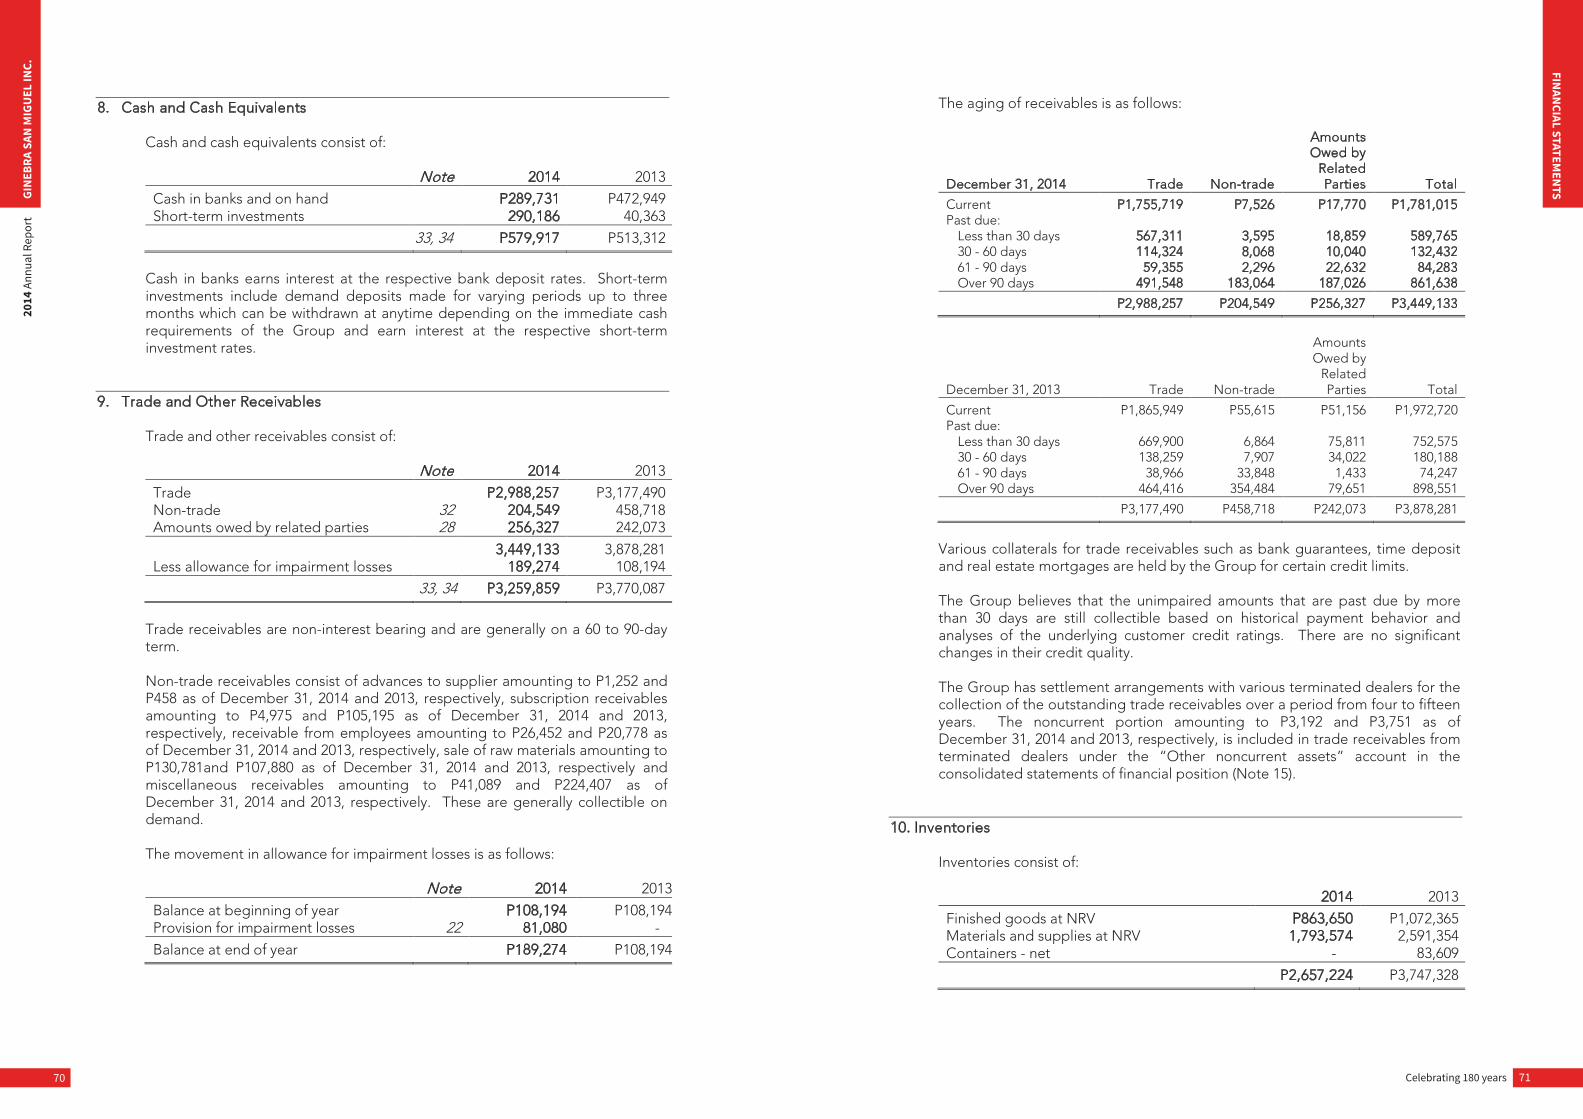
Celebrating 180 years 71
FINAN
CIAL STATEMEN
TS
70
GIN
EBRA
SAN
MIG
UEL
INC.
2014
Ann
ual R
epor
t
8. Cash and Cash Equivalents Cash and cash equivalents consist of:
Note 2014 2013
Cash in banks and on hand P289,731 P472,949 Short-term investments 290,186 40,363
33, 34 P579,917 P513,312
Cash in banks earns interest at the respective bank deposit rates. Short-term investments include demand deposits made for varying periods up to three months which can be withdrawn at anytime depending on the immediate cash requirements of the Group and earn interest at the respective short-term investment rates.
9. Trade and Other Receivables Trade and other receivables consist of:
Note 2014 2013
Trade P2,988,257 P3,177,490 Non-trade 32 204,549 458,718 Amounts owed by related parties 28 256,327 242,073
3,449,133 3,878,281 Less allowance for impairment losses 189,274 108,194
33, 34 P3,259,859 P3,770,087
Trade receivables are non-interest bearing and are generally on a 60 to 90-day term. Non-trade receivables consist of advances to supplier amounting to P1,252 and P458 as of December 31, 2014 and 2013, respectively, subscription receivables amounting to P4,975 and P105,195 as of December 31, 2014 and 2013, respectively, receivable from employees amounting to P26,452 and P20,778 as of December 31, 2014 and 2013, respectively, sale of raw materials amounting to P130,781and P107,880 as of December 31, 2014 and 2013, respectively and miscellaneous receivables amounting to P41,089 and P224,407 as of December 31, 2014 and 2013, respectively. These are generally collectible on demand. The movement in allowance for impairment losses is as follows: Note 2014 2013
Balance at beginning of year P108,194 P108,194 Provision for impairment losses 22 81,080 -
Balance at end of year P189,274 P108,194
The aging of receivables is as follows:
December 31, 2014 Trade Non-trade
Amounts Owed by
Related Parties Total
Current P1,755,719 P7,526 P17,770 P1,781,015 Past due:
Less than 30 days 567,311 3,595 18,859 589,765 30 - 60 days 114,324 8,068 10,040 132,432 61 - 90 days 59,355 2,296 22,632 84,283 Over 90 days 491,548 183,064 187,026 861,638
P2,988,257 P204,549 P256,327 P3,449,133
December 31, 2013 Trade Non-trade
Amounts Owed by
Related Parties Total
Current P1,865,949 P55,615 P51,156 P1,972,720 Past due:
Less than 30 days 669,900 6,864 75,811 752,575 30 - 60 days 138,259 7,907 34,022 180,188 61 - 90 days 38,966 33,848 1,433 74,247 Over 90 days 464,416 354,484 79,651 898,551
P3,177,490 P458,718 P242,073 P3,878,281
Various collaterals for trade receivables such as bank guarantees, time deposit and real estate mortgages are held by the Group for certain credit limits. The Group believes that the unimpaired amounts that are past due by more than 30 days are still collectible based on historical payment behavior and analyses of the underlying customer credit ratings. There are no significant changes in their credit quality. The Group has settlement arrangements with various terminated dealers for the collection of the outstanding trade receivables over a period from four to fifteen years. The noncurrent portion amounting to P3,192 and P3,751 as of December 31, 2014 and 2013, respectively, is included in trade receivables from terminated dealers under the “Other noncurrent assets” account in the consolidated statements of financial position (Note 15).
10. Inventories Inventories consist of:
2014 2013
Finished goods at NRV P863,650 P1,072,365 Materials and supplies at NRV 1,793,574 2,591,354 Containers - net - 83,609
P2,657,224 P3,747,328
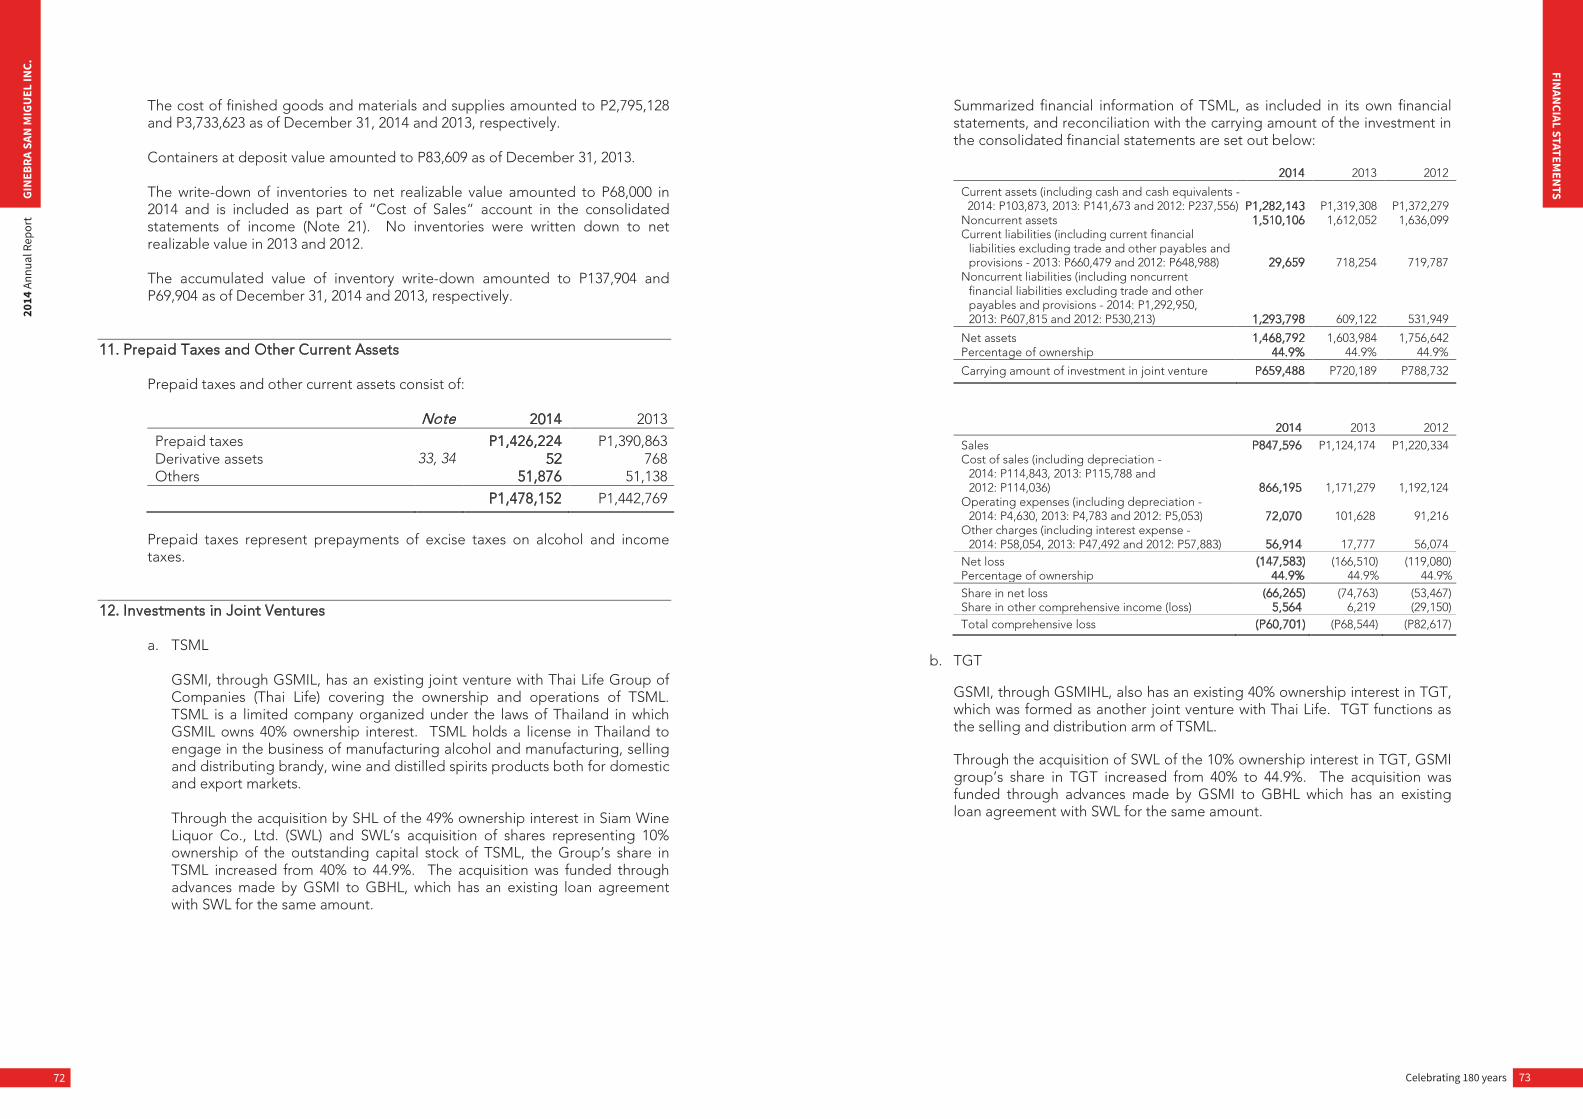
Celebrating 180 years 73
FINAN
CIAL STATEMEN
TS
72
GIN
EBRA
SAN
MIG
UEL
INC.
2014
Ann
ual R
epor
t
The cost of finished goods and materials and supplies amounted to P2,795,128 and P3,733,623 as of December 31, 2014 and 2013, respectively. Containers at deposit value amounted to P83,609 as of December 31, 2013. The write-down of inventories to net realizable value amounted to P68,000 in 2014 and is included as part of “Cost of Sales” account in the consolidated statements of income (Note 21). No inventories were written down to net realizable value in 2013 and 2012. The accumulated value of inventory write-down amounted to P137,904 and P69,904 as of December 31, 2014 and 2013, respectively.
11. Prepaid Taxes and Other Current Assets Prepaid taxes and other current assets consist of:
Note 2014 2013
Prepaid taxes P1,426,224 P1,390,863 Derivative assets 33, 34 52 768 Others 51,876 51,138
P1,478,152 P1,442,769
Prepaid taxes represent prepayments of excise taxes on alcohol and income taxes.
12. Investments in Joint Ventures a. TSML
GSMI, through GSMIL, has an existing joint venture with Thai Life Group of Companies (Thai Life) covering the ownership and operations of TSML. TSML is a limited company organized under the laws of Thailand in which GSMIL owns 40% ownership interest. TSML holds a license in Thailand to engage in the business of manufacturing alcohol and manufacturing, selling and distributing brandy, wine and distilled spirits products both for domestic and export markets. Through the acquisition by SHL of the 49% ownership interest in Siam Wine Liquor Co., Ltd. (SWL) and SWL’s acquisition of shares representing 10% ownership of the outstanding capital stock of TSML, the Group’s share in TSML increased from 40% to 44.9%. The acquisition was funded through advances made by GSMI to GBHL, which has an existing loan agreement with SWL for the same amount.
Summarized financial information of TSML, as included in its own financial statements, and reconciliation with the carrying amount of the investment in the consolidated financial statements are set out below:
2014 2013 2012
Current assets (including cash and cash equivalents - 2014: P103,873, 2013: P141,673 and 2012: P237,556) P1,282,143 P1,319,308 P1,372,279 Noncurrent assets 1,510,106 1,612,052 1,636,099 Current liabilities (including current financial
liabilities excluding trade and other payables and provisions - 2013: P660,479 and 2012: P648,988) 29,659 718,254 719,787
Noncurrent liabilities (including noncurrent financial liabilities excluding trade and other payables and provisions - 2014: P1,292,950, 2013: P607,815 and 2012: P530,213) 1,293,798 609,122 531,949
Net assets 1,468,792 1,603,984 1,756,642 Percentage of ownership 44.9% 44.9% 44.9%
Carrying amount of investment in joint venture P659,488 P720,189 P788,732
2014 2013 2012 Sales P847,596 P1,124,174 P1,220,334 Cost of sales (including depreciation -
2014: P114,843, 2013: P115,788 and 2012: P114,036) 866,195 1,171,279 1,192,124
Operating expenses (including depreciation - 2014: P4,630, 2013: P4,783 and 2012: P5,053) 72,070 101,628 91,216
Other charges (including interest expense - 2014: P58,054, 2013: P47,492 and 2012: P57,883) 56,914 17,777 56,074
Net loss (147,583) (166,510) (119,080) Percentage of ownership 44.9% 44.9% 44.9% Share in net loss (66,265) (74,763) (53,467) Share in other comprehensive income (loss) 5,564 6,219 (29,150) Total comprehensive loss (P60,701) (P68,544) (P82,617)
b. TGT
GSMI, through GSMIHL, also has an existing 40% ownership interest in TGT, which was formed as another joint venture with Thai Life. TGT functions as the selling and distribution arm of TSML. Through the acquisition of SWL of the 10% ownership interest in TGT, GSMI group’s share in TGT increased from 40% to 44.9%. The acquisition was funded through advances made by GSMI to GBHL which has an existing loan agreement with SWL for the same amount.
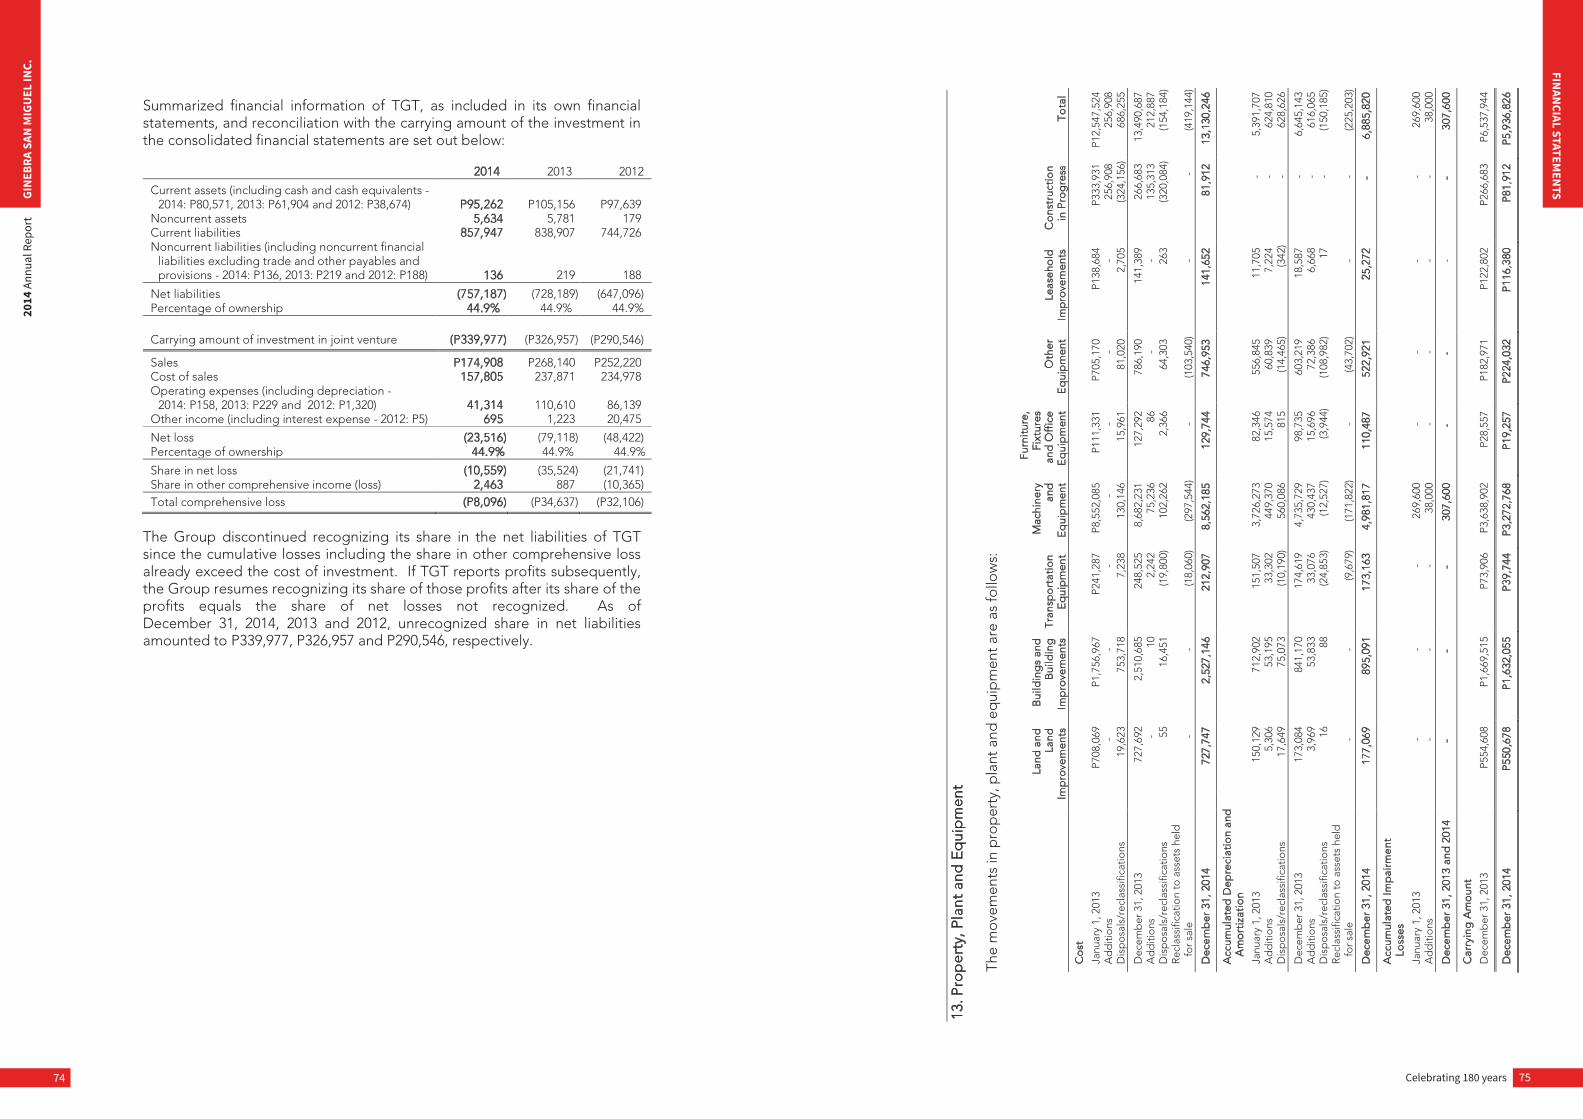
Celebrating 180 years 75
FINAN
CIAL STATEMEN
TS
74
GIN
EBRA
SAN
MIG
UEL
INC.
2014
Ann
ual R
epor
t
Summarized financial information of TGT, as included in its own financial statements, and reconciliation with the carrying amount of the investment in the consolidated financial statements are set out below:
2014 2013 2012
Current assets (including cash and cash equivalents - 2014: P80,571, 2013: P61,904 and 2012: P38,674) P95,262 P105,156 P97,639
Noncurrent assets 5,634 5,781 179 Current liabilities 857,947 838,907 744,726 Noncurrent liabilities (including noncurrent financial
liabilities excluding trade and other payables and provisions - 2014: P136, 2013: P219 and 2012: P188) 136 219 188
Net liabilities (757,187) (728,189) (647,096) Percentage of ownership 44.9% 44.9% 44.9%
Carrying amount of investment in joint venture (P339,977) (P326,957)
(P290,546)
Sales P174,908 P268,140 P252,220 Cost of sales 157,805 237,871 234,978 Operating expenses (including depreciation -
2014: P158, 2013: P229 and 2012: P1,320) 41,314 110,610 86,139 Other income (including interest expense - 2012: P5) 695 1,223 20,475
Net loss (23,516) (79,118) (48,422) Percentage of ownership 44.9% 44.9% 44.9%
Share in net loss (10,559) (35,524) (21,741) Share in other comprehensive income (loss) 2,463 887 (10,365) Total comprehensive loss (P8,096) (P34,637) (P32,106)
The Group discontinued recognizing its share in the net liabilities of TGT since the cumulative losses including the share in other comprehensive loss already exceed the cost of investment. If TGT reports profits subsequently, the Group resumes recognizing its share of those profits after its share of the profits equals the share of net losses not recognized. As of December 31, 2014, 2013 and 2012, unrecognized share in net liabilities amounted to P339,977, P326,957 and P290,546, respectively.
13.P
rop
erty
, Pla
nt a
nd E
qui
pm
ent
Th
e m
ovem
ents
in p
rop
erty
, pla
nt a
nd e
qui
pm
ent a
re a
s fo
llow
s:
Land
and
L a
nd
I mp
rove
men
ts
Bui
ldin
gs
and
B
uild
ing
I m
pro
vem
ents
T
rans
po
rtat
ion
Eq
uip
men
t
Mac
hine
ry
a nd
E
qui
pm
ent
Furn
itur
e,
Fixt
ures
a n
d O
ffic
e E
qui
pm
ent
Oth
er
Eq
uip
men
t Le
aseh
old
I m
pro
vem
ents
C
ons
truc
tio
n i n
Pro
gre
ss
To
tal
Co
st
Janu
ary
1, 2
013
P708
,069
P1
,756
,967
P2
41,2
87
P8,5
52,0
85
P111
,331
P7
05,1
70
P138
,684
P3
33,9
31
P12,
547,
524
Ad
diti
ons
-
-
-
-
-
-
-
25
6,90
8 25
6,90
8 D
isp
osa
ls/r
ecla
ssifi
catio
ns
19,6
23
753,
718
7,23
8 13
0,14
6 15
,961
81
,020
2,
705
(324
,156
) 68
6,25
5
Dec
emb
er 3
1, 2
013
727,
692
2,51
0,68
5 24
8,52
5 8,
682,
231
127,
292
786,
190
141,
389
266,
683
13,4
90,6
87
Ad
diti
ons
-
10
2,
242
75,2
36
86
-
-
135,
313
212,
887
Dis
po
sals
/rec
lass
ifica
tions
55
16
,451
(1
9,80
0)
102,
262
2,36
6 64
,303
26
3 (3
20,0
84)
(154
,184
) R
ecla
ssifi
catio
n to
ass
ets
held
fo
r sal
e -
-
(1
8,06
0)
(297
,544
) -
(1
03,5
40)
-
-
(419
,144
)
Dec
emb
er 3
1, 2
014
727,
747
2,
527,
146
212,
907
8,
562,
185
12
9,74
4 74
6,95
3 14
1,65
2
81,9
12
13,1
30,2
46
Acc
umul
ated
Dep
reci
atio
n an
d
Am
ort
izat
ion
Janu
ary
1, 2
013
150,
129
712,
902
151,
507
3,72
6,27
3 82
,346
55
6,84
5 11
,705
-
5,
391,
707
Ad
diti
ons
5,
306
53,1
95
33,3
02
449,
370
15,5
74
60,8
39
7,22
4 -
62
4,81
0 D
isp
osa
ls/r
ecla
ssifi
catio
ns
17,6
49
75,0
73
(10,
190)
56
0,08
6 81
5 (1
4,46
5)
(342
) -
62
8,62
6
Dec
emb
er 3
1, 2
013
173,
084
841,
170
174,
619
4,73
5,72
9 98
,735
60
3,21
9 18
,587
-
6,
645,
143
Ad
diti
ons
3,
969
53,8
33
33,0
76
430,
437
15,6
96
72,3
86
6,66
8 -
61
6,06
5 D
isp
osa
ls/r
ecla
ssifi
catio
ns
16
88
(24,
853)
(1
2,52
7)
(3,9
44)
(108
,982
) 17
-
(1
50,1
85)
Rec
lass
ifica
tion
to a
sset
s he
ld
for s
ale
-
-
(9,6
79)
(171
,822
) -
(4
3,70
2)
-
-
(225
,203
)
Dec
emb
er 3
1, 2
014
177,
069
89
5,09
1 17
3,16
3
4,98
1,81
7
110,
487
52
2,92
1
25,2
72
-
6,
885,
820
Acc
umul
ated
Imp
airm
ent
Loss
es
Janu
ary
1, 2
013
-
-
-
269,
600
-
-
-
-
269,
600
Ad
diti
ons
-
-
-
38
,000
-
-
-
-
38
,000
Dec
emb
er 3
1, 2
013
and
201
4 -
-
-
307,
600
-
-
-
-
30
7,60
0
Car
ryin
g A
mo
unt
Dec
emb
er 3
1, 2
013
P554
,608
P1
,669
,515
P7
3,90
6 P3
,638
,902
P2
8,55
7 P1
82,9
71
P122
,802
P2
66,6
83
P6,5
37,9
44
Dec
emb
er 3
1, 2
014
P55
0,67
8 P
1,63
2,05
5 P
39,7
44
P3,
272,
768
P19
,257
P
224,
032
P11
6,38
0 P
81,9
12
P5,
936,
826
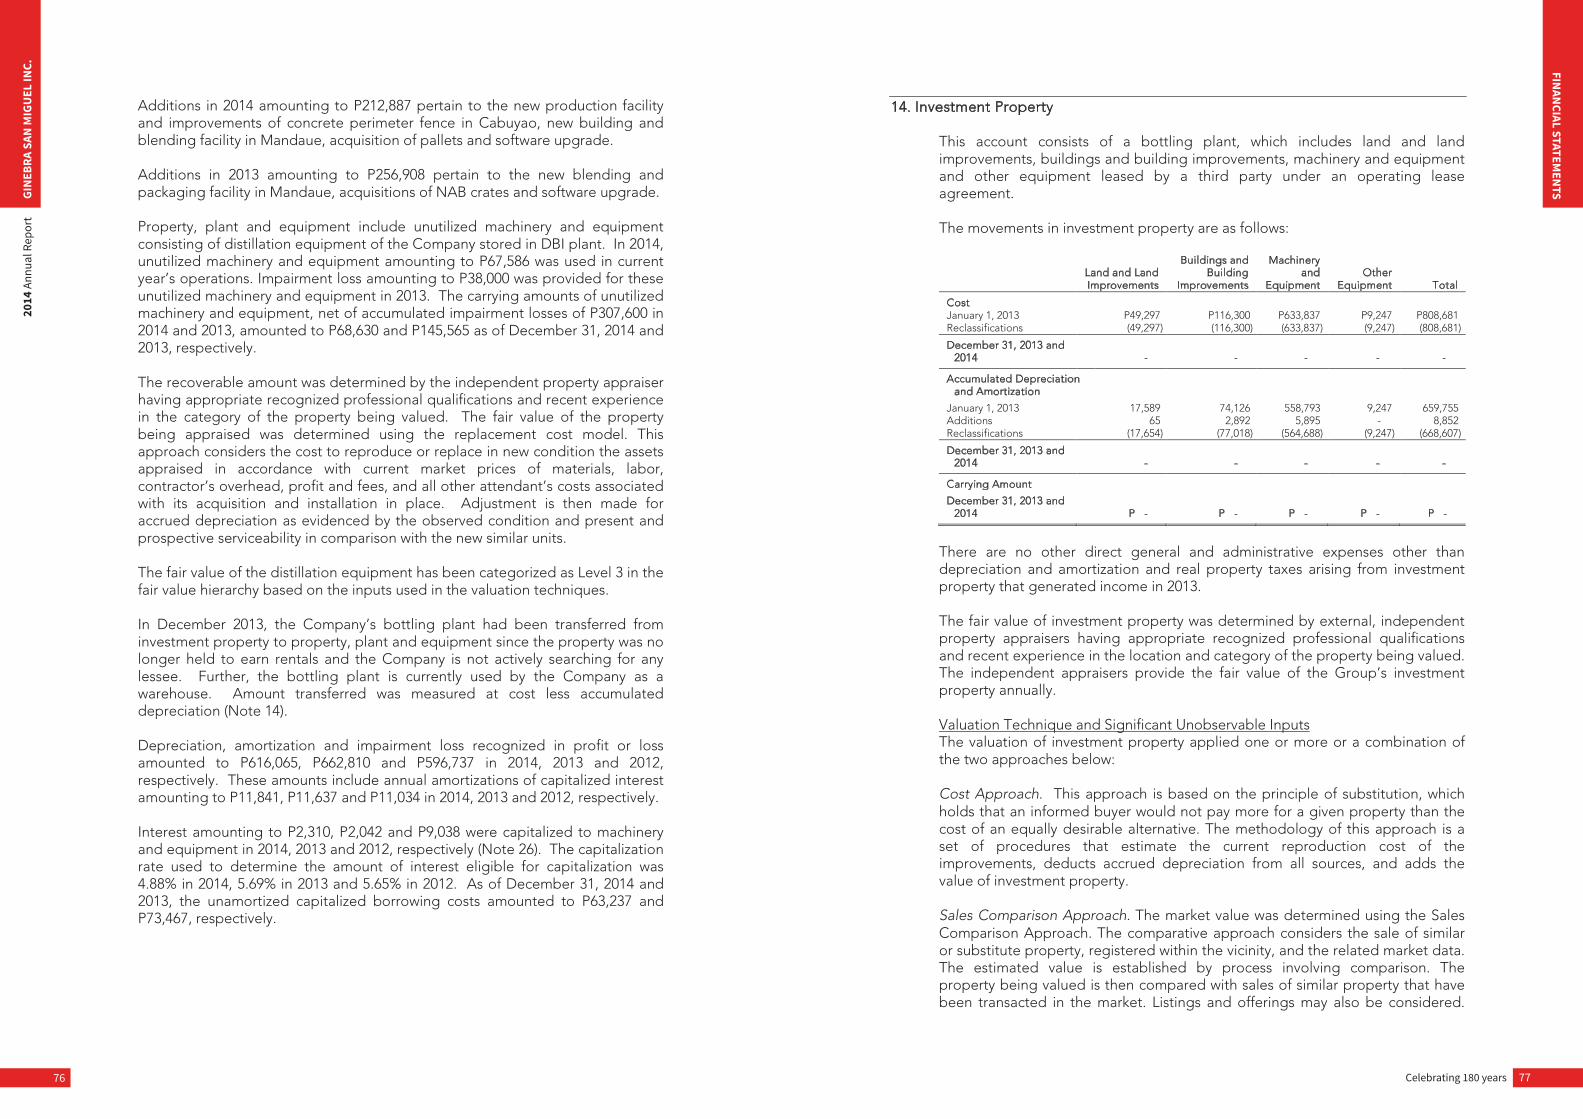
Celebrating 180 years 77
FINAN
CIAL STATEMEN
TS
76
GIN
EBRA
SAN
MIG
UEL
INC.
2014
Ann
ual R
epor
t
Additions in 2014 amounting to P212,887 pertain to the new production facility and improvements of concrete perimeter fence in Cabuyao, new building and blending facility in Mandaue, acquisition of pallets and software upgrade. Additions in 2013 amounting to P256,908 pertain to the new blending and packaging facility in Mandaue, acquisitions of NAB crates and software upgrade. Property, plant and equipment include unutilized machinery and equipment consisting of distillation equipment of the Company stored in DBI plant. In 2014, unutilized machinery and equipment amounting to P67,586 was used in current year’s operations. Impairment loss amounting to P38,000 was provided for these unutilized machinery and equipment in 2013. The carrying amounts of unutilized machinery and equipment, net of accumulated impairment losses of P307,600 in 2014 and 2013, amounted to P68,630 and P145,565 as of December 31, 2014 and 2013, respectively. The recoverable amount was determined by the independent property appraiser having appropriate recognized professional qualifications and recent experience in the category of the property being valued. The fair value of the property being appraised was determined using the replacement cost model. This approach considers the cost to reproduce or replace in new condition the assets appraised in accordance with current market prices of materials, labor, contractor’s overhead, profit and fees, and all other attendant’s costs associated with its acquisition and installation in place. Adjustment is then made for accrued depreciation as evidenced by the observed condition and present and prospective serviceability in comparison with the new similar units. The fair value of the distillation equipment has been categorized as Level 3 in the fair value hierarchy based on the inputs used in the valuation techniques. In December 2013, the Company’s bottling plant had been transferred from investment property to property, plant and equipment since the property was no longer held to earn rentals and the Company is not actively searching for any lessee. Further, the bottling plant is currently used by the Company as a warehouse. Amount transferred was measured at cost less accumulated depreciation (Note 14). Depreciation, amortization and impairment loss recognized in profit or loss amounted to P616,065, P662,810 and P596,737 in 2014, 2013 and 2012, respectively. These amounts include annual amortizations of capitalized interest amounting to P11,841, P11,637 and P11,034 in 2014, 2013 and 2012, respectively. Interest amounting to P2,310, P2,042 and P9,038 were capitalized to machinery and equipment in 2014, 2013 and 2012, respectively (Note 26). The capitalization rate used to determine the amount of interest eligible for capitalization was 4.88% in 2014, 5.69% in 2013 and 5.65% in 2012. As of December 31, 2014 and 2013, the unamortized capitalized borrowing costs amounted to P63,237 and P73,467, respectively.
14. Investment Property This account consists of a bottling plant, which includes land and land improvements, buildings and building improvements, machinery and equipment and other equipment leased by a third party under an operating lease agreement. The movements in investment property are as follows:
Land and Land Improvements
Buildings and Building
Improvements
Machinery and
Equipment Other
Equipment Total
Cost January 1, 2013 P49,297 P116,300 P633,837 P9,247 P808,681 Reclassifications (49,297) (116,300) (633,837) (9,247) (808,681)
December 31, 2013 and 2014 - - - - -
Accumulated Depreciation and Amortization
January 1, 2013 17,589 74,126 558,793 9,247 659,755 Additions 65 2,892 5,895 - 8,852 Reclassifications (17,654) (77,018) (564,688) (9,247) (668,607)
December 31, 2013 and 2014 - - - - -
Carrying Amount
December 31, 2013 and 2014 P - P - P - P - P -
There are no other direct general and administrative expenses other than depreciation and amortization and real property taxes arising from investment property that generated income in 2013. The fair value of investment property was determined by external, independent property appraisers having appropriate recognized professional qualifications and recent experience in the location and category of the property being valued. The independent appraisers provide the fair value of the Group’s investment property annually. Valuation Technique and Significant Unobservable Inputs The valuation of investment property applied one or more or a combination of the two approaches below: Cost Approach. This approach is based on the principle of substitution, which holds that an informed buyer would not pay more for a given property than the cost of an equally desirable alternative. The methodology of this approach is a set of procedures that estimate the current reproduction cost of the improvements, deducts accrued depreciation from all sources, and adds the value of investment property. Sales Comparison Approach. The market value was determined using the Sales Comparison Approach. The comparative approach considers the sale of similar or substitute property, registered within the vicinity, and the related market data. The estimated value is established by process involving comparison. The property being valued is then compared with sales of similar property that have been transacted in the market. Listings and offerings may also be considered.
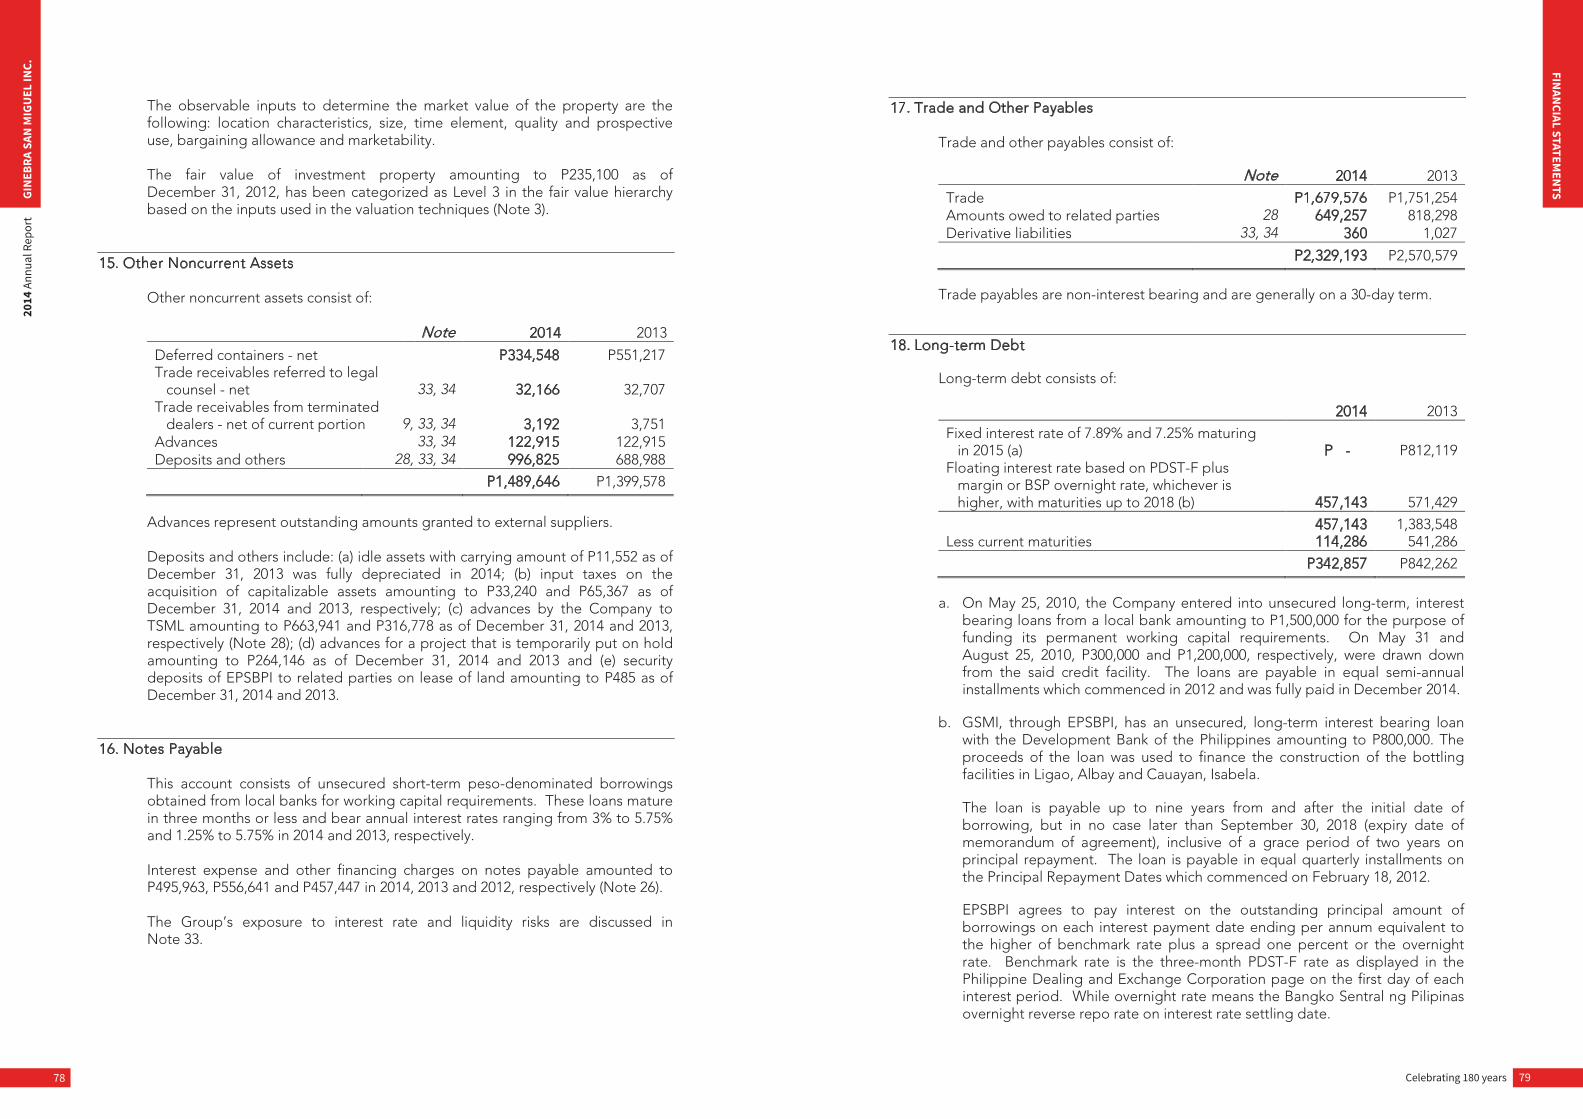
Celebrating 180 years 79
FINAN
CIAL STATEMEN
TS
78
GIN
EBRA
SAN
MIG
UEL
INC.
2014
Ann
ual R
epor
t
The observable inputs to determine the market value of the property are the following: location characteristics, size, time element, quality and prospective use, bargaining allowance and marketability. The fair value of investment property amounting to P235,100 as of December 31, 2012, has been categorized as Level 3 in the fair value hierarchy based on the inputs used in the valuation techniques (Note 3).
15. Other Noncurrent Assets Other noncurrent assets consist of:
Note 2014 2013
Deferred containers - net P334,548 P551,217 Trade receivables referred to legal
counsel - net 33, 34 32,166 32,707 Trade receivables from terminated
dealers - net of current portion 9, 33, 34 3,192 3,751 Advances 33, 34 122,915 122,915 Deposits and others 28, 33, 34 996,825 688,988
P1,489,646 P1,399,578
Advances represent outstanding amounts granted to external suppliers. Deposits and others include: (a) idle assets with carrying amount of P11,552 as of December 31, 2013 was fully depreciated in 2014; (b) input taxes on the acquisition of capitalizable assets amounting to P33,240 and P65,367 as of December 31, 2014 and 2013, respectively; (c) advances by the Company to TSML amounting to P663,941 and P316,778 as of December 31, 2014 and 2013, respectively (Note 28); (d) advances for a project that is temporarily put on hold amounting to P264,146 as of December 31, 2014 and 2013 and (e) security deposits of EPSBPI to related parties on lease of land amounting to P485 as of December 31, 2014 and 2013.
16. Notes Payable This account consists of unsecured short-term peso-denominated borrowings obtained from local banks for working capital requirements. These loans mature in three months or less and bear annual interest rates ranging from 3% to 5.75% and 1.25% to 5.75% in 2014 and 2013, respectively. Interest expense and other financing charges on notes payable amounted to P495,963, P556,641 and P457,447 in 2014, 2013 and 2012, respectively (Note 26). The Group’s exposure to interest rate and liquidity risks are discussed in Note 33.
17. Trade and Other Payables Trade and other payables consist of:
Note 2014 2013
Trade P1,679,576 P1,751,254 Amounts owed to related parties 28 649,257 818,298 Derivative liabilities 33, 34 360 1,027
P2,329,193 P2,570,579
Trade payables are non-interest bearing and are generally on a 30-day term.
18. Long-term Debt Long-term debt consists of:
2014 2013
Fixed interest rate of 7.89% and 7.25% maturing in 2015 (a) P - P812,119
Floating interest rate based on PDST-F plus margin or BSP overnight rate, whichever is higher, with maturities up to 2018 (b) 457,143 571,429
457,143 1,383,548 Less current maturities 114,286 541,286
P342,857 P842,262
a. On May 25, 2010, the Company entered into unsecured long-term, interest
bearing loans from a local bank amounting to P1,500,000 for the purpose of funding its permanent working capital requirements. On May 31 and August 25, 2010, P300,000 and P1,200,000, respectively, were drawn down from the said credit facility. The loans are payable in equal semi-annual installments which commenced in 2012 and was fully paid in December 2014.
b. GSMI, through EPSBPI, has an unsecured, long-term interest bearing loan
with the Development Bank of the Philippines amounting to P800,000. The proceeds of the loan was used to finance the construction of the bottling facilities in Ligao, Albay and Cauayan, Isabela. The loan is payable up to nine years from and after the initial date of borrowing, but in no case later than September 30, 2018 (expiry date of memorandum of agreement), inclusive of a grace period of two years on principal repayment. The loan is payable in equal quarterly installments on the Principal Repayment Dates which commenced on February 18, 2012. EPSBPI agrees to pay interest on the outstanding principal amount of borrowings on each interest payment date ending per annum equivalent to the higher of benchmark rate plus a spread one percent or the overnight rate. Benchmark rate is the three-month PDST-F rate as displayed in the Philippine Dealing and Exchange Corporation page on the first day of each interest period. While overnight rate means the Bangko Sentral ng Pilipinas overnight reverse repo rate on interest rate settling date.
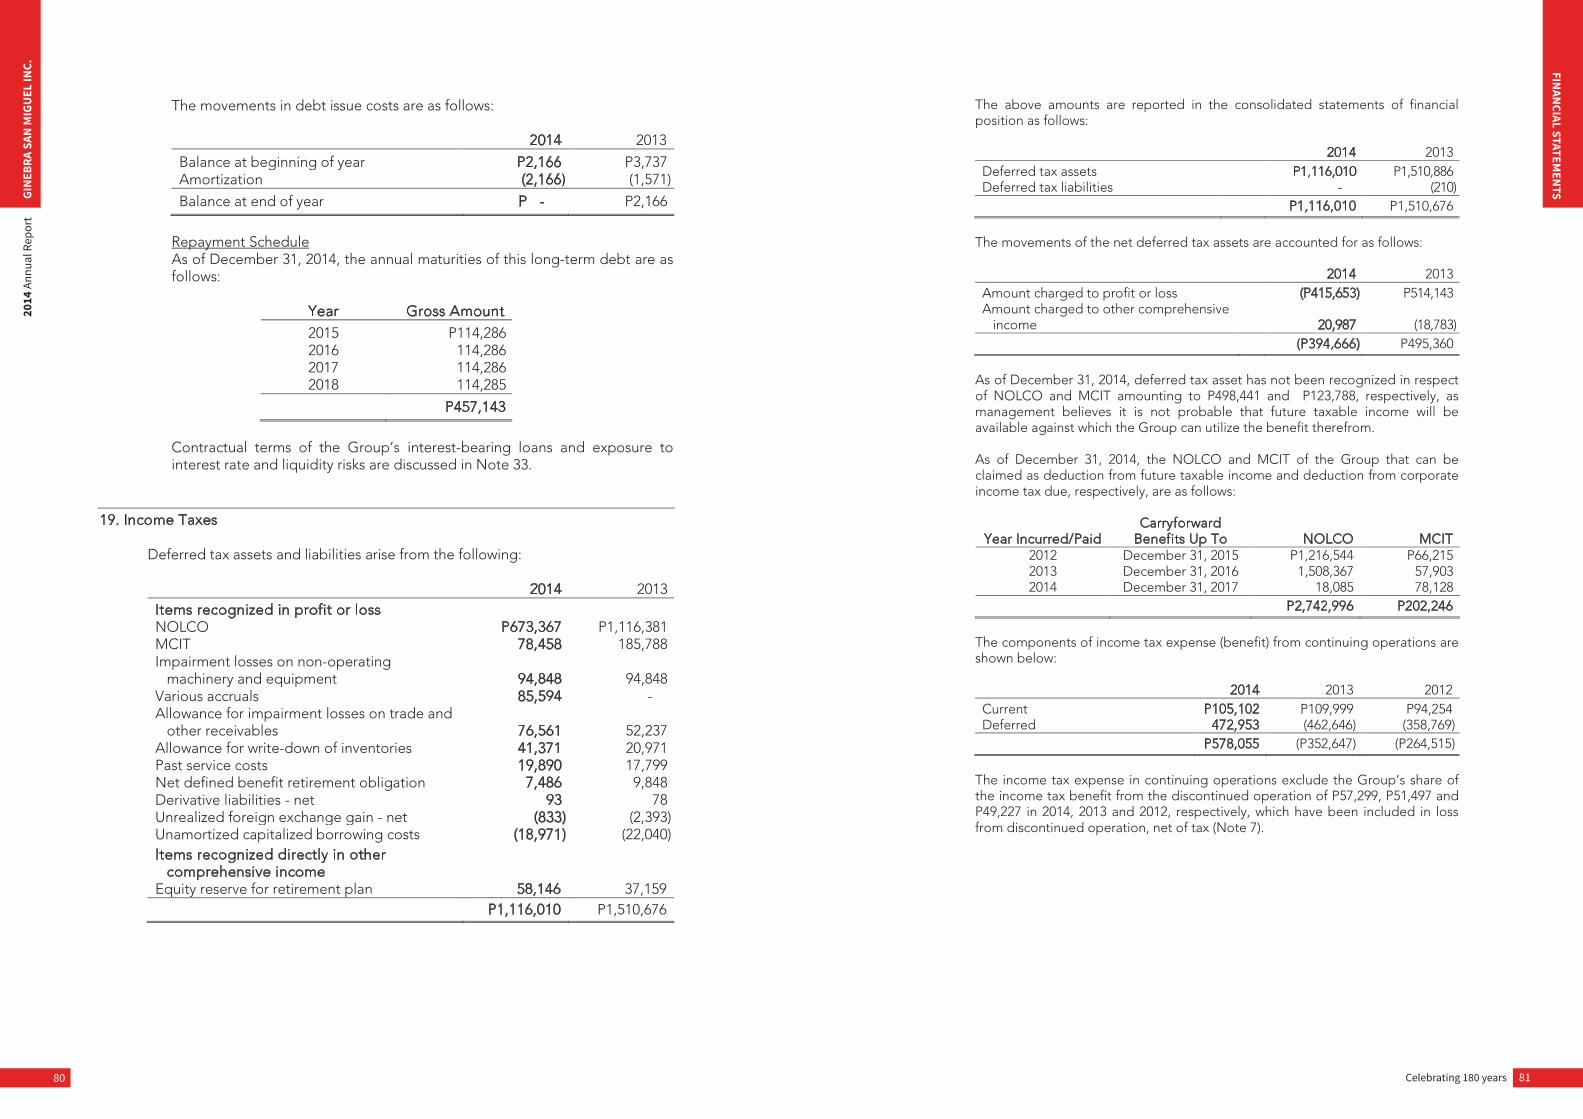
Celebrating 180 years 81
FINAN
CIAL STATEMEN
TS
80
GIN
EBRA
SAN
MIG
UEL
INC.
2014
Ann
ual R
epor
t
The movements in debt issue costs are as follows:
2014 2013
Balance at beginning of year P2,166 P3,737 Amortization (2,166) (1,571)
Balance at end of year P - P2,166
Repayment Schedule As of December 31, 2014, the annual maturities of this long-term debt are as follows:
Year Gross Amount
2015 P114,286 2016 114,286 2017 114,286 2018 114,285
P457,143
Contractual terms of the Group’s interest-bearing loans and exposure to interest rate and liquidity risks are discussed in Note 33.
19. Income Taxes Deferred tax assets and liabilities arise from the following:
2014 2013 Items recognized in profit or loss NOLCO P673,367 P1,116,381 MCIT 78,458 185,788 Impairment losses on non-operating
machinery and equipment 94,848 94,848 Various accruals 85,594 - Allowance for impairment losses on trade and
other receivables 76,561 52,237 Allowance for write-down of inventories 41,371 20,971 Past service costs 19,890 17,799 Net defined benefit retirement obligation 7,486 9,848 Derivative liabilities - net 93 78 Unrealized foreign exchange gain - net (833) (2,393) Unamortized capitalized borrowing costs (18,971) (22,040) Items recognized directly in other
comprehensive income Equity reserve for retirement plan 58,146 37,159 P1,116,010 P1,510,676
The above amounts are reported in the consolidated statements of financial position as follows:
2014 2013 Deferred tax assets P1,116,010 P1,510,886 Deferred tax liabilities - (210) P1,116,010 P1,510,676
The movements of the net deferred tax assets are accounted for as follows:
2014 2013 Amount charged to profit or loss (P415,653) P514,143 Amount charged to other comprehensive
income 20,987 (18,783) (P394,666) P495,360
As of December 31, 2014, deferred tax asset has not been recognized in respect of NOLCO and MCIT amounting to P498,441 and P123,788, respectively, as management believes it is not probable that future taxable income will be available against which the Group can utilize the benefit therefrom. As of December 31, 2014, the NOLCO and MCIT of the Group that can be claimed as deduction from future taxable income and deduction from corporate income tax due, respectively, are as follows:
Year Incurred/Paid Carryforward
Benefits Up To NOLCO MCIT 2012 December 31, 2015 P1,216,544 P66,215 2013 December 31, 2016 1,508,367 57,903 2014 December 31, 2017 18,085 78,128
P2,742,996 P202,246
The components of income tax expense (benefit) from continuing operations are shown below: 2014 2013 2012 Current P105,102 P109,999 P94,254 Deferred 472,953 (462,646) (358,769) P578,055 (P352,647) (P264,515)
The income tax expense in continuing operations exclude the Group’s share of the income tax benefit from the discontinued operation of P57,299, P51,497 and P49,227 in 2014, 2013 and 2012, respectively, which have been included in loss from discontinued operation, net of tax (Note 7).
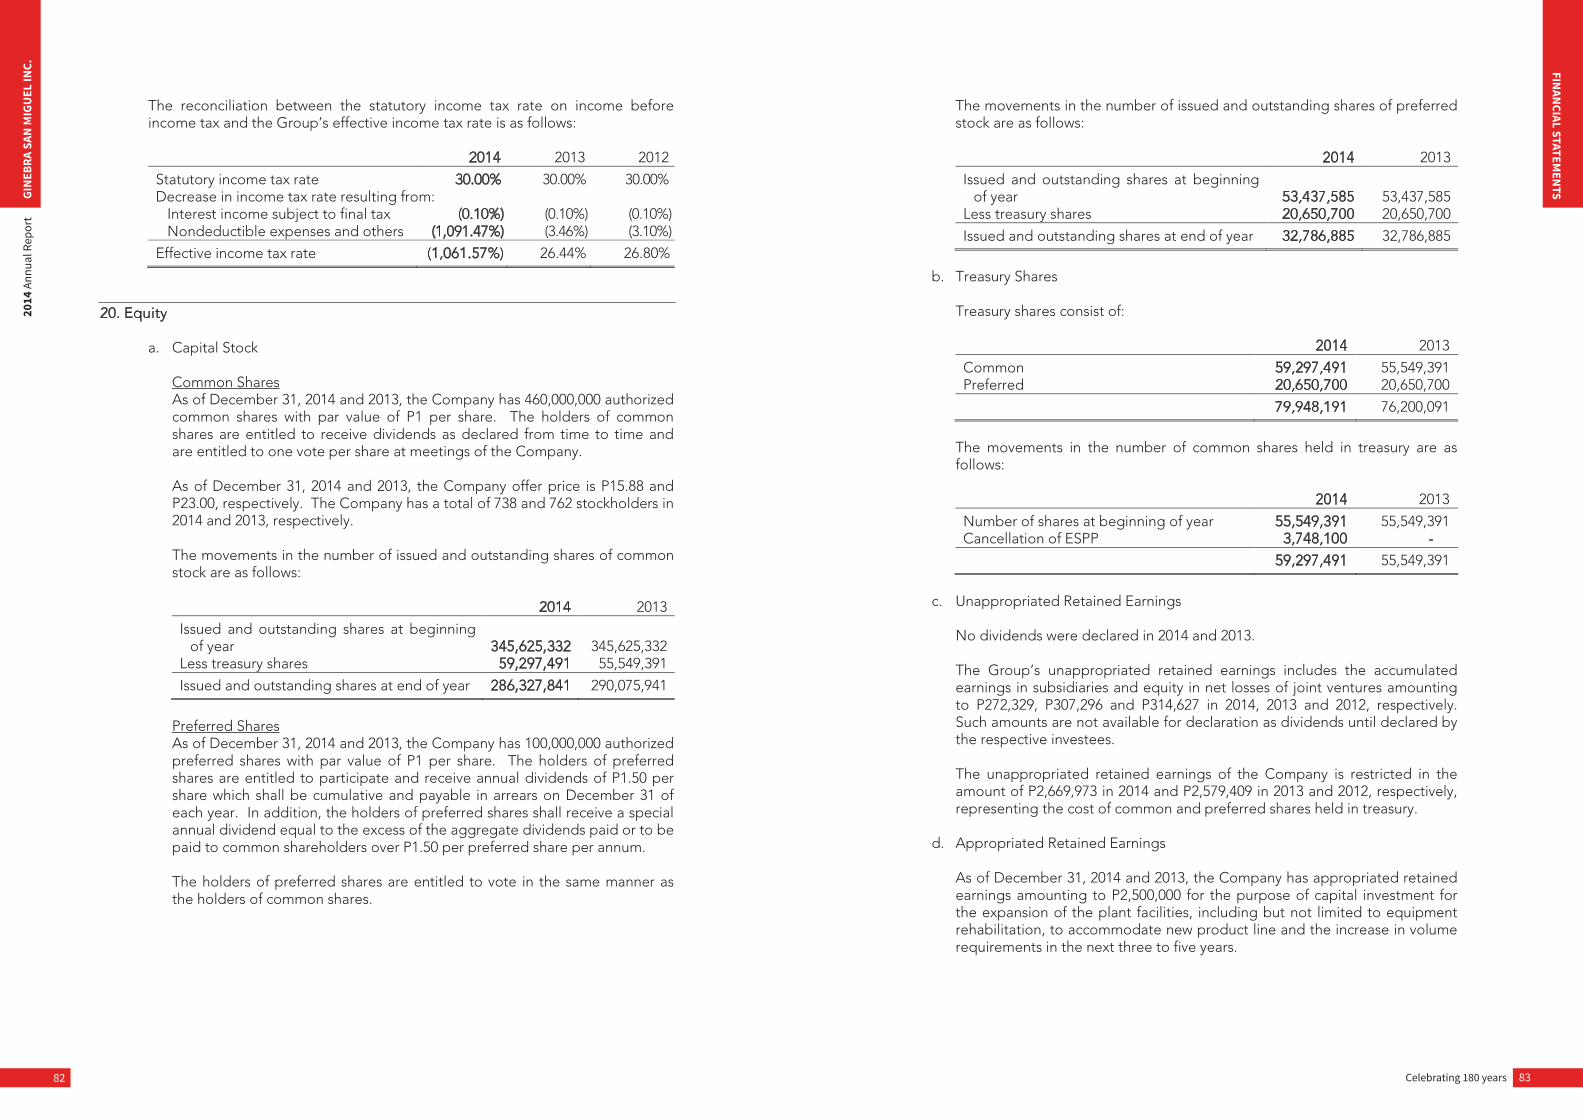
Celebrating 180 years 83
FINAN
CIAL STATEMEN
TS
82
GIN
EBRA
SAN
MIG
UEL
INC.
2014
Ann
ual R
epor
t
The reconciliation between the statutory income tax rate on income before income tax and the Group’s effective income tax rate is as follows:
2014 2013 2012
Statutory income tax rate 30.00% 30.00% 30.00% Decrease in income tax rate resulting from:
Interest income subject to final tax (0.10%) (0.10%) (0.10%) Nondeductible expenses and others (1,091.47%) (3.46%) (3.10%)
Effective income tax rate (1,061.57%) 26.44% 26.80%
20. Equity a. Capital Stock
Common Shares As of December 31, 2014 and 2013, the Company has 460,000,000 authorized common shares with par value of P1 per share. The holders of common shares are entitled to receive dividends as declared from time to time and are entitled to one vote per share at meetings of the Company. As of December 31, 2014 and 2013, the Company offer price is P15.88 and P23.00, respectively. The Company has a total of 738 and 762 stockholders in 2014 and 2013, respectively. The movements in the number of issued and outstanding shares of common stock are as follows: 2014 2013
Issued and outstanding shares at beginning of year 345,625,332 345,625,332
Less treasury shares 59,297,491 55,549,391
Issued and outstanding shares at end of year 286,327,841 290,075,941
Preferred Shares As of December 31, 2014 and 2013, the Company has 100,000,000 authorized preferred shares with par value of P1 per share. The holders of preferred shares are entitled to participate and receive annual dividends of P1.50 per share which shall be cumulative and payable in arrears on December 31 of each year. In addition, the holders of preferred shares shall receive a special annual dividend equal to the excess of the aggregate dividends paid or to be paid to common shareholders over P1.50 per preferred share per annum. The holders of preferred shares are entitled to vote in the same manner as the holders of common shares.
The movements in the number of issued and outstanding shares of preferred stock are as follows:
2014 2013
Issued and outstanding shares at beginning of year 53,437,585 53,437,585
Less treasury shares 20,650,700 20,650,700
Issued and outstanding shares at end of year 32,786,885 32,786,885
b. Treasury Shares
Treasury shares consist of:
2014 2013
Common 59,297,491 55,549,391 Preferred 20,650,700 20,650,700
79,948,191 76,200,091
The movements in the number of common shares held in treasury are as follows:
2014 2013
Number of shares at beginning of year 55,549,391 55,549,391 Cancellation of ESPP 3,748,100 -
59,297,491 55,549,391
c. Unappropriated Retained Earnings
No dividends were declared in 2014 and 2013. The Group’s unappropriated retained earnings includes the accumulated earnings in subsidiaries and equity in net losses of joint ventures amounting to P272,329, P307,296 and P314,627 in 2014, 2013 and 2012, respectively. Such amounts are not available for declaration as dividends until declared by the respective investees. The unappropriated retained earnings of the Company is restricted in the amount of P2,669,973 in 2014 and P2,579,409 in 2013 and 2012, respectively, representing the cost of common and preferred shares held in treasury.
d. Appropriated Retained Earnings As of December 31, 2014 and 2013, the Company has appropriated retained earnings amounting to P2,500,000 for the purpose of capital investment for the expansion of the plant facilities, including but not limited to equipment rehabilitation, to accommodate new product line and the increase in volume requirements in the next three to five years.
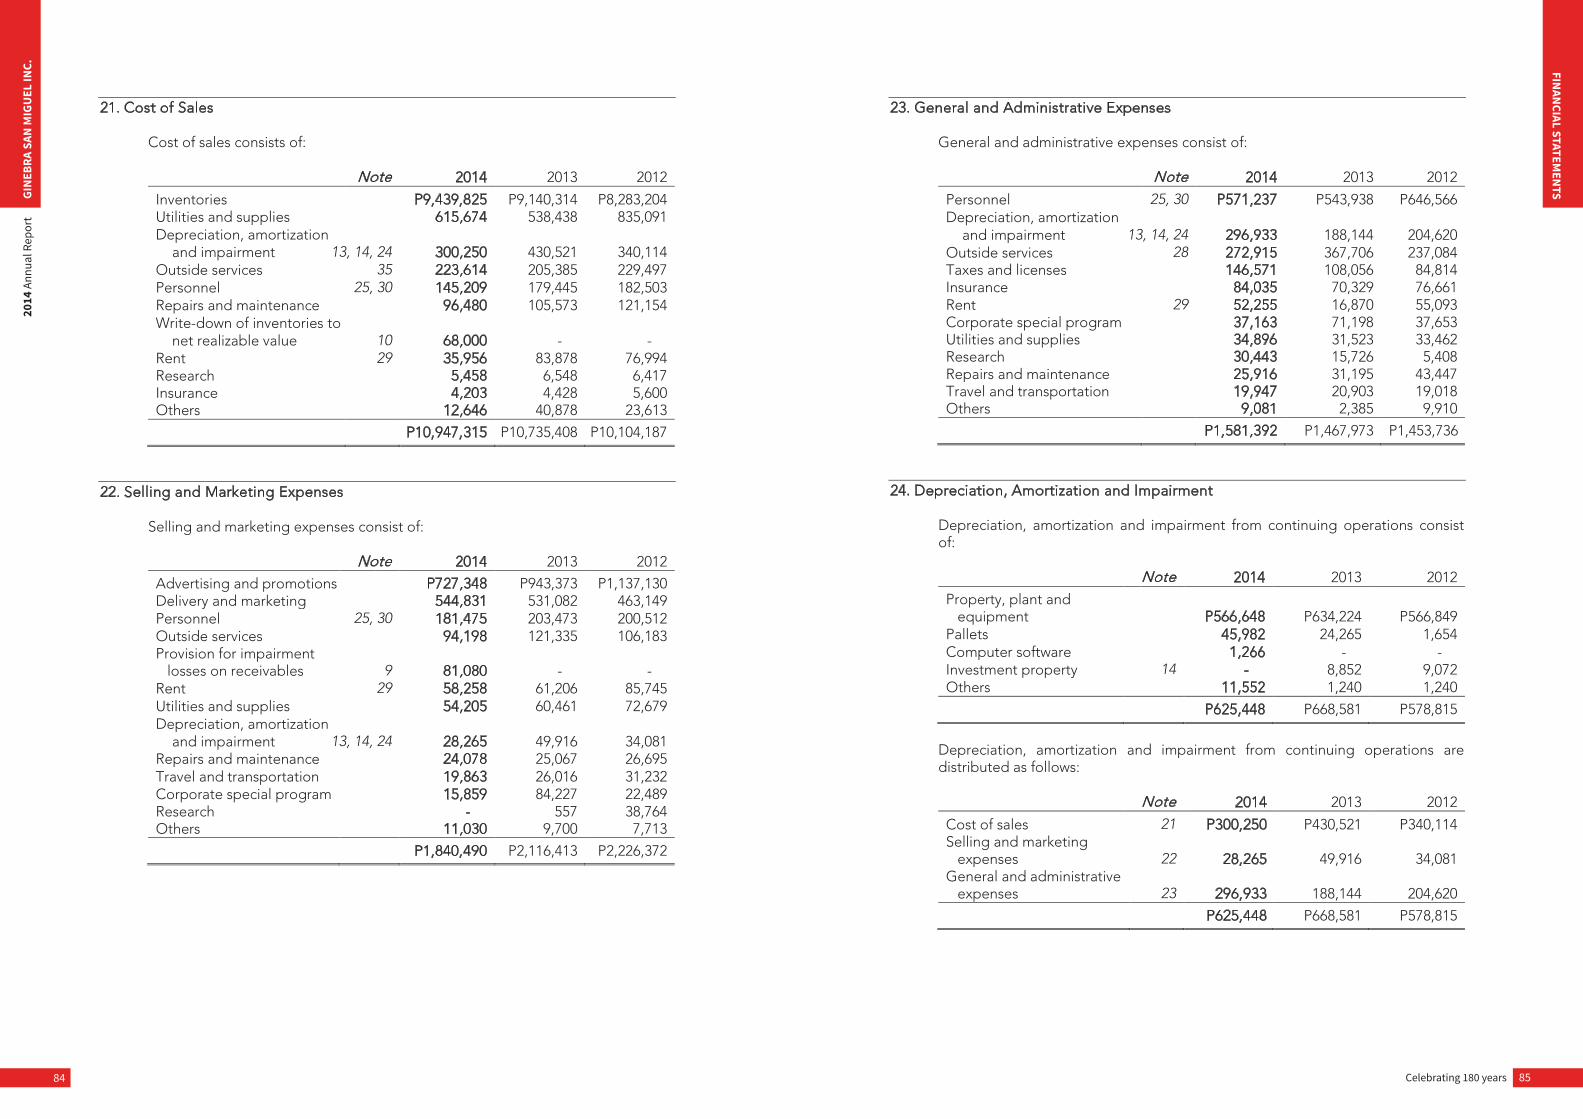
Celebrating 180 years 85
FINAN
CIAL STATEMEN
TS
84
GIN
EBRA
SAN
MIG
UEL
INC.
2014
Ann
ual R
epor
t
21. Cost of Sales Cost of sales consists of:
Note 2014 2013 2012
Inventories P9,439,825 P9,140,314 P8,283,204 Utilities and supplies 615,674 538,438 835,091 Depreciation, amortization
and impairment 13, 14, 24 300,250 430,521 340,114 Outside services 35 223,614 205,385 229,497 Personnel 25, 30 145,209 179,445 182,503 Repairs and maintenance 96,480 105,573 121,154 Write-down of inventories to
net realizable value 10 68,000 - - Rent 29 35,956 83,878 76,994 Research 5,458 6,548 6,417 Insurance 4,203 4,428 5,600 Others 12,646 40,878 23,613
P10,947,315 P10,735,408 P10,104,187
22. Selling and Marketing Expenses Selling and marketing expenses consist of:
Note 2014 2013 2012
Advertising and promotions P727,348 P943,373 P1,137,130 Delivery and marketing 544,831 531,082 463,149 Personnel 25, 30 181,475 203,473 200,512 Outside services 94,198 121,335 106,183 Provision for impairment
losses on receivables 9 81,080 - - Rent 29 58,258 61,206 85,745 Utilities and supplies 54,205 60,461 72,679 Depreciation, amortization
and impairment 13, 14, 24 28,265 49,916 34,081 Repairs and maintenance 24,078 25,067 26,695 Travel and transportation 19,863 26,016 31,232 Corporate special program 15,859 84,227 22,489 Research - 557 38,764 Others 11,030 9,700 7,713
P1,840,490 P2,116,413 P2,226,372
23. General and Administrative Expenses General and administrative expenses consist of:
Note 2014 2013 2012
Personnel 25, 30 P571,237 P543,938 P646,566 Depreciation, amortization
and impairment 13, 14, 24 296,933 188,144 204,620 Outside services 28 272,915 367,706 237,084 Taxes and licenses 146,571 108,056 84,814 Insurance 84,035 70,329 76,661 Rent 29 52,255 16,870 55,093 Corporate special program 37,163 71,198 37,653 Utilities and supplies 34,896 31,523 33,462 Research 30,443 15,726 5,408 Repairs and maintenance 25,916 31,195 43,447 Travel and transportation 19,947 20,903 19,018 Others 9,081 2,385 9,910
P1,581,392 P1,467,973 P1,453,736
24. Depreciation, Amortization and Impairment Depreciation, amortization and impairment from continuing operations consist of:
Note 2014 2013 2012
Property, plant and equipment P566,648 P634,224 P566,849
Pallets 45,982 24,265 1,654 Computer software 1,266 - - Investment property 14 - 8,852 9,072 Others 11,552 1,240 1,240
P625,448 P668,581 P578,815
Depreciation, amortization and impairment from continuing operations are distributed as follows:
Note 2014 2013 2012
Cost of sales 21 P300,250 P430,521 P340,114 Selling and marketing
expenses 22 28,265 49,916 34,081 General and administrative
expenses 23 296,933 188,144 204,620
P625,448 P668,581 P578,815
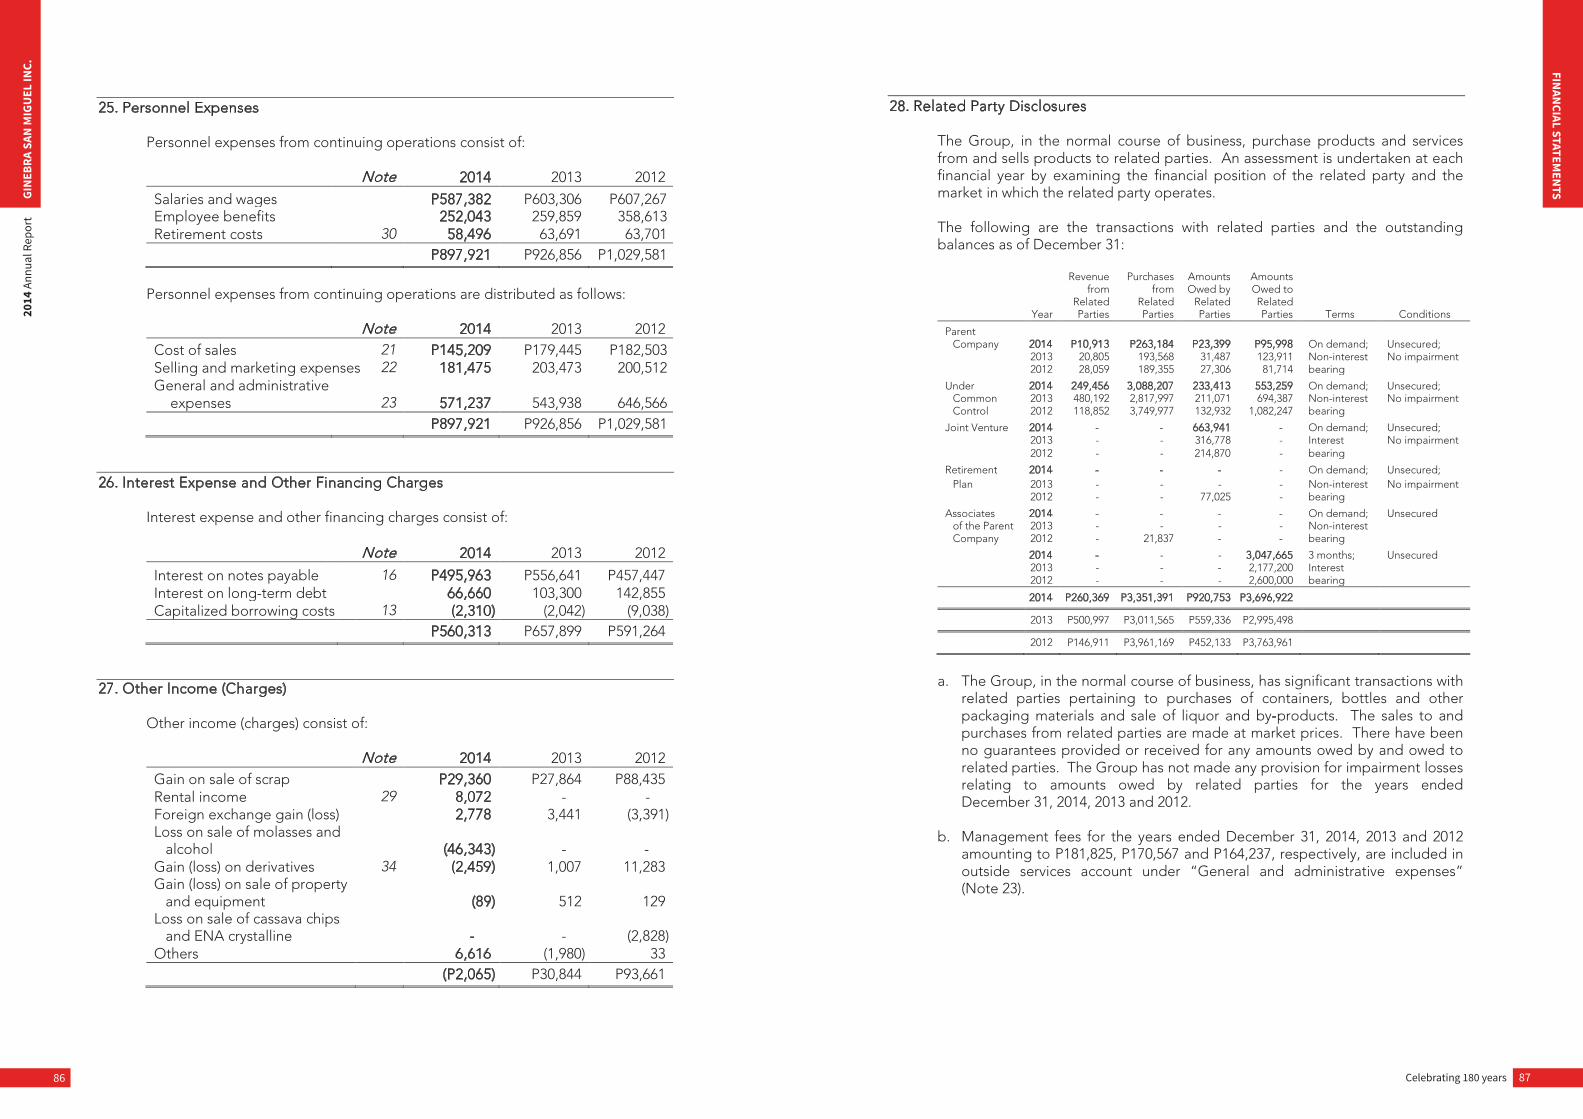
Celebrating 180 years 87
FINAN
CIAL STATEMEN
TS
86
GIN
EBRA
SAN
MIG
UEL
INC.
2014
Ann
ual R
epor
t
25. Personnel Expenses Personnel expenses from continuing operations consist of:
Note 2014 2013 2012
Salaries and wages P587,382 P603,306 P607,267 Employee benefits 252,043 259,859 358,613 Retirement costs 30 58,496 63,691 63,701 P897,921 P926,856 P1,029,581
Personnel expenses from continuing operations are distributed as follows:
Note 2014 2013 2012 Cost of sales 21 P145,209 P179,445 P182,503 Selling and marketing expenses 22 181,475 203,473 200,512 General and administrative
expenses 23 571,237 543,938 646,566 P897,921 P926,856 P1,029,581
26. Interest Expense and Other Financing Charges Interest expense and other financing charges consist of:
Note 2014 2013 2012
Interest on notes payable 16 P495,963 P556,641 P457,447 Interest on long-term debt 66,660 103,300 142,855 Capitalized borrowing costs 13 (2,310) (2,042) (9,038) P560,313 P657,899 P591,264
27. Other Income (Charges) Other income (charges) consist of:
Note 2014 2013 2012 Gain on sale of scrap P29,360 P27,864 P88,435 Rental income 29 8,072 - - Foreign exchange gain (loss) 2,778 3,441 (3,391) Loss on sale of molasses and
alcohol (46,343)
-
- Gain (loss) on derivatives 34 (2,459) 1,007 11,283 Gain (loss) on sale of property
and equipment (89) 512 129 Loss on sale of cassava chips
and ENA crystalline - - (2,828) Others 6,616 (1,980) 33 (P2,065) P30,844 P93,661
28. Related Party Disclosures The Group, in the normal course of business, purchase products and services from and sells products to related parties. An assessment is undertaken at each financial year by examining the financial position of the related party and the market in which the related party operates. The following are the transactions with related parties and the outstanding balances as of December 31:
Year
Revenue from
Related Parties
Purchases from
Related Parties
Amounts Owed by
Related Parties
Amounts Owed to Related Parties Terms Conditions
Parent Company 2014 P10,913 P263,184 P23,399 P95,998 On demand; Unsecured; 2013 20,805 193,568 31,487 123,911 Non-interest No impairment
2012 28,059 189,355 27,306 81,714 bearing
Under 2014 249,456 3,088,207 233,413 553,259 On demand; Unsecured; Common 2013 480,192 2,817,997 211,071 694,387 Non-interest No impairment Control 2012 118,852 3,749,977 132,932 1,082,247 bearing
Joint Venture 2014 - - 663,941 - On demand; Unsecured; 2013 - - 316,778 - Interest No impairment 2012 - - 214,870 - bearing
Retirement 2014 - - - - On demand; Unsecured; Plan 2013 - - - - Non-interest No impairment
2012 - - 77,025 - bearing
Associates 2014 - - - - On demand; Unsecured of the Parent 2013 - - - - Non-interest Company 2012 - 21,837 - - bearing
2014 - - - 3,047,665 3 months; Unsecured 2013 - - - 2,177,200 Interest 2012 - - - 2,600,000 bearing
2014 P260,369 P3,351,391 P920,753 P3,696,922
2013 P500,997 P3,011,565 P559,336 P2,995,498
2012 P146,911 P3,961,169 P452,133 P3,763,961
a. The Group, in the normal course of business, has significant transactions with
related parties pertaining to purchases of containers, bottles and other packaging materials and sale of liquor and by-products. The sales to and purchases from related parties are made at market prices. There have been no guarantees provided or received for any amounts owed by and owed to related parties. The Group has not made any provision for impairment losses relating to amounts owed by related parties for the years ended December 31, 2014, 2013 and 2012.
b. Management fees for the years ended December 31, 2014, 2013 and 2012
amounting to P181,825, P170,567 and P164,237, respectively, are included in outside services account under “General and administrative expenses” (Note 23).
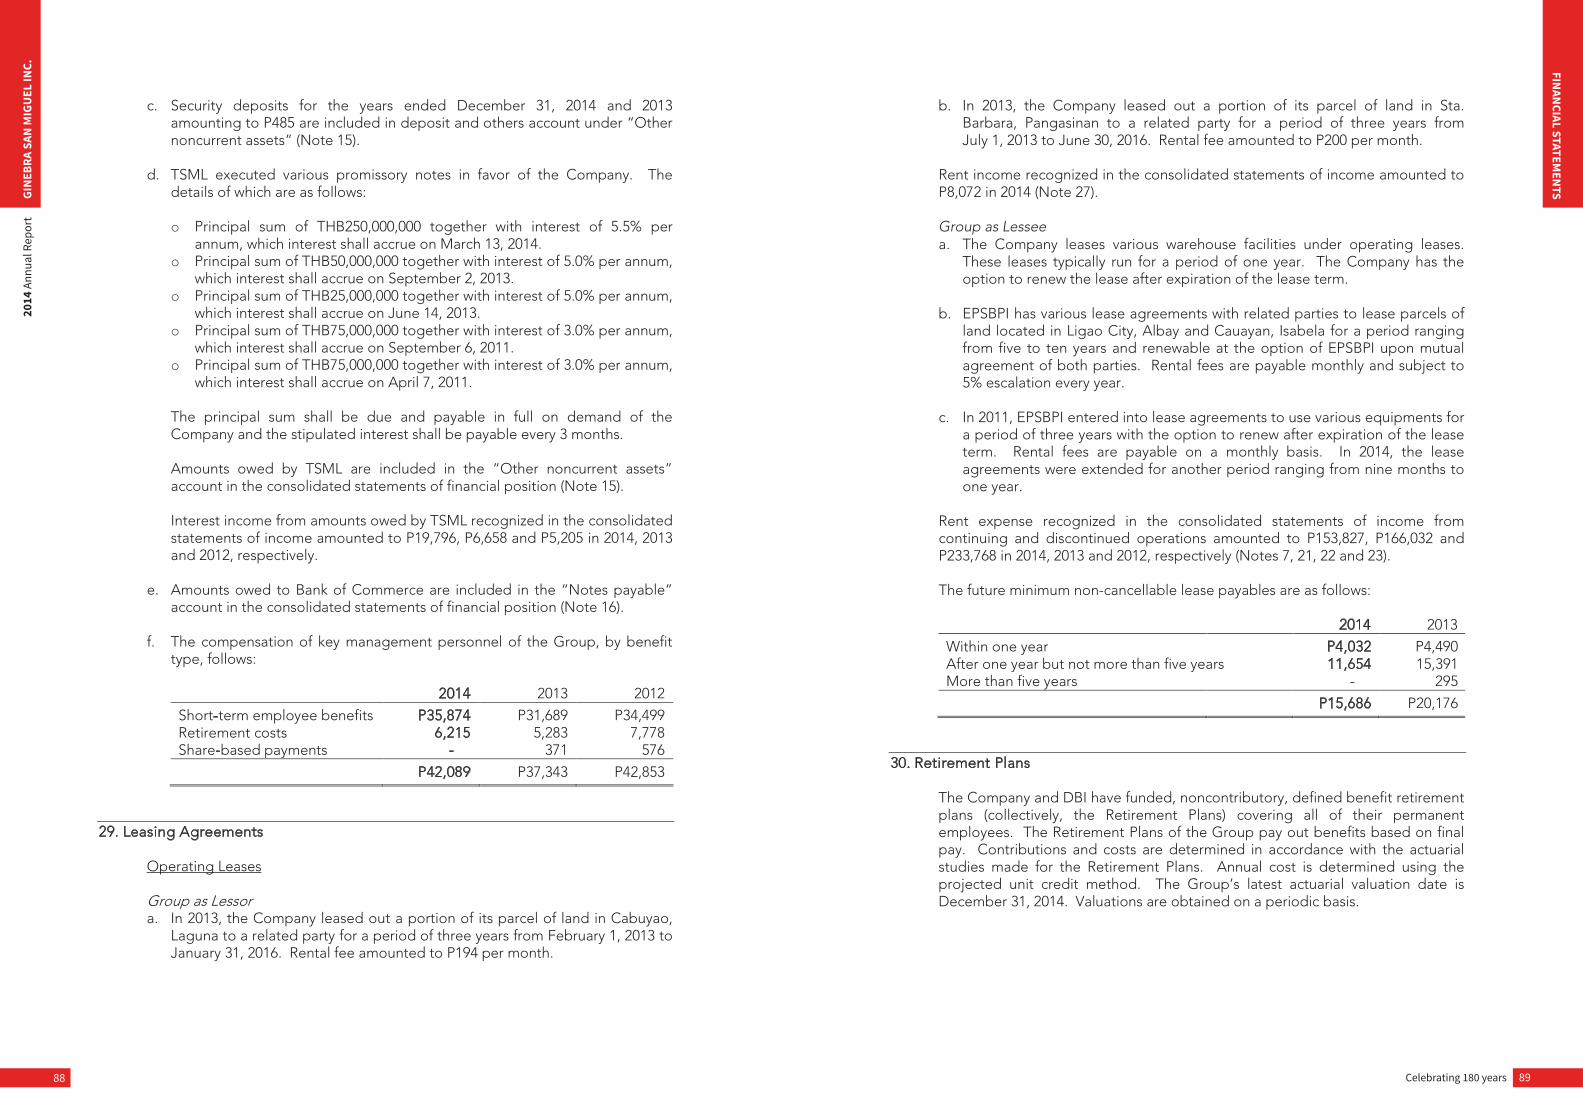
Celebrating 180 years 89
FINAN
CIAL STATEMEN
TS
88
GIN
EBRA
SAN
MIG
UEL
INC.
2014
Ann
ual R
epor
t
c. Security deposits for the years ended December 31, 2014 and 2013 amounting to P485 are included in deposit and others account under “Other noncurrent assets” (Note 15).
d. TSML executed various promissory notes in favor of the Company. The
details of which are as follows: o Principal sum of THB250,000,000 together with interest of 5.5% per
annum, which interest shall accrue on March 13, 2014. o Principal sum of THB50,000,000 together with interest of 5.0% per annum,
which interest shall accrue on September 2, 2013. o Principal sum of THB25,000,000 together with interest of 5.0% per annum,
which interest shall accrue on June 14, 2013. o Principal sum of THB75,000,000 together with interest of 3.0% per annum,
which interest shall accrue on September 6, 2011. o Principal sum of THB75,000,000 together with interest of 3.0% per annum,
which interest shall accrue on April 7, 2011.
The principal sum shall be due and payable in full on demand of the Company and the stipulated interest shall be payable every 3 months. Amounts owed by TSML are included in the “Other noncurrent assets” account in the consolidated statements of financial position (Note 15). Interest income from amounts owed by TSML recognized in the consolidated statements of income amounted to P19,796, P6,658 and P5,205 in 2014, 2013 and 2012, respectively.
e. Amounts owed to Bank of Commerce are included in the “Notes payable” account in the consolidated statements of financial position (Note 16).
f. The compensation of key management personnel of the Group, by benefit type, follows: 2014 2013 2012
Short-term employee benefits P35,874 P31,689 P34,499 Retirement costs 6,215 5,283 7,778 Share-based payments - 371 576
P42,089 P37,343 P42,853
29. Leasing Agreements Operating Leases Group as Lessor a. In 2013, the Company leased out a portion of its parcel of land in Cabuyao,
Laguna to a related party for a period of three years from February 1, 2013 to January 31, 2016. Rental fee amounted to P194 per month.
b. In 2013, the Company leased out a portion of its parcel of land in Sta. Barbara, Pangasinan to a related party for a period of three years from July 1, 2013 to June 30, 2016. Rental fee amounted to P200 per month.
Rent income recognized in the consolidated statements of income amounted to P8,072 in 2014 (Note 27). Group as Lessee a. The Company leases various warehouse facilities under operating leases.
These leases typically run for a period of one year. The Company has the option to renew the lease after expiration of the lease term.
b. EPSBPI has various lease agreements with related parties to lease parcels of land located in Ligao City, Albay and Cauayan, Isabela for a period ranging from five to ten years and renewable at the option of EPSBPI upon mutual agreement of both parties. Rental fees are payable monthly and subject to 5% escalation every year.
c. In 2011, EPSBPI entered into lease agreements to use various equipments for
a period of three years with the option to renew after expiration of the lease term. Rental fees are payable on a monthly basis. In 2014, the lease agreements were extended for another period ranging from nine months to one year.
Rent expense recognized in the consolidated statements of income from continuing and discontinued operations amounted to P153,827, P166,032 and P233,768 in 2014, 2013 and 2012, respectively (Notes 7, 21, 22 and 23). The future minimum non-cancellable lease payables are as follows: 2014 2013
Within one year P4,032 P4,490 After one year but not more than five years 11,654 15,391 More than five years - 295
P15,686 P20,176
30. Retirement Plans The Company and DBI have funded, noncontributory, defined benefit retirement plans (collectively, the Retirement Plans) covering all of their permanent employees. The Retirement Plans of the Group pay out benefits based on final pay. Contributions and costs are determined in accordance with the actuarial studies made for the Retirement Plans. Annual cost is determined using the projected unit credit method. The Group’s latest actuarial valuation date is December 31, 2014. Valuations are obtained on a periodic basis.
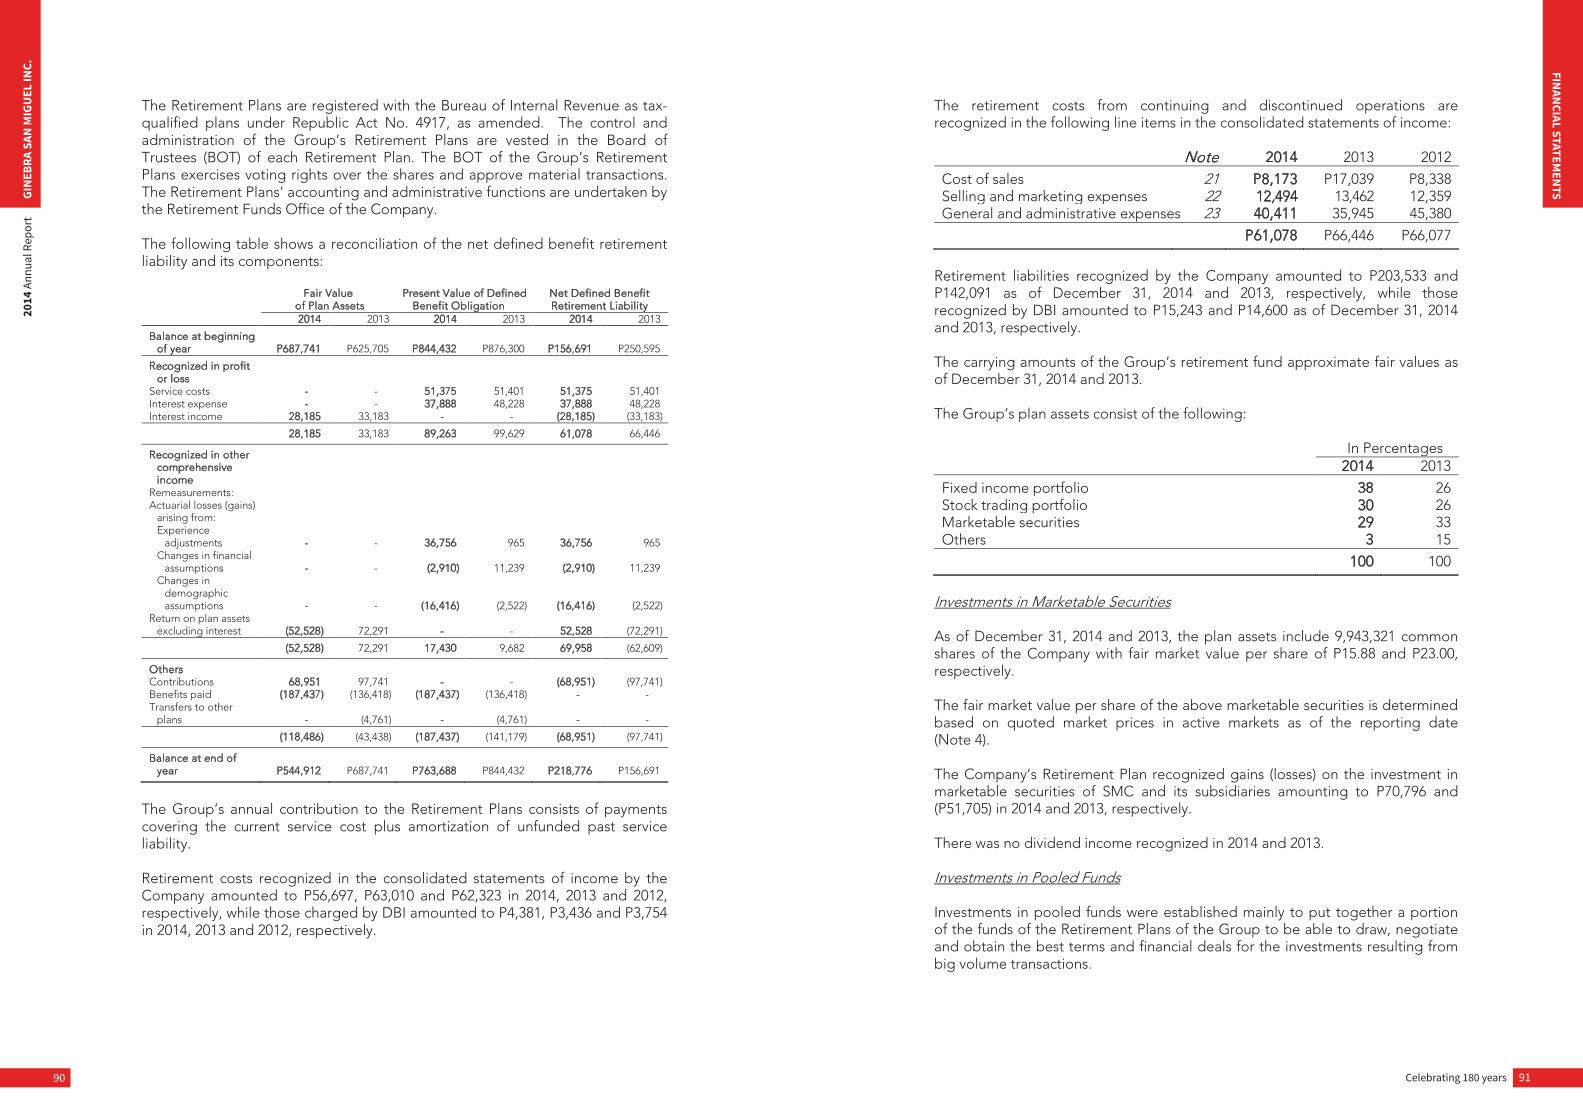
Celebrating 180 years 91
FINAN
CIAL STATEMEN
TS
90
GIN
EBRA
SAN
MIG
UEL
INC.
2014
Ann
ual R
epor
t
The Retirement Plans are registered with the Bureau of Internal Revenue as tax-qualified plans under Republic Act No. 4917, as amended. The control and administration of the Group’s Retirement Plans are vested in the Board of Trustees (BOT) of each Retirement Plan. The BOT of the Group’s Retirement Plans exercises voting rights over the shares and approve material transactions. The Retirement Plans’ accounting and administrative functions are undertaken by the Retirement Funds Office of the Company. The following table shows a reconciliation of the net defined benefit retirement liability and its components:
Fair Value
of Plan Assets Present Value of Defined
Benefit Obligation Net Defined Benefit Retirement Liability
2014 2013 2014 2013 2014 2013
Balance at beginning of year P687,741 P625,705 P844,432 P876,300 P156,691 P250,595
Recognized in profit or loss
Service costs - - 51,375 51,401 51,375 51,401 Interest expense - - 37,888 48,228 37,888 48,228 Interest income 28,185 33,183 - - (28,185) (33,183)
28,185 33,183 89,263 99,629 61,078 66,446
Recognized in other comprehensive income
Remeasurements: Actuarial losses (gains)
arising from: Experience
adjustments - - 36,756 965 36,756 965 Changes in financial
assumptions - - (2,910) 11,239 (2,910) 11,239 Changes in
demographic assumptions - - (16,416) (2,522) (16,416) (2,522)
Return on plan assets excluding interest (52,528) 72,291 - - 52,528 (72,291)
(52,528) 72,291 17,430 9,682 69,958 (62,609)
Others Contributions 68,951 97,741 - - (68,951) (97,741) Benefits paid (187,437) (136,418) (187,437) (136,418) - - Transfers to other
plans - (4,761) - (4,761) - -
(118,486) (43,438) (187,437) (141,179) (68,951) (97,741)
Balance at end of year P544,912 P687,741 P763,688 P844,432 P218,776 P156,691
The Group’s annual contribution to the Retirement Plans consists of payments covering the current service cost plus amortization of unfunded past service liability. Retirement costs recognized in the consolidated statements of income by the Company amounted to P56,697, P63,010 and P62,323 in 2014, 2013 and 2012, respectively, while those charged by DBI amounted to P4,381, P3,436 and P3,754 in 2014, 2013 and 2012, respectively.
The retirement costs from continuing and discontinued operations are recognized in the following line items in the consolidated statements of income:
Note 2014 2013 2012
Cost of sales 21 P8,173 P17,039 P8,338 Selling and marketing expenses 22 12,494 13,462 12,359 General and administrative expenses 23 40,411 35,945 45,380
P61,078 P66,446 P66,077
Retirement liabilities recognized by the Company amounted to P203,533 and P142,091 as of December 31, 2014 and 2013, respectively, while those recognized by DBI amounted to P15,243 and P14,600 as of December 31, 2014 and 2013, respectively. The carrying amounts of the Group’s retirement fund approximate fair values as of December 31, 2014 and 2013. The Group’s plan assets consist of the following:
In Percentages 2014 2013
Fixed income portfolio 38 26 Stock trading portfolio 30 26 Marketable securities 29 33 Others 3 15
100 100
Investments in Marketable Securities As of December 31, 2014 and 2013, the plan assets include 9,943,321 common shares of the Company with fair market value per share of P15.88 and P23.00, respectively. The fair market value per share of the above marketable securities is determined based on quoted market prices in active markets as of the reporting date (Note 4). The Company’s Retirement Plan recognized gains (losses) on the investment in marketable securities of SMC and its subsidiaries amounting to P70,796 and (P51,705) in 2014 and 2013, respectively. There was no dividend income recognized in 2014 and 2013. Investments in Pooled Funds Investments in pooled funds were established mainly to put together a portion of the funds of the Retirement Plans of the Group to be able to draw, negotiate and obtain the best terms and financial deals for the investments resulting from big volume transactions.
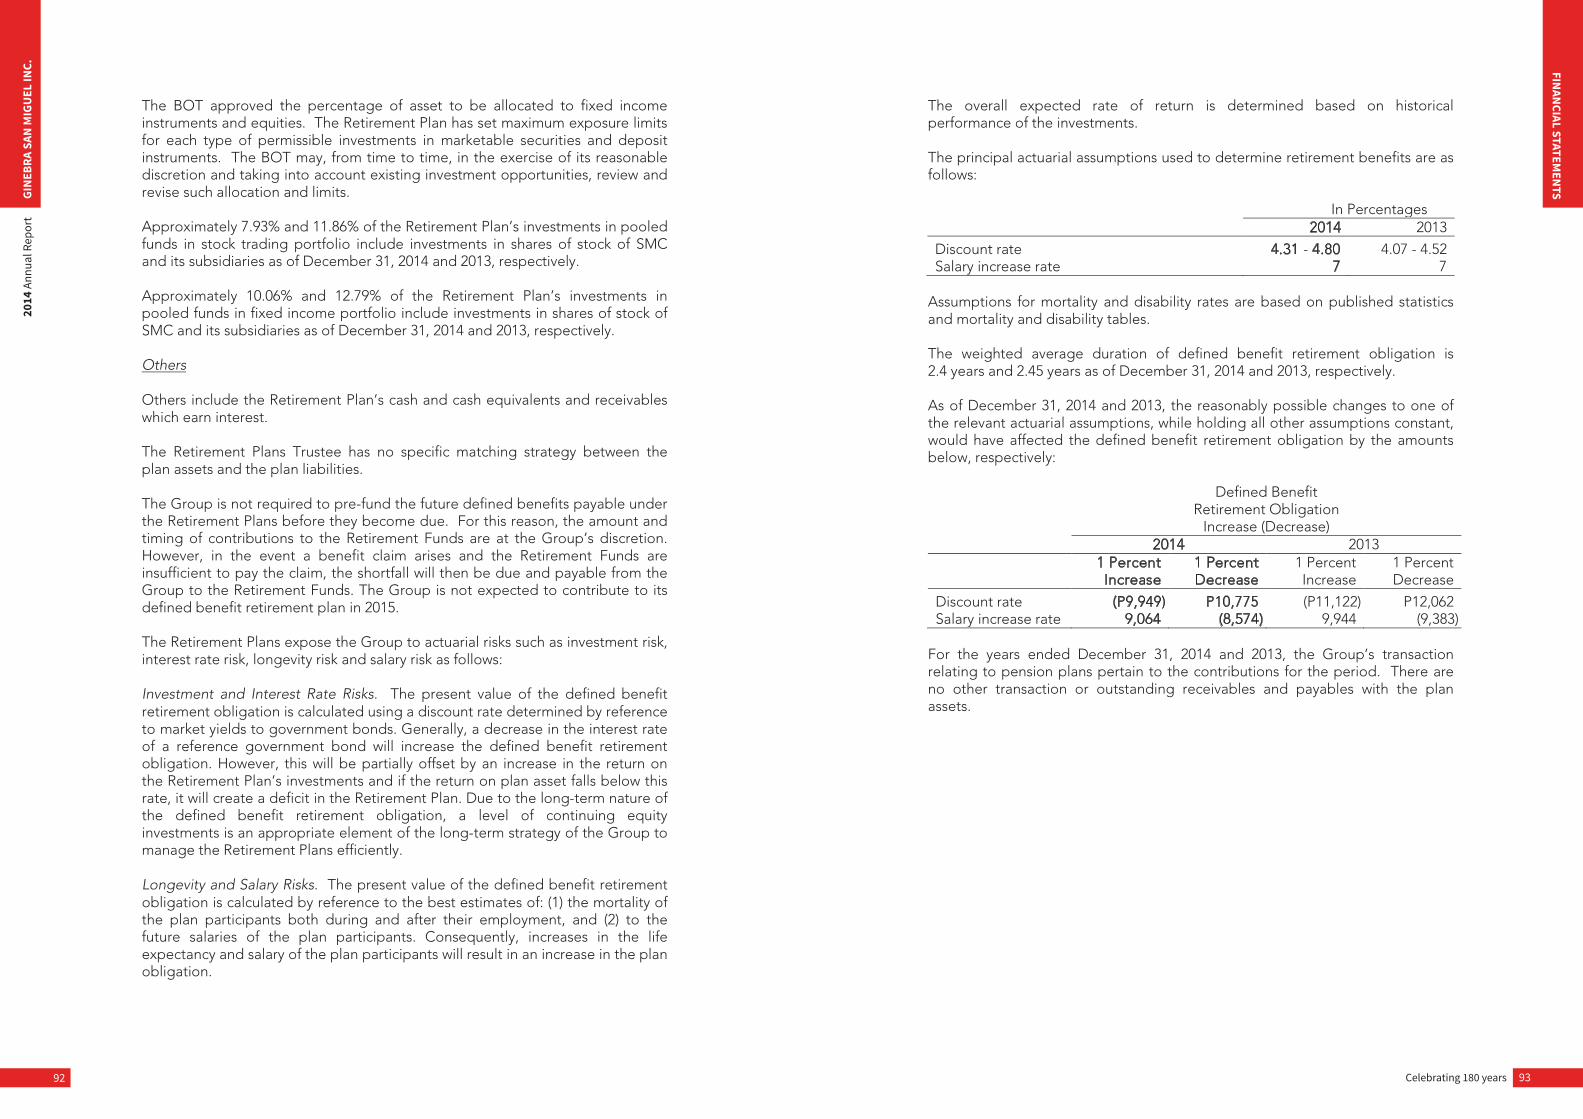
Celebrating 180 years 93
FINAN
CIAL STATEMEN
TS
92
GIN
EBRA
SAN
MIG
UEL
INC.
2014
Ann
ual R
epor
t
The BOT approved the percentage of asset to be allocated to fixed income instruments and equities. The Retirement Plan has set maximum exposure limits for each type of permissible investments in marketable securities and deposit instruments. The BOT may, from time to time, in the exercise of its reasonable discretion and taking into account existing investment opportunities, review and revise such allocation and limits. Approximately 7.93% and 11.86% of the Retirement Plan’s investments in pooled funds in stock trading portfolio include investments in shares of stock of SMC and its subsidiaries as of December 31, 2014 and 2013, respectively. Approximately 10.06% and 12.79% of the Retirement Plan’s investments in pooled funds in fixed income portfolio include investments in shares of stock of SMC and its subsidiaries as of December 31, 2014 and 2013, respectively. Others Others include the Retirement Plan’s cash and cash equivalents and receivables which earn interest. The Retirement Plans Trustee has no specific matching strategy between the plan assets and the plan liabilities. The Group is not required to pre-fund the future defined benefits payable under the Retirement Plans before they become due. For this reason, the amount and timing of contributions to the Retirement Funds are at the Group’s discretion. However, in the event a benefit claim arises and the Retirement Funds are insufficient to pay the claim, the shortfall will then be due and payable from the Group to the Retirement Funds. The Group is not expected to contribute to its defined benefit retirement plan in 2015. The Retirement Plans expose the Group to actuarial risks such as investment risk, interest rate risk, longevity risk and salary risk as follows: Investment and Interest Rate Risks. The present value of the defined benefit retirement obligation is calculated using a discount rate determined by reference to market yields to government bonds. Generally, a decrease in the interest rate of a reference government bond will increase the defined benefit retirement obligation. However, this will be partially offset by an increase in the return on the Retirement Plan’s investments and if the return on plan asset falls below this rate, it will create a deficit in the Retirement Plan. Due to the long-term nature of the defined benefit retirement obligation, a level of continuing equity investments is an appropriate element of the long-term strategy of the Group to manage the Retirement Plans efficiently. Longevity and Salary Risks. The present value of the defined benefit retirement obligation is calculated by reference to the best estimates of: (1) the mortality of the plan participants both during and after their employment, and (2) to the future salaries of the plan participants. Consequently, increases in the life expectancy and salary of the plan participants will result in an increase in the plan obligation.
The overall expected rate of return is determined based on historical performance of the investments. The principal actuarial assumptions used to determine retirement benefits are as follows: In Percentages 2014 2013
Discount rate 4.31 - 4.80 4.07 - 4.52 Salary increase rate 7 7
Assumptions for mortality and disability rates are based on published statistics and mortality and disability tables. The weighted average duration of defined benefit retirement obligation is 2.4 years and 2.45 years as of December 31, 2014 and 2013, respectively. As of December 31, 2014 and 2013, the reasonably possible changes to one of the relevant actuarial assumptions, while holding all other assumptions constant, would have affected the defined benefit retirement obligation by the amounts below, respectively:
Defined Benefit Retirement Obligation
Increase (Decrease) 2014 2013
1 Percent Increase
1 Percent Decrease
1 Percent Increase
1 Percent Decrease
Discount rate (P9,949) P10,775 (P11,122) P12,062 Salary increase rate 9,064 (8,574) 9,944 (9,383)
For the years ended December 31, 2014 and 2013, the Group’s transaction relating to pension plans pertain to the contributions for the period. There are no other transaction or outstanding receivables and payables with the plan assets.
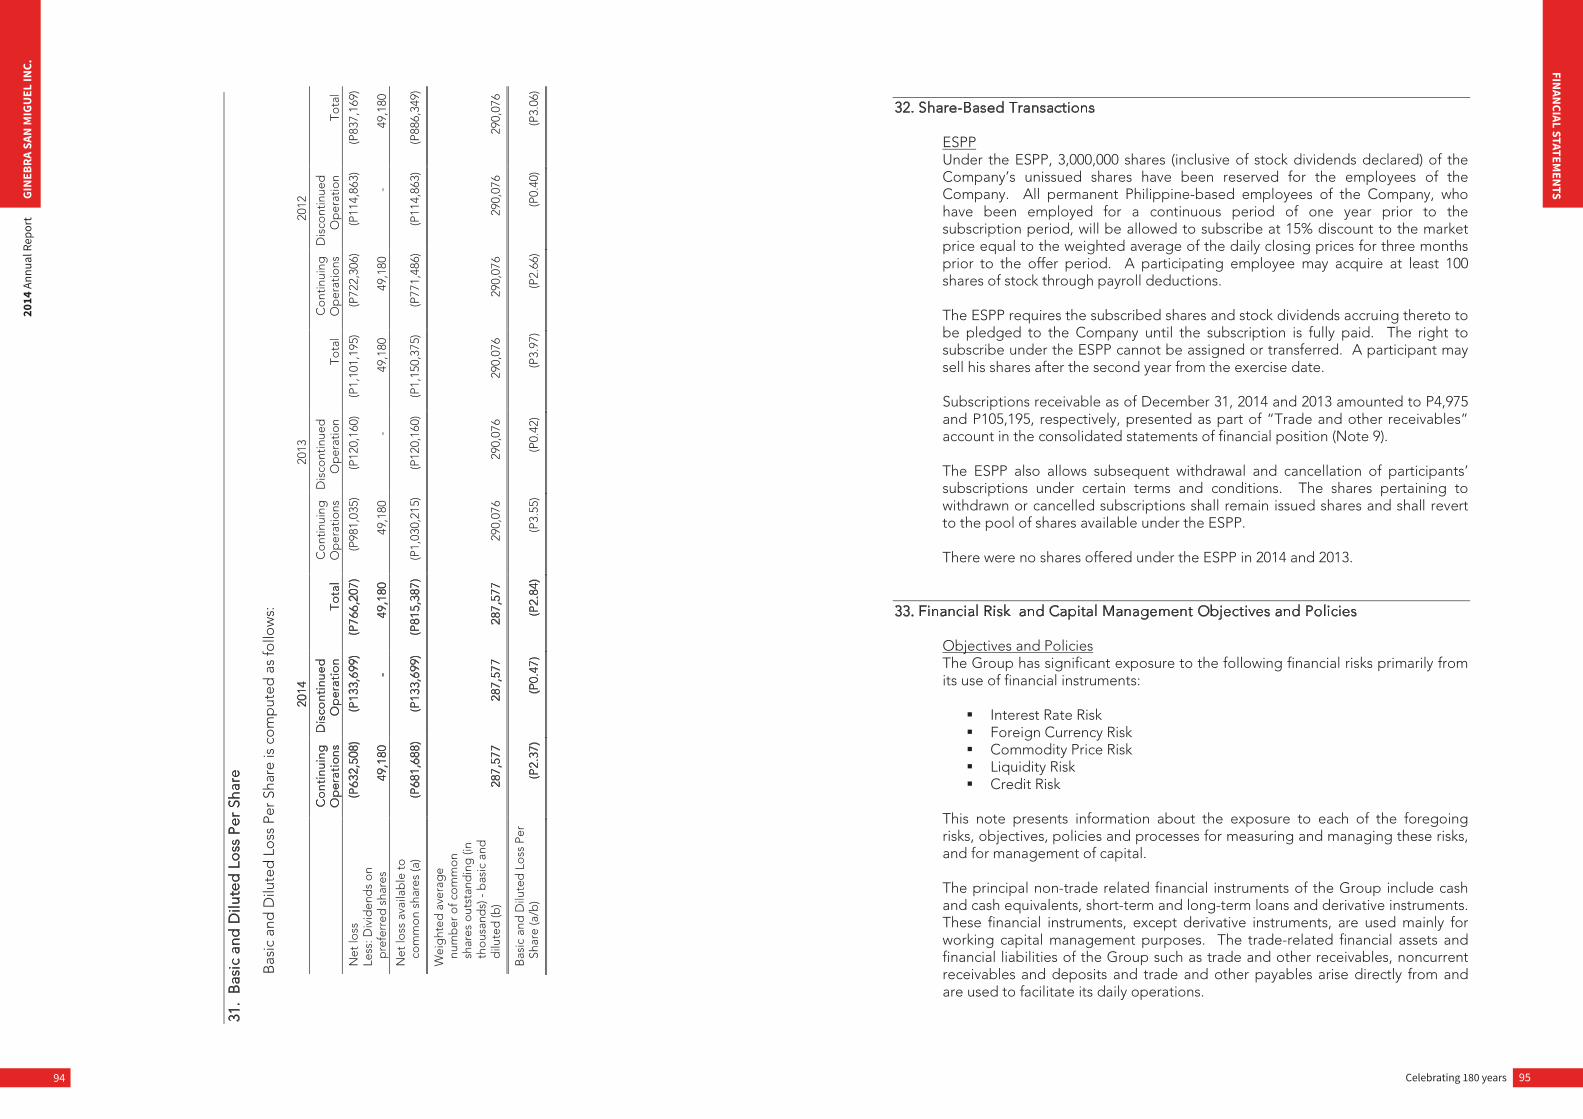
Celebrating 180 years 95
FINAN
CIAL STATEMEN
TS
94
GIN
EBRA
SAN
MIG
UEL
INC.
2014
Ann
ual R
epor
t
31.
Bas
ic a
nd D
ilute
d L
oss
Per
Sha
re
Bas
ic a
nd D
ilute
d L
oss
Per
Sha
re is
co
mp
uted
as
follo
ws:
20
14
2013
20
12
C
ont
inui
ng
Op
erat
ions
D
isco
ntin
ued
O
per
atio
n T
ota
l C
ont
inui
ng
Op
erat
ions
D
isco
ntin
ued
O
per
atio
n To
tal
Co
ntin
uing
O
per
atio
ns
Dis
cont
inue
d
Op
erat
ion
Tota
l
Net
loss
(P
632,
508)
(P
133,
699)
(P
766,
207)
(P
981,
035)
(P
120,
160)
(P
1,10
1,19
5)
(P72
2,30
6)
(P11
4,86
3)
(P83
7,16
9)
Less
: Div
iden
ds
on
pre
ferr
ed s
hare
s
49,1
80
-
49
,180
49
,180
-
49,1
80
49,1
80
-
49
,180
Net
loss
ava
ilab
le t
o co
mm
on
shar
es (a
) (P
681,
688)
(P
133,
699)
(P
815,
387)
(P
1,03
0,21
5)
(P12
0,16
0)
(P1,
150,
375)
(P
771,
486)
(P
114,
863)
(P
886,
349)
Wei
ght
ed a
vera
ge
num
ber
of c
om
mon
sh
ares
out
stan
din
g (i
n th
ous
and
s) -
bas
ic a
nd
dilu
ted
(b)
2 87,
577
287,
577
287,
577
290,
076
29
0,07
6 29
0,07
6 29
0,07
6 29
0,07
6 29
0,07
6
Bas
ic a
nd D
ilute
d L
oss
Per
Sh
are
(a/b
) ( P
2.37
) (P
0.47
) (P
2.84
) (P
3.55
) (P
0.42
) (P
3.97
) (P
2.66
) (P
0.40
) (P
3.06
)
32. Share-Based Transactions ESPP Under the ESPP, 3,000,000 shares (inclusive of stock dividends declared) of the Company’s unissued shares have been reserved for the employees of the Company. All permanent Philippine-based employees of the Company, who have been employed for a continuous period of one year prior to the subscription period, will be allowed to subscribe at 15% discount to the market price equal to the weighted average of the daily closing prices for three months prior to the offer period. A participating employee may acquire at least 100 shares of stock through payroll deductions. The ESPP requires the subscribed shares and stock dividends accruing thereto to be pledged to the Company until the subscription is fully paid. The right to subscribe under the ESPP cannot be assigned or transferred. A participant may sell his shares after the second year from the exercise date. Subscriptions receivable as of December 31, 2014 and 2013 amounted to P4,975 and P105,195, respectively, presented as part of “Trade and other receivables” account in the consolidated statements of financial position (Note 9). The ESPP also allows subsequent withdrawal and cancellation of participants’ subscriptions under certain terms and conditions. The shares pertaining to withdrawn or cancelled subscriptions shall remain issued shares and shall revert to the pool of shares available under the ESPP. There were no shares offered under the ESPP in 2014 and 2013.
33. Financial Risk and Capital Management Objectives and Policies Objectives and Policies The Group has significant exposure to the following financial risks primarily from its use of financial instruments: Interest Rate Risk Foreign Currency Risk Commodity Price Risk Liquidity Risk Credit Risk
This note presents information about the exposure to each of the foregoing risks, objectives, policies and processes for measuring and managing these risks, and for management of capital. The principal non-trade related financial instruments of the Group include cash and cash equivalents, short-term and long-term loans and derivative instruments. These financial instruments, except derivative instruments, are used mainly for working capital management purposes. The trade-related financial assets and financial liabilities of the Group such as trade and other receivables, noncurrent receivables and deposits and trade and other payables arise directly from and are used to facilitate its daily operations.
Celebrating 180 years 97
FINAN
CIAL STATEMEN
TS
96
GIN
EBRA
SAN
MIG
UEL
INC.
2014
Ann
ual R
epor
t
The BOD has the overall responsibility for the establishment and oversight of the risk management framework of the Group. The BOD has established the Risk Management Committee, which is responsible for developing and monitoring the risk management policies. The committee reports regularly to the BOD on its activities. The risk management policies of the Group are established to identify and analyze the risks faced by the Group, to set appropriate risk limits and controls, and to monitor risks and adherence to limits. Risk management policies and systems are reviewed regularly to reflect changes in market conditions and activities. The Group, through its training and management standards and procedures, aims to develop a disciplined and constructive control environment in which all employees understand their roles and obligations. The Audit Committee oversees how management monitors compliance with the risk management policies and procedures of the Group and reviews the adequacy of the risk management framework in relation to the risks faced by the Group. The Audit Committee is assisted in its oversight role by Internal Audit. Internal Audit undertakes both regular and ad hoc reviews of risk management controls and procedures, the results of which are reported to the Audit Committee. The BOD constituted the Audit Committee to assist the BOD in fulfilling its oversight responsibility of the Group’s corporate governance process relating to the: a) quality and integrity of the financial statements and financial reporting process and the systems of internal accounting and financial controls; b) performance of the internal auditors; c) annual independent audit of the financial statements, the engagement of the independent auditors and the evaluation of the independent auditors’ qualifications, independence and performance; d) compliance with legal and regulatory requirements, including the disclosure control and procedures; e) evaluation of management’s process to assess and manage the enterprise risk issues; and f) fulfillment of the other responsibilities set out by the BOD. The Audit Committee shall also prepare the reports required to be included in the annual report of the Group. The accounting policies in relation to derivatives are set out in Note 3 to the consolidated financial statements. Interest Rate Risk Interest rate risk is the risk that future cash flows from a financial instrument (cash flow interest rate risk) or its fair value (fair value interest rate risk) will fluctuate because of changes in market interest rates. The Group’s exposure to changes in interest rates relates primarily to the long-term borrowings. Borrowings issued at fixed rates expose the Group to fair value interest rate risk. On the other hand, borrowings issued at variable rates expose the Group to cash flow interest rate risk. The Group manages its interest cost by using an optimal combination of fixed and variable rate debt instruments. Management is responsible for monitoring the prevailing market-based interest rate and ensures that the mark-up rates charged on its borrowings are optimal and benchmarked against the rates charged by other creditor banks.
In managing interest rate risk, the Group aims to reduce the impact of short-term fluctuations on the earnings. Over the longer term, however, permanent changes in interest rates would have an impact on profit or loss. The management of interest rate risk is also supplemented by monitoring the sensitivity of the Group’s financial instruments to various standard and non-standard interest rate scenarios. Interest rate movements affect reported retained earnings arising from increases or decreases in interest income or interest expense as well as fair value changes reported in profit or loss, if any. The sensitivity to a reasonably possible 1% increase in the interest rates, with all other variables held constant, would have decreased the Group’s profit before tax (through the impact on floating rate borrowings) by P5,221 and P6,380 in 2014 and 2013, respectively. A 1% decrease in the interest rate would have had the equal but opposite effect. These changes are considered to be reasonably possible given the observation of prevailing market conditions in those periods. There is no impact on the Group’s other comprehensive income.
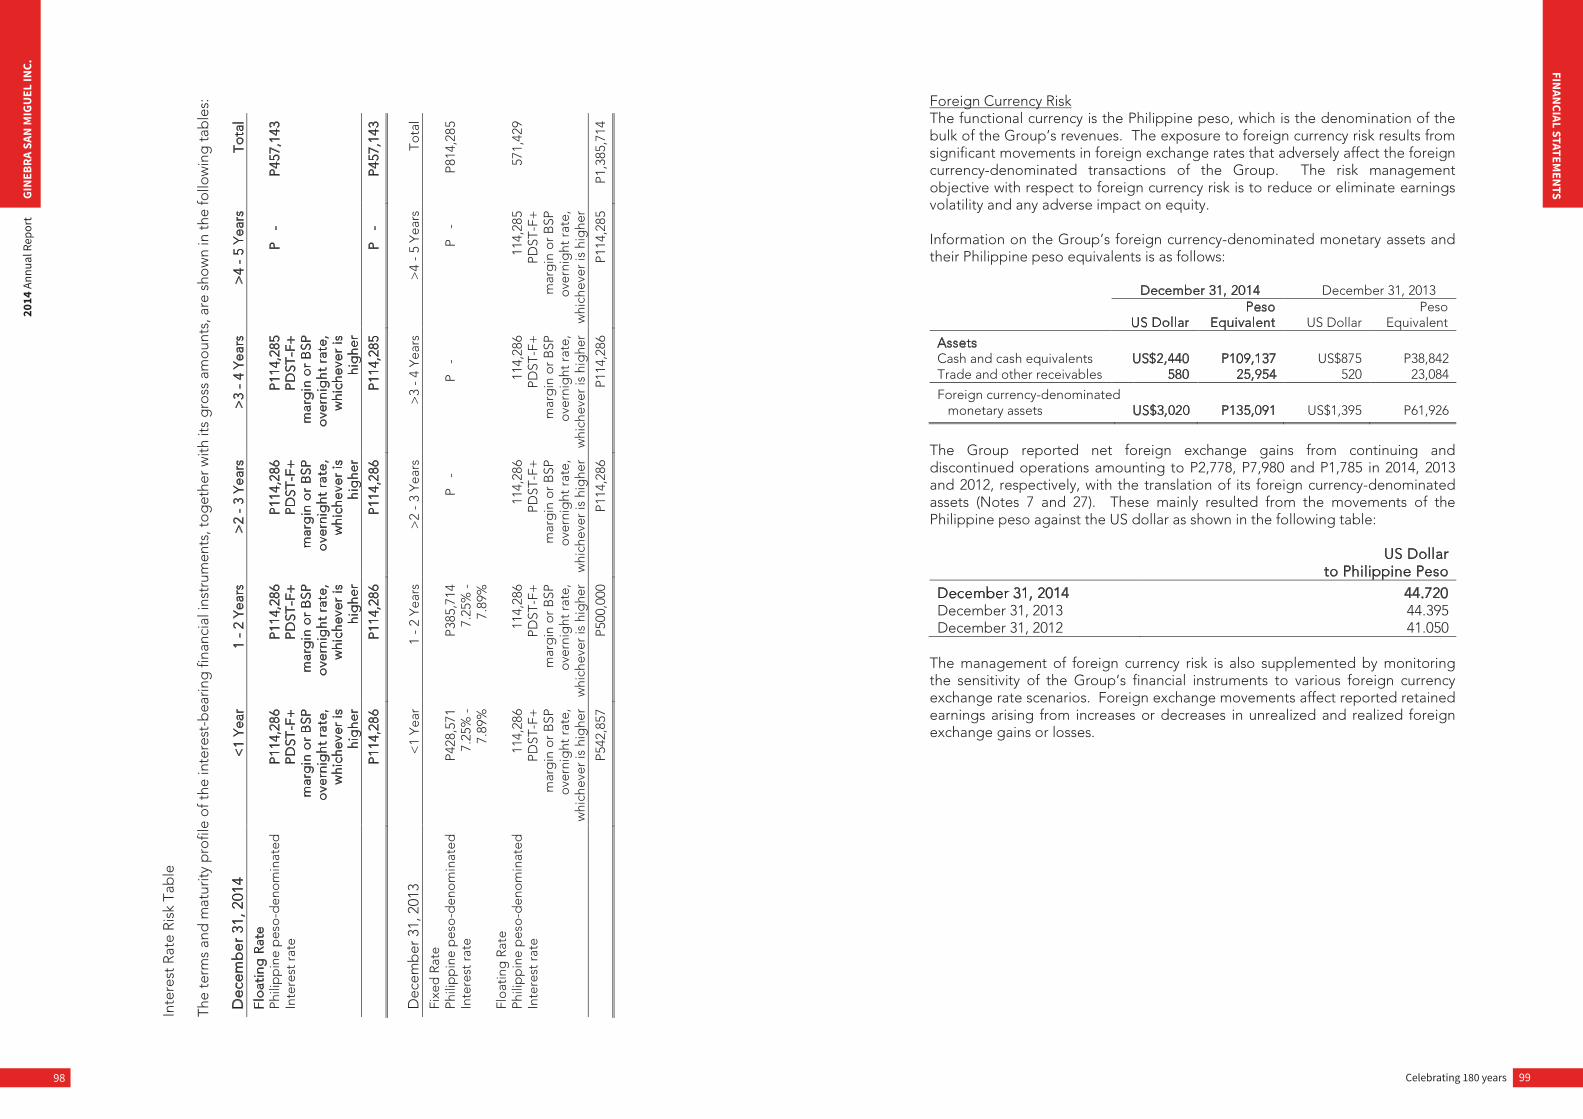
Celebrating 180 years 99
FINAN
CIAL STATEMEN
TS
98
GIN
EBRA
SAN
MIG
UEL
INC.
2014
Ann
ual R
epor
t
Inte
rest
Rat
e R
isk
Tab
le
The
term
s an
d m
atur
ity p
rofil
e o
f the
inte
rest
-bea
ring
fina
ncia
l ins
trum
ents
, to
get
her w
ith it
s g
ross
am
oun
ts, a
re s
how
n in
the
follo
win
g ta
ble
s:
Dec
emb
er 3
1, 2
014
<1
Yea
r 1
- 2
Yea
rs
>2
- 3
Yea
rs
>3
- 4
Yea
rs
>4
- 5
Yea
rs
To
tal
Flo
atin
g R
ate
Ph
ilip
pin
e p
eso
-den
omin
ated
P
114,
286
P11
4,28
6 P
114,
286
P11
4,28
5 P
-
P45
7,14
3 In
tere
st r
ate
PD
ST-F
+
PD
ST-F
+
PD
ST-F
+
PD
ST-F
+
m
arg
in o
r B
SP
ove
rnig
ht r
ate,
w
hich
ever
is
hig
her
mar
gin
or
BSP
o
vern
ight
rat
e,
whi
chev
er is
hi
ghe
r
mar
gin
or
BSP
o
vern
ight
rat
e,
whi
chev
er is
hi
ghe
r
mar
gin
or
BSP
o
vern
ight
rat
e,
whi
chev
er is
hi
ghe
r
P
114,
286
P11
4,28
6 P
114,
286
P11
4,28
5 P
-
P45
7,14
3
Dec
emb
er 3
1, 2
013
<1
Year
1
- 2
Year
s >
2 -
3 Ye
ars
>3
- 4
Year
s >
4 -
5 Ye
ars
Tota
l
Fixe
d R
ate
Phili
pp
ine
pes
o-d
enom
inat
ed
P428
,571
P3
85,7
14
P -
P -
P -
P814
,285
In
tere
st r
ate
7.25
% -
7.
25%
-
7.
89%
7.
89%
Floa
ting
Rat
e
Ph
ilip
pin
e p
eso
-den
omin
ated
11
4,28
6 11
4,28
6 11
4,28
6 11
4,28
6 11
4,28
5 57
1,42
9 In
tere
st r
ate
PDST
-F+
PD
ST-F
+
PDST
-F+
PD
ST-F
+
PDST
-F+
m
arg
in o
r B
SP
over
nig
ht r
ate,
w
hich
ever
is h
ighe
r
mar
gin
or
BSP
ov
erni
ght
rat
e,
whi
chev
er is
hig
her
mar
gin
or
BSP
ov
erni
ght
rat
e,
whi
chev
er is
hig
her
mar
gin
or
BSP
ov
erni
ght
rat
e,
whi
chev
er is
hig
her
mar
gin
or
BSP
ov
erni
ght
rat
e,
whi
chev
er is
hig
her
P5
42,8
57
P500
,000
P1
14,2
86
P114
,286
P1
14,2
85
P1,3
85,7
14
Foreign Currency Risk The functional currency is the Philippine peso, which is the denomination of the bulk of the Group’s revenues. The exposure to foreign currency risk results from significant movements in foreign exchange rates that adversely affect the foreign currency-denominated transactions of the Group. The risk management objective with respect to foreign currency risk is to reduce or eliminate earnings volatility and any adverse impact on equity. Information on the Group’s foreign currency-denominated monetary assets and their Philippine peso equivalents is as follows:
December 31, 2014 December 31, 2013
US Dollar Peso
Equivalent US Dollar Peso
Equivalent
Assets Cash and cash equivalents US$2,440 P109,137 US$875 P38,842 Trade and other receivables 580 25,954 520 23,084
Foreign currency-denominated monetary assets US$3,020 P135,091 US$1,395 P61,926
The Group reported net foreign exchange gains from continuing and discontinued operations amounting to P2,778, P7,980 and P1,785 in 2014, 2013 and 2012, respectively, with the translation of its foreign currency-denominated assets (Notes 7 and 27). These mainly resulted from the movements of the Philippine peso against the US dollar as shown in the following table:
US Dollar
to Philippine Peso
December 31, 2014 44.720 December 31, 2013 44.395 December 31, 2012 41.050
The management of foreign currency risk is also supplemented by monitoring the sensitivity of the Group’s financial instruments to various foreign currency exchange rate scenarios. Foreign exchange movements affect reported retained earnings arising from increases or decreases in unrealized and realized foreign exchange gains or losses.
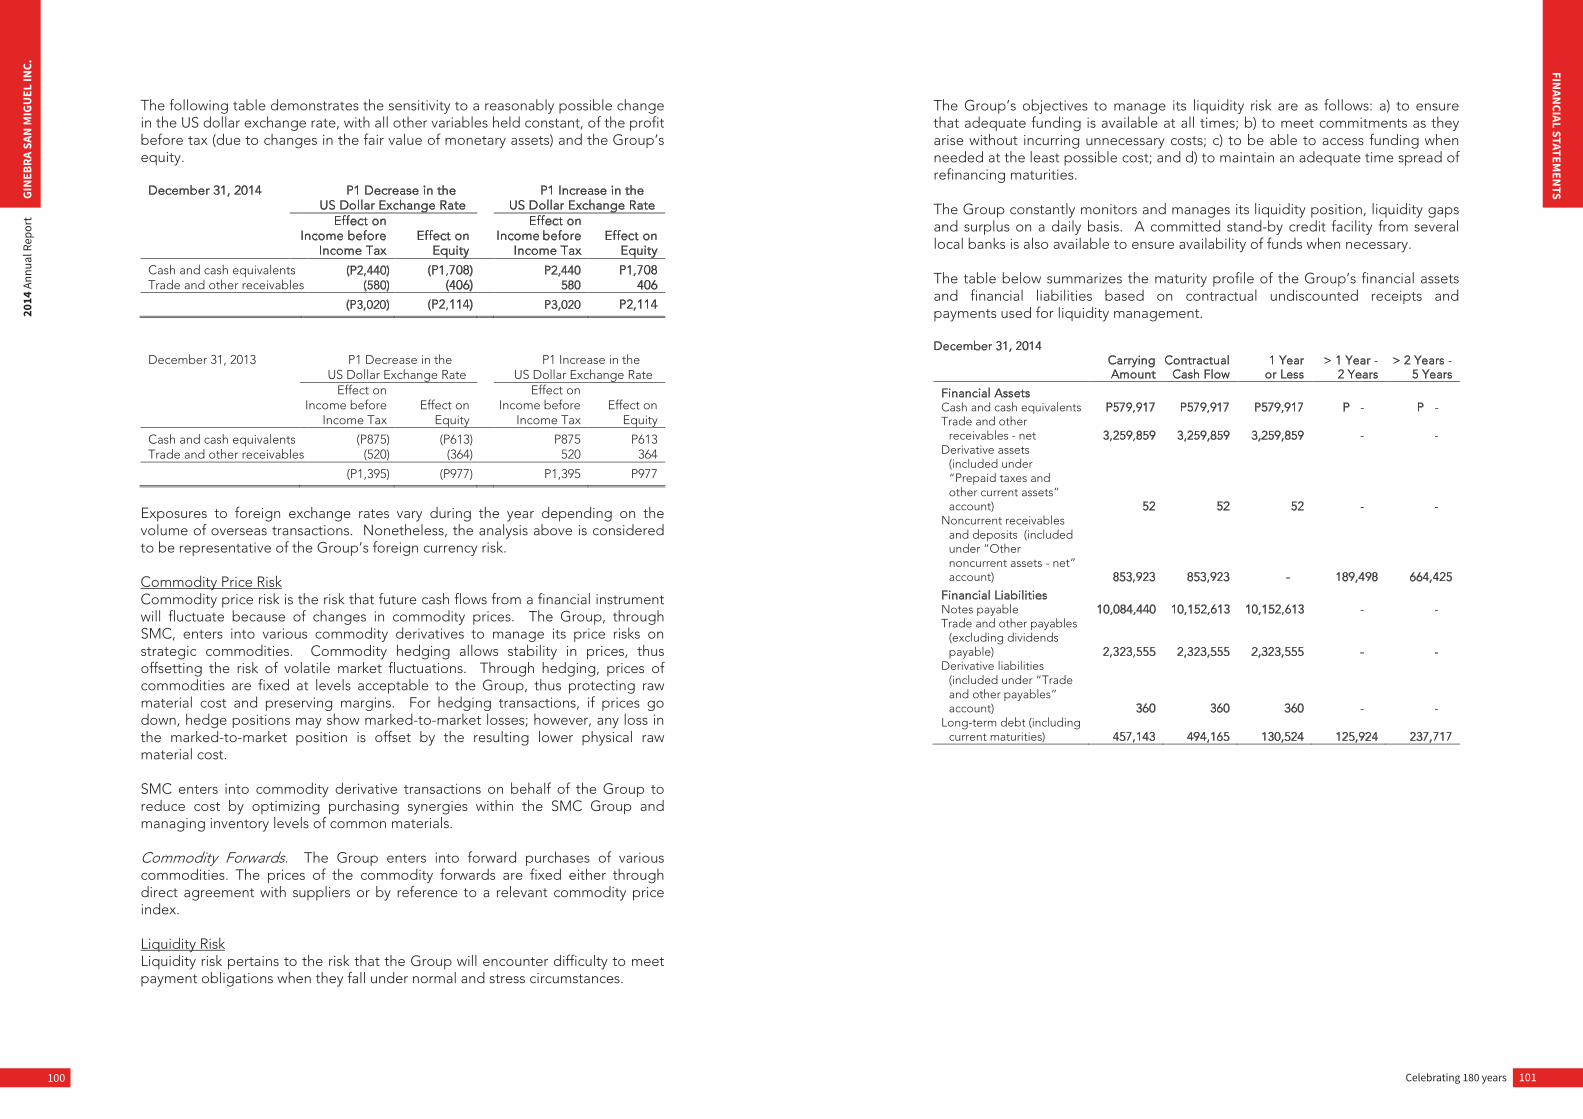
Celebrating 180 years 101
FINAN
CIAL STATEMEN
TS
100
GIN
EBRA
SAN
MIG
UEL
INC.
2014
Ann
ual R
epor
t
The following table demonstrates the sensitivity to a reasonably possible change in the US dollar exchange rate, with all other variables held constant, of the profit before tax (due to changes in the fair value of monetary assets) and the Group’s equity.
December 31, 2014 P1 Decrease in the US Dollar Exchange Rate
P1 Increase in the US Dollar Exchange Rate
Effect on Income before
Income Tax Effect on
Equity
Effect on Income before
Income Tax Effect on
Equity
Cash and cash equivalents (P2,440) (P1,708) P2,440 P1,708 Trade and other receivables (580) (406) 580 406
(P3,020) (P2,114) P3,020 P2,114
December 31, 2013 P1 Decrease in the US Dollar Exchange Rate
P1 Increase in the US Dollar Exchange Rate
Effect on Income before
Income Tax Effect on
Equity
Effect on Income before
Income Tax Effect on
Equity
Cash and cash equivalents (P875) (P613) P875 P613 Trade and other receivables (520) (364) 520 364
(P1,395) (P977) P1,395 P977
Exposures to foreign exchange rates vary during the year depending on the volume of overseas transactions. Nonetheless, the analysis above is considered to be representative of the Group’s foreign currency risk. Commodity Price Risk Commodity price risk is the risk that future cash flows from a financial instrument will fluctuate because of changes in commodity prices. The Group, through SMC, enters into various commodity derivatives to manage its price risks on strategic commodities. Commodity hedging allows stability in prices, thus offsetting the risk of volatile market fluctuations. Through hedging, prices of commodities are fixed at levels acceptable to the Group, thus protecting raw material cost and preserving margins. For hedging transactions, if prices go down, hedge positions may show marked-to-market losses; however, any loss in the marked-to-market position is offset by the resulting lower physical raw material cost. SMC enters into commodity derivative transactions on behalf of the Group to reduce cost by optimizing purchasing synergies within the SMC Group and managing inventory levels of common materials. Commodity Forwards. The Group enters into forward purchases of various commodities. The prices of the commodity forwards are fixed either through direct agreement with suppliers or by reference to a relevant commodity price index. Liquidity Risk Liquidity risk pertains to the risk that the Group will encounter difficulty to meet payment obligations when they fall under normal and stress circumstances.
The Group’s objectives to manage its liquidity risk are as follows: a) to ensure that adequate funding is available at all times; b) to meet commitments as they arise without incurring unnecessary costs; c) to be able to access funding when needed at the least possible cost; and d) to maintain an adequate time spread of refinancing maturities. The Group constantly monitors and manages its liquidity position, liquidity gaps and surplus on a daily basis. A committed stand-by credit facility from several local banks is also available to ensure availability of funds when necessary. The table below summarizes the maturity profile of the Group’s financial assets and financial liabilities based on contractual undiscounted receipts and payments used for liquidity management. December 31, 2014
Carrying Amount
Contractual Cash Flow
1 Year or Less
> 1 Year - 2 Years
> 2 Years - 5 Years
Financial Assets Cash and cash equivalents P579,917 P579,917 P579,917 P - P - Trade and other
receivables - net 3,259,859 3,259,859 3,259,859 - - Derivative assets
(included under “Prepaid taxes and other current assets” account) 52 52 52 - -
Noncurrent receivables and deposits (included under “Other noncurrent assets - net” account) 853,923 853,923 - 189,498 664,425
Financial Liabilities Notes payable 10,084,440 10,152,613 10,152,613 - - Trade and other payables
(excluding dividends payable) 2,323,555 2,323,555 2,323,555 - -
Derivative liabilities (included under “Trade and other payables” account) 360 360 360 - -
Long-term debt (including current maturities) 457,143 494,165 130,524 125,924 237,717
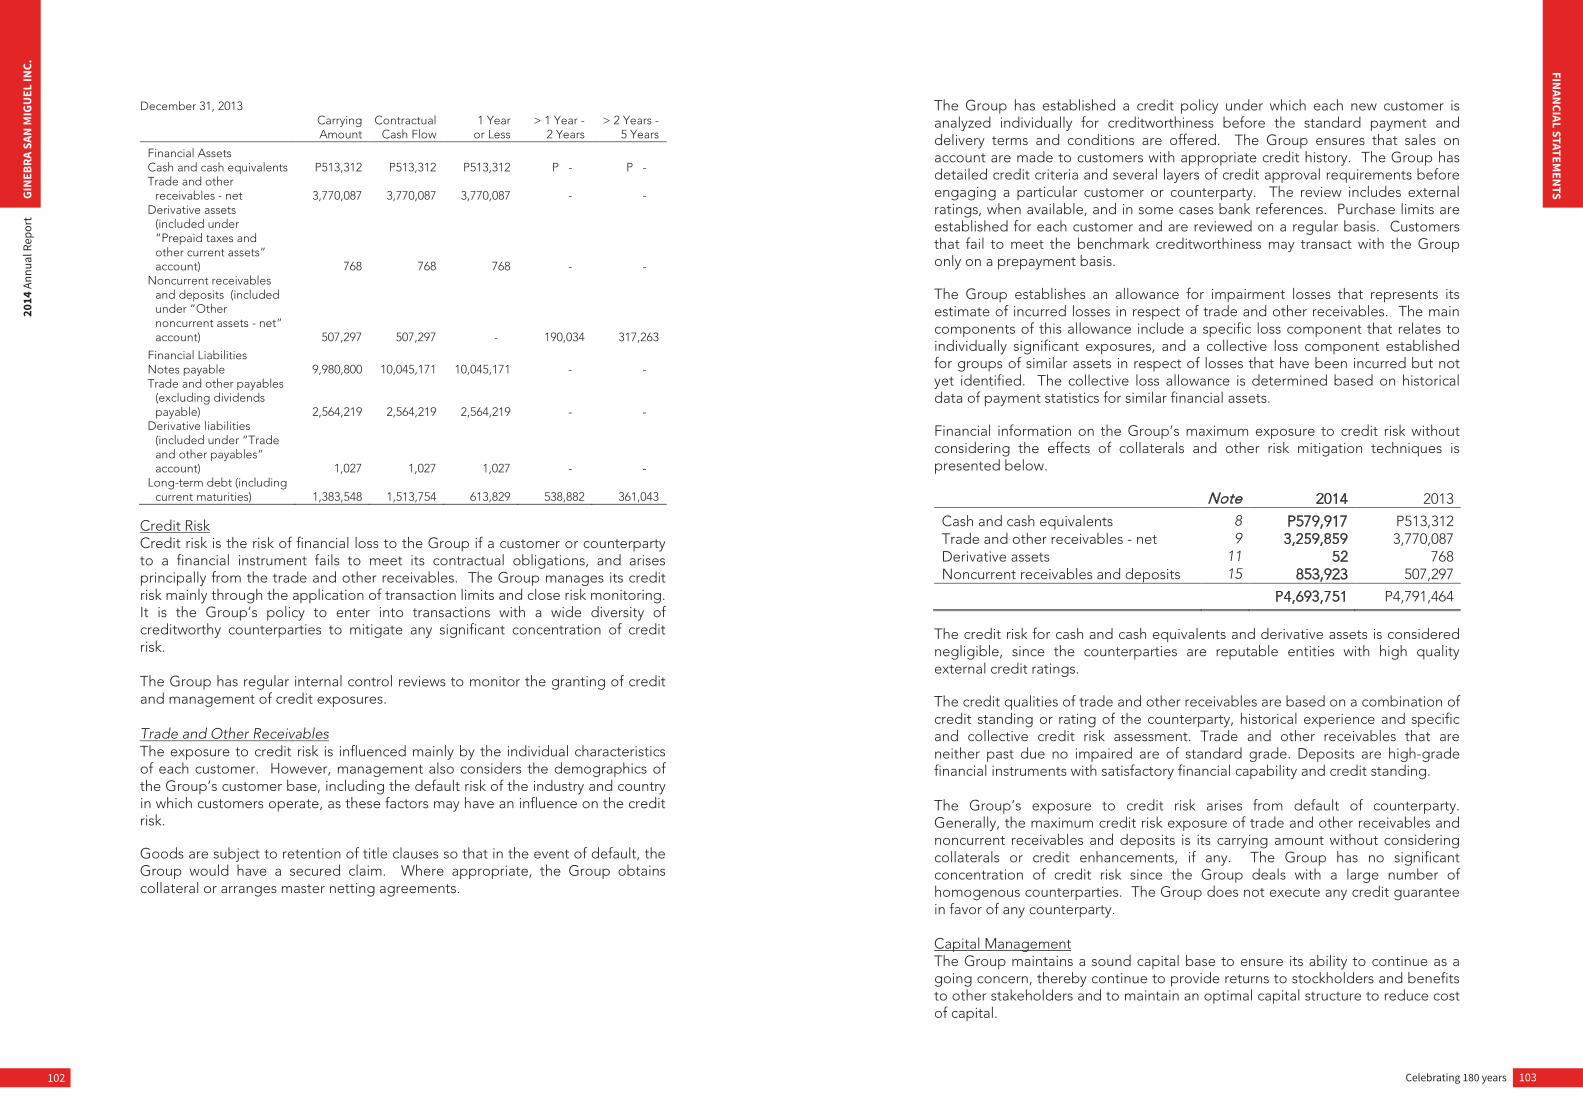
Celebrating 180 years 103
FINAN
CIAL STATEMEN
TS
102
GIN
EBRA
SAN
MIG
UEL
INC.
2014
Ann
ual R
epor
t
December 31, 2013
Carrying Amount
Contractual Cash Flow
1 Year or Less
> 1 Year - 2 Years
> 2 Years - 5 Years
Financial Assets Cash and cash equivalents P513,312 P513,312 P513,312 P - P - Trade and other
receivables - net 3,770,087 3,770,087 3,770,087 - - Derivative assets
(included under “Prepaid taxes and other current assets” account) 768 768 768 - -
Noncurrent receivables and deposits (included under “Other noncurrent assets - net” account) 507,297 507,297 - 190,034 317,263
Financial Liabilities Notes payable 9,980,800 10,045,171 10,045,171 - - Trade and other payables
(excluding dividends payable) 2,564,219 2,564,219 2,564,219 - -
Derivative liabilities (included under “Trade and other payables” account) 1,027 1,027 1,027 - -
Long-term debt (including current maturities) 1,383,548 1,513,754 613,829 538,882 361,043
Credit Risk Credit risk is the risk of financial loss to the Group if a customer or counterparty to a financial instrument fails to meet its contractual obligations, and arises principally from the trade and other receivables. The Group manages its credit risk mainly through the application of transaction limits and close risk monitoring. It is the Group’s policy to enter into transactions with a wide diversity of creditworthy counterparties to mitigate any significant concentration of credit risk. The Group has regular internal control reviews to monitor the granting of credit and management of credit exposures. Trade and Other Receivables The exposure to credit risk is influenced mainly by the individual characteristics of each customer. However, management also considers the demographics of the Group’s customer base, including the default risk of the industry and country in which customers operate, as these factors may have an influence on the credit risk. Goods are subject to retention of title clauses so that in the event of default, the Group would have a secured claim. Where appropriate, the Group obtains collateral or arranges master netting agreements.
The Group has established a credit policy under which each new customer is analyzed individually for creditworthiness before the standard payment and delivery terms and conditions are offered. The Group ensures that sales on account are made to customers with appropriate credit history. The Group has detailed credit criteria and several layers of credit approval requirements before engaging a particular customer or counterparty. The review includes external ratings, when available, and in some cases bank references. Purchase limits are established for each customer and are reviewed on a regular basis. Customers that fail to meet the benchmark creditworthiness may transact with the Group only on a prepayment basis. The Group establishes an allowance for impairment losses that represents its estimate of incurred losses in respect of trade and other receivables. The main components of this allowance include a specific loss component that relates to individually significant exposures, and a collective loss component established for groups of similar assets in respect of losses that have been incurred but not yet identified. The collective loss allowance is determined based on historical data of payment statistics for similar financial assets. Financial information on the Group’s maximum exposure to credit risk without considering the effects of collaterals and other risk mitigation techniques is presented below.
Note 2014 2013
Cash and cash equivalents 8 P579,917 P513,312 Trade and other receivables - net 9 3,259,859 3,770,087 Derivative assets 11 52 768 Noncurrent receivables and deposits 15 853,923 507,297
P4,693,751 P4,791,464 The credit risk for cash and cash equivalents and derivative assets is considered negligible, since the counterparties are reputable entities with high quality external credit ratings. The credit qualities of trade and other receivables are based on a combination of credit standing or rating of the counterparty, historical experience and specific and collective credit risk assessment. Trade and other receivables that are neither past due no impaired are of standard grade. Deposits are high-grade financial instruments with satisfactory financial capability and credit standing. The Group’s exposure to credit risk arises from default of counterparty. Generally, the maximum credit risk exposure of trade and other receivables and noncurrent receivables and deposits is its carrying amount without considering collaterals or credit enhancements, if any. The Group has no significant concentration of credit risk since the Group deals with a large number of homogenous counterparties. The Group does not execute any credit guarantee in favor of any counterparty. Capital Management The Group maintains a sound capital base to ensure its ability to continue as a going concern, thereby continue to provide returns to stockholders and benefits to other stakeholders and to maintain an optimal capital structure to reduce cost of capital.
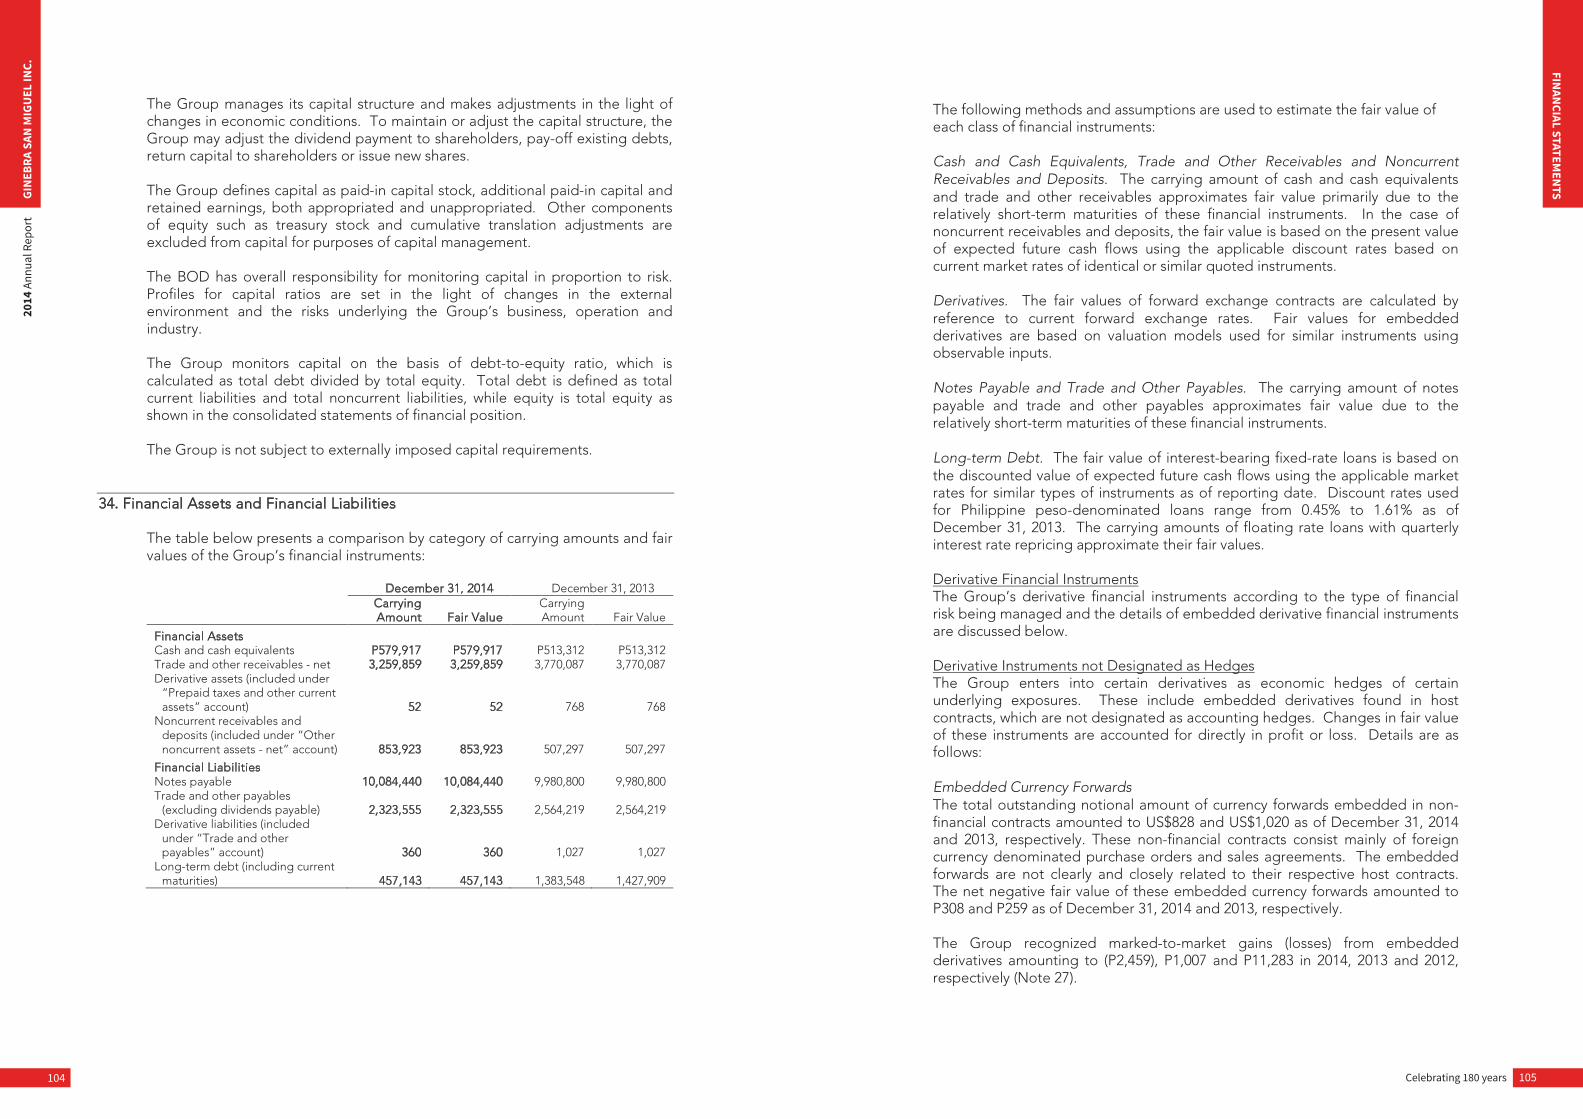
Celebrating 180 years 105
FINAN
CIAL STATEMEN
TS
104
GIN
EBRA
SAN
MIG
UEL
INC.
2014
Ann
ual R
epor
t
The Group manages its capital structure and makes adjustments in the light of changes in economic conditions. To maintain or adjust the capital structure, the Group may adjust the dividend payment to shareholders, pay-off existing debts, return capital to shareholders or issue new shares. The Group defines capital as paid-in capital stock, additional paid-in capital and retained earnings, both appropriated and unappropriated. Other components of equity such as treasury stock and cumulative translation adjustments are excluded from capital for purposes of capital management. The BOD has overall responsibility for monitoring capital in proportion to risk. Profiles for capital ratios are set in the light of changes in the external environment and the risks underlying the Group’s business, operation and industry. The Group monitors capital on the basis of debt-to-equity ratio, which is calculated as total debt divided by total equity. Total debt is defined as total current liabilities and total noncurrent liabilities, while equity is total equity as shown in the consolidated statements of financial position. The Group is not subject to externally imposed capital requirements.
34. Financial Assets and Financial Liabilities The table below presents a comparison by category of carrying amounts and fair values of the Group’s financial instruments:
December 31, 2014 December 31, 2013
Carrying Amount Fair Value
Carrying Amount Fair Value
Financial Assets Cash and cash equivalents P579,917 P579,917 P513,312 P513,312 Trade and other receivables - net 3,259,859 3,259,859 3,770,087 3,770,087 Derivative assets (included under
“Prepaid taxes and other current assets” account) 52 52 768 768
Noncurrent receivables and deposits (included under “Other noncurrent assets - net” account) 853,923 853,923 507,297 507,297
Financial Liabilities Notes payable 10,084,440 10,084,440 9,980,800 9,980,800 Trade and other payables
(excluding dividends payable) 2,323,555 2,323,555 2,564,219 2,564,219 Derivative liabilities (included
under “Trade and other payables” account) 360 360 1,027 1,027
Long-term debt (including current maturities) 457,143 457,143 1,383,548 1,427,909
The following methods and assumptions are used to estimate the fair value of each class of financial instruments: Cash and Cash Equivalents, Trade and Other Receivables and Noncurrent Receivables and Deposits. The carrying amount of cash and cash equivalents and trade and other receivables approximates fair value primarily due to the relatively short-term maturities of these financial instruments. In the case of noncurrent receivables and deposits, the fair value is based on the present value of expected future cash flows using the applicable discount rates based on current market rates of identical or similar quoted instruments. Derivatives. The fair values of forward exchange contracts are calculated by reference to current forward exchange rates. Fair values for embedded derivatives are based on valuation models used for similar instruments using observable inputs. Notes Payable and Trade and Other Payables. The carrying amount of notes payable and trade and other payables approximates fair value due to the relatively short-term maturities of these financial instruments. Long-term Debt. The fair value of interest-bearing fixed-rate loans is based on the discounted value of expected future cash flows using the applicable market rates for similar types of instruments as of reporting date. Discount rates used for Philippine peso-denominated loans range from 0.45% to 1.61% as of December 31, 2013. The carrying amounts of floating rate loans with quarterly interest rate repricing approximate their fair values. Derivative Financial Instruments The Group’s derivative financial instruments according to the type of financial risk being managed and the details of embedded derivative financial instruments are discussed below. Derivative Instruments not Designated as Hedges The Group enters into certain derivatives as economic hedges of certain underlying exposures. These include embedded derivatives found in host contracts, which are not designated as accounting hedges. Changes in fair value of these instruments are accounted for directly in profit or loss. Details are as follows: Embedded Currency Forwards The total outstanding notional amount of currency forwards embedded in non-financial contracts amounted to US$828 and US$1,020 as of December 31, 2014 and 2013, respectively. These non-financial contracts consist mainly of foreign currency denominated purchase orders and sales agreements. The embedded forwards are not clearly and closely related to their respective host contracts. The net negative fair value of these embedded currency forwards amounted to P308 and P259 as of December 31, 2014 and 2013, respectively. The Group recognized marked-to-market gains (losses) from embedded derivatives amounting to (P2,459), P1,007 and P11,283 in 2014, 2013 and 2012, respectively (Note 27).
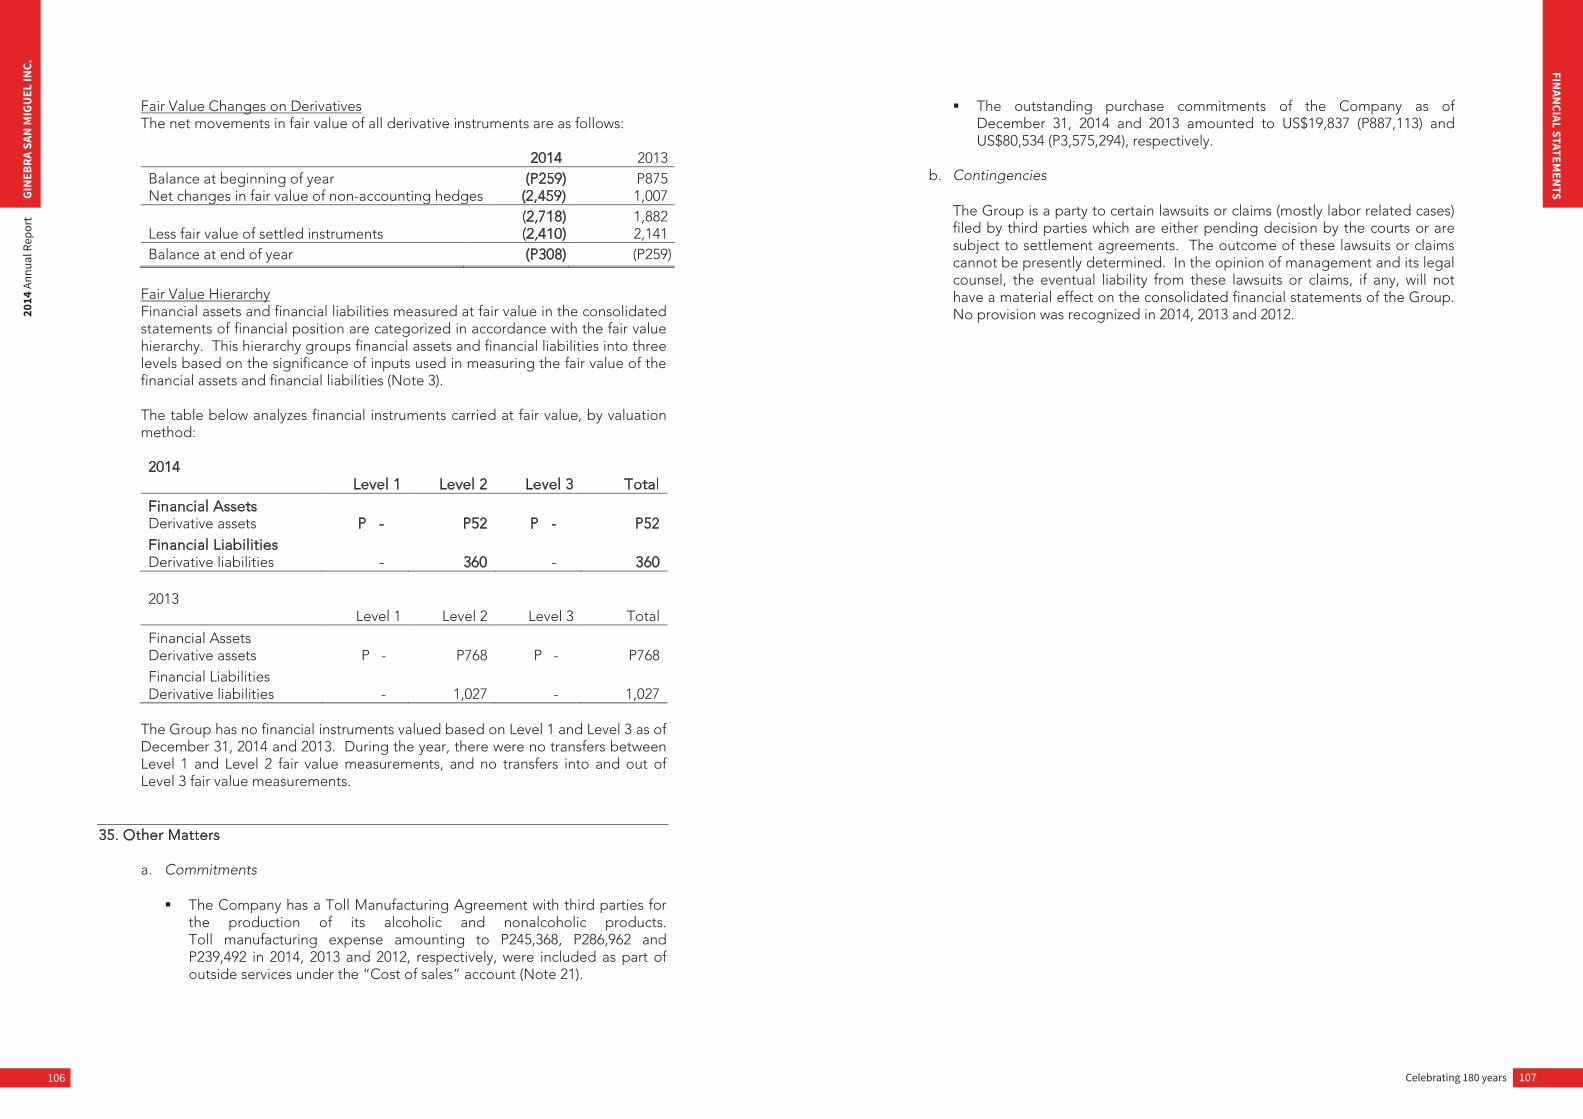
Celebrating 180 years 107
FINAN
CIAL STATEMEN
TS
106
GIN
EBRA
SAN
MIG
UEL
INC.
2014
Ann
ual R
epor
t
Fair Value Changes on Derivatives The net movements in fair value of all derivative instruments are as follows:
2014 2013 Balance at beginning of year (P259) P875 Net changes in fair value of non-accounting hedges (2,459) 1,007 (2,718) 1,882 Less fair value of settled instruments (2,410) 2,141 Balance at end of year (P308) (P259)
Fair Value Hierarchy Financial assets and financial liabilities measured at fair value in the consolidated statements of financial position are categorized in accordance with the fair value hierarchy. This hierarchy groups financial assets and financial liabilities into three levels based on the significance of inputs used in measuring the fair value of the financial assets and financial liabilities (Note 3). The table below analyzes financial instruments carried at fair value, by valuation method:
2014 Level 1 Level 2 Level 3 Total
Financial Assets Derivative assets P - P52 P - P52 Financial Liabilities Derivative liabilities - 360 - 360
2013 Level 1 Level 2 Level 3 Total
Financial Assets Derivative assets P - P768 P - P768 Financial Liabilities Derivative liabilities - 1,027 - 1,027
The Group has no financial instruments valued based on Level 1 and Level 3 as of December 31, 2014 and 2013. During the year, there were no transfers between Level 1 and Level 2 fair value measurements, and no transfers into and out of Level 3 fair value measurements.
35. Other Matters a. Commitments
The Company has a Toll Manufacturing Agreement with third parties for
the production of its alcoholic and nonalcoholic products. Toll manufacturing expense amounting to P245,368, P286,962 and P239,492 in 2014, 2013 and 2012, respectively, were included as part of outside services under the “Cost of sales” account (Note 21).
The outstanding purchase commitments of the Company as of December 31, 2014 and 2013 amounted to US$19,837 (P887,113) and US$80,534 (P3,575,294), respectively.
b. Contingencies
The Group is a party to certain lawsuits or claims (mostly labor related cases) filed by third parties which are either pending decision by the courts or are subject to settlement agreements. The outcome of these lawsuits or claims cannot be presently determined. In the opinion of management and its legal counsel, the eventual liability from these lawsuits or claims, if any, will not have a material effect on the consolidated financial statements of the Group. No provision was recognized in 2014, 2013 and 2012.

CORPORATE HEAD OFFICEGinebra San Miguel Inc.3rd and 6th FloorsSan Miguel Properties Centre7 St. Francis St., Mandaluyong City1550 Metro Manila, PhilippinesTelephone: (632) 841-5100Fax: (632) 841-5240
SHAREHOUSE SERVICES AND ASSISTANCEThe SMC Stock Transfer Services Corporation serves as the Company’s stock transfer agent and registrar. For inquiries regarding dividend payments, change of address and account status, lost or damaged stock certificate, please write or call:
SMC STOCK TRANSFER SERVICE CORPORATION2nd Floor, SMC Head Office40 San Miguel Avenue, Mandaluyong City1550 Metro Manila, PhilippinesTelephone: (632) 632-3450 to 52Email Address: [email protected]
CUSTOMER CAREFor inquiries, orders and suggestions on our products and services, please write or call:
SAN MIGUEL CUSTOMER CARE CENTERSan Miguel Properties Centre7 St. Francis St., Mandaluyong City1550 Metro Manila, PhilippinesTelephone: (632) 632-BLOG (2564)Fax: (632) 632-3299 Mailbox No. 2005#Email: [email protected]