Embed Size (px)
Citation preview

2012-13SECOND QUARTER REPORT
October through December

MetroMaking a great place
Clean air and clean water do not stop at city limits or county lines. Neither does the need for jobs, a thriving economy and good transportation choices for people and businesses in our region. Voters have asked Metro to help with the challenges that cross those lines and affect the 25 cities and three counties in the Portland metropolitan area.
A regional approach simply makes sense when it comes to protecting open space, caring for parks, planning for the best use of land, managing garbage disposal and increasing recycling. Metro oversees world-class facilities such as the Oregon Zoo, which contributes to conservation and education, and the Oregon Convention Center, which benefits the region’s economy.
Your Metro representatives
Council President Tom Hughes 503-797-1889
District 1 Shirley Craddick 503-797-1547
District 2 Carlotta Collette 503-797-1887
District 3 Craig Dirksen 503-797-1549
District 4 Kathryn Harrington 503-797-1553
District 5 Sam Chase 503-797-1546
District 6 Bob Stacey 503-797-1552
Auditor Suzanne Flynn, CIA 503-797-1891
2012-13SECOND QUARTER REPORT October through December
printed on recycled content papter

Metro Quarterly Report, October through December 2012
FY 2012-13 Quarterly
Report
SecondQuarter
Executive Summary 2
Metro RevenuesOverall Revenues 5Program Revenues 5General Revenues 9
Metro Expenditures
Operating DepartmentsAll Operating Departments 10MERC 10The Oregon Zoo 11Planning and Development 12Research Center 13Parks and Environmental Services 13Sustainability Center 14
Support DepartmentsAll Support Departments 16Council Office 16Office of the Auditor 16Office of the Metro Attorney 16Communications 16Finance and Regulatory Services 17Human Resources 17Information Services 17
Non-departmental ExpendituresNon-departmental 17
Appendix– Fund Tables, year to year comparison 18
Appendix– Excise Tax Forecast 30
Appendix– Capital Budget mid-year status 31
1

Metro Quarterly Report, October through December 2012
EXECUTIVE SUMMARY
February 19, 2013
President Tom Hughes Members of the Metro Council Interested Parties
On behalf of the Finance Team, I am today delivering Metro’s Second Quarter Financial Report for FY 2012-13. As we pointed out in the first quarter’s report, we expect this year’s performance to track very closely to budget. This report covers the first half of the year and anticipates our financial position at year end, shown in the table below. The second quarter is particularly important for developing our next budget, both for operations and for capital improvement planning.
YTD % Year-end Year-end 3-YearBudget Actual YTD of Budget Projection % of Budget Average
RevenueProgram Revenues 133,790,713 61,882,227 46.3% 126,221,278 94.3% 94.6%General Revenues 83,457,319 59,004,191 70.7% 82,981,788 99.4% 99.5%Other Financing Sources 0 502,200 502,200 N/A
Revenue $217,248,032 $121,388,617 55.9% $209,705,266 96.5%
YTD % Year-end Year-end 3-YearBudget Actual YTD of Budget Projection % of Budget Average
Personal Services 79,767,638 38,228,408 47.9% 77,236,065 96.8% 95.1%Materials and Services 116,358,219 40,522,261 34.8% 102,953,420 88.5% 69.6%
Total Operating Expenditures 196,125,857 78,750,669 40.2% 180,189,485 91.9% 79.3%
Total Capital Outlay 62,382,104 9,852,272 15.8% 38,099,991 61.1% 44.3%
Total Renewal and Replacement 3,799,260 538,312 14.2% 3,001,034 79.0% 68.4%
Total Expenditures $262,307,221 $89,141,252 34.0% $221,290,510 84.4% 72.3%
Estimating revenues conservatively proves wise
Revenues are budgeted conservatively to reflect the continuing sluggishness in the economy, an approach which continue to be wise. Total revenues are tracking to budget more closely than ever. There continues to be encouraging signs at the venues, as revenues are tracking higher than budget. A blockbuster ZooLights presentation and the birth of baby Lily returned the zoo to its positive revenue track after a small slump in the first quarter. Transient lodging tax and construction excise tax are returning to prerecession levels and are beginning to show a return to modest growth. Property tax collections are on target and are projected to end the year right on budget.
However, there are some areas of concern. The implementation of new cemetery fees last November has not demonstrated the impacts we were hoping for, and we are revisiting our pricing strategy on a go forward basis. Parks admission fees continue to slump, and we are still waiting on data to see how the new Glendoveer contract will perform. Solid waste tonnage in the region continues to slowly climb, but we are finding those returning tons are going to private facilities and not to Metro’s transfer stations.
Expenditures also track closely to budget
Operating expenditures also remain closer to budgeted levels than in the past. In a positive way we are watching closely the revenue-expenditure tandem for the venues. As revenues increase with activity, expenditures for the cost of food and beverage and event staffing follow. As parks revenues continue to sag we will be looking to slow spending to lessen the budgetary impacts.
2

Metro Quarterly Report, October through December 2012
Capital project update
At the second and fourth quarters we report on the progress of the Capital Improvement Plan (CIP). The review at the second quarter is particularly helpful in updating and developing the plan for the following year.
The five-year CIP includes 52 projects. The greatest spending is anticipated for acquisition of land under the Natural Areas bond program and intensive construction at the zoo under the Oregon Zoo Infrastructure and Animal Welfare bond program. The second quarter saw completion of roof projects at Central Household Hazardous Waste and Expo. The zoo’s conditional use master plan was well on its way to approval, which we received early in the third quarter.
The full report is included in the appendix.
Anticipating a third quarter bond refinancing
We have recently been reaffirmed as a AAA bond rated agency and will be looking to refund an outstanding bond issue at the MRC and zoo in third quarter. This refunding should save Metro a little more than $1 million over the remaining term of the bonds.
Second quarter prognosis: on track
Generally the news has been positive. The venue activity is going well; zoo attendance received a good bounce from Lily and ZooLights. The tightness of the expenditures to appropriations will require close monitoring in the spring to avoid any exceptions.
What can we expect for FY 2013-14?
The budget process for FY 2013-14 has begun in earnest and we must continue to closely monitor revenues and expenditures to ensure financial stability in later years. While revenues are turning around in most areas, they still are not outpacing rising costs, particularly with PERS and health care increases. While we are not out of the woods yet and we will still have to make some hard choices for foreseeable budget cycles, our fiscal prudence in the past has set us up for continued success in the future.
Sincerely,
Tim Collier, CPA, MBA
Interim Director of Finance and Regulatory Services
3

Metro Quarterly Report, October through December 201244

Metro Quarterly Report, October through December 2012
METRO REVENUES
Agency revenues totaled $121.4 million through the second quarter, or 56 percent of the annual budget. By year-end, total revenues are expected to reach $209.7 million, or 96.5 percent of budget. Revenues continued to be strong at the Oregon Convention Center (OCC) and Portland Center for the Performing Arts (PCPA) and a solid December improved the zoo’s revenue outlook for the year. Tonnage at Metro solid waste facilities continues to fall below budgeted figures, impacting both departmental revenues and excise tax collections.
PROGRAM REVENUE BY OPERATING UNIT
Contractors’ Business License revenues through second quarter are similar to last year through December and are projected to reach $375,000, just below the budgeted $380,000.
YTD % Year-end Year-end 3-YearBudget Actual YTD of Budget Projection % of Budget Average
Program RevenuesCharges for Services Revenue 115,017,139 57,219,469 49.7% 109,637,891 95.3% 95.8%Internal Charges for Svcs-Rev 530,292 530,292 100.0% 530,292 100.0% 96.4%Licenses and Permits 380,000 176,175 46.4% 375,000 98.7% 95.0%Miscellaneous Revenue 340,261 436,782 128.4% 504,953 148.4% 112.3%Grants 12,328,058 3,344,044 27.1% 9,933,743 80.6% 76.2%Contributions from Governments 3,723,036 81,271 2.2% 3,749,446 100.7% 122.7%Contributions - Private Source 1,441,927 67,318 4.7% 1,441,827 100.0% 121.6%Capital Grants 30,000 26,876 89.6% 48,126 160.4% 418.1%
Program Revenues $133,790,713 $61,882,227 46.3% $126,221,278 94.3% 70.2%
YTD % Year-end Year-end 3-YearBudget Actual YTD of Budget Projection % of Budget Average
All RevenueProgram Revenues 133,790,713 61,882,227 46.3% 126,221,278 94.3% 94.6%General Revenues 83,457,319 59,004,191 70.7% 82,981,788 99.4% 99.5%Other Financing Sources 0 502,200 NA 502,200 NA NA
All Revenue $217,248,032 $121,388,617 55.9% $209,705,266 96.5%
Finance and Regulatory Services
Overall Revenues
Program Revenues
Revenues generally on track
Metropolitan Exposition Recreation Commission by Venue
Oregon Convention Center- Program Revenues by Monthshown in millions
$2.5
$3.02012-13 Budget
$1.5
$2.0Three Year Average
2012-13 Actual
$0.5
$1.0
$0.0
$0 5
55

Metro Quarterly Report, October through December 2012
MERC operating revenues for the first six months reached $15.9 million year-to-date compared to $15.8 million in the prior year. Year-end operating revenue is estimated to be greater than budget based on several factors. OCC’s original budget included 32 national conventions. Current bookings have reached 37 conventions, however, with the additional five scheduled in spring 2013. PCPA revenue from operations is greater than budget, due partially to the way revenue and expenditures are recorded under the NewEra/TicketsWest ticketing contract. NewEra/TicketsWest provides PCPA with a ticket report which segregates the revenue (commission) and expenditures (fees, such as credit card, etc.). TicketMaster was unable to provide this detailed report; therefore, the amount posted to revenue was the net result. Expo operating revenue is trending close to budget, but year-end food and beverage sales are not expected to reach original budget estimates.
Expo’s top grossing events during second quarter were America’s Largest Christmas Bazaar ($327,000) and the Fall Home & Garden Show ($161,000). The top grossing events at OCC included 2012 Applied Superconductivity Conference – ASC ($508,000) and the International Code Council ($417,000). PCPA performances included the Nutcracker ($196,000) and the Singing Christmas Tree ($229,000).
During second quarter of FY 2012-13, Expo attendance was 2,080 greater than the same quarter of FY 2011-12, with one less tradeshow; OCC attendance was 1,450 greater, with six more events; PCPA attendance was 16,288 less, but with 27 more commercial performances than the prior year.
Portland Exposition Center- Program Revenues by Monthshown in millions
Portland Center for the Performing Arts- Program Revenues by Monthshown in millions
$1.0
$1.22012-13 Budget
$0.6
$0.8Three Year Average
2012-13 Actual
$0.2
$0.4
Actual
$0.0
$1.2
$1.42012-13 Budget
$0.8
$1.0
g
Three Year Average
2012-13
$0 2
$0.4
$0.6 Actual
$0.0
$0.2
MERC performance
consistent with last year
6

Metro Quarterly Report, October through December 2012
Oregon Zoo- Program Revenues by Monthshown in millions
$4.0
$4.5 2012-13 Budget
$2.5
$3.0
$3.5 Three Year Average
2012-13 Actual
$1.0
$1.5
$2.0
$0.0
$0.5
Oregon Zoo
$3 5
$4.0Three Year A
$2.5
$3.0
$3.5 Average
2012-13
$1.5
$2.0 Actual
$0 0
$0.5
$1.0
$0.0
Attendance set a monthly record in December at 219,000, and the overall quarter was comparable with the prior year. ZooLights had the second-best attendance in history by drawing 183,000 visitors. Revenue picked up in the second quarter and year-to-date is 1 percent greater than the prior year. Revenue remains below budget, however, and management continues to monitor costs to maintain a balanced condition.
Planning revenues are projected to end the year 5 percent ($580,000) below budget, primarily due to the first quarter rescoping of the Southwest Corridor project. Delayed grant funding includes $200,000 for the Powell-Division Bus Rapid Transit project, now expected to begin in FY 2013-14.The department is still awaiting more than $500,000 in grant funding for RTO work completed last year; this funding is expected in the third quarter. The October spike on the revenue chart includes July through September grant billing.
Because the timing of grant revenues varies significantly and unpredictably from year to year, the “budget” line is not included in the chart above. Each year the August revenues are adjusted in the Planning chart to account for year-end accounting entries.
Planning and Development/Research Center
Planning and Development/Research Center- Program Revenues by Monthshown in millions
Zoo sets monthly attendance record in December
7

Parks and Property Stewardship: Overall Parks and Property Stewardship revenues are anticipated to end the year 11.8 percent ($485,000) lower than budgeted levels, a further decline of $103,000 from the first quarter.
Despite November 2011 burial fee increases, cemetery revenues during the second quarter continued to fall below budgeted levels and below last year’s levels. Increasing use of cremation services could be one contributing factor to the decrease in burial services, which is currently the only service that Metro provides. Metro is implementing a new reduced rate structure effective January 2013 to make burial services more competitive.
Metro negotiated a new contract during the second quarter for rental fees at the on-site child care facility. The rental fees were adjusted down and year-end projections are now expected to be about $20,000 below budget.
Park admission revenues are down fiscal year-to-date over both FY 2011-12 and budgeted levels. Planned construction at Oxbow Park and Gleason Boat Ramp in the next six months may decrease park revenues further. A new Glendoveer Golf operating contract effective January 1, 2013, will necessitate a budget amendment to implement a new revenue and expenses structure.
Solid Waste Operations: Based on second quarter results, year-end tonnage at Metro facilities is expected to fall 13.7 percent below budget, while tonnage at non-Metro facilities is expected to be right on budget. The downturn at Metro transfer stations is primarily because waste continues to shift from Metro to private facilities and to a lesser degree because of changes in the waste stream, e.g., the Portland residential organics program. Year-end program revenues are projected to be 10.6 percent ($6,100,000) lower than budgeted, although this year-end projection also includes higher than budgeted revenues for the MetroPaint Stewardship Program (PaintCare).
$0.5
$0.62012-13 Budget
$0.3
$0.4
$0.5
Three Year Average
2012-13 Actual
$0.1
$0.2
$0.3 2012 13 Actual
$0.0
$0.1
Sustainability CenterSustainability Center- Program Revenues by Month
Metro Quarterly Report, October through December 2012
Waste stream continues to
shift to private facilities
$7.0
$8.0 2012-13 Budget
Three Year
$4.0
$5.0
$6.0Three Year Average2012-13 Actual
$1 0
$2.0
$3.0
$4.0
$0.0
$1.0
Parks and Environmental ServicesParks and Environmental Services- Program Revenues by Monthshown in millions
8

Metro Quarterly Report, October through December 2012
Property Tax collections on target
$1.50
$2.00
$2.50
$3.00
$3.50
Excise Tax Received Through December 31, 2012Budget vs. Actual
shown in millions
Budget
Actual
$0.00
$0.50
$1.00
SW&R Metro Facilities
SW&R Non-Metro Facilities
Oregon Convention
Center
Expo Center Parks and MRC SW Product Sales
Excise Tax
YTD % Year-end Year-end 3-YearBudget Actual YTD of Budget Projection % of Budget Average
General RevenueReal Property Taxes 51,157,728 46,496,434 90.9% 51,155,000 100.0% 101.1%Excise Taxes 15,639,971 6,941,725 44.4% 14,847,936 94.9% 95.4%Construction Excise Tax 1,760,000 654,509 37.2% 1,800,000 102.3% 107.6%Other Derived Tax Revenues 75,000 7,016 9.4% 30,000 40.0% 120.3%Local Govt Shared Revenues 13,671,720 4,351,920 31.8% 14,018,444 102.5% 103.0%Interest Earnings 1,152,900 552,587 47.9% 1,130,408 98.0% 89.4%
General Revenue $83,457,319 $59,004,191 70.7% $82,981,788 99.4% 99.3%
General Revenues
Non-tonnage excise tax is projected to end the year right at budget, led by strong revenues at OCC. Solid waste excise tax projections are currently 6 percent below budget, due to a slight further decline in tonnage at Metro facilities.
Property Taxes– Most property tax revenues are received during the second quarter. Based on receipts to date, property tax revenues are projected to end the year right on budget.
Transient Lodging Tax– Year-to-date transfers received from Multnomah County are $4.2 million compared to $4.0 million in the prior year. Year-to-date room nights sold in the market are up 2.4 percent, occupancy rates (room nights per hotel) are up 2.1 percent and the average daily room rate is up 7.3 percent.
Interest Earnings– Total interest earnings are projected to end the year just below budget; interest rates remain extremely low.
Excise Tax Received Through December 31, 2012, Budget vs. Actual shown in millions
Sustainability Center program revenues are projected to end the year 3.3 percent higher than budget with almost no change from the first quarter. The ability to meet the projected revenues is dependent upon completion of the Blue Lake Trail section of the 40-Mile Loop Trail and the recognition of the expenditures made directly by the Oregon Department of Transportation as revenue ($836,000) once the project is completed. The project is under review and moving forward; however, additional Metro matching funds may be required, and the project is likely to carry forward into FY 2013-14.
99

METRO EXPENDITURES– OPERATING DEPARTMENTS
YTD % Year-end Year-end 3-YearBudget Actual YTD of Budget Projection % of Budget Average
Personal Services 62,043,634 29,687,936 47.9% 60,293,623 97.2% 94.8%Materials and Services 105,327,198 37,469,416 35.6% 94,923,095 90.1% 61.6%Total Operating Expenditures 167,370,832 67,157,352 40.1% 155,216,718 92.7% 74.0%
Total Capital Outlay 61,919,498 9,811,386 15.8% 37,804,746 61.1% 41.5%
Total Renewal and Replacement 2,944,383 298,293 10.1% 2,551,034 86.6% 71.3%
Total Expenditures $232,234,713 $77,267,032 10.1% $195,572,498 84.2% 65.1%
YTD Year-end Year-end 3-YearBudget Actual YTD of Budget Projection % of Budget Average
Personal Services 17,403,962 8,238,654 47.3% 17,153,962 98.6% 94.3%Materials and Services 24,341,158 10,628,714 43.7% 25,541,158 104.9% 95.9%Total Operating Expenditures 41,745,120 18,867,368 45.2% 42,695,120 102.3% 95.1%
Total Capital Outlay 3,344,077 537,815 16.1% 3,044,077 91.0% 63.6%
Total Expenditures $45,089,197 $19,405,183 43.0% $45,739,197 101.4% 92.5%
$2.5
$3.02012-13 Budget
$1.5
$2.0
$2.5Three Year Average
2012-13 A t l
$0.5
$1.0
$1.5 Actual
$0.0
$0.5
$1.0
$1.22012-13 Budget
$0.6
$0.8
$1.0Three Year Average
2012-13 Actual
$0.2
$0.4
$0.6 Actual
$0.0
$0.2
EXPENDITURES BY DEPARTMENT
OCC- Operating Expenditures by Monthshown in millions
EXPO- Operating Expenditures by Monthshown in millions
Metro Operating Departments
MERC
Metro Quarterly Report, October through December 201210

Metro Quarterly Report, October through December 2012
METRO EXPENDITURES– OPERATING DEPARTMENTS
$1.2
$1.42012-13 Budget
$0.8
$1.0 Three Year Average
2012-13 A t l
$0 2
$0.4
$0.6 Actual
$0.0
$0.2
PCPA- Operating Expenditures by Monthshown in millions
MERC operating expenditures year-to-date are $18.9 million, compared to $19.2 million in the prior year. Operating expenditures relate directly to the event schedule at each venue. Due to the increase of five conventions at OCC, the current food and beverage sales forecasts will generate an increase in the cost of goods sold, although OCC position vacancies continue to generate savings. With the change in the accounting for the NewEra/TicketsWest contract, PCPA expenditures will increase.
YTD % Year-end Year-end 3-YearBudget Actual TYD of Budget Projection % of Budget Average
Personal Services 18,639,755 9,053,066 48.6% 17,945,637 96.3% 95.0%Materials and Services 12,187,756 5,436,754 44.6% 12,187,756 100.0% 87.8%Total Operating Expenditures 30,827,511 14,489,820 47.0% 30,133,393 97.7% 92.1%
Total New Capital 1,150,675 197,338 17.1% 1,072,322 93.2% 72.5%
Total Renewal and Replacement 797,754 185,331 23.2% 600,000 75.2% 70.6%
Total Expenditures 32,775,940 14,872,489 45.4% $31,805,715 97.0% 90.8%
$4.0
$4.5 2012-13 Budget
$2.5
$3.0
$3.5 Three Year Average
2012-13
$1.0
$1.5
$2.0 Actual
$0.0
$0.5
Oregon Zoo- Operating Expenditures by Monthshown in millions
The zoo continues its very close monitoring of expenditures, with a focus on managing seasonal, temporary and overtime staffing.
With the second quarter ended, focus is shifting to planning for the summer 2013 concert season, supporting moves and plans for the Elephant Lands project, and strategic and tactical planning for admissions, food services and facilities management.
Oregon Zoo
1111

Metro Quarterly Report, October through December 2012
$2 0
$2.5
2012-13
$1.5
$2.0 Budget
Three Year Average
$0 5
$1.0 2012-13 Actual
$0.0
$0.5
Planning and Development- Operating Expenditures by Monthshown in millions
YTD % Year-end Year-end 3-YearBudget Actual YTD of Budget Projection % of Budget Average
Personal Services 5,590,211 2,616,610 46.8% 5,225,000 93.5% 94.5%Materials and Services 8,866,159 910,314 10.3% 4,400,000 49.6% 40.9%Total Expenditures $14,456,370 $3,526,924 24.4% $9,625,000 66.6% 61.0%
Planning and Development
Elephant Lands project proceeding as
scheduled
The Elephant Lands design team was approved to proceed to the construction document design phase. In December 2012 the Metro Council approved the staff recommendation to allocate a portion of bond sale premium funds to offset budget overage related to geotechnical challenges. Construction on the service road and Wildlife Live will begin in the third quarter.
Construction drawings on the Condor Habitat are 90 percent complete, with construction expected to begin in March and expected to be completed in September 2013.
The Metro Council directed staff to exercise the property purchase option for the Roslyn Lake property for the Remote Elephant Center. Land-use planning options and strategies are being developed as well as funding sources for long-term operating costs.
The City of Portland’s Bureau of Development Services staff report for the Updated Conditional Use Master Plan was issued November 30, 2012, and the plan was approved with no appeal in late January 2013.
$4.0
$4.52012-13 Actual
$2.5
$3.0
$3.52012-13 Budget
$0 5
$1.0
$1.5
$2.0 Three Year Average
$0.0
$0.5
Oregon Zoo Infrastructure and Animal Welfare Bond- Expenditures by Monthshown in millions
YTD % Year-end Year-end 3-YearBudget Actual TYD of Budget Projection % of Budget Average
Personal Services 533,850 220,958 41.4% 443,458 83.1% 90.5%Materials and Services 14,753 5,158 35.0% 14,753 100.0% 0%Total Operating Expenditures 548,603 226,116 41.2% 458,211 83.5% 108.0%
Total Capital Outlay 18,963,162 1,777,750 9.4% 9,654,356 50.9% 51.1%
Total Expenditures $19,511,765 $2,003,866 10.3% $10,112,567 51.8% 54.6%
Oregon Zoo Infrastructure and Animal Welfare Bond
12

Metro Quarterly Report, October through December 2012
The re-scoping of the Southwest Corridors project will result in underspending of more than $1.2 million. The Development Opportunity Fund expects a carry forward of $427,000 in unfinished small construction grants. Underspending of $2.1 million in the Transit Oriented Development program will be carried forward to fund projects in future years.
Parks and Environmental Services- Operating Expenditures by Monthshown in millions
YTD % Year-end Year-end 3-YearBudget Actual YTD of Budget Projection % of Budget Average
Personal Services 3,327,876 1,579,490 47.5% 3,200,000 96.2% 96.3%Materials and Services 617,779 395,049 63.9% 549,000 88.9% 87.7%Total Expenditures $3,945,655 $1,974,539 50.0% $3,749,000 95.0% 94.2%
Research Center
Research Center- Operating Expenditures by Monthshown in millions
$0 5
$0.62012-13 Budget
$0 3
$0.4
$0.5 Budget
Three Year Average
$0.2
$0.3
2012-13 Actual
$0.0
$0.1
Research Center spending is projected to end the year very close to historical levels of spending.
YTD YTD % Year-End % ofBudget Actuals of Budget Projection Budget
General Fund $6,740,869 3,296,635 48.9% $6,576,389 97.6%Solid Waste Revenue Fund $49,645,731 18,111,461 36.5% $41,446,828 83.5%General Asset Management Fund $2,867,769 139,276 4.9% $2,672,174 93.2%
YTD YTD % Year-End % of 3-yearAll Funds Budget Actuals of Budget Projection Budget AveragePersonal Services 9,906,145 4,752,271 48.0% 9,776,912 98.7% 94.1%Materials and Services 41,183,674 16,244,477 39.4% 36,674,524 89.1% 91.5%Total Operating Expenditures 51,089,819 20,996,748 41.1% 46,451,436 90.9% 92.0%
Capital Outlay 6,140,040 474,417 7.7% 2,381,381 38.8% 23.3%
Renewal and Replacement 2,123,169 112,962 5.3% 1,927,574 90.8%
Total Expenditures 59,353,028 21,584,128 36.4% 50,760,391 85.5% 85.1%
Parks and Environmental Services
$8.0
$9.02012-13 Budget
$5.0
$6.0
$7.0 Three Year Average
2012-13 Actual
$2.0
$3.0
$4.0 Actual
$0.0
$1.0
13
Metro Quarterly Report, October through December 2012
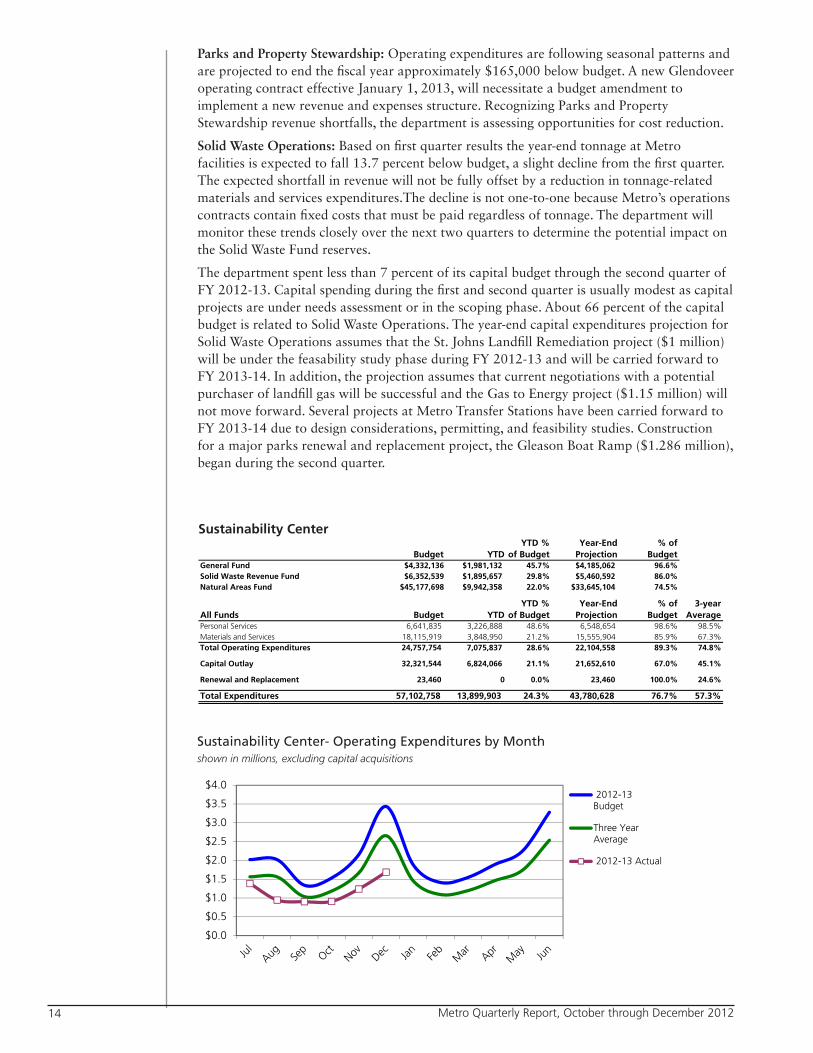
Sustainability Center- Operating Expenditures by Monthshown in millions, excluding capital acquisitions
$3.5
$4.02012-13 Budget
$2.0
$2.5
$3.0 Three Year Average
2012-13 Actual
$0 5
$1.0
$1.5
$2.0 2012 13 Actual
$0.0
$0.5
YTD % Year-End % ofBudget YTD of Budget Projection Budget
General Fund $4,332,136 $1,981,132 45.7% $4,185,062 96.6%Solid Waste Revenue Fund $6,352,539 $1,895,657 29.8% $5,460,592 86.0%Natural Areas Fund $45,177,698 $9,942,358 22.0% $33,645,104 74.5%
YTD % Year-End % of 3-yearAll Funds Budget YTD of Budget Projection Budget AveragePersonal Services 6,641,835 3,226,888 48.6% 6,548,654 98.6% 98.5%Materials and Services 18,115,919 3,848,950 21.2% 15,555,904 85.9% 67.3%Total Operating Expenditures 24,757,754 7,075,837 28.6% 22,104,558 89.3% 74.8%
Capital Outlay 32,321,544 6,824,066 21.1% 21,652,610 67.0% 45.1%
Renewal and Replacement 23,460 0 0.0% 23,460 100.0% 24.6%
Total Expenditures 57,102,758 13,899,903 24.3% 43,780,628 76.7% 57.3%
Sustainability Center
Parks and Property Stewardship: Operating expenditures are following seasonal patterns and are projected to end the fiscal year approximately $165,000 below budget. A new Glendoveer operating contract effective January 1, 2013, will necessitate a budget amendment to implement a new revenue and expenses structure. Recognizing Parks and Property Stewardship revenue shortfalls, the department is assessing opportunities for cost reduction.
Solid Waste Operations: Based on first quarter results the year-end tonnage at Metro facilities is expected to fall 13.7 percent below budget, a slight decline from the first quarter. The expected shortfall in revenue will not be fully offset by a reduction in tonnage-related materials and services expenditures.The decline is not one-to-one because Metro’s operations contracts contain fixed costs that must be paid regardless of tonnage. The department will monitor these trends closely over the next two quarters to determine the potential impact on the Solid Waste Fund reserves.
The department spent less than 7 percent of its capital budget through the second quarter of FY 2012-13. Capital spending during the first and second quarter is usually modest as capital projects are under needs assessment or in the scoping phase. About 66 percent of the capital budget is related to Solid Waste Operations. The year-end capital expenditures projection for Solid Waste Operations assumes that the St. Johns Landfill Remediation project ($1 million) will be under the feasability study phase during FY 2012-13 and will be carried forward to FY 2013-14. In addition, the projection assumes that current negotiations with a potential purchaser of landfill gas will be successful and the Gas to Energy project ($1.15 million) will not move forward. Several projects at Metro Transfer Stations have been carried forward to FY 2013-14 due to design considerations, permitting, and feasibility studies. Construction for a major parks renewal and replacement project, the Gleason Boat Ramp ($1.286 million), began during the second quarter.
14

Metro Quarterly Report, October through December 2012
Parks Planning and Development: Several projects are under review or in the scoping phase. The majority of the projects in this program require extensive involvement with stakeholders, general public, and public agencies at the local, regional, state and federal levels, causing projects to fall behind schedule. The year-end projection anticipates the completion of the Blue Lake Trail section of the 40-Mile Loop Trail ($836,000) and the recognition of the expenditures made directly by the Oregon Department of Transportation as a Metro asset. The project is under review and moving forward; however, additional Metro matching funds may be required. A budget amendment during the first quarter increased expenditure authority ($173,000) for a regional public involvement effort as part of evaluating a potential local option levy that will provide funding to restore natural areas, maintain and operate parks.
Resource Conservation and Recycling: Expenditures in this program generally take place from the second to fourth quarter, mainly as Grants to Other Governments. Historical underspending patterns are included in the year-end projections.
Natural Areas: Expenditures in materials and services from the Local Share program are below budget and three-year average trend. The year-end forecast for Local Share and for capital (land acquisition) is conservative, based on historical patterns and expected acquisitions by the end of the fiscal year.
15

Metro Quarterly Report, October through December 2012
YTD % Year-end Year-end 3-YearBudget Actual YTD of Budget Projection % of Budget Average
Personal Services 17,644,204 8,493,244 48.1% 16,841,442 95.5% 95.6%Materials and Services 3,791,983 1,212,946 32.0% 3,310,325 87.3% 75.6%Total Operating Expenditures 21,436,187 9,706,190 45.3% 20,151,767 94.0% 92.0%
Total Capital Outlay 243,781 40,885 16.8% 245,245 100.6% 37.1%
Total Renewal and Replacement 854,877 240,018 28.1% 450,000 52.6% 45.6%
Total Expenditures $22,534,845 $9,987,094 44.3% $20,847,012 92.5% 89.2%
YTD % Year-end Year-end 3-YearBudget Actual YTD of Budget Projection % of Budget Average
Personal Services 3,358,319 1,782,566 53.1% 3,287,200 97.9% 96.6%Materials and Services 796,921 100,958 12.7% 523,325 65.7% 49.1%Total Expenditures $4,155,240 $1,883,524 45.3% $3,810,525 91.7% 87.8%
YTD % Year-end Year-end 3-YearBudget Actual YTD of Budget Projection % of Budget Average
Personal Services 673,290 321,873 47.8% 625,142 92.8% 95.4%Materials and Services 44,474 17,992 40.5% 32,000 72.0% 58.3%Total Expenditures $717,764 $339,866 47.4% $657,142 91.6% 93.2%
YTD % Year-end Year-end 3-YearBudget Actual YTD of Budget Projection % of Budget Average
Personal Services 1,848,005 865,059 46.8% 1,746,000 94.5% 94.2%Materials and Services 65,200 17,883 27.4% 65,000 99.7% 86.2%Total Expenditures $1,913,205 $882,942 46.1% $1,811,000 94.7% 93.9%
YTD % Year-end Year-end 3-YearBudget Actual YTD of Budget Projection % of Budget Average
Personal Services 2,359,825 1,162,035 49.2% 2,340,000 99.2% 99.2%Materials and Services 237,500 63,569 26.8% 230,000 96.8% 64.8%Total Expenditures $2,597,325 $1,225,605 47.2% $2,570,000 98.9% 95.7%
EXPENDITURES– SUPPORT DEPARTMENTS
All Support Departments
Council Office
Office of the Auditor
Office of the Metro Attorney
Communications
A second quarter budget amendment provided 12 months of support for development of the agency’s Equity Strategy. Continuing funding for the project will be submitted via the FY 2013-14 budget process.
16

Metro Quarterly Report, October through December 2012
YTD % Year-end Year-end 3-YearBudget Actual YTD of Budget Projection % of Budget Average
Personal Services 4,989,500 2,267,080 45.4% 4,625,000 92.7% 94.3%Materials and Services 1,341,497 274,497 20.5% 1,190,000 88.7% 85.7%Total Operating Expenditures 6,330,997 2,541,577 40.1% 5,815,000 91.8% 92.4%
Total Capital Outlay 233,781 29,420 12.6% 233,780 100.0% 0.0%
Total Expenditures $6,564,778 $2,570,997 39.2% $6,048,780 92.1% 92.4%
Finance and Regulatory Services
YTD Year-end Year-end 3-YearBudget Actual YTD of Budget Projection % of Budget Average
Personal Services 2,682,863 1,267,989 47.3% 2,543,100 94.8% 95.6%Materials and Services 903,960 598,486 66.2% 920,000 101.8% 81.2%Total Operating Expenditures 3,586,823 1,866,475 52.0% 3,463,100 96.6% 92.0%
Total New Capital 10,000 11,465 114.7% 11,465 114.7% 87.3%
Total Renewal and Replacement 854,877 240,018 28.1% 450,000 52.6% 28.0%
Total Expenditures $4,451,700 $2,117,958 47.6% $3,924,565 88.2% 86.3%
YTD % Year-end Year-end 3-YearBudget Actual YTD of Budget Projection % of Budget Average
Personal Services 1,732,402 826,641 47.7% 1,675,000 96.7% 95.1%Materials and Services 402,431 139,561 34.7% 350,000 87.0% 83.4%Total Expenditures $2,134,833 $966,202 45.3% $2,025,000 94.9% 92.7%
Information Services
Human Resources
YTD % Year-end Year-end 3-YearBudget Actual YTD of Budget Projection % of Budget Average
Personal Services 79,800 47,228 59.2% 101,000 126.6%Materials and Services 4,597,762 711,795 15.5% 2,763,000 60.1% 25.4%Total Operating Expenditures 4,677,562 759,023 16.2% 2,864,000 61.2% 25.4%
Total Debt Service 54,769,223 15,418,978 28.2% 54,769,223 100.0% 130.7%
Total Capital Outlay 218,825 0 0.0% 50,000 22.8% 66.4%
Total Expenditures $59,665,610 $16,178,001 27.1% $57,683,223 96.7% 117.8%
EXPENDITURES– NON-DEPARTMENTAL
Non-departmental special appropriation expenditures during the second quarter included the following:
• $168,500 in Construction Excise Tax grant reimbursements.
• $75,100 of $150,000 expected for Metro’s external financial audit.
• $29,000 for the Metro web project. The project remains on schedule and on budget.
• $24,000 in Nature in Neighborhood grant reimbursements.
• $6,700 in dues to the Lloyd Business Improvement District.
• $4,400 of $15,250 in general agency sponsorships.
Non-departmental
A second quarter budget amendment provided appropriations for a consolidated Data Center, to be located at OCC. A portion of the funding was provided via underspending in IS personal services due to several vacancies.
17

Metro Quarterly Report, October through December 201218

Metro Quarterly Report, October through December 2012
Appendices
19

Metro Quarterly Report, October through December 201220

Metro Quarterly Report, October through December 2012
APPENDIX – All funds, year to year comparison, as of December 31, 2012
FY 2012-13
FY 2011-12
Adopted Actuals YTD YTD % June 30Budget 2nd Qtr Actuals of Budget Projection % Budget
Resources
Beginning Fund Balance 295,435,747 304,416,351 304,416,351
Program Revenues 133,790,713 31,286,819 61,882,227 46.3% 126,221,278 94.3%General Revenues 83,457,319 54,353,499 59,004,190 70.7% 82,981,788 99.4%Interfund Transfers 23,258,538 4,546,143 10,199,689 43.9% 22,677,075 97.5%Special Items 0 0 0 0Extraordinary Items 0 0 0 0Other Financing Sources 0 200 502,200 502,200
Subtotal Current Revenues 240,506,570 90,186,661 131,588,306 54.7% 232,382,341 96.6%
Total Resources 535,942,317 436,004,657 536,798,692
Requirements
Operating Expenditures 196,125,857 41,267,198 78,750,669 40.2% 180,189,485 91.9%Debt Service 54,769,223 7,078,718 17,989,301 32.8% 54,769,223 100.0%Capital Outlay + Renewal and Replacement 66,181,364 3,541,119 10,390,583 15.7% 41,101,025 62.1%Interfund Transfers 23,258,538 4,546,143 10,199,689 43.9% 22,677,075 97.5%Contingency 60,468,739
Subtotal Current Expenditures 400,803,721 56,433,179 117,330,242 29.3% 298,736,808 74.5%
Unappropriated Balance 135,138,596 318,674,415 238,061,884
Total Requirements 535,942,317 436,004,657 $536,798,692
Adopted Actuals YTD YTD % June 30Budget 2nd Qtr Actuals of Budget Actuals % Budget
Resources
Beginning Fund Balance 165,415,447 175,983,543 175,983,543
Program Revenues 132,623,896 29,318,332 61,061,977 46.0% 128,773,096 97.1%General Revenues 68,304,854 42,633,331 46,752,105 68.4% 69,206,922 101.3%Interfund Transfers 22,398,354 8,380,700 13,852,353 61.8% 21,837,400 97.5%Special Items 0 0 0 0Extraordinary Items 0 0 0 0Other Financing Sources 0 416,184 417,584 195,942,542
Subtotal Current Revenues 223,327,104 80,748,547 122,084,019 54.7% 415,759,960 186.2%
Total Resources 388,742,551 298,067,562 591,743,503
Requirements
Operating Expenditures 198,354,961 41,808,104 83,351,988 42.0% 172,359,957 86.9%Debt Service 35,261,700 3,565,496 15,150,817 43.0% 64,941,026 184.2%Capital Outlay + Renewal and Replacement 39,572,160 8,304,676 16,690,803 42.2% 28,188,766 71.2%Interfund Transfers 22,398,354 6,429,551 11,901,204 53.1% 21,837,403 97.5%Contingency 27,227,184
Subtotal Current Expenditures 322,814,359 60,107,827 127,094,812 39.4% 287,327,152 89.0%
Unappropriated Balance 65,928,192 170,972,750 304,416,351
Total Requirements 388,742,551 298,067,562 $591,743,503
21

Metro Quarterly Report, October through December 201222

Metro Quarterly Report, October through December 2012
APPENDIX – Fund Tables, year to year comparison
General Fund (consolidated), as of December 31, 2012
FY 2012-13
FY 2011-12
Adopted Actuals YTD YTD % June 30Budget 2nd Qtr Actuals of Budget Projection % Budget
Resources
Beginning Fund Balance 27,621,707 31,796,742 31,796,742
Program Revenues 39,159,885 7,495,633 17,578,898 44.9% 37,266,580 95.2%General Revenues 30,051,190 15,387,274 18,685,296 62.2% 29,402,381 97.8%Transfers 46,925,816 8,673,999 18,509,032 39.4% 38,479,169 82.0%Special Items 0 0 0 0Extraordinary Items 0 0 0 0Other Financing Sources 0 0 2,000 2,000
Subtotal Current Revenues 116,136,891 31,556,906 54,775,226 47.2% 105,150,130 90.5%
Total Resources 143,758,598 86,571,968 136,946,872
Requirements
Operating Expenditures 84,230,212 17,317,270 34,903,601 41.4% 75,462,415 89.6%Debt Service 1,654,290 564,645 564,645 34.1% 1,654,290 100.0%Capital Outlay 244,325 8,947 19,422 7.9% 67,000 27.4%Interfund Transfers 7,764,625 535,921 2,796,895 36.0% 7,764,625 100.0%Intrafund Transfers 33,762,699 5,874,222 12,751,264 37.8% 25,322,024 75.0%Contingency 3,049,319
Subtotal Current Expenditures 130,705,470 24,301,005 51,035,827 39.0% 110,270,354 84.4%
Unappropriated Balance 13,053,128 35,536,141 26,676,518
Total Requirements 143,758,598 86,571,968 $136,946,872
Adopted Actuals YTD YTD % June 30Budget 2nd Qtr Actuals of Budget Actuals % Budget
Resources
Beginning Fund Balance 25,619,555 0 28,964,227 28,964,227
Program Revenues 40,401,436 6,770,806 18,031,237 44.6% 37,910,912 93.8%General Revenues 29,133,718 14,701,888 18,081,565 62.1% 28,603,636 98.2%Transfers 47,242,596 9,138,572 16,026,397 33.9% 38,632,979 81.8%Special Items 0 0 0 0.0% 0Extraordinary Items 0 0 0 0.0% 0Other Financing Sources 0 18,300 19,700 0.0% 24,400
Subtotal Current Revenues 116,777,750 30,629,566 52,158,899 44.7% 105,171,927 90.1%
Total Resources 142,397,305 81,123,126 134,136,154
Requirements
Operating Expenditures 84,526,381 17,163,589 34,611,978 40.9% 70,901,861 83.9%Debt Service 1,588,215 576,607 576,607 36.3% 1,588,214 100.0%Capital Outlay 47,000 26,962 48,202 102.6% 130,131 276.9%Interfund Transfers 5,053,606 698,150 2,991,122 59.2% 5,045,607 99.8%Intrafund Transfers 32,830,111 3,166,149 7,319,814 22.3% 24,673,599 75.2%Contingency 3,562,142
Subtotal Current Expenditures 127,607,455 21,631,457 45,547,723 35.7% 102,339,412 80.2%
Unappropriated Balance 14,789,850 35,575,404 31,796,742
Total Requirements 142,397,305 81,123,126 $134,136,154
23

Metro Quarterly Report, October through December 2012
General Asset Management Fund, as of December 31, 2012
FY 2012-13
FY 2011-12
Adopted Actuals YTD YTD % June 30Budget 2nd Qtr Actuals of Budget Projection % Budget
Resources
Beginning Fund Balance 7,058,047 7,507,546 7,507,546
Program Revenues 1,070,220 12,570 12,570 1.2% 1,070,220 100.0%General Revenues 27,800 7,911 13,358 48.1% 27,000 97.1%Transfers 2,416,700 398,151 796,302 32.9% 2,416,700 100.0%Special Items 0 0 0 0Extraordinary Items 0 0 0 0Other Financing Sources 0 0 0 0
Subtotal Current Revenues 3,514,720 418,632 822,230 23.4% 3,513,920 100.0%
Total Resources 10,572,767 8,329,777 11,021,466
Requirements
Operating Expenditures 297,235 37,747 112,072 37.7% 264,000 88.8%Debt Service 0 0 0Capital Outlay 5,680,309 732,620 858,833 15.1% 4,009,465 70.6%Interfund Transfers 19,681 0 0 0.0% 19,681 100.0%Intrafund Transfers 0 0 0 0Contingency 4,369,222
Subtotal Current Expenditures 10,366,447 770,367 970,905 9.4% 4,293,146 41.4%
Unappropriated Balance 206,320 7,358,871 6,728,320
Total Requirements 10,572,767 8,329,777 $11,021,466
Adopted Actuals YTD YTD % June 30Budget 2nd Qtr Actuals of Budget Actuals % Budget
Resources
Beginning Fund Balance 6,689,948 7,453,961 7,453,961
Program Revenues 974,514 887,404 892,804 91.6% 929,245 95.4%General Revenues 33,298 13,405 20,177 60.6% 48,304 145.1%Transfers 2,193,368 732,621 1,109,748 50.6% 2,194,716 100.1%Special Items 0 0 0 0Extraordinary Items 0 0 0 0Other Financing Sources 0 0 0 19,100
Subtotal Current Revenues 3,201,180 1,633,430 2,022,729 63.2% 3,191,365 99.7%
Total Resources 9,891,128 9,476,690 10,645,326
Requirements
Operating Expenditures 898,483 184,620 200,388 22.3% 702,486 78.2%Debt Service 0 0 0 0Capital Outlay 5,081,063 445,317 664,647 13.1% 2,435,293 47.9%Interfund Transfers 0 0 0 0Intrafund Transfers 0 0 0 0Contingency 3,911,582
Subtotal Current Expenditures 9,891,128 629,937 865,035 8.7% 3,137,779 31.7%
Unappropriated Balance 0 8,611,654 7,507,546
Total Requirements 9,891,128 9,476,690 $10,645,326
24

Metro Quarterly Report, October through December 2012
MERC Fund, as of December 31, 2012
FY 2012-13
FY 2011-12
Adopted Actuals YTD YTD % June 30Budget 2nd Qtr Actuals of Budget Projection % Budget
Resources
Beginning Fund Balance 23,776,767 26,226,573 26,226,573
Program Revenues 30,981,961 8,865,849 15,991,509 51.6% 32,429,520 104.7%General Revenues 13,268,045 3,613,077 4,191,273 31.6% 13,568,045 102.3%Transfers 2,768,633 12,501 25,002 0.9% 2,768,633 100.0%Special Items 0 0 0 0Extraordinary Items 0 0 0 0Other Financing Sources 0 0 0 0
Subtotal Current Revenues 47,018,639 12,491,427 20,207,784 43.0% 48,766,198 103.7%
Total Resources 70,795,406 46,434,357 74,992,771
Requirements
Operating Expenditures 41,745,120 9,942,350 18,867,368 45.2% 42,695,120 102.3%Debt Service 0 0 0 0Capital Outlay 3,344,077 286,492 537,755 16.1% 3,044,077 91.0%Interfund Transfers 4,806,913 1,785,016 2,755,118 57.3% 4,806,913 100.0%Intrafund Transfers 0 0 0 0Contingency 8,001,724
Subtotal Current Expenditures 57,897,834 12,013,858 22,160,241 38.3% 50,546,110 87.3%
Unappropriated Balance 12,897,572 24,274,116 24,446,661
Total Requirements 70,795,406 46,434,357 $74,992,771
Adopted Actuals YTD YTD % June 30Budget 2nd Qtr Actuals of Budget Actuals % Budget
Resources
Beginning Fund Balance 24,615,569 26,357,848 26,357,848 26,357,848
Program Revenues 34,699,978 8,470,011 15,903,082 45.8% 33,391,154 96.2%General Revenues 11,278,141 3,144,315 4,120,541 36.5% 13,531,611 120.0%Transfers 594,822 114,822 114,822 19.3% 594,822 100.0%Special Items 0 0 0 0.0% 0Extraordinary Items 0 0 0 0.0% 0Other Financing Sources 0 0 0 0.0% 0
Subtotal Current Revenues 46,572,941 11,729,148 20,138,445 43.2% 47,517,587 102.0%
Total Resources 71,188,510 46,496,293 73,875,435
Requirements
Operating Expenditures 41,491,272 9,814,019 19,179,974 46.2% 39,467,408 95.1%Debt Service 0 0 0 0Capital Outlay 3,129,396 531,947 1,072,714 34.3% 2,044,279 65.3%Interfund Transfers 6,162,880 1,671,940 2,541,691 41.2% 6,137,175 99.6%Intrafund Transfers 0 0 0 0Contingency 4,336,123
Subtotal Current Expenditures 55,119,671 12,017,906 22,794,379 41.4% 47,648,862 86.4%
Unappropriated Balance 16,068,839 23,701,914 26,226,573
Total Requirements 71,188,510 46,496,293 $73,875,435
25

Metro Quarterly Report, October through December 2012
Natural Areas Fund, as of December 31, 2012
FY 2012-13
FY 2011-12
Adopted Actuals YTD YTD % June 30Budget 2nd Qtr Actuals of Budget Projection % Budget
Resources
Beginning Fund Balance 98,184,870 98,783,002 98,783,002
Program Revenues 866,000 77,414 200,609 23.2% 1,066,500 123.2%General Revenues 416,894 93,353 187,313 44.9% 375,000 90.0%Transfers 19,681 0 0 0.0% 19,681 100.0%Special Items 0 0 0 0Extraordinary Items 0 0 0 0Other Financing Sources 0 0 500,000 500,000
Subtotal Current Revenues 1,302,575 170,767 887,922 68.2% 1,961,181 150.6%
Total Resources 99,487,445 99,670,924 100,744,183
Requirements
Operating Expenditures 13,739,938 1,438,242 3,118,542 22.7% 12,207,000 88.8%Debt Service 0 0 0 0Capital Outlay 31,437,760 1,290,237 6,823,816 21.7% 21,438,000 68.2%Interfund Transfers 1,783,226 427,653 900,306 50.5% 1,515,742 85.0%Intrafund Transfers 0 0 0 0Contingency 25,000,000
Subtotal Current Expenditures 71,960,924 3,156,132 10,842,664 15.1% 35,160,742 48.9%
Unappropriated Balance 27,526,521 88,828,260 65,583,441
Total Requirements 99,487,445 99,670,924 $100,744,183
Adopted Actuals YTD YTD % June 30Budget 2nd Qtr Actuals of Budget Actuals % Budget
Resources
Beginning Fund Balance 36,715,000 36,469,224 36,469,224
Program Revenues 866,000 248,380 297,757 34.4% 950,828 109.8%General Revenues 183,575 42,631 50,657 27.6% 139,417 75.9%Transfers 13,176 13,176 13,176 100.0% 13,176 100.0%Special Items 0 0 0 0Extraordinary Items 0 0 0 0Other Financing Sources 0 0 0 90,015,894
Subtotal Current Revenues 1,062,751 304,188 361,591 34.0% 91,119,314 8573.9%
Total Resources 37,777,751 36,830,815 127,588,539
Requirements
Operating Expenditures 13,725,133 2,207,163 7,207,182 52.5% 11,026,441 80.3%Debt Service 0 0 0 0Capital Outlay 20,939,000 5,571,729 10,523,019 50.3% 16,261,986 77.7%Interfund Transfers 1,780,005 410,012 801,977 45.1% 1,517,109 85.2%Intrafund Transfers 0 0 0 0Contingency 1,333,613
Subtotal Current Expenditures 37,777,751 8,188,904 18,532,177 49.1% 28,805,537 76.3%
Unappropriated Balance 0 18,298,638 98,783,002
Total Requirements 37,777,751 36,830,815 $127,588,539
26

Metro Quarterly Report, October through December 2012
Oregon Zoo Infrastructure and Animal Welfare Bond Fund, as of December 31, 2012
FY 2012-13
FY 2011-12
Adopted Actuals YTD YTD % June 30Budget 2nd Qtr Actuals of Budget Projection % Budget
Resources
Beginning Fund Balance 78,374,866 77,630,727 77,630,727
Program Revenues 0 0 0 0General Revenues 225,000 72,475 166,383 73.9% 220,000 97.8%Transfers 0 0 0 0Special Items 0 0 0 0Extraordinary Items 0 0 0 0Other Financing Sources 0 0 0 0
Subtotal Current Revenues 225,000 72,475 166,383 73.9% 220,000 97.8%
Total Resources 78,599,866 77,797,110 77,850,727
Requirements
Operating Expenditures 548,603 109,087 226,116 41.2% 458,000 83.5%Debt Service 0 0 0 0Capital Outlay 18,963,162 925,749 1,777,750 9.4% 9,654,500 50.9%Interfund Transfers 292,677 73,171 146,806 50.2% 292,677 100.0%Intrafund Transfers 0 0 0 0Contingency 3,963,195
Subtotal Current Expenditures 23,767,637 1,108,007 2,150,672 9.0% 10,405,177 43.8%
Unappropriated Balance 54,832,229 75,646,438 67,445,550
Total Requirements 78,599,866 77,797,110 $77,850,727
Adopted Actuals YTD YTD % June 30Budget 2nd Qtr Actuals of Budget Actuals % Budget
Resources
Beginning Fund Balance 9,649,239 8,876,891 8,876,891
Program Revenues 0 44 44 66General Revenues 24,648 8,179 19,209 77.9% 32,364 131.3%Transfers 3,735 3,735 3,735 100.0% 3,735 100.0%Special Items 0 0 0 0Extraordinary Items 0 0 0 0Other Financing Sources 0 0 0 75,705,459
Subtotal Current Revenues 28,383 11,958 22,988 81.0% 75,741,623 266855.6%
Total Resources 9,677,622 8,899,879 84,618,514
Requirements
Operating Expenditures 628,075 143,432 333,989 53.2% 885,264 140.9%Debt Service 0 0 0 0Capital Outlay 6,432,825 1,556,557 3,652,155 56.8% 5,804,545 90.2%Interfund Transfers 365,414 63,946 102,026 27.9% 297,978 81.5%Intrafund Transfers 0 0 0 0Contingency 2,251,308
Subtotal Current Expenditures 9,677,622 1,763,935 4,088,171 42.2% 6,987,787 72.2%
Unappropriated Balance 0 4,811,708 77,630,727
Total Requirements 9,677,622 8,899,879 $84,618,514
27

Metro Quarterly Report, October through December 2012
Risk Management Fund, as of December 31, 2012
FY 2012-13
FY 2011-12
Adopted Actuals YTD YTD % June 30Budget 2nd Qtr Actuals of Budget Projection % Budget
Resources
Beginning Fund Balance 2,344,251 2,732,345 2,732,345
Program Revenues 585,292 780,649 782,013 133.6% 832,000 142.2%General Revenues 10,000 3,423 5,603 56.0% 12,000 120.0%Transfers 1,591,592 397,899 1,050,293 66.0% 1,591,592 100.0%Special Items 0 0 0 0.0% 0Extraordinary Items 0 0 0 0.0% 0Other Financing Sources 0 0 0 0.0% 0
Subtotal Current Revenues 2,186,884 1,181,971 1,837,910 84.0% 2,435,592 111.4%
Total Resources 4,531,135 4,570,255 5,167,937
Requirements
Operating Expenditures 2,641,276 412,637 1,128,124 42.7% 1,957,000 74.1%Debt Service 0 0 0 0Capital Outlay 0 0 0 0Interfund Transfers 295,207 73,803 147,606 50.0% 285,000 96.5%Intrafund Transfers 0 0 0 0Contingency 500,000
Subtotal Current Expenditures 3,436,483 486,440 1,275,730 37.1% 2,242,000 65.2%
Unappropriated Balance 1,094,652 3,294,525 2,925,937
Total Requirements 4,531,135 4,570,255 $5,167,937
Adopted Actuals YTD YTD % June 30Budget 2nd Qtr Actuals of Budget Actuals % Budget
Resources
Beginning Fund Balance 2,364,250 2,629,579 2,629,579
Program Revenues 627,807 (12,030) 1,429 0.2% 669,072 106.6%General Revenues 25,000 5,426 7,913 31.7% 18,187 72.7%Transfers 1,819,183 454,799 1,202,346 66.1% 1,818,311 100.0%Special Items 0 0 0 0Extraordinary Items 0 0 0 0Other Financing Sources 0 0 0 0
Subtotal Current Revenues 2,471,990 448,195 1,211,688 49.0% 2,505,571 101.4%
Total Resources 4,836,240 3,841,267 79.4% 5,135,149
Requirements
Operating Expenditures 2,815,266 239,553 908,723 32.3% 1,531,054 54.4%Debt Service 0 0 0 0.0% 0Capital Outlay 0 0 0 0.0% 0Interfund Transfers 875,210 597,320 736,265 84.1% 871,750 99.6%Intrafund Transfers 0 0 0 0.0% 0Contingency 382,680
Subtotal Current Expenditures 4,073,156 836,873 1,644,988 40.4% 2,402,804 59.0%
Unappropriated Balance 763,084 2,196,279 2,732,345
Total Requirements 4,836,240 3,841,267 $5,135,149
28

Metro Quarterly Report, October through December 2012
Solid Waste Revenue Fund, as of December 31, 2012
FY 2012-13
FY 2011-12
Adopted Actuals YTD YTD % June 30Budget 2nd Qtr Actuals of Budget Projection % Budget
Resources
Beginning Fund Balance 40,199,273 39,731,933 39,731,933
Program Revenues 60,743,758 13,994,095 27,233,853 44.8% 54,633,545 89.9%General Revenues 197,749 39,486 62,834 31.8% 198,660 100.5%Transfers 208,778 0 0 0.0% 208,778 100.0%Special Items 0 0 0 0.0% 0Extraordinary Items 0 0 0 0.0% 0Other Financing Sources 0 200 200 0.0% 0
Subtotal Current Revenues 61,150,285 14,033,781 27,296,888 44.6% 55,040,983 90.0%
Total Resources 101,349,558 67,028,820 94,772,916
Requirements
Operating Expenditures 52,796,867 11,447,134 20,365,005 38.6% 47,421,236 89.8%Debt Service 0 0 0 0.0% 0Capital Outlay 5,361,781 296,764 466,478 8.7% 1,636,781 30.5%Interfund Transfers 8,157,903 1,650,580 3,452,958 42.3% 8,157,903 100.0%Contingency 15,105,279
Subtotal Current Expenditures 81,421,830 13,394,478 24,284,441 29.8% 57,215,920 70.3%
Unappropriated Balance 19,927,728 42,744,379 37,556,996
Total Requirements 101,349,558 67,028,820 94,772,916
Adopted Actuals YTD YTD % June 30Budget 2nd Qtr Actuals of Budget Actuals % Budget
Resources
Beginning Fund Balance 39,914,107 42,792,555 42,792,555
Program Revenues 55,035,122 12,944,198 25,914,815 47.1% 53,254,478 96.8%General Revenues 196,526 68,600 103,072 52.4% 235,712 119.9%Transfers 267,625 85,880 85,880 32.1% 257,744 96.3%Special Items 0 0 0 0.0% 0Extraordinary Items 0 0 0 0.0% 0Other Financing Sources 0 450 450 0.0% 22,750
Subtotal Current Revenues 55,499,273 13,099,128 26,104,217 47.0% 53,770,685 96.9%
Total Resources 95,413,380 68,896,772 96,563,240
Requirements
Operating Expenditures 50,268,448 11,771,782 20,115,542 40.0% 47,522,223 94.5%Debt Service 0 0 0 0.0% 0Capital Outlay 3,726,000 171,514 236,859 6.4% 1,588,721 42.6%Interfund Transfers 7,988,738 2,771,896 4,511,836 56.5% 7,720,363 96.6%Contingency 14,588,745
Subtotal Current Expenditures 76,571,931 14,715,192 24,864,238 32.5% 56,831,307 74.2%
Unappropriated Balance 18,841,449 44,032,534 39,731,933
Total Requirements 95,413,380 68,896,772 96,563,240
29

Metro Quarterly Report, October through December 2012
APPENDIX – Excise Tax Annual Forecast, as of December 31, 2012
Total Excise Tax Collections7.5% Excise Tax
Facility/Function FY 2012-13
Budget
Revised Annual
Forecast Difference % Difference
Oregon Convention Center 1,295,334 1,376,292 80,958 6.25%
Expo Center 460,226 435,069 (25,157) -5.47%
Planning Fund 14,675 10,272 (4,403) -30.00%
SW Product Sales 170,250 170,250 - 0.00%
Parks and MRC 284,701 230,608 (54,093) -19.00%
Total 2,225,186 2,222,491 (2,695) -0.12%
Solid Waste Per Ton Excise Tax
FY 2012-13 Budget
Revised Annual
Forecast Difference % Difference
Solid Waste and Recycling Metro Facilities 5,494,968 4,753,147 (741,821) -13.50%
Solid Waste and Recycling Non Metro Facilities 7,919,817 7,872,298 (47,519) -0.60%
Total Solid Waste Per Ton Excise Tax 13,414,785 12,625,445 (789,340) -5.88%
Grand Total Excise Tax 15,639,971 14,847,936 (792,035) -5.06%
Solid Waste General by Code 11,851,103 11,851,103
Transfer to Res. for Future One Time Expenditures 1,563,682 771,647
Reserve for Future One Time Expenditures Balance
Beginning Balance from FY 2011-12 1,087,575$
Projected FY 2012-13 Contribution 771,647$
Projected FY 2012-13 Spending* 1,100,000$
Projected FY 2012-13 Ending Balance 759,222$
Assumptions:
*Contribution from FY 2010-11 has been identified for General Fund streetcar assessment, expected to be billed in FY 2012-13. Estimated cost is $500,000.
The FY 2012-13 adopted budget committed $600,000 for one-time expenses: Nature in Neighborhoods Grants ($200,000); Glendoveer upgrades ($200,000) and sustainable upgrades for renewal and replacement
Total Excise Tax Collections
Reserve for Future One Time Expenditures Balance
Total Excise Tax Collections7.5% Excise Tax
Facility/Function FY 2012-13
Budget
Revised Annual
Forecast Difference % Difference
Oregon Convention Center 1,295,334 1,376,292 80,958 6.25%
Expo Center 460,226 435,069 (25,157) -5.47%
Planning Fund 14,675 10,272 (4,403) -30.00%
SW Product Sales 170,250 170,250 - 0.00%
Parks and MRC 284,701 230,608 (54,093) -19.00%
Total 2,225,186 2,222,491 (2,695) -0.12%
Solid Waste Per Ton Excise Tax
FY 2012-13 Budget
Revised Annual
Forecast Difference % Difference
Solid Waste and Recycling Metro Facilities 5,494,968 4,753,147 (741,821) -13.50%
Solid Waste and Recycling Non Metro Facilities 7,919,817 7,872,298 (47,519) -0.60%
Total Solid Waste Per Ton Excise Tax 13,414,785 12,625,445 (789,340) -5.88%
Grand Total Excise Tax 15,639,971 14,847,936 (792,035) -5.06%
Solid Waste General by Code 11,851,103 11,851,103
Transfer to Res. for Future One Time Expenditures 1,563,682 771,647
Reserve for Future One Time Expenditures Balance
Beginning Balance from FY 2011-12 1,087,575$
Projected FY 2012-13 Contribution 771,647$
Projected FY 2012-13 Spending* 1,100,000$
Projected FY 2012-13 Ending Balance 759,222$
Assumptions:
*Contribution from FY 2010-11 has been identified for General Fund streetcar assessment, expected to be billed in FY 2012-13. Estimated cost is $500,000.
The FY 2012-13 adopted budget committed $600,000 for one-time expenses: Nature in Neighborhoods Grants ($200,000); Glendoveer upgrades ($200,000) and sustainable upgrades for renewal and replacement
30

Metro Quarterly Report, October through December 2012
APPENDIX – Capital Budget Mid-Year Status
SUMMARY
The following pages present the status of all projects with anticipated spending of greater than $100,000, including a comparison of budgeted capital projects with activity and expenditures through December 31, 2012.
This year’s budget includes 52 capital projects greater than $100,000. Through December 31, 2012, six projects are complete. An additional 22 projects are projected to be completed by fiscal year end, three projects were canceled and the remainder are expected to carry forward to FY 2013-14 or are ongoing projects: those that require substantial capital maintenance over time or that consist of a department’s grouped renewal and replacement projects less than $100,000 each.
Completed projects:
• Expo Portable Bleacher Replacement
• Expo Roof Repair, Hall D
• PCPA Antoinette Hatfield Hall Exterior Insulation
• Zoo Updated Conditional Use Master Plan and Land Use Reviews
• Metro Regional Center Front Plaza Planters
• Metro Central Household Hazardous Waste Roof Replacement
31

Metro Quarterly Report, October through December 201232

Metro Quarterly Report, October through December 2012 33
Finance and Regulatory Services
FY 2012-13 Capital Projects status through December 31, 2012
Solid Waste Information System (SWIS)
This project will implement a state of the art system of data collection and reporting to support Metro’s responsibility to collect regional system fees and excise taxes.
FY 2012-13Adopted Budget
113,781
Dollars spent as of 12-31-12
29,420
Comments: This project will be substantially complete by year end. This contract has been amended to provide extended warranty support, within the original project budget.
CIP estimated cost
693,965
Completion date
06/30/2013
Budget Module
This project will implement software to make budget development and monitoring more efficient.
FY 2012-13Adopted Budget
120,000
Dollars spent as of 12-31-12
197,476
Comments: A change in the approach to licensing has increased the cost. A budget amendment will go to Council in the 3rd quarter.
CIP estimated cost
310,000
Completion date
06/30/2013

Metro Quarterly Report, October through December 201234
Information Services
FY 2012-13 Capital Projects status through December 31, 2012
Metro Web Improvement Project
Ths project will upgrade Metro’s website content and migrate the site to the Drupal platform.
FY 2012-13Adopted Budget
367,125
Dollars spent as of 12-31-12
50,954
Comments: The project is on time and on budget and is scheduled to be completed during FY 2013-14.
CIP estimated cost
592,000
Completion date
06/30/2014
Information Technology R&R Projects
Information Technology renewal and replacement projects less than $100,000.
FY 2012-13Adopted Budget
433,169
Dollars spent as of 12-31-12
38,587
Comments: Several projects are likely to carry forward in to FY 2013-14.
CIP estimated cost
n/a
Completion date
Ongoing
Data Center
This project will create a more robust consolidated Metro data center at the Oregon Convention Center.
FY 2012-13Adopted Budget
156,500
Dollars spent as of 12-31-12
69
Comments: This project is expected to be completed on time.
CIP estimated cost
286,500
Completion date
06/30/2013
Enterprise Storage
Includes the replacement of the Net Appliance Alex File Server.
FY 2012-13Adopted Budget
245,243
Dollars spent as of 12-31-12
201,432
Comments: This project will in completed ahead of schedule.
CIP estimated cost
245,243
Completion date
06/30/2013

Metro Quarterly Report, October through December 2012 35
Metropolitan Exposition Recreation Commission
FY 2012-13 Capital Projects status through December 31, 2012
Expo - Parking Lot Maintenance
Ongoing project with funding set aside every year; work includes grinding, repaving and seal coating.
FY 2012-13Adopted Budget
50,000
Dollars spent as of 12-31-12
-
Comments: This work was completed but was a maintenance expense rather than a capital expense.
CIP estimated cost
n/a
Completion date
Ongoing
Expo - Portable Bleacher Replacement
Replaces a portion of the bleachers at Expo.
FY 2012-13Adopted Budget
50,000
Dollars spent as of 12-31-12
54,257
Comments: This is an ongoing project. This year’s planned purchases are complete.
CIP estimated cost
Ongoing
Completion date
Ongoing
Expo - Roof Repair Hall D
Repair of the roof at Hall D.
FY 2012-13Adopted Budget
150,000
Dollars spent as of 12-31-12
119,927
Comments: This project is complete.
Completed project cost
119,927
Completion date
12/31/2012
OCC - Close Circuit TV Replacement
Replacement of security cameras and development of master plan for overall security.
FY 2012-13Adopted Budget
275,000
Dollars spent as of 12-31-12
-
Comments: An RFP was issued and this project is curretnly in the design phase.
CIP estimated cost
275,000
Completion date
06/30/2014
OCC - Energy Conservation Upgrades
Includes Energy Trust of Oregon incentives of $60,000.
FY 2012-13Adopted Budget
150,000
Dollars spent as of 12-31-12
32,463
Comments: This project is in progress
CIP estimated cost
150,000
Completion date
06/30/2013

Metro Quarterly Report, October through December 201236
Metropolitan Exposition Recreation Commission (continued)
FY 2012-13 Capital Projects status through December 31, 2012
OCC - Electrical Sub Metering
Add additional meters.
FY 2012-13Adopted Budget
191,383
Dollars spent as of 12-31-12
3,240
Comments: The return on investment on the original plan was not feasible. The project scope is being revised.
CIP estimated cost
200,000
Completion date
06/30/2013
OCC - Lighting Upgrade Phase II
Lights and dimmers for Exhibit Halls and ABC Meeting Rooms. Includes Energy Trust of Oregon incentives of $190,000.
FY 2012-13Adopted Budget
500,000
Dollars spent as of 12-31-12
1,199
Comments: The work is in progress.
CIP estimated cost
500,000
Completion date
06/30/2013
OCC - Main Kitchen Walk-in Coolers and Freezer
The coolers are inefficient and contain refrigerant that is no longer compliant with regulations.
FY 2012-13Adopted Budget
250,000
Dollars spent as of 12-31-12
4,865
Comments: The work is in progress.
CIP estimated cost
250,000
Completion date
06/30/2013
OCC - Original Roof Replacement
The roof of the original side of the Convention Center is old and has leaks. Phase I through FY 2013-14 includes design and engineering.
FY 2012-13Adopted Budget
100,000
Dollars spent as of 12-31-12
547
Comments: Bids came in higher than budgeted and the project and CIP will be amended.
CIP estimated cost
176,119
Completion date
06/30/2014
OCC - Replace Chrome Entry Doors
Replacement of entry doors on the original side of the convention center.
FY 2012-13Adopted Budget
125,000
Dollars spent as of 12-31-12
-
Comments: A required change in scope is likely to push this project into FY 2013-14 and increase the total budget to $225,000.
CIP estimated cost
225,000
Completion date
09/30/2013

Metro Quarterly Report, October through December 2012 37
Metropolitan Exposition Recreation Commission (continued)
FY 2012-13 Capital Projects status through December 31, 2012
PCPA - AHH Cooling Tower
Replacement of the Cooling Tower and associated piping at Antoinette Hatfield Hall.
FY 2012-13Adopted Budget
150,000
Dollars spent as of 12-31-12
-
Comments: Bids came in higher than budgeted and the project and CIP will be amended.
CIP estimated cost
255,000
Completion date
06/30/2013
PCPA - AHH Exterior Insulation
Includes design, demolition and construction.
FY 2012-13Adopted Budget
100,000
Dollars spent as of 12-31-12
111,141
Comments: Project is complete.
Completed project cost
111,141
Completion date
12/31/2012

Metro Quarterly Report, October through December 201238
Oregon Zoo
FY 2012-13 Capital Projects status through December 31, 2012
Zoo Renewal and Replacement Projects
All zoo renewal and replacement projects less than $100,000.
FY 2012-13Adopted Budget
541,695
Dollars spent as of 12-31-12
185,331
Comments: Completed projects inlude the Penguin Roof and HVAC. Several projects have been moved to later years or will be carried forward to FY 2013-14.
CIP estimated cost
Ongoing
Completion date
Ongoing
Roof Replacement AfriCafe
Regular replacement of the roof on the AfriCafe.
FY 2012-13Adopted Budget
128,593
Dollars spent as of 12-31-12
-
Comments: Due to a much higher than budgeted cost to replace this roof, the current plan is to complete a reconditioning of the roof instead.
CIP estimated cost
139,265
Completion date
06/30/2013
Cascade Grill Improvements
This project will provide an upgrade of the outdated dining space.
FY 2012-13Adopted Budget
150,000
Dollars spent as of 12-31-12
-
Comments: The project will be carried forward to FY 2013-14.
CIP estimated cost
150,000
Completion date
06/30/2014
Aviary Marsh Mesh
The Aviary Marsh Mesh exhibit will undergo a full renovation and structural replacement.
FY 2012-13Adopted Budget
295,876
Dollars spent as of 12-31-12
7,523
Comments: Project is in progress.
CIP estimated cost
295,876
Completion date
06/30/2013
Africa Lagoon Aviary
Renovation of the Africa Lagoon Aviary to enhance visitor experience and the introduction of a new species (flamingos).
FY 2012-13Adopted Budget
573,479
Dollars spent as of 12-31-12
155,149
Comments: Project is in progress.
CIP estimated cost 573,479
Completion Date
06/30/2013

Metro Quarterly Report, October through December 2012 39
Condor Exhibit
The new exhibit will highlight the Oregon Zoo’s successful breeding program
FY 2012-13Adopted Budget
1,985,057
Dollars spent as of 12-31-12
174,056
Comments: Consultants are finishing construction documents, and a permit set has been submitted to the City of Portland for review.
CIP estimated cost
2,714,125
Completion date
09/30/2013
Improving Elephant On Site Facilities
This project includes the new elephant habitat, as well as Wildlife Live facilities, zoo train rerouting and new service building, construction of the perimeter service road, and new utilities from the central to east hubs along the main zoo pathway.
FY 2012-13Adopted Budget
15,363,237
Dollars spent as of 12-31-12
1,545,067
Comments: In December 2012 the Metro Council approved the staff recommendation to allocate a portion of bond sale premium funds to offset budget overage related to geotechnical challenges. The design team is approved to proceed with construction documents on the elephant portion of the project.
CIP estimated cost
58,753,709
Completion date
05/15/2015
Remote Elephant Center
The 2008 bond called for an assessment of the feasibility of an off-site facility. Staff is developing the capital and operating costs for a facility, assessing property, and reviewing ideas for funding sources.
FY 2012-13Adopted Budget
1,775,000
Dollars spent as of 12-31-12
866
Comments: The Metro Council has directed staff to exercise the property purchase option for the Roslyn Lake property. Project plan development continues. Major components include planning and design, funding strategy, securing land use approvals and communications.
CIP estimated cost
7,200,000
Completion date
TBD
Updated Conditional Use Master Plan and Land Use Reviews
Prepare and achieve land use approvals from the city of Portland for the updated master plan, bond program projects and other improvements at the zoo campus.
FY 2012-13Adopted Budget
50,000
Dollars spent as of 12-31-12
17,071
Comments: This project is complete; final approval of the updated Conditional Use Master Plan was received in January.
Completed project cost
847,630
Completion date
01/31/2013
Oregon Zoo Bond Projects
FY 2012-13 Capital Projects status through December 31, 2012

Metro Quarterly Report, October through December 201240
Parks and Environmental Services
FY 2012-13 Capital Projects status through December 31, 2012
MRC Front Plaza Planters
Project to repair and prevent leaks in the plaza planers.
FY 2012-13Adopted Budget
65,000
Dollars spent as of 12-31-12
50,802
Comments: This project is complete.
Completed project cost
126,000
Completion date
08/30/2012
Regional Parks Renewal and Replacement
All parks renewal and replacement projects less than $100,000.
FY 2012-13Adopted Budget
309,204
Dollars spent as of 12-31-12
8,600
Comments: Projects in progress.
CIP estimated cost n/a
Completion date
Ongoing
Blue Lake Wetland, Pathway, Trail
Regular replacement of existing trail and pathway.
FY 2012-13Adopted Budget
195,595
Dollars spent as of 12-31-12
-
Comments: This project remains on hold due to permitting issues.CIP estimated cost 195,595
Completion date
TBD
Glendoveer Golf Course Improvements
Improvements in this project include a new cart barn, bathroom renovations and irrigation planning.
FY 2012-13Adopted Budget
331,000
Dollars spent as of 12-31-12
21,394
Comments: Projects are in progress.
CIP estimated cost 331,000
Completion date
06/30/2013
Glendoveer Tennis Center Roof
Will replace roof that is currently leaking.
FY 2012-13Adopted Budget
129,000
Dollars spent as of 12-31-12
-
Comments: Project is in planning/bid stage.
CIP estimated cost 129,000
Completion Date
11/30/2010

Metro Quarterly Report, October through December 2012 41
M. James Gleason Boat Ramp - Phase IV
Represents the cost of repaving the existing parking lot.
FY 2012-13Adopted Budget
1,285,900
Dollars spent as of 12-31-12
37,039
Comments: A spring budget amendment will recognize an additional grant for this project.
CIP etimated cost
1,285,900
Completion Date
06/30/2013
Regional Parks Renewal and Replacement
All parks renewal and replacement projects less than $100,000.
FY 2012-13Adopted Budget
309,204
Dollars spent as of 12-31-12
8,600
Comments: Projects in progress.
CIP estimated cost
Ongoing
Completion Date
Ongoing
Oxbow Park Capital Improvements
Project will include improvement identified by the Oxbow Park Master Plan to be completed in FY 2012-13.
FY 2012-13Adopted Budget
363,600
Dollars spent as of 12-31-12
-
Comments: Master plan update is still in progress and no expenditures are anticipated this fiscal year.
CIP estimated cost
363,600
Completion Date
6/30/2014
Solid Waste Renewal and Replacement
All solid waste renewal and replacement projects under $100,000.
FY 2012-13Adopted Budget
665,000
Dollars spent as of 12-31-12
112,239
Comments: Completed projects include the Metro Central and Metro South Radiation Detection Systems. Other projects are in process; several may be carried forward to FY 2013-14.
CIP estimated cost n/a
Completion Date
Ongoing
Improvement to Metro South Truck Entrance/Exit
The project scope involves adding landscaping and a new automatic gate.
FY 2012-13Adopted Budget
100,000
Dollars spent as of 12-31-12
-
Comments: Since the road realignment work is still installing landscaping, this project will be carried forward to FY 2013-14.
CIP estimated cost
100,000
Completion Date
06/30/2014
Parks and Environmental Services (continued)
FY 2012-13 Capital Projects status through December 31, 2012

Metro Quarterly Report, October through December 201242
Metro Central Organics/Food Handling Area Improvements
Project to improve food handling capabilities.
FY 2012-13Adopted Budget
250,000
Dollars spent as of 12-31-12
174,591
Comments: The push wall and pit fill portion of the area modifications has been completed. Additional improvements are being considered.
CIP estimated Cost
250,000
Completion Date
6/30/2013
Metro Central Stormwater Improvements
This project will improve the removal of solids from our storm water discharge.
FY 2012-13Adopted Budget
150,000
Dollars spent as of 12-31-12
2,226
Comments: Some equipment has been purchased but the scope is still dependent on DEQ and new permit requirements.
CIP estimated cost 425,000
Completion Date
06/30/2014
Metro South HHW - Extend Canopy
This project expands the covered work area for unloading vehicles and reduces rainfall entering the spill containment tank.
FY 2012-13Adopted Budget
75,000
Dollars spent as of 12-31-12
-
Comments: Project is under construction and expected to come in at $50,000.
CIP estimated cost 50,000
Completion Date
06/30/2013
St. Johns Landfill-Gas to Energy Conversion
The project proposed to implement the conversion of the excess gas into either electricity or a compressed gas suitable for use in vehicles.
FY 2012-13Adopted Budget
1,150,000
Dollars spent as of 12-31-12
-
Comments: Project was not deemed feasible and as been canceled.
CIP estimated cost n/a
Completion Date
n/a
St. Johns - Landfill Remediation
St. Johns Landfill is on the DEQ confirmed release list and inventory, which identifies sites in Oregon where release of hazardous substances into the environment has been confirmed, where further investigation is required and remediation may be needed.
FY 2012-13Adopted Budget
1,000,000
Dollars spent as of 12-31-12
-
Comments: This project has not been implemented, and none of the budget has been expended. Depending on regulatory developments, implementation will occur in either FY 2013-14 or FY 2014-15.
CIP estimated cost 3,000,000
Completion Date
06/30/2015
Parks and Environmental Services (continued)
FY 2012-13 Capital Projects status through December 31, 2012

Metro Quarterly Report, October through December 2012 43
Metro Central - Replace Metal Wall System
Replace deteriorated metal siding as needed throughout the site buildings.
FY 2012-13Adopted Budget
170,000
Dollars spent as of 12-31-12
-
Comments: This project was forecast through a renewal and replacement study several years ago. It has not been necessary to this point.
CIP estimated cost n/a
Completion Date
n/a
Metro Central - Replace Slow Speed Shredder
This project will replace the slow speed shredder used to grind wood debris at Metro Central Transfer Station.
FY 2012-13Adopted Budget
600,000
Dollars spent as of 12-31-12
-
Comments: This project will be moved out until organics and wood debris issues are resolved, to be completed in FY 2014-15.
CIP estimated cost 600,000
Completion Date
06/30/2015
Metro Central HHW - Roof Replacement
This project replaces the roof at the Metro Central HHW facility.
FY 2012-13Adopted Budget
40,000
Dollars spent as of 12-31-12
48,863
Comments: This project is complete.
Completed project cost
136,000
Completion Date
09/30/2012
Metro South - Roof Replacement
The metal roofing at the South Transfer Station will reach the end of its expected life in 2013.
FY 2012-13Adopted Budget
335,000
Dollars spent as of 12-31-12
-
Comments: This project has been canceled. The two areas of roof that need replacement are being completed under separate projects approved for green roof consideration.
CIP estimated cost n/a
Completion Date
n/a
Metro South - Bays 1 and 2 Ventilation System
Replaces exhaust fans that were part of the original construction in 1993.
FY 2012-13Adopted Budget
110,000
Dollars spent as of 12-31-12
4,029
Comments: Project specifications and engineering are complete, construction likely to carry forward to FY 2013-14.
CIP estimated cost 110,000
Completion Date
06/30/2014
Parks and Environmental Services (continued)
FY 2012-13 Capital Projects status through December 31, 2012

Metro Quarterly Report, October through December 201244
Parks and Environmental Services (continued)
FY 2012-13 Capital Projects status through December 31, 2012
Metro South Control Room Green Roof
This project will evaluate feasibility of replacing the membrane roof with a green roof.
FY 2012-13Adopted Budget
150,000
Dollars spent as of 12-31-12
9,000
Comments: Green roof was determined infeasible. Membrane roof replacement bids were received 1/17/13.
CIP estimated cost 150,000
Completion Date
06/30/2013
Metro South Front Entry Roof
This project will evaluate feasibility of replacing the built-up roof with a green roof.
FY 2012-13Adopted Budget
120,000
Dollars spent as of 12-31-12
-
Comments: Green roof was determined infeasible. Standard built-up roof replacement bids were received 1/17/13.
CIP estimated cost 120,000
Completion Date
06/30/2013

Metro Quarterly Report, October through December 2012 45
40-Mile Loop Trail Construction at Blue Lake Park
This section of the 40-Mile Loop Trail will close a key gap along Marine Drive. The trail will be built on Metro-owned property in Blue Lake Park.
FY 2012-13Adopted Budget
1,087,760
Dollars spent as of 12-31-12
1,629
Comments: This project is underway but is expected to carry forward to FY 2013-14.
CIP estimated cost 1,087,760
Completion Date
06/30/2013
Natural Areas Acquisition
Voters approved a $224.7 million General Obligation Bond Measure to acquire natural areas for the purpose of water quality and habitat protection.
FY 2012-13Adopted Budget
30,000,000
Dollars spent as of 12-31-12
9,062,000
Comments: Project is ongoing.
CIP estimated cost 137,000,000
Completion Date
06/30/2016
Natural Areas Information System
Database project to track acquisitions from 1995 and 2006 bond programs.
FY 2012-13Adopted Budget
350,000
Dollars spent as of 12-31-12
179,609
Comments: This project will be complete at the end of the fiscal year, although an additional phase will be proposed.
Completed project cost
650,000
Completion Date
06/30/2013
Canemah Bluff Improvements
The project includes trail improvements, signage installation, and an overlook/safety fence design and construction.
FY 2012-13Adopted Budget
119,350
Dollars spent as of 12-31-12
-
Comments: Projects in progress.
CIP estimated cost 119,350
Completion Date
06/30/2013
Sustainability Center
FY 2012-13 Capital Projects status through December 31, 2012

Metro Quarterly Report, October through December 201246