Embed Size (px)
Citation preview
GHS Quality and Safety Report July 2012
Core Measures
Background – The Center for Medicare and Medicaid Services (CMS) and The Joint Commission (TJC) have developed process of care measures for Acute Myocardial Infarction (AMI), Congestive Heart Failure (CHF), Community Acquired Pneumonia (CAP), and Surgical Care Improvement (SCIP) termed “Core Measures”. Beginning January of 2012, a new measure, Inpatient Immunization, was added to the “Core Measures”. The term “All Care Measure” refers to perfect care provided to a patient with a specific disease. It is the percent of patients who received all the needed core measures required for that disease state. The term “Composite” refers to the percent compliance of all possible opportunities (the total number of compliant opportunities for care divided by the total number of opportunities for care). The Composite score will always be higher than the All Care Measure Score. The measures differ slightly between CMS and TJC and are publicly reported on their respective websites (CMS) www.hospitalcompare.hhs.gov and (TJC) www.qualitycheck.org. Reported results lag 3 to 6 months behind due to the complexity and requirements of external reporting. Over the past several years, we have set an organization wide goal for the All Care Measure (ACM). We have also reported the Composite measure. Beginning in FY 2012, we are changing our organizational goal to a Value Based Purchasing (VBP) score, but will continue to report the ACM and Composite scores. The Deficit Reduction Act of 2005 directed CMS to develop a Value Based Purchasing (VBP) incentive program to begin to align Medicare payments with hospital quality performance. The Patient Care and Affordable Care Act put in place the mechanism and requirement for CMS to withhold a percentage of Medicare reimbursement and require hospitals to meet performance thresholds to earn back the withheld percentage. The amount CMS will withhold in FY 2013 is 1.0% of a facility’s CMS baseline DRG payment. This withhold will increase by 0.25% annually to 2.0% in FY 2017. Based on a hospital’s total performance score, hospitals will have their DRG payments adjusted by a factor somewhere between a loss of the entire withhold, to a gain of an amount equal to the withhold. Thus, in FY 2013, GHS will be paid a DRG rate somewhere between 1.0% less than, to 1.0% greater than, the national DRG rate. The VBP program is budget neutral resulting in many hospitals losing money and others gaining money. Hospitals must also continue to submit results to the Hospital Compare website. The total performance score during the first year of the VBP program will combine both clinical core measures and patient experience (HCAHPS) measures. The clinical Core Measures domain consists of 12 core measures that are both clinically relevant and not optimally provided across the country, and will reflect 70% of the total VBP score in the first year. The patient experience domain consists of HCAHPS patient satisfaction measures and will reflect the other 30% of the total VBP score. First year payments or penalties will be assessed in FY 2013 based on a hospital’s performance score during the
2
time frame beginning with July 2011 discharges and ending with March 2012 discharges. Hospitals will have two methods to gain points toward their total VBP score. For each measure, a hospital can either achieve a certain level of performance or they can obtain points for improving their scores as compared to their baseline data. CMS will count the greater of the two scores, achievement versus improvement. Because GHS has historically done very well on core measures, our opportunity for improvement is minimal and our clinical domain score will likely be determined primarily by our achievement score. CMS has established national benchmarks and thresholds for each VBP quality measure. The benchmarks represent the highest achievement levels whereas the thresholds represent the minimum achievement levels. Each of our four acute care facilities will receive their own VBP score and will each be susceptible to incentive payments or penalties. GHS Goal – For FY 2012, the GHS quality goal is the new measure for Value Based Purchasing. Specifically, it is the composite compliance score for the 12 clinical core measures. Historically, our composite score for these measures has been around 98%, which is at the 75th percentile. Thus, the GHS goal is set at 98.0% to maintain performance at this level. We will continue to report the ACM and Composite scores. Historically, the inpatient scores have been at 93.0% and 98.0% respectively, which approximate the national 75th percentile. GHS Results –
Value Based Purchasing – The first year performance period includes the nine month time frame from July 2011 through March 2012. The initial results for all four acute care facilities exceed our target of 98.0%. The GHS VBP clinical score is 99.0%, Greenville Memorial’s score is 98.3%, Greer Memorial’s is 99.3%, Hillcrest Memorial’s score is 99.6%, and Patewood Memorial’s score is 99.5%. This suggests that if those scores are maintained, GHS will do very well financially in the VBP program. ACM / Composite Scores – From April 2011 through March 2012, the GHS ACM compliance rate is 95.3% for inpatient measures, 97.1% for outpatient measures, and 95.6% combined. The inpatient composite compliance rate for this time period is 98.8%. The Acute Myocardial Infarction ACM score for January -‐ March 12 is 98.0%, while the composite compliance rate is 99.5% (816/820). The Congestive Heart Failure ACM score for January -‐ March 12 is 96.7%, while the composite compliance rate is 98.5% (446/453). The Community Acquired Pneumonia ACM score for January -‐ March 12 is 96.3%, while the composite compliance rate is 97.8% (353/361).

3
The Surgical Care ACM score for January -‐ March 12 is 94.5%, while the composite compliance rate is 99.1% (3608/3641). The Outpatient All Care Measure score for January -‐ March 12 is 93.8% while the composite score is 96.2% (527/548).
Specif ic Issues – A few of the older core measures that are currently opportunities are the “removal of the post-‐operative urinary catheter” and “Antibiotic Selection”. In addition, several new outpatient ED measures are showing results lower than desired.
(1) Community Acquired Pneumonia – A recent focus of the Pnuemonia Team is the measure
“Antibiotic Selection”. During the quarter Janaury 2012 – March 2012 a trend was noted that the antibiotic administration was not consistently an accurate part of the hand off communication between the ED and the ICU or the Med-‐Surg unit. A subgroup of the Pnuemonia Team will be convened to develop and recommend solutions. 94% compliance is seen at both Greenville and Hillcrest Hospitals for this measure.
(2) SCIP (Surgical Care Improvement Project) – The primary opportunity continues to be the
Removal of Urinary Catheter within 2 Days of Surgery in order to prevent a Catheter Associated Urinary Tract Infection (CAUTI). Actions taken by the Urinary Catheter workgroup have led to an improved compliance rate in the mid 90’s except for March where the compliance rate dropped to 88%. ICU education and refinement of the Soarian Clinical documentation tool have been recent improvement projects.
(3) SCIP – The Core Measure for Perioperative Beta-‐Blocker was revised by CMS and Joint Commission starting with January 2012 discharges. A second component was added so that the patient who is taking a Beta-‐Blocker prior to arrival not only has to receive a dose during the perioperative period but must also receive a dose on post op day one or post op day two. Overall, GHS results did not significantly drop; however, they did decline to the mid to low 90’s. A workgroup has met once and will meet again in August to evaluate the process and develop recommendations.
Mortal ity Rates
Background – We assess mortality rates through four methods.
CMS 30 Day, All Cause Mortality Rates for AMI / CHF / Pneumonia – CMS calculates and reports 30 day, all-‐cause mortality rates for patients admitted with AMI, CHF, or pneumonia on their public website at www.hospitalcompare.hhs.gov. Because they have complete claims and eligibility data, they are able to identify patients who die after being admitted to any hospital in
4
the country. CMS calculates this data once annually. The current measures are for July 2008 through June 2011.
Premier In-‐Hospital Mortality Rates – We assess system, facility, and DRG business line level data of all-‐cause, in-‐hospital mortality throughout GHS utilizing the Premier Clinical Advisor database. A mortality rate index is calculated that represents a risk-‐adjusted measure of the observed mortality rate divided by the expected mortality rate. AHRQ Inpatient Quality Indicators (IQIs) – The Agency for Healthcare Research and Quality (AHRQ) has developed the Inpatient Quality Indicators (IQIs), which are a set of measures that provide perspective on hospital quality of care using hospital administrative (claims) data. The data source for AHRQ IQI data is provided by CMS on an annual basis to all participating hospitals across the country. The benchmarks in the CMS annual report are derived from their national database. At this time CMS is scheduled to publicly report on their Hospital Compare website only two of the AHRQ IQI indicators, Hip Fracture Mortality Rate and AAA (Abdominal Aortic Aneurysm) Repair Mortality Rate. The indicators are used to screen for opportunities in (1) inpatient mortality for certain procedures and medical conditions; (2) utilization of procedures for which there are questions of overuse, underuse, and misuse; and (3) volumes of procedures for which there is evidence that a higher volume of procedures is associated with lower mortality rates. In this section, we are presenting data for the IQIs that assess inpatient mortality rates only.
In addition to the CMS publicly reported data we are able to obtain external benchmarks from University HealthSystem Consortium (UHC) and Premier for Greenville Memorial. For Greer, Hillcrest and Patewood Memorial Hospitals the external benchmark is obtained from only Premier. GHS Site-‐Specific, 5-‐Year Cancer Survival Rates – Annually, we review our 5 year cancer survival rates for several specific forms of cancer as part of our cancer care accreditation. The data is obtained from our cancer registry and compared to the National Cancer Database (NCDB) national benchmarks.
The January 2012 study performed by Dawn Blackhurst, DrPH assessed the 5 year survival of “analytic” cases diagnosed with cancer in 2003 and 2004. “Analytic” cancer cases are those who were diagnosed or received their first course of treatment at GHS. GHS survival rates were compared to rates from Teaching/ Research Hospitals within the NCDB (n=244 hospitals). Rates were formally compared for statistical significance using 95% confidence intervals.
GHS Goal – Our goal is for our mortality index or rates to be statistically better than expected. For the IQIs, our goal is to have a rate lower than the comparative benchmark.
5
GHS Results
CMS 30-‐Day, All Cause Mortality Rates for AMI / CHF / Pneumonia – CMS updates the annual mortality rates for all 3 diseases at all 3 acute care hospitals. Our mortality rates for July 2008 through June 2011, reported in 2012 are statistically no different than the national average. Note that as the population becomes smaller around a specific disease, it is very difficult to show statistical significance.
Premier In-‐Hospital Mortality Rates – Our system wide in-‐hospital, all-‐cause mortality rate for January 2011 through December 2011 is 2.2% and our mortality rate index is 0.83. This is statistically better than expected for the GHS System as well as for GMH, Greer and Hillcrest. Patewood has a 0.10% mortality rate with a mortality rate index of 1.35 due to one death. Due to low numbers, this is not statistically significant. DRG level mortality rate indices are presented for Greenville Hospital System as a whole with no major opportunities identified. AHRQ Inpatient Quality Indicators (IQIs) – For Greenville Memorial we have the ability to benchmark AHRQ IQI results with other UHC teaching hospitals. The IQI mortality rates are below the UHC benchmark for the Inpatient Quality Indicators except for the following patient populations: Esophageal Resection, CABG, craniotomy, AMI with and without transfers, Acute Stroke, Hip Fracture, Pneumonia, PTCA, and CEA. GHS Site-‐Specific, 5-‐Year Cancer Survival Rates – Overall “combined-‐stage” GHS 5-‐year survival rates were comparable (i.e., not significantly different) to NCDB rates for 10 of the 11 cancer sites [See Figure 1]. For bladder cancer GHS had a significantly higher 5-‐year survival rate than did NCDB (75.6% vs. 62.7%, respectively); however, GHS had a greater proportion of Stage 0 cases (63% vs. 47%), which would explain the GHS survival advantage.
30 Day, Al l -‐Cause Readmission Rates
Background – We assess readmission rates through two sources.
CMS 30-‐Day, All Cause Readmission Rates for AMI / CHF / Pneumonia – CMS reports 30 day, all-‐cause readmission rates for patients admitted with AMI, CHF, or pneumonia. Because they have complete claims data, they are able to identify Medicare patients readmitted to any hospital in the country. CMS calculates this data once annually and reports it publicly at www.hospitalcompare.hhs.gov. Current measures are for July 2008 through June 2011. CMS Hospital Readmissions Reduction Program for AMI / CHF / Pneumonia – CMS has been calculating and public reporting the readmission measures for Hopital Inpatient Quality Reporting since 2009 (see above). The 2010 Affordable Care Act requires the Secretary of Health and Human Services to establish a Hospital Readmissions Reduction Program that would
6
reduce CMS Inpatient Prospective Payment System (IPPS) payments beginning October 1, 2012. The ACA further requires the adoption of the 30-‐day Risk Standardized Readmission measures for AMI, Heart Failure and Pneumonia. To comply with these requirements CMS has calculated an Excess Readmission Ratio that will be used to determine payment adjustment for each eligible hospital. Premier 30-‐Day, All Cause Readmission Rates – We assess system, facility, and DRG business line level data for 30 day, all-‐cause readmissions to the same facility utilizing the Premier Clinical Advisor database. A readmission rate index is calculated that represents a risk-‐adjusted measure of the observed readmission rate divided by the expected readmission rate. A higher than expected readmission rate can be an indicator of poor quality care in the hospital, premature discharge from the hospital, or problems within the ambulatory care delivery system. The collection and interpretation of this data is complex. Healthcare data is dynamic and a readmission rate can be one of the most variable measures in healthcare systems due to a variety of factors. In order to assess readmission rates, the medical record and coding of the care provided must be completed for both the first and second admission. Electronic data queries will capture a readmission only after the patient has been discharged a second time. Thus if a patient has a long stay in the hospital during his second admission it could potentially be at least several months before the data query will capture and include that patient’s readmission in the data results. For this reason, the readmission rate for any given quarter may increase over time as more cases are identified. Thus, the readmission rate is continually updated as ‘new’ patients are captured in the data reports. Additionally, current methods do not allow the capture of patients readmitted to other facilities.
GHS Goal – Our goal is to have our readmission index be statistically better than expected. GHS Results
CMS 30-‐Day, All Cause Readmission Rates for AMI / CHF / Pneumonia – CMS updates the annual risk-‐adjusted readmission rates for all 3 diseases at all 3 acute care hospitals. Current results on Hospital Compare reported in June 2012 are for July 2008 through June 2011. Our readmission rates for all 3 populations at Greenville Memorial Hospital (GMH) continue to improve slightly compared to results from the previous year. For the fourth consecutive year GMH has rated “better than the U.S. national average” in AMI and CHF. GMH was the only hospital in South Carolina to achieve this ranking for AMI and only one of four SC hospitals to achieve this “better than” ranking in Congestive Heart Failure. For Pneumonia GMH rated “no different from the U.S. national average. Hillcrest and Greer Memorial Hospitals are statistically no different from the national average for CHF, AMI and Pneumonia. Note that as the population becomes smaller around a specific disease, it is very difficult to show statistical significance. Additionally, GMH has the 2nd lowest overall 30 day readmission rate for Congestive Heart Failure in the entire country.
7
CMS Hospital Readmissions Reduction Program for AMI / CHF / Pneumonia – The data period for calculating the Excess Readmission Ratio in the first year will be based on July 1, 2008 through June 30, 2011. The Excess Readmission Ratio is a measure of relative performance. If a hospital performs better than an average hospital that admitted similar patients (that is, patients with similar risk factors for readmission such as age and comorbidities), the ratio will be less than 1.0000. If a hospital performs worse than average, the ratio will be greather than 1.0000. Results for Greenville Memorial, Hillcrest Memorial, and Greer Memorial for all 3 clinical populations were less than 1.0000. In fact, GMH’s Excess Readmission Ratio for Heart Failure was 0.7959 which is consistent with other benchmarking initiatives that illustrate top performing status. Premier 30-‐Day, All Cause Readmission Rates – Our system wide 30 day, all-‐cause readmission rate for January 2011 through December 2011 is 8.99% and our readmission rate index is 0.85 which is statistically significantly better than expected. Readmission rates for all 4 acute care hospitals are statistically significantly better than expected. DRG level readmission rate indices are presented for Greenville Hospital System and reveal only one quarter in the OB DRG Business Line that was statistically unfavorable. The detailed information has been provided to the OB/GYN Vice Chair of Quality for further review.
AHRQ Patient Safety Culture Survey Background – Key to Patient Safety is the development of an organization wide culture of safety. This is best measured using the AHRQ Patient Safety Culture Survey tool with standardized results and benchmarks. AHRQ publishes their benchmarks typically a year after they are obtained. We will resurvey all GHS employees and physicians in August, 2012. GHS Goal – For FY 2011, our GHS organization wide goal for the AHRQ Patient Safety Culture was to be in the top quartile using a rolled up measure of the entire survey tool by the fourth quarter of FY 2011. AHRQ reports their data a year after it is collected. Thus, the AHRQ benchmarks we used to set our goal came from the 2009 AHRQ Report that included data collected in 2008 and 2009. We approximated the ~82nd percentile as the half-‐way point between the 75th and 90th percentiles reported by AHRQ.
(1) < 50th percentile < 61.00% or lower (2) 50th to 74th percentile 61.00% to 66.99% (3) 75th to ~82nd percentile 67.00% to 68.99% (4) ~82nd to 90th percentile 69.00% to 70.99% (5) > 90th percentile 71.00% or higher
GHS Results – In December 2008, GHS took the survey for the first time. We surveyed only clinical staff and we had a response rate of 55.2% with an overall score of 59.8%.
8
In August / September 2010, GHS again took the survey, but this time did it electronically. We again surveyed only clinical staff and we had a response rate of 35.7% (2,138 / 5,996) and an overall score of 62.4%. This was a statistically significant improvement from baseline and approximated the 57th percentile. For comparative purposes, the national mean was 62%, median was 61%, 75th percentile was 67%, and maximum was 85%. The FY 2011 survey was administered from August 15th to September 5th, 2011. This year, rather than surveying only clinical staff, we sent the survey electronically to all GHS employees, including physicians. This is how AHRQ usually does their surveys and typically results in lower response rates, but higher scores. Our response rate did decrease to 27.2% (2,742 / 10,097). Unfortunately, while the overall score did increase to 62.8%, it did not increase as much as we had anticipated and did not achieve our goal of 67%. The report provides a comparison to benchmarks derived from the 2009 AHRQ Report, which is our goal for FY 2011. We also have access now to the 2010 AHRQ Report and have provided those benchmarks for comparative purposes. AHRQ has noted a slight improvement in all benchmarks. There are 12 domains.
• Previously, we had identified that we do particularly well in 3 areas: (1) teamwork within units; (2) the perception of management support for safety; and (3) supervisor and management expectations and actions. We continue to do well with teamwork within units and supervisor and management expectations and actions, but manager support for safety slightly decreased.
• Previously, we had identified 3 significant areas of opportunity: (1) the perception of a punitive culture; (2) handoffs and transitions; and (3) teamwork across units. These 3 areas continue to be a challenge although we did have a significant improvement in the perception of a punitive culture. This was our lowest performing domain in FY 2010 and we implemented a major program for “Just Culture” at our May Leadership Development Retreat followed by small group training for well over 200 managers over the past few months. A fourth opportunity now exists with a significant decrease in organizational learning and continuous improvement.
Individual hospital scores are provided across the 12 domains relative to the AHRQ mean. GMH worsened, especially within Marshall Pickens. Each of the satellite hospitals had improvements.
National Patient Safety Goals
Background – The Joint Commission (TJC) has established a number of National Patient Safety Goals (NPSG), which are process steps that should be implemented to ensure optimal patient safety. NPSGs are not publicly reported and they represent a self-‐audit. Consequently, there is no national comparative data. In 2011 the GHS audit process for NPSGs changed when a new methodology for data collection was developed. Previously, compliance was evaluated by a unit self-‐audit. Data is now
9
collected by the Quality Management Data Collector Nurses. In the first quarter of 2011, the tools and methodology for data collection were developed. In the second quarter the tools and methodology were tested and validated. In the third and fourth quarters, data collection continued. Data collection for Patient Identification and Suicide Risk are done by direct observation by the Quality Monitoring RNs. Data collection for Critical Results, Time Out and Medication Reconciliation are done by chart audits conducted by the Quality Monitoring RNs. The currently reported NPSGs include the following:
• NPSG 1 – Patient Identification, defined as: Use at least two patient identifiers when administering medications, blood, or blood components; when collecting blood samples and other specimens for clinical testing; and when providing treatments or procedures. The patient's room number or physical location is not used as an identifier. Label containers used for blood and other specimens in the presence of the patient. Audit methodology selected: Staff are observed while performing procedures for compliance with the requirements for patient identification including the use of barcoding technology.
• NPSG 2 – Reporting of Critical Result, defined as: Develop written procedures for managing the
critical results of tests and diagnostic procedures, implement the procedures for managing the critical results of tests and diagnostic procedures and evaluate the timeliness of reporting the critical results of tests and diagnostic procedures. Audit methodology selected: A list of critical results is obtained from the laboratory; then, a chart audit is done for the documentation and timeliness (one hour or less turn-‐ around time) of reporting critical results.
• NPSG 3.06 – Medication Reconciliation, defined as: Obtain information on the medications the patient is currently taking when he or she is admitted to the hospital or is seen in an outpatient setting and compare the medication information the patient brought to the hospital with the medications ordered for the patient by the hospital in order to identify and resolve discrepancies. Provide the patient (or family as needed) with written information on the medications the patient should be taking when he or she is discharged from the hospital or at the end of an outpatient encounter and explain the importance of managing medication information to the patient when he or she is discharged from the hospital or at the end of an outpatient encounter. Audit methodology selected: Medical charts are audited for evidence of a completed medication list on admission; reconciliation of the medication list; medications to be listed along with completed education of the patient and family at discharge.
10
• NPSG 15 – Suicide Risk Assessment and Safety, defined as: Conduct a risk assessment that
identifies specific patient characteristics and environmental features that may increase or decrease the risk for suicide, and address the patient’s immediate safety needs and most appropriate setting for treatment. When a patient at risk for suicide leaves the care of the hospital, provide suicide prevention information (such as a crisis hotline) to the patient and his or her family. Audit methodology selected: On the day this NPSG is audited, a list of behavioral patients present in the emergency department is obtained. A review of those patients’ chart is conducted to determine if the initial suicide risk assessment was completed, as well as evidence of on-‐going risk assessment.
• Universal Protocol -‐ Bedside Time-‐out, defined as: Implement a preprocedure process to verify the correct procedure, for the correct patient, at the correct site, mark the procedure site (if applicable), and perform a time-‐out before the procedure. Audit methodology selected: GHS policy stipulates that a Time-‐out will be performed at the bedside with all providers who will participate in the procedure immediately prior to the procedure and that the elements of the Time-‐out are documented in the medical record. A chart audit is done for the presence of the completed bedside time-‐out form on the charts of patients who have had a bedside procedure.
GHS Goal – Specific organization wide goals for the NPSGs have not been set, but best practice encourages that they should be carried out 100% of the time. TJC typically expects 90.0% compliance. During a recent Joint Commission visit GHSUMC was commended on performance improvement efforts for Patient Identification related to labeling of laboratory specimens at the bedside as evidenced by the National Patient Safety Goal data and observation during the survey. GHS Results – Quarterly results are presented in a graph format in the attachments. Current quarter results range between 61.9 and 97.1% with an overall score of 79.5%. The results reported starting with those in 2011 were significantly lower than those previously reported through unit self-‐audits and we believe are much more accurate. Project to Address Specif ic Goals – A Work-‐out Project is in progress to improve performance for the verification, reporting and documentation of Critical Results and a team has been pulled together to address Medication Reconciliation. Education was done in the Emergency Department to address the address the routine violation of policy to complete the suicide risk assessment for behavioral health patients on admission to the Emergency Department. Compliance is also affected by the number of new staff and the turnover of Clinical Nurse Educators in the Emergency Department at Greenville Memorial. The month of February was devoted to education regarding the requirements for the screening of

11
behavioral health patients for suicide risk and appropriate intervention for those identified as high risk. Preliminary data for the current quarter shows a return to prior performance.
Anticoagulat ion Therapy and Monitoring
Background – Bleeding from anticoagulant use has been recognized as a prevalent complication and an important cause of morbidity and mortality. For this reason Joint Commission added National Patient Safety Goal 3.05 that required the development and use of hospital policies to help reduce the likelihood of harm to patients receiving therapeutic anticoagulation or long-‐term prophylaxis. GHS initiatives began January 1, 2009. In 2010, a multidisciplinary team from Greenville Memorial collaborated with industrial engineers from Clemson University to analyze and direct further efforts to reduce adverse drug events associated with Warfarin (Coumadin). Pharmacists have been reviewing charts of inpatients receiving Warfarin to assure that an initial International Normalized Ratio (INR) was drawn within 48 hours and daily. Multiple actions have been taken to improve the process and the tools related to anticoagulation therapy and monitoring. At present, pharmacists have not been dosing the medication, but collaborating with physicians when the INR exceeds therapeutic range. The time for daily Warfarin administration was changed from 9 p.m. to 5 p.m. to facilitate discussion with the primary care provider more familiar with individual patients than “on-‐call” coverage. Nurses have been required to document the daily INR prior to medication administration. Order sets for anticoagulation therapies and reversal management have been revised. One of the primary goals of the 2010 Project was to identify metrics that demonstrate improved quality and patient safety specific to Warfarin therapy. Two measures are presented in this report.
• While the “therapeutic” INR range is individualized to patients, for purposes of this study, a range of 2.0 – 3.5 seconds represents the expected value. The denominator is INR values for any patient who received Warfarin while in the hospital. It may take several days for the INR to reach therapeutic values.
• The “Critical Value” INR range is defined as being greater than or equal to 5.0 seconds and carries with it an significantly increased risk of bleeding. The denominator is INR values for any patient who received Warfarin while in the hospital.
Goal – The goal is to reduce the likelihood of patient harm related to major bleeding events as evidenced by a decrease in the percentage of critical INR values and achieve clinically expected therapeutic INR values. Results – Trended data shows that from 2008 to 2011 a statistically significant improvement was achieved for both performance measures. There was a 16% increase in therapeutic INRs, and a 38% reduction in critical INRs. Additionally there was a statistically significant linear trend for improvement from 2008-‐2011, for both indicators. Note: P-‐values for improvement from 2008 vs. 2011 from Pearson’s chi-‐square test. P-‐values for linear trend from Cochrane-‐Armitage test.

12
Hospital Acquired Condit ions (HACs)
Background – The Center for Medicare and Medicaid Services (CMS) recently adopted eight of the ten Hospital Acquired Condition measures as part of their Pay-‐for-‐Reporting requirements. This initial set of eight measures will be publicly reported on the CMS Hospital Compare site by June 2011 as a downloadable file. The selected measures were established in collaboration with the CDC and other external agencies to determine conditions or events which were considered serious and reasonably preventable through application of evidence-‐based guidelines. The conditions are identifiable through claims data for Medicare fee-‐for-‐service patients only. Identification of inpatients with a HAC is determined through the use of qualifying ICD diagnostic codes and qualifying Present on Admission (POA) codes. In addition CMS has proposed to include the eight HAC measures as part of its Value Based Purchasing Initiative in 2014 which could potentially also lead to a financial risk for the organization. The eight Hospital Acquired Conditions that CMS will begin to publicly report are:
1. Retained Foreign Object after surgery 2. Air Embolism 3. Blood Incompatibility 4. Pressure Ulcer 5. Falls and Trauma 6. Vascular Catheter-‐Associated Infection 7. Catheter-‐Associated Urinary Tract Infection 8. Poor Glycemic (blood sugar) Control
There is significant concern regarding the accuracy of these measures. They are all developed exclusively from claims data which is subject to errors in documentation and coding. In many situations, the HAC data is not correlating with much more specific data that is obtained using detailed condition definitions and chart audits. Additionally, in some circumstances, there are medically justified reasons for a HAC to occur. They may not be 100% preventable. GHS Goal – No goal has been set at this time for HACs. Ultimately our goal will be to minimize the number of HAC’s for all eight measures across the system. GHS Results – CMS’s initial HAC report covers the time frame July 2009 – June 2011. All HAC measures for Greenville Memorial Hospital were lower than the national rates except for Foreign Object Retained after surgery (1 occurrence), Catheter-‐Associated Urinary Tract Infection (GMH rate is 0.910 compared to a national rate of 0.358), and Poor Glycemic Control (two events resulted in a GMH rate of 0.087 compared to a national rate of 0.058). Greer Memorial Hospital had one event for the measure “Falls and Trauma” resulting in a rate of 0.36 compared to a national benchmark rate of 0.527. Hillcrest Memorial Hospital also had one event for the measure “Falls and Trauma” resulting in a rate of 0.608 compared to a national benchmark rate of 0.527. All other HAC measures for Greer and Hillcrest showed zero events. Patewood Memorial Hospital had no identified HAC’s during this time frame.
13
Along with the CMS publicly reported data we have the ability to utilize our SoftMed coding system to track HAC’s more real-‐time. In July 2010 a process was implemented to concurrently review all HAC cases, excluding CAUTI and CLABSI, to verify and validate the accuracy of the coding. Raw numbers are presented for each HAC category at each of the 4 acute care hospitals. Over the last year and a half Greenville Memorial has seen a slight downward trend in our raw volumes of Hospital Acquired Conditions with the exception of a small spike in CAUTI during the second quarter of 2012. The occurrence of a HAC at the satellite facilities is very low and sporadic.
AHRQ Patient Safety Indicators (PSIs)
Background – A method of assessing inpatient patient safety and complication events is to use the Agency for Healthcare Research and Quality (AHRQ) Patient Safety Indicators (PSIs). The PSIs are a set of measures that provide perspective on hospital quality of care using hospital administrative (claims) data. The indicators are used to screen for potential adverse events occurring during hospitalization following surgeries, procedures and childbirth. They are based on evidence based medicine and use complex algorithms that are risk adjusted. While the PSIs were intended for internal screening to identify potential areas of improvement opportunity, they are now frequently being used to rate the quality and safety of care delivered by hospitals. At this time CMS is publicly reporting on their Hospital Compare website the following seven AHRQ PSI indicators: Patient Safety Indicator
• Iatrogenic Pneumothorax • Post op PE or DVT • Post op Wound Dehiscence • Accidental Puncture or Laceration • Death among Surgical Inpatients with Serious Treatable Conditions • Post op Respiratory Failure • Complications/Patient Safety for Selected Indicators (Composite Score)
GHS Goal – No goal has been set as these are screening tools. For each PSI, we would like the actual measure to be lower than the comparative benchmark. GHS Results – UHC and Premier provide external benchmarks for the PSI’s and thus we are able to track our performance throughout the year. Current data through March 2012 demonstrates that Greenville Memorial still has a potential opportunity with quite a few PSI’s whereas Greer, Hillcrest and Patewood show isolated potential opportunities. A Lean Six Sigma project has been launched to develop a methodology to improve patient safety indicators. The initial focus will target the Accidental Puncture or Laceration Indicator but will later include the measure Post Op Hemorrhage & Hematoma,

14
OB Trauma Vaginal Delivery with instrumentation, OB Trauma Vaginal Delivery without instrumentation . Early results for the Accidental Puncture and Laceration Lean Six Sigma project is showing that in the quarter January 2012 – March 2012 GMH achieved top quartile performance as compared to the UHC benchmark. An AHRQ PSI that we have begun to trend internally even though it is not yet publicly reported is the rate of pressure ulcers. Reviewing our results compared to the UHC benchmark shows that the overall pressure ulcer rate at Greenville Memorial is at or below benchmark.
IHI Global Tr igger Tool
Background – Traditional efforts to detect adverse events have focused on voluntary reporting of events by healthcare providers and tracking and trending of errors. Public health researchers have established that only 10 to 20 percent of errors are ever reported and, of those, 90 to 95 percent cause no harm to patients. The IHI Global Trigger Tool for Measuring Adverse Events was implemented in 2003, providing a method for accurately identifying events (harm) and measuring the rate of adverse events over time. “Harm” is defined as “unintended physical injury resulting from or contributed to by medical care that requires additional monitoring, treatment or hospitalization, or that results in death”. The concept was to move from a focus on error and whether it was preventable or not, to the measurement of global institutional harm, whether preventable or not. The process involves a retrospective review of a random sample of inpatient medical records using “triggers” or clues, to identify possible adverse events.
GHS Goal – A goal will be set after a establishing a baseline since IHI recommends obtaining at least twelve data points prior to performing data analyses. GHS Results – The Quality Management Department began using the IHI Global Trigger tool in January 2012, reviewing 60 random charts for October – December, 2011. The review identified a total of 20 harm events for 15 of the 60 patients. One method to present the data is as a run chart for the measure ‘Adverse Events per 1000 patient days’. GHS results, which includes Greenville, Hillcrest, Greer and Patewood Memorial Hospitals, demonstrate 85 harm events per thousand patient days in October, 72 for November and 37 for December. Florida Hospital System’s historical average was selected as a benchmark since it is also a multi-‐facility system similar to GHS and has years of experience with the IHI Global Trigger Tool. It must be emphasized that 3 months of data is far too little to draw any conclusions using the IHI Global Trigger Tool.
Event Reporting
15
Background – Critical to the ability to improve quality and prevent adverse events is the need to identify errors and near misses, analyze and understand opportunities for improvement and implement targeted improvement initiatives. This identification and measurement of actual and potential adverse events is critical to the development of a safety culture and a high reliability organization. The search for opportunities for improvement comes from data across a spectrum that includes patient complaints, reported unsafe conditions, near misses and adverse events, the investigation of adverse events and malpractice litigation. Efforts to systematically identify potential opportunities from each component of data are underway. What is presented here is some very preliminary unsafe condition / near miss / adverse event reporting data. Unsafe conditions represent issues that present the potential for patient safety issues if not corrected and include such things as environmental issues, equipment safety, infrastructure failure, and security issues. They are not patient specific. The ability to proactively identify and trend such issues via the event reporting system was implemented in January, 2011. Near misses and adverse events both relate to the care of a specific patient. Near misses are potential events that were caught and prevented prior to the patient being involved. An adverse event occurs when the event or care did involve the patient. The adverse event may or may not have caused any patient harm. GHS has used an on-‐line event reporting system since 2009. It is reported in the literature that typically only 5 to 10% of errors are actually reported in hospitals. This is also consistent with baseline data from other high risk industries. If this is true, assessment of errors is being done with 90-‐95% of the puzzle missing! Without this additional information, we lack the ability to accurately identify trends and to proactively isolate and solve problems and system issues. As part of our ongoing commitment to advancing health care quality and patient safety, GHS converted to University HealthSystem Consortium’s (UHC) Patient Safety Net (PSN) for event reporting in late December, 2010. This web-‐based tool provides a mechanism to identify, catalogue and analyze patient complaints, unsafe conditions, near misses and adverse events, which can then be systematically corrected to improve outcomes and prevent patient injury. GHS Goal – The current goal is focused on increasing the number of reports received from front line staff. This is measured as a rate for inpatient settings (number of events reported per 1000 patient days) and as a rate for outpatient settings (number of events reported per 10,000 procedures). The current goal is set at the 75th percentile of Event Reporting compared to comparable size hospitals in the UHC database. Thus, the goal is for the inpatient Event Reporting Rate is to be at or above 40.18 reports per 1000 patient days for each of our facilities. No benchmark has been established for outpatient event rate as published comparison data is not available. GHS Results – Current results are for the first quarter of CY 2012.
16
Frequency – Reporting rates continue to steadily increase. As a system, GHS continues to be below the UHC 75th percentile of 40.18 per 1000 patient days with a current rate in 2QTR12 of 30.72 (up from the baseline in 2010 of 11.9). For the first 6 months of 2012, event reporting increased 26.6% year-‐over-‐year. Unfortunately, we experienced a 6.5% decrease in the 2QTR12 over the prior quarter, primarily due to a 34% decrease at NGH and a 7% decrease at GMH. Hillcrest contributed to the 2QTR12 lift of the system with a 38% increase in that facility’s event reporting rate. Hillcrest, Patewood, North Greenville and Greer exceed the UHC top quartile. GMH, Marshall Pickens, Roger C Peace and Cottages of Brush Creek remain below the UHC comparison rate. Educational efforts continue. Severity – For the quarter reported, the rate of events with moderate to severe injury remained a small percent of the total reports and is in line with prior months. Inpatient events with harm in 2QTR12 were 2.4 / 1000 patient days; down from 3.0 the prior quarter. Harm rate trend line remains stable over time. Type – Event type allows reporting of patient and visitor events, as well as unsafe conditions (which do not pertain to a specific patient or visitor). In addition, the new event reporting system includes approximately 300 event types; the prior system had only 16 event types. The most common event types reported were:
1) Laboratory test (22.1% -‐ an insignificant increase from 21.9% the prior quarter) 2) Medication related events (up to 12.8% from 11.4% the prior quarter, most probably a
result of Pharmacy switching to reporting adverse drug events via PSN rather than a phone line).
3) Falls (12.8%, which is an increase from 11.3% in the prior quarter). It appears that fall frequency remains fairly steady. Although this could be attributable to the increased focus on event notification with this type of event easily recognized and reported. However, comparison to other organizations in the industry is unclear. In September, 2009, UHC reported on falls in CY2008, citing fall rates for all organizations of 2.98 (per 1000 patient days). The GHS fall rate of 4.18 for 2QTR 2012 appears to be statistically higher. It is not clear if the frequency of falls is really higher at GHS or the higher rates reflect underreporting at similar institutions. Visitor slip/trip/falls with harm have increased 44% over the same period last year.
4) Complications of Care (unanticipated, nonsurgical) showed a decrease of 4% this month bringing this category back to the prior average.
5) Skin integrity events (pressure ulcers and skin tears) (slight increase to 9.1% from 7.3% in the prior quarter).
6) Staff have been working arduously to educate front line reporters to select the appropriate event category when reporting. This has reduced the percentage of “other” event reports.
The top 3 events types remain unchanged from prior quarters.
17
This information is going to require significant work to understand the opportunities for improvement. Of critical note is that the relative proportions of types of events may not be reliable. There is a significant bias on the part of staff relative to past training to report some types of events and not others. For example, staffs are well trained that patient falls always need to be reported. This is in contrast to other types of events which might not be top of the mind for staff to report. Falls The Fall rate has remained fairly consistent over the past five quarters. The LEM goal for falls has been set at 3.18 / 1000 patient days and is based on the UHC benchmark data for falls. The fall rate for the last most current 6 quarters for Greer Memorial (3.1) and North Greenville Hospital (2.9) has been below the goal of 3.18. All other facilities are above the goal rate of 3.18; the average fall rate for the current 6 quarters for Greenville Memorial is 3.2, Hillcrest is 4.0, Patewood is 8.8, Marshall Pickens is 5.9 and Roger C. Peace is 7.5. Patewood has made significant improvement from 2Q11 at 19.2 to 2Q12 at 8.8. Hillcrest has also had a significant decline in falls from 2Q11 at 7.3 to 2Q12 at 4.1. Roger C. Peace (7.50), Marshall Pickens (5.9) and The Cottages at Brushy Creek (6.8) are the highest. In an effort to improve performance, the Falls Prevention Program underwent a significant change in 2011-‐2012. Initiatives over the past 12 months include:
• Complete revision of Fall Prevention Policy; • A new Fall Risk Assessment and the Morse Fall Scale was implemented with interventions based
on scoring; • Implementation of post Fall Huddles to discuss the causes of the fall and interventions needed
to prevent another fall. The Falls Committee is working on a system-‐wide marking initiative for Falls prevention including a new falls logo. That team is working with various units / facilities to provide more intensive interventions and staff engagement, as well.
Infect ion Prevention
Background – GHS has a comprehensive Infection Prevention and Control Program which encompass prevention and control practices, targeted ongoing infection surveillance, and process improvement to minimize infection risk. Targeted healthcare associated infections are also publicly reported in South Carolina and are displayed on the SC DHEC web-‐site. For 2012, top priorities include, hand hygiene, central line associated bloodstream infection (CLABSI), ventilator-‐associated pneumonia (VAP), surgical site infections (SSI), Catheter associated urinary tract infections (CAUTI) and multi-‐drug resistant organisms (MDRO). CAUTI surveillance has been expanded this year and reporting on this device related infection is included in this board report for the first time.. Physician led, collaborative teams are established to facilitate infection risk reduction for each of the priority areas. This report does not reflect all of the surveillance and work of the Infection prevention program, but focuses on the top

18
priorities. Newborn / Neonatal Intensive Care Unit (NBICU) data are not included in this report, but will be added in the future reports as this is developed. GHS Goal – Strive to eliminate infections. Infection rate targets are established annually to promote continuous improvement. The benchmark is obtained from the National Healthcare Safety Network (NHSN), a national surveillance program sponsored by the CDC, in which GHS participates. There are no national benchmarks for hand hygiene and multi-‐drug resistant organisms. Targets were established for these infections based on internal data.
Hand Hygiene Background – Hand Hygiene remains the hallmark of infection prevention and has been an identified GHS organization wide goal beginning in FY 2010. Compliance rates around the country typically run around 30% to 70%. There are no national benchmarks, but the literature suggests a critical target of 90% compliance. Dr. Kevin Gilroy and Dr. Bill Kelly lead the hand hygiene improvement team. GHS Goal – GHS is in the third and final year of this organizational goal. The target for FY 2012 is 90% (direct observation). The organization will also transition to electronic monitoring of hand hygiene performance during this year. GHS Results – The organization continues to dedicate two RNs to direct hand hygiene observations. Monthly hand hygiene compliance rates have continued to be above 90%. The data indicates that healthcare providers clean hands most frequently after patient body fluid contact and less frequently before aseptic procedures and before touching the patient. There continues to be gradual improvement in the areas of opportunity. Nursing staff (nurses and technicians) and therapy staff are more likely to clean hands than other healthcare provider groups. We have begun using an electronic form of monitoring on targeted units at GMH. At present, these data will be shared with the location of care only as we go through a period of time utilizing this monitoring approach which calculates a compliance index. The index is based on the number of dispenser activations (hand hygiene activity) divided by the expected hand hygiene opportunity. Specif ic Issues –Currently, GHS is conducting a hand hygiene validation study to validate statistical models to project hand hygiene opportunities which were based on research conduct by GHS (published during February 2011 in the American Journal of Infection Control and Epidemiology [AJIC]). See comments on measurement methodology below. The organization continues a campaign to encourage open communication about hand hygiene behavior which can be accomplished by calling the person’s name to get their attention and then using a high five signal or by stating “ Join the Battle”. The use of communication cards by direct observers to give feedback to healthcare providers about their hand hygiene practice is now being used on all GHS

19
campus s as well. Live, interactive training of front line staff to address hand hygiene compliance opportunities is being conducted during 2012. Comment on measurement methodology: There are several potential ways to measure hand hygiene compliance. The classic method is to use “secret shoppers” unknown to the healthcare workers. Because these observers cannot necessarily observe care in the patient’s room, they usually are limited to measuring hand hygiene only when the healthcare worker enters and leaves the room. This is the methodology used by Novant when it was able to achieve a 90% compliance rate over 3 years. It also is the methodology we used to identify the baseline of 53.8% compliance in June to September 2009. A second method is to have the observer introduce themselves to the healthcare worker and follow them into the room. We are currently using this method, but applying it to the World Health Organization’s more stringent criteria around the “5 moments of hand hygiene”. We believe the 5 moments are more scientifically based and important as we have documented the known transmission of infection to patients from bacteria present in their environment in their room. Washing hands only on entry and exit from the room will not prevent these episodes of infection. The down side to this method is its complexity and the introduction of the Hawthorne Effect, i.e. compliance increases when the healthcare worker knows they are being observed. Thus, the two methods are both valid, but likely will deliver different compliance rates. A critical factor is to measure consistently. At GHS, we are engaged in a significant research study around hand hygiene compliance. We have identified the Hawthorne Effect, but have also identified that it is not complete. That is, even with this method, we still have a 10% noncompliance rate. Nationally, there is a trend towards the second method of observation, although the 5 moments of hand hygiene are often not rigorously used. The research being performed here centers around an electronic method to identify the number of times a healthcare worker uses hand gel or soap during a patient encounter. We have developed statistical models to identify the average number of opportunities a healthcare worker should clean their hands based on the WHO 5 moments of hand hygiene during a patient encounter. Thus, the combination of use of hand cleansing agent (numerator) divided by the expected opportunities for hand cleansing (denominator) provides us with an index to measure hand hygiene in real time and across many different units every shift. We are in the process of doing validation studies to see how the various methods correlate mathematically. The key take away is that none of the methods is capable of determining the actual compliance rate across the organization. Thus, the absolute compliance rate is not as important as the trend towards increased compliance and the consistency and validity of the measurement methodology.
Surgical S ite Infections (SSIs)
20
Background – We track a number of surgical site infection rates which are required by South Carolina law to be publicly reported on the DHEC website. The data in this report is presented in terms of the Standardized Infection Ratio (SIR), which is a statistical ratio of the observed infection rate divided by the expected infection rate. The confidence intervals of each SIR must cross 1.0. SIRs above 1.0 demonstrate a worse than targeted infection rate, while those below 1.0 are better than targeted. NHSN has recently changed the methodology for risk adjustment of SSIs to include all procedure-‐level data collected on each patient (i.e., patient age, gender, duration of surgery, diabetes, trauma, etc.). The prior risk-‐adjustment method was based solely on the ASA (American Society of Anesthesiologists) physical status classification system (i.e., 1=normal healthy patient, …, 4=severely ill patient). This new methodology represents a significant improvement in risk-‐adjustment. NHSN used the data from 2006-‐2008 to derive the new risk adjustment models and then applied them to data from 2009 forward. Four surgical procedures are presented with the new method for determining expected numbers of infections -‐-‐ coronary bypass, abdominal hysterectomy, hip replacement and knee replacement. All other procedures have not yet been updated to the new methodology and use only the ASA classification. GHS Goal – We want to have a Standardized Infection Ratio (SIR) no different or less than 1.0 for each surgical procedure we monitor. This is indicated by the confidence interval crossing 1.0 (no different than expected) or lying completely below 1.0 (statistically better than expected). GHS Results – Data is reported for 2010, 2011 and the first six months of 2012. During the first 6 months of 2012, 3 surgery types, small bowel resection, colon resection and Caesarian section SSIs had a SIR that was statistically less than 1 (fewer infections than expected). All other surgery types have SIRS that were not statistically different from 1 (no different than expected number of infections). These surgery types were coronary bypass grafting (CABG), bariatric surgery, abdominal hysterectomy, ventral hernia repair, knee replacements and hip replacement. Of note hip replacement surgery had a SIR statistically higher than 1 (higher number of infections than expected) during 2010 which has seen improvement during 2011.
Central L ine-‐Associated Bloodstream Infections (CLABSI)
Background – Historically, CLABSI rates at GMH and NG LTACH have been significantly higher than the NHSN mean on many units. During the past four years, the CLABSI Elimination team under the leadership of Dr. Bill Curran has focused on the implementation of evidence-‐based interventions including a central line insertion check-‐list and more recently a maintenance bundle. GHS Goal(s ) – We have historically set our goals at the NHSN mean. This goal was surpassed this past year and thus the target has been increased to top quartile. Ultimately, the goal is to eliminate all CLABSI infections. The NHSN mean for the Adult CLABSI is 1.66 / 1000 central line days and the top
21
quartile is 0.26/ 1000 central line days. PICU pooled mean is 2.2 / 1000 central line days and the top quartile is 0/1000 central line days. Pediatric Medical/ Surgical unit pooled mean is 1.50/1000 central line days and the top quartile is 0/1000 central line days. GHS Results – The data in this report is presented as quarterly CLABSI rates for GHS wide adult care, GMH ICU and Non-‐ICU, North Greenville and PICU areas. The collaborative efforts of the ICU, Non-‐ICU and North Greenville LTACH CLABSI Elimination teams led to a continued reduction in the GHS Adult CLABSI rate to 0.73 / 1000 central line days for the second quarter of 2012. This rate is less than the NHSN pooled mean of 1.66 / 1000 central line days, but higher than the top quartile rate of 0.26 / 1000 central line days. Annual projections based on the first 6 months of 2012 indicate that 120 adult CLABSIs will be prevented. This represents a projected 12 to 24 lives saved and an estimated cost savings of approximately 4.8 million dollars ($40,000/ case). The GMH adult CLABSI rate continues to decline as reflected by a 2012 second quarter rate of 0.75/1000 which is the lowest it has ever been. The January-‐ June 2012 Pediatric Intensive Care Unit (PICU) CLABSI rate is 2.8/ 1000 central line days which is above the threshold. It is important to note that the number of device days is low in this location and that the CLABSI rate for the year will be a better reflection of their true rates. Pediatric Medical/ surgical units have not experienced a CLABSI since the 3rd quarter of 2011. NG experienced a 2011 CLABSI rate of1.42/ 1000 central line days which have been maintained during the first 6 months of 2012 with a rate of 1.40/ 1000 central line days. GrMH and PMH didn’t experience a CLABSI during 2011 or in the first 6 months of 2012. During 2011, HMH, for the first time in many years identified 2 CLABSIs in 497 central lines days for a rate of 4.02. Immediate intervention was initiated and the rate is 0 during the 6 months of 2012.
Venti lator-‐Associated Pneumonia (VAP) Background –The VAP Process Improvement Team led by Dr. Armin Meyer, modified the oral hygiene procedure to include the use of Chlorhexidine Gluconate (CHG). The expanded use of the CASS tube (continuous aspiration of subglottic secretions), head of bed elevation focus and extensive education has led to significant VAP rate improvement. The data presented is in terms of actual infections per 1000 ventilator days. GHS Goal – The 2012 GHS goal VAP during 2012 is to strive for the top quartile rate of 0.20/ 1000 ventilator days as GHS exceeded the target in 2011 of reducing the VAP rate to less than the NHSN mean for the Adult ICU which is 2.49 / 1000 ventilator days. It is understood that this top quartile rate will be challenging to attain. The Pediatric ICU the goal is 1.8 / 1000 ventilator days. LTACH 2011 VAP goal is 0.60 / 1000 ventilator days.

22
GHS Results – The GHS wide adult VAP rate is presented by calendar year beginning in 2007. Data is presented in quarterly rates for adult GMH and NG Adult VAP and pediatric ICU VAP. GHS-‐wide, the adult VAP rate for 2011 was 2.07 / 1000 ventilator days. For the first 6 months of 2012, the VAP rate is 1.93/1000 ventilator days. This rate is lower than the pooled mean but is higher than the top quartile. It is projected that 80 VAPs will be prevented, saving an estimated 16-‐24 lives and 3.20 million dollars. The 2011 GMH ICU VAP rate was 2.3 / 1000 ventilator days. During the 2nd quarter of 2012, the VAP rate increased to 2.7 after a steady decline the previous 2 quarters. The CCU was the site of 5 of the 8 VAPS occurring during the quarter. Several of the patients underwent cold chill procedure which causes fluid to develop in the lung. It is felt that while the patient cases met the CDC VAP definition the lung condition was a result of the code chill procedure. An in depth review was conducted and included the application of the CDC’s revised VAP definition which will go into use officially January 2013. The definition has been revised due to the opportunity for inconsistent application of the definition by hospitals in the United States. With the new definition, three of the CCU cases would not be considered a VAP. The VAP PI Team discussed other opportunities which include daily awakening and spontaneous breathing. A trial of a new process to improve on these opportunities is currently underway. The PICU has gone 1, 182 days without a VAP. (From May 5, 2009 to June 30, 2012). Greer Memorial, Hillcrest Memorial and Patewood Memorial have a VAP rate of 0. North Greenville Long term Acute Care VAP rate has steadily declined over the past several years, from 3.96 / 1000 ventilator days during 2008 to 1.32 / 1000 ventilator days during 2011. This reduction is a result of a focus on the VAP bundle which includes head of bed elevation and oral hygiene. During the first 6 months of 2012, the VAP rate is 1.40/1000 ventilator days which is an increase but not statistically significant. The NHSN pooled mean for this population is 0.6/1000 ventilator days.
Catheter-‐ associated Urinary tract Infections (CAUTI)
Background – Approximately 40% of healthcare associated infections are CAUTI and the infection is considered a hospital acquired condition by the CMS. GHS has chosen to more aggressively address these infections with the goal to reduce CAUTI incidence. Historically, the GMMC campus has not conducted CAUTI surveillance facility-‐ wide. Key to prevention is to identify the volume of infections in order to identify areas of opportunity. During 2011, CAUTI surveillance was conducted in the ICU. With the addition of an infection preventionist during the first quarter of 2012, surveillance was spread to all nursing units in April, 2012. Thus, the GMMC campus is still in the process of collecting baseline data which takes 1 year. It is clear from the data already collected, that CAUTI is an area of opportunity for the organization. NG LTACH, GrMH, PMH and HMH have been conducting facility wide CAUTI for a longer period of time.
23
GHS Goal – To establish a GHS CAUTI infection rate baseline. Strive to reduce CAUTI rates to the top quartile benchmark over time. The 2012 focus will be to conduct a 6 sigma project in two GMH units (NTICU and 5C) and at the NG LTACH and implement a prevention strategy based on identified areas of opportunity. The NHSN pooled mea(s) for the ICU is 2.4/ 1000 Foley days and for the Non-‐ICU it is 1.5/ 1000 Foley days. Results – GMH ICU and NG LTACH CAUT data is presented by quarterly rates. GMH Non-‐ICU is presented by monthly rates as there is limited data. GrMH, PMH and HMH data is presented by 2011 calendar and 2012 rates. GMH ICU experienced a 2011 CAUTI rate of 3.94 / 1000 Foley days which is above the NHSN pooled mean of 2.4 / 1000 Foley days. During the first two quarters of 2012, the CAUTI rate has increased (1st qtr: 5.7; 2nd qtr 6.6). GMH Non-‐ICU surveillance has been conducted for one quarter, April – June, 2012. The monthly CAUTI rates during this time are above the NHSN pooled mean of 1.5. The GMH 6 sigma project was initiated during April and analysis of data indicate that there are opportunities related to aseptic insertion and maintenance of Foley catheters as well earlier removal of Foley catheters when they are no longer clinically needed. GrMH and PMH experienced no CAUTI during the first 6 months of 2012. HMH experienced a 2011 CAUTI rate of 8.26/ 1000 Foley days and a CAUTI rate of 3.75/1000 Foley days during January –June , 2012. The reduction in CAUTI at HMH is a result of a focus on Foley maintenance. NG LTACH has been addressing CAUTI since mid-‐2011. The facility initiated a PI team and became involved in the SCHA CAUTI prevention initiative. They focused on getting Foley catheters out and on the maintenance of the devices while they are needed. These efforts have led to a significant reduction in CAUTI over the past 9 months.
Mult i -‐Drug Resistant Organisms Background – Multi-‐drug resistant organisms are bacteria that have mutated over time to become resistant to most antibiotics. They primarily include Methicillin Resistant Staphylococcus Aureus (MRSA), Vancomycin Resistant Enterococcus (VRE), and Clostridium Difficile. Individuals can be colonized with the bacteria, meaning that the bacteria are present, but not causing an infection. The bacteria can also cause very serious, life-‐threatening infections. We are seeing more individuals come into the hospital already colonized with the bacteria. Generally, it is very difficult to get rid of this colonization. No national benchmarks for incidence of new infections are available. Throughout 2009, MRSA PCR (polymerase chain reaction) testing was implemented on the GMH campus, which allows us to rapidly determine patients who are colonized with the bacteria. All chronically ill adult patients admitted to GMH and NGH are currently being tested for MRSA. This
24
screening facilitates the placement of patients with MRSA colonization into contact precautions to prevent transmission to other patients. Patients with a history of MRSA whose PCR screening was negative are taken out of precautions. The impact of Clostridium difficile (CD) has been felt across the entire spectrum of healthcare and is now recognized as a pathogen capable of causing human suffering to a degree matching that of MRSA. It is for this reason that this infection is being monitoring at GHS. GHS Goal – Goals have been established based on GHS historical data for each facility as there are no national benchmarks.
MRSA – This report focuses on the GMH and NG healthcare associated (HA) MRSA infection rate whose goal is to strive to maintain a stable rate. Clostridium Difficile – GMH and NG locations are the focus of this report. The GMH is to maintain a stable rate and NG’s target is 13.7/ 1000 patient days.
Results MRSA: GMH MRSA healthcare associated infection (HAI) rate data is reported in quarterly rates for 2011 and the first 6 months of 2012. The MRSA healthcare associated infection rate for January to June 2012 is 0.35/ 1000 patient days which is slightly less than the GMMC mean and and reflects stability. During the timeframe of January 2011-‐ June 2012, 11% of adult patients cultured for MRSA PCR on admission were positive (4233 / 35227). Patients colonized or infected with MRSA continue to be placed in contact precautions as a control measure. The 2011 NG MRSA HAI rate remained stable at 1.01/1000 patients days. All patients are placed in contact precautions due to the level of endeminicity of MDROs. C. d iff ic i le: The GMH CD rate remains stable as reflected by a rate of 5/19/ 10,000 patient days during the first 6 months of 2012. NG experienced an increase their CD rate during 2011 to 16.76/ 10,000 pt days. The increase is related to chronic illness and use of antibiotics. In both facilities, environmental cleaning has been emphasized with hypochlorite and antibiotic utilization is being monitored. Efforts on the NG campus have led to a reduction in the CD rate during the 1st quarter of 2012 with a rate of 8.96/ 10,000 patient days.
25
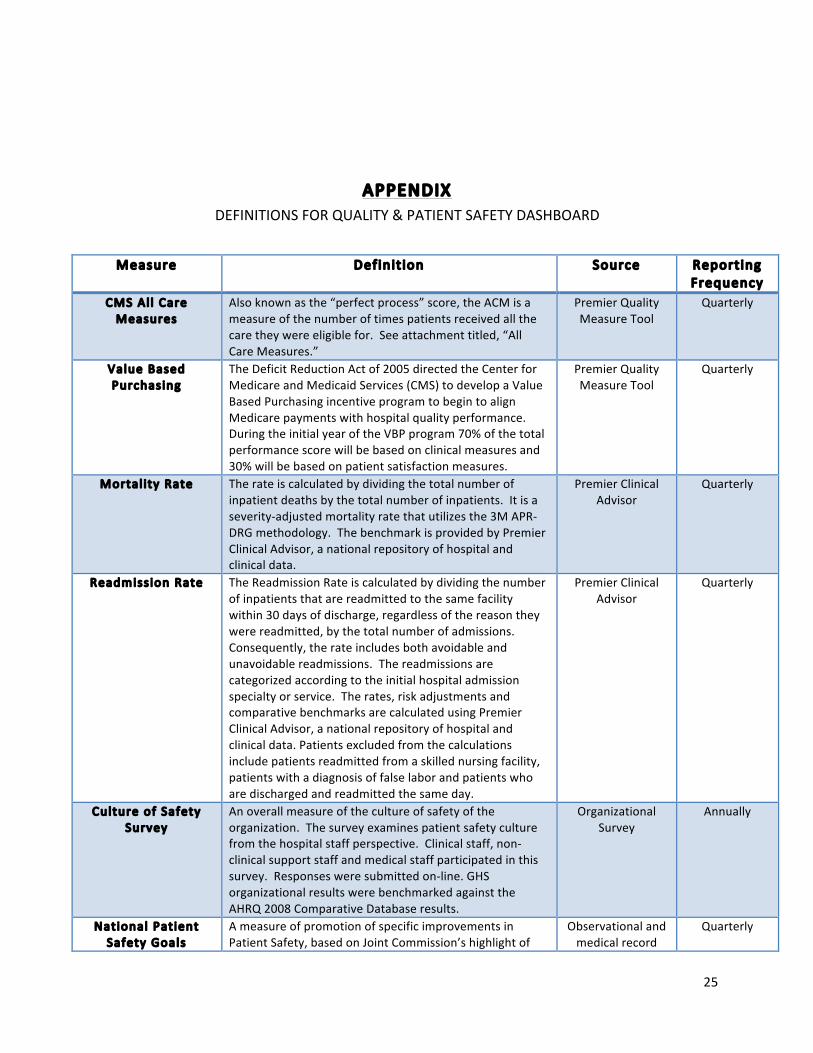
APPENDIX DEFINITIONS FOR QUALITY & PATIENT SAFETY DASHBOARD
Measure Definit ion Source Reporting Frequency
CMS Al l Care Measures
Also known as the “perfect process” score, the ACM is a measure of the number of times patients received all the care they were eligible for. See attachment titled, “All Care Measures.”
Premier Quality Measure Tool
Quarterly
Value Based Purchasing
The Deficit Reduction Act of 2005 directed the Center for Medicare and Medicaid Services (CMS) to develop a Value Based Purchasing incentive program to begin to align Medicare payments with hospital quality performance. During the initial year of the VBP program 70% of the total performance score will be based on clinical measures and 30% will be based on patient satisfaction measures.
Premier Quality Measure Tool
Quarterly
Mortal ity Rate The rate is calculated by dividing the total number of inpatient deaths by the total number of inpatients. It is a severity-‐adjusted mortality rate that utilizes the 3M APR-‐DRG methodology. The benchmark is provided by Premier Clinical Advisor, a national repository of hospital and clinical data.
Premier Clinical Advisor
Quarterly
Readmission Rate The Readmission Rate is calculated by dividing the number of inpatients that are readmitted to the same facility within 30 days of discharge, regardless of the reason they were readmitted, by the total number of admissions. Consequently, the rate includes both avoidable and unavoidable readmissions. The readmissions are categorized according to the initial hospital admission specialty or service. The rates, risk adjustments and comparative benchmarks are calculated using Premier Clinical Advisor, a national repository of hospital and clinical data. Patients excluded from the calculations include patients readmitted from a skilled nursing facility, patients with a diagnosis of false labor and patients who are discharged and readmitted the same day.
Premier Clinical Advisor
Quarterly
Culture of Safety Survey
An overall measure of the culture of safety of the organization. The survey examines patient safety culture from the hospital staff perspective. Clinical staff, non-‐clinical support staff and medical staff participated in this survey. Responses were submitted on-‐line. GHS organizational results were benchmarked against the AHRQ 2008 Comparative Database results.
Organizational Survey
Annually
National Patient Safety Goals
A measure of promotion of specific improvements in Patient Safety, based on Joint Commission’s highlight of
Observational and medical record
Quarterly

26
problematic areas in healthcare. Compliance is measured by audits of each element of performance. Recognizing that sound system design is intrinsic to the delivery of safe, high quality healthcare, the goals generally focus on system-‐wide solutions, wherever possible.
audits
Event Reporting Rate (per 1000 patient days)
A measure of reporting of quality and patient safety events or incidents as well as near misses or “Good Catches.” Total Reported Event Rate is calculated by dividing the number of events reported by the number of patient days times 1000. The data includes 298 event types separated into patient, visitor, and unsafe conditions (unrelated to an individual). The inpatient event rate is benchmarked against event reporting rates for comparable organizations associated with University HealthSystem Consortium(UHC).
Event Reporting System
Quarterly
Patient Fal l Rate(per 1000 patient days)
A measure of quality and patient safety. Falls generally result, at least in part, from the patient condition and are most often caused by disease state, weakness, confusion and medications. The benchmark was established for comparable organizations associated with University HealthSystem Consortium(UHC).
NDNQI Quarterly
Medication Error Rate(per 1000 patient days)
A measure of quality and patient safety. The rate of error reflects variation in the systems or processes of physician ordering, transcription, pharmacy dispensing, and nursing administration of medications. The rate is calculated by dividing the number of events reported by the number of patient days times 1000. An error is defined as the wrong drug, dose, route, time, or patient. Although error is inherent in all human processes, the benchmark should reflect a goal as close to 0% as possible. There are no national standard benchmarks for medication error rates.
Event Reporting System
Quarterly
Reported Events with Harm (per 1000
patient days)
A measure of harm rate of reported events. The harm rate is calculated by dividing the number of events with harm by the number of patient days times 1000. All event types are included in this rate. Harm scores are grouped as “Near Miss” which includes an unsafe condition, or a near miss. A second grouping is events that “Reached the Patient” including those that involved no evident harm, emotional distress or inconvenience, and those requiring additional treatment. A third grouping is those “With Harm” including events with temporary harm to patients, permanent harm to patients, severe permanent harm, or death. Events with harm are benchmarked against comparable UHC participating organizations.
Event Reporting System
Quarterly
Hand Hygiene A measure of quality and patient safety. Hand hygiene in multiple studies has been shown to reduce the incidence of healthcare associated infections. Compliance is determined as the number of appropriate hand hygiene activities (ie, washing hands or applying gel) over the total number of opportunities. Observations are conducted by dedicated and trained nursing staff.
Observational Data Quarterly
Surgical S ite Infection(SSI)
An infection involving the surgical site post-‐operatively. SSIs can be superficial, deep, or within an organ space
ICP Surveillance Monthly
27
(e.g., a joint in knee surgery). Cellulitis of an incision is not considered an infection.
Central L ine-‐Associated Bloodstream
Infection(CLABSI)
An infection in the bloodstream that is associated with a central line (an intravascular catheter that terminates at or close to the heart or in one of the great vessels).
ICP Surveillance Monthly
Venti lator-‐Associated
Pneumonia(VAP)
A diagnosis of pneumonia in a patient who is on a ventilator.
ICP Surveillance Monthly
Mult i-‐drug Resistant Organisms(MDROs)
Bacteria and other microorganisms that have developed resistance to antimicrobial drugs.
ICP Surveillance Monthly
Methici l l in Resistant Staph Aureus(MRSA)
A type of Staph that is resistant to certain antibiotics. MRSA frequently causes infections in the community as well as hospitals. To prevent transmission of MRSA in hospitals, patients who are colonized (the germ is living on the bodies, but isn’t causing infection) are placed on contact precautions as well as those patients who are infected with MRSA.
ICP Surveillance Monthly
Clostr idium Diff ic i le (C. diff ic i le)
A spore-‐forming anaerobic (grows in environment without oxygen) bacteria. The most serious cause of antibiotic-‐associated diarrhea(AAD) and can lead to pseudomembranous colitis, a severe infection of the colon, often resulting from eradication of the normal gut flora by antibiotics. The C. difficile bacteria, which naturally reside in the body, becomes overpopulated; the overpopulation is harmful because the bacterium releases toxins that can cause bloating, constipation, and diarrhea with abdominal pain, which may become severe.
ICP Surveillance Quarterly


![COLOR TELEVISION/ VIDEO CASSETTE RECORDER · using the 500V insulationreslstancemeter [Note1]. 4. If the insulationresistance is lessthan 1M ohm,the inspectionrepairshouldbe required](https://img.pdfslide.us/doc/110x75/5f6df317855d12263f609919/color-television-video-cassette-recorder-using-the-500v-insulationreslstancemeter.jpg)