Embed Size (px)
Citation preview

12011 UK Construction Industry KPIs - Industry Performance Report
UK IndustryPerformance Report2011
Based on the UK Construction Industry Key Performance Indicators
22011 UK Construction Industry KPIs - Industry Performance Report
Industry Performance Report 2011 - ContentsForeword by the Minister for Business and Enterprise ..........................03 Preface ..................................................................................................................04
Key Performance Indicators 2011
Economic indicators ........................................................................................05Client Satisfaction .............................................................................................05Predictability ......................................................................................................06Profitability ..........................................................................................................07Safety ....................................................................................................................07People indicators ..............................................................................................07Environmental indicators ...............................................................................07Housing ...............................................................................................................08Non-Housing ......................................................................................................08Consultants ........................................................................................................09M&E Contractors ...............................................................................................09
Economic KPIs - All Construction Year on Year Comparisons
KPI summary table ...........................................................................................10KPI group trend graph ....................................................................................11
Economic KPIs - All Construction - Individual KPITrend Graphs
Client Satisfaction - Product, Service & Value for Money ................................................................................................12
Contractor Satisfaction - Overall - Performance, Provision of Information & Payment ..........................................................13
Defects - Impact at Handover .......................................................................14
Predictability Cost - Construction, Predictability Time -Project & Design ...............................................................................................15
Predictability Time ............................................................................................16
Profitability (ROS) .............................................................................................16
Productivity - (VAPH Current Values) .........................................................16
Productivity - (VAPH Constant 2000 Values) ...........................................17
Safety - Industry - Contractors All Companies ................................... ......17
Respect for People KPIs - All Construction -Year on Year Comparisons
KPI summary table ...........................................................................................18
KPI group trend graph ....................................................................................19
Environment KPIs - All Construction -Year on Year Comparisons
KPI summary table ............................................................................................20KPI group trend graph .....................................................................................21
Economic KPIs - All Housing - Year on Year Comparisons
KPI summary table ............................................................................................22KPI group trend graph .....................................................................................23
Economic KPIs - All Non-Housing - Year on Year Comparisons
KPI summary table ............................................................................................24KPI group trend graph .....................................................................................25
Construction Consultants KPIs - Year on Year Comparisons
KPI summary table ............................................................................................26KPI group trend graph .....................................................................................26
M&E Contractors KPIs - Year on Year Comparisons
KPI summary table ............................................................................................27KPI group trend graph .....................................................................................27
About
Constructing Excellence ..................................................................................28Glenigan ...............................................................................................................29
32011 UK Construction Industry KPIs - Industry Performance Report
Foreword by the Minister for Business and Enterprise
The Construction Key Performance Indicators are an invaluable tool that can help companies across the
industry to raise their performance, win work and improve their profitability. Over the last 13 years the Construction KPIs have recorded a progressive improvement in the industry’s productivity, social responsibility and economic performance and the bar continues to be raised.
I am very pleased to see that the latest 2011 Key Performance Indicators show strong improvement in most areas, including client satisfaction and the delivery of projects on time and to
budget. It is particularly encouraging that contractors have responded so quickly to new and tougher standards for environmental performance. Their efforts are strongly reflected in this year’s KPIs and, more importantly, are helping to reduce the carbon footprint of industry in the UK.
Furthermore the industry’s clients are taking notice.
In the current tough economic environment, clients are increasingly demanding better value for money, quality of service, and environmental controls that meet the challenge of the UK’s environmental agenda. Construction KPIs provide objective, quantifiable measurements of contractor performance and are therefore a valuable tool to show that contractors are achieving the standards being demanded. For this reason, KPIs are often a key tool used by clients when selecting a supplier and in monitoring subsequent performance.
Contractors, consultants and sub-contractors who successfully improve their performance against industry KPIs are firms that will win more business and build profitable long term relationships with repeat clients. The latest set of KPIs show that collectively the industry continues to raise its game and provides the benchmark against which firms and their clients will judge their performance over the coming year.
Mark Prisk
Minister of State for Business and Enterprise
42011 UK Construction Industry KPIs - Industry Performance Report
Preface2011 sees the thirteenth year of publication of the Construction Industry KPIs which have become a mainstay of the industry since their initial development in 1998. These indicators are based on data from thousands of projects completed over the last year and is collated by Glenigan from surveys of construction clients, contractors, consultants and M&E Specialists. These KPIs enable individual firms to bench-mark their performance against other firms, and they also enable us to measure improve-ment across the industry through this annual Industry Performance Report.
This is the first year in which Constructing Excellence and Gleni-gan have been jointly responsible for compiling and publishing the KPIs, after BIS and ONS awarded the contract in 2009. This change provides an opportunity to ensure the viability of the KPIs for the future and over the last year we have implemented a number of changes to strengthen the KPI data collection process. In particular:
• Glenigan has enhanced the data collection process through:» Improved coverage of the sector through the use of the
Glenigan database.
» More timely issuing of surveys to completed projects—surveys are sent in as few as 15 days following project completion.
» Reduced paperwork burden for businesses through a switch to electronic surveys—paper surveys for client and main contractors ceased after September while consultants and M&E contractors completed surveys exclusively over the internet for the second year.
• Improved industry benchmarking by enabling better granu-larity of reporting (i.e. so that projects can be compared to similar projects, be it regionally, by sector or value).
We have also this year carried out a major review to ensure that the KPIs remain relevant to industry. As part of this review process a number of KPI definitions have been changed, with the prime driver being to increase the objectivity of the data and some obvious gaps have been filled – for instance with the creation of new KPIs for apprenticeships, waste to landfill, use of responsibly sourced material and predictability of energy performance.
We are incredibly excited by the future for KPIs and will ensure that these indicators continue to meet the needs of the industry going forward.
This report provides an overview of the construction industry’s performance and contains trend data for economic performance, people performance and environmental performance, as well as for housing, consultants and M&E contractors.
The KPI teamKeith Folwell Department for Business, Innovation and Skills
Graham Sharp Office for National Statistics
Jon de Souza Constructing Excellence
Allan Wilén Glenigan
David Bentley Glenigan Robert Davis Glenigan
Vicky Hutchinson Centre for Construction Innovation
Measurement and Benchmarking Task GroupThe Measurement and Benchmarking Task Group was formed in May 2010 and operates as a task group of the Strategic Forum for Construction. As such it is responsible for leading the review of the existing set of Key Performance Indicators.
Richard Saxon CBE (Chair) Consultancy for the Built Environment
Michael Bennett Highways Agency
David Bentley Glenigan
Robert Davis Glenigan
Nick Edwards Construction News
Keith Folwell Department for Business, Innovation and Skills
Scott Mclew National Specialist Constructors Confederation Andrew Quirke City West Housing Trust
Jane Thornback Construction Products Association
Charles Tincknell Willmott Dixon
Allan Wilén Glenigan
Jon de Souza Constructing Excellence
This year, a review of the environmental KPIs was undertaken by representatives of both the public and private sectors under the guid-ance of the Strategic Forum for Construction. As a result, in 2012 there will be additional environmental KPIs which better fit the needs of the construction industry. We would like to thank the Strategic Forum’s Sustainable Construction Task Group and the members of the Waste, Water and Carbon Measurement sub-groups who provided invaluable feedback which will greatly improve environmental KPIs in the future.

52011 UK Construction Industry KPIs - Industry Performance Report
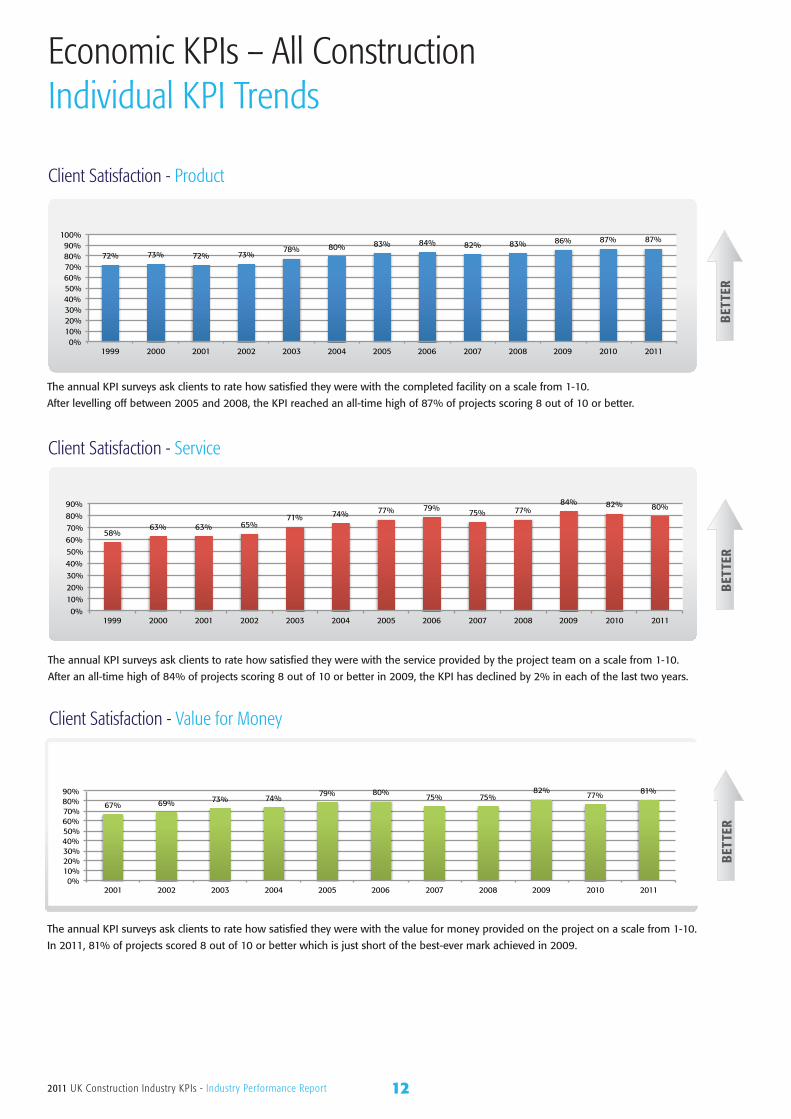
Economic indicators Over the first ten years of the survey, satisfaction KPIs had taken a slow but steady march upward. In the past two to three years, they have levelled off. Indeed, 2011 Key Performance Indicators show that overall client satisfaction was on par with 2010. Clients scored ‘satisfaction with the finished product’ an eight out of ten or higher on 87% of surveys. This equals the highest-ever figure achieved the prior year. Clients with large projects (project with a value of £5 million or more) were less satisfied (83% scored eight of ten or better) than those with smaller projects (88%).
Client Satisfaction Client Satisfaction with service received from contractors declined slightly for the second consecutive year but is still at 80%, higher than any figure before 2009. There was a large disparity between client satisfaction with large projects and those will smaller projects (73% compared to 82%).
On 81% of projects, clients scored ‘value for money’ as eight out of ten or higher. This is a 4% improvement from 2010 and the second highest mark since the survey started. Once again, projects over £5 million in value scored lower than smaller projects. Three quarters of large projects received an eight of ten while 83% of smaller projects hit the mark.
Contractor satisfaction scored highly in 2011. The KPIs either equalled all-time highs or set new highs. However, like clients, their satisfaction decreased as the projects got bigger.
Overall contractor satisfaction with the performance of the client matched the highest-ever figure (69%) set the year before. On projects valued under £5 million, satisfaction jumped to 73%. On large projects, satisfaction plunged to 60%.
Contractor satisfaction with the client’s provision of information slightly bested 2010 and reached a new high of 64%. On large projects, satisfaction declined to just 55% while it was 69% on smaller projects.
Contractor satisfaction with payment achieved both its highest ever mark and highest one year jump as it improved 6% to 77%. Unlike the other satisfaction KPIs, the ratings were approximately equal across all project sizes.
The only satisfaction KPI to decline somewhat significantly is the clients’ rating of ‘Condition of the facility in respect to defects.’ After hovering in the mid-70s for the past six years, it declined to 68%, the lowest rating since 2004. This KPI was dragged down by low marks from large projects. Projects under £1 million scored a solid 74%. This declined to 66% on projects from £1 million to less than £5 million and to 56% on projects of £5 million and more.
Key Performance Indicators 2011The impact of the recession is evident in the latest Key Performance Indicators, which
are centred upon projects completed during 2010. The construction industry has endured a sharp fall in profitability over the last year as workloads have fallen and margins have been squeezed. Despite this challenging economic environment, previous improvements in client satisfaction have been sustained and the predictability of project delivery, both to cost and to budget, has improved further.
Nevertheless the recession is leaving its mark on the industry. Average profitability has fallen 7.7% to 5%. Labour has been shed over the two years as companies have had to adjust to a deterioration in market conditions, with the retained workforce being more intensively deployed. Accordingly the sharp jump in productivity over the last year is likely to include cyclical factors, alongside any incremental efficiency improvements.
Looking ahead, public and private sector clients alike face a tough financial environment. Clients will be increasingly demanding that firms can demonstrate their ability to deliver projects to time and to budget. The Key Performance Indicators provide firms with the benchmark against which they can appraise their own performance and help identify where they can secure future improvements that will help safeguard their competitive position and win work.
62011 UK Construction Industry KPIs - Industry Performance Report
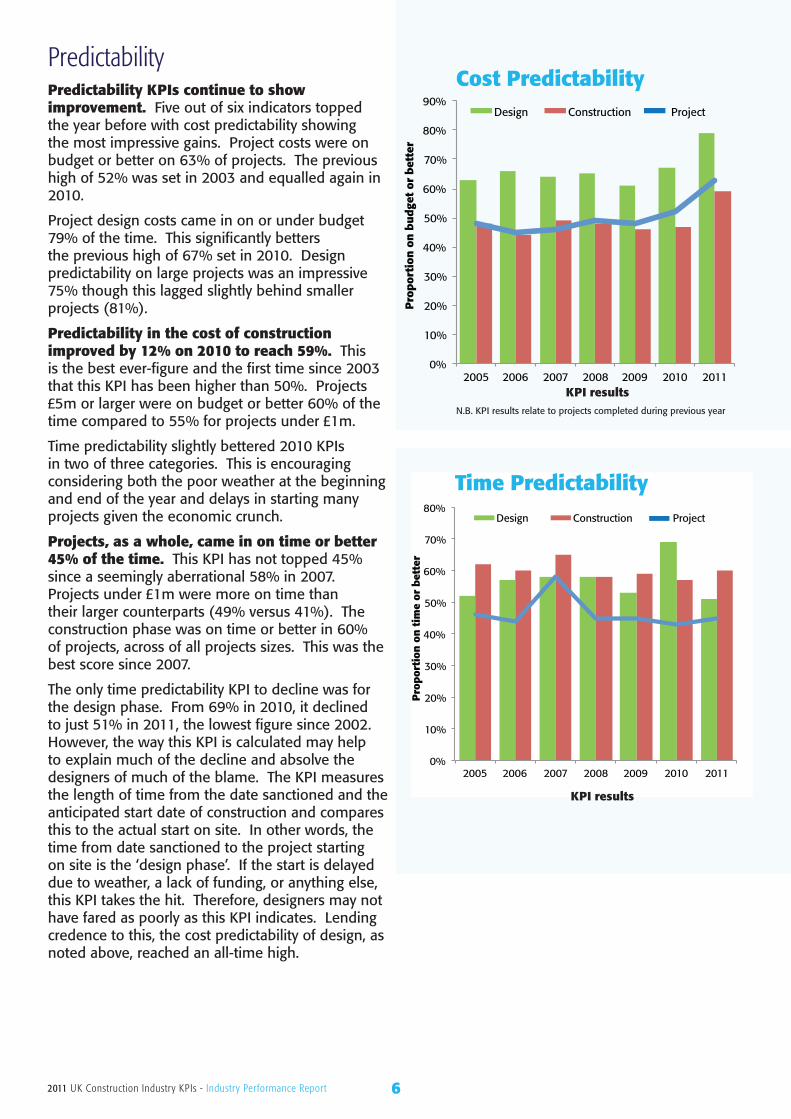
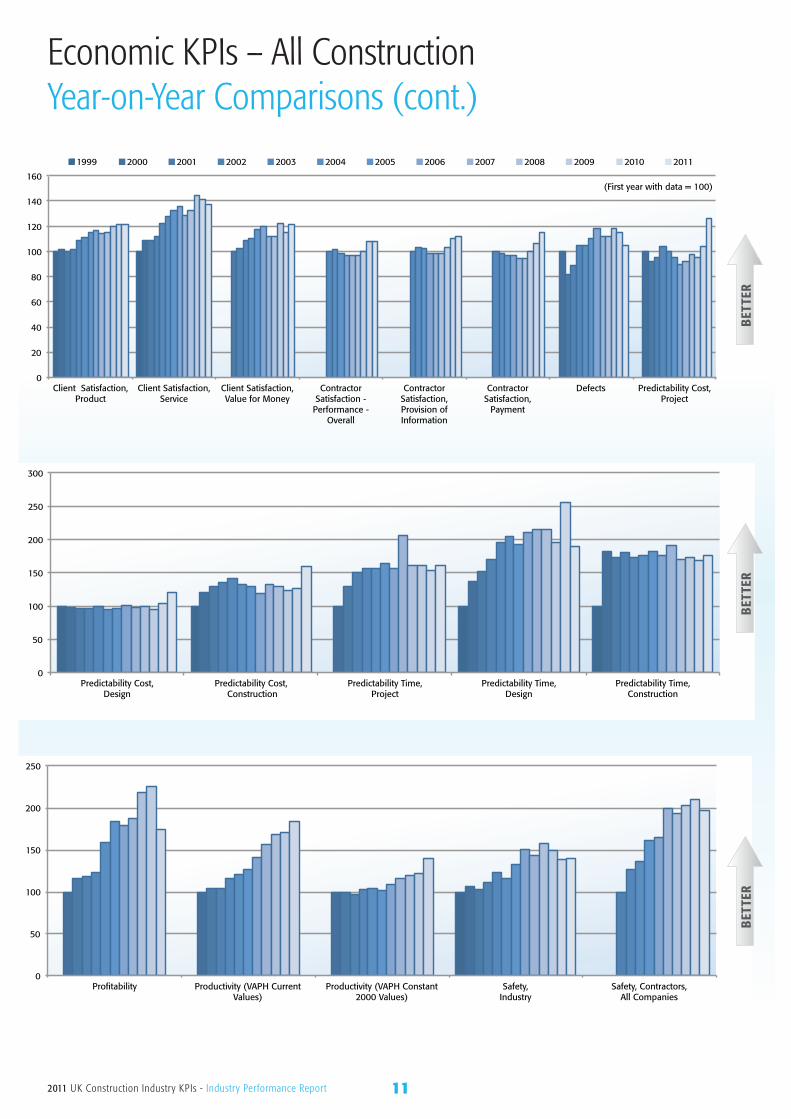
PredictabilityPredictability KPIs continue to show improvement. Five out of six indicators topped the year before with cost predictability showing the most impressive gains. Project costs were on budget or better on 63% of projects. The previous high of 52% was set in 2003 and equalled again in 2010.
Project design costs came in on or under budget 79% of the time. This significantly betters the previous high of 67% set in 2010. Design predictability on large projects was an impressive 75% though this lagged slightly behind smaller projects (81%).
Predictability in the cost of construction improved by 12% on 2010 to reach 59%. This is the best ever-figure and the first time since 2003 that this KPI has been higher than 50%. Projects £5m or larger were on budget or better 60% of the time compared to 55% for projects under £1m.
Time predictability slightly bettered 2010 KPIs in two of three categories. This is encouraging considering both the poor weather at the beginning and end of the year and delays in starting many projects given the economic crunch.
Projects, as a whole, came in on time or better 45% of the time. This KPI has not topped 45% since a seemingly aberrational 58% in 2007. Projects under £1m were more on time than their larger counterparts (49% versus 41%). The construction phase was on time or better in 60% of projects, across of all projects sizes. This was the best score since 2007.
The only time predictability KPI to decline was for the design phase. From 69% in 2010, it declined to just 51% in 2011, the lowest figure since 2002. However, the way this KPI is calculated may help to explain much of the decline and absolve the designers of much of the blame. The KPI measures the length of time from the date sanctioned and the anticipated start date of construction and compares this to the actual start on site. In other words, the time from date sanctioned to the project starting on site is the ‘design phase’. If the start is delayed due to weather, a lack of funding, or anything else, this KPI takes the hit. Therefore, designers may not have fared as poorly as this KPI indicates. Lending credence to this, the cost predictability of design, as noted above, reached an all-time high.
0%
10%
20%
30%
40%
50%
60%
70%
80%
90%
2005 2006 2007 2008 2009 2010 2011
Pro
por
tion
on
bu
dge
t or
bet
ter
Design Construction Project
Cost Predictability
KPI resultsN.B. KPI results relate to projects completed during previous year
0%
10%
20%
30%
40%
50%
60%
70%
80%
2005 2006 2007 2008 2009 2010 2011
Pro
por
tion
on
tim
e or
bet
ter
Design Construction Project
KPI results
Time Predictability
72011 UK Construction Industry KPIs - Industry Performance Report
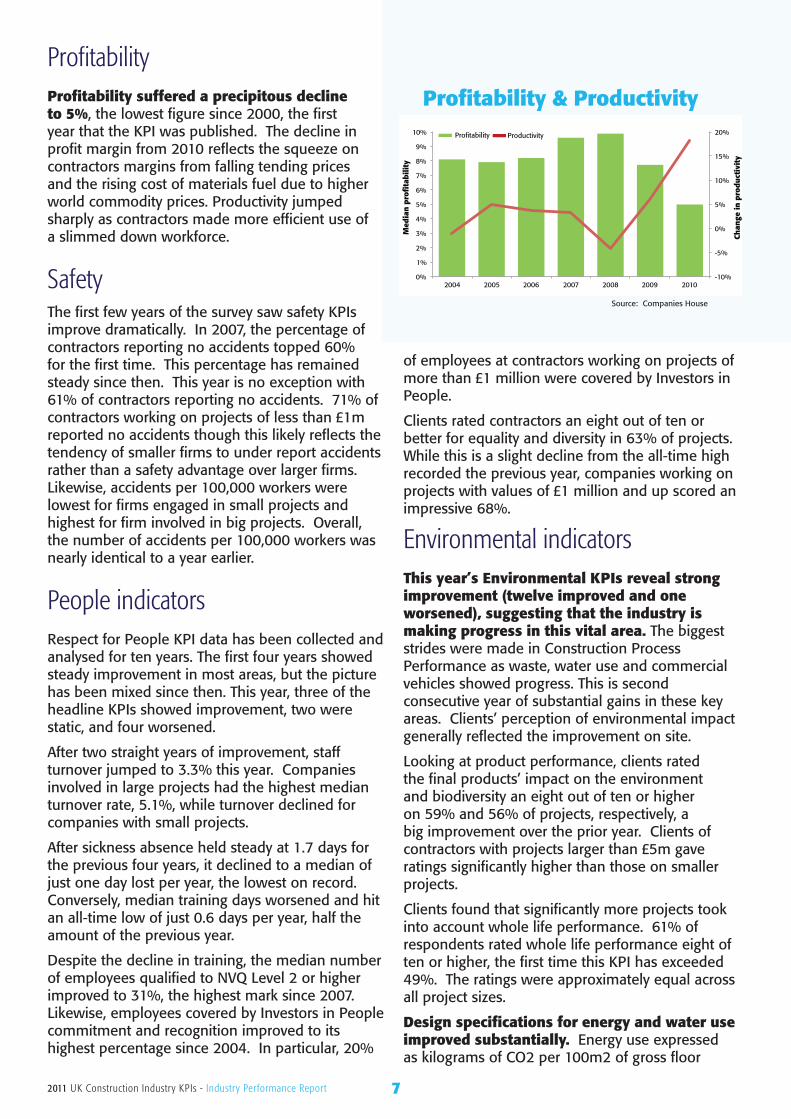
ProfitabilityProfitability suffered a precipitous decline to 5%, the lowest figure since 2000, the first year that the KPI was published. The decline in profit margin from 2010 reflects the squeeze on contractors margins from falling tending prices and the rising cost of materials fuel due to higher world commodity prices. Productivity jumped sharply as contractors made more efficient use of a slimmed down workforce.
SafetyThe first few years of the survey saw safety KPIs improve dramatically. In 2007, the percentage of contractors reporting no accidents topped 60% for the first time. This percentage has remained steady since then. This year is no exception with 61% of contractors reporting no accidents. 71% of contractors working on projects of less than £1m reported no accidents though this likely reflects the tendency of smaller firms to under report accidents rather than a safety advantage over larger firms. Likewise, accidents per 100,000 workers were lowest for firms engaged in small projects and highest for firm involved in big projects. Overall, the number of accidents per 100,000 workers was nearly identical to a year earlier.
People indicators Respect for People KPI data has been collected and analysed for ten years. The first four years showed steady improvement in most areas, but the picture has been mixed since then. This year, three of the headline KPIs showed improvement, two were static, and four worsened.
After two straight years of improvement, staff turnover jumped to 3.3% this year. Companies involved in large projects had the highest median turnover rate, 5.1%, while turnover declined for companies with small projects.
After sickness absence held steady at 1.7 days for the previous four years, it declined to a median of just one day lost per year, the lowest on record. Conversely, median training days worsened and hit an all-time low of just 0.6 days per year, half the amount of the previous year.
Despite the decline in training, the median number of employees qualified to NVQ Level 2 or higher improved to 31%, the highest mark since 2007. Likewise, employees covered by Investors in People commitment and recognition improved to its highest percentage since 2004. In particular, 20%
of employees at contractors working on projects of more than £1 million were covered by Investors in People.
Clients rated contractors an eight out of ten or better for equality and diversity in 63% of projects. While this is a slight decline from the all-time high recorded the previous year, companies working on projects with values of £1 million and up scored an impressive 68%.
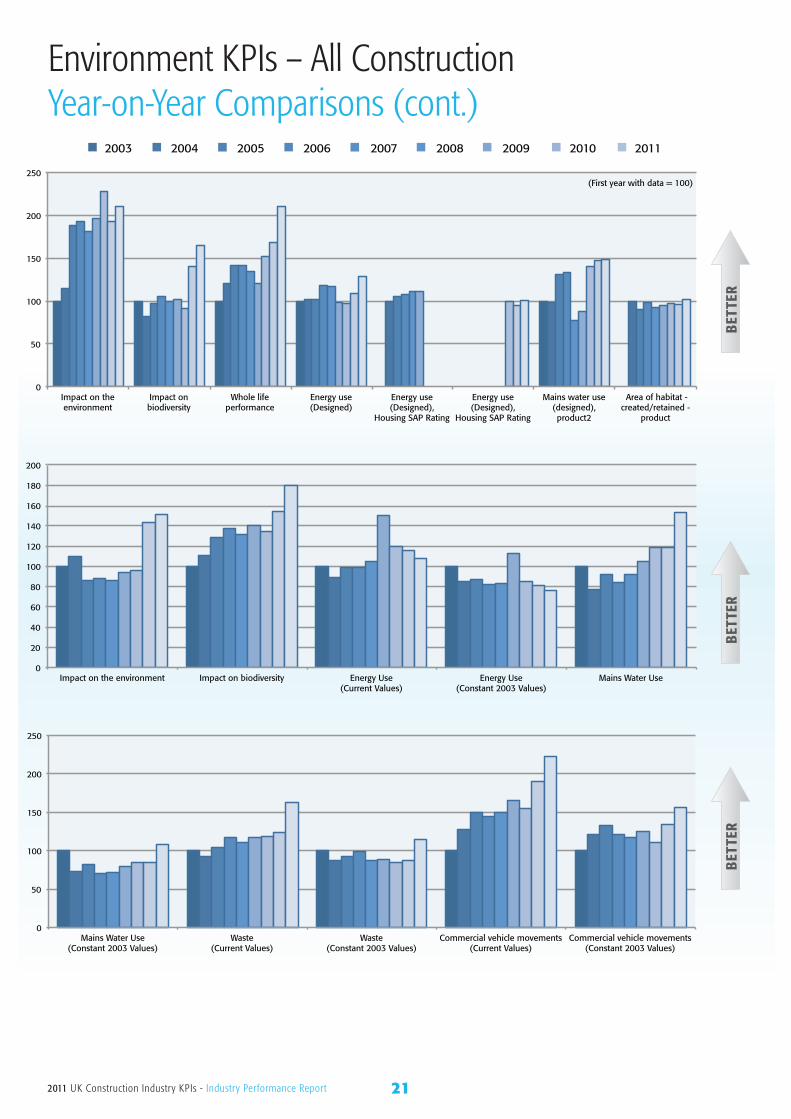
Environmental indicators This year’s Environmental KPIs reveal strong improvement (twelve improved and one worsened), suggesting that the industry is making progress in this vital area. The biggest strides were made in Construction Process Performance as waste, water use and commercial vehicles showed progress. This is second consecutive year of substantial gains in these key areas. Clients’ perception of environmental impact generally reflected the improvement on site.
Looking at product performance, clients rated the final products’ impact on the environment and biodiversity an eight out of ten or higher on 59% and 56% of projects, respectively, a big improvement over the prior year. Clients of contractors with projects larger than £5m gave ratings significantly higher than those on smaller projects.
Clients found that significantly more projects took into account whole life performance. 61% of respondents rated whole life performance eight of ten or higher, the first time this KPI has exceeded 49%. The ratings were approximately equal across all project sizes.
Design specifications for energy and water use improved substantially. Energy use expressed as kilograms of CO2 per 100m2 of gross floor
Profitability & Productivity
Source: Companies House
-10%
-5%
0%
5%
10%
15%
20%
0%
1%
2%
3%
4%
5%
6%
7%
8%
9%
10%
2004 2005 2006 2007 2008 2009 2010
Chan
ge in
pro
du
ctiv
ity
Med
ian
pro
fita
bil
ity
Profitability Productivity
82011 UK Construction Industry KPIs - Industry Performance Report
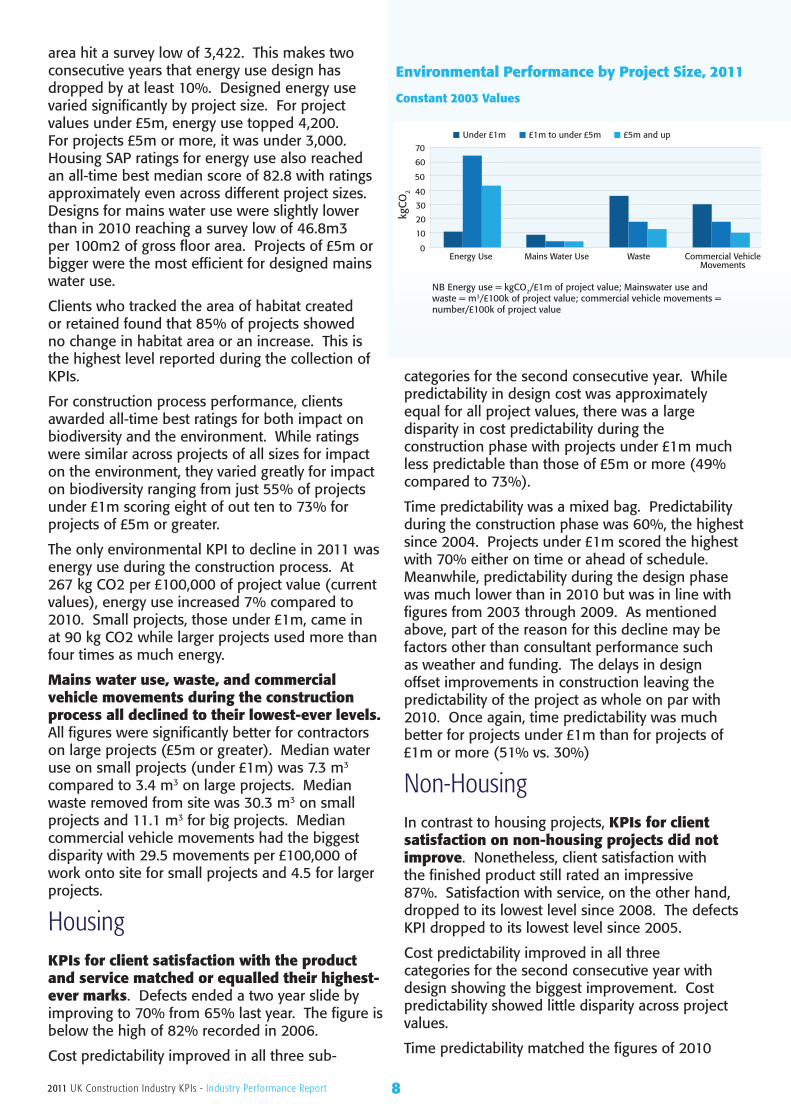
area hit a survey low of 3,422. This makes two consecutive years that energy use design has dropped by at least 10%. Designed energy use varied significantly by project size. For project values under £5m, energy use topped 4,200. For projects £5m or more, it was under 3,000. Housing SAP ratings for energy use also reached an all-time best median score of 82.8 with ratings approximately even across different project sizes. Designs for mains water use were slightly lower than in 2010 reaching a survey low of 46.8m3 per 100m2 of gross floor area. Projects of £5m or bigger were the most efficient for designed mains water use.
Clients who tracked the area of habitat created or retained found that 85% of projects showed no change in habitat area or an increase. This is the highest level reported during the collection of KPIs.
For construction process performance, clients awarded all-time best ratings for both impact on biodiversity and the environment. While ratings were similar across projects of all sizes for impact on the environment, they varied greatly for impact on biodiversity ranging from just 55% of projects under £1m scoring eight of out ten to 73% for projects of £5m or greater.
The only environmental KPI to decline in 2011 was energy use during the construction process. At 267 kg CO2 per £100,000 of project value (current values), energy use increased 7% compared to 2010. Small projects, those under £1m, came in at 90 kg CO2 while larger projects used more than four times as much energy.
Mains water use, waste, and commercial vehicle movements during the construction process all declined to their lowest-ever levels. All figures were significantly better for contractors on large projects (£5m or greater). Median water use on small projects (under £1m) was 7.3 m3
compared to 3.4 m3 on large projects. Median waste removed from site was 30.3 m3 on small projects and 11.1 m3 for big projects. Median commercial vehicle movements had the biggest disparity with 29.5 movements per £100,000 of work onto site for small projects and 4.5 for larger projects.
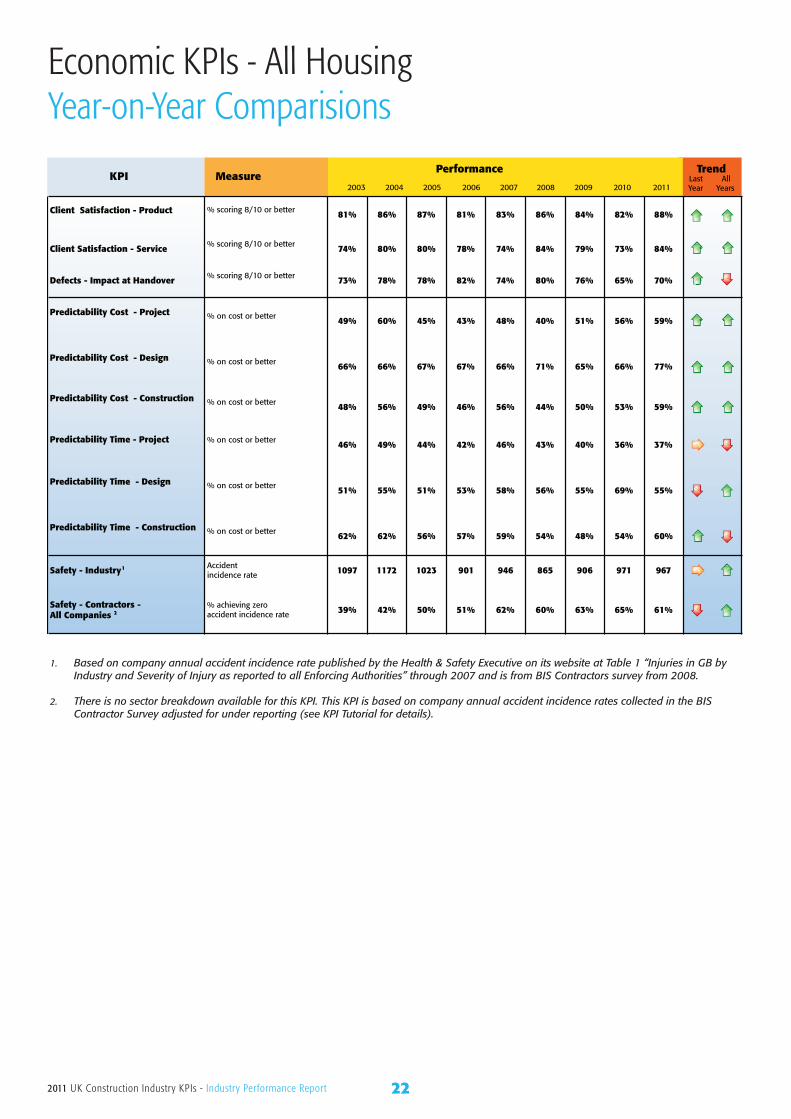
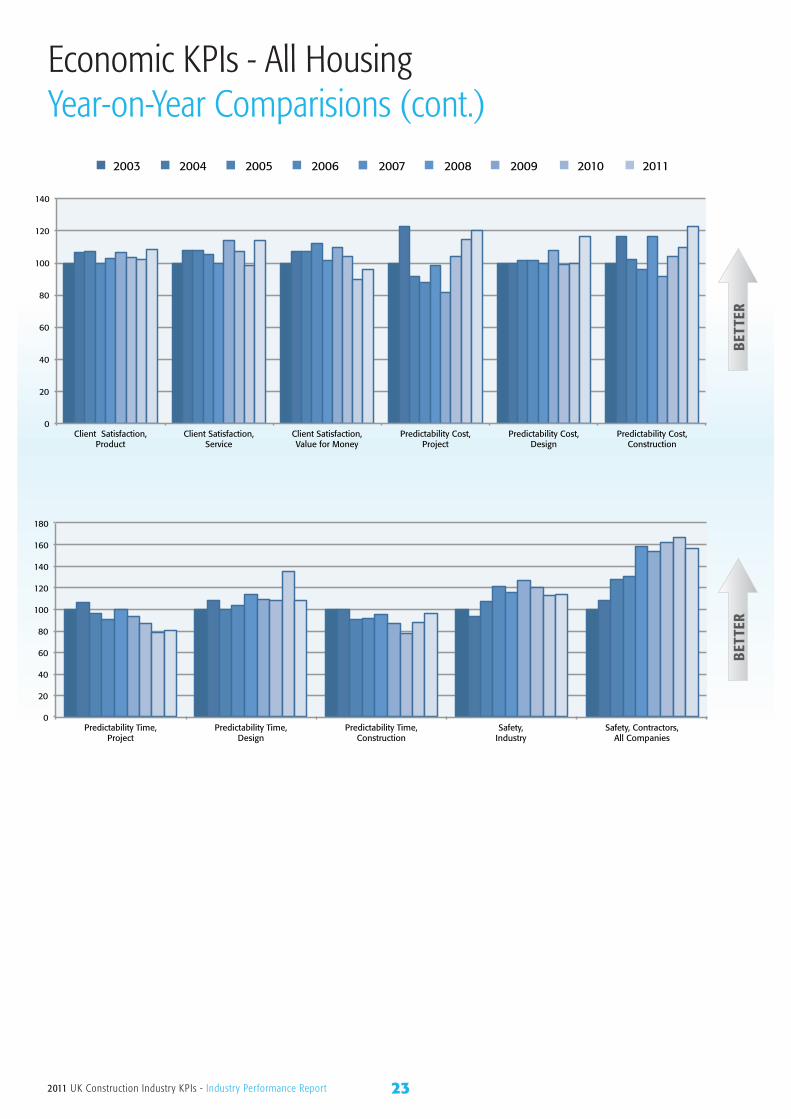
HousingKPIs for client satisfaction with the product and service matched or equalled their highest-ever marks. Defects ended a two year slide by improving to 70% from 65% last year. The figure is below the high of 82% recorded in 2006.
Cost predictability improved in all three sub-
categories for the second consecutive year. While predictability in design cost was approximately equal for all project values, there was a large disparity in cost predictability during the construction phase with projects under £1m much less predictable than those of £5m or more (49% compared to 73%).
Time predictability was a mixed bag. Predictability during the construction phase was 60%, the highest since 2004. Projects under £1m scored the highest with 70% either on time or ahead of schedule. Meanwhile, predictability during the design phase was much lower than in 2010 but was in line with figures from 2003 through 2009. As mentioned above, part of the reason for this decline may be factors other than consultant performance such as weather and funding. The delays in design offset improvements in construction leaving the predictability of the project as whole on par with 2010. Once again, time predictability was much better for projects under £1m than for projects of £1m or more (51% vs. 30%)
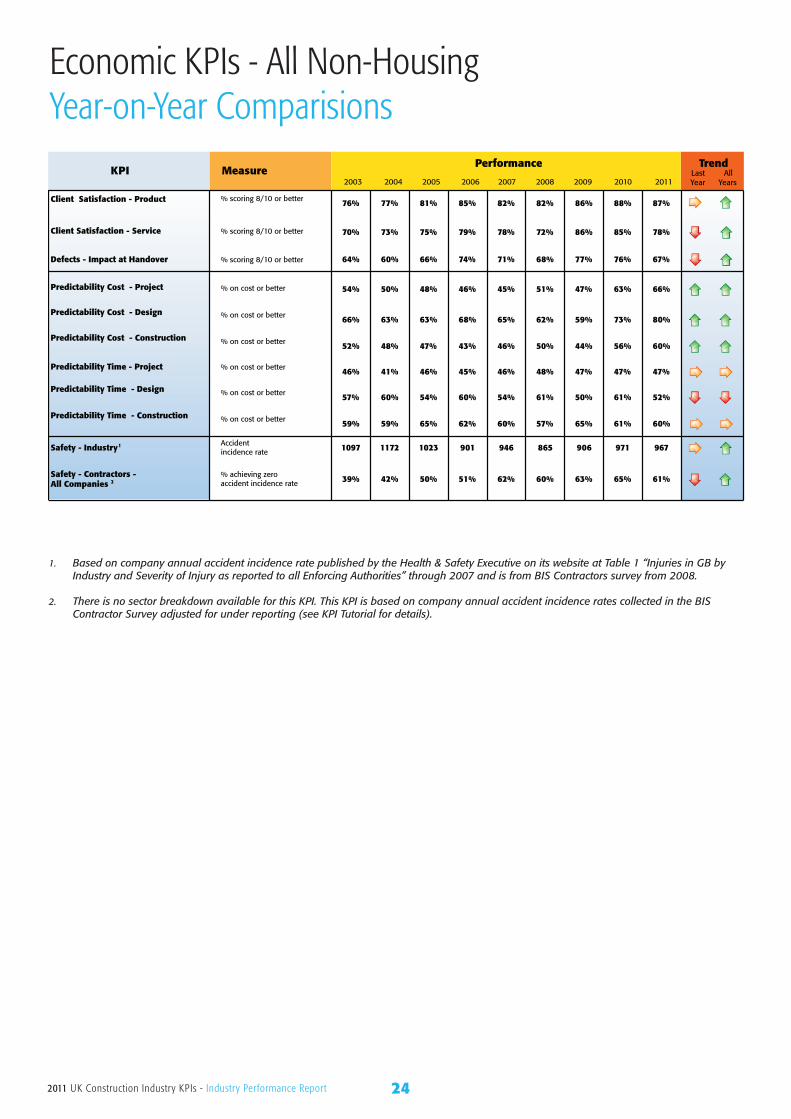
Non-HousingIn contrast to housing projects, KPIs for client satisfaction on non-housing projects did not improve. Nonetheless, client satisfaction with the finished product still rated an impressive 87%. Satisfaction with service, on the other hand, dropped to its lowest level since 2008. The defects KPI dropped to its lowest level since 2005.
Cost predictability improved in all three categories for the second consecutive year with design showing the biggest improvement. Cost predictability showed little disparity across project values.
Time predictability matched the figures of 2010
70
50
60
40
30
20
10
0Energy Use
Under £1m
Mains Water Use Waste Commercial Vehicle Movements
£1m to under £5m £5m and up
Environmental Performance by Project Size, 2011
Constant 2003 Values
NB Energy use = kgCO2/£1m of project value; Mainswater use and waste = m3/£100k of project value; commercial vehicle movements = number/£100k of project value
kgC
O2
92011 UK Construction Industry KPIs - Industry Performance Report
for both the project and construction phase, and showed very little variation amongst project sizes. In contrast, predictability during the design phase was lower than in 2010 (52% compared to 61%). Design time predictability was much better for projects under £1m than for projects of £1m or more (59% vs. 44%)
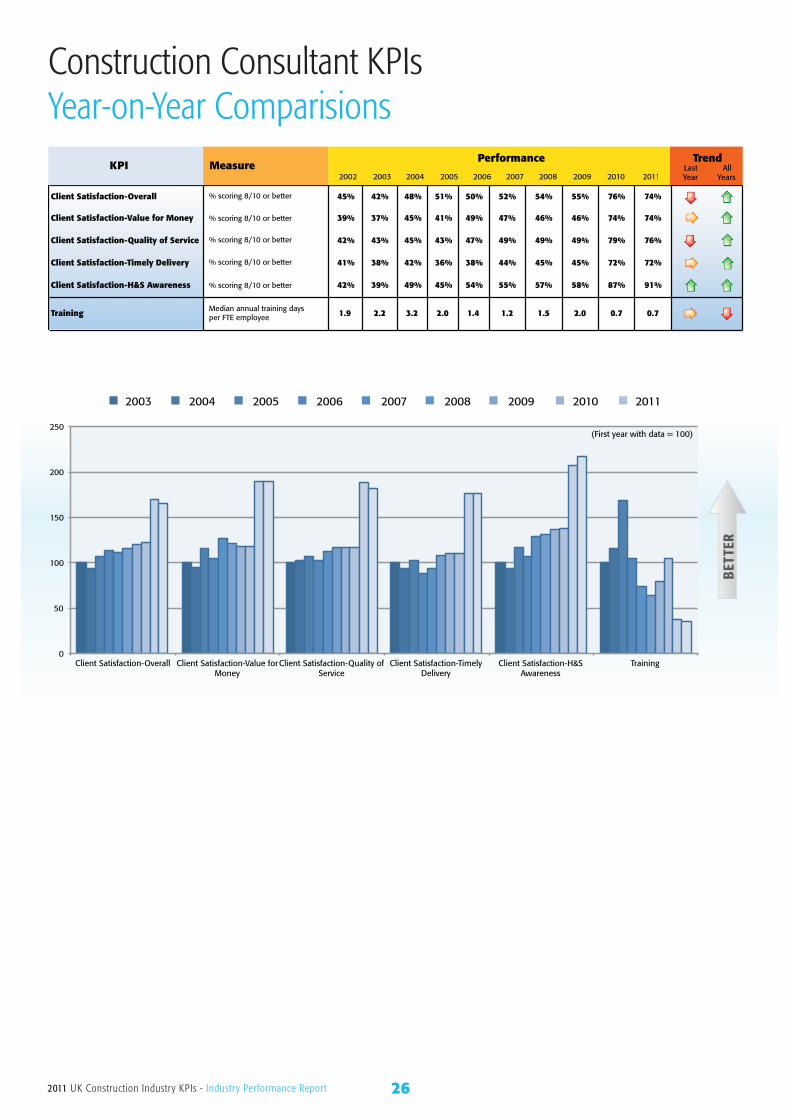
ConsultantsOverall, client satisfaction with consultants has improved since 2002 with 2010 and 2011 KPIs showing dramatic gains across the board compared to prior years. In 2011, overall client satisfaction was rated an eight or better of out of ten by 74% of respondents. Clients rated consultants highest on small projects—those with a value of under £1 million. Overall client satisfaction on small projects was 78% compared to 68% on large projects—projects of £5 million and up.
On the down side, median training days per employee were just 0.7, the same figure as the previous year and the lowest ever for the survey.
Smaller consultant companies were more likely than their larger counterparts to offer training. Companies who worked on projects of less than £1 million offered a median of one day of training per year while companies with larger projects offered 0.5 days of training per year.
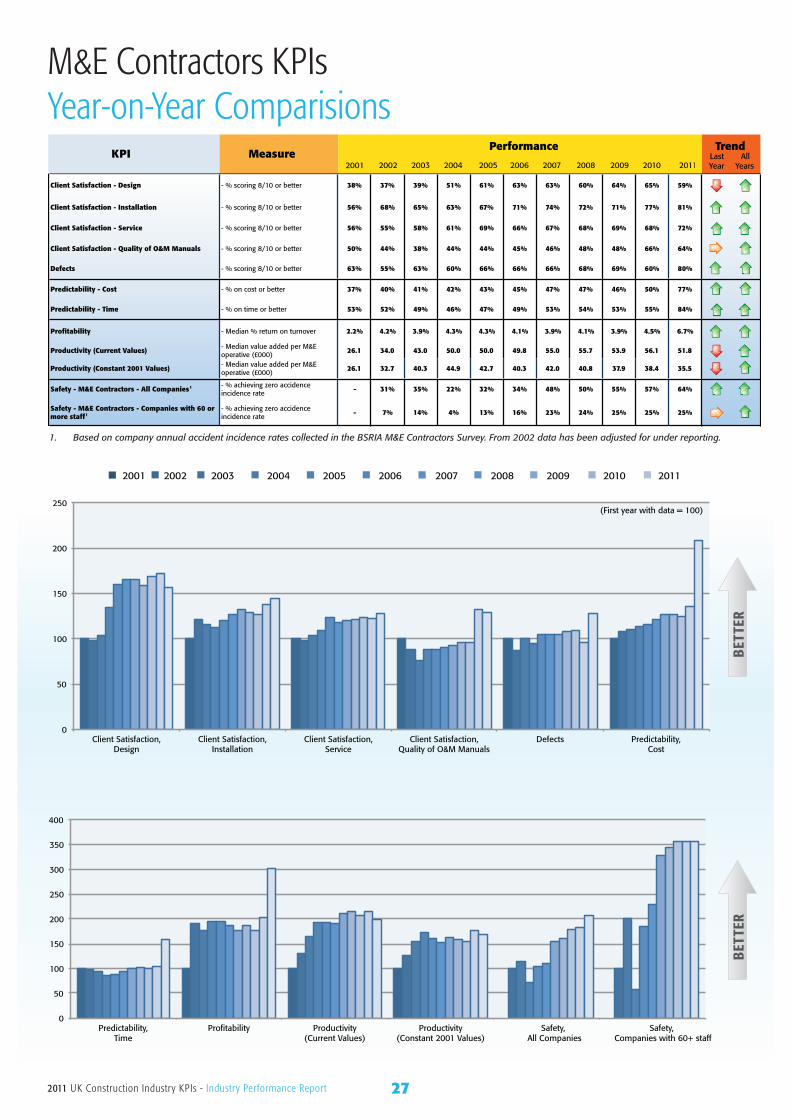
M&E Contractors
Client satisfaction in the M&E sector generally improved this year, continuing the overall positive trend since 2001. Client satisfaction with installation and service both reached all-time highs while client satisfaction with the quality of O&M manuals was flat. On the down side, client satisfaction with design, which had improved during the prior two years, declined 6% to 59%.
For the sixth year in a row, M&E Contractors’ safety performance showed an improvement, with 64% of all companies achieving zero reportable accidents (57% in 2010). For larger (60+ employees) companies, 25% achieved zero accidents, the same as the prior two years.
2011 saw extremely strong improvements in both cost predictability, which rose to 77% (50% in 2010), and time predictability which was 84% (55% in 2010). Defects also showed a strong improvement as clients scored 80% of projects as an eight out of ten or better compared to 60% the year before.
Median profitability increased to 6.7% (from 4.5% last year) while productivity declined from £56k value-added per employee to £52k. Both figures should be treated with caution as unprofitable firms may not have survived to report their results thus inflating the medians.

102011 UK Construction Industry KPIs - Industry Performance Report
Economic KPIs – All ConstructionYear-on-Year Comparisons
KPI Measure1999 2000 2001 2002 2003 2004 2005 2006 2007 2008 2009 2010 2011
Last Year
All Years
Client Satisfaction - Product % scoring 8/10 or better 72% 73% 72% 73% 78% 80% 83% 84% 82% 83% 86% 87% 87%
Client Satisfaction - Service % scoring 8/10 or better 58% 63% 63% 65% 71% 74% 77% 79% 75% 77% 84% 82% 80%
Client Satisfaction - Value for Money 1 % scoring 8/10 or better - - 67% 69% 73% 74% 79% 80% 75% 75% 82% 77% 81%
Contractor Satisfaction - Performance - Overall 1
% scoring 8/10 or better - - - - 64% 65% 63% 62% 62% 62% 64% 69% 69%
Contractor Satisfaction - Provision of Information - Overall 1
% scoring 8/10 or better - - - - 57% 59% 58% 56% 56% 56% 59% 63% 64%
Contractor Satisfaction - Payment - Overall 1
% scoring 8/10 or better - - - - 67% 66% 65% 65% 63% 63% 67% 71% 77%
Defects - Impact at Handover 1 % scoring 8/10 or better - 65% 53% 58% 68% 68% 72% 77% 73% 73% 77% 75% 68%
Predictability Cost - Project 1 % on cost or better - 50% 46% 48% 52% 50% 48% 45% 46% 49% 48% 52% 63%
Predictability Cost - Design % on cost or better 65% 64% 63% 63% 65% 62% 63% 66% 64% 65% 61% 67% 79%
Predictability Cost - Construction % on cost or better 37% 45% 48% 50% 52% 49% 48% 44% 49% 48% 46% 47% 59%
Predictability Time - Project 1 % on cost or better - 28% 36% 42% 44% 44% 46% 44% 58% 45% 45% 43% 45%
Predictability Time - Design % on cost or better 27% 37% 41% 46% 53% 55% 52% 57% 58% 58% 53% 69% 51%
Predictability Time - Construction % on cost or better 34% 62% 59% 61% 59% 60% 62% 60% 65% 58% 59% 57% 60%
Profitability 2 Median % profit before interest & tax - 4.4% 5.1% 5.2% 5.4% 7.0% 8.1% 7.9% 8.2% 9.6% 9.9% 7.7% 5.0%
Productivity (VAPH Current Values) 2
Median value added/FTE employee (£000) - 27 28 28 31.1 32.6 34.2 38.2 42 45.5 46.2 49.5 58.5
Productivity (VAPH Constant 2000 Values) 2 3
Median value added/FTE employee (£000) - 27.0 26.8 26.1 27.9 27.7 27.3 28.7 29.7 30.7 29.5 31.3 37.0
Safety - Industry Accident incidence rate 1354 1271 1318 1217 1097 1172 1023 901 946 865 906 971 967
Safety - Contractors - All Companies 4
% achieving zero accident incidence rate - - - 31% 39% 42% 50% 51% 62% 60% 63% 65% 61%
Performance Trend
1. Data not available before the first year shown.
2. The measure for this KPI was changed in 2000; thus 1999 data was not reported. In order to regularise the volatile mix of financial data by company size from year to year, in 2006 a standard method of weighting by number of employees was adopted in line with other international financial KPIs. This method was applied retrospectively and, where applicable, results were revised.
3. Current values are deflated by the “All Construction Output Price Index” for the first years KPI to arrive at constant values .
4. Data for this KPI was not available before 2002. This KPI is based on company annual accident incidence rates collected in the BIS Contractor Survey adjusted for under reporting.
112011 UK Construction Industry KPIs - Industry Performance Report
0
20
40
60
80
100
120
140
160
Client Satisfaction, Product
Client Satisfaction, Service
Client Satisfaction, Value for Money
Contractor Satisfaction -
Performance - Overall
Contractor Satisfaction, Provision of Information
Contractor Satisfaction,
Payment
Defects Predictability Cost, Project
1999 2000 2001 2002 2003 2004 2005 2006 2007 2008 2009 2010 2011
(First year with data = 100)
0
50
100
150
200
250
300
Predictability Cost, Design
Predictability Cost, Construction
Predictability Time, Project
Predictability Time, Design
Predictability Time, Construction
0
50
100
150
200
250
Profitability Productivity (VAPH Current Values)
Productivity (VAPH Constant 2000 Values)
Safety, Industry
Safety, Contractors, All Companies
Economic KPIs – All ConstructionYear-on-Year Comparisons (cont.)
BET
TER
BET
TER
BET
TER
122011 UK Construction Industry KPIs - Industry Performance Report
Economic KPIs – All ConstructionIndividual KPI Trends
BET
TER
72% 73% 72% 73% 78% 80% 83% 84% 82% 83% 86% 87% 87%
0% 10% 20% 30% 40% 50% 60% 70% 80% 90%
100%
1999 2000 2001 2002 2003 2004 2005 2006 2007 2008 2009 2010 2011
The annual KPI surveys ask clients to rate how satisfied they were with the completed facility on a scale from 1-10.
After levelling off between 2005 and 2008, the KPI reached an all-time high of 87% of projects scoring 8 out of 10 or better.
Client Satisfaction - Product
Client Satisfaction - Service
Client Satisfaction - Value for MoneyB
ETTE
R
58% 63% 63% 65%
71% 74% 77% 79% 75% 77% 84% 82% 80%
0% 10% 20% 30% 40% 50% 60% 70% 80% 90%
1999 2000 2001 2002 2003 2004 2005 2006 2007 2008 2009 2010 2011
The annual KPI surveys ask clients to rate how satisfied they were with the service provided by the project team on a scale from 1-10.
After an all-time high of 84% of projects scoring 8 out of 10 or better in 2009, the KPI has declined by 2% in each of the last two years.
The annual KPI surveys ask clients to rate how satisfied they were with the value for money provided on the project on a scale from 1-10.
In 2011, 81% of projects scored 8 out of 10 or better which is just short of the best-ever mark achieved in 2009.
BET
TER
67% 69% 73% 74% 79% 80%
75% 75% 82%
77% 81%
0% 10% 20% 30% 40% 50% 60% 70% 80% 90%
2001 2002 2003 2004 2005 2006 2007 2008 2009 2010 2011
132011 UK Construction Industry KPIs - Industry Performance Report
BET
TER64%
65%
63% 62% 62% 62%
64%
69% 69%
58%
60%
62%
64%
66%
68%
70%
2003 2004 2005 2006 2007 2008 2009 2010 2011
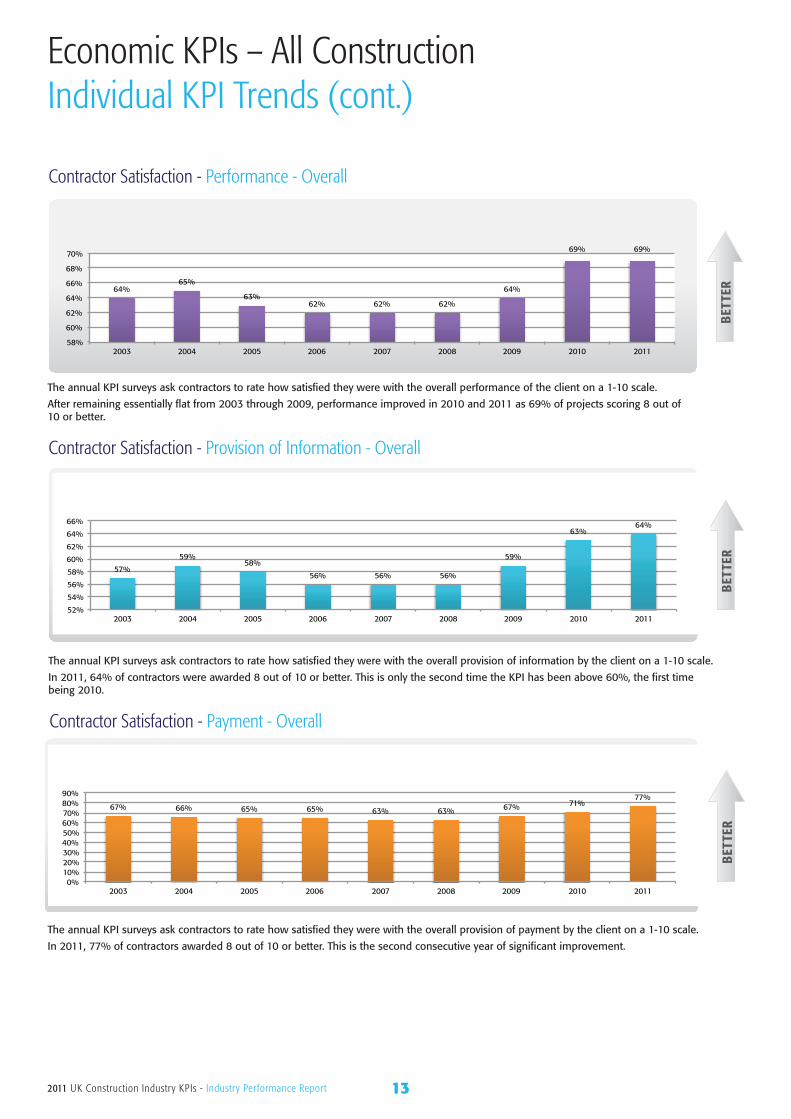
The annual KPI surveys ask contractors to rate how satisfied they were with the overall performance of the client on a 1-10 scale.
After remaining essentially flat from 2003 through 2009, performance improved in 2010 and 2011 as 69% of projects scoring 8 out of 10 or better.
Contractor Satisfaction - Performance - Overall
Contractor Satisfaction - Provision of Information - Overall
Contractor Satisfaction - Payment - OverallB
ETTE
R
57%
59% 58%
56% 56% 56%
59%
63% 64%
52%
54%
56%
58%
60%
62%
64%
66%
2003 2004 2005 2006 2007 2008 2009 2010 2011
The annual KPI surveys ask contractors to rate how satisfied they were with the overall provision of information by the client on a 1-10 scale.
In 2011, 64% of contractors were awarded 8 out of 10 or better. This is only the second time the KPI has been above 60%, the first time being 2010.
The annual KPI surveys ask contractors to rate how satisfied they were with the overall provision of payment by the client on a 1-10 scale.
In 2011, 77% of contractors awarded 8 out of 10 or better. This is the second consecutive year of significant improvement.
BET
TER
67% 66% 65% 65% 63% 63% 67% 71% 77%
0% 10% 20% 30% 40% 50% 60% 70% 80% 90%
2003 2004 2005 2006 2007 2008 2009 2010 2011
Economic KPIs – All ConstructionIndividual KPI Trends (cont.)
142011 UK Construction Industry KPIs - Industry Performance Report
Economic KPIs – All ConstructionIndividual KPI Trends (cont.)
BET
TER
65%
53% 58%
68% 68% 72% 77% 73% 73% 77% 75%
68%
0% 10% 20% 30% 40% 50% 60% 70% 80% 90%
2000 2001 2002 2003 2004 2005 2006 2007 2008 2009 2010 2011
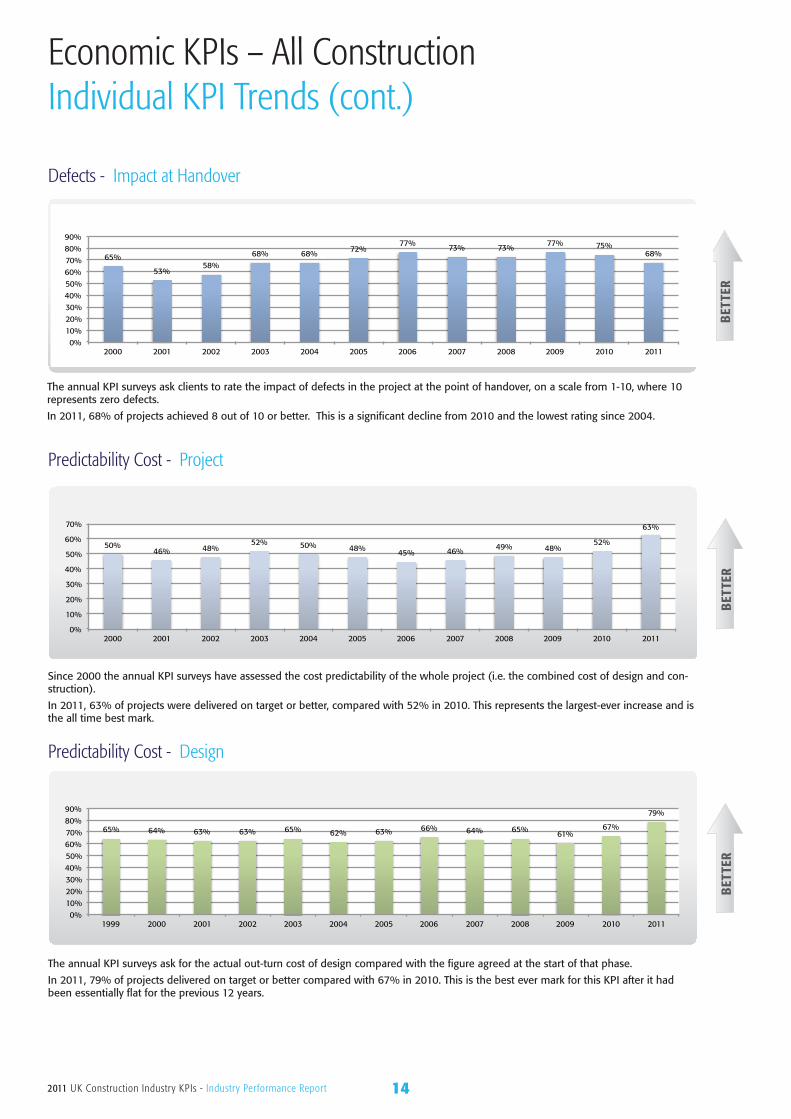
The annual KPI surveys ask clients to rate the impact of defects in the project at the point of handover, on a scale from 1-10, where 10 represents zero defects.
In 2011, 68% of projects achieved 8 out of 10 or better. This is a significant decline from 2010 and the lowest rating since 2004.
Defects - Impact at Handover
Predictability Cost - Design
Predictability Cost - Project
BET
TER
65% 64% 63% 63% 65% 62% 63% 66% 64% 65% 61% 67%
79%
0% 10% 20% 30% 40% 50% 60% 70% 80% 90%
1999 2000 2001 2002 2003 2004 2005 2006 2007 2008 2009 2010 2011
The annual KPI surveys ask for the actual out-turn cost of design compared with the figure agreed at the start of that phase.
In 2011, 79% of projects delivered on target or better compared with 67% in 2010. This is the best ever mark for this KPI after it had been essentially flat for the previous 12 years.
Since 2000 the annual KPI surveys have assessed the cost predictability of the whole project (i.e. the combined cost of design and con-struction).
In 2011, 63% of projects were delivered on target or better, compared with 52% in 2010. This represents the largest-ever increase and is the all time best mark.
BET
TER
50% 46% 48%
52% 50% 48% 45% 46% 49% 48% 52%
63%
0%
10%
20%
30%
40%
50%
60%
70%
2000 2001 2002 2003 2004 2005 2006 2007 2008 2009 2010 2011
152011 UK Construction Industry KPIs - Industry Performance Report
BET
TER
28%
36% 42% 44% 44% 46% 44%
58%
45% 45% 43% 45%
0%
10%
20%
30%
40%
50%
60%
70%
2000 2001 2002 2003 2004 2005 2006 2007 2008 2009 2010 2011
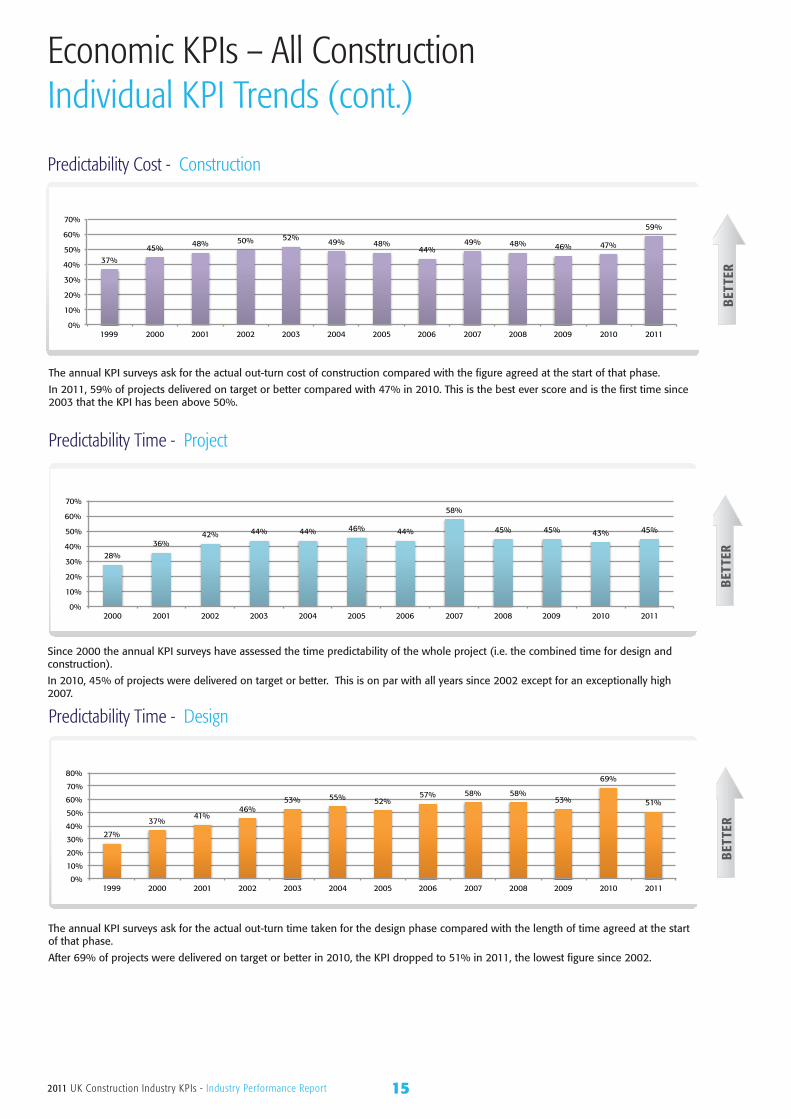
Since 2000 the annual KPI surveys have assessed the time predictability of the whole project (i.e. the combined time for design and construction).
In 2010, 45% of projects were delivered on target or better. This is on par with all years since 2002 except for an exceptionally high 2007.
Predictability Time - Project
Predictability Time - DesignB
ETTE
R
27%
37% 41%
46% 53% 55% 52%
57% 58% 58% 53%
69%
51%
0%
10%
20%
30%
40%
50%
60%
70%
80%
1999 2000 2001 2002 2003 2004 2005 2006 2007 2008 2009 2010 2011
The annual KPI surveys ask for the actual out-turn time taken for the design phase compared with the length of time agreed at the start of that phase.
After 69% of projects were delivered on target or better in 2010, the KPI dropped to 51% in 2011, the lowest figure since 2002.
Economic KPIs – All ConstructionIndividual KPI Trends (cont.)
Predictability Cost - Construction
The annual KPI surveys ask for the actual out-turn cost of construction compared with the figure agreed at the start of that phase.
In 2011, 59% of projects delivered on target or better compared with 47% in 2010. This is the best ever score and is the first time since 2003 that the KPI has been above 50%.
BET
TER
37%
45% 48% 50% 52% 49% 48% 44%
49% 48% 46% 47%
59%
0%
10%
20%
30%
40%
50%
60%
70%
1999 2000 2001 2002 2003 2004 2005 2006 2007 2008 2009 2010 2011
162011 UK Construction Industry KPIs - Industry Performance Report
Economic KPIs – All ConstructionIndividual KPI Trends (Cont.)Predictability Time - Construction
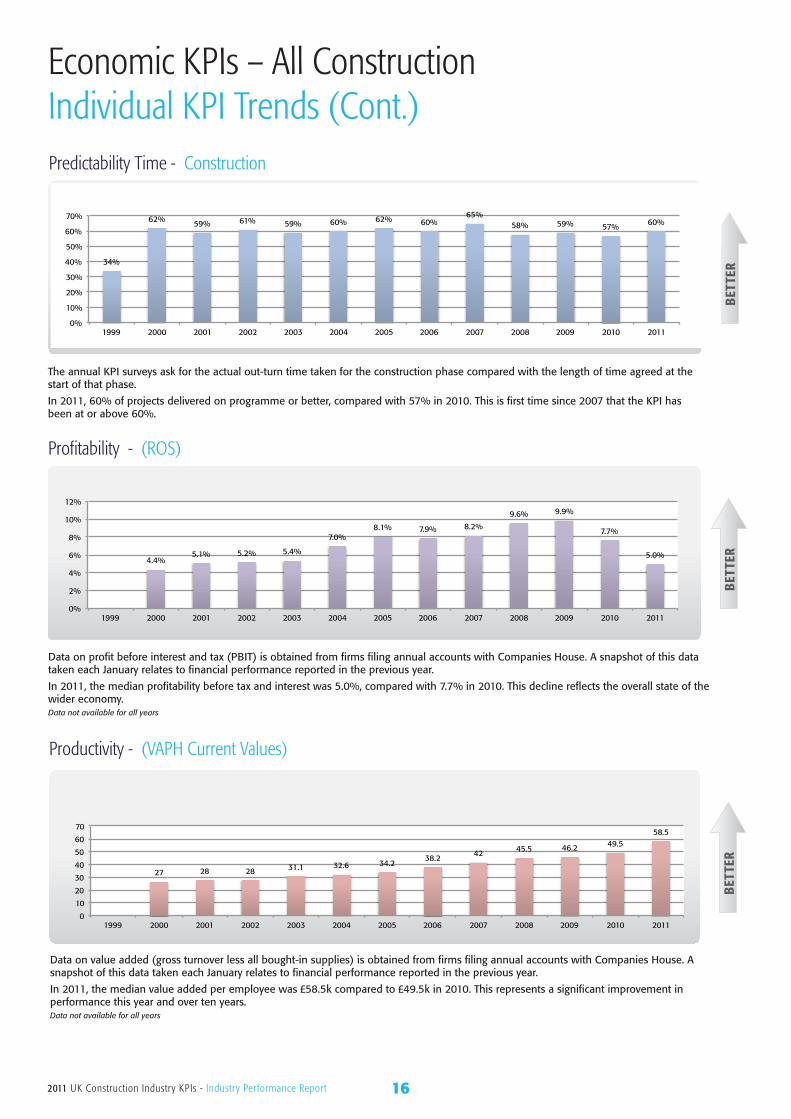
The annual KPI surveys ask for the actual out-turn time taken for the construction phase compared with the length of time agreed at the start of that phase.
In 2011, 60% of projects delivered on programme or better, compared with 57% in 2010. This is first time since 2007 that the KPI has been at or above 60%.
BET
TER34%
62% 59% 61% 59% 60% 62% 60% 65%
58% 59% 57% 60%
0%
10%
20%
30%
40%
50%
60%
70%
1999 2000 2001 2002 2003 2004 2005 2006 2007 2008 2009 2010 2011
BET
TER
27 28 28 31.1 32.6 34.2 38.2
42 45.5 46.2 49.5 58.5
0
10
20
30
40
50
60
70
1999 2000 2001 2002 2003 2004 2005 2006 2007 2008 2009 2010 2011
Data on value added (gross turnover less all bought-in supplies) is obtained from firms filing annual accounts with Companies House. A snapshot of this data taken each January relates to financial performance reported in the previous year.
In 2011, the median value added per employee was £58.5k compared to £49.5k in 2010. This represents a significant improvement in performance this year and over ten years.Data not available for all years
Productivity - (VAPH Current Values)
Profitability - (ROS)
Data on profit before interest and tax (PBIT) is obtained from firms filing annual accounts with Companies House. A snapshot of this data taken each January relates to financial performance reported in the previous year.
In 2011, the median profitability before tax and interest was 5.0%, compared with 7.7% in 2010. This decline reflects the overall state of the wider economy. Data not available for all years
BET
TER
4.4% 5.1% 5.2% 5.4%
7.0% 8.1% 7.9% 8.2%
9.6% 9.9%
7.7%
5.0%
0%
2%
4%
6%
8%
10%
12%
1999 2000 2001 2002 2003 2004 2005 2006 2007 2008 2009 2010 2011
172011 UK Construction Industry KPIs - Industry Performance Report
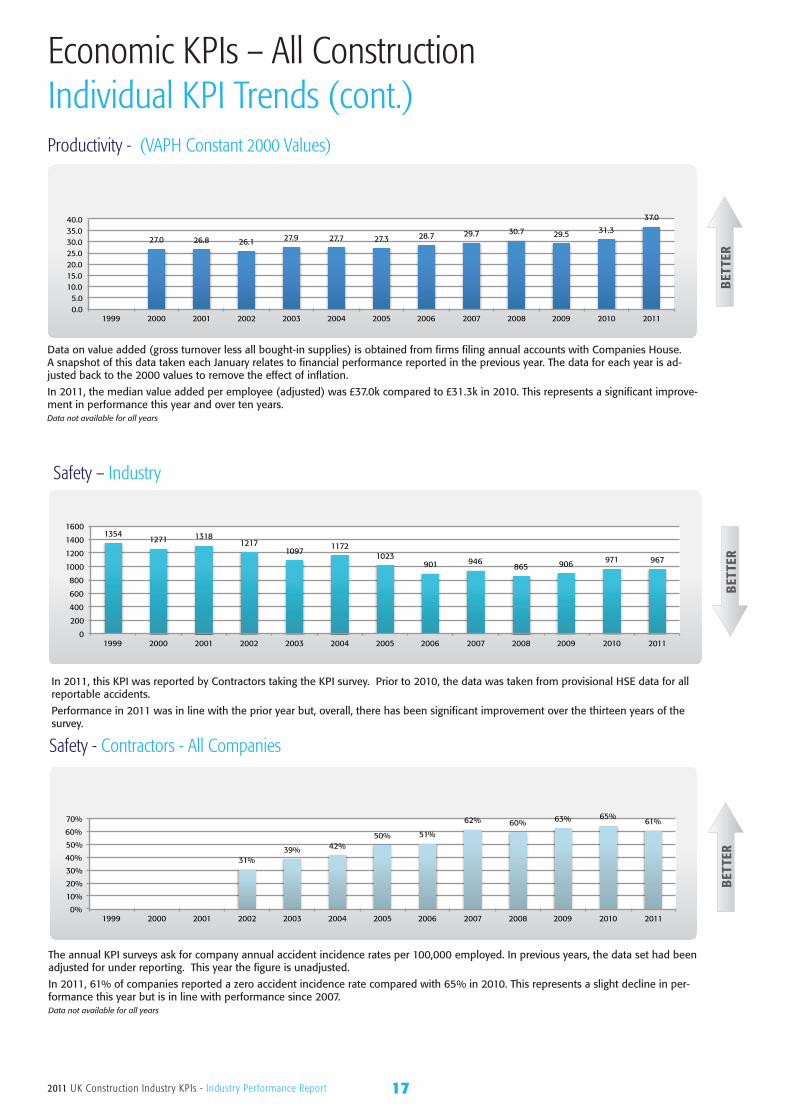
Productivity - (VAPH Constant 2000 Values)
BET
TER
27.0 26.8 26.1 27.9 27.7 27.3 28.7 29.7 30.7 29.5 31.3
37.0
0.0 5.0
10.0 15.0 20.0 25.0 30.0 35.0 40.0
1999 2000 2001 2002 2003 2004 2005 2006 2007 2008 2009 2010 2011
Data on value added (gross turnover less all bought-in supplies) is obtained from firms filing annual accounts with Companies House. A snapshot of this data taken each January relates to financial performance reported in the previous year. The data for each year is ad-justed back to the 2000 values to remove the effect of inflation.
In 2011, the median value added per employee (adjusted) was £37.0k compared to £31.3k in 2010. This represents a significant improve-ment in performance this year and over ten years. Data not available for all years
Economic KPIs – All ConstructionIndividual KPI Trends (cont.)
BET
TER
31% 39% 42%
50% 51%
62% 60% 63% 65% 61%
0%
10%
20%
30%
40%
50%
60%
70%
1999 2000 2001 2002 2003 2004 2005 2006 2007 2008 2009 2010 2011
The annual KPI surveys ask for company annual accident incidence rates per 100,000 employed. In previous years, the data set had been adjusted for under reporting. This year the figure is unadjusted.
In 2011, 61% of companies reported a zero accident incidence rate compared with 65% in 2010. This represents a slight decline in per-formance this year but is in line with performance since 2007. Data not available for all years
Safety - Contractors - All Companies
Safety – Industry
In 2011, this KPI was reported by Contractors taking the KPI survey. Prior to 2010, the data was taken from provisional HSE data for all reportable accidents.
Performance in 2011 was in line with the prior year but, overall, there has been significant improvement over the thirteen years of the survey.
BET
TER
1354 1271 1318
1217 1097
1172 1023
901 946 865 906 971 967
0
200
400
600
800
1000
1200
1400
1600
1999 2000 2001 2002 2003 2004 2005 2006 2007 2008 2009 2010 2011
182011 UK Construction Industry KPIs - Industry Performance Report
Respect for People KPIs – All ConstructionYear-on-Year Comparisons
KPI
2002 2003 2004 2005 2006 2007 2008 2009 2010 2011Last Year
All Years
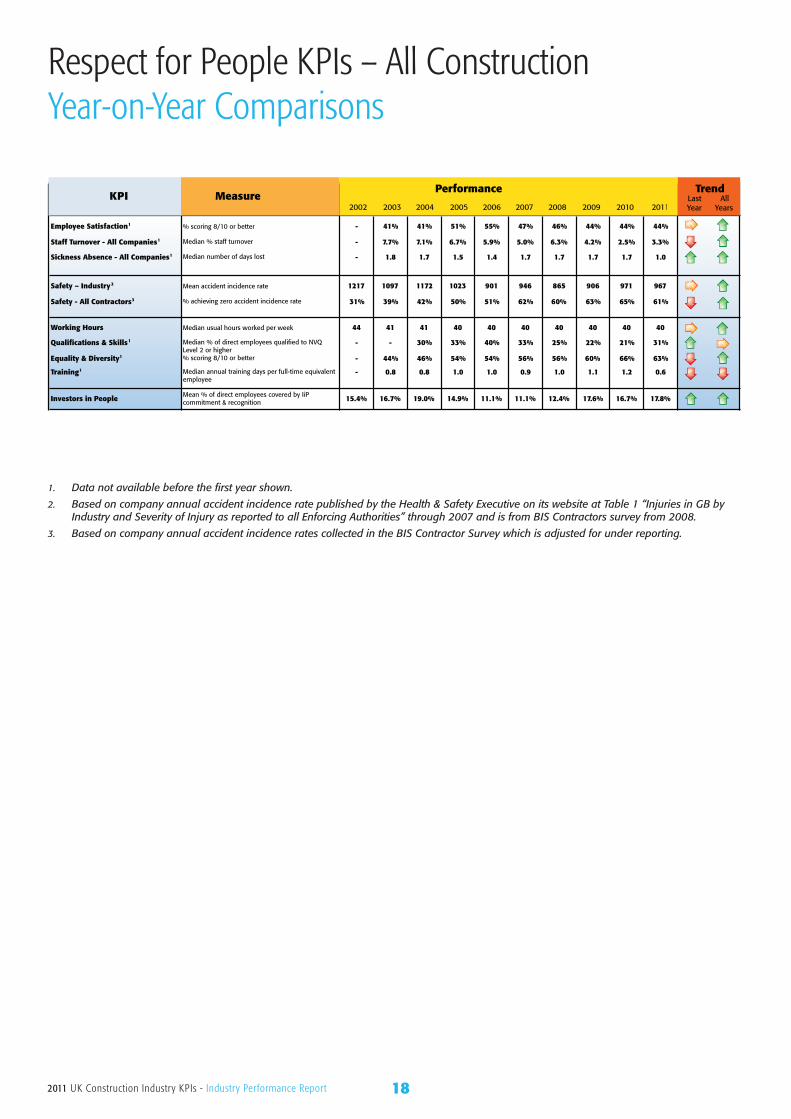
Employee Satisfaction1 % scoring 8/10 or better - 41% 41% 51% 55% 47% 46% 44% 44% 44%
Staff Turnover - All Companies1 Median % staff turnover - 7.7% 7.1% 6.7% 5.9% 5.0% 6.3% 4.2% 2.5% 3.3%
Sickness Absence - All Companies1 Median number of days lost - 1.8 1.7 1.5 1.4 1.7 1.7 1.7 1.7 1.0
Safety – Industry2 Mean accident incidence rate 1217 1097 1172 1023 901 946 865 906 971 967
Safety - All Contractors3 % achieving zero accident incidence rate 31% 39% 42% 50% 51% 62% 60% 63% 65% 61%
Working Hours Median usual hours worked per week 44 41 41 40 40 40 40 40 40 40
Qualifications & Skills1 Median % of direct employees qualified to NVQ Level 2 or higher
- - 30% 33% 40% 33% 25% 22% 21% 31%
Equality & Diversity1 % scoring 8/10 or better - 44% 46% 54% 54% 56% 56% 60% 66% 63%
Training1 Median annual training days per full-time equivalent employee
- 0.8 0.8 1.0 1.0 0.9 1.0 1.1 1.2 0.6
Investors in People Mean % of direct employees covered by IiP commitment & recognition 15.4% 16.7% 19.0% 14.9% 11.1% 11.1% 12.4% 17.6% 16.7% 17.8%
KPI Measure2002 2003 2004 2005 2006 2007 2008 2009 2010 2011
Last Year
All Years
Performance Trend
1. Data not available before the first year shown.
2. Based on company annual accident incidence rate published by the Health & Safety Executive on its website at Table 1 “Injuries in GB by Industry and Severity of Injury as reported to all Enforcing Authorities” through 2007 and is from BIS Contractors survey from 2008.
3. Based on company annual accident incidence rates collected in the BIS Contractor Survey which is adjusted for under reporting.
192011 UK Construction Industry KPIs - Industry Performance Report
0
20
40
60
80
100
120
140
160
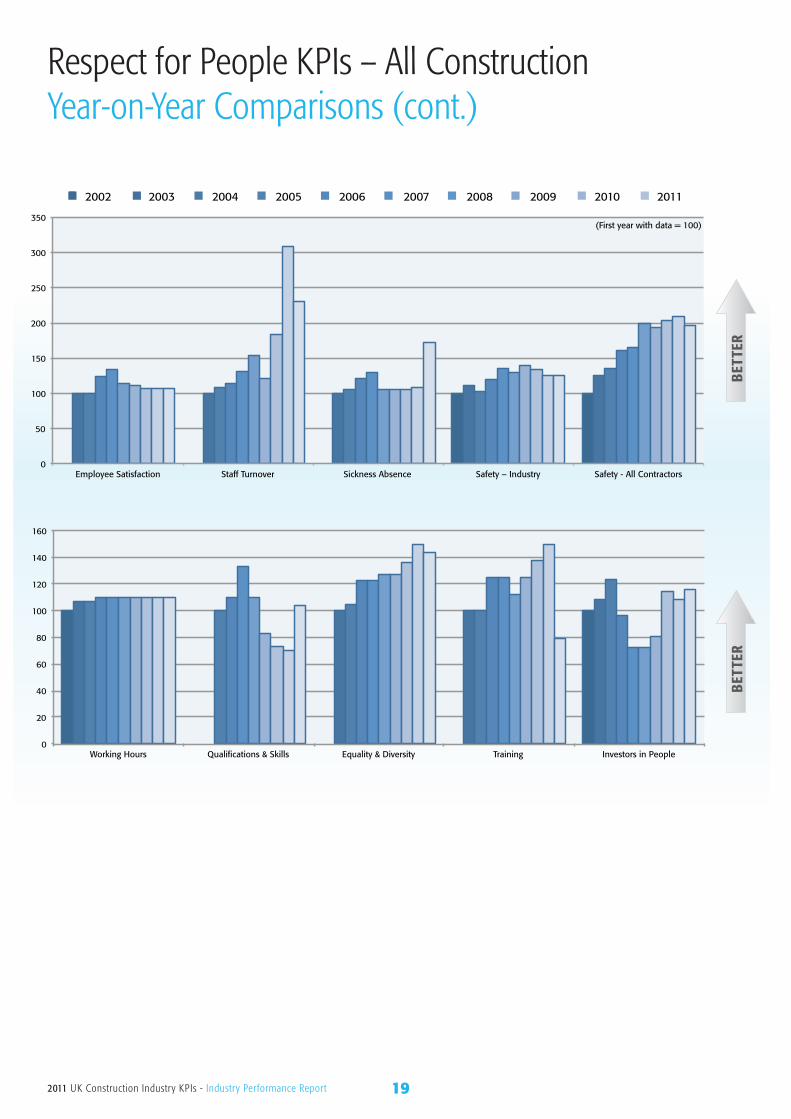
Working Hours Qualifications & Skills Equality & Diversity Training Investors in People
2002 2003 2004 2005 2006 2007 2008 2009 2010 2011
BET
TER
BET
TER
0
50
100
150
200
250
300
350
Employee Satisfaction Staff Turnover Sickness Absence Safety – Industry Safety - All Contractors
(First year with data = 100)
Respect for People KPIs – All ConstructionYear-on-Year Comparisons (cont.)
202011 UK Construction Industry KPIs - Industry Performance Report
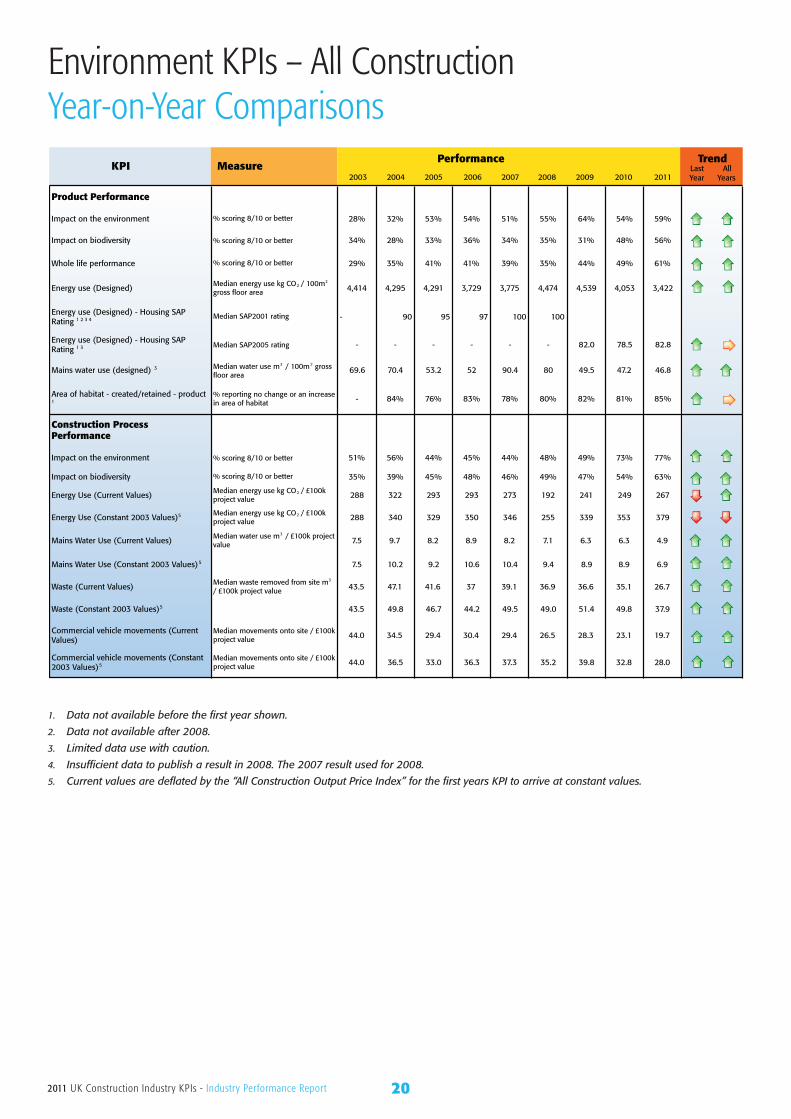
Environment KPIs – All ConstructionYear-on-Year Comparisons
KPI Measure2003 2004 2005 2006 2007 2008 2009 2010
Last Year
All Years
Performance Trend
2011
Product Performance
Impact on the environment % scoring 8/10 or better 28% 32% 53% 54% 51% 55% 64% 54% 59%
Impact on biodiversity % scoring 8/10 or better 34% 28% 33% 36% 34% 35% 31% 48% 56%
Whole life performance % scoring 8/10 or better 29% 35% 41% 41% 39% 35% 44% 49% 61%
Energy use (Designed) Median energy use kg CO2 / 100m2
gross floor area 4,414 4,295 4,291 3,729 3,775 4,474 4,539 4,053 3,422
Energy use (Designed) - Housing SAP Rating 1 2 3 4 Median SAP2001 rating - 90 95 97 100 100
Energy use (Designed) - Housing SAP Rating 1 3 Median SAP2005 rating - - - - - - 82.0 78.5 82.8
Mains water use (designed) 3 Median water use m3 / 100m2 gross floor area
69.6 70.4 53.2 52 90.4 80 49.5 47.2 46.8
Area of habitat - created/retained - product 1
% reporting no change or an increase in area of habitat - 84% 76% 83% 78% 80% 82% 81% 85%
Construction Process Performance
Impact on the environment % scoring 8/10 or better 51% 56% 44% 45% 44% 48% 49% 73% 77%
Impact on biodiversity % scoring 8/10 or better 35% 39% 45% 48% 46% 49% 47% 54% 63%
Energy Use (Current Values) Median energy use kg CO2 / £100k
project value 288 322 293 293 273 192 241 249 267
Energy Use (Constant 2003 Values)5 Median energy use kg CO2 / £100k
project value 288 340 329 350 346 255 339 353 379
Mains Water Use (Current Values) Median water use m3 / £100k project value 7.5 9.7 8.2 8.9 8.2 7.1 6.3 6.3 4.9
Mains Water Use (Constant 2003 Values)5 7.5 10.2 9.2 10.6 10.4 9.4 8.9 8.9 6.9
Waste (Current Values) Median waste removed from site m3
/ £100k project value 43.5 47.1 41.6 37 39.1 36.9 36.6 35.1 26.7
Waste (Constant 2003 Values)5 43.5 49.8 46.7 44.2 49.5 49.0 51.4 49.8 37.9
Commercial vehicle movements (Current Values)
Median movements onto site / £100k project value 44.0 34.5 29.4 30.4 29.4 26.5 28.3 23.1 19.7
Commercial vehicle movements (Constant 2003 Values)5
Median movements onto site / £100k project value 44.0 36.5 33.0 36.3 37.3 35.2 39.8 32.8 28.0
1. Data not available before the first year shown.
2. Data not available after 2008.
3. Limited data use with caution.
4. Insufficient data to publish a result in 2008. The 2007 result used for 2008.
5. Current values are deflated by the “All Construction Output Price Index” for the first years KPI to arrive at constant values.
212011 UK Construction Industry KPIs - Industry Performance Report
2003 2004 2005 2006 2007 2008 2009 2010 2011
BET
TER
BET
TER
BET
TER
0
50
100
150
200
250
Impact on the environment
Impact on biodiversity
Whole life performance
Energy use (Designed)
Energy use (Designed),
Housing SAP Rating
Energy use (Designed),
Housing SAP Rating
Mains water use (designed), product2
Area of habitat - created/retained -
product
(First year with data = 100)
0
20
40
60
80
100
120
140
160
180
200
Impact on the environment Impact on biodiversity Energy Use (Current Values)
Energy Use (Constant 2003 Values)
Mains Water Use
0
50
100
150
200
250
Mains Water Use (Constant 2003 Values)
Waste (Current Values)
Waste (Constant 2003 Values)
Commercial vehicle movements (Current Values)
Commercial vehicle movements (Constant 2003 Values)
Environment KPIs – All ConstructionYear-on-Year Comparisons (cont.)
222011 UK Construction Industry KPIs - Industry Performance Report
Economic KPIs - All HousingYear-on-Year Comparisions
KPI Measure2003 2004 2005 2006 2007 2008 2009 2010
Last Year
All Years
Performance Trend
2011
Client Satisfaction - Product % scoring 8/10 or better 81% 86% 87% 81% 83% 86% 84% 82% 88%
Client Satisfaction - Service % scoring 8/10 or better 74% 80% 80% 78% 74% 84% 79% 73% 84%
Defects - Impact at Handover % scoring 8/10 or better 73% 78% 78% 82% 74% 80% 76% 65% 70%
Predictability Cost - Project % on cost or better 49% 60% 45% 43% 48% 40% 51% 56% 59%
Predictability Cost - Design % on cost or better 66% 66% 67% 67% 66% 71% 65% 66% 77%
Predictability Cost - Construction % on cost or better 48% 56% 49% 46% 56% 44% 50% 53% 59%
Predictability Time - Project % on cost or better 46% 49% 44% 42% 46% 43% 40% 36% 37%
Predictability Time - Design % on cost or better 51% 55% 51% 53% 58% 56% 55% 69% 55%
Predictability Time - Construction % on cost or better 62% 62% 56% 57% 59% 54% 48% 54% 60%
Safety - Industry1 Accident incidence rate 1097 1172 1023 901 946 865 906 971 967
Safety - Contractors - All Companies 2
% achieving zero accident incidence rate 39% 42% 50% 51% 62% 60% 63% 65% 61%
1. Based on company annual accident incidence rate published by the Health & Safety Executive on its website at Table 1 “Injuries in GB by Industry and Severity of Injury as reported to all Enforcing Authorities” through 2007 and is from BIS Contractors survey from 2008.
2. There is no sector breakdown available for this KPI. This KPI is based on company annual accident incidence rates collected in the BIS Contractor Survey adjusted for under reporting (see KPI Tutorial for details).
232011 UK Construction Industry KPIs - Industry Performance Report
2003 2004 2005 2006 2007 2008 2009 2010 2011
BET
TER
BET
TER
0
20
40
60
80
100
120
140
Client Satisfaction, Product
Client Satisfaction, Service
Client Satisfaction, Value for Money
Predictability Cost, Project
Predictability Cost, Design
Predictability Cost, Construction
0
20
40
60
80
100
120
140
160
180
Predictability Time, Project
Predictability Time, Design
Predictability Time, Construction
Safety, Industry
Safety, Contractors, All Companies
Economic KPIs - All HousingYear-on-Year Comparisions (cont.)
242011 UK Construction Industry KPIs - Industry Performance Report
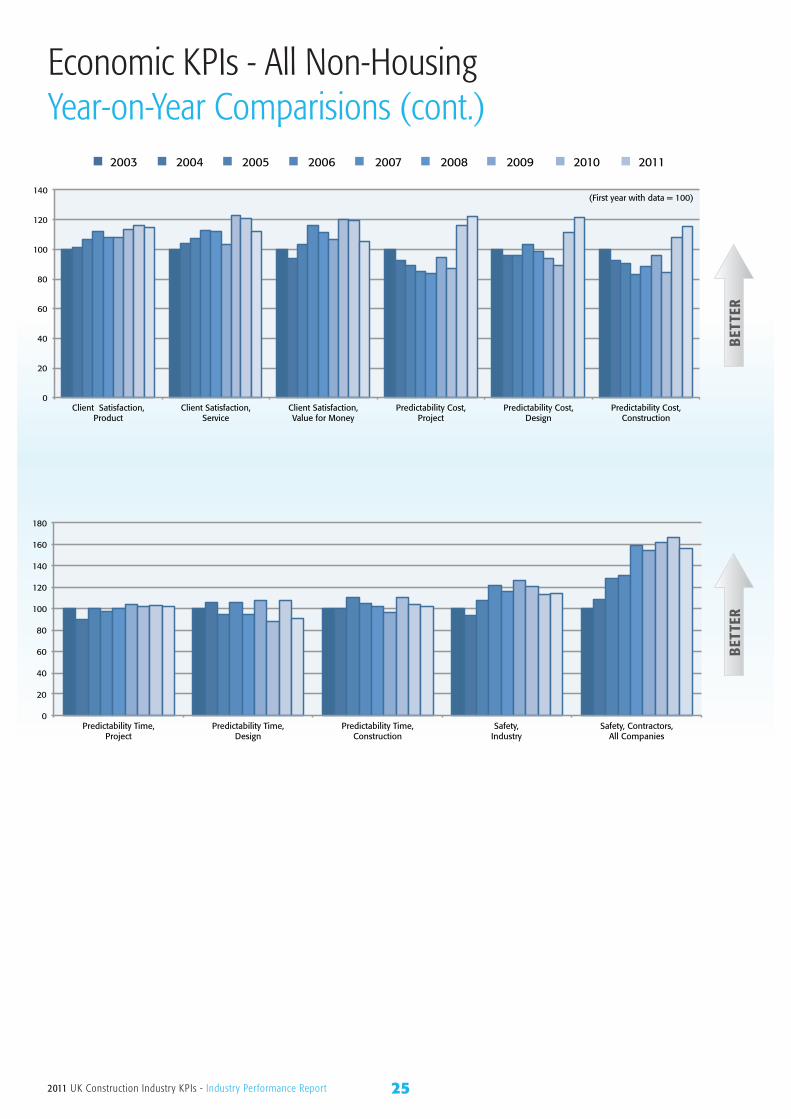
Economic KPIs - All Non-HousingYear-on-Year Comparisions
KPI Measure2003 2004 2005 2006 2007 2008 2009 2010
Last Year
All Years
Performance Trend
2011
Client Satisfaction - Product % scoring 8/10 or better 76% 77% 81% 85% 82% 82% 86% 88% 87%
Client Satisfaction - Service % scoring 8/10 or better 70% 73% 75% 79% 78% 72% 86% 85% 78%
Defects - Impact at Handover % scoring 8/10 or better 64% 60% 66% 74% 71% 68% 77% 76% 67%
Predictability Cost - Project % on cost or better 54% 50% 48% 46% 45% 51% 47% 63% 66%
Predictability Cost - Design % on cost or better 66% 63% 63% 68% 65% 62% 59% 73% 80%
Predictability Cost - Construction % on cost or better 52% 48% 47% 43% 46% 50% 44% 56% 60%
Predictability Time - Project % on cost or better 46% 41% 46% 45% 46% 48% 47% 47% 47%
Predictability Time - Design % on cost or better 57% 60% 54% 60% 54% 61% 50% 61% 52%
Predictability Time - Construction % on cost or better 59% 59% 65% 62% 60% 57% 65% 61% 60%
Safety - Industry1 Accident incidence rate 1097 1172 1023 901 946 865 906 971 967
Safety - Contractors - All Companies 2
% achieving zero accident incidence rate 39% 42% 50% 51% 62% 60% 63% 65% 61%
1. Based on company annual accident incidence rate published by the Health & Safety Executive on its website at Table 1 “Injuries in GB by Industry and Severity of Injury as reported to all Enforcing Authorities” through 2007 and is from BIS Contractors survey from 2008.
2. There is no sector breakdown available for this KPI. This KPI is based on company annual accident incidence rates collected in the BIS Contractor Survey adjusted for under reporting (see KPI Tutorial for details).
252011 UK Construction Industry KPIs - Industry Performance Report
2003 2004 2005 2006 2007 2008 2009 2010 2011
BET
TER
BET
TER
0
20
40
60
80
100
120
140
Client Satisfaction, Product
Client Satisfaction, Service
Client Satisfaction, Value for Money
Predictability Cost, Project
Predictability Cost, Design
Predictability Cost, Construction
(First year with data = 100)
0
20
40
60
80
100
120
140
160
180
Predictability Time, Project
Predictability Time, Design
Predictability Time, Construction
Safety, Industry
Safety, Contractors, All Companies
Economic KPIs - All Non-HousingYear-on-Year Comparisions (cont.)
262011 UK Construction Industry KPIs - Industry Performance Report
Construction Consultant KPIsYear-on-Year Comparisions
Client Satisfaction-Overall % scoring 8/10 or better 45% 42% 48% 51% 50% 52% 54% 55% 76% 74%
Client Satisfaction-Value for Money % scoring 8/10 or better 39% 37% 45% 41% 49% 47% 46% 46% 74% 74%
Client Satisfaction-Quality of Service % scoring 8/10 or better 42% 43% 45% 43% 47% 49% 49% 49% 79% 76%
Client Satisfaction-Timely Delivery % scoring 8/10 or better 41% 38% 42% 36% 38% 44% 45% 45% 72% 72%
Client Satisfaction-H&S Awareness % scoring 8/10 or better 42% 39% 49% 45% 54% 55% 57% 58% 87% 91%
Training Median annual training days per FTE employee 1.9 2.2 3.2 2.0 1.4 1.2 1.5 2.0 0.7 0.7
KPI Measure2002 2003 2004 2005 2006 2007 2008 2009 2010 2011
Last Year
All Years
Performance Trend
2003 2004 2005 2006 2007 2008 2009 2010 2011
BET
TER
0
50
100
150
200
250
Client Satisfaction-Overall Client Satisfaction-Value for Money
Client Satisfaction-Quality of Service
Client Satisfaction-Timely Delivery
Client Satisfaction-H&S Awareness
Training
(First year with data = 100)
272011 UK Construction Industry KPIs - Industry Performance Report
M&E Contractors KPIsYear-on-Year Comparisions
Client Satisfaction - Design - % scoring 8/10 or better 38% 37% 39% 51% 61% 63% 63% 60% 64% 65% 59%
Client Satisfaction - Installation - % scoring 8/10 or better 56% 68% 65% 63% 67% 71% 74% 72% 71% 77% 81%
Client Satisfaction - Service - % scoring 8/10 or better 56% 55% 58% 61% 69% 66% 67% 68% 69% 68% 72%
Client Satisfaction - Quality of O&M Manuals - % scoring 8/10 or better 50% 44% 38% 44% 44% 45% 46% 48% 48% 66% 64%
Defects - % scoring 8/10 or better 63% 55% 63% 60% 66% 66% 66% 68% 69% 60% 80%
Predictability - Cost - % on cost or better 37% 40% 41% 42% 43% 45% 47% 47% 46% 50% 77%
Predictability - Time - % on time or better 53% 52% 49% 46% 47% 49% 53% 54% 53% 55% 84%
Profitability - Median % return on turnover 2.2% 4.2% 3.9% 4.3% 4.3% 4.1% 3.9% 4.1% 3.9% 4.5% 6.7%
Productivity (Current Values) - Median value added per M&E operative (£000) 26.1 34.0 43.0 50.0 50.0 49.8 55.0 55.7 53.9 56.1 51.8
Productivity (Constant 2001 Values) - Median value added per M&E operative (£000) 26.1 32.7 40.3 44.9 42.7 40.3 42.0 40.8 37.9 38.4 35.5
Safety - M&E Contractors - All Companies1 - % achieving zero accidence incidence rate - 31% 35% 22% 32% 34% 48% 50% 55% 57% 64%
Safety - M&E Contractors - Companies with 60 or more staff1
- % achieving zero accidence incidence rate - 7% 14% 4% 13% 16% 23% 24% 25% 25% 25%
KPI Measure2002 2003 2004 2005 2006 2007 2008 2009 2010 20112001
Last Year
All Years
Performance Trend
2003 2002 2001 2004 2005 2006 2007 2008 2009 2010 2011
BET
TER
BET
TER
0
50
100
150
200
250
Client Satisfaction, Design
Client Satisfaction, Installation
Client Satisfaction, Service
Client Satisfaction, Quality of O&M Manuals
Defects Predictability, Cost
(First year with data = 100)
0
50
100
150
200
250
300
350
400
Predictability, Time
Profitability Productivity (Current Values)
Productivity (Constant 2001 Values)
Safety, All Companies
Safety, Companies with 60+ staff
1. Based on company annual accident incidence rates collected in the BSRIA M&E Contractors Survey. From 2002 data has been adjusted for under reporting.
282011 UK Construction Industry KPIs - Industry Performance Report
About Constructing ExcellenceConstructing Excellence provides a range of services to help implement KPIs:
KPIzone and the KPI Engine
KPIzone and the KPI Engine are now integrated products providing companies within the construction sector the right product for their KPI reporting and benchmarking.
The KPI Engine offers a sophisticated method of monitoring and benchmarking company and project performance data. It contains a wide range of reporting options and the opportunity to customise a performance measurement system to enable data sharing with clients, supply chains and for monitoring framework agreements. Use of the KPI Engine provides tangible evidence that your company is at the forefront of project delivery and performance improvement.
KPIzone offers continual access to benchmark performance against over 580 KPIs. It also contains definitions, methods of measurement and calculations for any of the Constructing Excellence KPIs and SPIs. Results can be viewed online at any time. For more details on any of these please visit www.kpizone.com .
Website
An extensive database of best practice activities, information and resources is available on www.constructingexcellence.org.uk .
At Constructing Excellence we bring distinctive value to our customers’ businesses through six core activities:
Action Research and Innovation:
• Members shape and take part in Constructing Excellence’s research programme, from major action research projects to working groups and confidential learning clubs.
• Involvement in up to ten Task Groups on strategic issues for the sector
KPIs and Benchmarking:
Constructing Excellence has led the way in industry performance measurement, with diagnostic tools central to its activities.
Members receive:
• Complimentary KPIzone subscription
Guidance and Training:
Constructing Excellence is able to offer members consultancy tailored to their business requirements. This service includes free or discounted access to Constructing Excellence publications, and discounts on facilitation and mentoring services and conferences.
Networks:Existing members see real benefits in these networks, meeting with other like minded individuals and companies, building relationships, sharing best practice and developing business contacts.
Demonstrations:
One of the key benefits of membership is being able to demonstrate participation to key stakeholders such as customers, employees, suppliers and investors. Constructing Excellence provides members:
• Opportunities to showcase projects• Opportunities to share and learn from members’
exemplars
Leadership and Influence:
Constructing Excellence works closely with government, strategic partners, firms and influences organisations to shape the future of the sector. Members have the chance to take an active role in influencing Government priorities and to have input into the formation of future policy at regular forums and conferences.
292011 UK Construction Industry KPIs - Industry Performance Report
About Glenigan
Glenigan provides subscribers with the most up-to-date and detailed UK construction contract sales leads service and analysis as well as offering custom research and analysis to help firms evaluate specific market opportunities and inform strategic decisions.
• Gleniganprovidessubscriberswithaconstantsupplyofleads,helpingfirmstoquicklyfindtherightprojectstotarget.
• Gleniganindentifiestherightcontacts,providingthenames,emailaddressesandphonenumbersofdecisionmakers.
• Gleniganhascomprehensiveconstructionmarketdata,analysis,forecastsandleaguetables.Ourcustomresearchandanalysisservicesisusedbyleadingfirmstoprovideinsightintospecificmarketopportunitiesandinformstrategicdecisions.
www.glenigan.com0870 443 5373

Constructing Excellence • Warwick House • 25 Buckingham Palace Road • London • SW1W 0PP
Tel: 020 7592 1100Fax: 020 7592 1101
E-mail: [email protected]: www.constructingexcellence.org.uk
In partnership with