Embed Size (px)
Citation preview

AM-VN-11-1
UNIVERSITY OF CALIFORNIA COOPERATIVE EXTENSION
2011
SAMPLE COSTS TO ESTABLISH AN ORCHARD AND PRODUCE
ALMONDS
SAN JOAQUIN VALLEY NORTH MICRO SPRINKLER IRRIGATION
Roger A. Duncan UCCE Farm Advisor, Stanislaus County Paul S. Verdegaal UCCE Farm Advisor, San Joaquin County Brent A. Holtz UCCE Farm Advisor / County Director, San Joaquin County David A. Doll UCCE Farm Advisor, Merced County Karen A. Klonsky UCCE Extension Specialist, Department of Agricultural and Resource
Economics, UC Davis Richard L. De Moura Research Associate, Department of Agricultural and Resource Economics,
UC Davis

2011 Almonds Costs and Returns Study San Joaquin Valley North UC Cooperative Extension 2
UNIVERSITY OF CALIFORNIA COOPERATIVE EXTENSION
SAMPLE COSTS TO ESTABLISH an ORCHARD and PRODUCE ALMONDS
San Joaquin Valley North - 2011 Micro Sprinkler Irrigation
CONTENTS
INTRODUCTION ................................................................................................................................................. 2 ASSUMPTIONS.................................................................................................................................................... 3 Establishment Cultural Practices and Material Inputs ......................................................................................... 3 Production Cultural Practices and Material Inputs .............................................................................................. 5 Labor, Equipment and Interest............................................................................................................................. 7 Cash Overhead ..................................................................................................................................................... 8 Non-Cash Overhead............................................................................................................................................. 9 REFERENCES .................................................................................................................................................... 11 Table 1. COSTS PER ACRE TO ESTABLISH AN ALMOND ORCHARD ................................................... 12 Table 2. COSTS PER ACRE TO PRODUCE ALMONDS ............................................................................... 14 Table 3. COSTS AND RETURNS PER ACRE TO PRODUCE ALMONDS .................................................. 15 Table 4. MONTHLY CASH COSTS – ALMONDS ......................................................................................... 17 Table 5. RANGING ANALYSIS ....................................................................................................................... 19 Table 6. WHOLE FARM EQUIPMENT, INVESTMENT, AND BUSINESS OVERHEAD COSTS............. 20 Table 7. HOURLY EQUIPMENT COSTS ........................................................................................................ 20 Table 8. OPERATIONS WITH EQUIPMENT & MATERIALS...................................................................... 21
INTRODUCTION
Sample costs to establish an almond orchard and produce almonds under micro sprinkler irrigation in the
Northern San Joaquin Valley are presented in this study. This study is intended as a guide only, and can be used in making production decisions, determining potential returns, preparing budgets and evaluating production loans. Practices described are based on production practices considered typical for the crop and area, but will not apply to every situation. Sample costs for labor, materials, equipment and custom services are based on current figures. A blank column, “Your Costs”, in Tables 2 and 3 is provided to enter your costs.
The hypothetical farm operation, production practices, overhead, and calculations are described under
the assumptions. For additional information or an explanation of the calculations used in the study call the Department of Agricultural and Resource Economics, University of California, Davis, (530) 752-3589 or your local UC Cooperative Extension office.
Sample Cost of Production Studies for many commodities can be downloaded at
http://coststudies.ucdavis.edu, requested through the Department of Agricultural and Resource Economics, UC Davis, (530) 752-3589 or obtained from the local county UC Cooperative Extension offices. Many archived studies are also available on the website.
The University of California does not discriminate in any of its policies, procedures or practices. The university is an affirmative action/equal opportunity employer.
University of California and USDA, Risk Management Cooperating.

2011 Almonds Costs and Returns Study San Joaquin Valley North UC Cooperative Extension 3
ASSUMPTIONS
The assumptions refer to Tables 1 to 8 and pertain to sample costs to establish an orchard and produce almonds under micro sprinkler irrigation in the northern San Joaquin Valley. The cultural practices described represent production operations and materials considered typical for a well managed farm in the region. Costs, materials, and practices in this study will not apply to all farms. Timing of and types of cultural practices will vary among growers within the region and from season to season due to variables such as weather, soil, and insect and disease pressure. The study is intended as a guide only. The use of trade names and cultural practices in this report does not constitute an endorsement or recommendation by the University of California nor is any criticism implied by omission of other similar products or cultural practices.
Land. The hypothetical farm consists of 100 contiguous acres farmed by the owner. Almonds are
being established on 40 acres. A mature almond orchard covers 55 acres; roads, irrigation systems and farmstead occupy the remaining five acres.
Establishment Cultural Practices and Material Inputs
(Table 1) Trees. No specific almond variety is planted in this study, but cultural practices are based on mid-
season varieties. Almond orchards will include two or more varieties in which pollen shedding and bloom periods overlap to insure good pollination. Cultivars that might be planted in this region include: A) Early blooming Sonora; B) Mid-blooming Aldrich, Nonpareil, Carmel, Monterey, Price, and Fritz; C) Late blooming Padre, Livingston, and Butte. Planting densities may range from 75 to 180 trees per acre. In this study, 124 trees per acre are planted on a 16-foot X 22-foot spacing (tree x row). The life of the orchard at the time of planting is estimated to be 25 years.
Site Preparation. This 40-acre orchard is established on land previously planted to an orchard. The
land is assumed to be well drained and either a class I or II soil. Orchard Removal. In this study the trees are pushed over and then chipped. The custom operator
charges $350 per acre, plus keeps and sells the wood. The grower then cleans up the orchard for land preparation. To reduce the incidence of diseases and nematodes, the ground should be fallowed for one year after removal.
Land Preparation. The ground is cross-ripped to a six-foot depth by a custom operator to break up
hardpan and pull up remaining tree roots, disked twice, and fumigated in the fall, then left unattended over the winter. A custom operator fumigates the tree row area (11 foot strip) with Telone. Fumigation costs also include the grower disking and rolling in the tree row behind the custom fumigator. Prior to planting in January, using GPS, a custom operator makes berms and marks the planting sites. Fall operations that prepare the orchard for planting are done the year prior to planting, but costs are shown in the first year.
Planting, Training, and Pruning. Planting the orchard starts by making a berm and marking the tree
sites. In January, the trees are planted, headed, trimmed, painted, and a tree wrap placed around the trunk. The tree wrap protects against above ground rodents, herbicide sprays, and sunburn. Contract labor companies who specialize in orchard planting do the planting operation. In the second year, two trees per acre are replanted. The replant sites are backhoed, fumigated, and replanted by a custom operator. Training, which includes suckering and light pruning for shaping is done during February or March of the first three years. In March of the first year, the trees are suckered. Tree tying is done late (November/December) in the second year or early (January/February) in the third and fourth year. The tie (small rope) is made around the tree about one-third of the way from the top of the tree. The young trees are pruned late to avoid bacterial canker. In the fourth and following years, pruning is done in November or December removing limbs for equipment access and safety.

2011 Almonds Costs and Returns Study San Joaquin Valley North UC Cooperative Extension 4
Fertilization. Beginning in the second year, leaf samples (1 per
20 acres) are taken in July for nutrient analysis. Fertilizers should be applied according to the analysis results. Fertilizer rates in this study are typical nutrient requirements, but do not take into account soil and water nitrogen. In the first year, equally split applications of N are made one-third in the spring (March or April), one third in early summer (June) and one-third in late summer (August). The fertilizer (15-15-15) is broadcast by hand near the base of the tree. In the second year, N is applied monthly from April to August through the irrigation system. CAN-17 (1/3 of N budget) is applied during the first application and UN32 thereafter. In the following years, UN32 is applied monthly. Potassium sulfate (K), 0-0-50, is banded along the tree row in the fall. In years one and two, zinc is applied with the rust spray in late March and with the shothole/scab spray in the following years. In October of the second and subsequent years, Solubor (boron) is applied as a foliar spray. Beginning in the third year, hull samples for boron analysis (1 per 40 acres) are taken, immediately prior to or at harvest. Many orchards on the eastside of the northern San Joaquin Valley are boron deficient and additional boron may be required. Annual rates of actual N, K, and B used in this study are shown in Table A. For both the leaf and hull samples, the grower uses an ATV to collect the samples. For the 40 acres, the estimated time is one hour to collect the samples and one hour to prepare and ship the samples.
Irrigation and Frost Protection. Water is pumped from a well and
passes through an infiltration system into the micro-sprinklers. Water is applied to the orchard approximately twice a week from mid March through mid October. Frost protection begins in the fourth year and uses two acre-inches annually, applied in February and early March in this study. Irrigation labor is assumed to be 0.09 hours per acre per irrigation and water costs (pumping costs) $41.28 per acre foot or $3.44 per acre inch. Table B shows the applied water for each year in this study. Applied water values are substantially greater than the actual tree water requirement due to application inefficiency. Application efficiencies of 90% are used for all years and reflect the differences in evaporative loss due to canopy development. Effective rainfall has not been considered in this study because it is too variable; therefore it is assumed that the season begins with a full soil profile.
Pollination. Bee hives are placed in the orchard in February prior to bloom by a beekeeper. One hive per acre is set out in the third year and two hives per acre thereafter.
Winter Sanitation. Winter sanitation to remove the mummy nuts begins in December of the fourth
year. The mummies are shaken from the trees, blown into the middles and shredded Pest Management. The pesticides and rates mentioned in this cost study as well as other materials
available are listed in UC Integrated Pest Management Guidelines, Almonds. Pesticides mentioned in the study are commonly used, but are not recommendations. Adjuvants or surfactants are recommended with many pesticides but are not included as a cost in this study. Growers should monitor pesticide chemistry and modes of action to prevent pesticide resistance by using different materials.
Weeds. In the first year, Gramoxone and Prowl are applied to the tree row (strip spray) in February soon
after planting. Also, the row middles are disked, floated and then mowed four times during the year. Spot sprays are usually applied as needed; in this study, Gramoxone is applied as a spot spray in the tree row during June. In the second year, the row middles are mowed seven times, once per month from March through September and six times thereafter, March through August. Roundup is applied as a spot spray, once (April)
Table A. Establishment Years Applied Actual Nitrogen (N),
Potash (K2O), Boron (B) Year N K2O B
lb /acre 1 20 00 (000) 0 .0 (0) 2 40 40 (080) 0 .4 (2) 3 80 80 (160) 0 .4 (2) 4 120 120 (240) 0 .4 (2) 5 160 160 (320) 0 .4 (2)
6+ 200 200 (400) 0 .4 (2) Parenthesis = actual amount of material applied (0-0-50) and (Solubor)
Table B. Applied Water per Year Year Acre- inch
1 11 2 21
3 32 4+ 42

2011 Almonds Costs and Returns Study San Joaquin Valley North UC Cooperative Extension 5
during the growing season to the tree row in the second year, but is usually applied as needed. Prowl and Roundup are applied to the tree row during the dormant season (December). Beginning in the third year, the dormant strip spray (Matrix and Roundup) is applied to the tree row in the fall, or winter (November). A preharvest spray (Roundup and Goal) is applied to the orchard floor starting in the third year to clean up the row middles prior to harvest. Although no cost is shown, ammonium sulfate should be used with all sprays to increase efficacy.
Insects. In May of the first and following years, mites are controlled with an Agri-Mek application.
Beginning in July of the third year, ant bait (Clinch) is sprinkled on the berms for ant control. Navel orange worms (NOW) are treated with Intrepid beginning in July (hull split spray) of the third year.
Diseases. Rust control is done in the first and second year with an application of Abound (zinc included
with spray). In the third and following years, brown rot is treated in February (60 to 80% bloom) with Vangard; shot hole, scab and rust are treated in March (petal fall or afterwards) with Pristine or Abound (zinc included with spray). Bravo is applied at petal fall for shothole, scab and anthracnose. Sprays are usually applied with a handgun sprayer during the first two years and with an air blast sprayer, thereafter. Materials are applied at reduced volumes (25, 50, 75%) during the first three years, because of the small tree size.
Vertebrates. Gophers can cause major losses to trees. Gophers are managed with the use of poison bait
applied in the spring by a mechanical bait applicator. Ground squirrels are managed by late winter use of anti-coagulant bait in aboveground bait stations.
Harvest. Harvest starts in the third year using contract labor for hand
harvest (poling). The nuts are moved to the centers by hand raking labor furnished by the grower. Mechanical harvesting and pickup by a custom operator begins in the fourth year. Typical annual yields for almonds are measured in meat (kernel) pounds per acre and are shown in Table C.
Production Cultural Practices and Material Inputs
(Tables 2-8)
Winter Sanitation. Winter (December) sanitation destroys over wintering sites for navel orangeworm. The mummy nuts are shaken from the trees, dropped to the orchard floor, blown into the row middles and shredded with a flail mower. Winter sanitation operations except for the shredding are custom hired. Hand poling may be needed in low rainfall years.
Pruning. Maintenance hand pruning for safety and equipment access is done in November or
December in this study, but can be done anytime from harvest through the dormant period. Prunings are stacked in the row middles and shredded by a custom operator. Tying and roping may continue to year 7 or 8 depending on previous training and variety.
Tree Replacement. One or more trees per acre may die each year and are replaced in late winter. Costs
in this study are basic costs that will vary with each orchard and type of tree loss. Tree replacement is included in investment repairs under Cash Overhead.
Irrigation/Frost Protection. Irrigation costs include pumping (water) and labor costs. The water is
pumped from a well and passes through an infiltration system and fed into a micro-sprinkler system. Forty-two acre-inches of water are applied to the orchard based on 90% application efficiency from March to October.
Table C. Annual Yields Year Kernel Pounds
3 400 4 800 5 1,600
6+ 2,000

2011 Almonds Costs and Returns Study San Joaquin Valley North UC Cooperative Extension 6
Applied water values are greater than the actual tree water requirement due to application inefficiency. No assumption is made about effective rainfall. An additional two acre inches are applied in February and/or March for frost protection. Water cost or pumping costs are $3.44 per acre inch based on current PG&E agricultural rates. Rates will vary depending upon pump and well specifications and rate program selected. Irrigation labor is 0.09 hours per acre per irrigation.
Pollination. Two hives (8+ frames/hive) per acre are contracted for pollination and set in the orchard by
the beekeeper prior to bloom (February). Fertilization. Nitrogen (N) at 200 pounds per acre per season as UN32 is applied monthly March
through September through the irrigation system. Neutral zinc at five pounds per acre is foliar applied with an insecticide or fungicide spray at pink bud in March. Potassium sulfate is banded in the fall (October) along the tree row at 400 pounds of material or 200 pounds of K20 per acre. Boron at 0.4 pounds per acre or two pounds of Solubor is foliar applied in October.
Sampling. Tree nutrient status is determined by leaf and hull analysis. Leaf samples at one per 20 acres
are taken in July. A hull sample at one per 40 acres is taken from the windrow at harvest. The grower uses an ATV to collect the samples which is assumed to take one hour per 40 acres (0.025 hrs/acre) each time. In addition another hour is required to prepare and ship the samples to a commercial lab for analysis.
Pest Management. The pesticides and rates mentioned in this cost study are listed in UC Integrated
Pest Management Guidelines, Almonds. For more information on other pesticides available, pest identification, monitoring, and management visit the UC IPM website at http://www.ipm.ucdavis.edu/. Cultural practices are discussed in the publications Integrated Pest Management for Almonds and Almond Production Manual. For information and pesticide use permits, contact the local county agricultural commissioner's office. Adjuvants or surfactants may be recommended for use with some pesticides, but are not included in this study. Pesticide costs vary by location and grower volume. Pesticide costs in this study are taken from a single dealer and shown as full retail.
Pest Control Adviser (PCA). Written recommendations are required for many pesticides and are made
by licensed pest control advisers. In addition the PCA can monitor the field for agronomic problems including pests and nutrition. Growers may hire private PCAs or receive the service as part of a service agreement with an agricultural chemical and fertilizer company. No costs are shown for a PCA in this study.
Weeds. A dormant strip spray is applied in November or December using pre-emergent and contact
herbicides (Roundup, Matrix) to control weeds in the tree rows. Row middles are mowed six times, once per month March through August. Rely is applied as a strip or spot spray in April/May or as needed. A preharvest spray (Roundup, Goal) is applied in August to prepare the orchard floor for harvest.
Insect and Mite. Mites are sprayed with Agri-Mek in May. Clinch is applied on the berms in July for
ant control. At the beginning of hull split in July, Intrepid is applied to control navel orange worm (NOW). NOW is also managed by early harvest and winter sanitation. Check for San Jose scale; in some year’s dormant oil applications may be necessary, also if twig borers are present additional sprays may be needed.
Disease. Brown rot is controlled at 60 to 80% bloom in February with Vangard. Shot hole, scab and
rust treatments with Pristine or Abound, are made in March at petal fall or afterwards. Also at petal fall, brown rot, scab and anthracnose are controlled with an application of Bravo.

2011 Almonds Costs and Returns Study San Joaquin Valley North UC Cooperative Extension 7
Vertebrate Pest. Gophers are managed with the use of poison bait applied in the spring using a mechanical applicator. Ground squirrels are managed by late winter fumigation and/or the use of anti-coagulant baits on above ground bait stations during the growing season when rodents accept grain.
Harvest. A custom operator mechanically harvests the almond crop. The grower furnishes labor for
hand raking to move nuts missed by the sweeper into the windrows. Harvest begins in August with the early maturing varieties and continues into October for late maturing varieties. In this study, harvest is in September. An inertia trunk shaker is the most common shaker in almonds. The shaker head attaches to the tree trunk to shake the nuts from the tree. The nuts fall to the ground and in a separate operation are blown from around the tree and swept into windrows to dry. A pickup machine gathers the nuts from the windrow and loads them into a cart or bankout wagon. In this study the nuts are elevated or dumped into bottom dump trailers with extended sides for delivery to the huller.
Yields and Returns. Typical annual yields for almonds are measured in meat pounds per acre and are
shown in Table C. An estimated price of a $1.50 per pound of almonds is used in this study to determine potential profits/losses. Returns will vary during the year, depending upon the market. The yields and prices used in this cost study are estimated based on 2005 to 2009 USDA California grower returns.
Assessment. The Almond Board of California (ABC) assesses all almonds commercially grown in the
state to pay for almond promotions and research. The mandatory assessment is paid by processors and is not reflected in grower costs.
Pickup/ATV. The study assumes business use mileage of 4,000 miles per year for the pickup. The
ATV is used for spot spraying, baiting ants and gophers and is included in those costs. Additional ATV use for checking the orchard, diseases and irrigation system is shown as a line item. The business use is estimated and not taken from any specific data.
Labor, Equipment, and Interest
Labor. Hourly wages for workers are $12.00 for machine operators and $8.00 per hour non-machine
labor. Adding 33% for the employer’s share of federal and state payroll taxes, workers compensation insurance, for nut crops (0045) and other possible benefits gives the labor rates shown of $15.96 and $10.64 per hour for machine labor and non-machine labor, respectively. Workers’ compensation costs will vary among growers, but for this study the cost is based upon the average industry final rate as of January 1, 2010 (California Department of Insurance). Labor for operations involving machinery are 20% higher than the operation time given in Table 2 to account for the extra labor involved in equipment set up, moving, maintenance, work breaks, and field repair.
Equipment Operating Costs. Repair costs are based on purchase price, annual hours of use, total
hours of life, and repair coefficients formulated by American Society of Agricultural Engineers (ASAE). Fuel and lubrication costs are also determined by ASAE equations based on maximum power takeoff (PTO) horsepower, and fuel type. Prices for on-farm delivery of diesel and gasoline are $2.60 and $3.10 per gallon, respectively. The cost includes a 2% local sales tax on diesel fuel and 8% sales tax on gasoline. Gasoline also includes federal and state excise tax, which are refundable for on-farm use when filing your income tax. The fuel, lube, and repair cost per acre for each operation in Table 2 is determined by multiplying the total hourly operating cost in Table 7 for each piece of equipment used for the selected operation by the hours per acre. Tractor time is 10% higher than implement time for a given operation to account for setup, travel and down time.

2011 Almonds Costs and Returns Study San Joaquin Valley North UC Cooperative Extension 8
Interest on Operating Capital. Interest on operating capital is based on cash operating costs and is calculated monthly until harvest at a nominal rate of 5.75% per year. A nominal interest rate is the typical market cost of borrowed funds. The interest cost of post harvest operations is discounted back to the last harvest month using a negative interest charge. The rate will vary depending upon various factors, but the rate in this study is considered a typical lending rate by a farm lending agency as of January 2011.
Risk. The risks associated with crop production should not be minimized. While this study makes
every effort to model a production system based on typical, real world practices, it cannot fully represent financial, agronomic and market risks, which affect profitability and economic viability.
Cash Overhead Costs
Cash overhead consists of various cash expenses paid out during the year that are assigned to the whole
farm and not to a particular operation. These costs include property taxes, interest on operating capital, office expense, liability and property insurance, sanitation services, equipment repairs, and management.
Property Taxes. Counties charge a base property tax rate of 1% on the assessed value of the property.
In some counties special assessment districts exist and charge additional taxes on property including equipment, buildings, and improvements. For this study, county taxes are calculated as 1% of the average value of the property. Average value equals new cost plus salvage value divided by 2 on a per acre basis.
Insurance. Insurance for farm investments varies depending on the assets included and the amount of
coverage. Property insurance provides coverage for property loss and is charged at 0.767% of the average value of the assets over their useful life. Liability insurance covers accidents on the farm and costs $581 for the entire farm.
Office Expense. Office and business expenses are estimated at $50 per acre. These expenses include
office supplies, telephones, bookkeeping, accounting, legal fees, shop and office utilities, and miscellaneous administrative charges. Office expenses are estimated and not taken from any collected data.
Environmental/Regulatory Costs. Various environmental fees are collected by the county and state.
The fees will vary by county. For example there are fees assessed by the Air Resources Board (state agency) regulating air pollution, a Water Coalition Fee (local coalition), formerly called an Ag Waiver Fee for water discharges, and hazardous material storage fee (local coalition). The grower must also provide safety training, safety equipment, and maintain training records. For this study, a cost of $10.00 per producing acre or $950 for the farm is assumed.
Sanitation Services. Sanitation services provide one portable toilet and cost the farm $640 annually.
The cost includes one single toilet unit with washbasin, delivery and 4 months of weekly service. Managers Salary. No salary is shown. The farm is owned and operated by the grower, therefore
returns above cost are assumed to go to management (grower). Investment Repairs. Annual maintenance is calculated as two percent of the purchase price, except for
tree replacement in the orchard. The average tree replacement cost over the life of the orchard is assumed to be 0.50% of the establishment cost or $1,010 ($25.25 per acre) per year.

2011 Almonds Costs and Returns Study San Joaquin Valley North UC Cooperative Extension 9
Non-Cash Overhead Costs
Non-cash overhead is calculated as the capital recovery cost for equipment and other farm investments. Capital Recovery Costs. Capital recovery cost is the annual depreciation and interest costs for a capital
investment. It is the amount of money required each year to recover the difference between the purchase price and salvage value (unrecovered capital). It is equivalent to the annual payment on a loan for the investment with the down payment equal to the discounted salvage value. This is a more complex method of calculating ownership costs than straight-line depreciation and opportunity costs, but more accurately represents the annual costs of ownership because it takes the time value of money into account (Boehlje and Eidman). The formula for the calculation of the annual capital recovery costs is ((Purchase Price – Salvage Value) x (Capital Recovery Factor)) + (Salvage Value x Interest Rate).
Salvage Value. Salvage value is an estimate of the remaining value of an investment at the end of its
useful life. For farm machinery (tractors and implements) the remaining value is a percentage of the new cost of the investment (Boehlje and Eidman). The percent remaining value is calculated from equations developed by the American Society of Agricultural Engineers (ASAE) based on equipment type and years of life. The life in years is estimated by dividing the wear out life, as given by ASAE by the annual hours of use in this operation. For other investments including irrigation systems, buildings, and miscellaneous equipment, the value at the end of its useful life is zero. The salvage value for land is the purchase price because land does not depreciate. The purchase price and salvage value for equipment and investments are shown in Table 6.
Capital Recovery Factor. Capital recovery factor is the amortization factor or annual payment whose
present value at compound interest is 1. The amortization factor is a table value that corresponds to the interest rate used and the life of the machine.
Interest Rate. The interest rate of 5.75% is used to calculate capital recovery. The rate will vary
depending upon size of loan and other lending agency conditions, but is a suggested rate by a farm lending agency in January 2011.
Establishment Cost. Costs to establish the orchard are used to determine capital recovery expenses, depreciation, and interest on investment for the production years. Establishment cost is the sum of the costs for land preparation, planting, trees, cash overhead and production expenses for growing the trees through the first year that almonds are harvested minus any returns from production. The Total Accumulated Net Cash Cost on Table 1, in the third year represents the establishment cost. For this study the cost is $5,049 per acre or $201,953 for the 40-acre orchard. The establishment cost is spread over the remaining 22 years of the 25 years the orchard is in production. Establishment costs in this study are based on typical basic operations, but can vary considerably, depending upon terrain, soil type, local regulations, and other factors.
Sprinkler Irrigation System. The sprinkler system consists of micro-sprinklers installed on the 40
acres in the tree row and includes a filtration/injection system located near the pumping plant. Irrigation Pumping System. A 200 foot deep well with a pumping level at 75-feet is drilled on the site
and a new 25 horsepower pump installed to irrigate the 40 acres. Land. Bare land values range from $5,000 to $25,000 per acre depending upon water source (well,
district or surface water). Land with available surface water ranges from $10,000 to $25,000 per acre. Land in this study is valued at $15,000 per acre or $15,790 per producing acre. Land values with planted almonds range from $12,000 to $25,000.

2011 Almonds Costs and Returns Study San Joaquin Valley North UC Cooperative Extension 10
Building. The metal building(s) are on a cement slab and total approximately 2,400 square feet. The buildings are used for shops and equipment storage. The buildings are located on the grower owned land.
Shop/FieldTools. This includes shop tools and equipment, hand tools, and miscellaneous field tools
including pruning equipment. The cost is assumed and not based on any collected data. Fuel Tanks. Two 500-gallon fuel tanks using gravity feed are on metal stands. The tanks are setup in a
cement containment pad that meets federal, state, and county regulations. Equipment. Farm equipment is purchased new or used, but the study shows the current purchase price
for new equipment. The new purchase price is adjusted to 60% to indicate a mix of new and used equipment. Annual ownership costs for equipment and other investments are shown in Table 6. Equipment costs are composed of three parts: non-cash overhead, cash overhead, and operating costs. Both of the overhead factors have been discussed in previous sections. The operating costs consist of repairs, fuel, and lubrication and are discussed under operating costs.
Table Values. Due to rounding, the totals may be slightly different from the sum of the components.

2011 Almonds Costs and Returns Study San Joaquin Valley North UC Cooperative Extension 11
REFERENCES
Ag Commissioner. 2009. Annual Crop Reports. Merced County, San Joaquin County, and Stanislaus County. American Society of Agricultural Engineers. 1994. American Society of Agricultural Engineers Standards
Yearbook. Russell H. Hahn and Evelyn E. Rosentreter (ed.) St. Joseph, Missouri. 41st edition.
Boehlje, Michael D., and Vernon R. Eidman. 1984. Farm Management. John Wiley and Sons. New York, New York
California Chapter of the American Society of Farm Managers and Rural Appraisers. 2010. Trends in
Agricultural Land and Lease Values. California Chapter of the American Society of Farm Managers and Rural Appraisers, Inc. Woodbridge, CA.
California State Board of equalization. Fuel Tax Division Tax Rates. Internet accessed January 2011.
http://www.boe.ca.gov/sptaxprog/spftdrates.htm Energy Information Administration. 2010. Weekly Retail on Highway Diesel and Gasoline Prices. Internet
accessed January 2011. http://tonto.eix.doe.gov/oog/info/wohdp Doanes Editors. Facts and Figures for Farmers. 1977. Doane Publishing, St. Louis, MO. P 292. Duncan, Roger, Paul Verdegaal, Brent A. Holtz, Karen M. Klonsky and Richard L. De Moura. 2006. Sample
Cost to Establish an Almond Orchard and Produce Almonds, San Joaquin Valley North, Micro-Sprinkler Irrigation. University of California Cooperative Extension. Department of Agricultural and Resource Economics. Davis, CA.
University of California Statewide Integrated Pest Management Program. UC Pest Management Guidelines,
Almonds. 2009. University of California, Davis, CA. http://www.ipm.ucdavis.edu University of California, Division of Agriculture and Natural Resources. 1996. Almond Production Manual.
University of California, Division of Agriculture and Natural Resources. Oakland, California. Publication 3364.
USDA, NASS, California Field Office. 2010. 2009 California Almond Acreage Report. Almond Board of California. http://www.almondboard.com/ For information concerning the above mentioned University of California publications contact UC DANR Communications
Services (1-800-994-8849) or your local county Cooperative Extension office.

2011 Almonds Costs and Returns Study San Joaquin Valley North UC Cooperative Extension 12
UC COOPERATIVE EXTENSION Table 1. COSTS PER ACRE TO ESTABLISH AN ALMOND ORCHARD
SAN JOAQUIN VALLEY - NORTH 2011 Cost Per Acre Year 1st 2nd 3rd 4th 5th Meat Pounds Per Acre 400 800 1,600 Planting Costs: Orchard Removal: (custom) 350 Orchard Removal; Field Cleanup 128 Land Preparation:- Subsoil 2X 6' depth (custom) 400 Land Preparation: Disc 2X (custom) 60 Fumigate: Tree Row 11' width (custom) 320 Land Preparation: Disc & Roll Tree Row 8 Land Preparation: Pull Berms & Mark Tree Sites (GPS) 30 Plant, Top, Paint, Wrap Trees (Yr 2 included backhoe cost) 223 44 Trees: 124 Per Acre (1% Replant In 2nd Year) 651 11 TOTAL PLANTING COSTS 2,170 54 Cultural Costs: Pollination: Hives 140 280 280 Disease: Brown Rot (Vangard). 34 34 34 Disease: Shothole/Scab (Abound) Petal Fall. Fertilizer: (Zinc) 71 74 74 Disease: Rust (Abound). Fertilizer: (Zinc) 27 42 Disease: Shothole/Scab/Anthracnose (Bravo) 44 44 44 Irrigate: Frost Protection 9 9 Vertebrate: Gopher & Squirrel (Bait) 34 34 34 34 34 Fertilize: (15-15-15) 97 Fertilize N (Yr 2, CAN 17 & UN32. Yr 3+, UN32, 5X) 29 54 80 107 Weed: Disk 8 Weed: Float 7 Weed: Mow (Yr 1, 4X. Yr 2-3, 7X. Yr 4+, 6X) 27 48 48 41 41 Irrigate: (water + labor) 91 126 164 198 198 Insect: Mites (Agrimek) 20 29 37 46 46 Fertilize: Leaf Samples for NPK (ATV, labor, analysis) 3 3 3 3 Insect: Worm (Intrepid) Hull Split 53 67 67 Insect: Ants (Clinch) 5 5 5 Weed: Orchard Floor (Roundup, Goal) Preharvest 34 34 34 Fertilize: Hull Analysis for Boron (ATV, labor, analysis) 1 1 Fertilize: Foliar, Boron (Solubor) 12 12 12 12 Fertilize: Potassium Sulfate 70 104 137 Weed: Spot Spray (Yr. 1, Gramoxone 1X. Yr. 2, Roundup 1X) 5 9 Weed: Strip Spray post plant (Prowl, Gramoxone) 34 Weed: Dormant Strip Spray (Yr 2, Prowl, Roundup) (Yr 3+ Roundup, Matrix) 33 105 105 105 Prune and/or Train and/or Sucker 54 53 43 138 138 Prune: Stack Prunings 11 16 16 Prune: Shred 29 29 29 Prune/Train: Tie/Rope Trees 48 80 95 Winter Sanitation: Knock Mummies, (Blow, Rake, Shred) 166 166 Pickup Truck Use 100 100 100 100 100 ATV Truck Use 23 23 23 23 23 TOTAL CULTURAL COSTS 529 541 1,161 1,724 1,799 Harvest Costs: Pole Trees 29 Shake Trees 98 98 Sweep Nuts 62 62 Hand Rake 29 3 3 Pick Up and Haul 77 78 81 Hull Nuts 20 40 80 TOTAL HARVEST COSTS 155 281 324 Interest On Operating Capital @ 5.75% 163 21 24 26 27 TOTAL OPERATING COSTS/ACRE 2,862 615 1,341 2,031 2,150

2011 Almonds Costs and Returns Study San Joaquin Valley North UC Cooperative Extension 13
UC COOPERATIVE EXTENSION
Table 1. continued Cost Per Acre Year 1st 2nd 3rd 4th 5th Meat Pounds Per Acre 400 800 1,600 Cash Overhead Costs: Office Expense 75 75 75 75 75 Liability Insurance 6 6 6 6 6 Sanitation Fees 7 7 7 7 7 Environmental Fee 10 10 10 10 10 Property Taxes 176 176 176 176 176 Property Insurance 14 14 14 14 14 Investment Repairs 59 59 59 59 59 TOTAL CASH OVERHEAD COSTS 347 347 348 348 348 TOTAL CASH COSTS/ACRE 3,209 962 1,689 2,379 2,498 INCOME/ACRE FROM PRODUCTION 800 1,600 3,200 NET CASH COSTS/ACRE FOR THE YEAR 3,209 962 889 779 PROFIT/ACRE ABOVE CASH COSTS 702 ACCUMULATED NET CASH COSTS/ACRE 3,209 4,171 5,059 5,838 5,136 Non-Cash Overhead Costs, (Capital Recovery): Buildings 2400 sqft 66 66 66 66 66 Land 750 750 750 750 750 Fuel Tanks 2-500 gal 5 5 5 5 5 Shop/Field Tools/Equipment 15 15 15 15 15 Pump Refurbished (40 acres) 35 35 35 35 35 Micro-Sprinkler Irrigation System (40 acres) 97 97 97 97 97 Equipment 64 48 61 60 60 TOTAL NON-CASH OVERHEAD COST/ACRE 1,032 1,016 1,029 1,028 1,028 TOTAL COST/ACRE FOR THE YEAR 4,241 1,978 2,718 3,407 3,526 INCOME/ACRE FROM PRODUCTION 800 1,600 3,200 TOTAL NET COST/ACRE FOR THE YEAR 4,241 1,978 1,918 1,807 326 NET PROFIT/ACRE ABOVE TOTAL COST TOTAL ACCUMULATED NET COST/ACRE 4,241 6,219 8,136 9,943 10,269

2011 Almonds Costs and Returns Study San Joaquin Valley North UC Cooperative Extension 14
UC COOPERATIVE EXTENSION
Table 2. COSTS PER ACRE TO PRODUCE ALMONDS SAN JOAQUIN VALLEY - NORTH 2011
Operation Cash and Labor Costs per acre Time Labor Fuel, Lube Material Custom/ Total Your Operation (Hrs/A) Cost & Repairs Cost Rent Cost Cost Cultural: Pollination (2 hives) 0.00 0 0 0 280 280 Disease: Brown Rot (Vangard) 0.31 6 5 24 0 34 Irrigate: Frost Protection 0.18 2 0 7 0 9 Disease: Shothole/Scab/Rust (Abound). Fertilize: (Zn) 0.31 6 5 63 0 74 Vertebrate: Gopher & Squirrel (Bait) 0.66 13 3 19 0 34 Fertilize: N @ 200 lb N/acre (UN32) 0.00 0 0 134 0 134 Weed: Mow 6X 1.16 22 19 0 0 41 Irrigate: (water & labor) 56X 5.04 54 0 144 0 198 Disease: Shothole/Scab/Anthracnose (Bravo). 0.31 6 5 33 0 44 Weed: Strip Spray (Rely) 0.23 4 3 12 0 19 Insect: Mites (AgriMek) 0.31 6 5 35 0 46 Fertilize: Leaf Samples (collect & analysis) NPK 0.03 1 0 0 2 3 Insect: NOW (Intrepid) 0.31 6 5 56 0 67 Insect: Ants (Clinch) 0.08 2 0 13 0 15 Weed: Preharvest Spray Orchard Floor (Roundup, Goal) 0.23 4 3 19 0 27 Fertilize: Hull Samples (collect & analysis) B 0.03 1 0 0 1 1 Fertilize: Foliar Spray (Solubor) B 0.31 6 5 1 0 12 Fertilize: Potassium Sulfate 0.08 1 1 168 0 171 Weed: Winter Strip (Roundup, Matrix) 0.23 4 3 93 0 101 Prune: Hand (maintenance pruning) 13.00 138 0 0 0 138 Prune: Stack Prunings 1.50 16 0 0 0 16 Prune: Shred Prunings (brush) 0.00 0 0 0 29 29 Winter Sanitation: Shake Mummies, Rake, Sweep, Shred 0.09 4 1 0 160 166 Pickup Truck Ranch Use 3.33 64 37 0 0 100 ATV: General Use 1.00 19 4 0 0 23 TOTAL CULTURAL COSTS 28.73 386 105 821 471 1,782 Harvest: Shake 0.00 0 0 0 98 98 Sweep 0.00 0 0 0 62 62 Hand Rake Nuts 0.25 3 0 0 0 3 Pickup and Haul Nuts 0.00 0 0 0 83 83 Hull and Shell Nuts 0.00 0 0 0 100 100 TOTAL HARVEST COSTS 0.25 3 0 0 343 345 Interest on operating capital @ 5.75% 24 TOTAL OPERATING COSTS/ACRE 388 105 821 813 2,151 CASH OVERHEAD: Office Expense 75 Liability Insurance 6 Sanitation Fees 7 Environmental/Regulatory Fee 10 Property Taxes 202 Property Insurance 34 Investment Repairs 85 TOTAL CASH OVERHEAD COSTS 418 TOTAL CASH COSTS/ACRE 2,569 Non-Cash Overhead (Capital Recovery) Investment Per producing Annual Cost Acre Capital Recovery Buildings 842 66 66 Land 15,789 750 750 Fuel Tanks 2-500g 69 5 5 Shop & Field Tools 158 15 15 Sprinkler Irrigation System 500 35 35 Pump Refurbished 1,400 97 97 Orchard Establishment Costs 5,059 376 376 Equipment 615 59 62 TOTAL NON-CASH OVERHEAD COSTS 24,433 1,403 1,405 TOTAL COSTS/ACRE 3,974

2011 Almonds Costs and Returns Study San Joaquin Valley North UC Cooperative Extension 15
UC COOPERATIVE EXTENSION Table 3. COSTS AND RETURNS PER ACRE TO PRODUCE ALMONDS
SAN JOAQUIN VALLEY - NORTH 2011 Quantity/ Price or Value or Your Acre Unit Cost/Unit Cost/Acre Cost GROSS RETURNS
Almonds 2,000.00 lb 1.50 3,000 OPERATING COSTS Insecticide:
Agri-Mek 0.15 EC 15.00 floz 2.35 35 Intrepid 2F 18.00 floz 3.11 56 Clinch 1.00 lb 12.74 13
Fungicide: Vangard WF 5.00 oz 4.71 24 Abound 14.00 floz 3.71 52 Bravo Weatherstik 4.00 pint 8.23 33
Rodenticide: Gopher Bait 1.50 lb 7.87 12 Squirrel Bait 1.50 lb 4.54 7
Herbicide: Rely 200 1.20 pint 9.72 12 Roundup Ultra Max 2.00 pint 4.75 10 Goal 2 XL 1.25 pint 9.73 12 Matrix SG 4.00 oz 22.69 91
Fertilizer: Neutral Zinc 5.00 lb 2.20 11 UN-32 200.00 lb N 0.67 134 Solubor (Boron) 2.00 lb 0.72 1 Potassium Sulfate (0-0-50) 400.00 lb 0.42 168
Irrigation: Water - Pumped 44.00 acin 3.44 151
Custom/Contract: Hives (Pollination) 2.00 hives 140.00 280 Leaf Analysis: NPK (2 samples/40 acres) 0.05 each 32.00 2 Hull Analysis: B (1 sample/40 acres) 0.03 each 17.00 0 Shake Trees 2.00 hour 98.00 196 Sweep Nuts 2.00 hour 62.00 124 Pickup Nuts 1.00 acre 75.00 75 Haul Nuts 20.00 cwt 0.38 8 Hull & Shell Nuts 2,000.00 lb 0.05 100 Shred Brush 0.10 hour 285.00 29
Labor (machine) 10.81 hrs 15.96 173 Labor (non-machine) 20.28 hrs 10.64 216 Fuel - Gas 10.12 gal 3.10 31 Fuel - Diesel 13.65 gal 2.60 35 Lube 10 Machinery repair 28 Interest on operating capital @ 5.75% 24 TOTAL OPERATING COSTS/ACRE 2,151 NET RETURNS ABOVE OPERATING COSTS 849 CASH OVERHEAD COSTS: Office Expense 75 Liability Insurance 6 Sanitation Fees 7 Environmental/Regulatory Fee 10 Property Taxes 202 Property Insurance 34 Investment Repairs 85 TOTAL CASH OVERHEAD COSTS/ACRE 418 TOTAL CASH COSTS/ACRE 2,569

2011 Almonds Costs and Returns Study San Joaquin Valley North UC Cooperative Extension 16
UC COOPERATIVE EXTENSION
Table 3. continued Quantity/ Price or Value or Your Acre Unit Cost/Unit Cost/Acre Cost NON-CASH OVERHEAD COSTS (Capital Recovery) Buildings 66 Land 750 Fuel Tanks 2-500g 5 Shop & Field Tools 15 Sprinkler Irrigation System 35 Pump Refurbished 97 Orchard Establishment Costs 376 Equipment 62 TOTAL NON-CASH OVERHEAD COSTS/ACRE 1,405 TOTAL COSTS/ACRE 3,974 NET RETURNS ABOVE TOTAL COSTS -974
2011 Almonds Costs and Returns Study San Joaquin Valley North UC Cooperative Extension 17
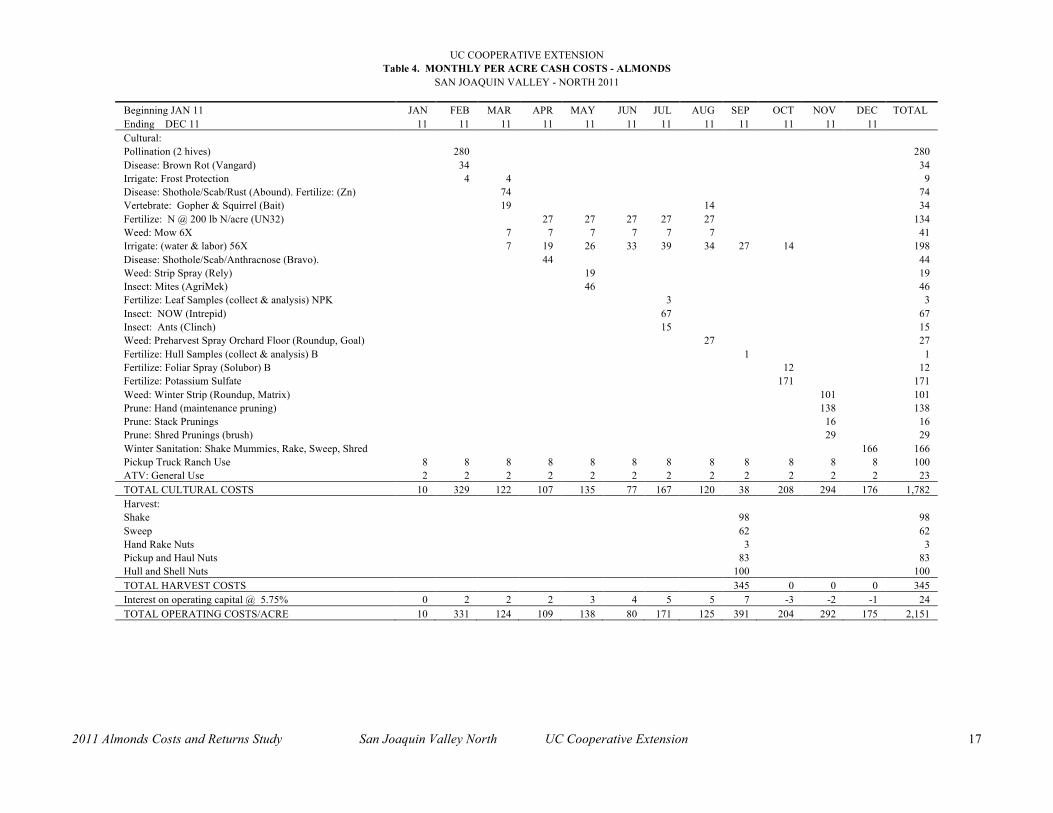
UC COOPERATIVE EXTENSION Table 4. MONTHLY PER ACRE CASH COSTS - ALMONDS
SAN JOAQUIN VALLEY - NORTH 2011 Beginning JAN 11 JAN FEB MAR APR MAY JUN JUL AUG SEP OCT NOV DEC TOTAL Ending DEC 11 11 11 11 11 11 11 11 11 11 11 11 11 Cultural: Pollination (2 hives) 280 280 Disease: Brown Rot (Vangard) 34 34 Irrigate: Frost Protection 4 4 9 Disease: Shothole/Scab/Rust (Abound). Fertilize: (Zn) 74 74 Vertebrate: Gopher & Squirrel (Bait) 19 14 34 Fertilize: N @ 200 lb N/acre (UN32) 27 27 27 27 27 134 Weed: Mow 6X 7 7 7 7 7 7 41 Irrigate: (water & labor) 56X 7 19 26 33 39 34 27 14 198 Disease: Shothole/Scab/Anthracnose (Bravo). 44 44 Weed: Strip Spray (Rely) 19 19 Insect: Mites (AgriMek) 46 46 Fertilize: Leaf Samples (collect & analysis) NPK 3 3 Insect: NOW (Intrepid) 67 67 Insect: Ants (Clinch) 15 15 Weed: Preharvest Spray Orchard Floor (Roundup, Goal) 27 27 Fertilize: Hull Samples (collect & analysis) B 1 1 Fertilize: Foliar Spray (Solubor) B 12 12 Fertilize: Potassium Sulfate 171 171 Weed: Winter Strip (Roundup, Matrix) 101 101 Prune: Hand (maintenance pruning) 138 138 Prune: Stack Prunings 16 16 Prune: Shred Prunings (brush) 29 29 Winter Sanitation: Shake Mummies, Rake, Sweep, Shred 166 166 Pickup Truck Ranch Use 8 8 8 8 8 8 8 8 8 8 8 8 100 ATV: General Use 2 2 2 2 2 2 2 2 2 2 2 2 23 TOTAL CULTURAL COSTS 10 329 122 107 135 77 167 120 38 208 294 176 1,782 Harvest: Shake 98 98 Sweep 62 62 Hand Rake Nuts 3 3 Pickup and Haul Nuts 83 83 Hull and Shell Nuts 100 100 TOTAL HARVEST COSTS 345 0 0 0 345 Interest on operating capital @ 5.75% 0 2 2 2 3 4 5 5 7 -3 -2 -1 24 TOTAL OPERATING COSTS/ACRE 10 331 124 109 138 80 171 125 391 204 292 175 2,151

2011 Almonds Costs and Returns Study San Joaquin Valley North UC Cooperative Extension 18
UC COOPERATIVE EXTENSION
Table 4. continued Beginning JAN 11 JAN FEB MAR APR MAY JUN JUL AUG SEP OCT NOV DEC TOTAL Ending DEC 11 11 11 11 11 11 11 11 11 11 11 11 11 CASH OVERHEAD: Office Expense 6 6 6 6 6 6 6 6 6 6 6 6 75 Liability Insurance 6 6 Sanitation Fees 7 7 Environmental/Regulatory Fee 10 10 Property Taxes 101 101 202 Property Insurance 17 17 34 Investment Repairs 7 7 7 7 7 7 7 7 7 7 7 7 85 TOTAL CASH OVERHEAD COSTS 138 19 13 23 13 13 131 13 13 13 13 13 418 TOTAL CASH COSTS/ACRE 148 350 138 132 152 94 302 138 404 218 305 188 2,569

2011 Almonds Costs and Returns Study San Joaquin Valley North UC Cooperative Extension 19
UC COOPERATIVE EXTENSION Table 5. RANGING ANALYSIS
SAN JOAQUIN VALLEY - NORTH 2011
COSTS PER ACRE AT VARYING YIELDS TO PRODUCE ALMONDS YIELD (lb/acre) 1,400 1,600 1,800 2,000 2,200 2,400 2,600 OPERATING COSTS/ACRE: Cultural Cost 1,782 1,782 1,782 1,782 1,782 1,782 1,782 Harvest Cost 312 323 334 345 356 367 378 Interest on operating capital @ 5.75% 24 24 24 24 24 24 24 TOTAL OPERATING COSTS/ACRE 2,118 2,129 2,140 2,151 2,162 2,173 2,184 TOTAL OPERATING COSTS/LB 1.51 1.33 1.19 1.08 0.98 0.91 0.84 CASH Overhead Costs/ACRE 418 418 418 418 418 418 418 TOTAL CASH COSTS/ACRE 2,536 2,547 2,558 2,569 2,580 2,591 2,602 TOTAL CASH COSTS/LB 1.81 1.59 1.42 1.28 1.17 1.08 1.00 NON-CASH Overhead Costs/ACRE 1,405 1,405 1,405 1,405 1,405 1,405 1,405 TOTAL COSTS/ACRE 3,941 3,952 3,963 3,974 3,985 3,996 4,007 TOTAL COSTS/LB 2.81 2.47 2.20 1.99 1.81 1.66 1.54
NET RETURNS PER ACRE ABOVE OPERATING COSTS
PRICE YIELD (lb/acre) $/lb 1,400 1,600 1,800 2,000 2,200 2,400 2,600 0.90 -858 -689 -520 -351 -182 -13 156 1.10 -578 -369 -160 49 258 467 676 1.30 -298 -49 200 449 698 947 1,196 1.50 -18 271 560 849 1,138 1,427 1,716 1.70 262 591 920 1,249 1,578 1,907 2,236 1.90 542 911 1,280 1,649 2,018 2,387 2,756 2.10 822 1,231 1,640 2,049 2,458 2,867 3,276
NET RETURNS PER ACRE ABOVE CASH COSTS
PRICE YIELD (lb/acre) $/lb 1,400 1,600 1,800 2,000 2,200 2,400 2,600 0.90 -1,276 -1,107 -938 -769 -600 -431 -262 1.10 -996 -787 -578 -369 -160 49 258 1.30 -716 -467 -218 31 280 529 778 1.50 -436 -147 142 431 720 1,009 1,298 1.70 -156 173 502 831 1,160 1,489 1,818 1.90 124 493 862 1,231 1,600 1,969 2,338 2.10 404 813 1,222 1,631 2,040 2,449 2,858
NET RETURNS PER ACRE ABOVE TOTAL COSTS
PRICE YIELD (lb/acre) $/lb 1,400 1,600 1,800 2,000 2,200 2,400 2,600 0.90 -2,681 -2,512 -2,343 -2,174 -2,005 -1,836 -1,667 1.10 -2,401 -2,192 -1,983 -1,774 -1,565 -1,356 -1,147 1.30 -2,121 -1,872 -1,623 -1,374 -1,125 -876 -627 1.50 -1,841 -1,552 -1,263 -974 -685 -396 -107 1.70 -1,561 -1,232 -903 -574 -245 84 413 1.90 -1,281 -912 -543 -174 195 564 933 2.10 -1,001 -592 -183 226 635 1,044 1,453

2011 Almonds Costs and Returns Study San Joaquin Valley North UC Cooperative Extension 20
UC COOOPERATIVE EXTENSION Table 6. WHOLE FARM ANNUAL EQUIPMENT, INVESTMENT, AND BUSINESS OVERHEAD COSTS
SAN JOAQUIN VALLEY - NORTH 2011
ANNUAL EQUIPMENT COSTS Cash Overhead Yrs Salvage Capital Insur- Yr Description Price Life Value Recovery ance Taxes Total 11 66 HP 2WD Tractor 37,773 20 4,847 2,817 165 213 3,195 11 ATV 4WD 6,500 7 2,466 808 35 45 888 11 Mower/Chopper - 8' 9,600 10 1,698 1,092 44 56 1,192 11 Orch. Sprayer 500 G 21,000 15 2,016 1,894 89 115 2,098 11 Pickup 1/2 ton 28,000 7 10,621 3,481 150 193 3,824 11 Spin/Spreader-Pull 14,000 20 730 1,077 57 74 1,208 11 Weed Sprayer 100 G 5,500 10 973 625 25 32 683
TOTAL 122,373 23,351 11,793 565 729 13,087 60% of New Cost* 73,424 14,011 7,076 339 437 7,852 *Used to reflect a mix of new and used equipment
ANNUAL INVESTMENT COSTS
Cash Overhead Yrs Salvage Capital Insur- Description Price Life Value Recovery ance Taxes Repairs Total INVESTMENT Orchard Establishment 202,374 22 15,026 784 1,012 1,010 17,832 Buildings, 2400 sqft 80,000 20 6,284 310 400 1,600 8,594 Sprinkler Irrigation System 56,000 25 3,874 217 280 1,120 5,491 Pump 25HP Refurbished 20,000 25 1,384 78 100 400 1,961 Fuel Tanks 2-500g 6,514 20 651 491 28 36 130 685 Land 1,500,000 22 1,500,000 71,250 0 15,000 0 86,250 Shop & Field Tools/Equipment 15,000 15 1,421 58 75 300 1,854 TOTAL INVESTMENT 1,879,888 1,500,651 99,730 1,475 16,903 4,560 122,668
ANNUAL BUSINESS OVERHEAD COSTS
Units/ Price/ Total Description Farm Unit Unit Cost Environmental/Regulatory Fee 95 acre 10 950 Liability Insurance 100 acre 5.81 581 Office Expense 95 acre 75.00 7,125 Sanitation Fees 95 acre 6.74 640
UC COOPERATIVE EXTENSION Table 7. HOURLY EQUIPMENT COSTS SAN JOAQUIN VALLEY - NORTH 2011
COSTS PER HOUR Actual Cash Overhead Operating Hours Capital Insur- Fuel & Total Total Yr Description Used Recovery ance Taxes Repairs Lube Oper. Costs/Hr 11 66 HP 2WD Tractor 600 2.82 0.17 0.21 1.61 9.54 11.15 14.35 11 ATV 4WD 285 1.70 0.07 0.09 0.48 3.56 4.04 5.90 11 Mower/Chopper - 8' 200 3.28 0.13 0.17 4.05 0.00 4.05 7.63 11 Orch. Sprayer 500 G 130 8.75 0.41 0.53 3.46 0.00 3.46 13.15 11 Pickup 1/2 ton 285 7.32 0.31 0.41 2.07 8.91 10.98 19.02 11 Spin/Spreader-Pull 60 10.76 0.56 0.74 5.24 0.00 5.24 17.30 11 Weed Sprayer 100 G 150 2.51 0.10 0.13 1.48 0.00 1.48 4.22
2011 Almonds Costs and Returns Study San Joaquin Valley North UC Cooperative Extension 21
UC COOPERATIVE EXTENSION
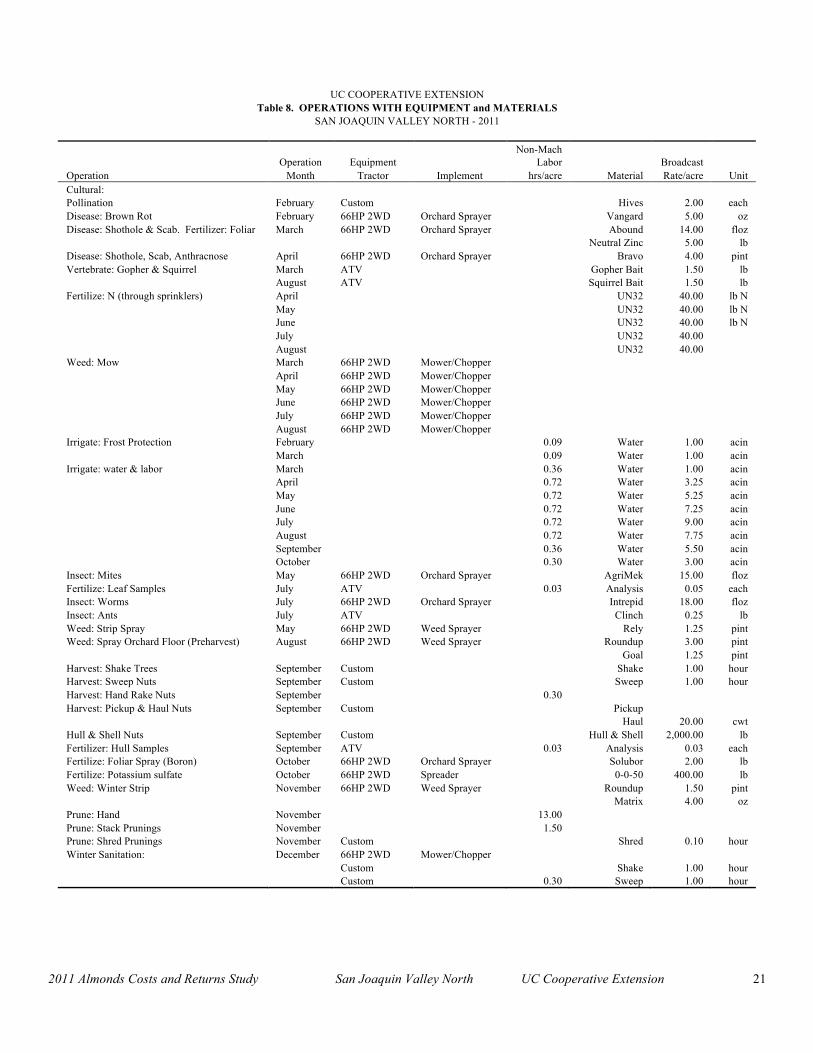
Table 8. OPERATIONS WITH EQUIPMENT and MATERIALS SAN JOAQUIN VALLEY NORTH - 2011
Non-Mach Operation Equipment Labor Broadcast Operation Month Tractor Implement hrs/acre Material Rate/acre Unit Cultural: Pollination February Custom Hives 2.00 each Disease: Brown Rot February 66HP 2WD Orchard Sprayer Vangard 5.00 oz Disease: Shothole & Scab. Fertilizer: Foliar March 66HP 2WD Orchard Sprayer Abound 14.00 floz Neutral Zinc 5.00 lb Disease: Shothole, Scab, Anthracnose April 66HP 2WD Orchard Sprayer Bravo 4.00 pint Vertebrate: Gopher & Squirrel March ATV Gopher Bait 1.50 lb August ATV Squirrel Bait 1.50 lb Fertilize: N (through sprinklers) April UN32 40.00 lb N May UN32 40.00 lb N June UN32 40.00 lb N July UN32 40.00 August UN32 40.00 Weed: Mow March 66HP 2WD Mower/Chopper April 66HP 2WD Mower/Chopper May 66HP 2WD Mower/Chopper June 66HP 2WD Mower/Chopper July 66HP 2WD Mower/Chopper August 66HP 2WD Mower/Chopper Irrigate: Frost Protection February 0.09 Water 1.00 acin March 0.09 Water 1.00 acin Irrigate: water & labor March 0.36 Water 1.00 acin April 0.72 Water 3.25 acin May 0.72 Water 5.25 acin June 0.72 Water 7.25 acin July 0.72 Water 9.00 acin August 0.72 Water 7.75 acin September 0.36 Water 5.50 acin October 0.30 Water 3.00 acin Insect: Mites May 66HP 2WD Orchard Sprayer AgriMek 15.00 floz Fertilize: Leaf Samples July ATV 0.03 Analysis 0.05 each Insect: Worms July 66HP 2WD Orchard Sprayer Intrepid 18.00 floz Insect: Ants July ATV Clinch 0.25 lb Weed: Strip Spray May 66HP 2WD Weed Sprayer Rely 1.25 pint Weed: Spray Orchard Floor (Preharvest) August 66HP 2WD Weed Sprayer Roundup 3.00 pint Goal 1.25 pint Harvest: Shake Trees September Custom Shake 1.00 hour Harvest: Sweep Nuts September Custom Sweep 1.00 hour Harvest: Hand Rake Nuts September 0.30 Harvest: Pickup & Haul Nuts September Custom Pickup Haul 20.00 cwt Hull & Shell Nuts September Custom Hull & Shell 2,000.00 lb Fertilizer: Hull Samples September ATV 0.03 Analysis 0.03 each Fertilize: Foliar Spray (Boron) October 66HP 2WD Orchard Sprayer Solubor 2.00 lb Fertilize: Potassium sulfate October 66HP 2WD Spreader 0-0-50 400.00 lb Weed: Winter Strip November 66HP 2WD Weed Sprayer Roundup 1.50 pint Matrix 4.00 oz Prune: Hand November 13.00 Prune: Stack Prunings November 1.50 Prune: Shred Prunings November Custom Shred 0.10 hour Winter Sanitation: December 66HP 2WD Mower/Chopper Custom Shake 1.00 hour Custom 0.30 Sweep 1.00 hour