Embed Size (px)
Citation preview
The Economics of Growing AlmondsRichard Waycott, Moderator

Thank you Green Sponsor
The Economics of
Growing Almonds
Presenters:
Karen Klonsky, UC Davis
Brian Ezell, Paramount Farms
Debbie McMillan, Derco Foods
What’s the Real Price of Almonds?Karen Klonsky, Dept. of Agricultural & Resource Economics
Cost and Return Study Authors
David Doll, UCCE Merced County
Roger Duncan, UCCE Stanislaus County
Paul Verdegaal, UCCE San Joaquin County
Rich DeMoura, Dept. of Ag. & Resource Econ. UCD
Karen Klonsky, Dept. of Ag. & Resource Econ. UCD
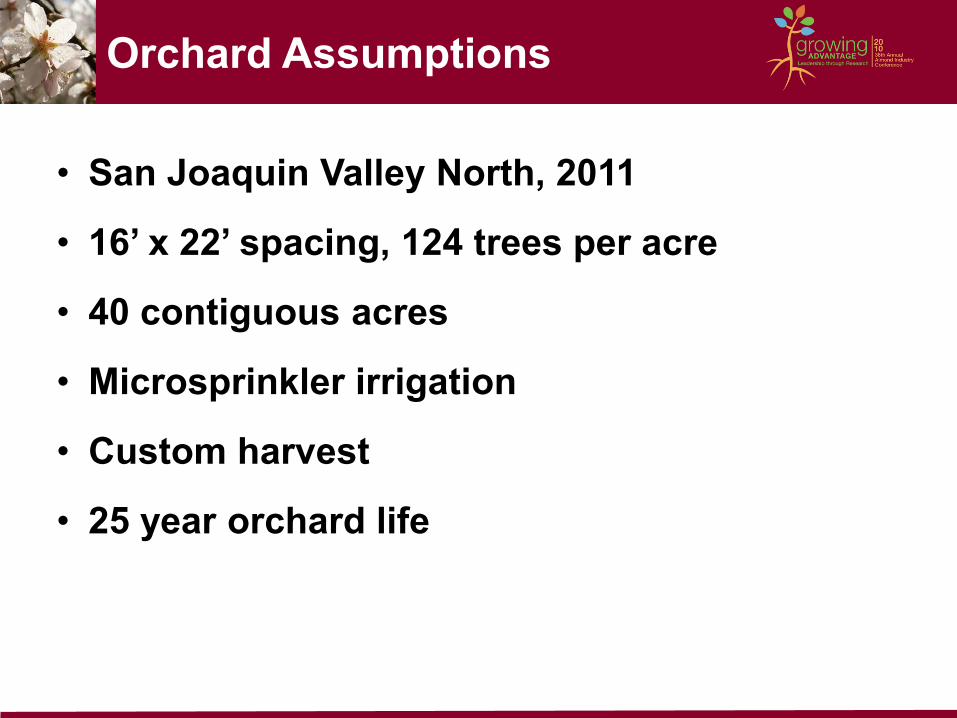
Orchard Assumptions
• San Joaquin Valley North, 2011
• 16’ x 22’ spacing, 124 trees per acre
• 40 contiguous acres
• Microsprinkler irrigation
• Custom harvest
• 25 year orchard life
Costs of Production Terminology
Cultural Costs
Harvest Costs
Cash Overhead
Noncash Overhead
Costs of Production
Cultural Costs
• Pruning
• Floor management
• Disease and pest control
• Irrigation and fertilization
• ATV and pickup use
Harvest Costs
Cash Overhead
Noncash Overhead
Costs of Production
Cultural Costs
Harvest Costs
• Shake, sweep, rake
• Pick up and haul
• Hull and shell nuts
Cash Overhead
Noncash Overhead
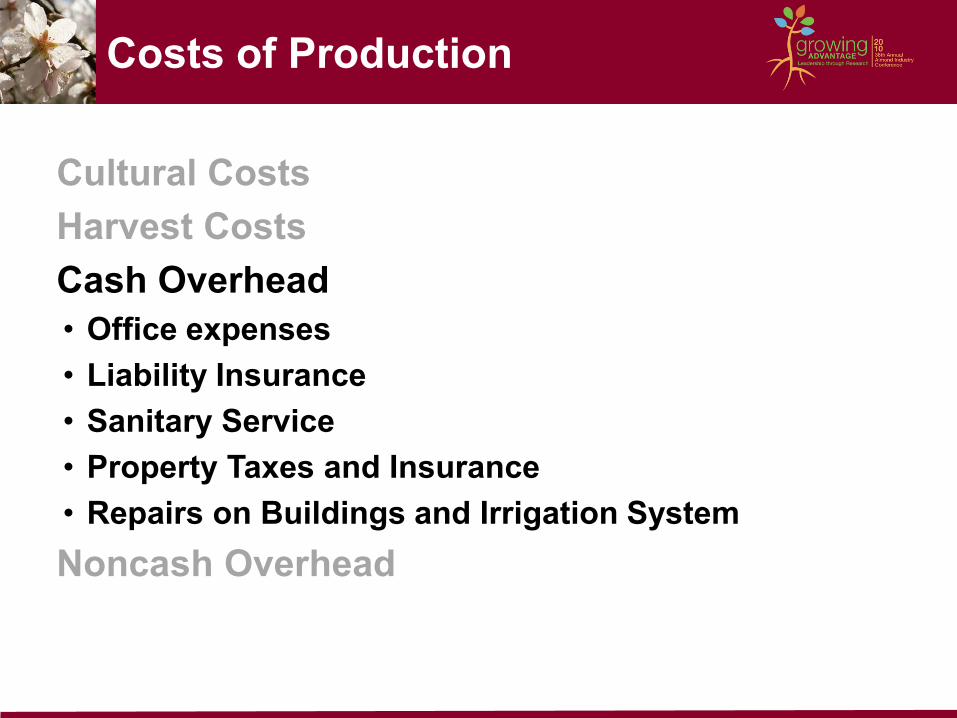
Costs of Production
Cultural Costs
Harvest Costs
Cash Overhead
• Office expenses
• Liability Insurance
• Sanitary Service
• Property Taxes and Insurance
• Repairs on Buildings and Irrigation System
Noncash Overhead
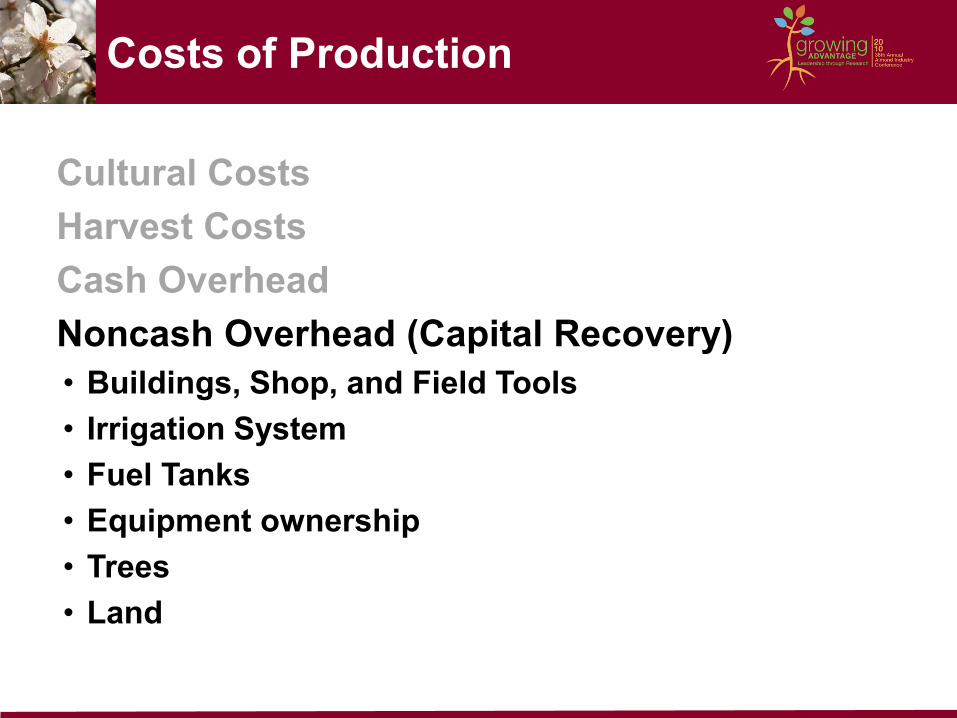
Costs of Production
Cultural Costs
Harvest Costs
Cash Overhead
Noncash Overhead (Capital Recovery)
• Buildings, Shop, and Field Tools
• Irrigation System
• Fuel Tanks
• Equipment ownership
• Trees
• Land
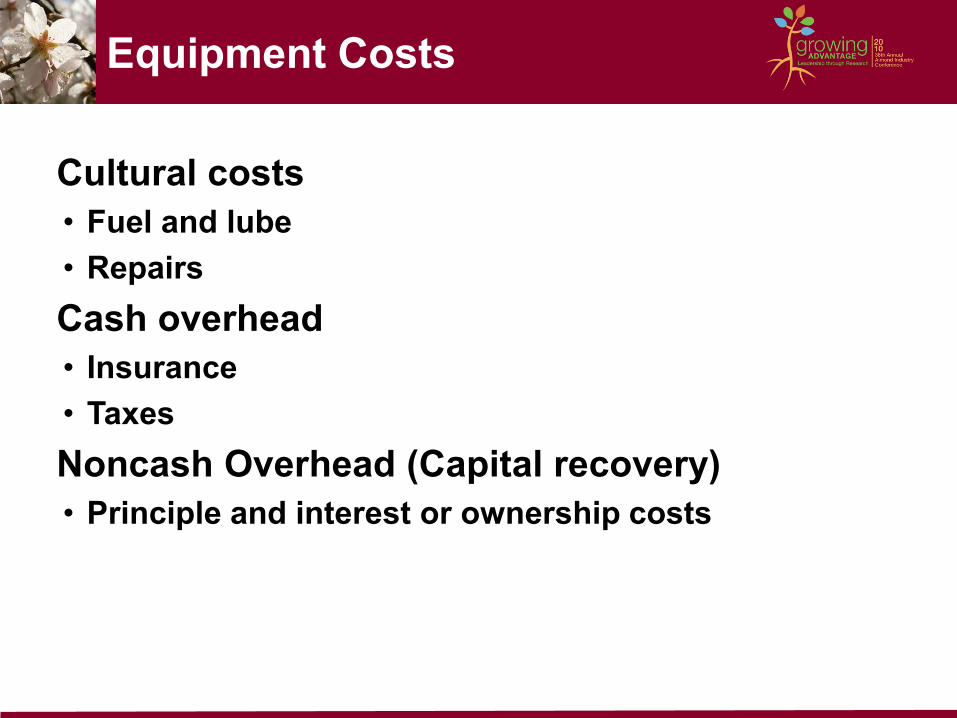
Equipment Costs
Cultural costs
• Fuel and lube
• Repairs
Cash overhead
• Insurance
• Taxes
Noncash Overhead (Capital recovery)
• Principle and interest or ownership costs
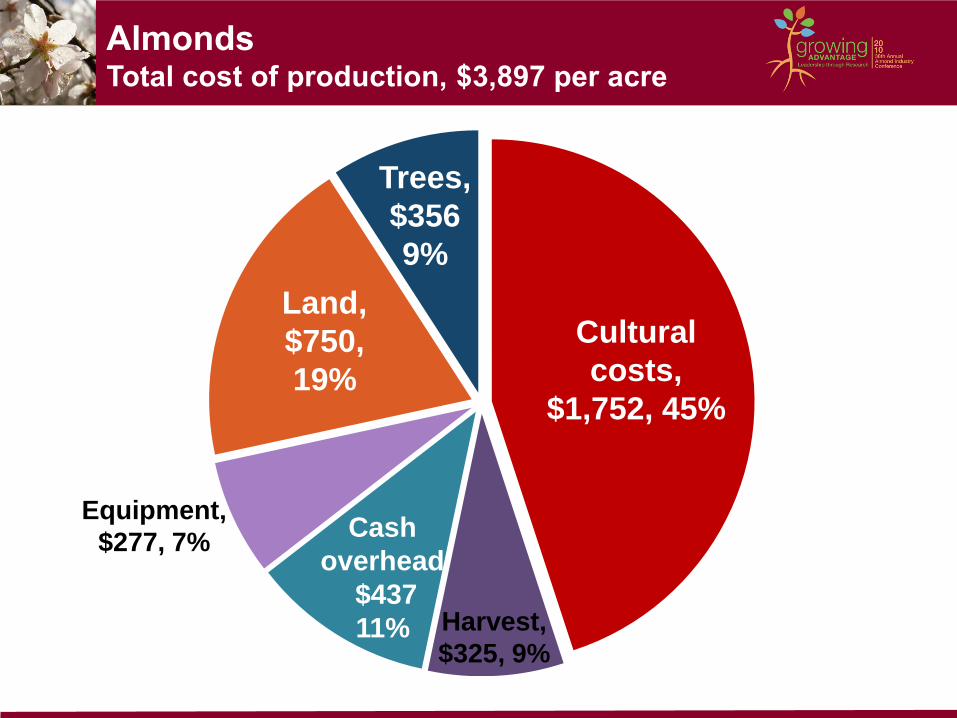
AlmondsTotal cost of production, $3,897 per acre
Cultural
costs,
$1,752, 45%
Land,
$750,
19%
Cash
overhead
$437
11%
Trees,
$356
9%
Harvest,
$325, 9%
Equipment,
$277, 7%
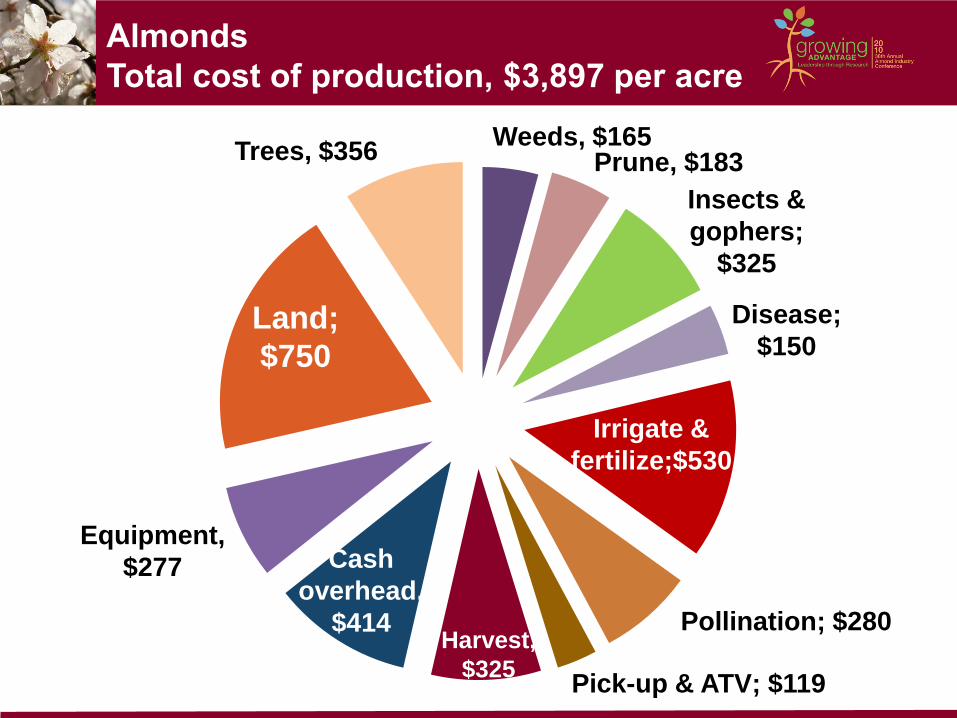
Almonds
Total cost of production, $3,897 per acre
Land;
$750
Irrigate &
fertilize;$530
Cash
overhead,
$414
Equipment,
$277
Trees, $356 Weeds, $165
Prune, $183
Insects &
gophers;
$325
Disease;
$150
Pollination; $280
Pick-up & ATV; $119
Harvest,
$325
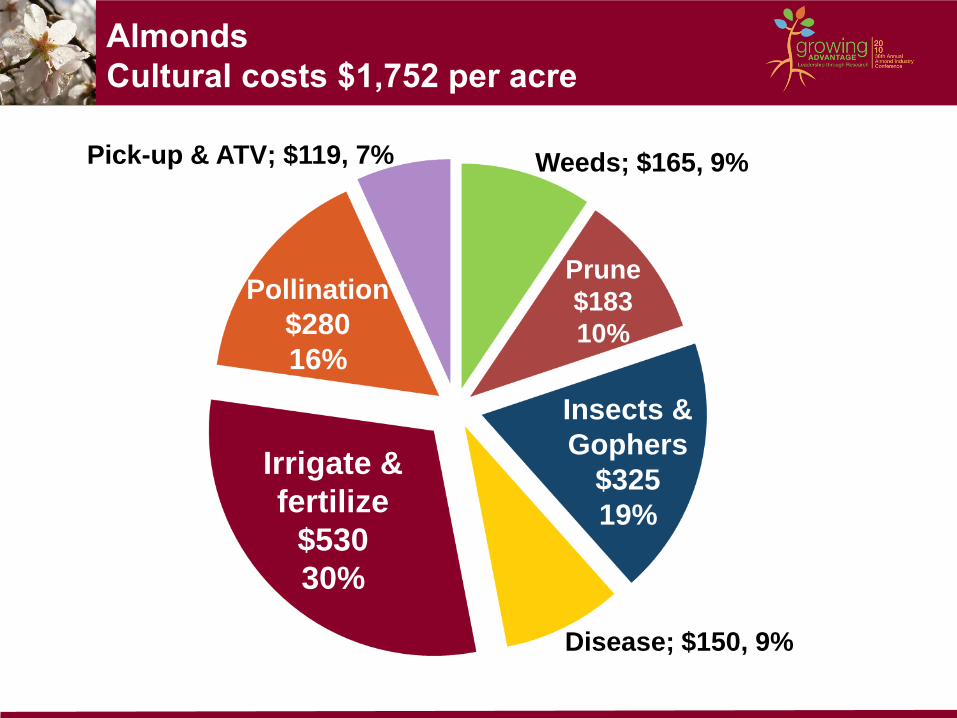
Almonds
Cultural costs $1,752 per acre
Irrigate &
fertilize
$530
30%
Insects &
Gophers
$325
19%
Pollination
$280
16%
Prune
$183
10%
Disease; $150, 9%
Weeds; $165, 9% Pick-up & ATV; $119, 7%
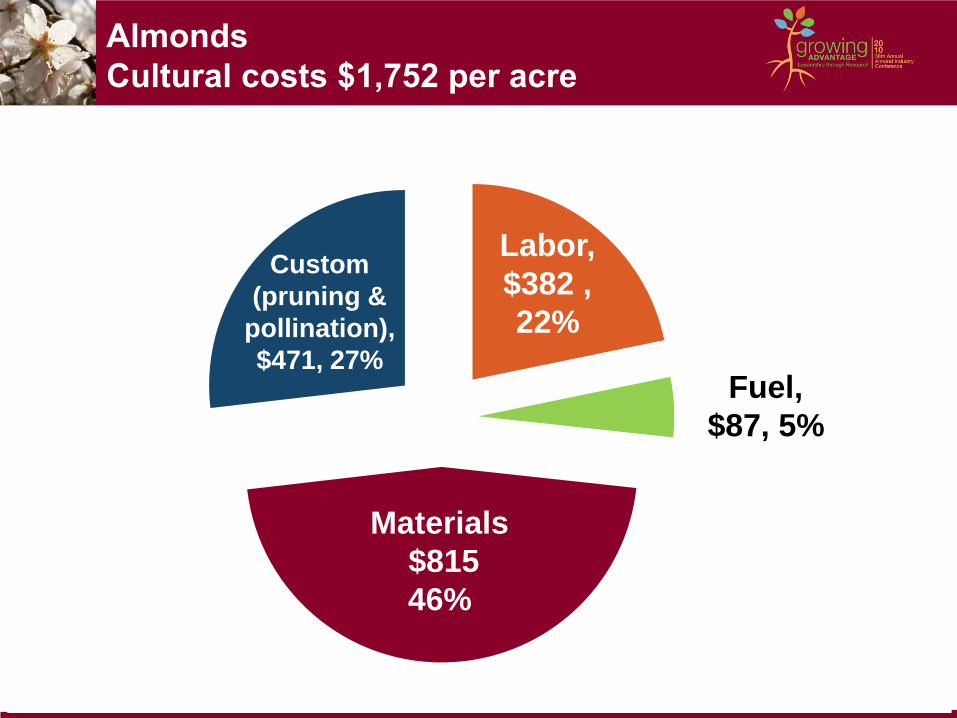
Almonds
Cultural costs $1,752 per acre
Materials
$815
46%
Custom
(pruning &
pollination),
$471, 27%
Labor,
$382 ,
22%
Fuel,
$87, 5%
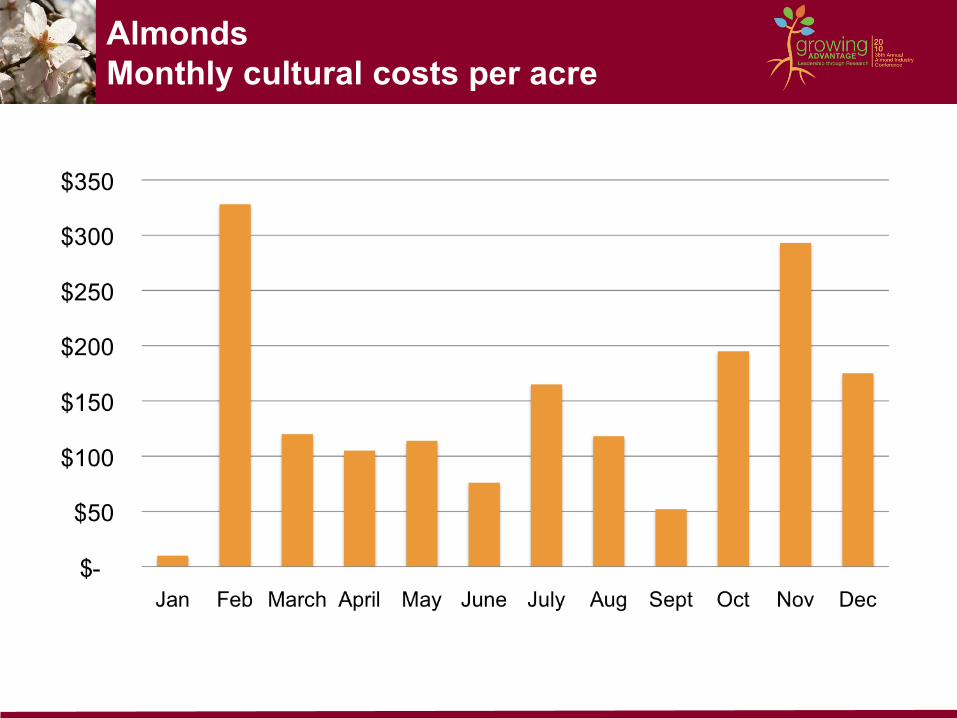
Almonds
Monthly cultural costs per acre
Almonds
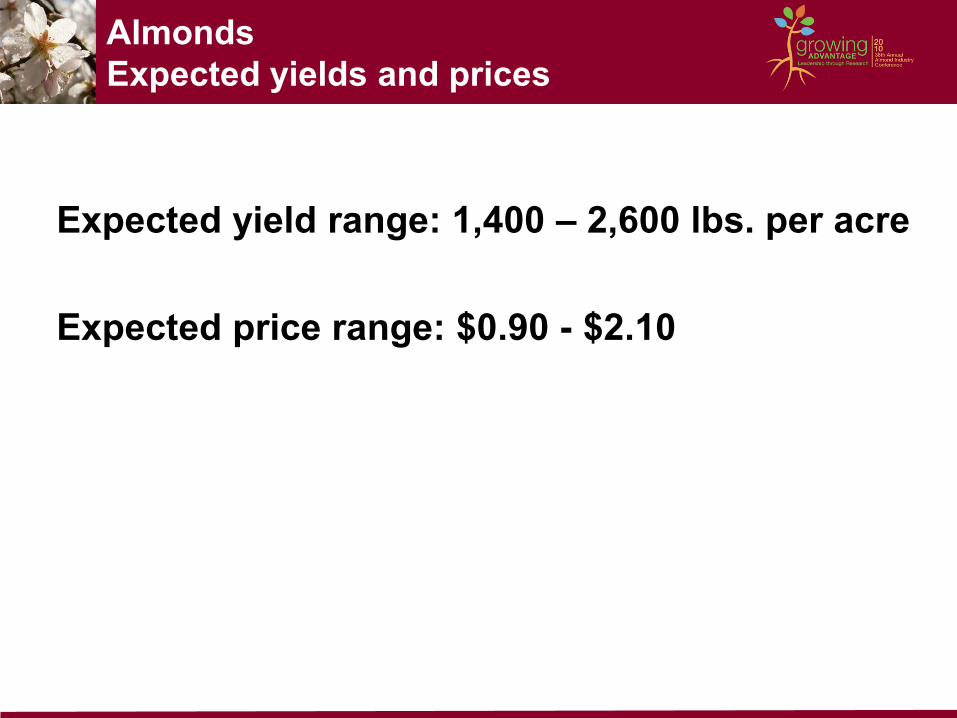
Expected yields and prices
Expected yield range: 1,400 – 2,600 lbs. per acre
Expected price range: $0.90 - $2.10
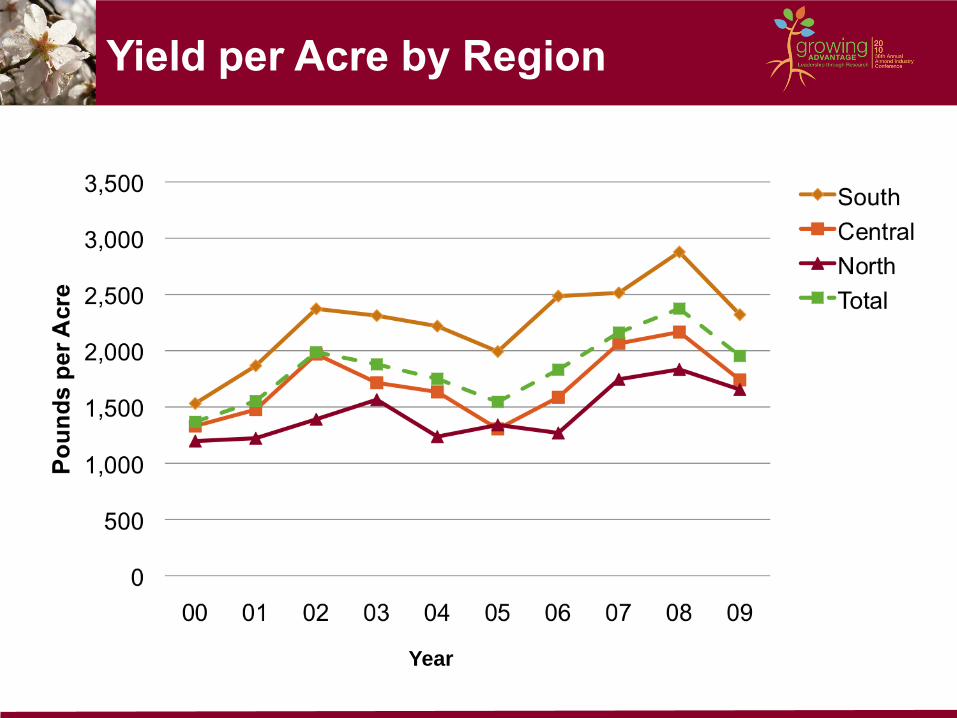
Yield per Acre by Region
Year
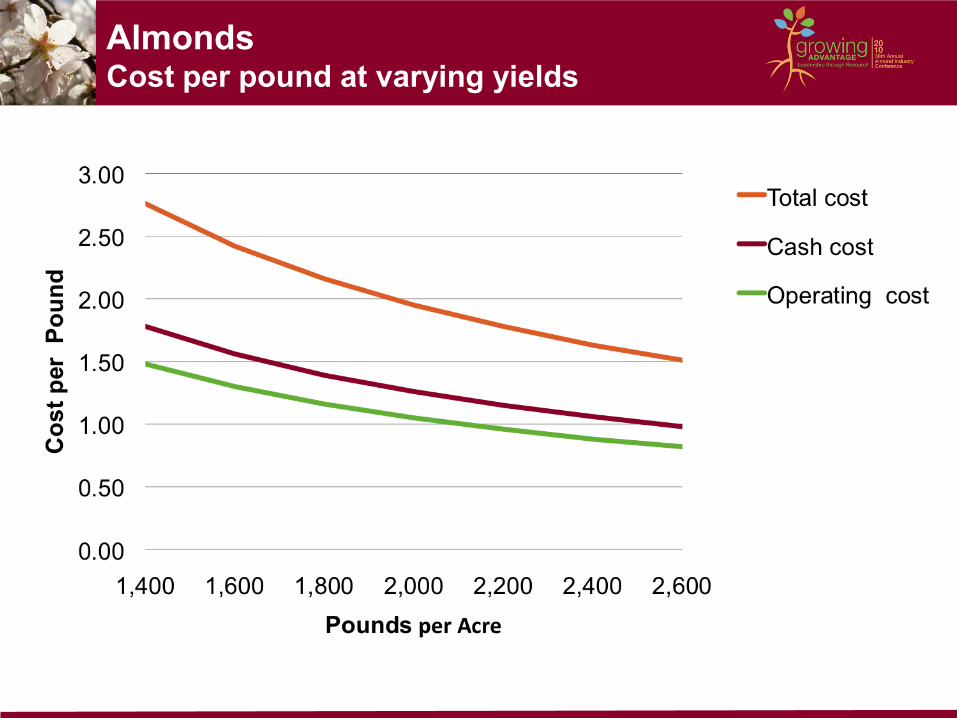
AlmondsCost per pound at varying yields
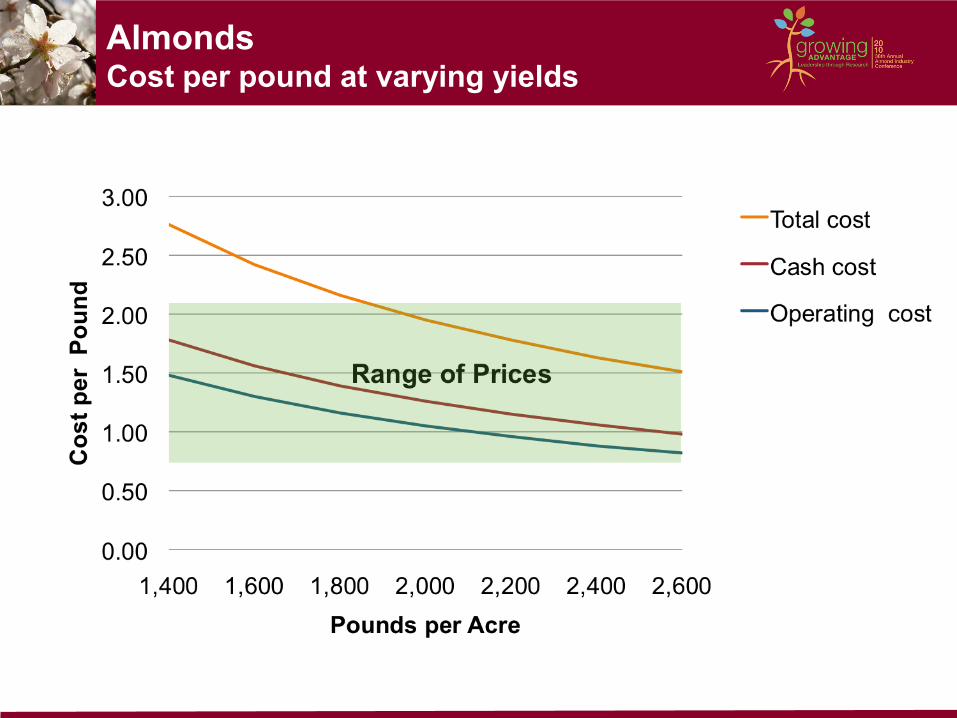
AlmondsCost per pound at varying yields
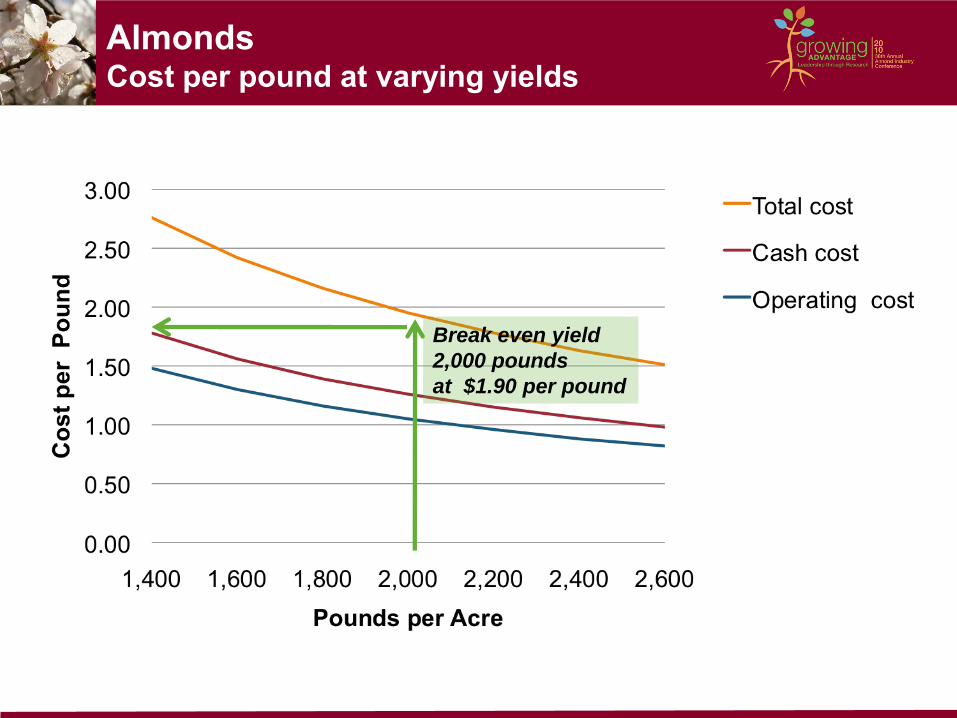
AlmondsCost per pound at varying yields
Break even yield
2,000 pounds
at $1.90 per pound
External Cost Factors
Interest rates
Fertilizer
Fuel
Pesticides
Machinery costs
Tractors and trucks
Labor
Cost of living
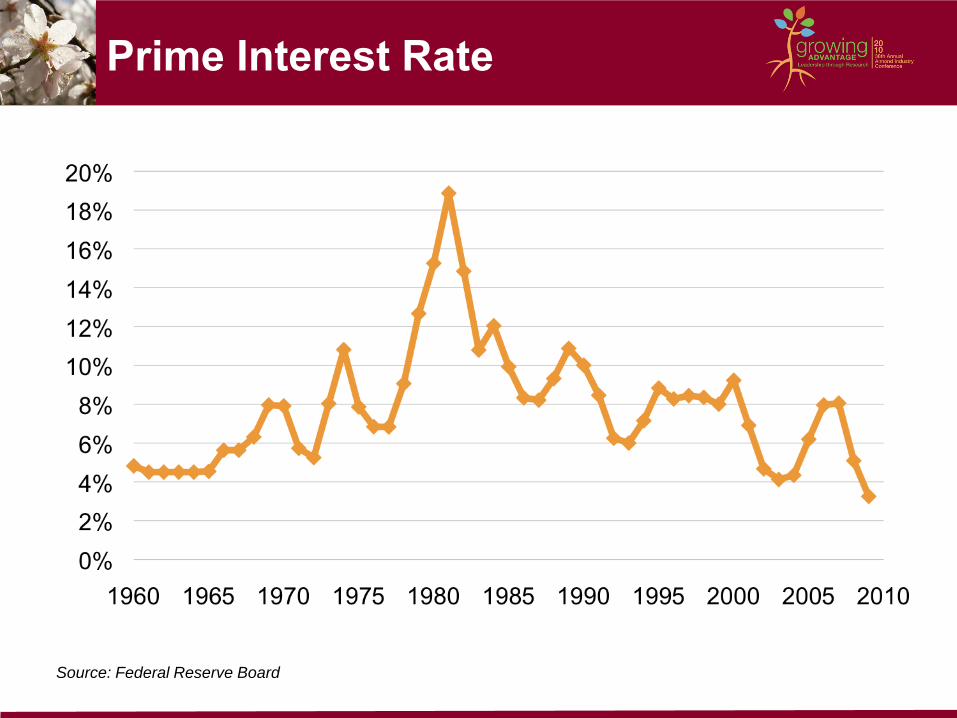
Prime Interest Rate
Source: Federal Reserve Board
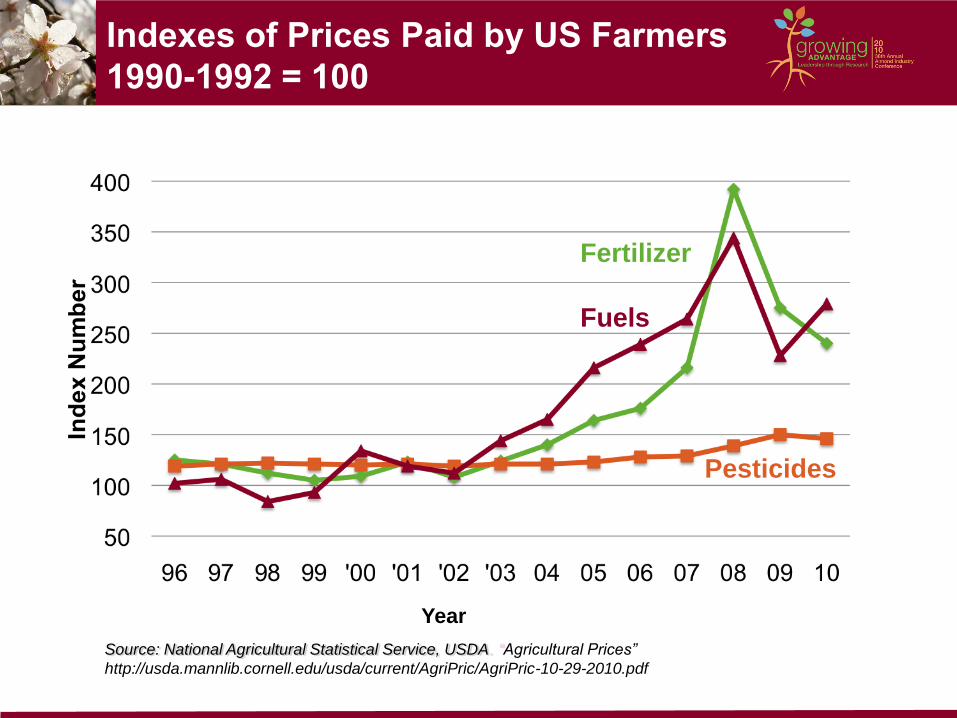
Indexes of Prices Paid by US Farmers
1990-1992 = 100
Pesticides
Fertilizer
Fuels
Source: National Agricultural Statistical Service, USDA. “Agricultural Prices”
http://usda.mannlib.cornell.edu/usda/current/AgriPric/AgriPric-10-29-2010.pdf
Year
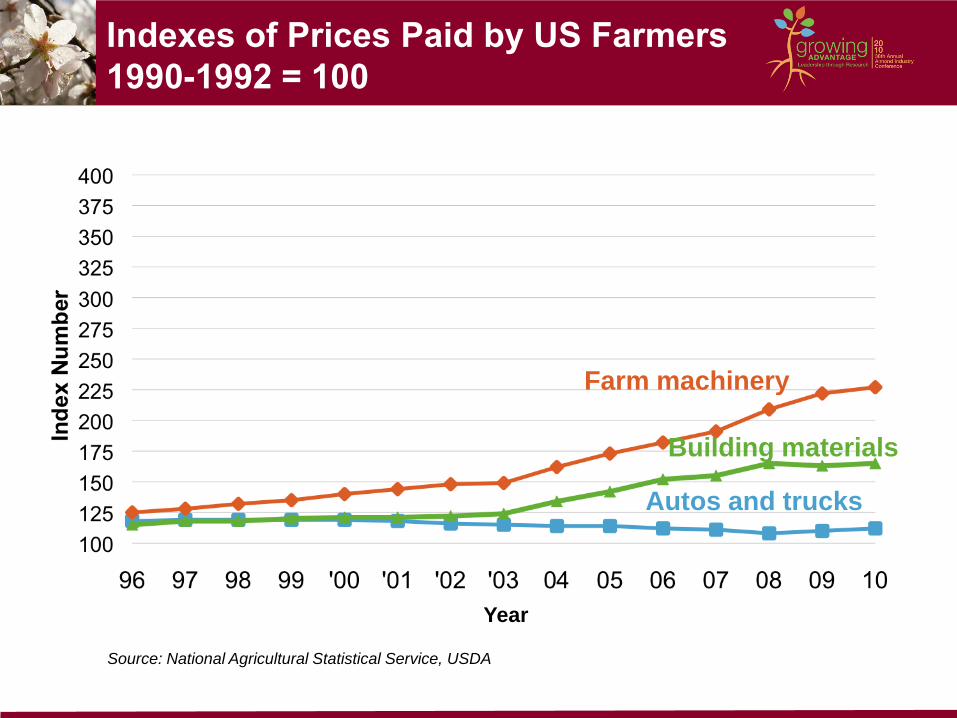
Indexes of Prices Paid by US Farmers
1990-1992 = 100
Farm machinery
Autos and trucks
Building materials
Source: National Agricultural Statistical Service, USDA
Year
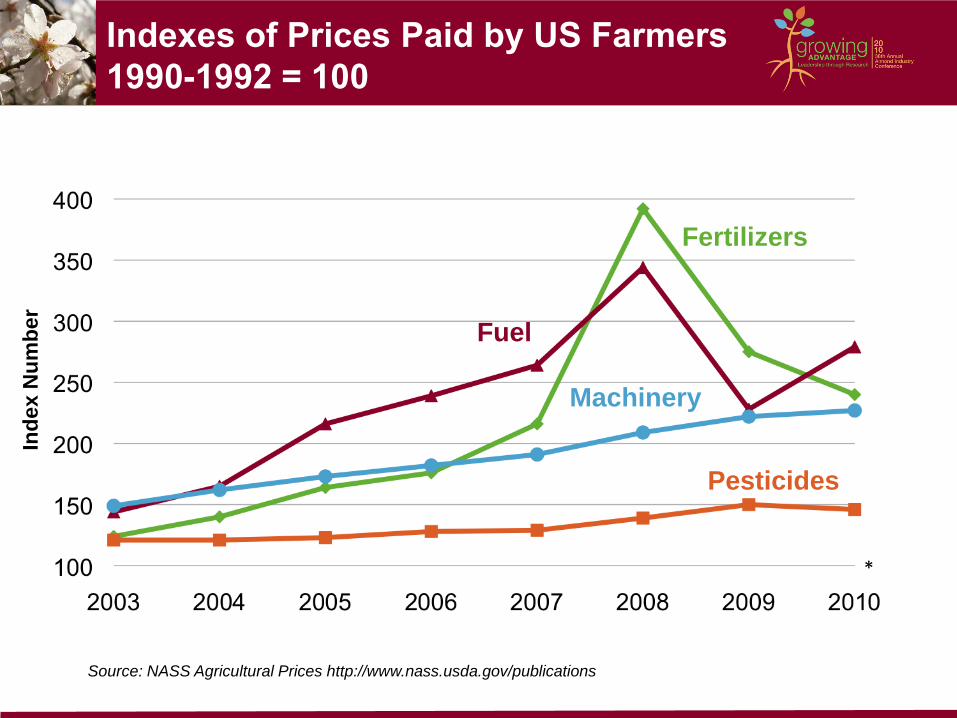
Indexes of Prices Paid by US Farmers
1990-1992 = 100
Fuel
Machinery
Fertilizers
Pesticides
Source: NASS Agricultural Prices http://www.nass.usda.gov/publications
*
Ind
ex N
um
ber
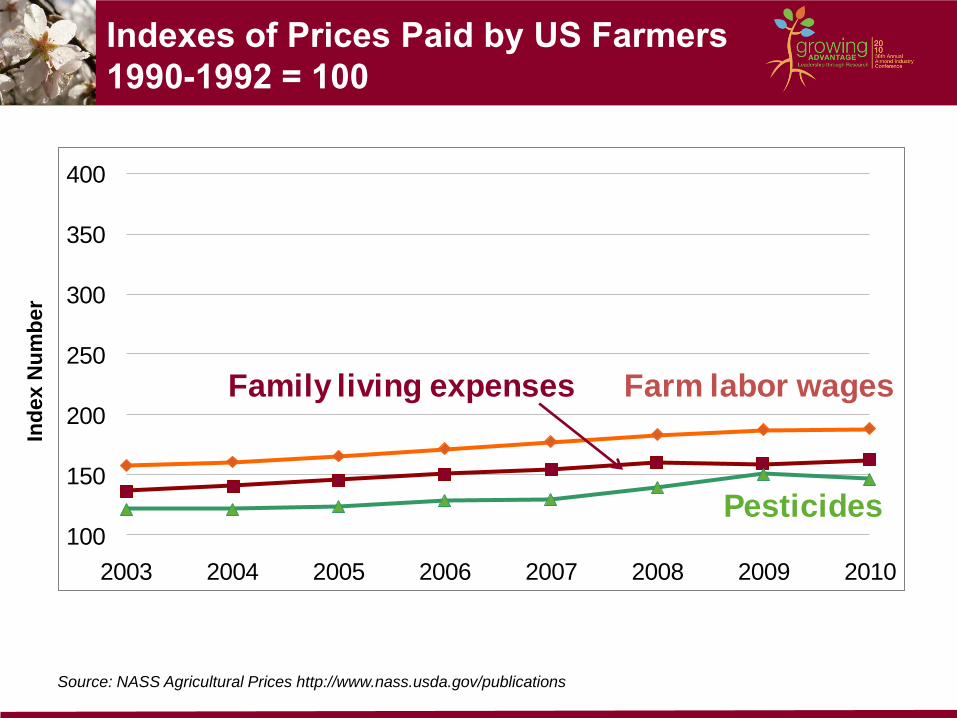
Indexes of Prices Paid by US Farmers
1990-1992 = 100
100
150
200
250
300
350
400
2003 2004 2005 2006 2007 2008 2009 2010
Farm labor wagesFamily living expenses
Pesticides
Source: NASS Agricultural Prices http://www.nass.usda.gov/publications
Ind
ex N
um
ber
Advertisement
http://coststudies.ucdavis.edu

Thank You
The Fundamentals of Selling AlmondsBrian Ezell, Paramount Farms
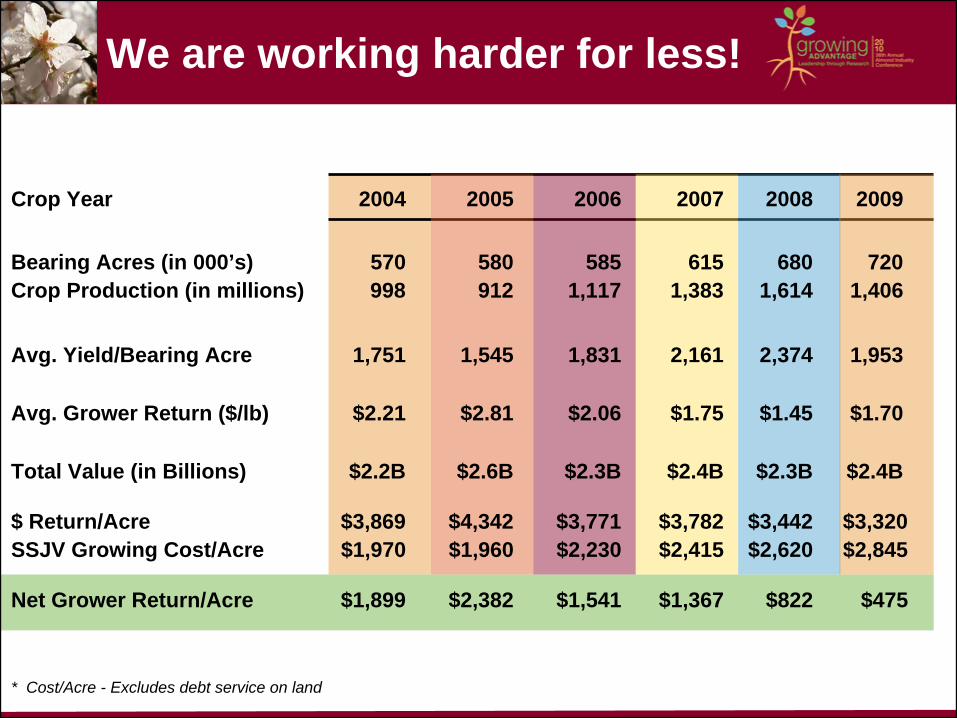
We are working harder for less!
Crop Year 2004 2005 2006 2007 2008 2009
Bearing Acres (in 000’s) 570 580 585 615 680 720Crop Production (in millions) 998 912 1,117 1,383 1,614 1,406
Avg. Yield/Bearing Acre 1,751 1,545 1,831 2,161 2,374 1,953
Avg. Grower Return ($/lb) $2.21 $2.81 $2.06 $1.75 $1.45 $1.70
Total Value (in Billions) $2.2B $2.6B $2.3B $2.4B $2.3B $2.4B
$ Return/Acre $3,869 $4,342 $3,771 $3,782 $3,442 $3,320SSJV Growing Cost/Acre $1,970 $1,960 $2,230 $2,415 $2,620 $2,845
Net Grower Return/Acre $1,899 $2,382 $1,541 $1,367 $822 $475
* Cost/Acre - Excludes debt service on land
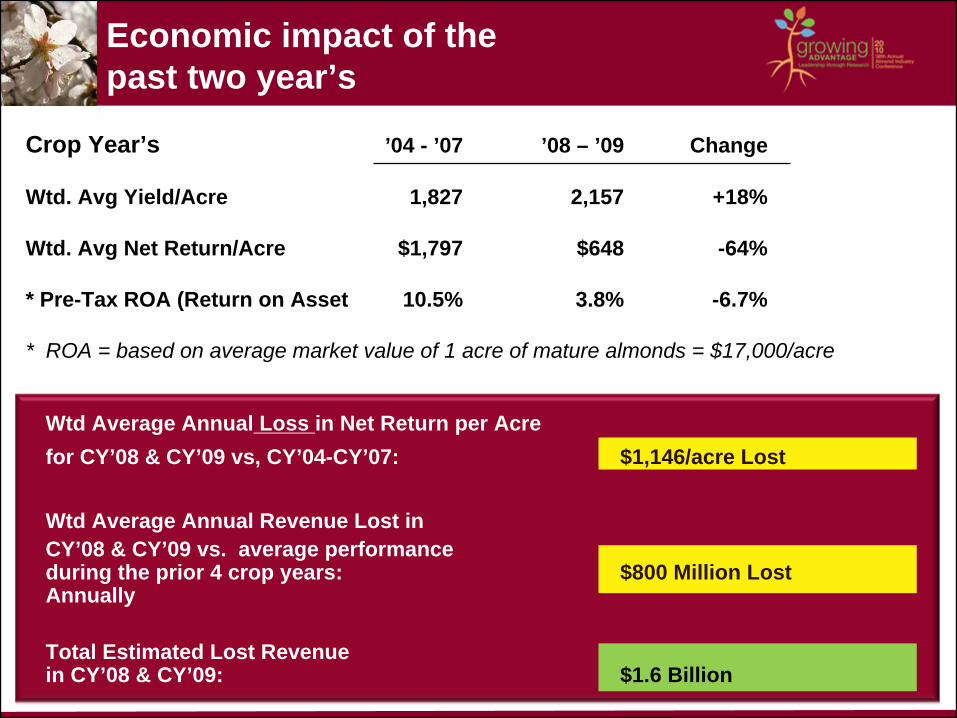
Economic impact of the past two year’s
Crop Year’s ’04 - ’07 ’08 – ’09 Change
Wtd. Avg Yield/Acre 1,827 2,157 +18%
Wtd. Avg Net Return/Acre $1,797 $648 -64%
* Pre-Tax ROA (Return on Asset 10.5% 3.8% -6.7%
* ROA = based on average market value of 1 acre of mature almonds = $17,000/acre
Wtd Average Annual Loss in Net Return per Acre for CY’08 & CY’09 vs, CY’04-CY’07: $1,146/acre Lost
Wtd Average Annual Revenue Lost in CY’08 & CY’09 vs. average performance during the prior 4 crop years: $800 Million Lost Annually
Total Estimated Lost Revenue in CY’08 & CY’09: $1.6 Billion
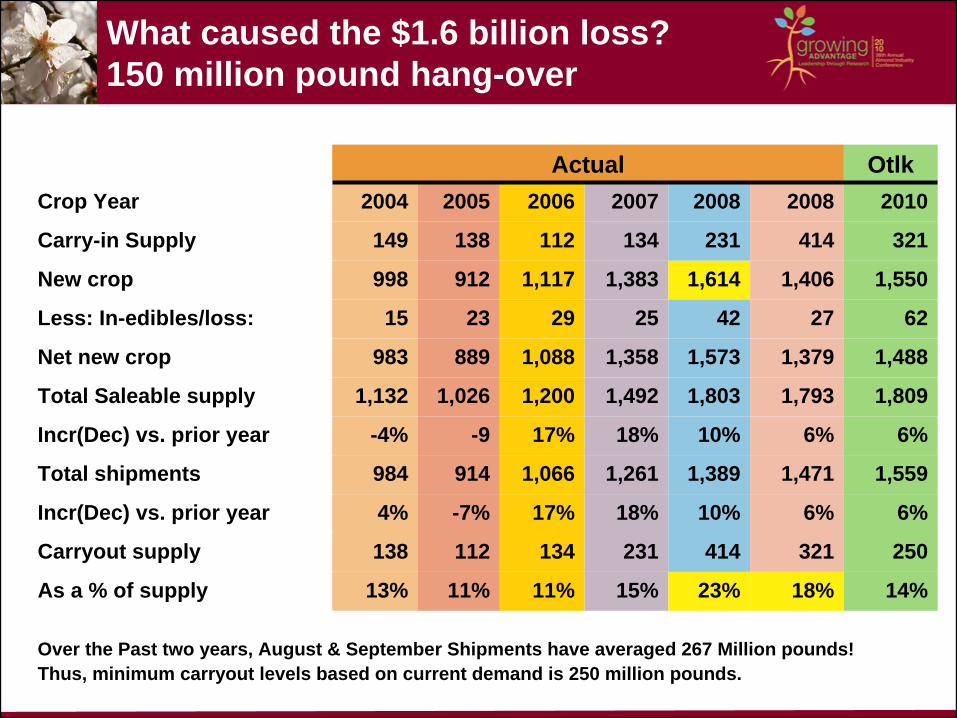
Actual OtlkCrop Year 2004 2005 2006 2007 2008 2008 2010
Carry-in Supply 149 138 112 134 231 414 321
New crop 998 912 1,117 1,383 1,614 1,406 1,550
Less: In-edibles/loss: 15 23 29 25 42 27 62
Net new crop 983 889 1,088 1,358 1,573 1,379 1,488
Total Saleable supply 1,132 1,026 1,200 1,492 1,803 1,793 1,809
Incr(Dec) vs. prior year -4% -9 17% 18% 10% 6% 6%
Total shipments 984 914 1,066 1,261 1,389 1,471 1,559
Incr(Dec) vs. prior year 4% -7% 17% 18% 10% 6% 6%
Carryout supply 138 112 134 231 414 321 250
As a % of supply 13% 11% 11% 15% 23% 18% 14%
What caused the $1.6 billion loss? 150 million pound hang-over
Over the Past two years, August & September Shipments have averaged 267 Million pounds!Thus, minimum carryout levels based on current demand is 250 million pounds.
What Caused the Revenue Loss in ’08 &’09? A review of what happened during this period.
• Review Supply and Demand History Chart. Was it the record crop we saw in 2008 of 1.6 billion pounds? Not really, but it did play a factor. This record crop gave us a 300 million pound increase in total Saleable Supply. However, in 2007, we had a similar jump in total saleable supply from the 2006 year (almost 300 million) yet we managed to keep the price of standards above $1.90/lb on average. In 2006, we saw a 186 million pound increase in total saleable supply yet managed to keep an average price of standards above $2.35/lb.
• So What was the cause of falling prices? It was the Industry’s lack of willingness to carryout an extra 150 million pounds into CY’09 and the lack of discipline to market our crop based on the basic fundamentals of selling almonds. In short, we lost perspective on the value of almonds!
• Instead of resolving to carryout the excess supply produced by the 2008 bumper crop, the industry decided to try to sell and ship it all out during that crop year. How quickly we forgot that based on historical production, big crops have a tendency to be offset by following smaller crop or visa versa.
• In order to move this excess volume, the industry decided to use lower prices as a lever to increase sales. Bad mistake!
• Starting with an average price of Std 5’s at $1.70/lb (the lowest price since October 2003), sellers continued to try to increase demand with continued price decreases until prices bottomed in February 2009 at $1.00 (when growers finally drew a line in the sand in terms of minimum acceptable grower return).
What Caused the Revenue Loss in ’08 &’09? A review of what happened during this period.
• The strategy failed miserably. During the heaviest shipment period of the year (Aug-Jan), a 6 month period, shipments actually declined by -0.05% vs. the same period in CY’07 despite the falling prices. During this time period in CY’07 when the average price of Std 5’s was stable at around $2.00/lb, demand grew by 14.3% vs. the same period in CY’06.
• Why didn’t lower pricing work? Simple, we lost buyer confidence. Buyer’s don’t like pricing risk. In fact they hate it. So lowering prices below reasonable levels (below $2.00/lb) has just the opposite affect of what you would think. Instead of increasing demand, is kills demand!
• The result was we lowered prices far below the cost of production for nothing as we ended up carrying out the 150 million excess pounds we so desired to move (carryout ended up 414 million pounds). Once prices bottomed out in February at $1.00/lb for Std 5’s, buyers saw no risk in buying almonds (only upside) and demand from Feb-July jumped 23% over the same period in CY’07. But the damage was already done and we ended up with only a 10.3% increase over the prior. This verses an average increase in demand the prior two crop years of 17.5%. During these crop years, the price of Std 5’s sold for an average of $2.35/lb (CY’06) and $1.90/lb (CY’07).
• The end result was an average grower return for all almonds of $1.45/lb and $800 million of lost value vs. the average return during the prior 4 crop years. And Tragically, the 150 million excess pounds we so wanted to move was still sitting in our inventory as of the start of the 2009 crop year.
What Caused the Revenue Loss in ’08 &’09? A review of what happened during this period.
• They say that those who do not remember history are bound to repeat it. Well despite the recent events of the 2008 marketing year, instead of learning from this tragic experience, California Sellers seemed determined to repeat the failed strategy once again.
• The failed “low price = big demand” strategy executed during the 2008 CY along with excess carryout inventory had a “Hang-over” affect on the 2009 crop year. Despite increasing demand in the back half of the 2008 CY (+23% growth), our industry failed to increase pricing from the $1.00/lb level for Std 5’s until the Objective estimate came out in late June of 2009. By the end of August 2009, 500 million pounds of Carryout & new crop had been sold during this period when price of Std 5’s averaged less than $1.10/lb (with other almonds selling at normal spreads). Why didn’t prices increase during this heavy demand period? Emotions overcame fundamentals as the speculative trade talk of a potential 1.7 billion pound of new crop production played against the fears of growers and sellers who were already distracted by the large carryover from CY’08. In the end, these fears were unfounded since the actual size of the 2009 crop was 1.4 billion pounds (300 million less than “threat” and 200 million less than the actual size of the 2008 crop).
• In September of 2009, is appeared the industry had learned from its mistakes of the past year and prices began to move up slowly from Sept – Nov when Std 5 prices reached $1.65/lb during a shipment pace of 12.1% vs. the prior year (Aug – Nov). By January, our shipment pace was up 21% over the prior year and prices had increased by another $0.70/lb to a level of $2.35/lb for Std 5’s.
What Caused the Revenue Loss in ’08 &’09? A review of what happened during this period.
• But then a tragic event took place. Despite the 21% YTD growth in shipments and despite the impending El Nino conditions predicted for the 2010 Bloom, our Industry again began to drop prices, once again emotionally succumbing to speculative “trade” talk of now a possible 1.8 billion pounds of potential production to market the coming year along with a carryover of 300 million pounds. The result was a repeated monthly price drop from the $2.35/lb price for Std 5’s established in January and ending with a Std 5 price level of $1.40/lb by the time the Objective Estimate was released in July 2010. We now the 2010 crop is no where close to 1.8 billion and in fact, due to the lower than forecasted Nonpareil yields and the devastating impact of the continual rains in October and November of 2010, we are now looking at a crop of 1.55 billion pounds (best case) and more than likely, a net crop below 1.5 billion pounds due to the increased rejects from mold and internal damage.
• So what did the $0.95/lb drop in pricing achieve? A shipment pace reduction of -9.1% and a final shipment performance for the year of 5.9% above the 2008 CY levels. This was the lowest % increase in shipments seen since the supply constrained 2005 crop year. In addition, another $800 million of lost revenue vanished from the growers pockets vs. the average value/acre seen in the 2004-2007 crop years. Why? Again, the price drop lost buyer confidence, as they waited to see if we would return once again to $1.00/lb Std 5 pricing.
• The lesson hopefully learned. Buyers value price stability much more than they value lower prices, especially prices below the cost of production. Dropping prices below reasonable levels only kills demand and in the end results in significant un-necessary loss of income to the growers who work so hard and risk so much to grow this specialty crop.
What Caused the Revenue Loss in ’08 &’09? A review of what happened during this period.
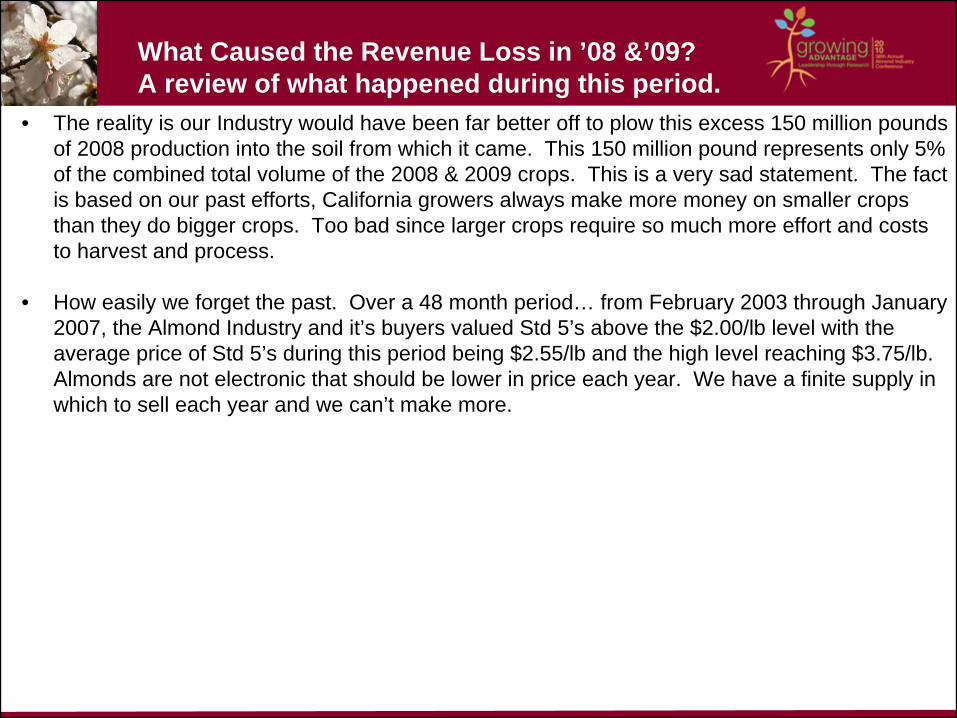
• The reality is our Industry would have been far better off to plow this excess 150 million pounds of 2008 production into the soil from which it came. This 150 million pound represents only 5% of the combined total volume of the 2008 & 2009 crops. This is a very sad statement. The fact is based on our past efforts, California growers always make more money on smaller crops than they do bigger crops. Too bad since larger crops require so much more effort and costs to harvest and process.
• How easily we forget the past. Over a 48 month period… from February 2003 through January 2007, the Almond Industry and it’s buyers valued Std 5’s above the $2.00/lb level with the average price of Std 5’s during this period being $2.55/lb and the high level reaching $3.75/lb. Almonds are not electronic that should be lower in price each year. We have a finite supply in which to sell each year and we can’t make more.
Factors That Did Not Cause The Revenue Loss in ’08 &’09.
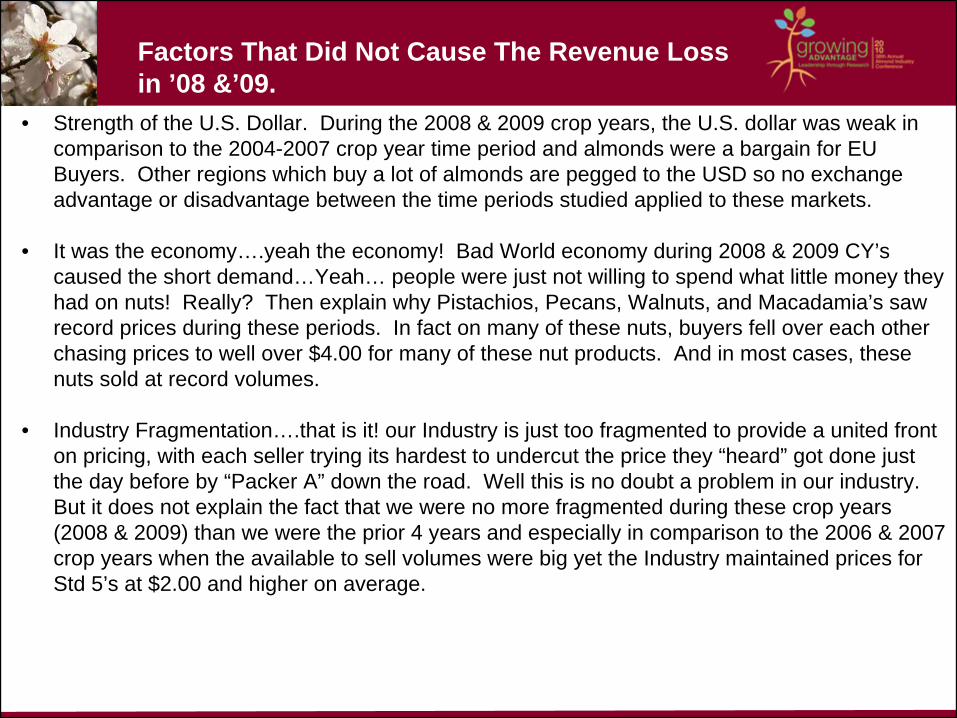
• Strength of the U.S. Dollar. During the 2008 & 2009 crop years, the U.S. dollar was weak in comparison to the 2004-2007 crop year time period and almonds were a bargain for EU Buyers. Other regions which buy a lot of almonds are pegged to the USD so no exchange advantage or disadvantage between the time periods studied applied to these markets.
• It was the economy….yeah the economy! Bad World economy during 2008 & 2009 CY’s caused the short demand…Yeah… people were just not willing to spend what little money they had on nuts! Really? Then explain why Pistachios, Pecans, Walnuts, and Macadamia’s saw record prices during these periods. In fact on many of these nuts, buyers fell over each other chasing prices to well over $4.00 for many of these nut products. And in most cases, these nuts sold at record volumes.
• Industry Fragmentation….that is it! our Industry is just too fragmented to provide a united front on pricing, with each seller trying its hardest to undercut the price they “heard” got done just the day before by “Packer A” down the road. Well this is no doubt a problem in our industry. But it does not explain the fact that we were no more fragmented during these crop years (2008 & 2009) than we were the prior 4 years and especially in comparison to the 2006 & 2007 crop years when the available to sell volumes were big yet the Industry maintained prices for Std 5’s at $2.00 and higher on average.
Still not a Believer in the 150 million pound Hangover Theory?.
• On the next slide, just for a visual, I took 150 million pounds out of the 2008 crop volume and let the numbers re-calculate based on actual 2008 demand, actual 2009 supply and demand, and outlook supply and demand volume for 2010 & 2011.
• How differently would we have priced our almond crops the past two years and currently had this been the picture? What would pricing be today? Think about it!
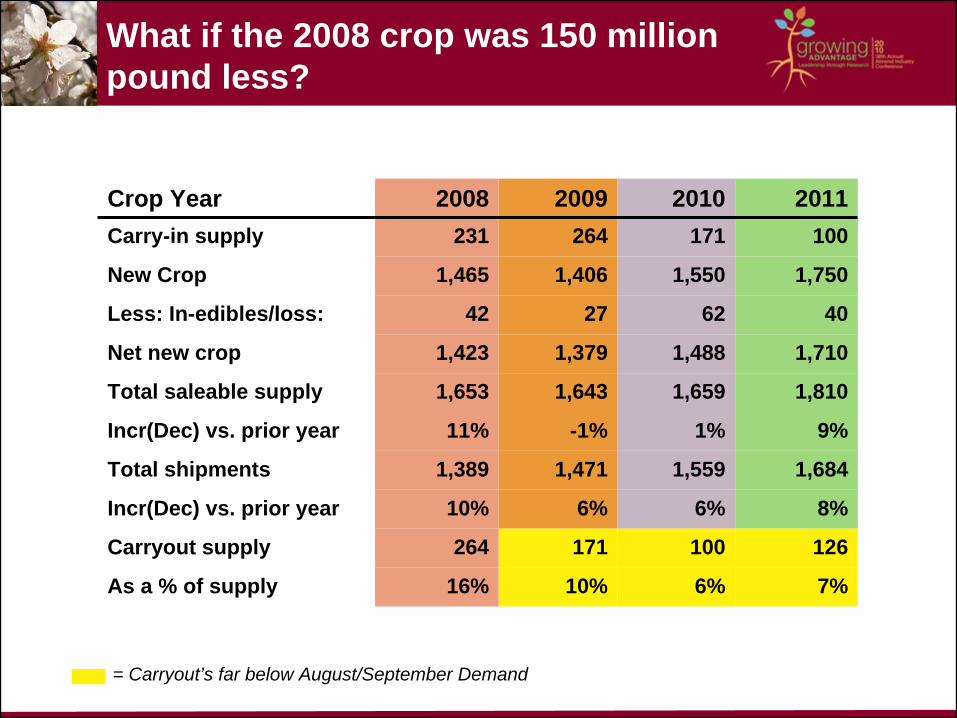
What if the 2008 crop was 150 million pound less?
= Carryout’s far below August/September Demand
Crop Year 2008 2009 2010 2011Carry-in supply 231 264 171 100
New Crop 1,465 1,406 1,550 1,750
Less: In-edibles/loss: 42 27 62 40
Net new crop 1,423 1,379 1,488 1,710
Total saleable supply 1,653 1,643 1,659 1,810
Incr(Dec) vs. prior year 11% -1% 1% 9%
Total shipments 1,389 1,471 1,559 1,684
Incr(Dec) vs. prior year 10% 6% 6% 8%
Carryout supply 264 171 100 126
As a % of supply 16% 10% 6% 7%
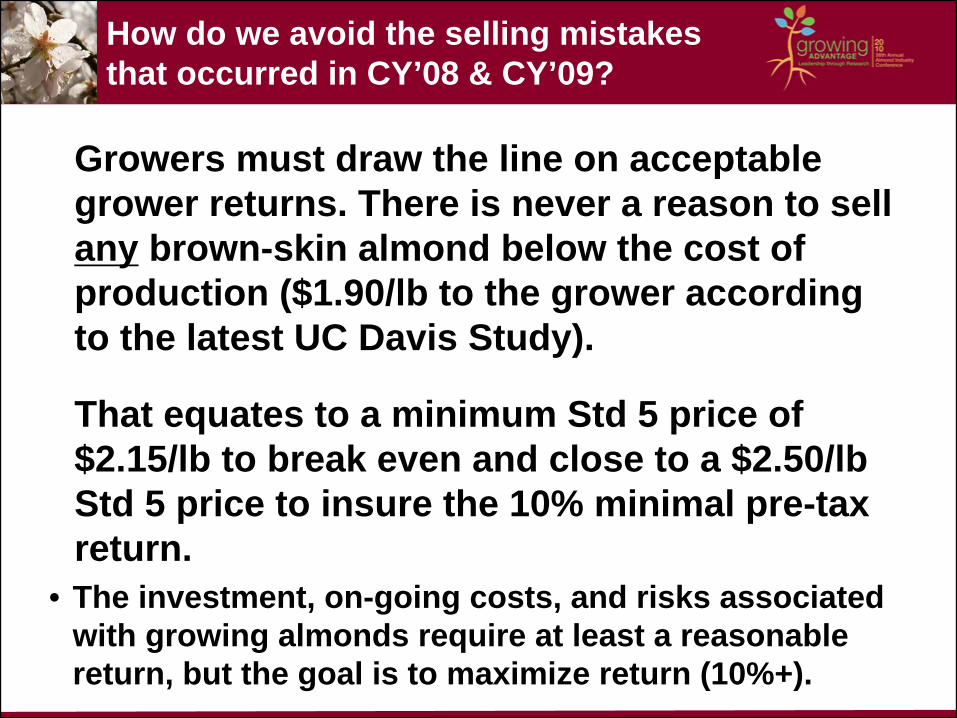
How do we avoid the selling mistakes that occurred in CY’08 & CY’09?
Growers must draw the line on acceptable grower returns. There is never a reason to sell any brown-skin almond below the cost of production ($1.90/lb to the grower according to the latest UC Davis Study).
That equates to a minimum Std 5 price of $2.15/lb to break even and close to a $2.50/lb Std 5 price to insure the 10% minimal pre-tax return.
• The investment, on-going costs, and risks associated with growing almonds require at least a reasonable return, but the goal is to maximize return (10%+).
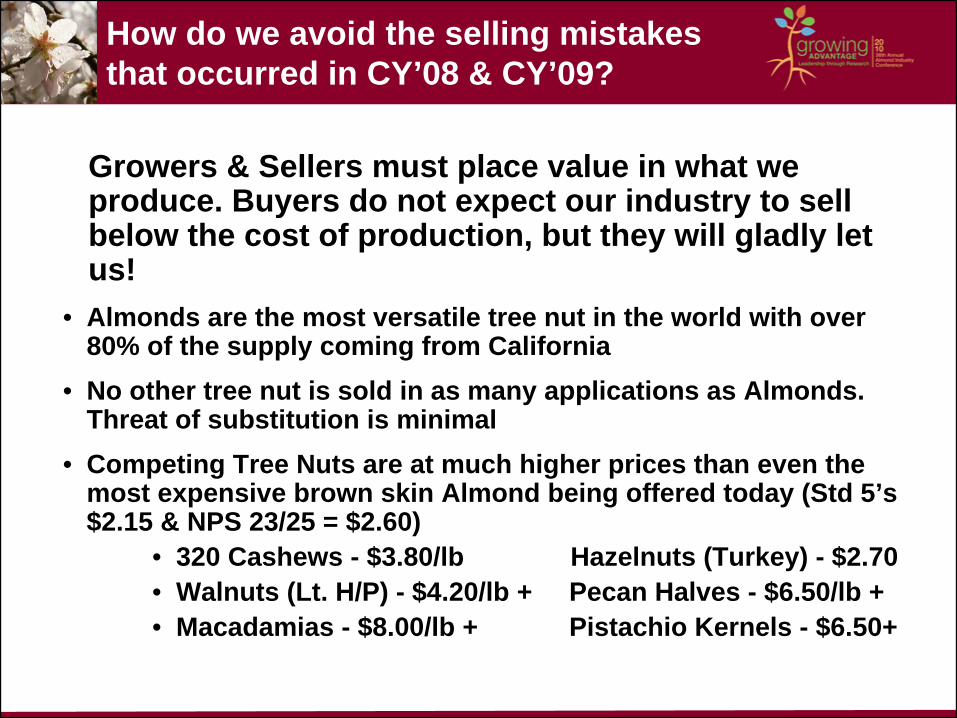
How do we avoid the selling mistakes that occurred in CY’08 & CY’09?
Growers & Sellers must place value in what we produce. Buyers do not expect our industry to sell below the cost of production, but they will gladly let us!
• Almonds are the most versatile tree nut in the world with over 80% of the supply coming from California
• No other tree nut is sold in as many applications as Almonds. Threat of substitution is minimal
• Competing Tree Nuts are at much higher prices than even the most expensive brown skin Almond being offered today (Std 5’s $2.15 & NPS 23/25 = $2.60)
• 320 Cashews - $3.80/lb Hazelnuts (Turkey) - $2.70• Walnuts (Lt. H/P) - $4.20/lb + Pecan Halves - $6.50/lb +• Macadamias - $8.00/lb + Pistachio Kernels - $6.50+
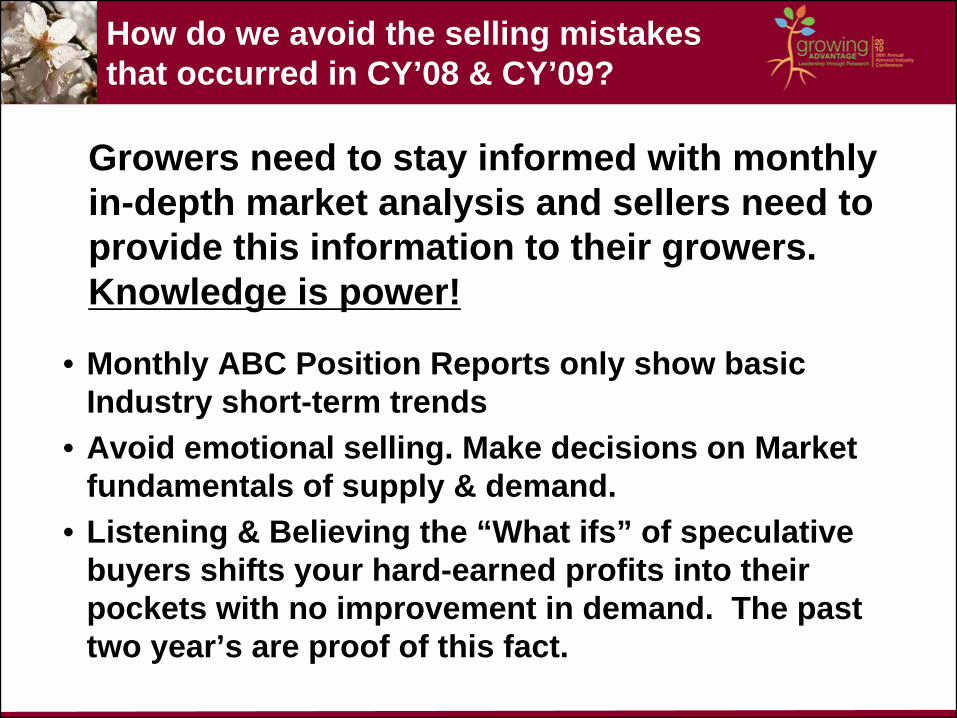
How do we avoid the selling mistakes that occurred in CY’08 & CY’09?
Growers need to stay informed with monthly in-depth market analysis and sellers need to provide this information to their growers. Knowledge is power!
• Monthly ABC Position Reports only show basic Industry short-term trends
• Avoid emotional selling. Make decisions on Market fundamentals of supply & demand.
• Listening & Believing the “What ifs” of speculative buyers shifts your hard-earned profits into their pockets with no improvement in demand. The past two year’s are proof of this fact.
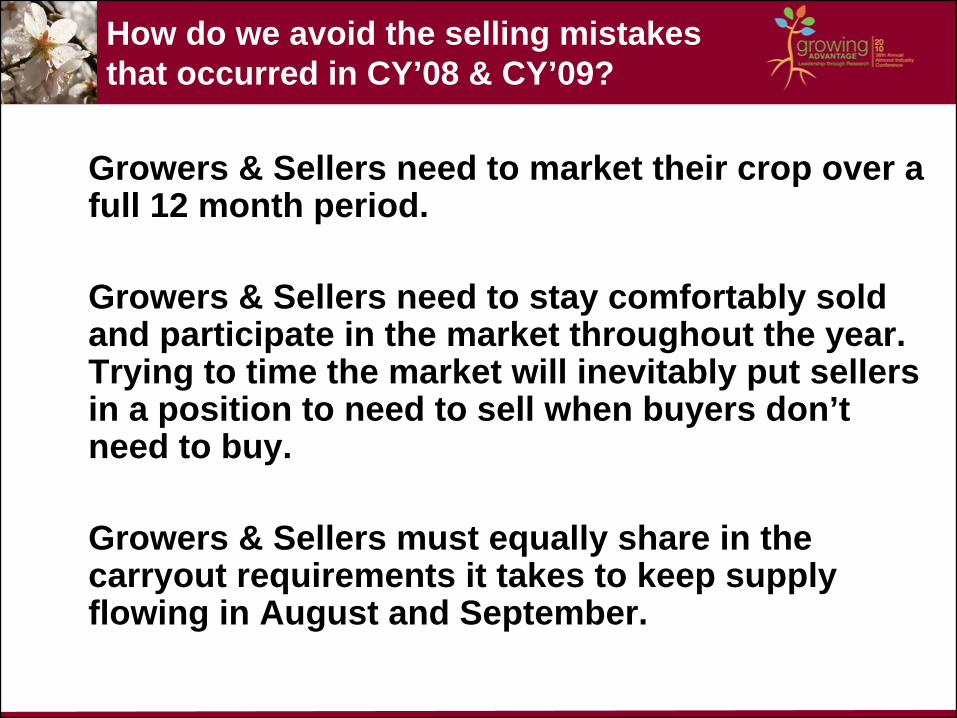
How do we avoid the selling mistakes that occurred in CY’08 & CY’09?
Growers & Sellers need to market their crop over a full 12 month period.
Growers & Sellers need to stay comfortably sold and participate in the market throughout the year. Trying to time the market will inevitably put sellers in a position to need to sell when buyers don’t need to buy.
Growers & Sellers must equally share in the carryout requirements it takes to keep supply flowing in August and September.
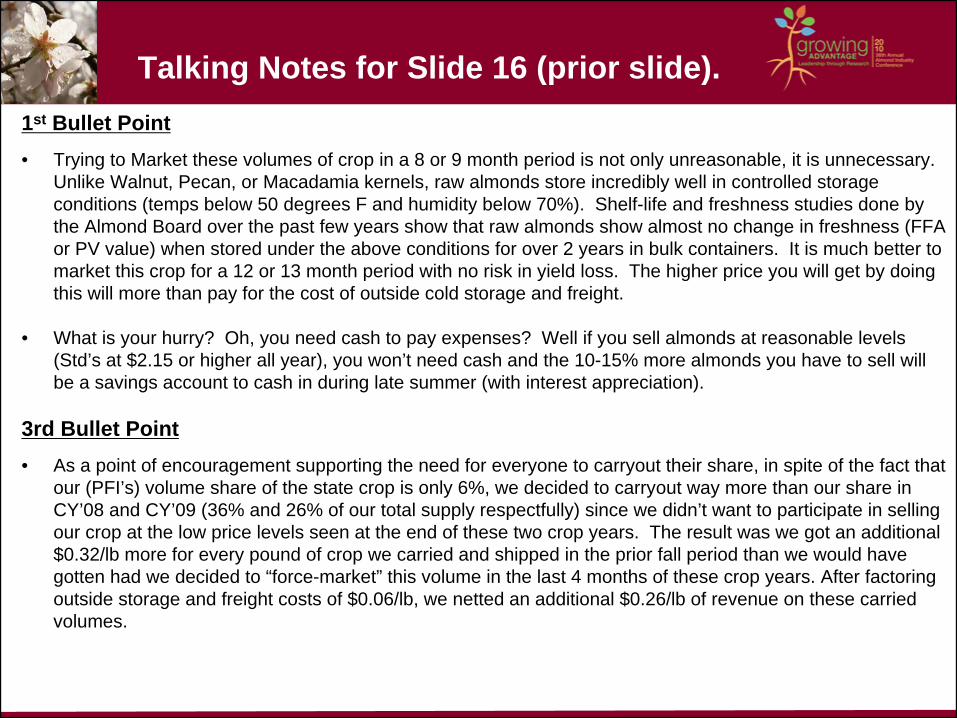
Talking Notes for Slide 16 (prior slide).1st Bullet Point• Trying to Market these volumes of crop in a 8 or 9 month period is not only unreasonable, it is unnecessary.
Unlike Walnut, Pecan, or Macadamia kernels, raw almonds store incredibly well in controlled storage conditions (temps below 50 degrees F and humidity below 70%). Shelf-life and freshness studies done by the Almond Board over the past few years show that raw almonds show almost no change in freshness (FFA or PV value) when stored under the above conditions for over 2 years in bulk containers. It is much better to market this crop for a 12 or 13 month period with no risk in yield loss. The higher price you will get by doing this will more than pay for the cost of outside cold storage and freight.
• What is your hurry? Oh, you need cash to pay expenses? Well if you sell almonds at reasonable levels (Std’s at $2.15 or higher all year), you won’t need cash and the 10-15% more almonds you have to sell will be a savings account to cash in during late summer (with interest appreciation).
3rd Bullet Point• As a point of encouragement supporting the need for everyone to carryout their share, in spite of the fact that
our (PFI’s) volume share of the state crop is only 6%, we decided to carryout way more than our share in CY’08 and CY’09 (36% and 26% of our total supply respectfully) since we didn’t want to participate in selling our crop at the low price levels seen at the end of these two crop years. The result was we got an additional $0.32/lb more for every pound of crop we carried and shipped in the prior fall period than we would have gotten had we decided to “force-market” this volume in the last 4 months of these crop years. After factoring outside storage and freight costs of $0.06/lb, we netted an additional $0.26/lb of revenue on these carried volumes.
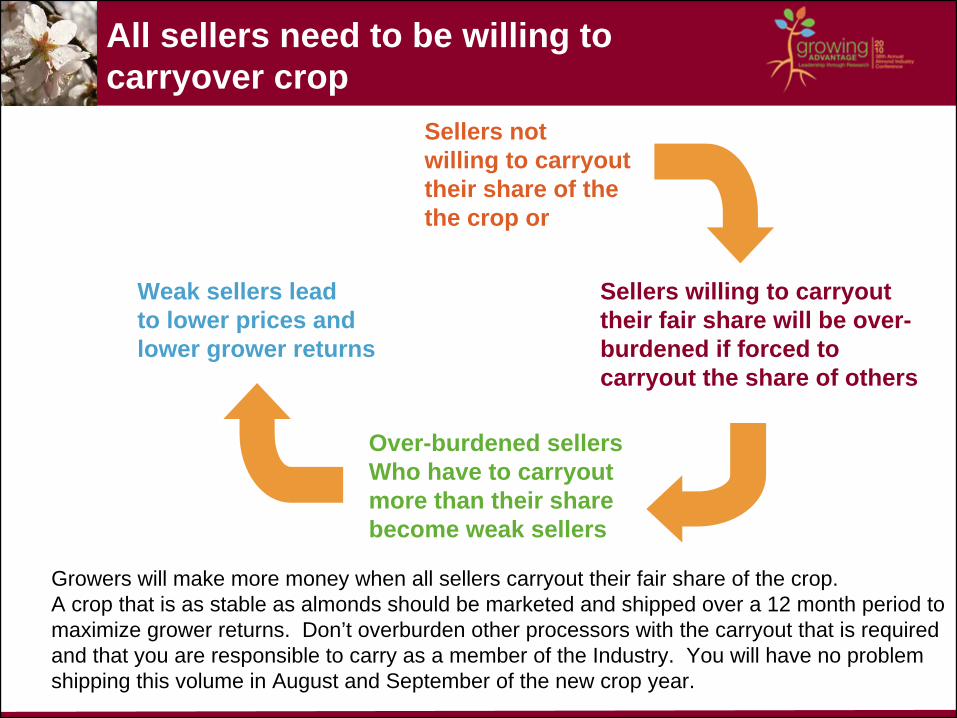
All sellers need to be willing to carryover crop
Sellers notwilling to carryouttheir share of thethe crop or
Sellers willing to carryouttheir fair share will be over- burdened if forced to carryout the share of others
Over-burdened sellersWho have to carryoutmore than their sharebecome weak sellers
Weak sellers leadto lower prices and lower grower returns
Growers will make more money when all sellers carryout their fair share of the crop.A crop that is as stable as almonds should be marketed and shipped over a 12 month period to maximize grower returns. Don’t overburden other processors with the carryout that is required and that you are responsible to carry as a member of the Industry. You will have no problem shipping this volume in August and September of the new crop year.
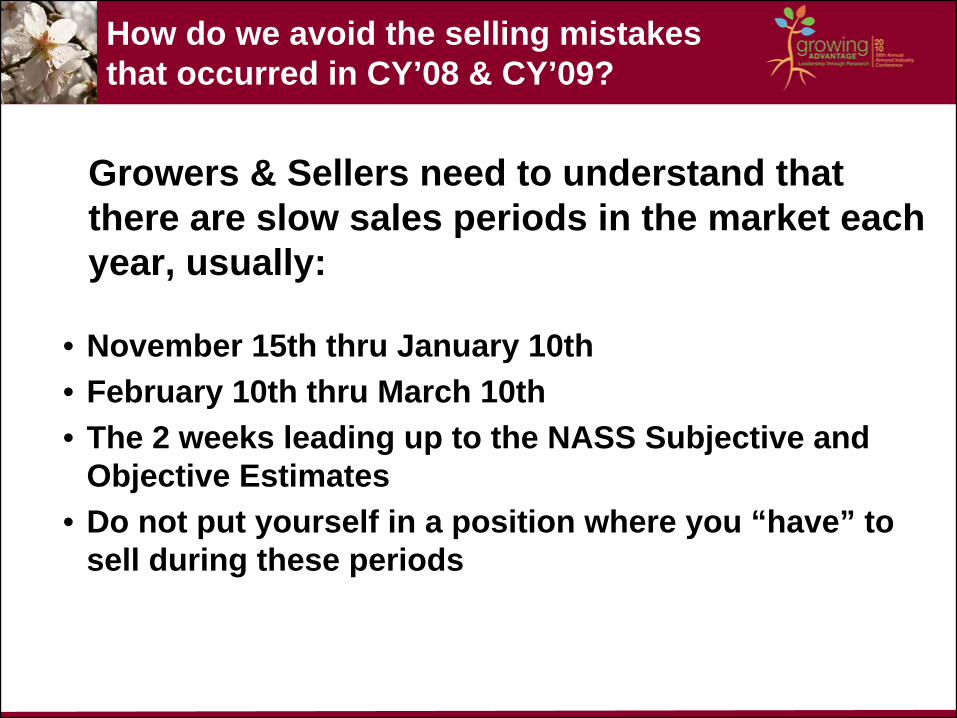
How do we avoid the selling mistakes that occurred in CY’08 & CY’09?
Growers & Sellers need to understand that there are slow sales periods in the market each year, usually:
• November 15th thru January 10th• February 10th thru March 10th• The 2 weeks leading up to the NASS Subjective and
Objective Estimates• Do not put yourself in a position where you “have” to
sell during these periods
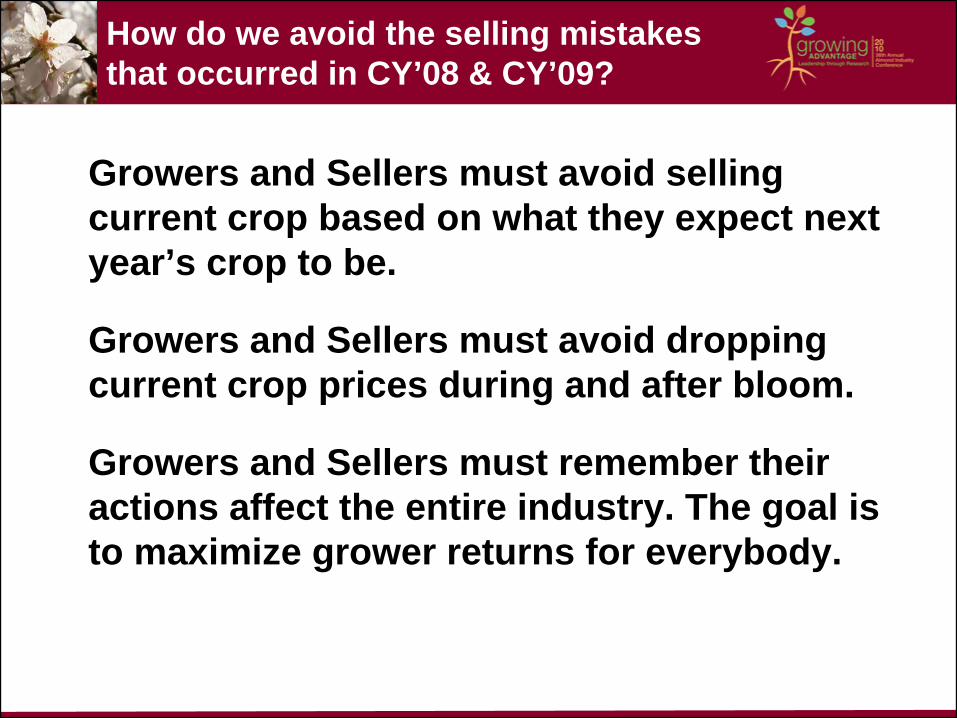
How do we avoid the selling mistakes that occurred in CY’08 & CY’09?
Growers and Sellers must avoid selling current crop based on what they expect next year’s crop to be.
Growers and Sellers must avoid dropping current crop prices during and after bloom.
Growers and Sellers must remember their actions affect the entire industry. The goal is to maximize grower returns for everybody.
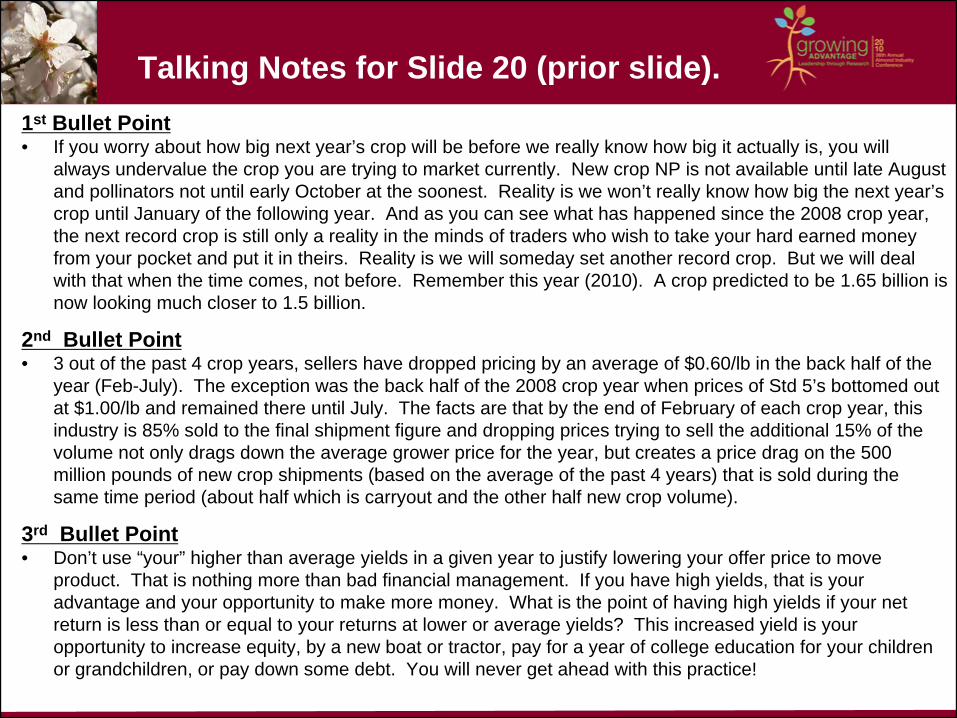
Talking Notes for Slide 20 (prior slide).1st Bullet Point• If you worry about how big next year’s crop will be before we really know how big it actually is, you will
always undervalue the crop you are trying to market currently. New crop NP is not available until late August and pollinators not until early October at the soonest. Reality is we won’t really know how big the next year’s crop until January of the following year. And as you can see what has happened since the 2008 crop year, the next record crop is still only a reality in the minds of traders who wish to take your hard earned money from your pocket and put it in theirs. Reality is we will someday set another record crop. But we will deal with that when the time comes, not before. Remember this year (2010). A crop predicted to be 1.65 billion is now looking much closer to 1.5 billion.
2nd Bullet Point• 3 out of the past 4 crop years, sellers have dropped pricing by an average of $0.60/lb in the back half of the
year (Feb-July). The exception was the back half of the 2008 crop year when prices of Std 5’s bottomed out at $1.00/lb and remained there until July. The facts are that by the end of February of each crop year, this industry is 85% sold to the final shipment figure and dropping prices trying to sell the additional 15% of the volume not only drags down the average grower price for the year, but creates a price drag on the 500 million pounds of new crop shipments (based on the average of the past 4 years) that is sold during the same time period (about half which is carryout and the other half new crop volume).
3rd Bullet Point• Don’t use “your” higher than average yields in a given year to justify lowering your offer price to move
product. That is nothing more than bad financial management. If you have high yields, that is your advantage and your opportunity to make more money. What is the point of having high yields if your net return is less than or equal to your returns at lower or average yields? This increased yield is your opportunity to increase equity, by a new boat or tractor, pay for a year of college education for your children or grandchildren, or pay down some debt. You will never get ahead with this practice!
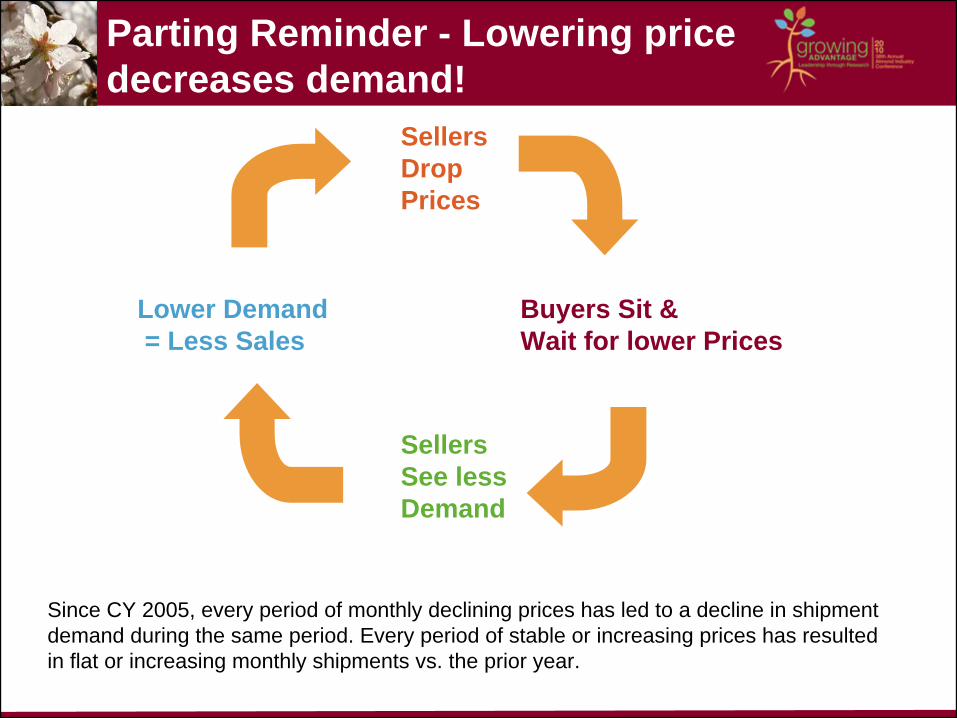
Parting Reminder - Lowering price decreases demand!
SellersDropPrices
Buyers Sit &Wait for lower Prices
SellersSee lessDemand
Lower Demand= Less Sales
Since CY 2005, every period of monthly declining prices has led to a decline in shipment demand during the same period. Every period of stable or increasing prices has resulted in flat or increasing monthly shipments vs. the prior year.
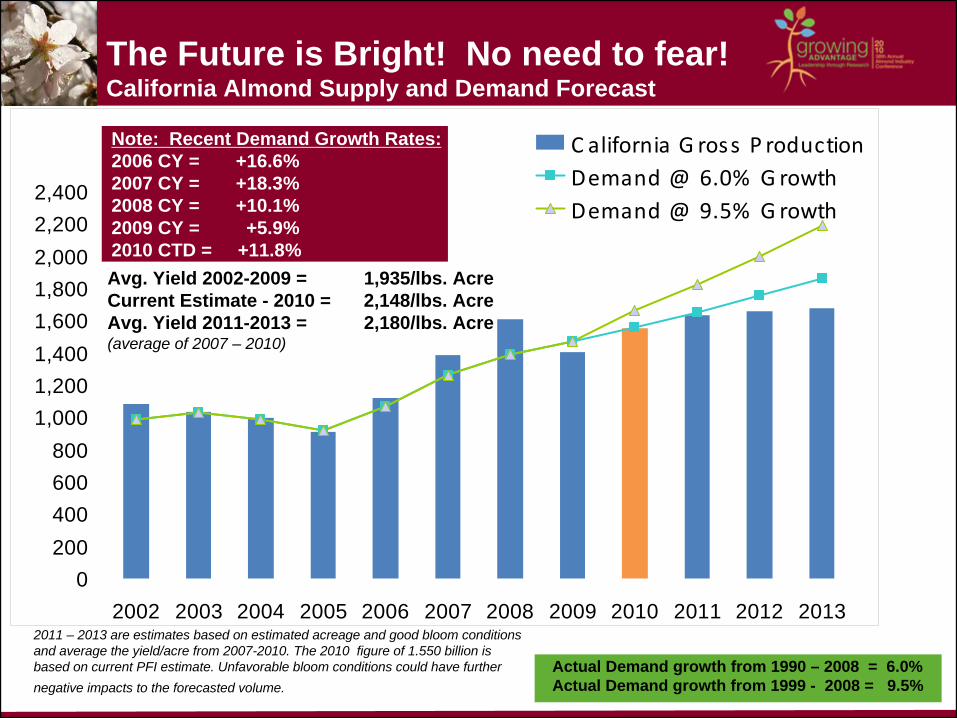
The Future is Bright! No need to fear! California Almond Supply and Demand Forecast
0200400600800
1,0001,2001,4001,6001,8002,0002,2002,400
2002 2003 2004 2005 2006 2007 2008 2009 2010 2011 2012 2013
C alifornia G ross P roductionDemand @ 6.0% G rowthDemand @ 9.5% G rowth
2011 – 2013 are estimates based on estimated acreage and good bloom conditions and average the yield/acre from 2007-2010. The 2010 figure of 1.550 billion is based on current PFI estimate. Unfavorable bloom conditions could have further negative impacts to the forecasted volume.
Avg. Yield 2002-2009 = 1,935/lbs. AcreCurrent Estimate - 2010 = 2,148/lbs. AcreAvg. Yield 2011-2013 = 2,180/lbs. Acre(average of 2007 – 2010)
Actual Demand growth from 1990 – 2008 = 6.0% Actual Demand growth from 1999 - 2008 = 9.5%
Note: Recent Demand Growth Rates:2006 CY = +16.6%2007 CY = +18.3%2008 CY = +10.1%2009 CY = +5.9%2010 CTD = +11.8%

Parting Thought• Final Thought – If you don’t remember any of the fundamentals of selling almonds I have
reviewed in this presentation or the actual figures and statistics I have presented, please remember to do the following.
• When you get home, go to your nearest Party Store or Costume Shop and buy a set of red clown hair and a red clown nose. Put this on your desk or in your brief case or vehicle when you travel. When a buyer or trader tries to convince you to sell your crop below the cost of production ($1.90/lb) or better yet, below a reasonable return ($2.15+ for Std 5’s with other almond products at normal spreads), or tries to convince you that surely this coming bloom will result in a 1.8 or 1.9 billion pound crop, do what Homey the Clown would do (character from an old sit-com “In Living Color”). Put on the clown hair and nose, whack them over the head with a stuffed sock, and say……
I Don’t think So……Homey Don’t Play That!

Remember Homey The Clown!
I Don’t Think So!Homey Don’tPlay That!

Thank You

What Really Sets the Almond MarketAnd Other Musings From A Neurotic Exporter
Debbie McMillan, Derco Foods
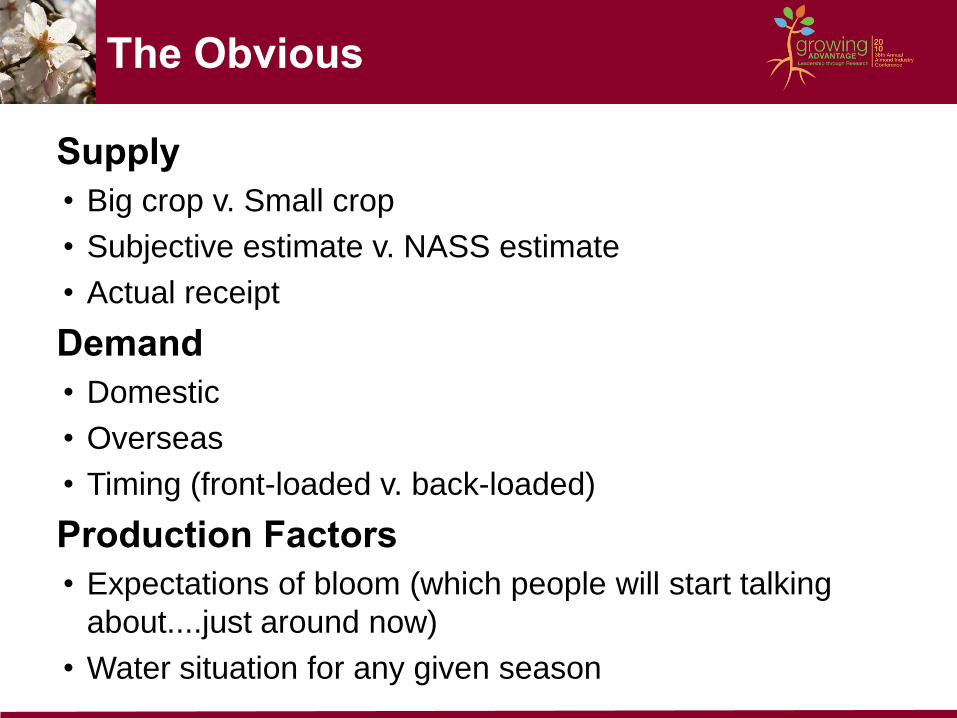
The Obvious
Supply
• Big crop v. Small crop
• Subjective estimate v. NASS estimate
• Actual receipt
Demand
• Domestic
• Overseas
• Timing (front-loaded v. back-loaded)
Production Factors
• Expectations of bloom (which people will start talking
about....just around now)
• Water situation for any given season
The Not-So-Obvious
Domestic Factors
• The “Artificial Shortage” which results from:
• Grower Psychology – expectation of a particular level of
return (whether based on fact or fiction) which must be
coupled with Grower Solidarity (much easier to attain in a
rising market)
• Grower’s “percentage sold”
• Financial strength to be patient
• Physical storage space
The Not-So-Obvious
International factors
• Price of other nuts (primarily hazelnuts, walnuts,
pecans, pistachios, cashews)
• Sometimes act as an umbrella for almond prices
• Other times impact purchase strategies and
short-term volumes
• Currency
• Unlikely to be a seasonal limiting factor, but more likely a
stimulus to load-up on purchases or buy hand to mouth
(seasonal impact on volume questionable)
The Not-So-Obvious
Economic condition in importing markets
Importer profit margins (a “base” & “inelegant”
calculus…sometimes confused for health claims
or other more “worthy” considerations)
Second-hand inventory in Europe
Re-selling hubs of Hong Kong and Dubai
Speculation gone bad
Defaults
Thank You
Wrap-Up, Discussion
and Q&A

Research Update
Turn in your 2010
Research Update ticket
at the ABC booth (#143)
in the Exhibit Tent for
the 2010 Research
Update.

Gala Dinner Speaker
Bill Nye
The Science Guy
Wednesday at
7:00 pm
Please check with the
registration desk for ticket
availability.

Reception Sponsor
Thank you Metal Sponsors