Embed Size (px)
Citation preview
2011 3rd
Quarter Report
2011 3rd Quarter Report

2011 3rd
Quarter Report
Our Mission
Changing the face of automotive retail through technology.
At Quorum, our mission is to be the very best at building and supporting the most advanced automotive
Dealership & Customer Relationship Management System, and technology infrastructure, in the
automotive industry to enable dealerships to streamline their operations and better serve their customers.
Our Values
Integrity While our abilities are considerable, we will be realistic, honest and fair
in our commitments, and above all, we will follow through.
Respect Our customers and our people are our greatest resources;
we encourage, listen to, and value their contributions.
Excellence We set high standards, strive for continuous improvement
in everything we do, and we exceed expectations.
Knowledge Understanding our customers’ business processes,
and the technology that supports them, is our focus.
Empowerment We empower our people with the resources needed
to promote innovation and fresh thinking.
Teamwork Our success is the result of teamwork. We operate with the highest level
of cooperation and trust, and will share objectives between departments.
Table of Contents
President’s Message 1
Financial Highlights 2
Management’s Discussion and Analysis 3
Condensed Consolidated Statements of Financial Position (unaudited) 21
Condensed Consolidated Statements of Comprehensive Income (unaudited) 22
Condensed Consolidated Statements of Changes in Equity (unaudited) 23
Condensed Consolidated Statements of Cash Flows (unaudited) 24
Notes to Condensed Consolidated Financial Statements (unaudited) 25
Corporate Information Inside Back Cover
President’s Message
Quorum is both an Integrated Dealership Management System (IDMS) strategic
partner with General Motors Corporation (GM) and an industry partner with
Microsoft. Quorum’s XSELLERATOR™ product is broadly promoted to our target
dealerships throughout North America by these prominent companies.
Over the last two years, Quorum has become an “all makes” organization, with a continued emphasis on
GM dealerships. Quorum supplies our product to GM, Isuzu, Chrysler, Hyundai, Kia, Nissan, Subaru,
Saab, NAPA and Bumper to Bumper franchised dealership customers.
As the Company has grown in the market, we have also enhanced our operational excellence by focusing
on measurable improvements. Some of our key Q3 FY2011 milestones are as follows:
- Quorum attained 250 installed active dealership rooftops at the end of Q3 FY2011. During the
quarter we also sold an additional seven dealership rooftops that should be installed in Q4
FY2011. For the remainder of FY2011, we expect to experience some dealership losses attributed
to dealerships closing after unsuccessfully operating with a new franchise. Our 250 dealership
rooftops encompass 8,616 active users - approximately 35 users per rooftop.
- Our dealership Customer Satisfaction (“CSI”) score results in Q3 FY2011 were as follows:
o CSI semi annual survey – 86% of end users reported “satisfied” or “very satisfied” and
89% of dealer principles reported “satisfied” or “very satisfied”.
o Our monthly Support CSI survey reported an average of 94% “very satisfied” with the
service they received from our support centre.
- For XSELLERATOR, we started development on the ground-breaking Communicator project
which is designed to transform how dealership staff is able take advantage of modern technology
to communicate with their customers and with each other. First release of “Communicator” is
scheduled for Q1 FY2012.
Key financial results summary:
- Sales increased by 1% to $1,874K in Q3 FY2011 up from $1,863K in Q3 FY2010 and margin
after direct costs increased to $1,105K in Q3 FY2011 compared to $1,059 in Q3 FY2010, a 4%
gain. The change in sales is due to:
o An increase of $86K in recurring support revenue as a result from having 250 active
dealership rooftops at the end of Q3 FY2011.
o A decrease of $176K in net new revenue which was a result of completing three
installations in Q3 FY2011 down from eight installations in Q3 FY2010.
o An increase in integration revenue of $102K due to an increased number of GM IDMS
integration projects.
- Earnings before interest, taxes, depreciation and amortization (EBITDA) increased to $372K in
Q3 FY2011 from $337K in Q3 FY2010. The increase is largely due to a reduced cost structure.
- Net income increased to $411K in Q3 FY2011 compared to a net loss of $292K in Q3 FY2010.
The increase is largely due to two non-cash items as follows:
o Foreign exchange gain in Q3 FY2011 of $187K and a loss in Q3 FY2010 of $97K.
o Income tax recovery in Q3 FY2011 of $24K and an expense in Q3 FY2010 of $283K.
- Quorum posted its ninth consecutive quarter of cash flow positive results. These results are due to
a well-managed cost structure and from attaining a critical mass of dealerships that generate
significant higher margin recurring support revenues.

2011 3rd Quarter Report
2
- Net working capital at September 30, 2011 was $913,532 with a current ratio of 2.37, compared
to $640,309 at December 31, 2010, with a current ratio of 1.91, an increase of $273,223.
Conclusion
The Company continues to improve its financial and operational results. Our single biggest challenge in
2012 is to grow our quarterly sales and implementation rates. The seven new sales in Q3 FY2011 are a
good indication that we are on the right track. Currently, we are approximately 1/3 of the way through
completing the many Company-wide sales focused improvements that we have planned.
My sincere appreciation is extended to Quorum’s Board of Directors and to our employees and
consultants who have been diligent and dedicated in their support of the Corporation’s goals and
objectives. My thanks also extend to our investors for their long-term and continued support of Quorum.
Maury Marks
President & Chief Executive Officer
Financial Highlights
(dollar figures in ‘000) Nine
Months Ended
Sept. 30, 2011
Nine Months Ended
Sept. 30, 2010
Q3 Ended Sept. 30,
2011
Q3 Ended Sept. 30,
2010
Q2 Ended June 30,
2011
Q2 Ended June 30,
2010
Q1 Ended March 31,
2011
Q1 Ended March 31,
2010
Gross revenue $5,616 $ 5,840 $1,874 $ 1,863
$ 1,830
$ 2,031
$1,912
$1,946
Direct costs 2,387 2,543 769 804
771
869
847
870 Margin after direct costs 3,229 3,297 1,105 1,059
1,059
1,162
1,065
1,076
Earnings before interest,
taxes and amortization (EBITDA) 934 1,046 372 337
239
412
323
297 Net income (loss) before
deferred income tax
534
278
387
(9)
45
322
102
(35)
Net income (loss) 404 49 411 (292) 93 369 (100) (28)
Basic earnings per share $0.0103 $0.0012 $0.0105 $(0.0074)
$0.0024
$0.0094
$(0.0025)
$(0.0007)
Fully diluted earnings per share $0.0103 $0.0012 $0.0105 $(0.0074)
$0.0023
$0.0087
$(0.0025)
$(0.0007)
Weighted average number
of common shares
Basic 39,298,428 39,298,438 39,298,438 39,298,438 39,298,438 39,298,438 39,298,438 39,298,438 Diluted 39,298,438 39,685,819 39,298,438 39,298,438 39,684,319 42,398,938 39,684,319 42,398,938 XSELLERATOR installations –
in the period 15 27 3 8
6
9
6
10 XSELLERATOR active
dealership rooftops 250 235 250 235
249
228
245
221
Note: All 2010 figures have been restated in accordance with International Financial Reporting Standards
2011 3rd Quarter Report
3
Management’s Discussion and Analysis of
Financial Condition and Results of Operations
The following discussion and analysis provides information that management deems is relevant to an
assessment and understanding of the Corporation’s interim consolidated results of operations and
financial condition. This Management’s Discussion and Analysis (“MD&A”) should be read in
conjunction with the unaudited interim condensed consolidated financial statements for the nine months
ended September 30, 2011 and the audited annual consolidated financial statements of the Corporation for
the year ended December 31, 2010 and the notes thereto. Comparisons made to prior periods are to the
corresponding period in the preceding year unless otherwise indicated.
Adoption of International Financial Reporting Standards (“IFRS”) Quorum’s interim Condensed Consolidated Financial Statements and the financial information included
in the interim MD&A have been prepared in accordance with IFRS as issued by the International
Accounting Standards Board (IASB) and interpretations of the International Financial Reporting
Interpretations Committee (IFRIC) that are expected to be effective as at December 31, 2011, the date of
the Corporation’s first annual reporting under IFRS. Previously, the Corporation prepared its interim and
annual Consolidated Financial Statements in accordance with Canadian Generally Accepted Accounting
Principles (“Canadian GAAP”). Comparative information for years ending on or before December 31,
2009, has been prepared under Canadian GAAP and has not been restated under IFRS.
Note 4 to the interim Condensed Consolidated Financial Statements contains a detailed description of the
Corporation’s adoption of IFRS, including a reconciliation of the Consolidated Financial Statements
previously prepared under Canadian GAAP to those under IFRS for the following:
The Consolidated Statement of Financial Position at January 1, 2010 and at September 30, 2010;
The Consolidated Statement of Comprehensive Income and Cash Flows for the three and nine-
month periods ended September 30, 2010; and
The Consolidated Statement of Changes in Shareholders’ Equity at September 30, 2010.
The most significant impacts of the adoption of IFRS, together with the details of the IFRS 1 exemptions
taken, are described in the “Transition to IFRS” section on page 12 of this interim MD&A. The adoption
of IFRS does not impact the underlying operations of Quorum’s business or its cash flows.
Background and Description of Business Quorum Information Technologies Inc. (“Quorum” or the “Corporation”) is an information technology
company that focuses on the automotive retail business, and is incorporated under the Business
Corporations Act of Alberta.
Quorum develops, markets, implements and supports its software product, XSELLERATOR™, a
Dealership Management System (DMS) for the automotive market. The product is delivered to General
Motors Corporation (GM), Chrysler, Hyundai, Isuzu, Kia, Nissan, Subaru, Saab, NAPA and Bumper to
Bumper dealerships throughout North America. The Corporation is an Integrated Dealership Management
System (IDMS) strategic partner with GM and both a Silver-certified and an Independent Software
Vendor (ISV) partner with Microsoft. Quorum has a large opportunity with a market of approximately
4,000 dealerships across North America; to capitalize on this market Quorum has invested significant
funds and resources.

2011 3rd Quarter Report
4
Non-GAAP/IFRS Measures
The accompanying interim condensed consolidated financial statements have been prepared in
accordance with IFRS. Certain supplementary information and measures not recognized under IFRS or
previous GAAP are also provided in this MD&A where management believes they assist the reader in
understanding Quorum’s results. These measures are calculated by Quorum on a consistent basis unless
otherwise specifically explained. These measures are further explained as follows:
EBITDA – means net earnings before interest, taxes, amortization, foreign exchange gains and losses and
stock-based compensation. EBITDA is a metric used to assess the financial performance of an entity.
Management believes that this metric assists in determining the ability of the Corporation to generate cash
from operations.
Cash flow from operating activities – means cash flow from operating activities before changes in non-
cash operating working capital. This measure is not intended to be an alternative to cash provided by
operating activities as provided in the condensed consolidated statements of cash flows, comprehensive
income or other measures of financial performance calculated in accordance with IFRS. Cash flow from
operating activities assists management and investors in analyzing operating performance and leverage.
Margin after direct costs – means revenue less direct costs, which includes third party costs and salaries
and benefits of employees directly related to the activities from which the Corporation generates revenue
from. Management believes this metric provides a good measure of the operating performance of the
product. Q3 FY2011 Overview Quorum’s key to growing profits is having a critical mass of installed dealerships that supply a recurring
revenue stream, along with a well-managed fixed and variable cost structure. Sales increased by 1% to
$1,874K in Q3 FY2011 from $1,863K in Q3 FY2010, and margin after direct costs increased to $1,105K
in Q3 FY2011, as compared to $1,059K in Q3 FY2010, a 4% increase. The change in sales is due to:
o An increase of $86K in recurring support revenue as a result from having 250 active
dealership rooftops at the end of Q3 FY2011 versus 235 at the end of Q3 FY2010.
o A decrease of $176K in net new revenue which was a result of completing three
installations in Q3 FY2011, down from eight installations in Q3 FY2010.
o An increase in integration revenue of $102K due to an increase in the number of GM
integration projects.
Earnings before interest, taxes, depreciation and amortization (EBITDA), increased to $372K in Q3
FY2011 from $337K in Q3 FY2010. Net income before taxes increased to $387K in Q3 FY2011
compared to a net loss before taxes of $9K in Q3 FY2010. The increase during Q3 FY2011 was due to an
increase in integration revenue; a decrease in general and administrative expense; a decrease in interest on
long-term debt; and a non-cash foreign exchange gain of $187K. Management continues to optimize all
business processes in the organization with the goal of continually reducing our cost structure. Interest
was reduced due to the early repayment of the Corporation’s 12% secured convertible debenture on
December 15, 2010.
The Corporation continues to invest significantly in the further development of its proprietary software
product, XSELLERATOR. XSELLERATOR represents the “next generation” of Dealership Management
Systems for the automotive market. New investment is now more focused on development that will grow
market share, improve customer satisfaction, reduce support calls (and our cost of support), paid
integration work through the GM IDMS contract, other Original Equipment Manufacturing (OEM)
integration work and third party company integration.
2011 3rd Quarter Report
5
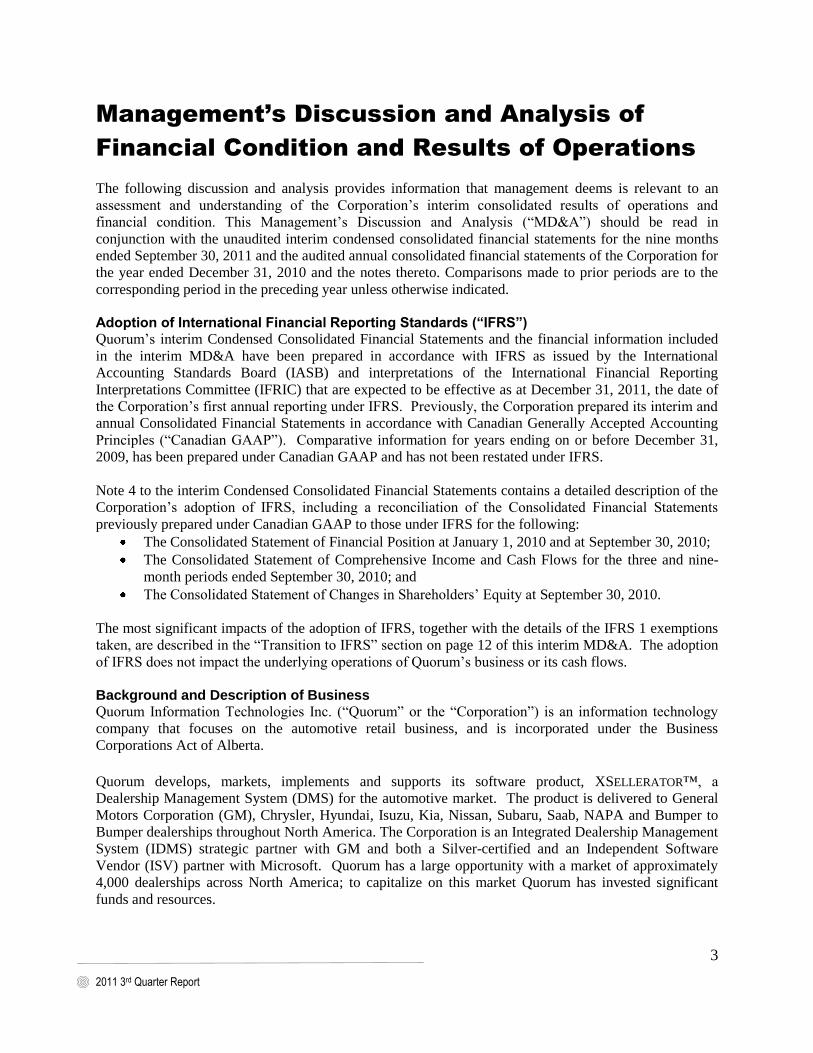
Q3 FY2011 Financial Highlights
1% increase in gross revenue from Q3 FY2010.
4% increase in margin after direct costs from Q3 FY2010.
6% increase in on-going annuity XSELLERATOR software support and dealer services
revenue over Q3 FY2010.
74% decrease in net new and migration revenue from Q3 FY 2010.
78% increase in integration revenue from Q3 FY2010.
EBITDA (earnings before interest, taxes, depreciation and amortization) increased from
$337K in Q3 FY2010 to $372K during Q3 FY2011.
Positive quarterly cash flow from operating activities of $163K in Q3 FY2011 versus $299K
in Q3 FY2010.
10% decrease in quarterly cash expenditures from Q3 FY2010. Results of Operations
(dollar figures in ‘000) Nine
Months Ended
Sept 30, 2011
Nine Months Ended
Sept 30, 2010
Q3 Ended
Sept 30, 2011
Q3 Ended
Sept 30, 2010
Q2 Ended
June 30, 2011
Q2 Ended
June 30, 2010
Q1 Ended March
31, 2011
Q1 Ended
March 31, 2010
Gross revenue $ 5,616 $ 5,840
$ 1,874
$1,863 $ 1,830 $ 2,031 $ 1,912 $ 1,946
Margin after direct costs 3,229 3,297
1,105
1,059 1,059
1,162
1,065
1,076
EBITDA expenses1 2,295 2,251
733
721 820
751 742
779
Operating income before interest, taxes,
depreciation and amortization (EBITDA) 934 1,046
372
337
239
412
323
297 Income (loss) before deferred income tax
expense 534 278
387
(9) 45 322 102 (35) Net income (loss) 404 49
411
(292) 93
369
(100)
(28)
Net income (loss) per share 0.0103 0.0012
0.0105
(0.0074) 0.0024 0.0094 (0.003) (0.001)
Cash flow from operating activities 692 888
163
299 288
304
241
285
Quarterly cash expenditures (cash
payments for operating and investing activities) $ 5,520 $ 5,889
$ 1,844
$ 2,060 $ 1,821
$ 2,014
$ 1,855
$ 1,815
KEY MANAGEMENT METRICS
XSELLERATOR installations – in the period 15 27 3 8 6 9 6 10 XSELLERATOR active dealership rooftops 250 235 250 235 249 228 245 221
Note:
All 2010 figures have been restated in accordance with International Financial Reporting Standards
1 EBITDA Expenses include salaries and benefits, general and administrative and sales and marketing.

2011 3rd Quarter Report
6
Detailed Discussion on Operating Results for the Periods Ended September 30, 2011 and September 30, 2010
Revenue and Margin After Direct Costs Analysis
Nine Months Ended
Sept 30, 2011
Nine Months Ended
Sept 30, 2010
Q3 Ended Sept 30,
2011
Q3 Ended Sept 30,
2010
Q2 Ended June 30,
2011
Q2 Ended June 30,
2010
Q1 Ended March 31,
2011
Q1 Ended March 31,
2010
Gross revenue $5,616,280 $5,839,898 $1,874,497 $1,862,811 $1,829,515 $2,031,488 $1,912,268 $1,945,599 Third party costs (direct) 748,969 1,022,444 202,702 259,077 203,522 353,766 342,745 375,229 Salaries and benefits (direct) 1,638,744 1,520,442 566,599 545,170 567,315 515,704 504,830 493,940
Margin after direct costs 3,228,567 3,297,012 1,105,196 1,058,564 $1,058,678 $1,162,018 $1,064,693 $1,076,430
Margin after direct costs % 57% 56% 59% 57% 58% 57% 56% 55%
KEY MANAGEMENT METRICS
XSELLERATOR installations – in the period 15
27
3 8
6
9
6
10
XSELLERATOR total active rooftops 250 235 250 235 249 228 245 221
Support and other revenue
$4,794,187
$4,476,329
$1,580,865
$1,494,710
$1,622,538
$1,556,825
$1,590,784
$1,424,794
Net new and migrations 456,086 944,836 61,468 237,882 150,149 343,823 244,469 363,131 Integration 366,007 418,733 232,164 130,219 56,828 130,840 77,015 157,674
Gross revenue $5,616,280 $5,839,898 $1,874,497 $1,862,811 $1,829,515 $2,031,488 $1,912,268 $1,945,599
Revenue For Q3 FY2011, revenues from operations were $1,874,497 compared to $1,862,811 for Q3 FY2010, an
increase of $11,686 or 1%. Quorum revenue results were as follows:
Recurring support and other revenue increased to $1,580,865 in Q3 FY2011, compared to $1,494,710 in
Q3 FY2010, an increase of 6%. The Corporation completed three installations during Q3 FY2011, six
installations during Q2 FY2011 and six installations during Q1 FY2011, along with 33 installations in
FY2010, with each now paying recurring monthly support and services fees. Quorum has 250 active
dealership rooftops and 8,616 users utilizing XSELLERATOR. As our customer base grows, support and
other revenue should continue to grow proportionately.
Integration revenue for Q3 FY2011 was $232,164 compared to $130,219 in Q3 FY2010, an increase of
78%. During Q3 FY2011 Quorum completed two integration projects and five new integration projects
are currently in progress for the remainder of FY2011 and into the first quarter of FY2012.
Migrations and net new revenue was $61,468 in Q3 FY2011 compared to $237,882 in Q3 FY2010, a
decrease of $176,414 in net new revenue which was a result of completing three installations in Q3
FY2011, down from eight installations in Q3 FY2010.
Direct Costs and Margin After Direct Costs The direct costs include all costs related to implementations and support including third party costs and all
the implementation, migrations and support staff. For Q3 FY2011, margin after direct costs increased to
$1,105,196 or 59% compared to $1,058,564 or 57% for Q3 FY2010. The gross margin percentage
2011 3rd Quarter Report
7
increase is due to higher margin recurring support revenues of $86,155 in Q3 FY2011 compared to Q3
FY2010.
Expenses
Nine Months Ended
Sept 30, 2011
Nine Months Ended
Sept 30, 2010
Q3 Ended Sept 30,
2011
Q3 Ended Sept 30,
2010
Q2 Ended June 30,
2011
Q2 Ended June 30,
2010
Q1 Ended March 31,
2011
Q1 Ended March 31,
2010
Salaries and benefits2
$1,213,432
$1,183,826
$386,523
$347,742
$431,523
$406,819
$395,386
$429,265
Employee stock option benefits3 52,543 105,522 17,479 36,066 17,479 34,728 17,585 34,728
General & administrative 900,619 900,654 290,695 316,555 329,231 291,476 280,693 292,623
Sales & marketing 181,129 166,304 55,856 56,875 59,416 51,665 65,857 57,764
Total expenses $2,347,723 $2,356,306 $750,553 $757,238 $837,649 $784,688 $759,521 $814,380
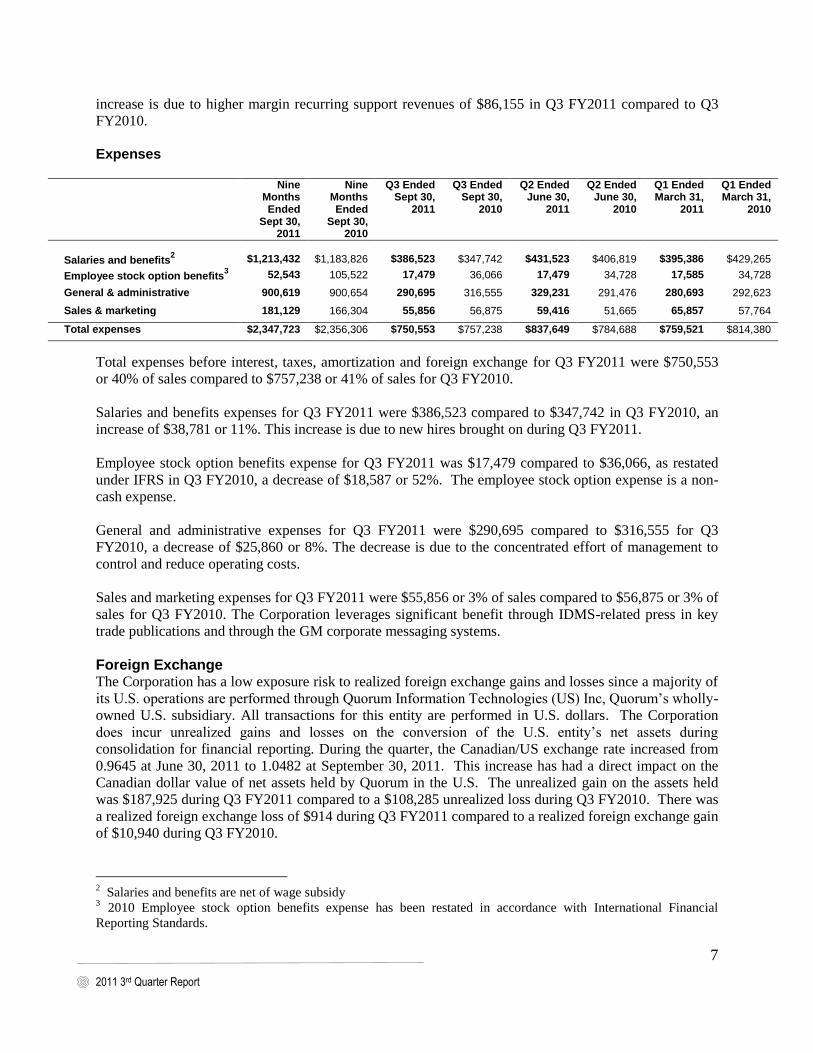
Total expenses before interest, taxes, amortization and foreign exchange for Q3 FY2011 were $750,553
or 40% of sales compared to $757,238 or 41% of sales for Q3 FY2010.
Salaries and benefits expenses for Q3 FY2011 were $386,523 compared to $347,742 in Q3 FY2010, an
increase of $38,781 or 11%. This increase is due to new hires brought on during Q3 FY2011.
Employee stock option benefits expense for Q3 FY2011 was $17,479 compared to $36,066, as restated
under IFRS in Q3 FY2010, a decrease of $18,587 or 52%. The employee stock option expense is a non-
cash expense.
General and administrative expenses for Q3 FY2011 were $290,695 compared to $316,555 for Q3
FY2010, a decrease of $25,860 or 8%. The decrease is due to the concentrated effort of management to
control and reduce operating costs.
Sales and marketing expenses for Q3 FY2011 were $55,856 or 3% of sales compared to $56,875 or 3% of
sales for Q3 FY2010. The Corporation leverages significant benefit through IDMS-related press in key
trade publications and through the GM corporate messaging systems.
Foreign Exchange The Corporation has a low exposure risk to realized foreign exchange gains and losses since a majority of
its U.S. operations are performed through Quorum Information Technologies (US) Inc, Quorum’s wholly-
owned U.S. subsidiary. All transactions for this entity are performed in U.S. dollars. The Corporation
does incur unrealized gains and losses on the conversion of the U.S. entity’s net assets during
consolidation for financial reporting. During the quarter, the Canadian/US exchange rate increased from
0.9645 at June 30, 2011 to 1.0482 at September 30, 2011. This increase has had a direct impact on the
Canadian dollar value of net assets held by Quorum in the U.S. The unrealized gain on the assets held
was $187,925 during Q3 FY2011 compared to a $108,285 unrealized loss during Q3 FY2010. There was
a realized foreign exchange loss of $914 during Q3 FY2011 compared to a realized foreign exchange gain
of $10,940 during Q3 FY2010.
2 Salaries and benefits are net of wage subsidy
3 2010 Employee stock option benefits expense has been restated in accordance with International Financial
Reporting Standards.

2011 3rd Quarter Report
8
Capitalization & Amortization During Q3 FY2011, the Corporation continued to invest significantly in the further development of its
proprietary software product, XSELLERATOR. XSELLERATOR represents the “next generation” of
Dealership Management Systems (DMS) in the automotive market, and is one of the most advanced,
fully-integrated Windows-based products in the marketplace.
Summary of software development costs capitalized during the quarter and related amortization for
XSELLERATOR:
Nine Months
Ended September 30,
2011
Nine Months Ended
September 30, 2010
Q3 Ended September 30,
2011
Q3 Ended September 30,
2010
Total software development costs
capitalized
$ 685,867
$ 769,725
$ 230,864
$ 293,419
Amortization of software development costs
4
$ 349,458
$ 302,085
$ 119,235
$ 100,185
All research and development costs are expensed as incurred unless they satisfy the IFRS accounting
criteria for deferral and subsequent amortization. As noted above, the Corporation continues to conduct
ongoing research and development towards the improvement of XSELLERATOR and has capitalized
payroll costs of $198,672, net of $15,129 of wage subsidies from the Newfoundland and Labrador
government, as well as direct overheads of $32,192 for a total of $230,864 in Q3 FY2011 compared to
capitalized payroll costs of $254,660, net of $11,190 of wage subsidies from the Newfoundland and
Labrador government and direct overheads of $38,759 in Q3 FY2010 for a total of $293,419.
XSELLERATOR is a leading-edge product in the automotive DMS field and the Corporation intends to
maintain this lead through continued investment in the product. The Corporation has continued its
development efforts as it prepares to roll out additional features and functionality and more and improved
integration points with the manufacturers. The outlook is to maintain the level of investment for FY2011,
with a continued focus on the development of XSELLERATOR as the premier DMS software that is
scalable across all sizes of dealerships in the North American market and is available for all
manufacturers and integrated to all key strategic third party companies in the marketplace.
Amortization on the software development costs for Q3 FY2011 increased to $119,235 as compared to
$100,185 for Q3 FY2010, a $19,050 increase. Under IFRS, the Corporation has changed its amortization
policy estimate to ten-year straight line from the units of production method. Management feels that this
amortization method is a more appropriate estimate that meets the IFRS guidelines and is more in line
with industry standards.
4 2010 Amortization of software development costs has been restated in accordance with International Financial
Reporting Standards. Under Canadian GAPP, amortization expense was $ 77,760 for Q3 2010 and $259,940 for the
nine months ended September 30, 2010.
2011 3rd Quarter Report
9
Net Income, EBITDA and Earnings per Share FY 2011
September 30 Q3
FY 2010 September 30
Q3
EBITDA $ 372,122 $ 337,392 Net income (loss) $ 411,338 $ (291,733)
Net income (loss) per share - Basic $ 0.0105 $ (0.0074) - Diluted $ 0.0105 $ (0.0074) Weighted average number of common shares
- Basic 39,298,438 39,298,438 - Diluted 39,298,438 39,298,438
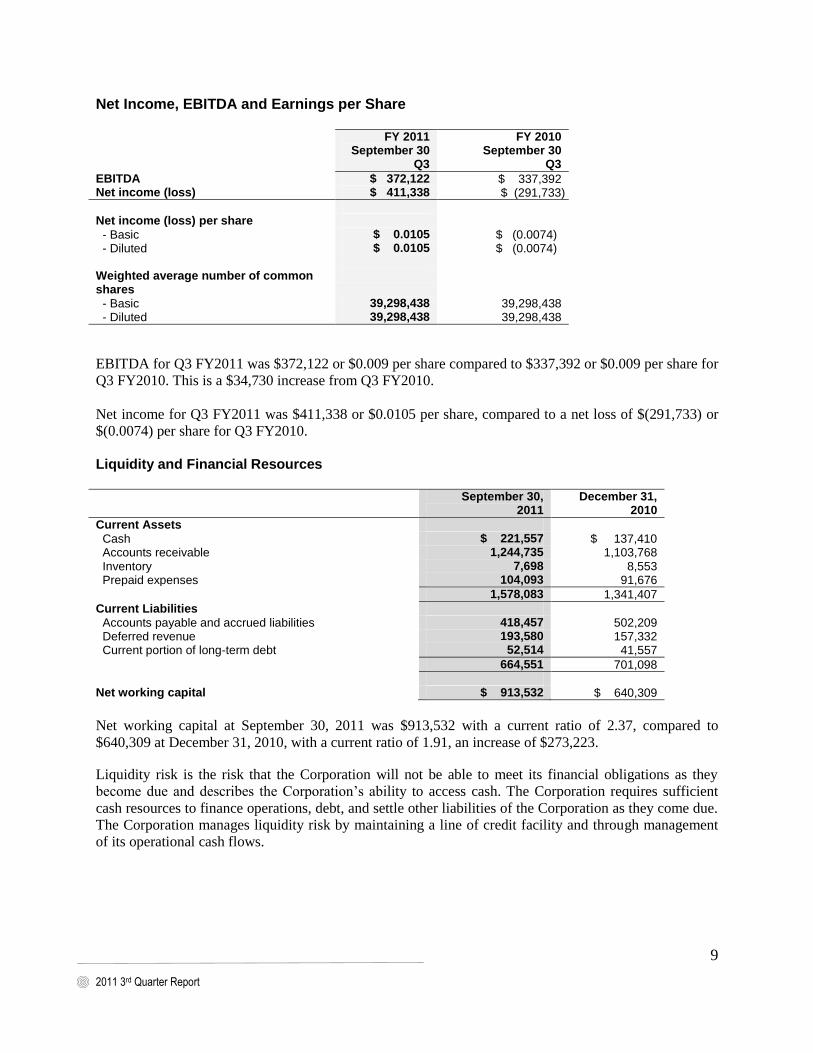
EBITDA for Q3 FY2011 was $372,122 or $0.009 per share compared to $337,392 or $0.009 per share for
Q3 FY2010. This is a $34,730 increase from Q3 FY2010.
Net income for Q3 FY2011 was $411,338 or $0.0105 per share, compared to a net loss of $(291,733) or
$(0.0074) per share for Q3 FY2010.
Liquidity and Financial Resources September 30,
2011 December 31,
2010
Current Assets
Cash $ 221,557 $ 137,410 Accounts receivable 1,244,735 1,103,768 Inventory 7,698 8,553 Prepaid expenses 104,093 91,676
1,578,083 1,341,407
Current Liabilities Accounts payable and accrued liabilities 418,457 502,209 Deferred revenue 193,580 157,332 Current portion of long-term debt 52,514 41,557
664,551 701,098
Net working capital $ 913,532 $ 640,309
Net working capital at September 30, 2011 was $913,532 with a current ratio of 2.37, compared to
$640,309 at December 31, 2010, with a current ratio of 1.91, an increase of $273,223.
Liquidity risk is the risk that the Corporation will not be able to meet its financial obligations as they
become due and describes the Corporation’s ability to access cash. The Corporation requires sufficient
cash resources to finance operations, debt, and settle other liabilities of the Corporation as they come due.
The Corporation manages liquidity risk by maintaining a line of credit facility and through management
of its operational cash flows.

2011 3rd Quarter Report
10
Payments Due By Period
Less than 3
months
3 months to 1 year
1-2
years
2-5 years
5+ years
Total
Accounts payable and accrued liabilities
$418,457
$ -
$ -
$ -
$ -
$418,457
Lease commitments 139,920 541,051 724,283 1,405,254 Long-term debt
5 12,215 40,299 146,418 71,971 - 270,903
Provisions - - - 29,264 14,499 43,763
Total $570,592 $581,350 $870,701 $101,235 $ 14,499 $2,183,377
Cash Flows The Corporation’s cash balance increased by $35,620 in Q3 FY2011 compared to an increase of $80,602
in Q3 FY2010.
Cash flows from operating activities were $162,513 in Q3 FY2011 compared to $298,467 in Q3 FY2010.
During the quarter, net new revenue was down, as previously discussed. Cash paid to suppliers decreased
during the quarter by $154,283 as compared to Q3 FY2010 as a result of fewer installations taking place
during Q3 FY2011.
Cash flows relating to financing activities were $110,016 in Q3 FY2011 compared to $77,102 in Q3
FY2010. During the quarter, Quorum received $122,232 through the approval of the 2010 SR&ED claim
and $12,216 of loan repayments were made as per the ACOA loan agreement. $85,665 was received
through the approval of the 2009 SR&ED claim during Q3 FY2010 and $8,563 of loan repayments were
paid as per the ACOA loan agreement.
The Corporation has a strong commitment to continually enhance and improve XSELLERATOR and
invested $230,864, net of wage subsidies from the Newfoundland and Labrador government, in product
development in Q3 FY2011 and spent $6,045 on property and equipment, net of grant from the
Newfoundland Department of Business, compared to $293,419 in product development and $1,548 on
property and equipment in Q3 FY2010.
Current Liabilities Accounts payable and accrued liabilities were $418,457 at September 30, 2011 compared to $502,209 at
December 31, 2010 and $361,650 at September 30, 2010. The decrease from year end is due to the
emphasis the Corporation has put on managing cash flow with a stronger purchasing process and better
approval controls.
Repayment of a loan with the Atlantic Canada Opportunities Agency (ACOA) (described below)
commenced on July 2, 2010. As of September 30, 2011, $52,514 of the present value is due within the
next 12 months. On a cash basis, $99,996 is required to be repaid within the next 12 months.
Deferred revenue was $193,580 at September 30, 2011 compared to $157,332 at December 31, 2010.
Under the GM IDMS contract, the Corporation’s support billings are billed in advance. As of September
30, 2011, there was $193,580 of support fees billed that relate to October 1-19th, 2011.
5 Long-term debt obligations reflect principal payments and excludes any associated interest portion

2011 3rd Quarter Report
11
Long-Term Liabilities On March 31, 2009, the Corporation completed an agreement with the Atlantic Canada Opportunities
Agency (ACOA) to provide a $500,000 interest-free, unsecured loan to provide funding to develop
version 4.7 of the XSELLERATOR system and to expand the office in St. John’s, Newfoundland. As of
December 31, 2010, $500,000 was received. The ACOA loan is recognized as $270,803 of which
$52,514 is current principal due within the next 12 months. On a cash basis, $383,338 is remaining on the
loan and $99,996 is required to be repaid within the next 12 months. Repayment of the ACOA loan
commenced on July 2, 2010 at $8,333 per month, including imputed interest, over five years.
On December 15, 2010 the Corporation repaid in full a $1.5 million secured convertible debenture (“the
Debenture”). The Debenture was issued on April 15, 2008 and was secured by a fixed and floating charge
on all assets of the Corporation. The Debenture incurred interest at a rate of 12% per annum, payable
monthly in arrears, and was scheduled to mature April 15, 2011. The Debenture was convertible any time
prior to maturity, at the Debenture holders’ option, into common shares of Quorum Information
Technologies Inc. at a price of $0.55 per common share, equating to 2,727,272 common shares. In
exchange for agreeing to the early retirement of the Debenture, the Corporation amended the warrants
available to the Debenture holders. The exercise price of the warrants was reduced to $0.18 per Quorum
share from their original price of $0.55. In accordance with the rules of the TSX Venture Exchange, the
exercise period for the warrants will be reduced to 30 days in the event that for any ten consecutive
trading days the closing price of Quorum common shares on the TSX Venture Exchange exceeds $0.225.
During Q3 FY2011, interest on long-term debt was $12,785 compared to $79,456 in Q3 FY2010. The
debt incurred cash interest of $12,785 ($60,231 in Q3 FY2010) and non-cash interest from loan accretion
of $nil ($19,225 in Q3 FY2010). The decrease in cash and non-cash interest relates the retirement of the
Debenture during FY2010.
During FY2009, Quorum entered into an agreement with Central Consulting Services Inc. to prepare the
Scientific Research & Economic Development (SR&ED) claim for the years ending December 31, 2007,
December 31, 2008, December 31, 2009 and December 31, 2010. The amount of $87,917, recorded at a
fair value of $43,763, is not payable until the Corporation is in a position to utilize the SR&ED
Investment Tax Credits (ITCs). The Corporation does not expect to utilize those ITCs until at least the
year ended December 31, 2015 as it will use its loss carry forwards and Capital Cost Allowances in full
before using the ITCs.
Share Capital There has been no change in the share capital of the Corporation since December 31, 2010. Note 12 of the
September 30, 2011 unaudited condensed consolidated financial statements of the Corporation provides
further details on share capital.
During Q3 FY2011, the share price ranged from a high of $0.15 and a low of $0.06. The average share
price over the period was $0.10. In calculating the earnings per share (EPS) and fully diluted EPS, the
options with an exercise price below the $0.10 are considered. None of the options had an exercise price
less than $0.10. As of the date of this report, 3,534,066 options are outstanding.
Material Contracts & Commitments On March 11, 2011, the Corporation completed an agreement with the Newfoundland and Labrador
Department of Business (“NL loan”), to provide funding, up to a maximum of $500,000, to increase
staffing levels in Newfoundland and Labrador and expand the office in St. John’s. The increase in the
number of employees is required in order to achieve the high growth model that the Corporation has
planned for 2011. A portion of the loan, $172,000, will be forgivable to the Corporation dependent on the

2011 3rd Quarter Report
12
Corporation meeting certain requirements. The balance of the NL loan, $328,000, is to be repaid over a
four-year term starting in December, 2012. As of the date of this MD&A, $25,575 has been received.
On March 31, 2009, the Corporation completed an agreement with ACOA to provide $500,000 of
funding to develop version 4.7 of the XSELLERATOR system and to expand the office in St. John’s,
Newfoundland. As of April 20, 2010, the full amount had been received by the Corporation. The ACOA
loan is to be repaid with equal installments of $8,333 over a five-year period. The first repayment amount
was made in July 2010.
On June 7, 2007, the Corporation entered into a wage subsidy agreement with the provincial government
of Newfoundland and Labrador. The agreement entitles the Corporation to an 8% subsidy of all gross
payroll costs, including benefits, associated with Newfoundland and Labrador employees for a period of
five years. The Corporation must maintain a minimum of 35 full-time positions during each reporting
period to receive this subsidy. As of the date of this MD&A, 43 full-time positions were maintained by
the Corporation in Newfoundland and Labrador.
Effective January 3, 2006 the Corporation was named an IDMS supplier on behalf of GM throughout
North America. This contract required the Corporation to expand operations and capabilities to meet the
requirements of an expanded North American customer base.
Off Balance Sheet Arrangements Other than the lease commitments noted in Note 15 of the September 30, 2011 unaudited condensed
consolidated financial statements, the Corporation has not entered into any off balance sheet
arrangements.
Transition to IFRS Effective January 1, 2010, International Financial Reporting Standards replaced Canada’s current
Generally Accepted Accounting Principles for all publicly accountable profit-oriented enterprises. The
Corporation has adopted IFRS effective January 1, 2010 (“the transition date”) and has prepared its
opening IFRS statement of financial position as at that date. Prior to the adoption of IFRS, the
Corporation prepared its financial statements in accordance with Canadian GAAP.
The Corporation’s consolidated financial statements for the year ending December 31, 2011, will be the
first annual financial statements that comply with IFRS. The Corporation will ultimately prepare its
opening IFRS statement of financial position by applying existing IFRS with an effective date of
December 31, 2011. Accordingly, the opening IFRS statement of financial position and the December
31, 2010, comparative statement of financial position presented in the consolidated financial statements
for the year ending December 31, 2011, may differ from those presented at this time.
The Corporation has completed all three IFRS project phases and has successfully integrated IFRS into
our day-to-day operations. The adoption of IFRS has not changed the strategy of Quorum nor has it
impacted our underlying business activities. Overall, our cash flows have not been impacted by the
transition.
IFRS 1 – First-Time Adoption
In preparing these condensed consolidated financial statements in accordance with IFRS 1, “First-time
Adoption of International Financial Reporting Standards (“IFRS 1”), the Corporation has applied certain
of the optional exemptions from full retrospective application of IFRS. Based on management’s analysis
of the various accounting policy choices available, the IFRS 1 optional exemptions applied are described
below:
2011 3rd Quarter Report
13
(i) Share-based payment transactions
The Corporation has elected to apply IFRS 2, “Share based Payments” (“IFRS 2”), to equity
instruments granted after November 7, 2002, which have not vested by the Transition Date.
Accordingly, Management has elected not to restate the stock-based compensation expense for share
based payments granted and vested prior to the Transition Date.
(ii) Borrowing costs
IAS 23, “Borrowing Costs”, has not been applied to borrowing costs relating to qualifying assets for
which the commencement date for capitalization is before January 1, 2010. Accordingly, the
Corporation has not capitalized borrowing costs relating to qualifying assets for which the
commencement date for capitalization was before January 1, 2010.
(iii) Fair value or revaluation as deemed cost
IAS 16, “Property, plant, and equipment”, allows for property and equipment to continue to be carried
at cost less depreciation, as determined under Canadian GAAP. Accordingly, the Corporation has
elected to carry its property and equipment at historical cost less accumulated amortization.
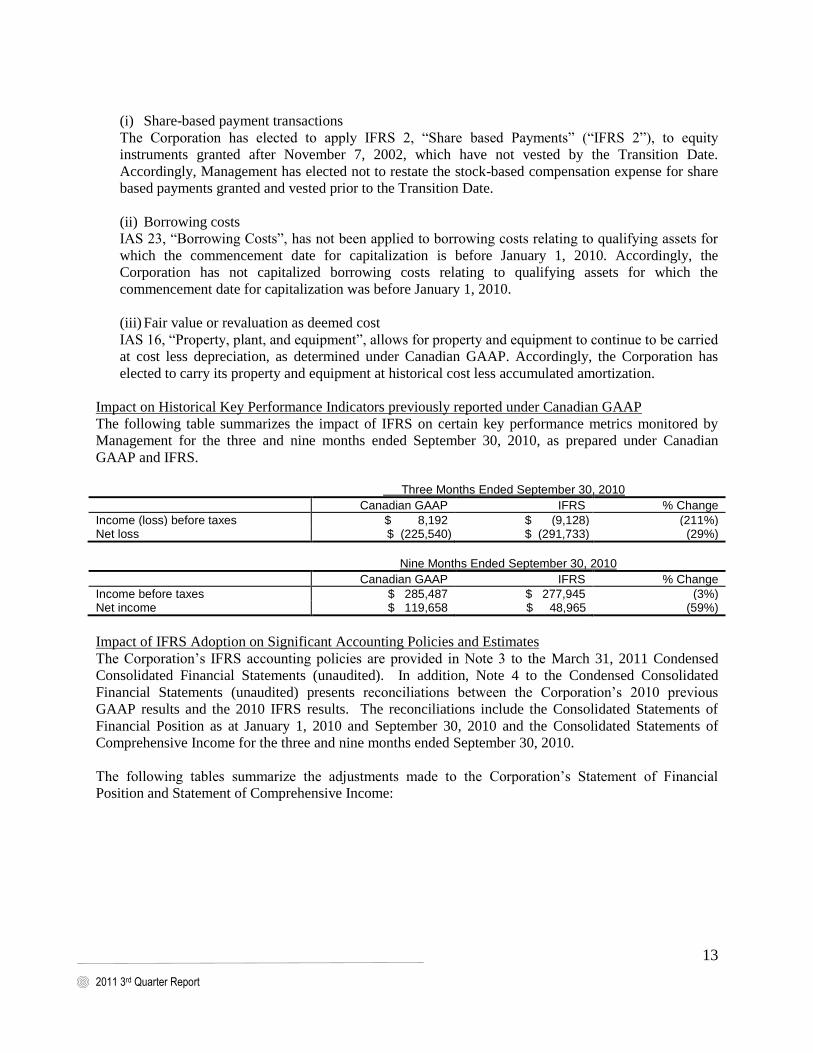
Impact on Historical Key Performance Indicators previously reported under Canadian GAAP
The following table summarizes the impact of IFRS on certain key performance metrics monitored by
Management for the three and nine months ended September 30, 2010, as prepared under Canadian
GAAP and IFRS.
Three Months Ended September 30, 2010
Canadian GAAP IFRS % Change
Income (loss) before taxes $ 8,192 $ (9,128) (211%) Net loss $ (225,540) $ (291,733) (29%)
Nine Months Ended September 30, 2010
Canadian GAAP IFRS % Change
Income before taxes $ 285,487 $ 277,945 (3%) Net income $ 119,658 $ 48,965 (59%)
Impact of IFRS Adoption on Significant Accounting Policies and Estimates
The Corporation’s IFRS accounting policies are provided in Note 3 to the March 31, 2011 Condensed
Consolidated Financial Statements (unaudited). In addition, Note 4 to the Condensed Consolidated
Financial Statements (unaudited) presents reconciliations between the Corporation’s 2010 previous
GAAP results and the 2010 IFRS results. The reconciliations include the Consolidated Statements of
Financial Position as at January 1, 2010 and September 30, 2010 and the Consolidated Statements of
Comprehensive Income for the three and nine months ended September 30, 2010.
The following tables summarize the adjustments made to the Corporation’s Statement of Financial
Position and Statement of Comprehensive Income:

2011 3rd Quarter Report
14
September 30, 2010
January 1, 2010
Deficit as reported under Canadian GAAP
$ (9,879,886)
$ (9,999,544)
IFRS adjustments increase (decrease):
Stock-based compensation (82,333) (76,693) Property and equipment (14,830) (15,541) Software development costs (4,710,820) (4,670,822) Deferred tax 1,252,502 1,318,514 Provisions 73,417 - Long-term debt (33,171) -
(3,515,235) (3,444,542)
Deficit as reported under IFRS
$ (13,395,121)
$ (13,444,086)
Three Months Ended September 30, 2010
Nine Months Ended September 30, 2010
Net income (loss) as reported under Canadian GAAP
$ (225,540)
$ 119,658
IFRS adjustments increase (decrease):
Stock-based compensation (6,326) (5,642) General and administrative 11,433 40,244 Amortization of property and equipment 235 712 Amortization of intangibles (22,662) (42,856) Foreign exchange loss - - Deferred tax (48,873) (63,151)
(66,193) (70,693)
Net income (loss) as reported under IFRS
$ (291,733)
$ 48,965
An explanation of how the transition from Canadian GAAP to IFRS has affected the Corporation’s
Statement of Financial Position is set out below, and is based on the standards as published on the
Corporation’s Transition Date. Accordingly, the opening IFRS Statement of Financial Position and the
December 31, 2010 comparative Statement of Financial Position presented in the consolidated financial
statements for the year ended December 31, 2011, may differ from those presented at this time.
Stock-Based Compensation
Under Canadian GAAP, the Corporation recognized stock-based compensation expense with graded
vesting features on a straight-line basis over the vesting period. Under IFRS, the Corporation is required
to treat each “tranche” of a stock-based compensation arrangement as a separate grant which results in the
recognition of compensation expense on an accelerated basis as compared to Canadian GAAP. Further,
IFRS requires that an estimate of the number of awards expected to vest be accounted for at the date of
the grant. As a result, this increased contributed surplus and increased deficit by $76,693 at the date of
transition and increased employee stock option benefits by $6,326 and $5,642 for the three and nine
months ended September 30, 2010.
Property and Equipment
Under Canadian GAAP, the Corporation included vendor distribution rights in its property and
equipment. IFRS requires that these items be shown as an intangible asset. The resulting change
decreased property and equipment by $15,541 and increased intangible assets by $15,541 at the date of
transition. Amortization of property and equipment expense decreased by $235 and $712 for the three
and nine months ended September 30, 2010.
2011 3rd Quarter Report
15
As well, under Canadian GAAP, the Corporation measured property and equipment at amortized cost.
IFRS permits items of property and equipment to be measured either at fair value or amortized cost. In
this regard, the Corporation expects to continue to reflect property and equipment at its historic amortized
cost. Further, IFRS requires that significant asset parts (i.e. components) are recognized and depreciated
separately. The Corporation has assessed componentization under IFRS to be similar to how assets have
been componentized by the Corporation and the impact on Quorum’s Condensed Statement of Financial
Position upon adoption of IFRS was $nil.
Software Development Costs
Under Canadian GAAP, the Corporation amortized its software development costs using the units of
production method. Under IFRS the Corporation will use a ten year, straight-line amortization method.
Amortization of intangible assets expense increased by $22,662 for the three months ended September 30,
2010 and increased by $42,856 for the nine months ended September 30, 2010.
Deferred Income Taxes
Under Canadian GAAP, the Corporation used the liability method of tax allocation for current and future
income taxes. Under IFRS, a deferred tax asset is recognized for the carry-forward of unused tax losses
and unused tax credits to the extent that it is probable that future taxable profit will be generated to utilize
these unused tax losses and unused tax credits. Based on current and forecasted taxable profits, the
Corporation expects to use these losses and credits, so there has been no change in the carrying value of
its deferred tax asset upon adoption of IFRS.
The conversion to IFRS has changed the deferred tax asset balance as a result of the new accounting
values of the intangible assets. The deferred tax asset increased by $1,318,514 as of the transition date.
Provisions
Under Canadian GAAP, the Corporation recognized amounts due to Central Consulting Services as long-
term payables/long-term debt. Under IFRS, these amounts are classified as a provision because it is a
liability of uncertain timing. The effect of this change in classification at the transition date is to increase
provisions by $29,929 with a corresponding decrease to accounts payable and accrued liabilities, and
decreased general and administrative expense by $11,433 and $40,244 for each of the three and nine
months ended September 30, 2010.
Impairment of Assets
Under Canadian GAAP, intangible assets were recognized as one overall asset. Under IFRS, the
intangible assets are broken down based on their cash generating units (“CGU”) levels and tested for
impairment on an annual basis. The Corporation has analyzed the intangible asset and it has been
separated into three CGUs; General Motors (“GM”) Canadian Dealerships, General Motors US
Dealerships, and Other OEM Dealerships. Under IFRS, if the carrying value of each CGU exceeds the
greater of the fair value less cost to sell or value in use, an impairment loss is recognized in the CGU.
Based on the impairment test, software development costs for the General Motors US Dealerships, and
the Other OEM Dealerships were impaired. As a result, the intangible asset balance in the GM US CGU
was decreased by $3,413,404 and the intangible asset balance in the Other OEM Dealerships CGU was
decreased by $1,272,959 for a total of intangible asset writedown of $4,686,363 and a corresponding
increase in the cumulative deficit of $4,686,363 at the transition date. In addition, $15,541 for Vendor
Distribution rights was reallocated from Property and Equipment to Intangible Assets for a total
Intangible Asset adjustment of $4,670,822.

2011 3rd Quarter Report
16
Internal Controls
The conversion to IFRS does not have a significant impact on the Corporation’s current control
environment, business processes, financial systems or IT systems. There have been no significant
changes in Quorum’s internal control over financial reporting during the nine-month period ended
September 30, 2011, which have materially affected, or are reasonably likely to materially affect, the
Corporation’s internal control over financial reporting.
Estimates and Judgments
As a routine element of the financial statement preparation process, management is required to make
estimates and assumptions based on information available as at the financial statement date. These
estimates and assumptions affect the reported amounts of assets and liabilities, the possible disclosure of
contingent assets and liabilities at the date of the condensed consolidated financial statements and the
reported amounts of revenue and expenses for the period.
Although estimates and assumptions must be made during the financial statement preparation process, it
is management’s opinion that none of the estimates or assumptions were highly uncertain at the time they
were made. The most significant estimates in Quorum’s condensed consolidated financial statements are
the impairment of intangibles, amortization of property and equipment and intangibles, deferred income
taxes and stock-based compensation.
Future Accounting Pronouncements All accounting standards effective for periods beginning on or after January 1, 2011, have been adopted
as part of the transition to IFRS.
In May 2011, the IASB issued the following new and amended standards:
IFRS 9, “Financial Instruments” is intended to replace IAS 39 “Financial Instruments:
Recognition and Measurement”. For financial assets, IFRS 9 uses a single approach to determine
whether a financial asset is measured at amortized cost or fair value, and replaces the multiple
rules in IAS 39. The new standard also requires a single impairment method to be used, replacing
the multiple impairment methods in IAS 39. For financial liabilities, although the classification
criteria for financial liabilities will not change under IFRS 9, the approach to the fair value option
for financial liabilities may require different accounting for changes to the fair value of a financial
liability as a result of changes to an entity’s own credit risk;
IFRS 10, “Consolidated Financial Statements” (“IFRS 10”) replaces IAS 27, “Consolidated and
Separate Financial Statements” (“IAS 27”) and Standing Interpretations Committee (“SIC”) 12,
“Consolidation – Special Purpose Entities”. IFRS 10 revises the definition of control and focuses
on the need to have power and variable returns for control to be present. IFRS 10 provides
guidance on participating and protective rights and also addresses the notion of “de facto”
control. It also includes guidance related to an investor with decision making rights to determine
if it is acting as a principal or agent;
IFRS 13, “Fair Value Measurement” (“IFRS 13”) provides a consistent and less complex
definition of fair value, establishes a single source for determining fair value, and introduces
consistent requirements for disclosures related to fair value measurement;
IAS 1, “Presentation of Financial Statements” (“IAS 1”) requires companies to group items
presented within Other Comprehensive Income based on whether they may be subsequently
reclassified to profit or loss. This amendment to IAS 1 is effective for annual periods beginning
on or after July 1, 2012 with full retrospective application; and
IAS 27, “Separate Financial Statements” has been amended to conform to the changes made in
IFRS 10 but retains the current guidance for separate financial statements

2011 3rd Quarter Report
17
Except as noted above, all of the above pronouncements are effective for annual periods beginning on or
after January 1, 2013, with early adoption permitted. The Corporation is currently evaluating the impact
of adopting these standards.
Outlook The automotive dealership market has traditionally implemented older, character-based technology for its
in-house systems. However, in recent years the auto manufacturers have worked towards developing
numerous new electronic interfaces between their systems and the auto dealerships’ systems. As a
Windows-based, fully-integrated product, XSELLERATOR is one of the most technologically advanced
software products in the DMS field, and as such, is able to implement the new electronic interfaces more
quickly and effectively than its competitors that utilize older technology. The Corporation anticipates that
there will be a considerable amount of demand from the auto dealership industry to upgrade to the latest
technology, and for companies that utilize new technology in order to electronically interface with the
auto manufacturers. This provides a unique opportunity for the Corporation to market its XSELLERATOR
product both at the dealership and the manufacturer level.
The Corporation believes that its success depends largely upon the following factors:
Financial health of the automotive industry including dealerships and manufacturers.
Sales, installations and support of the Corporation’s XSELLERATOR product.
Continued enhancements and upgrades contained in the new version releases of the Corporation’s
proprietary software product, XSELLERATOR.
The ability of the Corporation to attract and retain top quality people.
The ability of the Corporation to attract and leverage quality business partners to help accelerate
the Corporation’s growth and penetration into the expanding marketplace.
Development of business processes and standardization of those processes, to facilitate the
implementation and support of XSELLERATOR on a global scale.
Building and maintaining positive relationships with the automotive manufacturers, and in
particular GM Canada and GM U.S. through the IDMS contract.
Continued financial support from the Atlantic Canada Opportunities Agency (ACOA) and the
Newfoundland and Labrador provincial government.
Continued access to capital to fund growth and meet debt repayment obligations, which may not
be able to be funded from internal sources.
Management expects sales from its suite of DMS software products will continue to grow over the next
several years. Management is committed to enhancing its market share in the DMS software market in
both Canada and the U.S. However, it is difficult to forecast the Corporation’s sales and market share
with precision due to factors such as: the nature of the automotive industry; acceptance of XSELLERATOR;
the overall sales cycle; and the continued support of GM and approvals from other auto manufacturers.
Forward-Looking Statements Forward-looking statements are not guarantees of future performance. They involve risks, uncertainties
and assumptions and the Corporation’s actual results may differ materially from those anticipated in these
forward-looking statements. Factors which may cause such differences include, but are not limited to
those set forth under “Business Risks”. The Corporation does not take any obligation to release any public
information of the results of any revision to these forward-looking statements, which may be made to
reflect events or circumstances occurring in the future, except as required by securities regulations.

2011 3rd Quarter Report
18
Business Risks The Corporation faces key risks, including adequacy of capital and/or cash flow to pursue its business
plan objectives, reliance on relatively few key suppliers and customers, and the emergence of superior
competing technologies. This list is not intended to be exhaustive, but merely to communicate to
shareholders certain key risks faced by the Corporation in its business.
Liquidity Risk As discussed in the Cash flow section above, in April 2008 the Corporation issued the Debenture ($1.5
million) to fund operations. The Debenture was secured by a fixed and floating charge on all assets and
was convertible any time prior to maturity. The debenture was retired on December 15, 2010.
Customer Concentration Risk Although the Corporation has been expanding its coverage of various dealership brands, a significant
portion of its business is conducted with General Motors Corporation and its dealerships in both Canada
and the U.S. Prior to GM entering bankruptcy protection on June 1, 2009, over 90% of Quorum’s 225
active dealership rooftops were GM dealerships. Currently approximately 75% of Quorum’s 250 active
dealership rooftops are GM dealerships.
Quorum’s product strategy has moved to a much stronger focus on new OEM business partners, with the
intention of expanding the system to support other makes. Over time, this strategy will continue to
diversify our customer base; however, GM franchises will remain a key focus for the organization. It is
important to Quorum’s success for GM to continue to make significant progress on its North American
and International business plan.
Server Reliability Risk Quorum’s XSELLERATOR product operates on a server that is installed at the dealership. Server up-time,
data backup, virus protection and disaster recovery are critical to our customers and Quorum. To ensure
the highest level of continuity of service for our customers Quorum has deployed:
- Rigorous installation and migration procedures to ensure server consistency.
- Strong change control, including automated tools to manage many of our changes, on all
dealership servers to maintain server consistency.
- Approved application lists and related controls, to ensure that applications follow a testing
process before they are installed on dealership servers.
- Servers with both redundant hard drives and power supplies.
- Support agreements with our hardware providers to supply 24 hour support – seven days a week.
Typically the service agreements also have four hour response times.
- Web-based backup to Microsoft’s cloud data backup are monitored by a Server View application
built by Quorum
- Anti-virus protection that is monitored by Server View.
- A disaster recovery environment located at Quorum’s St. John’s office. This is an optional
service that dealerships can subscribe to.
Server downtime and lost data cost our customers in terms of lost productivity and will result in a
financial impact to our customers. Although Quorum cannot guarantee continuity of service, we have
taken numerous steps to help protect our customers.
Quorum attempts to mitigate these risks through various strategic and operating mechanisms such as
ongoing research and development to maintain XSELLERATOR’s position as one of the most advanced
products in the automotive DMS field, fair and equitable compensation and workplace policies, flexibility
in operational decision making, review and discussion of competitors’ policies to maintain market

2011 3rd Quarter Report
19
advantage, and ongoing interaction with both debt and capital markets. Management believes these
strategies reduce the Corporation’s business risk to an acceptable level, which will allow the Corporation
to continue to grow and maximize shareholder value.
Despite the Corporation’s attempts to mitigate key risks, shareholders should be aware that the
information technology industry is subject to rapid technological change, and the products and services
provided by the Corporation are also expected to be subject to rapid technological changes. To remain
competitive, the Corporation must be able to keep pace with the technological developments in this
industry and change its product and service lines to meet new demands. The Corporation will depend on
research and development for improvements and enhancements to XSELLERATOR, and the introduction of
new products and services that have not been commercially tested to accelerate its future growth. The
Corporation has a proven track record of success in innovative product design and enhancements, and has
the expertise and the capital backing in place to continue it.

2011 3rd Quarter Report
20
2011 3rd Quarter Condensed Consolidated Financial Statements (unaudited)
2011 3rd Quarter Report
21
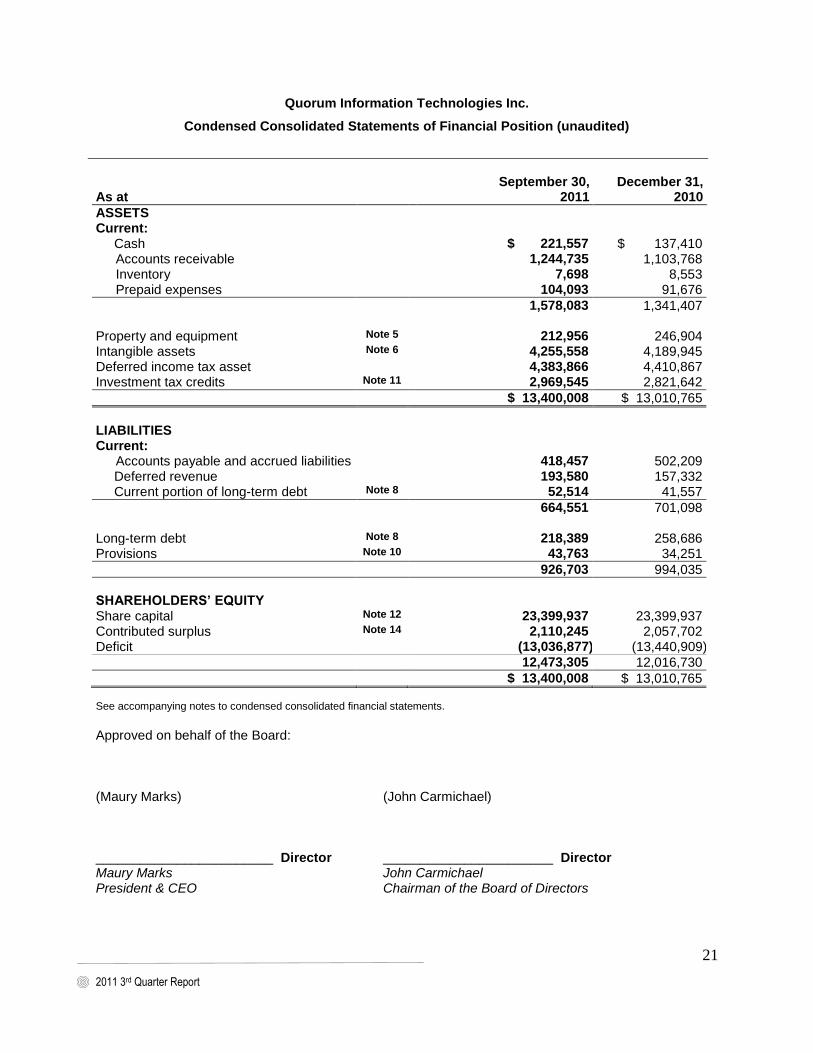
Quorum Information Technologies Inc.
Condensed Consolidated Statements of Financial Position (unaudited)
As at
September 30, 2011
December 31, 2010
ASSETS Current: Cash $ 221,557 $ 137,410 Accounts receivable 1,244,735 1,103,768 Inventory 7,698 8,553 Prepaid expenses 104,093 91,676
1,578,083 1,341,407 Property and equipment Note 5 212,956 246,904 Intangible assets Note 6 4,255,558 4,189,945 Deferred income tax asset 4,383,866 4,410,867 Investment tax credits Note 11 2,969,545 2,821,642
$ 13,400,008 $ 13,010,765
LIABILITIES Current: Accounts payable and accrued liabilities 418,457 502,209 Deferred revenue 193,580 157,332 Current portion of long-term debt Note 8 52,514 41,557
664,551 701,098 Long-term debt Note 8 218,389 258,686 Provisions Note 10 43,763 34,251
926,703 994,035
SHAREHOLDERS’ EQUITY Share capital Note 12 23,399,937 23,399,937 Contributed surplus Note 14 2,110,245 2,057,702 Deficit (13,036,877) (13,440,909)
12,473,305 12,016,730
$ 13,400,008 $ 13,010,765 See accompanying notes to condensed consolidated financial statements.
Approved on behalf of the Board: (Maury Marks) (John Carmichael) ________________________ Director _______________________ Director Maury Marks John Carmichael President & CEO Chairman of the Board of Directors

2011 3rd Quarter Report
22
Quorum Information Technologies Inc.
Condensed Consolidated Statements of Comprehensive Income (unaudited)
Period ended
Three months
ended September
30, 2011
Three months
ended September
30, 2010
Nine months
ended September
30, 2011
Nine months
ended September
30, 2010 Gross revenue $ 1,874,497 $1,862,811 $ 5,616,280 $ 5,839,898
Third party costs (direct) 202,702 259,077 748,969 1,022,444 Salaries and benefits (direct) 566,599 545,170 1,638,744 1,520,442
Gross profit 1,105,196 1,058,564 3,228,567 3,297,012
Expenses Salaries and benefits (indirect) 446,672 389,564 1,358,509 1,307,955 Government assistance Note 9 (60,149) (41,822) (145,077) (124,129) Stock-based compensation Note 13 17,479 36,066 52,543 105,522 General and administrative 290,695 316,555 900,619 900,654 Sales and marketing 55,856 56,875 181,129 166,304 Interest expense on long-term debt 12,785 79,456 45,658 230,833 Bank charges and other interest
expense
6,148
11,794
19,571
18,722 Amortization of intangible assets 119,419 100,422 350,120 302,796 Amortization of property and
equipment
16,227
19,995
48,618
59,858 Amortization of software licenses
held for resale
-
1,442
-
4,326 Foreign exchange loss (gain) (187,011) 97,345 (116,791) 46,226
Total expenses 718,121 1,067,692 2,694,899 3,019,067
Income before income taxes 387,075 (9,128) 533,668 277,945 Future income tax expense
(recovery)
(24,263)
282,605
129,636
228,980
Net income (loss) and
comprehensive income (loss)
411,338
(291,733)
404,032
48,965
Net income (loss) per share - Basic Note 12 $ 0.0105 $ (0.0074) $ 0.0103 $ 0.0012 - Diluted $ 0.0105 $ (0.0074) $ 0.0103 $ 0.0012 Weighted average number of
common shares
- Basic 39,298,438 39,298,438 39,298,438 39,298,438 - Diluted 39,298,438 39,298,438 39,684,319 42,786,319
See accompanying notes to condensed consolidated financial statements.
2011 3rd Quarter Report
23
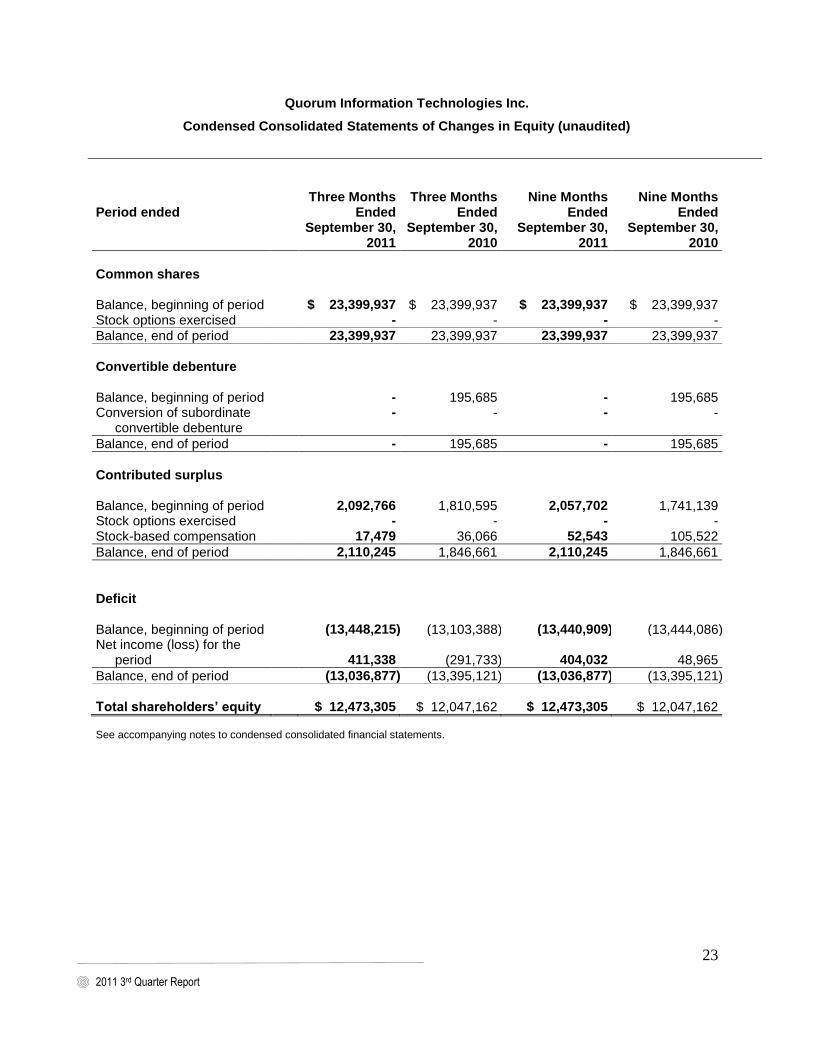
Quorum Information Technologies Inc.
Condensed Consolidated Statements of Changes in Equity (unaudited)
Period ended
Three Months
Ended September 30,
2011
Three Months
Ended September 30,
2010
Nine Months
Ended September 30,
2011
Nine Months
Ended September 30,
2010
Common shares Balance, beginning of period
$ 23,399,937
$ 23,399,937
$ 23,399,937
$ 23,399,937
Stock options exercised - - - -
Balance, end of period 23,399,937 23,399,937 23,399,937 23,399,937 Convertible debenture Balance, beginning of period
-
195,685
-
195,685
Conversion of subordinate convertible debenture
- - - -
Balance, end of period - 195,685 - 195,685
Contributed surplus Balance, beginning of period
2,092,766
1,810,595
2,057,702
1,741,139
Stock options exercised - - - - Stock-based compensation 17,479 36,066 52,543 105,522
Balance, end of period 2,110,245 1,846,661 2,110,245 1,846,661
Deficit Balance, beginning of period
(13,448,215)
(13,103,388)
(13,440,909)
(13,444,086)
Net income (loss) for the period
411,338
(291,733)
404,032
48,965
Balance, end of period (13,036,877) (13,395,121) (13,036,877) (13,395,121) Total shareholders’ equity $ 12,473,305 $ 12,047,162 $ 12,473,305 $ 12,047,162 See accompanying notes to condensed consolidated financial statements.

2011 3rd Quarter Report
24
Quorum Information Technologies Inc.
Condensed Consolidated Statements of Cash Flows (unaudited)
Period ended Three months
ended September
30, 2011
Three months ended
September 30, 2010
Nine months ended
September 30, 2011
Nine months ended
September 30, 2010
Cash flow from operating activities
Cash receipts from customers $ 1,769,705 $ 2,063,729 $ 5,511,562 $ 6,004,644 Cash paid to suppliers and employees (1,555,388) (1,709,671) (4,754,381) (4,964,453)
Interest paid (51,804) (55,591) (65,228) (152,287)
162,513 298,467 691,953 887,904
Cash flow from financing activities
Proceeds from long-term debt - - - 25,000 Proceeds from SR&ED 122,232 85,665 122,232 164,523 Repayment of long-term debt (12,216) (8,563) (29,342) (19,119)
110,016 77,102 92,890 170,404
Cash flow from investing activities
Purchase of property and equipment (6,045) (1,548) (14,829) (2,457)
Software development costs (230,864) (293,419) (685,867) (769,725)
(236,909) (294,967) (700,696) (772,182)
Increase in cash 35,620 80,602 84,147 286,126
Cash, beginning of period 185,937 1,549,306 137,410 1,343,782
Cash, end of period $ 221,557 $ 1,629,908 $ 221,557 $ 1,629,908
See accompanying notes to condensed consolidated financial statements.
2011 3rd Quarter Report
25
Quorum Information Technologies Inc. Notes to the Condensed Consolidated Financial Statements (unaudited)
1. Nature of Operations
Quorum Information Technologies Inc. (“Quorum” or the “Corporation”) is an information technology company that focuses on the automotive retail business in Canada and the U.S. and is incorporated under the Business Corporations Act of Alberta. Quorum develops, markets, implements and supports its own software product, XSELLERATOR™, a Dealership Management System, for the automotive market.
2. Basis of Presentation
(a) Statement of compliance
In 2010, the Handbook of the Canadian Institute of Chartered Accountants (“CICA Handbook”) was revised to incorporate International Financial Reporting Standards (“IFRS”) and requires publicly accountable enterprises to apply such standards effective for years beginning on or after January 1, 2011. Accordingly, the Corporation commenced reporting on this basis in the March 31, 2011 interim consolidated financial statements. In these financial statements, the term “Canadian GAAP” refers to Canadian generally accepted accounting principles before the adoption of IFRS. These financial statements have been prepared in accordance with International Accounting Standard 34 (“IAS 34”), “Interim Financial Reporting” as issued by the International Accounting Standards Board and using the accounting policies the Corporation expects to adopt in its consolidated financial statements for the year ending December 31, 2011, which will be the Corporation’s first consolidated annual financial statements prepared in accordance with IFRS. IFRS requires an entity to adopt IFRS in its first annual financial statements by making an explicit and unreserved statement in those financial statements of compliance with IFRS. The Corporation will make this statement when it issues its 2011 annual financial statements. IFRS 1, “First-time Adoption of International Financial Reporting Standards”, has been applied with a transition date of January 1, 2010. An explanation of how the transition to IFRS has affected the reported financial position, financial performance, and cash flows of the Corporation, including the nature and effect of significant changes in accounting policies from those used in the Corporation’s consolidated financial statements for the year ended December 31, 2010, is provided in note 4. These unaudited consolidated financial statements were authorized for issue by the Board of Directors on November 18, 2011.
(b) Basis of measurement The consolidated financial statements have been prepared on a going concern basis using the historical cost convention, except financial instruments at fair value through profit or loss are measured at fair value.
(c) Functional and presentation currency These consolidated financial statements are presented in Canadian dollars, which is the Corporation’s functional currency. Foreign currency transactions are translated into the functional currency using exchange rates prevailing at the date of the transactions. At the end of each reporting period, foreign currency denominated monetary assets and liabilities are translated to the functional currency using the prevailing rate of exchange at the statement of financial position date. Gains and losses on translation of monetary items are recognized in the comprehensive income statement, except for those foreign exchange gains or losses arising from a monetary item receivable from or
2011 3rd Quarter Report
26
Quorum Information Technologies Inc. Notes to the Condensed Consolidated Financial Statements (unaudited)
2. Basis of Presentation (continued)
payable to a foreign operation, the settlement of which is neither planned nor likely to occur in the foreseeable future and which in substance is considered to form part of the net investment in the foreign operation, are recognized in other comprehensive income in the cumulative translation account. Assets and liabilities of subsidiaries having a functional currency other than the Canadian dollar are translated at the rate of exchange at the statement of financial position date. Revenues and expenses are translated at average rates for the period, unless exchange rates fluctuated significantly during the period, in which case the exchange rates at the dates of the transaction are used. The resulting foreign currency translation adjustments are recognized in other comprehensive income (“OCI”).
(d) Recent accounting pronouncements In May 2011, the IASB issued the following new and amended standards:
IFRS 9, “Financial Instruments” is intended to replace IAS 39 “Financial Instruments: Recognition and Measurement”. For financial assets, IFRS 9 uses a single approach to determine whether a financial asset is measured at amortized cost or fair value, and replaces the multiple rules in IAS 39. The new standard also requires a single impairment method to be used, replacing the multiple impairment methods in IAS 39. For financial liabilities, although the classification criteria for financial liabilities will not change under IFRS 9, the approach to the fair value option for financial liabilities may require different accounting for changes to the fair value of a financial liability as a result of changes to an entity’s own credit risk;
IFRS 10, “Consolidated Financial Statements” (“IFRS 10”) replaces IAS 27, “Consolidated and Separate Financial Statements” (“IAS 27”) and Standing Interpretations Committee (“SIC”) 12, “Consolidation – Special Purpose Entities”. IFRS 10 revises the definition of control and focuses on the need to have power and variable returns for control to be present. IFRS 10 provides guidance on participating and protective rights and also addresses the notion of “de facto” control. It also includes guidance related to an investor with decision making rights to determine if it is acting as a principal or agent;
IFRS 13, “Fair Value Measurement” (“IFRS 13”) provides a consistent and less complex definition of fair value, establishes a single source for determining fair value, and introduces consistent requirements for disclosures related to fair value measurement;
IAS 1, “Presentation of Financial Statements” (“IAS 1”) requires companies to group items presented within Other Comprehensive Income based on whether they may be subsequently reclassified to profit or loss. This amendment to IAS 1 is effective for annual periods beginning on or after July 1, 2012 with full retrospective application; and
IAS 27, “Separate Financial Statements” has been amended to conform to the changes made in IFRS 10 but retains the current guidance for separate financial statements.
Except as noted above, all of the above pronouncements are effective for annual periods beginning on or after January 1, 2013, with early adoption permitted. The Corporation is currently evaluating the impact of adopting these standards.

2011 3rd Quarter Report
27
Quorum Information Technologies Inc. Notes to the Condensed Consolidated Financial Statements (unaudited)
3. Significant Accounting Policies
These unaudited interim consolidated financial statements have been prepared by management of the Corporation in accordance with IAS 34 following the same accounting principles and methods of computation as outlined in the Corporation’s unaudited interim consolidated financial statements for the three months ending March 31, 2011. These unaudited interim consolidated financial statements include all necessary disclosures required for interim financial statements but do not include all disclosures required for annual financial statements. Therefore, these interim consolidated financial statements should be read in conjunction with the most recent audited annual consolidated financial statements and the notes thereto for the year ended December 31, 2010, and the disclosures and accounting policies included in the unaudited consolidated financial statements as at and for the three months ended March 31, 2011.
4. Explanation of Transition to IFRS
The Corporation has adopted IFRS effective January 1, 2010, (“the Transition Date”) and has prepared its opening IFRS statement of financial position as at that date. Prior to the adoption of IFRS the Corporation prepared its financial statements in accordance with Canadian generally accepted accounting principles (“Canadian GAAP”). The Corporation’s consolidated financial statements for the year ending December 31, 2011, will be the first annual financial statements prepared under IFRS. The Corporation will ultimately prepare its opening IFRS statement of financial position by applying existing IFRS with an effective date of December 31, 2011. Accordingly, the opening IFRS statement of financial position and the December 31, 2010, comparative statement of financial position presented in the consolidated financial statements for the year ending December 31, 2011, may differ from those presented at this time. Mandatory exceptions to retrospective application In preparing these financial statements in accordance with IFRS, the Corporation has applied certain mandatory exceptions from full retrospective application of IFRS. The mandatory exceptions applied are: Estimates Estimates previously made by the Corporation under Canadian GAAP are consistent with those under IFRS. Hindsight was not used to create or revise previous estimates. Elected exemptions to retrospective application IFRS 1 “First-time Adoption of International Financial Reporting Standards” allows for certain elected exemptions from full retrospective application of IFRS. The Corporation has applied certain of the optional exemptions from full retrospective application of IFRS. Based on management’s analysis of the various accounting policy choices available, the IFRS 1 optional exemptions applied are described below:

2011 3rd Quarter Report
28
Quorum Information Technologies Inc. Notes to the Condensed Consolidated Financial Statements (unaudited)
4. Explanation of Transition to IFRS (continued)
(i) Share-based payment transactions The Corporation has elected to apply IFRS 2, “Share-based Payments” (“IFRS 2”), to equity instruments granted after November 7, 2002, which have not vested by the Transition Date. Accordingly, Management has elected not to restate the stock-based compensation expense for share-based payments granted and vested prior to the Transition Date. (ii) Borrowing costs IAS 23, “Borrowing Costs”, has not been applied to borrowing costs relating to qualifying assets for which the commencement date for capitalization is before January 1, 2010. Accordingly, the Corporation has not capitalized borrowing costs relating to qualifying assets for which the commencement date for capitalization was before January 1, 2010. (iii) Fair value or revaluation as deemed cost IAS 16, “Property, plant, and equipment”, allows for property and equipment to continue to be carried at cost less depreciation, as determined as under Canadian GAAP. Accordingly, the Corporation has elected to carry its property and equipment at historical cost less accumulated amortization. Reconciliation of equity and comprehensive income as reported under Canadian GAAP and IFRS In preparing its opening IFRS consolidated statement of financial position, the Corporation has adjusted amounts previously reported in the financial statements prepared in accordance with Canadian GAAP. An explanation of how the transition from Canadian GAAP to IFRS has affected the Corporation’s consolidated statements of financial position, comprehensive income, and cash flows is set out in the following tables and the notes that accompany the tables.

2011 3rd Quarter Report
29
Quorum Information Technologies Inc. Notes to the Condensed Consolidated Financial Statements (unaudited)
4. Explanation of Transition to IFRS (continued)
Reconciliation of financial position:
As at
September 30, 2010 January 1, 2010
Note
Canadian GAAP
Effect of transition
to IFRS
IFRS
Canadian GAAP
Effect of transition
to IFRS
IFRS
ASSETS Current: Cash 1,629,908 - 1,629,908 1,343,782 - 1,343,782 Accounts receivable 972,296 - 972,296 1,200,435 - 1,200,435 Inventory 10,679 - 10,679 2,377 - 2,377 Prepaid expenses 96,559 - 96,559 88,458 - 88,458
2,709,442 - 2,709,442 2,635,052 2,635,052 Property & equipment c 277,028 (14,830) 262,198 335,148 (15,541) 319,607 Intangible assets b 8,755,715 (4,710,820) 4,044,895 8,755,135 (4,670,822) 4,084,313 Software licenses held
for resale
1,442
-
1,442
5,767
-
5,767 Deferred tax asset d 3,272,857 1,252,502 4,525,359 3,481,822 1,318,514 4,800,336 Investment tax credits 2,821,642 - 2,821,642 2,477,564 - 2,477,564
17,838,126 (3,473,148) 14,364,978 17,690,488 (3,367,849) 14,322,639
LIABILITES
Current: Accounts payable and
accrued liabilities
361,650
-
361,650
517,984
(29,929)
488,055 Deferred revenue 166,306 - 166,306 229,698 - 229,698 Current portion of long-
term debt
1,485,788
-
1,485,788
27,940
-
27,940 Deferred government
assistance
-
-
-
15,900
-
15,900
2,013,744 - 2,013,744 791,522 (29,929) 761,593 Long-term debt 344,318 (73,417) 270,901 260,558 - 260,558 Provisions e - 33,171 33,171 - 29,929 29,929 Convertible debenture - - - 1,377,883 - 1,377,883
2,358,062 (40,246) 2,317,816 2,429,963 - 2,429,963 SHAREHOLDERS’ EQUITY
Share capital 23,399,937 - 23,399,937 23,399,937 - 23,399,937 Convertible debenture 195,685 - 195,685 195,685 - 195,685 Contributed surplus a 1,764,328 82,333 1,846,661 1,664,447 76,693 1,741,140 Deficit f (9,879,886) (3,515,235) (13,395,121) (9,999,544) (3,444,542) (13,444,086)
15,480,064 (3,432,902) 12,047,163 15,260,525 (3,367,849) 11,892,676
17,838,126 (3,473,148) 14,364,978 17,690,488 (3,367,849) 14,333,639
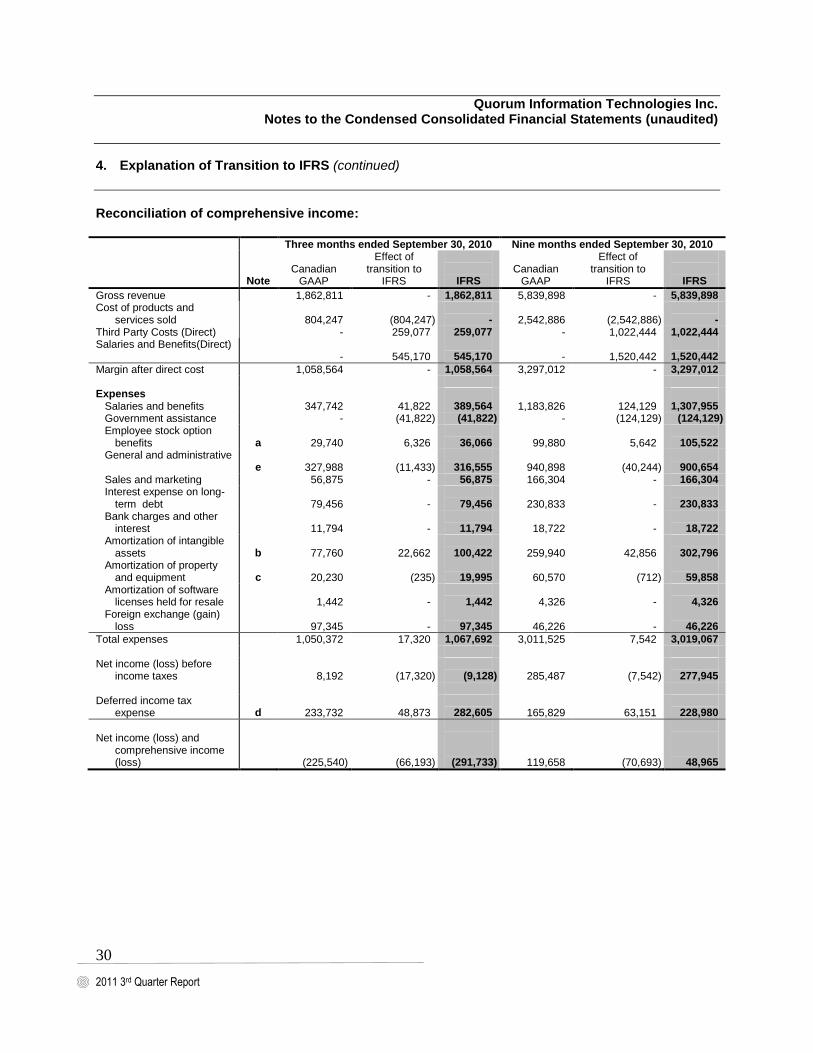
2011 3rd Quarter Report
30
Quorum Information Technologies Inc. Notes to the Condensed Consolidated Financial Statements (unaudited)
4. Explanation of Transition to IFRS (continued)
Reconciliation of comprehensive income: Three months ended September 30, 2010 Nine months ended September 30, 2010
Note
Canadian
GAAP
Effect of transition to
IFRS
IFRS
Canadian
GAAP
Effect of transition to
IFRS
IFRS
Gross revenue 1,862,811 - 1,862,811 5,839,898 - 5,839,898 Cost of products and
services sold
804,247
(804,247)
-
2,542,886
(2,542,886)
- Third Party Costs (Direct) - 259,077 259,077 - 1,022,444 1,022,444 Salaries and Benefits(Direct)
-
545,170
545,170
-
1,520,442
1,520,442
Margin after direct cost 1,058,564 - 1,058,564 3,297,012 - 3,297,012 Expenses Salaries and benefits 347,742 41,822 389,564 1,183,826 124,129 1,307,955 Government assistance - (41,822) (41,822) - (124,129) (124,129) Employee stock option
benefits
a
29,740
6,326
36,066
99,880
5,642
105,522 General and administrative
e
327,988
(11,433)
316,555
940,898
(40,244)
900,654 Sales and marketing 56,875 - 56,875 166,304 - 166,304 Interest expense on long-
term debt
79,456
-
79,456
230,833
-
230,833 Bank charges and other
interest
11,794
-
11,794
18,722
-
18,722 Amortization of intangible
assets
b
77,760
22,662
100,422
259,940
42,856
302,796 Amortization of property
and equipment
c
20,230
(235)
19,995
60,570
(712)
59,858 Amortization of software
licenses held for resale
1,442
-
1,442
4,326
-
4,326 Foreign exchange (gain)
loss
97,345
-
97,345
46,226
-
46,226
Total expenses 1,050,372 17,320 1,067,692 3,011,525 7,542 3,019,067 Net income (loss) before
income taxes
8,192
(17,320)
(9,128)
285,487
(7,542)
277,945
Deferred income tax expense
d
233,732
48,873
282,605
165,829
63,151
228,980
Net income (loss) and
comprehensive income (loss)
(225,540)
(66,193)
(291,733)
119,658
(70,693)
48,965

2011 3rd Quarter Report
31
Quorum Information Technologies Inc. Notes to the Condensed Consolidated Financial Statements (unaudited)
4. Explanation of Transition to IFRS (continued)
Note to the Reconciliations a) Stock-based compensation
Under Canadian GAAP, the Corporation recognized compensation expense associated with stock-based compensation plans on a straight-line basis over the vesting period of the option. IFRS requires each “tranche” of a stock-based compensation arrangement to be treated as a separate grant which results in accelerated recognition of compensation expense when compared to Canadian GAAP.
Additionally, IFRS requires that the expected vesting awards be accounted for at the date of the grant. The resulting change increased contributed surplus and increased deficit by $76,693 at the transition date and increased employee stock option benefits by $6,326 and $5,642 for the three and nine months ended September 30, 2010, with a corresponding increase to contributed surplus for each of the respective periods.
b) Software development costs Under Canadian GAAP, intangible assets were recognized as one overall asset. Under IFRS, the intangible assets are broken down based on their cash generating units (“CGU”) levels and tested for impairment on an annual basis. The Corporation has analyzed the intangible asset and it has been separated into three CGUs; General Motors (“GM”) Canadian Dealerships, General Motors US Dealerships, and Other OEM Dealerships. Under IFRS, if the carrying value of each CGU exceeds the greater of the fair value less cost to sell or value in use, an impairment loss is recognized in the CGU. Based on the impairment test, software development costs for the General Motors US Dealerships, and the Other OEM Dealerships were impaired. As a result, the intangible asset balance in the GM US CGU was decreased by $3,413,404 and the intangible asset balance in the Other OEM Dealerships CGU was decreased by $1,272,959 for a total of intangible asset writedown of $4,686,363 and a corresponding increase in the cumulative deficit of $4,686,363 at the transition date. In addition, $15,541 for Vendor Distribution rights was reallocated from Property and Equipment to Intangible Assets for a total Intangible Asset adjustment of $4,670,822.
As well, under Canadian GAAP, the Corporation amortized its software development costs using the units of production method. Under IFRS the Corporation will use a ten year, straight-line amortization method. As a result of the change in useful life, amortization of intangible assets expense increased by $22,662 for the three months ended September 30, 2010 and increased by $42,856 for the nine months ended September 30, 2010, with a corresponding decrease to intangible assets for each of the respective periods.
c) Property and equipment
Under Canadian GAAP, the Corporation included vendor distribution rights in its property and equipment. IFRS requires that these items be shown as an intangible asset. The resulting change decreased property and equipment by $15,541 and increased intangible assets by $15,541 at the transition date. Amortization of property and equipment expense decreased by $235 and $712 for the three and nine months ended September 30, 2010, with a corresponding increase to intangible assets for each of the respective periods.

2011 3rd Quarter Report
32
Quorum Information Technologies Inc. Notes to the Condensed Consolidated Financial Statements (unaudited)
4. Explanation of Transition to IFRS (continued)
d) Deferred tax asset
Under Canadian GAAP, the Corporation used the liability method of tax allocation for current and future income taxes. Under IFRS, a deferred tax asset is recognized for the carry-forward of unused tax losses and unused tax credits to the extent that it is probable that future taxable profit will be generated to utilize these unused tax losses and unused tax credits. Based on current and forecasted taxable profits, the Corporation expects to use these losses and credits, so there has been no change in the carrying value of its deferred tax asset upon adoption of IFRS. The conversion to IFRS has changed the deferred tax asset balance as a result of the new accounting values of the intangible assets. The deferred tax asset increased by $1,318,514 as of the transition date and increased the deferred income tax expense by $48,873 and $63,151 for each of the three and nine months ended September 30, 2010.
e) Provisions
Under Canadian GAAP, the Corporation recognized amounts due to Central Consulting Services as long-term payable/long-term debt. Under IFRS, these amounts are classified as a provision because it is a liability of uncertain timing. The effect of this change in classification at the transition date is to increase provisions by $29,929 with a corresponding decrease to accounts payable and accrued liabilities and long-term debt, and decreased general and administrative expense by $11,433 and $40,244 for each of the three and nine months ended September 30, 2010.
f) Summary of adjustments to Deficit The following is a summary of transitional adjustments to the Corporation’s deficit from Canadian GAAP to IFRS:
December 31, 2010
September 30, 2010
January 1, 2010
Deficit as reported under Canadian GAAP $ (9,904,461) $ (9,879,886) $ (9,999,544)
IFRS adjustments increase (decrease): Stock-based compensation Note a (89,890) (82,333) (76,693) Property and equipment Note c (14,593) (14,830) (15,541) Intangibles Note b (4,753,501) (4,710,820) (4,670,822) Deferred tax Note d 1,321,536 1,252,502 1,318,514 Provisions - 73,417 - Long-term debt - (33,171) -
(3,536,448) (3,515,235) (3,444,542)
Deficit as reported under IFRS $ (13,440,909) $ (13,395,121) $ (13,444,086)
g) Material adjustments to the consolidated statement of cash flows for 2010
Consistent with the Corporation’s accounting policy choice under IAS 7, the Statement of Cash Flows has no material difference between the statement of cash flows presented under IFRS and the statement of cash flows presented under previous Canadian GAAP.

2011 3rd Quarter Report
33
Quorum Information Technologies Inc. Notes to the Condensed Consolidated Financial Statements (unaudited)
5. Property and Equipment
The Corporation’s property and equipment comprise computer hardware and software, office equipment and leasehold improvements. The carrying amount can be analyzed as follows:
Computer Hardware
Computer Software
Office Equipment
Leasehold Improvements
Total
Gross Carrying Amount Balance at January 1, 2011 $ 928,838 $ 535,718 $ 393,224 $ 85,101 $1,942,881 Additions 10,151 729 2,274 1,675 14,829 Disposals - - - - - Revaluation increase - - - - - Net exchange differences - - - - -
Balance at September 30, 2011
938,989
536,447
395,498
86,776
1,957,710
Amortization and Impairment
Balance at January 1, 2011 817,128 535,718 303,381 39,750 1,695,977 Disposal - - - - - Net exchange differences 159 - - - 159 Amortization 25,550 364 13,551 9,153 48,618
Balance at September 30, 2011
842,837
536,082
316,932
48,903
1,744,754
Carrying amount September 30, 2011
$ 96,152
$ 365
$ 78,566
$ 37,873
$212,956
Computer Hardware
Computer Software
Office Equipment
Leasehold Improvements
Total
Gross Carrying Amount Balance at January 1, 2010 $ 922,336 $ 535,718 $ 391,540 $ 386,613 $2,236,207 Additions 6,502 - 1,684 - 8,186 Disposals - - - (301,512) (301,512) Revaluation increase - - - - - Net exchange differences - - - - -
Balance at December 31, 2010 928,838 535,718 393,224 85,101 1,942,881 Amortization and Impairment
Balance at January 1, 2010 770,646 535,718 281,131 329,105 1,916,600 Disposal - - - (301,512) (301,512) Net exchange differences - - - - Amortization 46,482 - 22,250 12,157 80,889
Balance at December 31, 2010 817,128 535,718 303,381 39,750 1,695,977
Carrying amount December 31, 2010
$ 111,710
$ -
$ 89,843
$ 45,351
$ 246,904

2011 3rd Quarter Report
34
Quorum Information Technologies Inc. Notes to the Condensed Consolidated Financial Statements (unaudited)
6. Intangible Assets
The Corporation’s other intangible assets comprise internally generated software development costs and vendor distribution rights. The carrying amounts for the reporting periods under review can be analyzed as follows:
Software Development Costs
Vendor Distribution Rights
Total
Gross Carrying Amount Balance at January 1, 2011 $ 11,157,328 $ 42,646 $ 11,199,974 Additions 415,732 - 415,732 Disposals - - - Net exchange differences - - -
Balance at September 30, 2011 11,573,060 42,646 11,615,706 Amortization and impairment
Balance at January 1, 2011 6,981,976 28,053 7,010,029 Amortization 349,458 661 350,119 Impairment losses - - - Disposals - - - Net exchange differences - - -
Balance at September 30, 2011 7,331,434 28,714 7,360,148
Carrying amount September 30, 2011
$ 4,241,626
$ 13,932
$ 4,255,558
Gross Carrying Amount Balance at January 1, 2010 $ 10,643,817 $ 42,646 $ 10,686,463 Additions 513,511 - 513,511 Disposals - - - Net exchange differences - - -
Balance at December 31, 2010 11,157,328 42,646 11,199,974 Amortization and impairment
Balance at January 1, 2010 6,575,045 27,105 6,602,150 Amortization 406,931 948 407,879 Impairment losses - - - Disposals - - - Net exchange differences - - -
Balance at December 31, 2010 6,981,976 28,053 7,010,029
Carrying amount December 31, 2010
$ 4,175,352
$ 14,593
$ 4,189,945
In accordance with IFRS 1, the Corporation was required to perform an impairment test of its intangible assets as of the Transition Date. The Corporation’s impairment analysis as of January 1, 2010 indicated that the recoverable amount of the net assets was below its respective carrying value and, therefore, an impairment existed. Details of the impairment are included in Note 4.
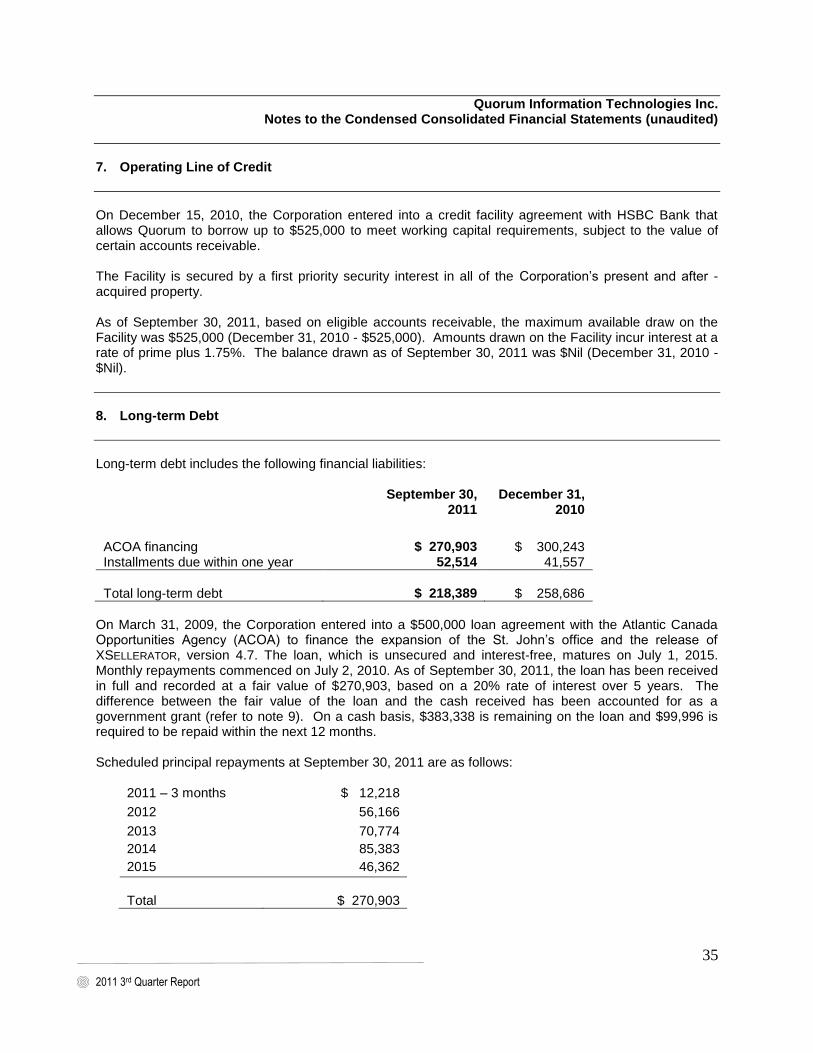
2011 3rd Quarter Report
35
Quorum Information Technologies Inc. Notes to the Condensed Consolidated Financial Statements (unaudited)
7. Operating Line of Credit
On December 15, 2010, the Corporation entered into a credit facility agreement with HSBC Bank that allows Quorum to borrow up to $525,000 to meet working capital requirements, subject to the value of certain accounts receivable. The Facility is secured by a first priority security interest in all of the Corporation’s present and after -acquired property. As of September 30, 2011, based on eligible accounts receivable, the maximum available draw on the Facility was $525,000 (December 31, 2010 - $525,000). Amounts drawn on the Facility incur interest at a rate of prime plus 1.75%. The balance drawn as of September 30, 2011 was $Nil (December 31, 2010 - $Nil).
8. Long-term Debt
Long-term debt includes the following financial liabilities:
September 30, 2011
December 31, 2010
ACOA financing $ 270,903 $ 300,243 Installments due within one year 52,514 41,557
Total long-term debt
$ 218,389
$ 258,686
On March 31, 2009, the Corporation entered into a $500,000 loan agreement with the Atlantic Canada Opportunities Agency (ACOA) to finance the expansion of the St. John’s office and the release of XSELLERATOR, version 4.7. The loan, which is unsecured and interest-free, matures on July 1, 2015. Monthly repayments commenced on July 2, 2010. As of September 30, 2011, the loan has been received in full and recorded at a fair value of $270,903, based on a 20% rate of interest over 5 years. The difference between the fair value of the loan and the cash received has been accounted for as a government grant (refer to note 9). On a cash basis, $383,338 is remaining on the loan and $99,996 is required to be repaid within the next 12 months. Scheduled principal repayments at September 30, 2011 are as follows:
2011 – 3 months $ 12,218
2012 56,166
2013 70,774
2014 85,383
2015 46,362
Total
$ 270,903

2011 3rd Quarter Report
36
Quorum Information Technologies Inc. Notes to the Condensed Consolidated Financial Statements (unaudited)
9. Government Grants and Assistance
On June 12, 2007, the Corporation entered into an agreement with the Government of Newfoundland and Labrador, Department of Innovation, Trade and Rural Development to provide an eight percent subsidy of the Corporation’s gross payroll costs including approved benefits associated with Newfoundland and Labrador employees, for a period of five years. In order to maintain this subsidy, the Corporation must maintain a high level of qualified employees (minimum of 35 full-time positions) each earning annual salaries aggregating $35,000 or higher, net of benefits. On March 31, 2009, the Corporation entered into an unsecured, interest-free loan agreement with the Atlantic Canada Opportunities Agency (ACOA) to finance a project for the expansion of the St. John’s office and the release of XSELLERATOR, version 4.7. The completion date of the project was March 31, 2010. The $250,782 difference between the fair value of the loan and the cash received has been accounted for as a government grant, as prescribed by IAS 20 under IFRS. The amount relates to expenses and capital expenditures to be incurred over the term of the project. Any amounts allocated to capital expenditures have been deducted from the specific fixed assets with depreciation calculated on the net amount over the life of the asset. On March 11, 2011, the Corporation entered into an agreement with the Newfoundland and Labrador Department of Business to provide funding, up to a maximum of $500,000, to increase staffing levels in Newfoundland and Labrador and expand the office in St. John’s. A portion of the loan, $172,000, will be forgivable to the Corporation dependent on the Corporation meeting certain requirements. The balance of the loan is to be repaid over a four-year term starting December 2012.
10. Provisions
Provisions are considered long-term. The carrying amounts may be analyzed as follows:
Central Consulting Services Inc.
Carrying amount, January 1, 2011 $ 34,251 Additional provisions 9,512 Amount utilized - Reversals -
Carrying amount, September 30, 2011 $ 43,763
Carrying amount, January 1, 2010
$ 29,929
Additional provisions 4,322 Amount utilized - Reversals -
Carrying amount, December 31, 2010 $ 34,251
On July 13, 2009, the Corporation entered into an agreement with Central Consulting Services Inc. to prepare the Scientific Research & Economic Development (SR&ED) claim for the years ended December 31, 2007, through to December 31, 2010. The amount of $87,917, recorded at a fair value of $43,763, is not payable until the Corporation is in a position to utilize the SR&ED Investment Tax Credits (ITCs). The Corporation does not expect to utilize those ITCs until the year ended December 31, 2015.

2011 3rd Quarter Report
37
Quorum Information Technologies Inc. Notes to the Condensed Consolidated Financial Statements (unaudited)
11. Investment Tax Credits
The Corporation recorded government research and development tax credits pertaining to the following taxation years. These amounts have been applied to reduce the cost of capitalized software development costs and expire twenty years after the year in which they were earned. 2002 $ 192,988 2003 279,845 2004 463,146 2005 573,125 2006 580,940 2007 387,520 2008 218,944 2009 125,134 2010 147,903
$ 2,969,545
12. Share Capital
(a) Authorized
The Corporation is authorized to issue an unlimited number of Common shares and Preferred shares issuable in series.
(b) Issued and Outstanding A summary of the changes to shareholders’ equity for the period is presented below:
Number of Shares
Amount
Common Shares
Balance, December 31, 2010 39,298,438 $ 23,399,937 Issued, January 1 – September 30, 2011 - -
Total share capital at September 30, 2011 39,298,438 $ 23,399,937
(c) Net income per share In calculating the basic and diluted net income per share for the nine months ended September 30, 2011 and 2010, the weighted average number of shares used in the calculation is shown in the table below. The diluted shares for 2011 are based on an average stock price of $0.10 for the three months ended September 30 and $0.13 for the nine months ended September 30. The diluted shares for 2010 are based on an average stock price of $0.14 for the three months ended September 30 and $0.16 for the nine months ended September 30.

2011 3rd Quarter Report
38
Quorum Information Technologies Inc. Notes to the Condensed Consolidated Financial Statements (unaudited)
12. Share Capital (continued)
Three Months Ended Sept 30 Nine Months Ended Sept 30 2011 2010 2011 2010
Net income (loss) $ 411,338 $ (291,733) $ 404,032 $ 48,965
Common Shares Balance 39,298,438 39,298,438 39,298,438 39,298,438 Options issued at $0.12 - - 385,881 387,381 Options issued at $0.15 - - - 3,004,500 Options issued at $0.16 - - - 96,000
Diluted shares outstanding 39,298,438 39,298,438 39,684,319 42,786,319
Net income per share – basic $ 0.0105 $ (0.0074) $ 0.0103 $ 0.0012 Net income per share – diluted $ 0.0105 $ (0.0074) $ 0.0103 $ 0.0012
13. Stock-Based Compensation
As at September 30, 2011, a total of 3,929,844 stock options were reserved for issuance under the Corporation’s Stock Option Plan of which 395,778 stock options remain available for grant. Pursuant to the Stock Plan, options may be granted to purchase common shares of the Corporation up to a maximum of 10% of common shares currently issued and outstanding. Quorum provides incentives to employees, officers and directors of the Corporation by issuing options to acquire common shares. The exercise price of the options is determined by the Board of Directors in accordance with the policies of the TSX Venture Exchange (“TSXV”). The options have a maximum term of five years with a hold period of four months from the date of the initial grant, and no more than 1/3 of the stock options granted to any one individual shall vest in any twelve-month period. Stock option transactions for the respective periods and the number of stock options outstanding are summarized as follows: As at September 30, 2011 As at December 31, 2010
Number of shares
Weighted average
exercise price
Number of shares
Weighted average
exercise price
Balance, beginning of period 3,732,481 $0.17 3,400,500 $0.18 Granted during the period - - 396,381 $0.12 Exercised during the period - - - - Forfeited during the period (198,415) $0.15 (64,400) $0.15
Balance, end of period 3,534,066 $0.18 3,732,481 $0.17
Exercisable options, end of period 3,167,941 $0.18 2,443,527 $0.19

2011 3rd Quarter Report
39
Quorum Information Technologies Inc. Notes to the Condensed Consolidated Financial Statements (unaudited)
13. Stock-Based Compensation (continued)
For the nine months ended September 30, 2011, stock based compensation expense of $52,543 (2010 - $105,522) was recorded related to the Corporation’s stock based compensation plan. The following table summarizes information about stock options outstanding at September 30, 2011:
Exercise prices Number outstanding
Weighted average remaining contractual
life in years
Weighted average exercise price
$ 0.12 355,866 3.8 $ 0.12 $ 0.15 2,818,200 2.6 $ 0.15 $ 0.16 60,000 3.2 $ 0.16 $ 0.49 300,000 0.8 $ 0.49
3,534,066 2.6 $ 0.18
The Corporation accounts for its stock-based compensation plan using the fair value method, under which compensation expense for each tranche of an award is measured at the grant date and recognized over the vesting period. Assumptions utilized in the calculation thereof using the Black-Scholes model for option valuation are as follows:
2011 2010 Volatility rate 108% 108% Stock option holding period (years) 5 5 Risk free interest rate 1.8% 1.8% Dividend yield 0% 0%
14. Contributed Surplus
The following table reconciles the Corporation’s contributed surplus:
Nine Months Ended September 30, 2011
Year Ended December 31, 2010
Contributed surplus, beginning of period $ 2,057,702 $ 1,741,139 Stock-based compensation 52,543 142,820 Convertible debt - 173,743 Exercise of share options - -
Contributed surplus, end of period $ 2,110,245 $ 2,057,702

2011 3rd Quarter Report
40
Quorum Information Technologies Inc. Notes to the Condensed Consolidated Financial Statements (unaudited)
15. Operating leases
The Corporation's future minimum operating lease payments are as follows:
2011 – 3 months $ 139,920 2012 541,051 2013 465,232 2014 259,051 2015 -
Total $ 1,405,254
Lease payments recognized as an expense during the nine month period ending September 30, 2011 amount to $578,957 (2010 - $570,798). This amount consists of minimum lease payments. Sublease payments of $143,718 (2010 - $96,943) were received. The rental contract for the office rented since October 1, 2007 at 10655 Southport Road, Calgary, Alberta has a non-cancellable term of seven years. The rental contract for the office rented since June 1, 2008 at 136 Crosbie Road, St. John’s, Newfoundland and Labrador has a non-cancellable term of five years. The rental contract for the office rented since June 1, 2007 at 2109-39 Ottawa Street, Windsor, Ontario has a non-cancellable term of five years The Corporation's operating lease agreements do not contain any contingent rent clauses. None of the operating lease agreements contain renewal or purchase options or escalation clauses or any restrictions regarding dividends, further leasing or additional debt.
16. Financial Instruments and Risk Management
a) Financial instrument measurement and classification The classification of financial instruments remains consistent at September 30, 2011 with that as at December 31, 2010. b) Credit risk Credit risk reflects the risk of loss if counterparties do not fulfill their contractual obligations to the Corporation. The Corporation manages credit risk by assessing the creditworthiness of its customers on an ongoing basis as well as monitoring the amount and age of balances outstanding. Accounts receivable primarily includes balances from customers operating primarily automotive dealership industry. Accordingly, the Corporation views the credit risks on these amounts as normal for the industry. An analysis of accounts receivable, net of impairment provisions, which are past due but not impaired is as follows:
September 30, 2011
December 31, 2010
Past due 61 – 90 days $ 8,791 $ 2,188 Past 90 days 49,982 27,948
Total past due $ 58,773 $ 30,136

2011 3rd Quarter Report
41
Quorum Information Technologies Inc. Notes to the Condensed Consolidated Financial Statements (unaudited)
16. Financial Instruments and Risk Management (continued)
The Corporation reduces an account receivable to its estimated recoverable amount. At September 30, 2011, the Corporation had recorded a provision of $48,215 (December 31, 2010 – $Nil, January 1, 2010 - $139,513) relating to accounts receivable which may not be collectible. c) Interest rate risk
Interest rate risk is the risk that future cash flows will fluctuate as a result of changes in prevailing market interest rates. The Corporation is exposed to interest rate risk as a result of funds borrowed at floating interest rates. The Corporation manages this risk by monitoring interest rate trends and forecasted economic conditions. As of September 30, 2011, the Corporation had not entered into any interest rate derivatives to manage its exposure to fluctuations in interest rates. d) Foreign currency risk Foreign currency risk is the risk that the value of future cash flows will fluctuate as a result of changes in foreign currency exchange rates. The Corporation’s foreign currency risk arises from its working capital balances denominated in foreign currencies and on the translation of its foreign operations. The Corporation uses the U.S. dollar as its functional currency for the operations of Quorum Information Technologies (US) Inc. The Corporation manages foreign currency risk by monitoring exchange rate trends and forecasted economic conditions. A 10% increase or decreased is used when reporting foreign currency risk internally and represents management’s assessment of the reasonable change in foreign exchange rates. For the three and nine months ended September 30, 2011, a 10% increase/decrease in the Canadian dollar vis-à-vis the U.S. dollar is estimated to decrease/increase net income of the Corporation from unrealized gains/losses by approximately $239,276 and $247,201 respectively (2010 – decrease/increase of $110,555 and $309,648 respectively). e) Liquidity risk Liquidity risk is the risk that the Corporation will not be able to meet its financial obligations as they become due and describes the Corporation’s ability to access cash. The Corporation requires sufficient cash resources to finance operations, debt, and settle other liabilities of the Corporation as they come due. The Corporation manages liquidity risk by maintaining a line of credit facility and through management of its operational cash flows. Payments Due By Period
Less than 3
months
3 months to 1 year
1-2
years
2-5 years
5+ years
Total
Accounts payable and accrued liabilities
$418,457
$ -
$ -
$ -
$ -
$418,457
Lease commitments 139,920 541,051 724,283 1,405,254 Long-term debt
6 12,215 40,299 146,418 71,971 - 270,903
Provisions - - - 29,264 14,499 43,763
Total $570,592 $581,350 $870,701 $101,235 $ 14,499 $2,183,377
6 Long-term debt obligations reflect principal payments and excludes any associated interest portion
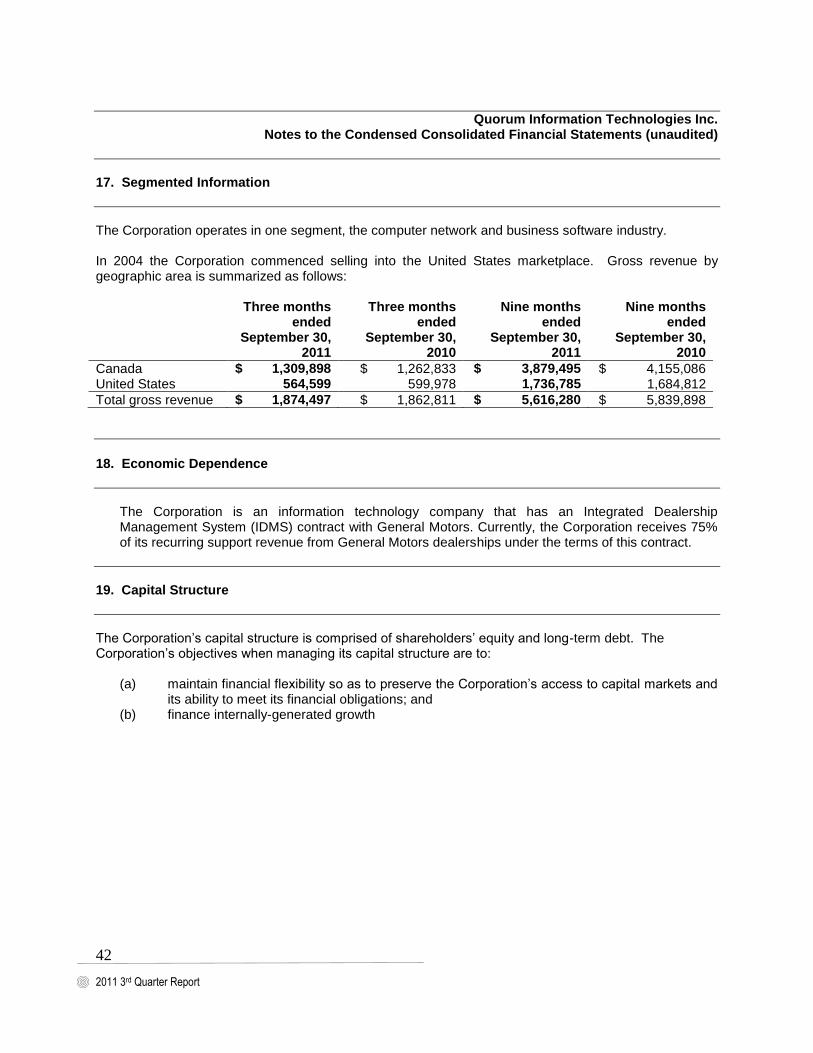
2011 3rd Quarter Report
42
Quorum Information Technologies Inc. Notes to the Condensed Consolidated Financial Statements (unaudited)
17. Segmented Information
The Corporation operates in one segment, the computer network and business software industry.
In 2004 the Corporation commenced selling into the United States marketplace. Gross revenue by geographic area is summarized as follows: Three months
ended September 30,
2011
Three months ended
September 30, 2010
Nine months ended
September 30, 2011
Nine months ended
September 30, 2010
Canada $ 1,309,898 $ 1,262,833 $ 3,879,495 $ 4,155,086 United States 564,599 599,978 1,736,785 1,684,812
Total gross revenue $ 1,874,497 $ 1,862,811 $ 5,616,280 $ 5,839,898
18. Economic Dependence
The Corporation is an information technology company that has an Integrated Dealership Management System (IDMS) contract with General Motors. Currently, the Corporation receives 75% of its recurring support revenue from General Motors dealerships under the terms of this contract.
19. Capital Structure
The Corporation’s capital structure is comprised of shareholders’ equity and long-term debt. The Corporation’s objectives when managing its capital structure are to:
(a) maintain financial flexibility so as to preserve the Corporation’s access to capital markets and its ability to meet its financial obligations; and
(b) finance internally-generated growth

Corporate Information
QUORUM INFORMATION TECHNOLOGIES Head Office
Suite 300, 10655 Southport Road SW, Calgary, AB T2W 4Y1 Phone: 403.777.0036
E-mail: [email protected] Web Site: www.QuorumDMS.com
Maury Marks Director President & Chief Executive Officer Quorum Information Technologies Inc.
John Carmichael Chairman of Board of Directors Dealer Principal City Buick Pontiac Cadillac
Craig Nieboer Director Chief Financial Officer Canadian Energy Services & Technology Corp.
Michael Podovilnikoff Director Business Consultant
Board of Directors
Officers
John Carmichael Chairman of Board of Directors
Maury Marks President & Chief Executive Officer
Marilyn Bown Chief Financial Officer
Corporate Counsel Burnet Duckworth & Palmer Calgary, Alberta
Bankers HSBC Bank Canada Calgary, Alberta
Auditors DNTW Chartered Accountants, LLP
Calgary, Alberta
Stock Exchange Listing TSX Venture Exchange Trading Symbol: QIS
Registrar and Transfer Agent Computershare Trust Company of Canada Calgary, Alberta
Scot Eisenfelder Director Vice President Strategy AutoNation Inc.

QUORUM INFORMATION TECHNOLOGIES Suite 300, 10655 Southport Road SW, Calgary, AB T2W 4Y1
Phone: 403.777.0036 Fax: 403-777-0039 E-mail: [email protected] www.QuorumDMS.com
Stock Symbol – TSXV: QIS