Embed Size (px)
DESCRIPTION
The Population Reference Bureau (PRB) is pleased to announce the availability of the 2010 World Population Data Sheet, providing indepth demographic data and information for more than 200 countries. New in this edition are data on the elderly support ratio, indicating levels of potential societal support available for the elderly; mobile phone subscribers per 100 inhabitants; and percent of population who use improved sanitation. There is also a special section focusing on aging.
Citation preview

2010 World PoPulation
Data Sheet
I n f o r m | e m p o w e r | a D va n c e | w w w. p r b . o r g
PoPulation RefeRence BuReau
60The number of mobile phone subscribers per 100 inhabitants worldwide.
BY 2050,
Japan’s population is projected to decline to 95 million from 127 million in 2010.
76%The percentage of people in urban areas worldwide who use improved sanitation.
2.5The total fertility rate worldwide. TFRs range from 1.7 in more developed countries to 4.5 in the least developed countries.

© 2010 Population reference Bureau 2010 WORLD POPULATION DATA SHEET 2
Most PoPulous Countries, 2010 and 20502010 2050
Country PoPulation (millions)
India 1,748
China 1,437
United States 423
Pakistan 335
Nigeria 326
Indonesia 309
Bangladesh 222
Brazil 215
Ethiopia 174
Congo, Dem. Rep. 166
Country PoPulation (millions)
China 1,338
India 1,189
United States 310
Indonesia 235
Brazil 193
Pakistan 185
Bangladesh 164
Nigeria 158
Russia 142
Japan 127
Countries With the Youngest and oldest PoPulations, 2010
younGEst % aGEs <15
Niger 50.1
Uganda 48.7
Burkina Faso 46.4
Congo, Dem. Rep. 46.4
Zambia 46.2
Malawi 45.9
Afghanistan 45.9
Chad 45.6
Somalia 44.9
Tanzania 44.7
PoPulation CloCk, 2010
WorlDmorE DEvEloPED
CountriEslEss DEvEloPED
CountriEs
Population 6,892,319,000 1,236,646,000 5,655,673,000
Births per
Year 140,184,169 14,215,211 125,968,959
Day 384,066 38,946 345,120
Minute 267 27 240
Deaths per
Year 56,907,606 12,125,055 44,782,552
Day 155,911 33,219 122,692
Minute 108 23 85
Natural increase (births-deaths) per
Year 83,276,563 2,090,156 81,186,407
Day 228,155 5,726 222,429
Minute 158 4 154
Infant deaths per
Year 6,383,531 80,133 6,303,398
Day 17,489 220 17,270
Minute 12 0.2 12
olDEst % aGEs 65+
Japan 22.6
Germany 20.5
Italy 20.4
Sweden 18.3
Greece 18.3
Portugal 17.9
Bulgaria 17.6
Austria 17.6
Latvia 17.4
Belgium 17.4

© 2010 Population reference Bureau 2010 WORLD POPULATION DATA SHEET 3
W o r l d P o P u l a t i o n h i g h l i g h t sF O C U S O N A G I N G
Today, Global Population Adds Another Billion at Record Rates.at some point around 1800, after untold millennia of human history, global population reached its first billion. the world’s population now grows by 1 billion about every 12 years. the 20th century began with 1.6 billion and, at the end of that century, those two numbers had simply reversed to 6.1 billion. if birth rates continue to decline in developing countries, the increase to 8 billion could take slightly longer.
FirstBillion
130 Years (1930)
ca. 1800All of Human History
30 Years (1960)
14 Years (1974)
13 Years (1987)
12 Years (1999)
12 Years (2011)
13 Years (2024)
Second
Third
Fourth
Fifth
Sixth
Seventh
Eighth
Source: Population Reference Bureau estimates and projections; and un Population Division, World Population Prospects: The 2008 Revision (2009).
As Developed Countries Undergo Aging and Little Growth in Population Size, Developing Countries Remain Young and Growing.the population “pyramid” of the developed countries clearly shows the decline in the number of young people as a result of low birth rates. the two pyramids provide a comparable picture of the developed and developing countries in the size of their respective populations and
Source: un Population Division, World Population Prospects: The 2008 Revision (2009).
85+
Age
80-84
75-79
70-74
65-69
60-64
55-59
50-54
45-49
40-44
35-39
30-34
25-29
20-24
15-19
10-14
5-9
0-4
200 200100 1000Population (millions), 2010
FemalesMales
300 300
85+
Age
80-84
75-79
70-74
65-69
60-64
55-59
50-54
45-49
40-44
35-39
30-34
25-29
20-24
15-19
10-14
5-9
0-4
200 200100 1000Population (millions), 2010
FemalesMales
300 300
DEVELOPED COUNTRIES DEVELOPING COUNTRIESage structure. in some developed countries, the size of the youngest age group is barely more than half that of their parents’ age group. When the two population pyramids are compared, it is obvious that virtually all future world population growth will take place in the developing countries. But the amount of growth these countries will expe-rience depends upon the degree to which couples in those countries choose to reduce family size and have access to family planning services.

© 2010 Population Reference Bureau 2010 WORLD POPULATION DATA SHEET 4
W O R L D P O P U L A T I O N H I G H L I G H T SF O C U S O N A G I N G
The Number of Working-Age Adults Available to Support an Older Person Is Declining Globally but Still Varies Substantially From Country to Country.Population aging puts pressure on a society’s ability to support its elderly citizens. A commonly used indicator of this pressure is the elderly support ratio, calculated as the number of working-age people ages 15 to 64 divided by the number of persons 65 or older. This ratio serves as a rough indicator of the number of potential providers of support per potential elderly dependent. In 1950, there were 12 working-age people for every elderly person in the world. By 2010, this ratio had declined to 9, with the largest decline occurring in more developed countries. But the ratios still vary substantially across countries. In 24 countries, mostly in Europe, there are fewer than 5 working-age people for every elderly person. The ratio is lowest in Japan, Italy, and Germany—at 3. The ratio is above 25 in seven countries, principally in sub-Saharan Africa and the Middle East. By 2050, the ratio for the world is projected to decline by more than one-half—to 4, and Japan will have the lowest ratio of only 1 working-age adult per elderly person. The elderly support ratio will be below 5 in more than half of the world’s countries. By 2050, no country will have a ratio above 20.
15 and over
10 to 14.9
5 to 9.9
Less than 5
Elderly Support Ratio (2010)
Elderly Support Ratio (2050)
Country ratio
Niger 19
Uganda 16
Guatemala 7
Pakistan 7
Egypt 5
India 5
Morocco 4
United States 3
Mexico 3
China 3
France 2
Japan 1
Source: UN Population Division, World Population Prospects: The 2008 Revision (2009).

© 2010 Population reference Bureau 2010 WORLD POPULATION DATA SHEET 5
W o r l d P o P u l a t i o n h i g h l i g h t sF O C U S O N A G I N G
the number of people age 65 or older in the united States will more than double from 40 million in 2010 to 89 million by 2050. Spending on Social Security and Medicare is projected to increase dramatically between now and 2050 as the number of people receiving benefits grows. the magnitude of this increased spending is illustrated by comparing the projected costs of these two programs with Gross Domestic Product (GDP), which measures the total output of the u.S. economy. in 1970, spending on Social Security and Medicare totaled only about 4 percent of GDP, while by 2010 this share had risen to more than 8 percent of GDP. By 2030, Medicare expenditures
0
1
2
3
4
5
6
7
8
9
10
1970 1980
Social Security
Medicare
3.2%
8.7%
5.8%
0.7%
1990 2000 2010 2020 2030 2040 2050
Expenditures as a Percentage of GDP
Spending as a Percentage of GDP
2010 2030 2050
Social Security 4.9 6.1 5.8
Medicare 3.5 6.4 8.7
Total 8.4% 12.5% 14.5%
As the U.S. Population Ages, Spending on Entitlement Programs Such as Social Security and Medicare Will Rise Sharply.
Source: u.S. Social Security administration, A Summary of the 2009 Annual Social Security and Medicare Trust Fund Reports (2009).
Worldwide, 40 percent of the population, or more than 2.6 billion people, lack one of life’s basic needs: an adequate sanitation facility, defined as one that hygienically separates sewage from human contact. there are wide regional and rural-urban disparities, and the
Sub-Saharan Africa 4324
5929
6654
8655
7959
9366
9992
Percent of Population Who Use Improved Sanitation (2008)
South Central Asia
East Asia
Latin America/Caribbean
Southeast Asia
Western Asia
More DevelopedCountries
Urban
Rural
In Many Parts of the World, Rural Populations Still Lack Adequate Sanitation.
Source: Regional estimates calculated by PRB based on data from the WHo/unicef Joint Monitoring Programme for Water Supply and Sanitation.
are projected to exceed those for Social Security; by 2050, total spending on these two programs is projected to reach almost 15 percent of GDP. the rapid growth in Medicare spending will be fueled by the rising cost and use of health care services, in addition to the increase in the number of people receiving benefits.
bulk of the underserved live in rural areas of developing countries. Much of the world is making little progress toward meeting the Millennium Development Goal target to halve the proportion of the world’s population without access to basic sanitation by 2015. at the current pace, the world will miss the MDG target for improved sanitation by 13 percentage points: approximately 1 billion people who are targeted for improvement will still lack access.

© 2010 Population reference Bureau 2010 WORLD POPULATION DATA SHEET 6
WORLD 6,892 20 8 1.2 — 8,108 9,485 1.4 46 2.5 27 8
MORE DEVELOPED 1,237 11 10 0.2 2 1,290 1,326 1.1 6 1.7 17 16
LESS DEVELOPED 5,656 22 8 1.4 -1 6,819 8,159 1.4 50 2.7 30 6
LESS DEVELOPED (Excl. China) 4,318 25 8 1.7 -1 5,343 6,722 1.6 54 3.1 33 5
LEAST DEVELOPED 857 35 12 2.3 -0 1,172 1,710 2.0 81 4.5 41 3
AFRICA 1,030 37 13 2.4 -1 1,412 2,084 2.0 76 4.7 41 3
SUB-Saharan afrIca 865 39 14 2.5 -0 1,207 1,831 2.1 81 5.2 43 3
northern afrIca 209 26 7 1.9 -0 262 329 1.6 42 3.0 33 4
algeria 36.0 23 5 1.8 -1 43.6 50.4 1.4 28 2.3 28 5
egypt 80.4 27 6 2.1 -0 103.6 137.7 1.7 28 3.0 33 4
libya 6.5 23 4 1.9 1 8.1 9.8 1.5 18 2.7 30 4
Morocco 31.9 21 6 1.5 -3 36.6 41.2 1.3 31 2.4 29 5
sudan 43.2 33 11 2.2 1 56.7 75.9 1.8 81 4.5 41 3
tunisia 10.5 18 6 1.2 -0 12.1 13.2 1.2 18 2.1 24 7
Western saharad 0.5 34 9 2.5 9 0.7 1.2 2.4 63 4.5 40 3
weStern afrIca 309 41 15 2.6 -1 435 682 2.2 81 5.5 43 3
Benin 9.8 40 10 3.0 0 13.6 22.1 2.3 89 5.6 45 3
Burkina Faso 16.2 46 12 3.4 0 25.4 47.4 2.9 81 6.0 46 3
Cape Verde 0.5 25 6 2.0 -3 0.7 0.8 1.6 25 2.9 35 5
Côte d'ivoire 22.0 37 14 2.4 -1 30.8 47.2 2.1 97 4.9 40 2
gambia 1.8 38 12 2.7 3 2.5 3.8 2.1 81 5.3 43 3
ghana 24.0 31 9 2.2 -1 31.8 44.6 1.9 50 4.0 39 4
guinea 10.8 41 11 3.0 0 15.9 25.1 2.3 91 5.7 43 3
guinea-Bissau 1.6 43 18 2.4 0 2.3 3.6 2.2 121 5.8 43 3
liberia 4.1 43 11 3.3 1 6.1 10.0 2.4 95 5.9 44 3
Mali 15.2 46 15 3.1 -6 22.3 35.6 2.3 116 6.6 48 3
Mauritania 3.4 34 11 2.3 1 4.4 6.1 1.8 73 4.5 40 3
niger 15.9 52 17 3.5 -6 27.4 58.2 3.7 108 7.4 49 2
nigeria 158.3 42 17 2.4 -0 217.4 326.4 2.1 75 5.7 43 3
senegal 12.5 39 11 2.8 -2 17.4 25.4 2.0 58 4.9 44 2
sierra leone 5.8 40 16 2.4 2 8.1 12.4 2.1 89 5.1 43 2
togo 6.8 33 8 2.5 -0 9.3 13.2 1.9 81 4.8 41 3
eaStern afrIca 326 40 13 2.7 -0 465 709 2.2 72 5.3 44 3
Burundi 8.5 36 15 2.1 8 11.6 16.8 2.0 98 5.4 41 3
Comoros 0.7 33 7 2.6 -3 0.9 1.2 1.8 53 4.1 38 3
djibouti 0.9 29 11 1.8 0 1.1 1.5 1.7 67 4.0 37 3
eritrea 5.2 37 9 2.9 2 7.4 10.8 2.1 54 4.7 42 2
ethiopia 85.0 39 12 2.7 -1 119.8 173.8 2.0 77 5.4 44 3
Kenya 40.0 37 10 2.7 0 51.3 65.2 1.6 52 4.6 42 3
Madagascar 20.1 37 9 2.7 -0 28.6 42.7 2.1 48 4.8 43 3
Malawi 15.4 44 15 2.9 0 22.9 37.4 2.4 80 6.0 46 3
Mauritius 1.3 12 7 0.5 -0 1.4 1.4 1.1 13.4 1.5 22 7
Mayotte 0.2 39 3 3.6 4 0.3 0.5 2.6 — 4.5 44 2
Mozambique 23.4 40 16 2.3 -0 31.2 44.1 1.9 90 5.1 44 3
reunion 0.8 18 5 1.3 -0 1.0 1.1 1.3 8 2.4 26 8
rwanda 10.4 42 14 2.9 0 15.8 28.3 2.7 102 5.4 42 2
seychelles 0.1 18 7 1.0 0 0.1 0.1 1.4 11.5 2.3 22 10
somalia 9.4 46 16 3.0 -6 13.9 23.5 2.5 111 6.5 45 3
tanzania 45.0 42 12 3.0 -1 67.4 109.5 2.4 58 5.6 45 3
uganda 33.8 47 13 3.4 -1 53.4 91.3 2.7 76 6.5 49 3
Zambia 13.3 45 20 2.5 -1 20.3 37.6 2.8 70 6.2 46 3
Zimbabwe 12.6 30 17 1.3 0 16.8 22.2 1.8 60 3.7 42 4
mIDDLe afrIca 129 44 16 2.7 -0 188 296 2.3 111 5.9 46 3
angola 19.0 42 17 2.5 1 27.4 42.3 2.2 118 5.8 45 2
Cameroon 20.0 37 14 2.3 -0 26.5 36.7 1.8 87 4.7 41 4
Central african republic 4.8 38 16 2.2 0 6.6 10.3 2.1 106 4.8 41 4
Chad 11.5 46 17 2.9 -1 16.9 27.8 2.4 130 6.2 46 3
Congo 3.9 38 13 2.5 -3 5.5 8.2 2.1 79 5.0 42 4
Congo, dem. rep. 67.8 47 17 2.9 -1 101.4 166.2 2.5 114 6.4 48 3
equatorial guinea 0.7 39 16 2.3 4 1.0 1.4 2.1 103 5.5 42 3
gabon 1.5 29 10 1.9 1 2.0 2.8 1.9 55 3.6 39 4
sao tome and Principe 0.2 37 7 2.9 -7 0.2 0.3 2.1 45 4.9 44 4
Population mid-2010(millions)
Births per 1,000
Population
Deaths per 1,000
Population
Rate ofNatural
Increase(%)
Net Migration
Rateper 1,000
Population mid–2025 mid–2050
2050 Population
as a Multipleof 2010
InfantMortality
Ratea
TotalFertilityRateb <15 65+
Projected Population (millions)
Percent of Population
Ages
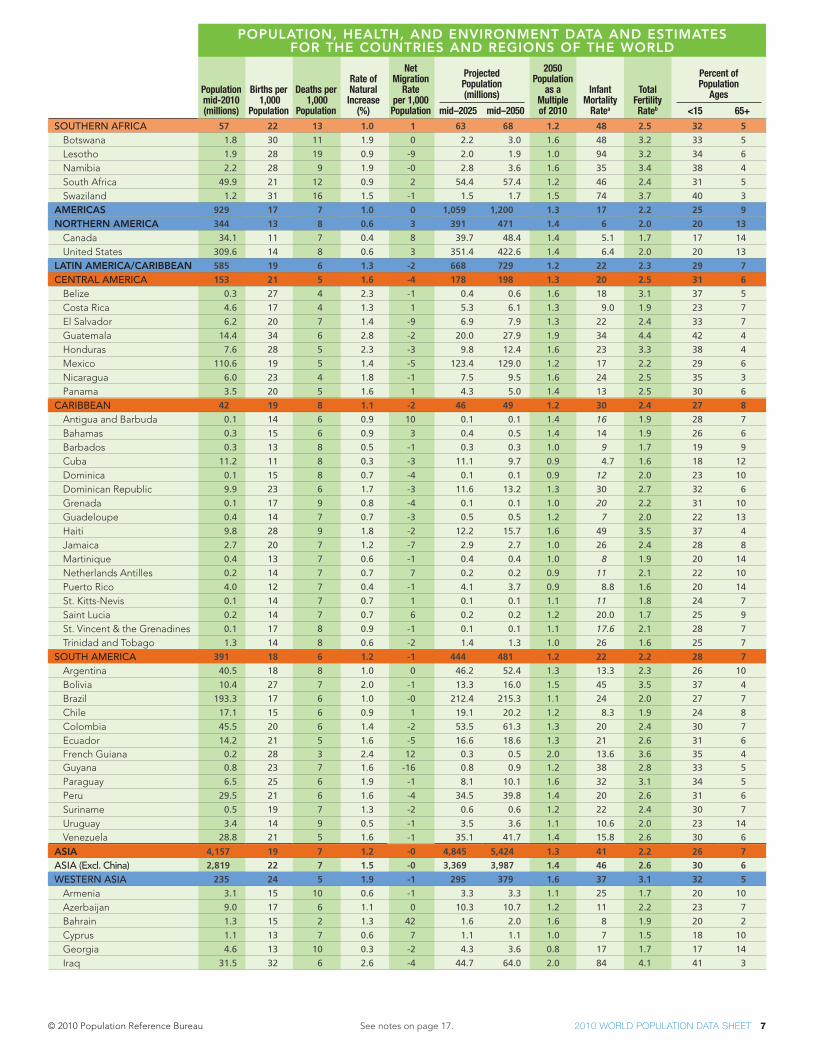
POPULATION, HEALTH, AND ENVIRONMENT DATA AND ESTIMATES FOR THE COUNTRIES AND REGIONS OF THE WORLD
See notes on page 17.
© 2010 Population reference Bureau 2010 WORLD POPULATION DATA SHEET 7
Population mid-2010(millions)
Births per 1,000
Population
Deaths per 1,000
Population
Rate ofNatural
Increase(%)
Net Migration
Rateper 1,000
Population mid–2025 mid–2050
2050 Population
as a Multipleof 2010
InfantMortality
Ratea
TotalFertilityRateb <15 65+
Projected Population (millions)
Percent of Population
Ages
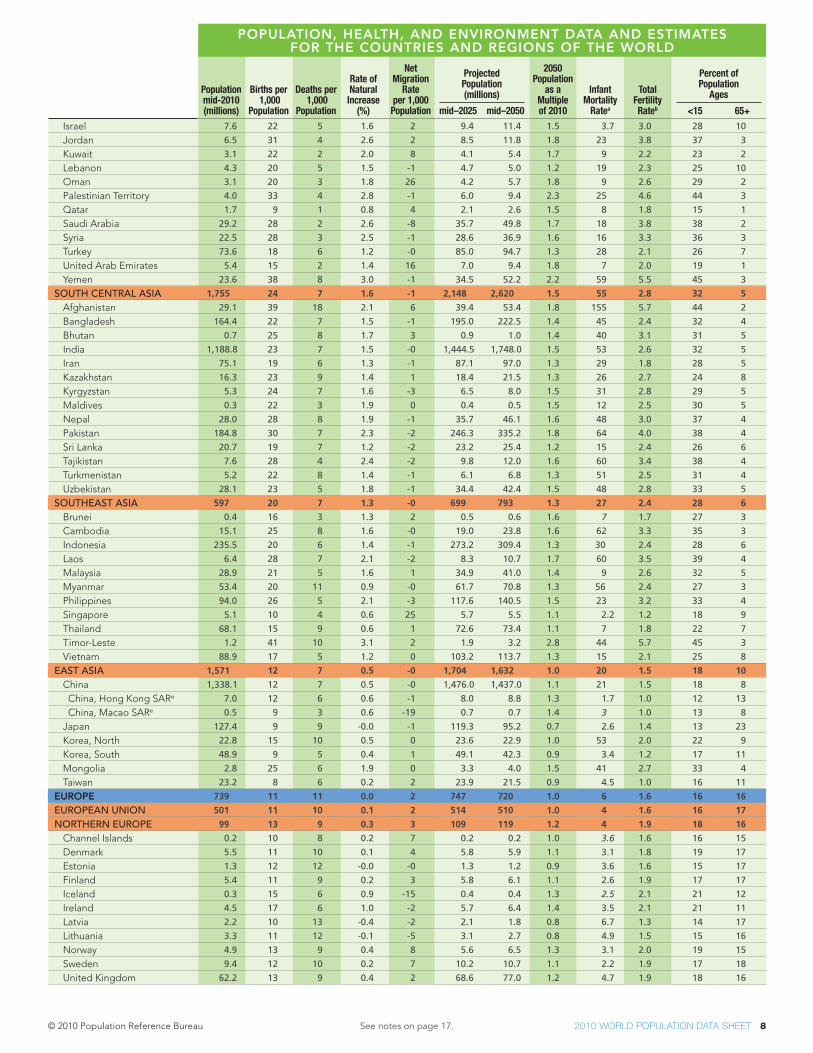
POPULATION, HEALTH, AND ENVIRONMENT DATA AND ESTIMATES FOR THE COUNTRIES AND REGIONS OF THE WORLD
SoUthern afrIca 57 22 13 1.0 1 63 68 1.2 48 2.5 32 5
Botswana 1.8 30 11 1.9 0 2.2 3.0 1.6 48 3.2 33 5
lesotho 1.9 28 19 0.9 -9 2.0 1.9 1.0 94 3.2 34 6
namibia 2.2 28 9 1.9 -0 2.8 3.6 1.6 35 3.4 38 4
south africa 49.9 21 12 0.9 2 54.4 57.4 1.2 46 2.4 31 5
swaziland 1.2 31 16 1.5 -1 1.5 1.7 1.5 74 3.7 40 3
AMERICAS 929 17 7 1.0 0 1,059 1,200 1.3 17 2.2 25 9
NORTHERN AMERICA 344 13 8 0.6 3 391 471 1.4 6 2.0 20 13
Canada 34.1 11 7 0.4 8 39.7 48.4 1.4 5.1 1.7 17 14
united states 309.6 14 8 0.6 3 351.4 422.6 1.4 6.4 2.0 20 13
LATIN AMERICA/CARIBBEAN 585 19 6 1.3 -2 668 729 1.2 22 2.3 29 7
centraL amerIca 153 21 5 1.6 -4 178 198 1.3 20 2.5 31 6
Belize 0.3 27 4 2.3 -1 0.4 0.6 1.6 18 3.1 37 5
Costa rica 4.6 17 4 1.3 1 5.3 6.1 1.3 9.0 1.9 23 7
el salvador 6.2 20 7 1.4 -9 6.9 7.9 1.3 22 2.4 33 7
guatemala 14.4 34 6 2.8 -2 20.0 27.9 1.9 34 4.4 42 4
honduras 7.6 28 5 2.3 -3 9.8 12.4 1.6 23 3.3 38 4
Mexico 110.6 19 5 1.4 -5 123.4 129.0 1.2 17 2.2 29 6
nicaragua 6.0 23 4 1.8 -1 7.5 9.5 1.6 24 2.5 35 3
Panama 3.5 20 5 1.6 1 4.3 5.0 1.4 13 2.5 30 6
carIBBean 42 19 8 1.1 -2 46 49 1.2 30 2.4 27 8
antigua and Barbuda 0.1 14 6 0.9 10 0.1 0.1 1.4 16 1.9 28 7
Bahamas 0.3 15 6 0.9 3 0.4 0.5 1.4 14 1.9 26 6
Barbados 0.3 13 8 0.5 -1 0.3 0.3 1.0 9 1.7 19 9
Cuba 11.2 11 8 0.3 -3 11.1 9.7 0.9 4.7 1.6 18 12
dominica 0.1 15 8 0.7 -4 0.1 0.1 0.9 12 2.0 23 10
dominican republic 9.9 23 6 1.7 -3 11.6 13.2 1.3 30 2.7 32 6
grenada 0.1 17 9 0.8 -4 0.1 0.1 1.0 20 2.2 31 10
guadeloupe 0.4 14 7 0.7 -3 0.5 0.5 1.2 7 2.0 22 13
haiti 9.8 28 9 1.8 -2 12.2 15.7 1.6 49 3.5 37 4
Jamaica 2.7 20 7 1.2 -7 2.9 2.7 1.0 26 2.4 28 8
Martinique 0.4 13 7 0.6 -1 0.4 0.4 1.0 8 1.9 20 14
netherlands antilles 0.2 14 7 0.7 7 0.2 0.2 0.9 11 2.1 22 10
Puerto rico 4.0 12 7 0.4 -1 4.1 3.7 0.9 8.8 1.6 20 14
st. Kitts-nevis 0.1 14 7 0.7 1 0.1 0.1 1.1 11 1.8 24 7
saint lucia 0.2 14 7 0.7 6 0.2 0.2 1.2 20.0 1.7 25 9
st. Vincent & the grenadines 0.1 17 8 0.9 -1 0.1 0.1 1.1 17.6 2.1 28 7
trinidad and tobago 1.3 14 8 0.6 -2 1.4 1.3 1.0 26 1.6 25 7
SoUth amerIca 391 18 6 1.2 -1 444 481 1.2 22 2.2 28 7
argentina 40.5 18 8 1.0 0 46.2 52.4 1.3 13.3 2.3 26 10
Bolivia 10.4 27 7 2.0 -1 13.3 16.0 1.5 45 3.5 37 4
Brazil 193.3 17 6 1.0 -0 212.4 215.3 1.1 24 2.0 27 7
Chile 17.1 15 6 0.9 1 19.1 20.2 1.2 8.3 1.9 24 8
Colombia 45.5 20 6 1.4 -2 53.5 61.3 1.3 20 2.4 30 7
ecuador 14.2 21 5 1.6 -5 16.6 18.6 1.3 21 2.6 31 6
French guiana 0.2 28 3 2.4 12 0.3 0.5 2.0 13.6 3.6 35 4
guyana 0.8 23 7 1.6 -16 0.8 0.9 1.2 38 2.8 33 5
Paraguay 6.5 25 6 1.9 -1 8.1 10.1 1.6 32 3.1 34 5
Peru 29.5 21 6 1.6 -4 34.5 39.8 1.4 20 2.6 31 6
suriname 0.5 19 7 1.3 -2 0.6 0.6 1.2 22 2.4 30 7
uruguay 3.4 14 9 0.5 -1 3.5 3.6 1.1 10.6 2.0 23 14
Venezuela 28.8 21 5 1.6 -1 35.1 41.7 1.4 15.8 2.6 30 6
ASIA 4,157 19 7 1.2 -0 4,845 5,424 1.3 41 2.2 26 7
aSIa (excl. china) 2,819 22 7 1.5 -0 3,369 3,987 1.4 46 2.6 30 6
weStern aSIa 235 24 5 1.9 -1 295 379 1.6 37 3.1 32 5
armenia 3.1 15 10 0.6 -1 3.3 3.3 1.1 25 1.7 20 10
azerbaijan 9.0 17 6 1.1 0 10.3 10.7 1.2 11 2.2 23 7
Bahrain 1.3 15 2 1.3 42 1.6 2.0 1.6 8 1.9 20 2
Cyprus 1.1 13 7 0.6 7 1.1 1.1 1.0 7 1.5 18 10
georgia 4.6 13 10 0.3 -2 4.3 3.6 0.8 17 1.7 17 14
iraq 31.5 32 6 2.6 -4 44.7 64.0 2.0 84 4.1 41 3
See notes on page 17.
© 2010 Population reference Bureau 2010 WORLD POPULATION DATA SHEET 8
Population mid-2010(millions)
Births per 1,000
Population
Deaths per 1,000
Population
Rate ofNatural
Increase(%)
Net Migration
Rateper 1,000
Population mid–2025 mid–2050
2050 Population
as a Multipleof 2010
InfantMortality
Ratea
TotalFertilityRateb <15 65+
Projected Population (millions)
Percent of Population
Ages
POPULATION, HEALTH, AND ENVIRONMENT DATA AND ESTIMATES FOR THE COUNTRIES AND REGIONS OF THE WORLD
israel 7.6 22 5 1.6 2 9.4 11.4 1.5 3.7 3.0 28 10
Jordan 6.5 31 4 2.6 2 8.5 11.8 1.8 23 3.8 37 3
Kuwait 3.1 22 2 2.0 8 4.1 5.4 1.7 9 2.2 23 2
lebanon 4.3 20 5 1.5 -1 4.7 5.0 1.2 19 2.3 25 10
oman 3.1 20 3 1.8 26 4.2 5.7 1.8 9 2.6 29 2
Palestinian territory 4.0 33 4 2.8 -1 6.0 9.4 2.3 25 4.6 44 3
Qatar 1.7 9 1 0.8 4 2.1 2.6 1.5 8 1.8 15 1
saudi arabia 29.2 28 2 2.6 -8 35.7 49.8 1.7 18 3.8 38 2
syria 22.5 28 3 2.5 -1 28.6 36.9 1.6 16 3.3 36 3
turkey 73.6 18 6 1.2 -0 85.0 94.7 1.3 28 2.1 26 7
united arab emirates 5.4 15 2 1.4 16 7.0 9.4 1.8 7 2.0 19 1
Yemen 23.6 38 8 3.0 -1 34.5 52.2 2.2 59 5.5 45 3
SoUth centraL aSIa 1,755 24 7 1.6 -1 2,148 2,620 1.5 55 2.8 32 5
afghanistan 29.1 39 18 2.1 6 39.4 53.4 1.8 155 5.7 44 2
Bangladesh 164.4 22 7 1.5 -1 195.0 222.5 1.4 45 2.4 32 4
Bhutan 0.7 25 8 1.7 3 0.9 1.0 1.4 40 3.1 31 5
india 1,188.8 23 7 1.5 -0 1,444.5 1,748.0 1.5 53 2.6 32 5
iran 75.1 19 6 1.3 -1 87.1 97.0 1.3 29 1.8 28 5
Kazakhstan 16.3 23 9 1.4 1 18.4 21.5 1.3 26 2.7 24 8
Kyrgyzstan 5.3 24 7 1.6 -3 6.5 8.0 1.5 31 2.8 29 5
Maldives 0.3 22 3 1.9 0 0.4 0.5 1.5 12 2.5 30 5
nepal 28.0 28 8 1.9 -1 35.7 46.1 1.6 48 3.0 37 4
Pakistan 184.8 30 7 2.3 -2 246.3 335.2 1.8 64 4.0 38 4
sri lanka 20.7 19 7 1.2 -2 23.2 25.4 1.2 15 2.4 26 6
tajikistan 7.6 28 4 2.4 -2 9.8 12.0 1.6 60 3.4 38 4
turkmenistan 5.2 22 8 1.4 -1 6.1 6.8 1.3 51 2.5 31 4
uzbekistan 28.1 23 5 1.8 -1 34.4 42.4 1.5 48 2.8 33 5
SoUtheaSt aSIa 597 20 7 1.3 -0 699 793 1.3 27 2.4 28 6
Brunei 0.4 16 3 1.3 2 0.5 0.6 1.6 7 1.7 27 3
Cambodia 15.1 25 8 1.6 -0 19.0 23.8 1.6 62 3.3 35 3
indonesia 235.5 20 6 1.4 -1 273.2 309.4 1.3 30 2.4 28 6
laos 6.4 28 7 2.1 -2 8.3 10.7 1.7 60 3.5 39 4
Malaysia 28.9 21 5 1.6 1 34.9 41.0 1.4 9 2.6 32 5
Myanmar 53.4 20 11 0.9 -0 61.7 70.8 1.3 56 2.4 27 3
Philippines 94.0 26 5 2.1 -3 117.6 140.5 1.5 23 3.2 33 4
singapore 5.1 10 4 0.6 25 5.7 5.5 1.1 2.2 1.2 18 9
thailand 68.1 15 9 0.6 1 72.6 73.4 1.1 7 1.8 22 7
timor-leste 1.2 41 10 3.1 2 1.9 3.2 2.8 44 5.7 45 3
Vietnam 88.9 17 5 1.2 0 103.2 113.7 1.3 15 2.1 25 8
eaSt aSIa 1,571 12 7 0.5 -0 1,704 1,632 1.0 20 1.5 18 10
China 1,338.1 12 7 0.5 -0 1,476.0 1,437.0 1.1 21 1.5 18 8
China, hong Kong sare 7.0 12 6 0.6 -1 8.0 8.8 1.3 1.7 1.0 12 13
China, Macao sare 0.5 9 3 0.6 -19 0.7 0.7 1.4 3 1.0 13 8
Japan 127.4 9 9 -0.0 -1 119.3 95.2 0.7 2.6 1.4 13 23
Korea, north 22.8 15 10 0.5 0 23.6 22.9 1.0 53 2.0 22 9
Korea, south 48.9 9 5 0.4 1 49.1 42.3 0.9 3.4 1.2 17 11
Mongolia 2.8 25 6 1.9 0 3.3 4.0 1.5 41 2.7 33 4
taiwan 23.2 8 6 0.2 2 23.9 21.5 0.9 4.5 1.0 16 11
EUROPE 739 11 11 0.0 2 747 720 1.0 6 1.6 16 16
eUropean UnIon 501 11 10 0.1 2 514 510 1.0 4 1.6 16 17
northern eUrope 99 13 9 0.3 3 109 119 1.2 4 1.9 18 16
Channel islands 0.2 10 8 0.2 7 0.2 0.2 1.0 3.6 1.6 16 15
denmark 5.5 11 10 0.1 4 5.8 5.9 1.1 3.1 1.8 19 17
estonia 1.3 12 12 -0.0 -0 1.3 1.2 0.9 3.6 1.6 15 17
Finland 5.4 11 9 0.2 3 5.8 6.1 1.1 2.6 1.9 17 17
iceland 0.3 15 6 0.9 -15 0.4 0.4 1.3 2.5 2.1 21 12
ireland 4.5 17 6 1.0 -2 5.7 6.4 1.4 3.5 2.1 21 11
latvia 2.2 10 13 -0.4 -2 2.1 1.8 0.8 6.7 1.3 14 17
lithuania 3.3 11 12 -0.1 -5 3.1 2.7 0.8 4.9 1.5 15 16
norway 4.9 13 9 0.4 8 5.6 6.5 1.3 3.1 2.0 19 15
sweden 9.4 12 10 0.2 7 10.2 10.7 1.1 2.2 1.9 17 18
united Kingdom 62.2 13 9 0.4 2 68.6 77.0 1.2 4.7 1.9 18 16
See notes on page 17.
© 2010 Population reference Bureau 2010 WORLD POPULATION DATA SHEET 9
Population mid-2010(millions)
Births per 1,000
Population
Deaths per 1,000
Population
Rate ofNatural
Increase(%)
Net Migration
Rateper 1,000
Population mid–2025 mid–2050
2050 Population
as a Multipleof 2010
InfantMortality
Ratea
TotalFertilityRateb <15 65+
Projected Population (millions)
Percent of Population
Ages
POPULATION, HEALTH, AND ENVIRONMENT DATA AND ESTIMATES FOR THE COUNTRIES AND REGIONS OF THE WORLD
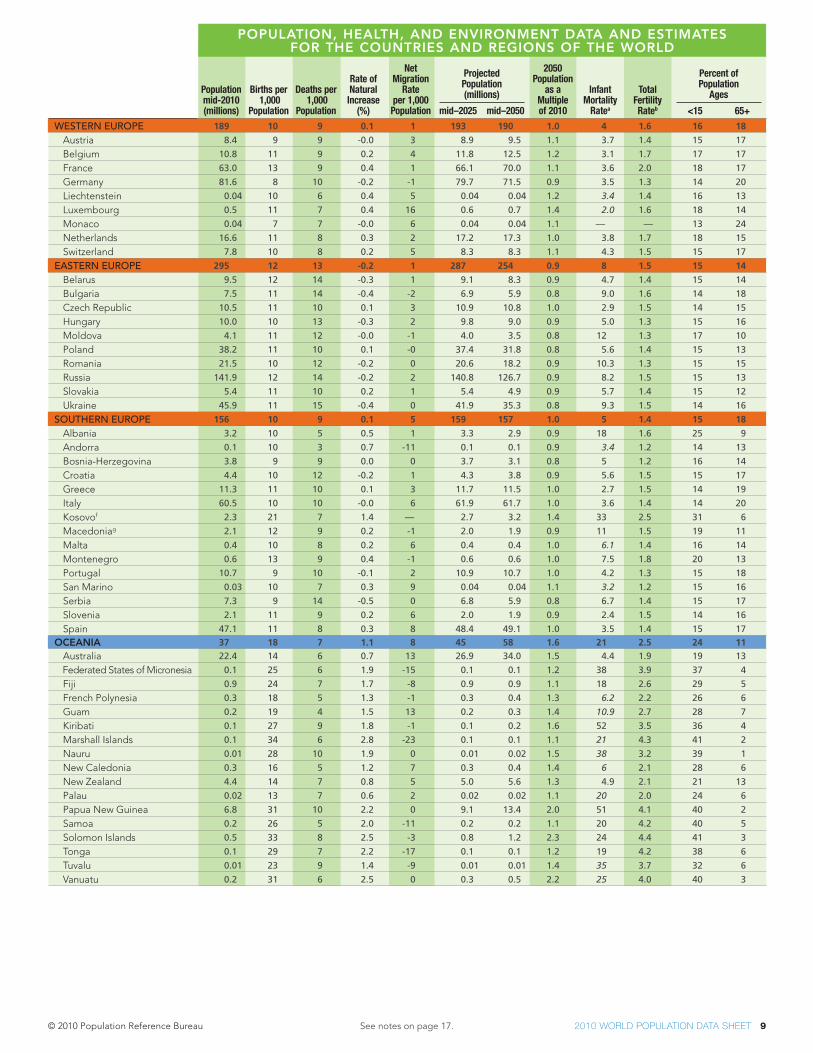
weStern eUrope 189 10 9 0.1 1 193 190 1.0 4 1.6 16 18
austria 8.4 9 9 -0.0 3 8.9 9.5 1.1 3.7 1.4 15 17
Belgium 10.8 11 9 0.2 4 11.8 12.5 1.2 3.1 1.7 17 17
France 63.0 13 9 0.4 1 66.1 70.0 1.1 3.6 2.0 18 17
germany 81.6 8 10 -0.2 -1 79.7 71.5 0.9 3.5 1.3 14 20
liechtenstein 0.04 10 6 0.4 5 0.04 0.04 1.2 3.4 1.4 16 13
luxembourg 0.5 11 7 0.4 16 0.6 0.7 1.4 2.0 1.6 18 14
Monaco 0.04 7 7 -0.0 6 0.04 0.04 1.1 — — 13 24
netherlands 16.6 11 8 0.3 2 17.2 17.3 1.0 3.8 1.7 18 15
switzerland 7.8 10 8 0.2 5 8.3 8.3 1.1 4.3 1.5 15 17
eaStern eUrope 295 12 13 -0.2 1 287 254 0.9 8 1.5 15 14
Belarus 9.5 12 14 -0.3 1 9.1 8.3 0.9 4.7 1.4 15 14
Bulgaria 7.5 11 14 -0.4 -2 6.9 5.9 0.8 9.0 1.6 14 18
Czech republic 10.5 11 10 0.1 3 10.9 10.8 1.0 2.9 1.5 14 15
hungary 10.0 10 13 -0.3 2 9.8 9.0 0.9 5.0 1.3 15 16
Moldova 4.1 11 12 -0.0 -1 4.0 3.5 0.8 12 1.3 17 10
Poland 38.2 11 10 0.1 -0 37.4 31.8 0.8 5.6 1.4 15 13
romania 21.5 10 12 -0.2 0 20.6 18.2 0.9 10.3 1.3 15 15
russia 141.9 12 14 -0.2 2 140.8 126.7 0.9 8.2 1.5 15 13
slovakia 5.4 11 10 0.2 1 5.4 4.9 0.9 5.7 1.4 15 12
ukraine 45.9 11 15 -0.4 0 41.9 35.3 0.8 9.3 1.5 14 16
SoUthern eUrope 156 10 9 0.1 5 159 157 1.0 5 1.4 15 18
albania 3.2 10 5 0.5 1 3.3 2.9 0.9 18 1.6 25 9
andorra 0.1 10 3 0.7 -11 0.1 0.1 0.9 3.4 1.2 14 13
Bosnia-herzegovina 3.8 9 9 0.0 0 3.7 3.1 0.8 5 1.2 16 14
Croatia 4.4 10 12 -0.2 1 4.3 3.8 0.9 5.6 1.5 15 17
greece 11.3 11 10 0.1 3 11.7 11.5 1.0 2.7 1.5 14 19
italy 60.5 10 10 -0.0 6 61.9 61.7 1.0 3.6 1.4 14 20
Kosovof 2.3 21 7 1.4 — 2.7 3.2 1.4 33 2.5 31 6
Macedoniag 2.1 12 9 0.2 -1 2.0 1.9 0.9 11 1.5 19 11
Malta 0.4 10 8 0.2 6 0.4 0.4 1.0 6.1 1.4 16 14
Montenegro 0.6 13 9 0.4 -1 0.6 0.6 1.0 7.5 1.8 20 13
Portugal 10.7 9 10 -0.1 2 10.9 10.7 1.0 4.2 1.3 15 18
san Marino 0.03 10 7 0.3 9 0.04 0.04 1.1 3.2 1.2 15 16
serbia 7.3 9 14 -0.5 0 6.8 5.9 0.8 6.7 1.4 15 17
slovenia 2.1 11 9 0.2 6 2.0 1.9 0.9 2.4 1.5 14 16
spain 47.1 11 8 0.3 8 48.4 49.1 1.0 3.5 1.4 15 17
OCEANIA 37 18 7 1.1 8 45 58 1.6 21 2.5 24 11
australia 22.4 14 6 0.7 13 26.9 34.0 1.5 4.4 1.9 19 13
Federated states of Micronesia 0.1 25 6 1.9 -15 0.1 0.1 1.2 38 3.9 37 4
Fiji 0.9 24 7 1.7 -8 0.9 0.9 1.1 18 2.6 29 5
French Polynesia 0.3 18 5 1.3 -1 0.3 0.4 1.3 6.2 2.2 26 6
guam 0.2 19 4 1.5 13 0.2 0.3 1.4 10.9 2.7 28 7
Kiribati 0.1 27 9 1.8 -1 0.1 0.2 1.6 52 3.5 36 4
Marshall islands 0.1 34 6 2.8 -23 0.1 0.1 1.1 21 4.3 41 2
nauru 0.01 28 10 1.9 0 0.01 0.02 1.5 38 3.2 39 1
new Caledonia 0.3 16 5 1.2 7 0.3 0.4 1.4 6 2.1 28 6
new Zealand 4.4 14 7 0.8 5 5.0 5.6 1.3 4.9 2.1 21 13
Palau 0.02 13 7 0.6 2 0.02 0.02 1.1 20 2.0 24 6
Papua new guinea 6.8 31 10 2.2 0 9.1 13.4 2.0 51 4.1 40 2
samoa 0.2 26 5 2.0 -11 0.2 0.2 1.1 20 4.2 40 5
solomon islands 0.5 33 8 2.5 -3 0.8 1.2 2.3 24 4.4 41 3
tonga 0.1 29 7 2.2 -17 0.1 0.1 1.2 19 4.2 38 6
tuvalu 0.01 23 9 1.4 -9 0.01 0.01 1.4 35 3.7 32 6
Vanuatu 0.2 31 6 2.5 0 0.3 0.5 2.2 25 4.0 40 3
See notes on page 17.

© 2010 Population reference Bureau 2010 WORLD POPULATION DATA SHEET 10See notes on page 17.
WORLD 9 4 69 67 71 50 0.8 0.9 62 55
MORE DEVELOPED 4 2 77 74 81 75 0.7 0.3 71 60
LESS DEVELOPED 11 4 67 66 69 44 0.9 1.1 60 54
LESS DEVELOPED (Excl. China) 13 5 65 63 67 44 1.1 1.4 52 44
LEAST DEVELOPED 17 9 56 55 57 27 1.9 2.7 29 23
AFRICA 16 9 55 54 57 38 3.2 4.8 29 23
SUB-Saharan afrIca 17 11 52 51 53 35 3.7 5.6 23 17
northern afrIca 14 5 69 67 71 50 0.3 0.4 49 44
algeria 15 4 72 71 74 63 0.1 <0.1 61 52
egypt 14 5 72 69 75 43 <0.1 <0.1 60 58
libya 15 4 74 72 77 77 — — 42 20
Morocco 12 4 71 69 73 57 0.2 <0.1 63 55
sudan 16 8 58 57 60 38 1.1 1.7 8 6
tunisia 10 3 74 72 76 66 <0.1 <0.1 60 52
Western saharad 29 4 60 58 62 81 — — — —
weStern afrIca 18 11 51 50 52 42 2.1 3.0 14 10
Benin 16 10 59 57 60 41 0.9 1.6 17 6
Burkina Faso 26 14 53 51 54 23 1.5 1.7 17 13
Cape Verde 15 5 73 69 76 61 — — 61 57
Côte d'ivoire 14 9 52 51 54 50 3.1 4.7 13 8
gambia 19 12 55 54 57 54 0.7 1.0 10 9
ghana 16 8 60 58 61 48 1.5 2.3 24 17
guinea 16 10 57 55 58 28 1.3 2.0 9 6
guinea-Bissau 16 12 46 45 48 30 1.5 2.2 10 6
liberia 17 10 56 54 57 58 1.4 2.1 11 10
Mali 23 14 51 50 53 33 1.2 1.7 8 6
Mauritania 22 9 57 55 59 40 1.2 0.5 9 8
niger 24 19 48 48 49 20 1.1 0.5 11 5
nigeria 17 11 47 47 48 47 2.5 3.8 15 10
senegal 23 12 55 54 57 41 0.8 1.2 12 10
sierra leone 30 16 47 46 49 36 1.4 2.0 8 7
togo 16 8 61 60 63 40 2.6 3.9 17 11
eaStern afrIca 17 12 53 52 54 22 4.5 6.7 28 23
Burundi 21 9 50 49 52 10 1.6 2.4 9 8
Comoros 19 7 64 62 66 28 <0.1 <0.1 26 19
djibouti 18 8 55 54 57 76 2.4 3.7 18 17
eritrea 22 9 59 57 62 21 1.0 1.5 8 5
ethiopia 17 11 55 54 57 16 1.6 2.4 15 14
Kenya 21 11 57 56 57 18 4.3 8.0 46 39
Madagascar 18 10 60 59 62 31 0.2 <0.1 40 29
Malawi 16 13 49 48 50 14 10.2 13.5 41 38
Mauritius 9 3 73 69 76 42 2.4 1.0 76 42
Mayotte 18 6 74 72 76 28 — — — —
Mozambique 16 13 48 47 49 31 10.0 14.9 17 12
reunion 9 3 78 75 82 92 — — 67 64
rwanda 22 11 51 50 53 17 2.3 3.2 36 27
seychelles — — 73 68 78 53 — — — —
somalia 19 13 49 48 51 34 0.8 0.3 15 1
tanzania 17 13 55 55 56 25 5.0 7.6 26 20
uganda 19 16 52 52 53 13 4.3 6.6 24 18
Zambia 17 16 42 41 42 37 12.4 18.0 41 33
Zimbabwe 14 10 43 41 44 37 12.2 18.7 60 58
mIDDLe afrIca 18 13 48 47 50 41 1.9 3.1 19 7
angola 21 13 47 45 49 57 1.7 2.5 6 5
Cameroon 16 10 51 50 52 53 3.9 6.3 26 13
Central african republic 14 10 49 47 50 38 4.6 8.0 19 9
Chad 18 14 49 47 50 27 2.8 4.2 3 2
Congo 15 9 53 52 54 60 2.1 4.1 44 13
Congo, dem. rep. 19 14 48 46 49 33 1.0 1.6 21 6
equatorial guinea 20 12 49 48 51 39 2.8 4.1 — —
gabon 14 7 60 58 61 84 4.8 7.1 33 12
sao tome and Principe 14 7 66 64 69 58 — — 38 34
2010 2050 Both Sexes Males Females Percent Urban Males Females All MethodsModern Methods
Life Expectancy at Birth (years)
Percent of Population With HIV/AIDS
Adults Ages 15–49, 2007/2009
Percent of Married Women 15–49 Using
ContraceptionElderly Support Ratioc
POPULATION, HEALTH, AND ENVIRONMENT DATA AND ESTIMATES FOR THE COUNTRIES AND REGIONS OF THE WORLD

© 2010 Population reference Bureau 2010 WORLD POPULATION DATA SHEET 11
2010 2050 Both Sexes Males Females Percent Urban Males Females All MethodsModern Methods
Life Expectancy at Birth (years)
Percent of Population With HIV/AIDS
Adults Ages 15–49, 2007/2009
Percent of Married Women 15–49 Using
ContraceptionElderly Support Ratioc
POPULATION, HEALTH, AND ENVIRONMENT DATA AND ESTIMATES FOR THE COUNTRIES AND REGIONS OF THE WORLD
See notes on page 17.
SoUthern afrIca 14 7 55 53 57 50 14.7 22.3 59 58
Botswana 16 9 55 55 55 60 18.9 28.9 44 42
lesotho 12 11 41 40 43 23 19.4 27.1 37 35
namibia 16 8 61 60 62 35 12.2 18.6 55 53
south africa 14 7 55 54 57 52 14.4 21.8 60 60
swaziland 17 15 46 46 45 22 20.2 32.1 51 48
AMERICAS 7 3 75 72 78 78 0.8 0.3 75 69
NORTHERN AMERICA 5 3 78 76 81 79 0.9 0.3 78 73
Canada 5 2 81 78 83 80 0.5 0.2 74 72
united states 5 3 78 75 80 79 0.9 0.3 79 73
LATIN AMERICA/CARIBBEAN 9 3 74 71 77 77 0.7 0.4 73 67
centraL amerIca 10 3 75 72 78 71 0.5 0.3 68 63
Belize 15 5 73 71 74 51 1.6 2.5 34 31
Costa rica 11 3 79 77 82 59 0.5 0.2 80 72
el salvador 8 4 71 67 76 63 1.2 0.5 73 66
guatemala 12 7 70 66 73 47 1.1 0.4 43 34
honduras 14 5 72 70 75 50 0.9 0.4 65 56
Mexico 10 3 76 74 79 77 0.4 0.2 71 67
nicaragua 13 4 71 69 73 56 0.3 0.1 72 70
Panama 10 4 76 73 78 64 1.4 0.6 — —
carIBBean 8 3 72 69 74 65 1.2 1.1 62 55
antigua and Barbuda — — 75 73 77 31 — — — —
Bahamas 10 3 74 71 77 83 4.4 1.6 — —
Barbados 7 2 74 71 76 38 1.8 0.6 — —
Cuba 6 2 78 76 80 75 0.1 <0.1 73 72
dominica — — 75 72 78 73 — — — —
dominican republic 10 4 72 69 75 67 1.0 1.1 73 60
grenada 9 3 70 68 72 31 — — — —
guadeloupe 5 2 80 76 83 100 — — — —
haiti 14 6 61 59 62 48 2.1 2.3 32 25
Jamaica 8 4 72 68 75 52 2.2 0.9 69 66
Martinique 5 2 80 77 83 89 — — — —
netherlands antilles 7 2 76 73 80 92 — — — —
Puerto rico 5 2 79 75 82 94 — — 84 72
st. Kitts-nevis — — 74 71 76 32 — — — —
saint lucia 10 3 73 71 76 28 — — — —
st. Vincent & the grenadines 10 4 72 70 74 40 — — — —
trinidad and tobago 10 3 69 66 73 12 1.2 1.8 43 38
SoUth amerIca 9 3 73 70 77 82 0.8 0.3 76 69
argentina 6 3 75 72 79 91 0.8 0.3 65 64
Bolivia 12 5 66 64 68 65 0.2 <0.1 61 35
Brazil 10 3 73 69 77 84 0.8 0.4 81 77
Chile 7 3 79 76 82 87 0.4 0.2 64 —
Colombia 12 4 74 71 78 75 0.8 0.3 78 68
ecuador 9 4 75 72 78 65 0.5 0.2 73 59
French guiana 16 5 78 75 81 81 — — — —
guyana 10 3 66 62 70 28 2.0 3.0 43 40
Paraguay 12 5 72 70 74 58 0.8 0.3 79 71
Peru 11 4 73 71 76 76 0.6 0.3 73 50
suriname 10 4 69 65 73 67 3.4 1.4 42 41
uruguay 5 3 76 72 80 94 0.8 0.3 77 75
Venezuela 12 4 74 71 77 88 1.1 0.4 70 62
ASIA 10 4 70 68 72 43 0.3 0.2 66 60
aSIa (excl. china) 11 4 68 66 69 41 0.4 0.2 56 47
weStern aSIa 14 5 72 69 74 69 — — 52 35
armenia 6 3 72 68 75 64 0.2 <0.1 53 20
azerbaijan 11 4 72 70 75 54 0.3 <0.1 51 14
Bahrain 32 4 75 73 77 100 — — — —
Cyprus 5 3 79 77 80 62 — — — —
georgia 5 2 74 69 79 53 0.2 <0.1 47 27
iraq 17 8 67 64 72 67 — — 50 33

© 2010 Population reference Bureau 2010 WORLD POPULATION DATA SHEET 12
2010 2050 Both Sexes Males Females Percent Urban Males Females All MethodsModern Methods
Life Expectancy at Birth (years)
Percent of Population With HIV/AIDS
Adults Ages 15–49, 2007/2009
Percent of Married Women 15–49 Using
ContraceptionElderly Support Ratioc
POPULATION, HEALTH, AND ENVIRONMENT DATA AND ESTIMATES FOR THE COUNTRIES AND REGIONS OF THE WORLD
See notes on page 17.
israel 6 3 81 79 83 92 0.2 <0.1 — —
Jordan 17 5 73 72 74 83 — — 59 42
Kuwait 32 3 78 76 80 98 — — 52 39
lebanon 9 3 72 70 74 87 0.2 <0.1 58 34
oman 21 4 72 70 74 72 — — — —
Palestinian territory 18 9 72 70 73 83 — — 50 39
Qatar 78 5 76 75 77 100 — — 43 32
saudi arabia 22 5 76 74 78 81 — — 24 —
syria 19 5 74 72 76 54 — — 58 43
turkey 11 3 72 69 74 76 — — 71 43
united arab emirates 79 6 77 77 79 83 — — — —
Yemen 23 11 63 62 64 29 — — 28 19
SoUth centraL aSIa 14 5 65 64 66 31 0.3 0.2 54 45
afghanistan 23 18 44 44 44 22 <0.1 <0.1 19 16
Bangladesh 16 4 66 65 67 25 <0.1 <0.1 56 48
Bhutan 13 4 68 67 68 32 0.1 <0.1 31 31
india 13 5 64 63 65 29 0.4 0.3 56 49
iran 15 3 71 70 73 69 0.3 0.1 74 56
Kazakhstan 10 4 69 63 74 54 0.2 <0.1 51 49
Kyrgyzstan 13 5 68 64 72 35 0.2 <0.1 48 46
Maldives 16 4 73 72 74 35 <0.1 <0.1 35 27
nepal 15 6 64 64 65 17 0.7 0.3 48 44
Pakistan 15 7 66 66 67 35 0.1 <0.1 30 22
sri lanka 9 3 74 72 76 15 <0.1 <0.1 68 53
tajikistan 17 7 67 64 69 26 0.4 0.1 38 33
turkmenistan 16 5 65 61 69 47 — — 62 53
uzbekistan 15 5 68 65 71 36 0.1 <0.1 65 59
SoUtheaSt aSIa 11 4 70 68 72 42 0.6 0.3 60 53
Brunei 20 4 77 75 80 72 — — — —
Cambodia 18 7 61 59 63 20 1.2 0.4 40 27
indonesia 11 3 71 69 73 43 0.3 <0.1 61 57
laos 16 7 65 63 66 27 0.3 <0.1 32 29
Malaysia 14 4 74 72 77 63 0.8 0.3 — —
Myanmar 12 4 58 56 60 31 0.8 0.5 37 33
Philippines 14 5 72 70 74 63 <0.1 <0.1 51 34
singapore 7 2 81 79 84 100 0.2 <0.1 62 55
thailand 9 3 69 66 72 31 1.7 1.2 72 70
timor-leste 17 14 61 60 62 22 — — 22 21
Vietnam 11 3 74 72 76 28 0.8 0.3 80 69
eaSt aSIa 7 2 75 73 77 52 0.1 <0.1 84 82
China 9 3 74 72 76 47 0.1 <0.1 87 86
China, hong Kong sare 6 2 83 80 86 100 — — 84 80
China, Macao sare 11 2 82 79 85 100 — — — —
Japan 3 1 83 79 86 86 <0.1 <0.1 54 44
Korea, north 7 4 63 61 66 60 — — 69 58
Korea, south 7 2 80 77 83 82 <0.1 <0.1 81 67
Mongolia 17 4 67 63 70 61 <0.1 <0.1 66 61
taiwan 7 2 79 75 82 78 — — 71 —
EUROPE 4 2 76 72 80 71 0.7 0.3 70 56
eUropean UnIon 4 2 79 76 82 71 0.4 0.1 70 59
northern eUrope 4 3 79 77 82 77 0.3 0.1 81 75
Channel islands 4 2 79 77 82 31 — — — —
denmark 4 3 79 76 81 72 0.2 <0.1 — —
estonia 4 2 74 69 79 69 2.0 0.6 70 56
Finland 4 2 80 77 83 65 0.1 <0.1 79 78
iceland 6 2 81 80 83 93 0.3 0.1 — —
ireland 6 2 79 77 82 60 0.3 0.1 75 66
latvia 4 2 73 67 78 68 1.2 0.4 85 60
lithuania 4 2 72 66 78 67 0.2 <0.1 47 30
norway 4 3 81 79 83 80 0.2 <0.1 88 82
sweden 4 2 81 79 83 84 0.1 0.1 75 65
united Kingdom 4 3 80 77 82 80 0.3 0.1 84 79

© 2010 Population reference Bureau 2010 WORLD POPULATION DATA SHEET 13
2010 2050 Both Sexes Males Females Percent Urban Males Females All MethodsModern Methods
Life Expectancy at Birth (years)
Percent of Population With HIV/AIDS
Adults Ages 15–49, 2007/2009
Percent of Married Women 15–49 Using
ContraceptionElderly Support Ratioc
POPULATION, HEALTH, AND ENVIRONMENT DATA AND ESTIMATES FOR THE COUNTRIES AND REGIONS OF THE WORLD
See notes on page 17.
weStern eUrope 4 2 80 78 83 75 0.3 0.1 73 69
austria 4 2 80 78 83 67 0.3 0.1 57 41
Belgium 4 2 80 77 82 99 0.3 0.1 75 73
France 4 2 81 78 85 77 0.5 0.2 79 76
germany 3 2 80 77 82 73 0.2 <0.1 70 66
liechtenstein — — 80 79 82 15 — — — —
luxembourg 5 3 80 78 83 83 0.3 0.1 — —
Monaco — — — — — 100 — — — —
netherlands 4 2 80 78 82 66 0.3 0.1 67 65
switzerland 4 2 82 80 84 73 0.7 0.4 82 78
eaStern eUrope 5 2 70 65 76 69 1.2 0.5 69 48
Belarus 5 2 70 65 76 74 0.3 0.1 73 57
Bulgaria 4 2 73 70 77 71 0.1 <0.1 63 40
Czech republic 5 2 77 74 80 74 <0.1 <0.1 72 63
hungary 4 2 74 70 78 67 <0.1 <0.1 77 68
Moldova 6 3 70 66 73 41 0.5 0.2 68 44
Poland 5 2 76 71 80 61 0.1 <0.1 49 19
romania 5 2 73 69 76 55 0.1 0.1 70 38
russia 6 3 68 62 74 73 1.7 0.6 73 53
slovakia 6 2 75 71 79 55 — — 80 66
ukraine 5 2 68 63 74 69 1.9 1.3 67 48
SoUthern eUrope 4 2 80 77 83 68 0.6 0.2 62 46
albania 7 3 75 72 79 49 — — 69 10
andorra — — — — — 90 — — — —
Bosnia-herzegovina 5 2 75 72 77 46 — — 36 11
Croatia 4 2 76 72 79 56 — — — —
greece 4 2 80 77 82 73 0.2 <0.1 76 46
italy 3 2 82 79 84 68 0.6 0.2 60 39
Kosovof — — 69 67 71 — — — 44 18
Macedoniag 6 2 74 71 76 65 — — 14 10
Malta 5 2 79 77 82 94 0.1 <0.1 86 43
Montenegro 5 3 74 71 76 64 — — 39 17
Portugal 4 2 79 75 82 55 0.7 0.3 67 63
san Marino — — 83 80 86 84 — — — —
serbia 5 3 74 71 76 58 0.1h <0.1h 41h 19h
slovenia 4 2 79 76 82 50 — — 74 59
spain 4 2 81 78 84 77 0.8 0.2 66 62
OCEANIA 6 3 76 74 78 66 0.6 0.3 82 63
australia 5 3 81 79 84 82 0.3 <0.1 85 75
Federated states of Micronesia 16 7 68 67 68 22 — — — 70
Fiji 13 5 68 66 71 51 0.1 <0.1 — 40
French Polynesia 11 4 74 72 77 53 — — — —
guam 9 4 79 76 82 93 — — 67 58
Kiribati — — 61 59 63 44 — — — 21
Marshall islands — — 66 64 67 68 — — 45 42
nauru — — 56 55 57 100 — — 36 25
new Caledonia 9 3 76 72 80 58 — — — —
new Zealand 5 3 80 78 82 86 <0.1 <0.1 75 72
Palau — — 69 66 72 78 — — 33 30
Papua new guinea 23 9 59 57 62 13 1.8 1.2 — 24
samoa 12 8 73 72 74 22 — — — 54
solomon islands 19 7 62 62 63 17 — — 35 27
tonga 10 6 70 67 73 23 — — — 23
tuvalu — — 64 62 65 47 — — 31 22
Vanuatu 17 7 67 66 69 24 — — 38 37
© 2010 Population reference Bureau 2010 WORLD POPULATION DATA SHEET 14See notes on page 17.
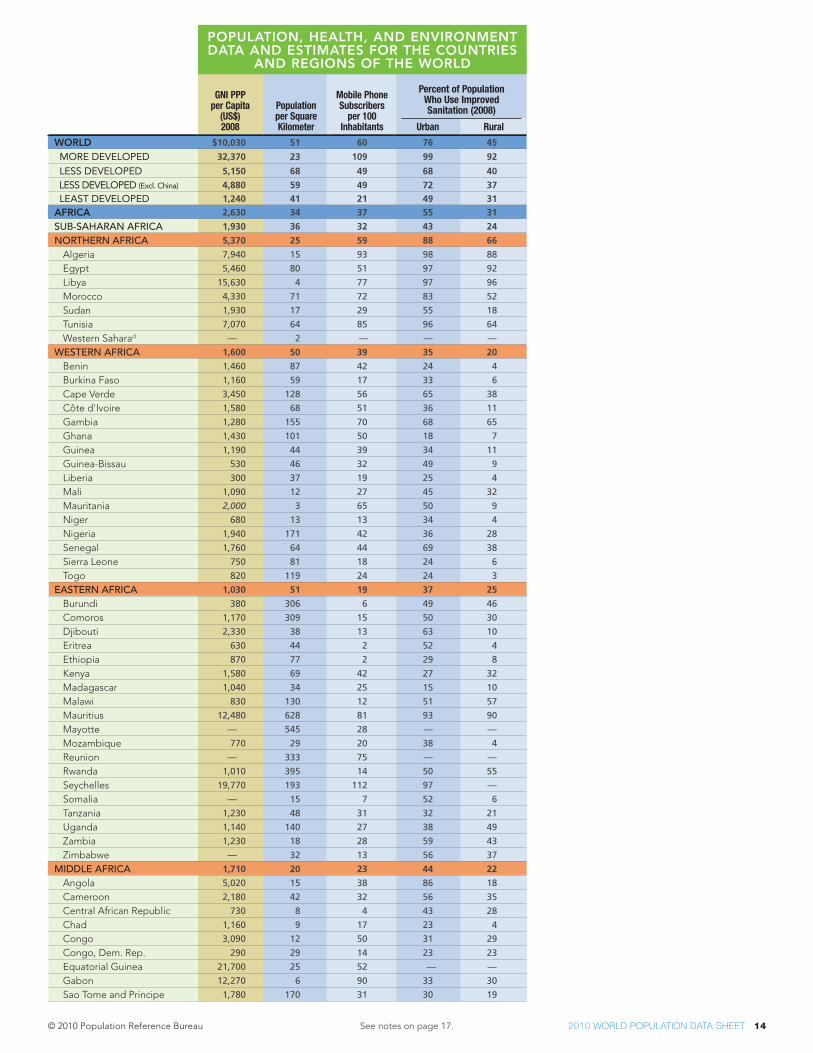
WORLD $10,030 51 60 76 45
MORE DEVELOPED 32,370 23 109 99 92
LESS DEVELOPED 5,150 68 49 68 40
LESS DEVELOPED (Excl. China) 4,880 59 49 72 37
LEAST DEVELOPED 1,240 41 21 49 31
AFRICA 2,630 34 37 55 31
SUB-Saharan afrIca 1,930 36 32 43 24
northern afrIca 5,370 25 59 88 66
algeria 7,940 15 93 98 88
egypt 5,460 80 51 97 92
libya 15,630 4 77 97 96
Morocco 4,330 71 72 83 52
sudan 1,930 17 29 55 18
tunisia 7,070 64 85 96 64
Western saharad — 2 — — —
weStern afrIca 1,600 50 39 35 20
Benin 1,460 87 42 24 4
Burkina Faso 1,160 59 17 33 6
Cape Verde 3,450 128 56 65 38
Côte d'ivoire 1,580 68 51 36 11
gambia 1,280 155 70 68 65
ghana 1,430 101 50 18 7
guinea 1,190 44 39 34 11
guinea-Bissau 530 46 32 49 9
liberia 300 37 19 25 4
Mali 1,090 12 27 45 32
Mauritania 2,000 3 65 50 9
niger 680 13 13 34 4
nigeria 1,940 171 42 36 28
senegal 1,760 64 44 69 38
sierra leone 750 81 18 24 6
togo 820 119 24 24 3
eaStern afrIca 1,030 51 19 37 25
Burundi 380 306 6 49 46
Comoros 1,170 309 15 50 30
djibouti 2,330 38 13 63 10
eritrea 630 44 2 52 4
ethiopia 870 77 2 29 8
Kenya 1,580 69 42 27 32
Madagascar 1,040 34 25 15 10
Malawi 830 130 12 51 57
Mauritius 12,480 628 81 93 90
Mayotte — 545 28 — —
Mozambique 770 29 20 38 4
reunion — 333 75 — —
rwanda 1,010 395 14 50 55
seychelles 19,770 193 112 97 —
somalia — 15 7 52 6
tanzania 1,230 48 31 32 21
uganda 1,140 140 27 38 49
Zambia 1,230 18 28 59 43
Zimbabwe — 32 13 56 37
mIDDLe afrIca 1,710 20 23 44 22
angola 5,020 15 38 86 18
Cameroon 2,180 42 32 56 35
Central african republic 730 8 4 43 28
Chad 1,160 9 17 23 4
Congo 3,090 12 50 31 29
Congo, dem. rep. 290 29 14 23 23
equatorial guinea 21,700 25 52 — —
gabon 12,270 6 90 33 30
sao tome and Principe 1,780 170 31 30 19
GNI PPP per Capita
(US$) 2008
Population per Square Kilometer
Mobile Phone Subscribers
per 100 Inhabitants Urban Rural
POPULATION, HEALTH, AND ENVIRONMENT DATA AND ESTIMATES FOR THE COUNTRIES
AND REGIONS OF THE WORLD
Percent of Population Who Use Improved Sanitation (2008)

© 2010 Population reference Bureau 2010 WORLD POPULATION DATA SHEET 15
GNI PPP per Capita
(US$) 2008
Population per Square Kilometer
Mobile Phone Subscribers
per 100 Inhabitants Urban Rural
POPULATION, HEALTH, AND ENVIRONMENT DATA AND ESTIMATES FOR THE COUNTRIES
AND REGIONS OF THE WORLD
SoUthern afrIca 9,390 21 86 82 59
Botswana 13,100 3 77 74 39
lesotho 2,000 63 28 40 25
namibia 6,270 3 49 60 17
south africa 9,780 41 91 84 65
swaziland 5,010 69 46 61 53
AMERICAS 23,370 22 82 92 71
NORTHERN AMERICA 45,890 16 85 100 99
Canada 36,220 3 66 100 99
united states 46,970 32 87 100 99
LATIN AMERICA/CARIBBEAN 10,140 28 80 86 55
centraL amerIca 11,910 62 75 89 68
Belize 6,040 15 53 93 86
Costa rica 10,950 90 42 95 96
el salvador 6,670 294 113 89 83
guatemala 4,690 132 109 89 73
honduras 3,870 68 85 80 62
Mexico 14,270 57 69 90 68
nicaragua 2,620 46 55 63 37
Panama 11,650 46 115 75 51
carIBBean — 177 50 77 55
antigua and Barbuda 20,570 205 158 98 —
Bahamas — 25 106 100 100
Barbados — 637 159 100 100
Cuba — 101 3 100 81
dominica 8,300 96 150 — —
dominican republic 7,890 203 72 87 74
grenada 8,060 320 58 96 97
guadeloupe — 239 70 95 —
haiti 1,180 353 32 24 10
Jamaica 7,360 246 101 82 84
Martinique — 368 75 95 —
netherlands antilles — 255 109 — —
Puerto rico — 448 86 — —
st. Kitts-nevis 15,170 203 157 96 96
saint lucia 9,190 327 100 — —
st. Vincent & the grenadines 8,770 276 119 — 96
trinidad and tobago 23,950 257 113 92 92
SoUth amerIca 10,150 22 85 86 46
argentina 14,020 15 117 91 77
Bolivia 4,140 9 50 34 9
Brazil 10,070 23 78 87 37
Chile 13,270 23 88 98 83
Colombia 8,510 40 92 81 55
ecuador 7,760 50 86 96 84
French guiana — 3 50 — —
guyana 2,510 4 37 85 80
Paraguay 4,820 16 95 90 40
Peru 7,980 23 73 81 36
suriname 7,130 3 81 90 66
uruguay 12,540 19 105 100 99
Venezuela 12,830 32 96 — —
ASIA 6,000 130 49 69 42
aSIa (excl. china) 5,990 126 49 75 38
weStern aSIa 10,590 49 81 93 66
armenia 6,310 104 100 95 80
azerbaijan 7,770 104 75 51 39
Bahrain — 1,807 186 100 —
Cyprus 24,040 118 118 100 100
georgia 4,850 67 64 96 93
iraq — 72 58 76 66
See notes on page 17.
Percent of Population Who Use Improved Sanitation (2008)
© 2010 Population reference Bureau 2010 WORLD POPULATION DATA SHEET 16
GNI PPP per Capita
(US$) 2008
Population per Square Kilometer
Mobile Phone Subscribers
per 100 Inhabitants Urban Rural
POPULATION, HEALTH, AND ENVIRONMENT DATA AND ESTIMATES FOR THE COUNTRIES
AND REGIONS OF THE WORLD
See notes on page 17.
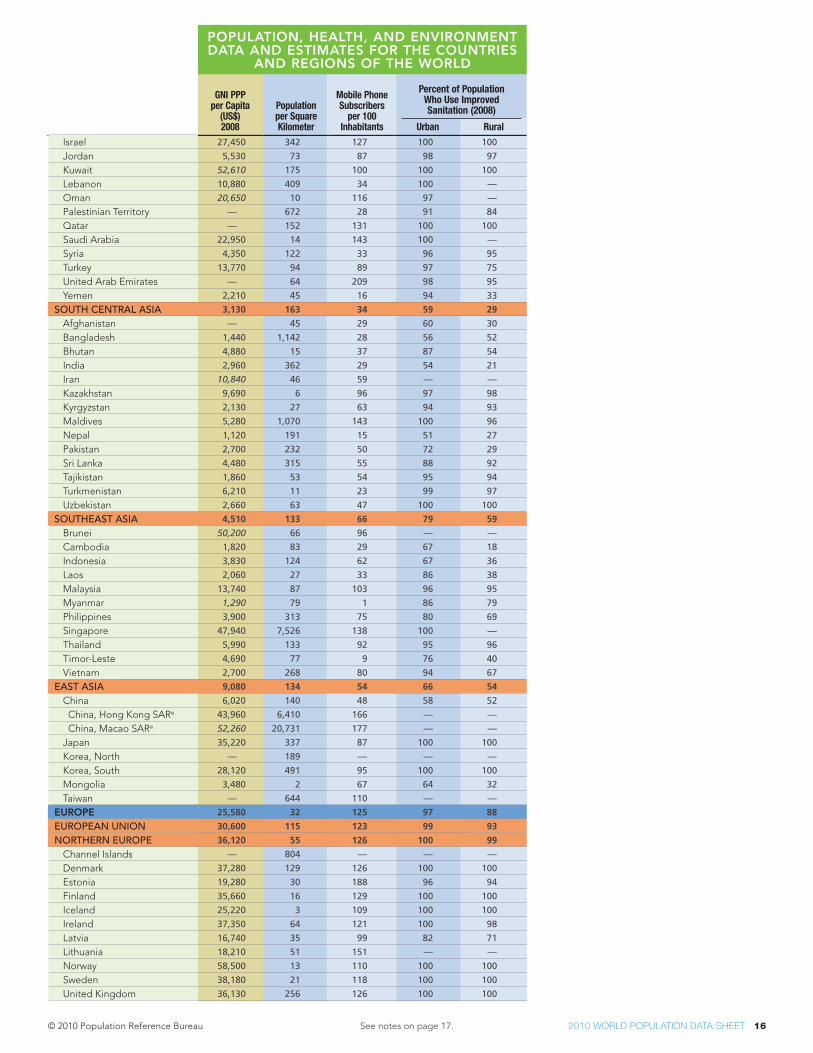
israel 27,450 342 127 100 100
Jordan 5,530 73 87 98 97
Kuwait 52,610 175 100 100 100
lebanon 10,880 409 34 100 —
oman 20,650 10 116 97 —
Palestinian territory — 672 28 91 84
Qatar — 152 131 100 100
saudi arabia 22,950 14 143 100 —
syria 4,350 122 33 96 95
turkey 13,770 94 89 97 75
united arab emirates — 64 209 98 95
Yemen 2,210 45 16 94 33
SoUth centraL aSIa 3,130 163 34 59 29
afghanistan — 45 29 60 30
Bangladesh 1,440 1,142 28 56 52
Bhutan 4,880 15 37 87 54
india 2,960 362 29 54 21
iran 10,840 46 59 — —
Kazakhstan 9,690 6 96 97 98
Kyrgyzstan 2,130 27 63 94 93
Maldives 5,280 1,070 143 100 96
nepal 1,120 191 15 51 27
Pakistan 2,700 232 50 72 29
sri lanka 4,480 315 55 88 92
tajikistan 1,860 53 54 95 94
turkmenistan 6,210 11 23 99 97
uzbekistan 2,660 63 47 100 100
SoUtheaSt aSIa 4,510 133 66 79 59
Brunei 50,200 66 96 — —
Cambodia 1,820 83 29 67 18
indonesia 3,830 124 62 67 36
laos 2,060 27 33 86 38
Malaysia 13,740 87 103 96 95
Myanmar 1,290 79 1 86 79
Philippines 3,900 313 75 80 69
singapore 47,940 7,526 138 100 —
thailand 5,990 133 92 95 96
timor-leste 4,690 77 9 76 40
Vietnam 2,700 268 80 94 67
eaSt aSIa 9,080 134 54 66 54
China 6,020 140 48 58 52
China, hong Kong sare 43,960 6,410 166 — —
China, Macao sare 52,260 20,731 177 — —
Japan 35,220 337 87 100 100
Korea, north — 189 — — —
Korea, south 28,120 491 95 100 100
Mongolia 3,480 2 67 64 32
taiwan — 644 110 — —
EUROPE 25,580 32 125 97 88
eUropean UnIon 30,600 115 123 99 93
northern eUrope 36,120 55 126 100 99
Channel islands — 804 — — —
denmark 37,280 129 126 100 100
estonia 19,280 30 188 96 94
Finland 35,660 16 129 100 100
iceland 25,220 3 109 100 100
ireland 37,350 64 121 100 98
latvia 16,740 35 99 82 71
lithuania 18,210 51 151 — —
norway 58,500 13 110 100 100
sweden 38,180 21 118 100 100
united Kingdom 36,130 256 126 100 100
Percent of Population Who Use Improved Sanitation (2008)

© 2010 Population reference Bureau 2010 WORLD POPULATION DATA SHEET 17
GNI PPP per Capita
(US$) 2008
Population per Square Kilometer
Mobile Phone Subscribers
per 100 Inhabitants Urban Rural
POPULATION, HEALTH, AND ENVIRONMENT DATA AND ESTIMATES FOR THE COUNTRIES
AND REGIONS OF THE WORLD
See notes on page 17.
weStern eUrope 36,440 170 115 100 100
austria 37,680 100 130 100 100
Belgium 34,760 354 112 100 100
France 34,400 114 93 100 100
germany 35,940 229 128 100 100
liechtenstein — 225 95 — —
luxembourg 64,320 196 147 100 100
Monaco — 35,835 67 100 —
netherlands 41,670 400 125 100 100
switzerland 46,460 190 118 100 100
eaStern eUrope 14,440 16 128 94 77
Belarus 12,150 46 84 91 97
Bulgaria 11,950 68 138 100 100
Czech republic 22,790 133 134 99 97
hungary 17,790 108 122 100 100
Moldova 3,210 122 67 85 74
Poland 17,310 122 115 96 80
romania 13,500 90 115 88 54
russia 15,630 8 141 93 70
slovakia 21,300 111 102 100 99
ukraine 7,210 76 121 97 90
SoUthern eUrope 26,740 118 129 99 97
albania 7,950 112 100 98 98
andorra — 179 76 100 100
Bosnia-herzegovina 8,620 75 84 99 92
Croatia 18,420 78 133 99 98
greece 28,470 86 124 99 97
italy 30,250 201 152 — —
Kosovof — 207 — — —
Macedoniag 9,950 80 123 92 82
Malta 22,460 1,326 95 100 100
Montenegro 13,920 46 118 96 86
Portugal 22,080 116 140 100 100
san Marino — 522 77 — —
serbia 11,150 94 98 96 88
slovenia 26,910 101 102 100 100
spain 31,130 93 112 100 100
OCEANIA 24,380 4 83 98 66
australia 34,040 3 105 100 100
Federated states of Micronesia 3,000 158 31 — —
Fiji 4,270 47 71 — —
French Polynesia — 68 70 99 97
guam — 344 59 99 98
Kiribati 3,660 139 1 — —
Marshall islands — 298 2 83 53
nauru — 507 — 50 —
new Caledonia — 14 80 — —
new Zealand 25,090 16 109 — —
Palau — 45 60 96 —
Papua new guinea 2,000 15 9 71 41
samoa 4,340 68 69 100 100
solomon islands 2,580 19 6 98 —
tonga 3,880 139 49 98 96
tuvalu — 376 20 88 81
Vanuatu 3,940 20 15 66 48
NOTES(—) Indicates data unavailable or inapplicable.a Infant deaths per 1,000 live births. Rates
shown with decimals indicate national sta-tistics reported as completely registered, while those without are estimates from the sources cited on reverse. Rates shown in italics are based upon fewer than 50 annual infant deaths and, as a result, are subject to considerable yearly variability.
b Average number of children born to a woman during her lifetime.
c The number of people of “working age” (15-64), divided by those ages 65+.
d The status of Western Sahara is disputed by Morocco.
e Special Administrative Region.f Kosovo declared independence from
Serbia on Feb. 17, 2008. Serbia has not recognized Kosovo’s independence.
g The former Yugoslav Republic.h Includes Kosovo.* Data prior to 2004 are shown in italics.
For additional notes and sources, see reverse side.
Data prepared by PRB demographer Carl Haub.© July 2010. Population Reference Bureau. All rights reserved.
Percent of Population Who Use Improved Sanitation (2008)

© 2010 Population reference Bureau 2010 WORLD POPULATION DATA SHEET 18
ACkNOWLEDGMENTSThe author gratefully acknowledges the valuable assistance of PRB staff members Donna Clifton, Jennay Ghowrwal, Toshiko Kaneda, Mary Mederios Kent, Kata Fustos, and Will Thompson; staff of the Interna-tional Programs Center of the U.S. Census Bureau; the United Nations (UN) Population Division; the Institut national d’etudes démographiques (INED), Paris; and the World Bank in the preparation of this year’s World Population Data Sheet. This publication is funded by the William and Flora Hewlett Foundation, the David and Lucile Packard Foundation, the U.S. Agency for International Development (Cooperative Agreement GPO-A-00-03-00004-00), and supporters. The information in this Data Sheet was not provided by and does not represent the views of the United States government or the U.S. Agency for International Development.
NOTESThe Data Sheet lists all geopolitical entities with populations of 150,000 or more and all members of the UN. These include sovereign states, dependencies, overseas departments, and some territories whose status or boundaries may be undetermined or in dispute. More developed regions, following the UN classification, comprise all of Europe and North America, plus Australia, Japan, and New Zealand. All other regions and countries are classified as less developed. The least developed countries consist of 49 countries with especially low incomes, high economic vulnerability, and poor human development indicators. The criteria and list of countries, as defined by the United Nations, can be found at www.unohrlls.org/en/ldc/.
Sub-Saharan Africa: All countries of Africa except the northern African countries of Algeria, Egypt, Libya, Morocco, Tunisia, and Western Sahara.
World and Regional Totals: Regional population totals are independently rounded and include small countries or areas not shown. Regional and world rates and per-centages are weighted averages of countries for which data are available; regional aver-ages are shown when data or estimates are available for at least three-quarters of the region’s population.
World Population Data Sheets from different years should not be used as a time series. Fluctuations in values from year to year often reflect revisions based on new data or estimates rather than actual changes in levels. Additional information on likely trends and consistent time series can be obtained from PRB, and are also available in UN and U.S. Census Bureau publications and websites.
SOURCESThe rates and figures are primarily compiled from the following sources: official country statistical yearbooks, bulletins, and websites; United Nations Demographic Yearbook, 2007 of the UN Statistics Division; World Population Prospects: The 2008 Revision of the UN Population Division; and the International Data Base of the International Programs Center, U.S. Census Bureau. Other sources include recent demographic surveys such as the Demographic and Health Surveys, Reproductive Health Surveys, special studies, and direct communication with demographers and statistical bureaus in the United States and abroad. Specific data sources may be obtained by contacting the author of the 2010 World Population Data Sheet. For countries with complete registration of births and deaths, rates are those most recently reported. For more developed countries, nearly all vital rates refer to 2009 or 2008.
DEFINITIONSMid-2010 PopulationEstimates are based on a recent census; official national data; or PRB, UN, and U.S. Census Bureau projections. The effects of refugee movements, large numbers of foreign workers, and population shifts due to contemporary political events are taken into account to the extent possible.
Birth and Death RateThe annual number of births and deaths per 1,000 total population. These rates are often referred to as “crude rates” since they do not take a population’s age structure into account. Thus, crude death rates in more developed countries, with a relatively large proportion of high-mortality older population, are often higher than those in less developed countries with lower life expectancy.
Rate of Natural Increase (RNI)The birth rate minus the death rate, implying the annual rate of population growth without regard for migration. Expressed as a percentage.
Net MigrationThe estimated rate of net immigration (immigration minus emigration) per 1,000 population for a recent year based upon the official national rate or derived as a residual from estimated birth, death, and population growth rates. Migration rates can vary substantially from year to year for any particular country, as can the definition of an immigrant.
2050 Population as a Multiple of 2010Projected populations based upon reason-able assumptions on the future course of fertility, mortality, and migration. Projections are based upon official country projections, series issued by the UN or the U.S. Census Bureau, or PRB projections.
Infant Mortality RateThe annual number of deaths of infants under age 1 per 1,000 live births. Rates shown with decimals indicate national statistics reported as completely registered, while those without are estimates from the sources cited above. Rates shown in italics are based upon fewer than 50 annual infant deaths and, as a result, are subject to considerable yearly variability.
Total Fertility Rate (TFR)The average number of children a woman would have assuming that current age-specific birth rates remain constant throughout her childbearing years (usually considered to be ages 15-49).
Population Under Age 15/Age 65+The percentage of the total population in these ages, which are often considered the “dependent ages.”
Elderly Support RatioThe number of working-age people ages 15-64 divided by the number of persons 65 or older, indicating levels of potential societal support available for the elderly.
Life Expectancy at BirthThe average number of years a newborn infant can expect to live under current mortality levels.
Percent UrbanPercentage of the total population living in areas termed “urban” by that country. Countries define urban in many different ways, from population centers of 100 or more dwellings to only the population living in national and provincial capitals.
Prevalence of HIV/AIDSThe estimated percentage of adults ages 15-49 living with HIV/AIDS. Most figures are from UNAIDS’ 2008 Report on the Global AIDS Epidemic. Figures are updated with data from Demographic and Health Surveys where available. Some regional averages were calculated by PRB.
Contraceptive UseThe percentage of currently married or “in-union” women of reproductive age who are using any form of contraception. “Modern” methods include clinic and supply methods such as the pill, IUD, condom, and sterilization. Data are from the most recently available national-level surveys, such as Demographic and Health Surveys, Repro-ductive Health Surveys, Multiple Indicator Cluster Surveys, regional survey programs, national surveys, and the UN Population Division World Contraceptive Use 2009. For more developed countries, data refer to some point in the 1990s and early 2000s; and for less developed countries, from 1995. Data prior to 2004 are shown in italics.
GNI PPP per Capita, 2008 (US$)GNI PPP per capita is gross national income in purchasing power parity (PPP) divided by midyear population. GNI PPP refers to gross national income converted to “international” dollars using a purchasing power parity con-version factor. International dollars indicate the amount of goods and services one could buy in the United States with a given amount of money. Data are from the World Bank. Figures in italics are for 2006 or 2007.
Mobile Phone Subscribers per 100 InhabitantsData are from the International Telecommu-nications Union, Measuring the Information Society 2010 (www.itu.int).
Percent of Population Who Use Improved SanitationFor monitoring Millennium Development Goals, an improved sanitation facility is defined as one that hygienically separates sewage from human contact. Data are from WHO/UNICEF Joint Monitoring Programme for Water Supply and Sanitation (www.wssinfo.org/datamining/tables.html).
Acknowledgments, Notes, Sources, and Definitions
For a full list of PRB publications avail-able in English, French, Spanish, Arabic, and Portuguese, go to PRB’s online store at www.prb.org.
To order PRB publications (discounts available for bulk orders):
• Online at www.prb.org.
• E-mail: [email protected].
• Call toll-free: 800-877-9881.
• Fax: 202-328-3937.
• Mail: 1875 Connecticut Ave., NW, Suite 520, Washington, DC 20009.
The 2010 World Population Data Sheet is also available in French and Spanish.
Data prepared by PRB demographer Carl Haub.
© July 2010. Population Reference Bureau. All rights reserved. ISSN 0085-8315
Photo credits from cover (clockwise, top left): © 2009 Arturo Sanabria, Courtesy of Photoshare; © Richard Lord; © 2008 Jacob Simkin, Courtesy of Photoshare; © 2009 Valentin Casarsa, iStockPhoto.
Photo credits from data side (left to right): © 2007 Anne Clark, iStockPhoto; © 2008 Bart Coenders, iStockPhoto; © 2009 Wendy Leonard, Courtesy of Photoshare; © 2007 Vikram Raghuvan-shi, iStockPhoto; © 2005 Nancy Louie, iStockPhoto; © Richard Lord.

© 2010 Population reference Bureau 2010 WORLD POPULATION DATA SHEET 19
the PoPulation referenCe Bureau informs people around the
world about population, health, and the environment, and empowers them to
use that information to advance the well-being of current and future generations.
1875 Connecticut Ave., NW, Washington, DC 20009 USAtel. 202-483-1100 | fax 202-328-3937 | e-mail: [email protected] | website: www.prb.org
if you value the PrB’s World Population Data Sheet and are among the tens of thousands of people who eagerly anticipate its publication each year, please consider making a contribution to PrB. Your donation will help ensure that PrB can maintain its commitment to keeping the Data Sheet as affordable as possible. Visit our website to donate now: www.prb.org.
inForMPRB informs people around the world about issues related to population, health, and the environment. to do this, we transform technical data and research into accurate, easy-to-understand information.
innovativE tools. Datafinder is a PRB searchable database of 133 population, health, and environment variables for all countries of the world. a separate u.S. database includes 579 social, economic, and demographic variables for each state and the District of columbia.
influEntial rEPorts. Female Genital Mutilation/Cutting: Data and Trends—Update 2010 is a new and unique data sheet that highlights fGM/c data and information for 27 countries. this publication is useful to those working for the abandonment of fGM/c and for the improvement of women’s repro-ductive health.
unbiasED PoliCy analysis. for more than 20 years, PRB has hosted a monthly seminar series focused on the policy implica-tions of population issues including neglected tropical diseases, climate change and mortality, and HiV/aiDS.
onlinE rEsourCEs. PRB’s website offers full text of all PRB publications, including our respected Population Bulletins, and web-exclusive data and analysis on world issues ranging from aging to family planning.
eMPoWerPRB empowers people—researchers, journal-ists, policymakers, and educators—to use information about population, health, and the environment to encourage action. frequently, people have information but lack the tools needed to communicate effectively to decision-makers. PRB builds coalitions and conducts trainings to share techniques to inform policy.
Journalist nEtWorks. PRB builds the capacity of journalists from developing countries through seminars and study tours. We organized several study tours for journalists in uganda, Kenya, tanzania, and Mali to visit projects and the people they affect.
PoliCy CommuniCations traininG. in the past decade, PRB has trained more than 800 professionals in asia, africa, and latin amer-ica. for example, we sponsored two workshops with Kenya’s national coordinating agency for Population and Development, training local and regional policymakers, program managers, and advocates.
Data WorkshoPs. PRB’s data workshops and online training assist the annie e. casey foundation’s KiDS count network in using vital data about the status of children in the united States. Participants take away the knowledge needed to access data about their particular state and communicate with policymakers.
adVanCePRB works to advance the well-being of current and future generations. toward that end, we analyze data and research, disseminate informa-tion, and empower people to use that informa-tion to inform policymaking. While the numbers of publications created or workshops conducted are one way to measure PRB’s work, the cre-ation of evidence-based policies, increased demand for health services, and active coalitions are better gauges of progress toward positive social change.
EviDEnCE-basED PoliCiEs. PRB pro-vides analysis for the KiDS count Data Book, an annual report card on the well-being of children and families in the united States. the Data Book has helped promote the passage of several u.S. policies, including the State children’s Health insurance Program.
DEmanD for hEalth sErviCEs. an article written after one study tour for journalists in Kenya led to a steep increase in vasectomies in western Kenya. Seminars for journalists in West africa increased coverage of contraceptive supply problems, prompting government action in Senegal.
aCtivE Coalitions. PRB works with the east africa Population, Health, and environment network to increase information sharing across the region. the afRicaPHe online discussion group improves access to information and capacity-building and funding opportunities.