Embed Size (px)
DESCRIPTION
Port Metro Vancouver's 2010 Sustainability Report
Citation preview
THE WAY FORWARD Our First Sustainability Report | 2010

President’s Message
02About This Report
03About Port Metro Vancouver
06Our Economic Performance
16Our Environmental Performance
22Connecting with Our Communities
32IndependentAssurance
40GRI Index
44
Our Mission To lead the efficient and reliable movement of cargo and passengers in a manner that supports Canadian growth and prosperity, now and in the future.
Our Vision Port Metro Vancouver will be valued by customers, embraced as a member of the community and recognized globally as a leader in port sustainability.
Our Values Collaboration and Teamwork: We work together to achieve our greatest potential. We communicate openly and treat each other with trust and respect.
Customer Responsiveness: We strive to understand our customers’ needs and to proactively provide them with distinctive value.
Innovation: We seek new ideas and creative solutions.
Leadership and Accountability: We lead by example, act with integrity and are accountable for our actions.
Our People: We are committed to continuous learning, diversity and balance.
Sustainability: We think long term, considering social, environmental and financial matters.
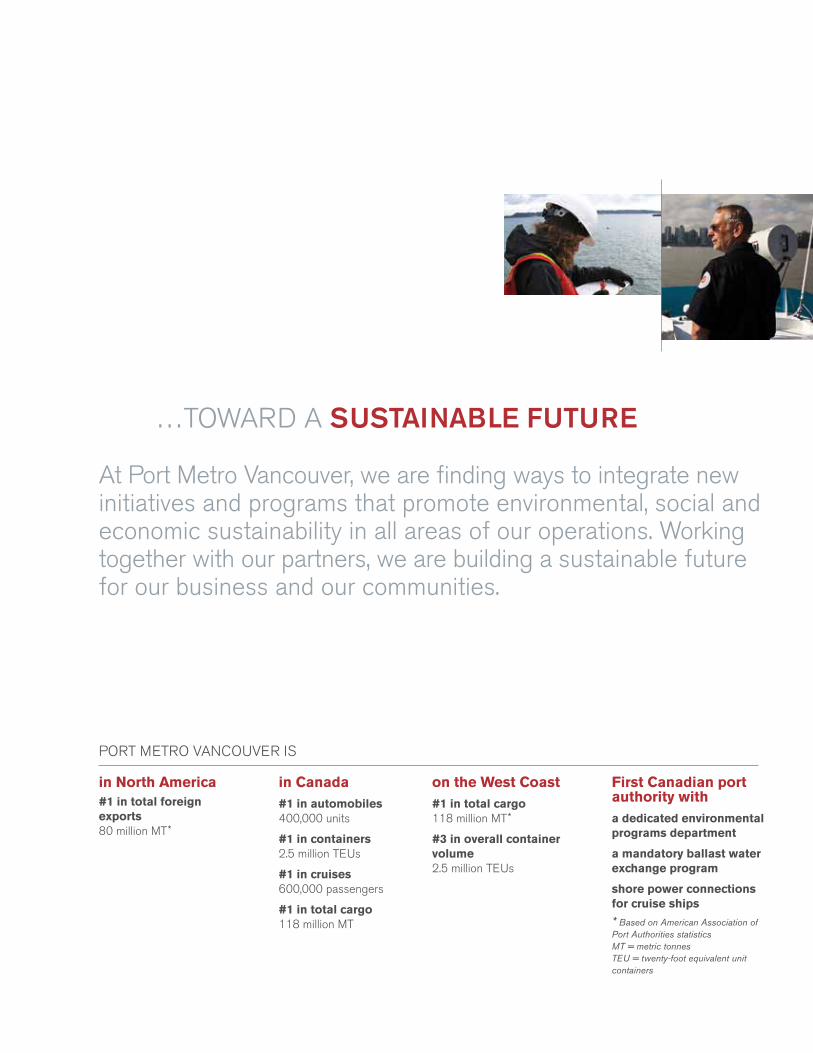
…TOWARD A SUSTAINABLE FUTURE
GRI Index
At Port Metro Vancouver, we are finding ways to integrate new initiatives and programs that promote environmental, social and economic sustainability in all areas of our operations. Working together with our partners, we are building a sustainable future for our business and our communities.
in North America #1 in total foreign exports 80 million MT *
in Canada#1 in automobiles 400,000 units
#1 in containers 2.5 million TEUs
#1 in cruises 600,000 passengers
#1 in total cargo 118 million MT
PORT METRO VANCOUVER IS
on the West Coast#1 in total cargo 118 million MT *
#3 in overall container volume 2.5 million TEUs
First Canadian port authority witha dedicated environmental programs department
a mandatory ballast water exchange program
shore power connections for cruise ships
* Based on American Association of Port Authorities statistics MT = metric tonnes TEU = twenty-foot equivalent unit containers
PRESIDENT’S MESSAGE
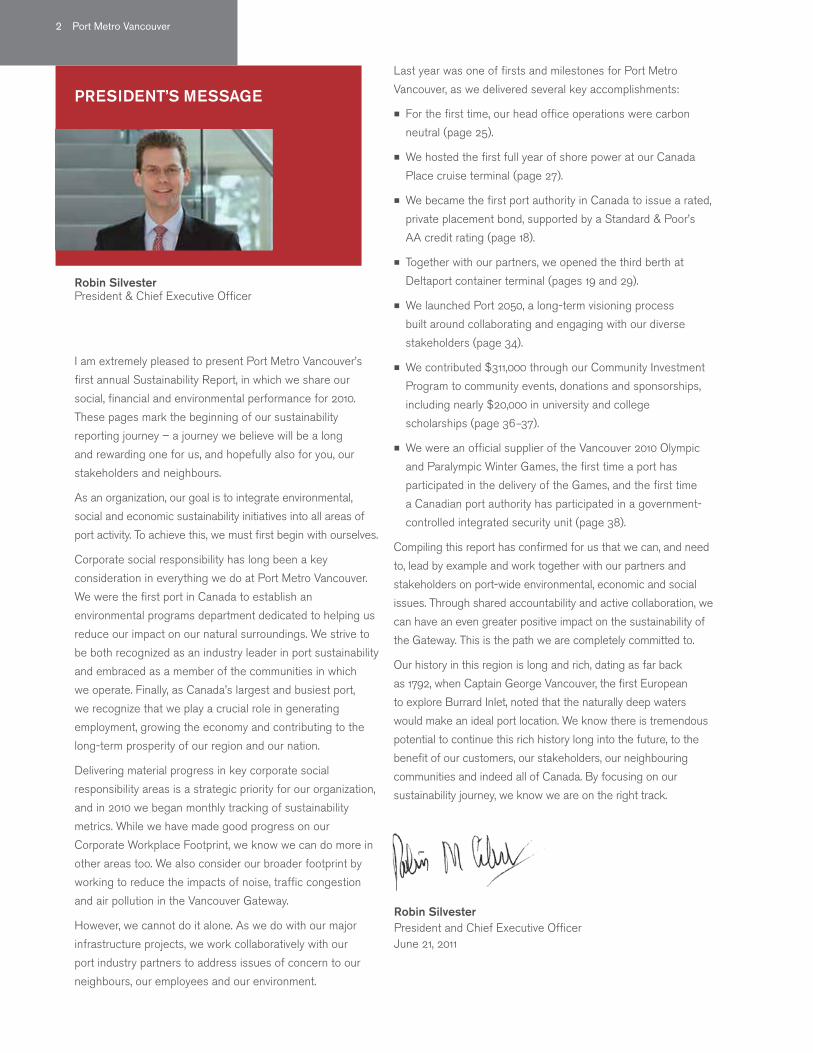
I am extremely pleased to present Port Metro Vancouver’s
first annual Sustainability Report, in which we share our
social, financial and environmental performance for 2010.
These pages mark the beginning of our sustainability
reporting journey – a journey we believe will be a long
and rewarding one for us, and hopefully also for you, our
stakeholders and neighbours.
As an organization, our goal is to integrate environmental,
social and economic sustainability initiatives into all areas of
port activity. To achieve this, we must first begin with ourselves.
Corporate social responsibility has long been a key
consideration in everything we do at Port Metro Vancouver.
We were the first port in Canada to establish an
environmental programs department dedicated to helping us
reduce our impact on our natural surroundings. We strive to
be both recognized as an industry leader in port sustainability
and embraced as a member of the communities in which
we operate. Finally, as Canada’s largest and busiest port,
we recognize that we play a crucial role in generating
employment, growing the economy and contributing to the
long-term prosperity of our region and our nation.
Delivering material progress in key corporate social
responsibility areas is a strategic priority for our organization,
and in 2010 we began monthly tracking of sustainability
metrics. While we have made good progress on our
Corporate Workplace Footprint, we know we can do more in
other areas too. We also consider our broader footprint by
working to reduce the impacts of noise, traffic congestion
and air pollution in the Vancouver Gateway.
However, we cannot do it alone. As we do with our major
infrastructure projects, we work collaboratively with our
port industry partners to address issues of concern to our
neighbours, our employees and our environment.
Last year was one of firsts and milestones for Port Metro
Vancouver, as we delivered several key accomplishments:
≠ For the first time, our head office operations were carbon
neutral (page 25).
≠ We hosted the first full year of shore power at our Canada
Place cruise terminal (page 27).
≠ We became the first port authority in Canada to issue a rated,
private placement bond, supported by a Standard & Poor’s
AA credit rating (page 18).
≠ Together with our partners, we opened the third berth at
Deltaport container terminal (pages 19 and 29).
≠ We launched Port 2050, a long-term visioning process
built around collaborating and engaging with our diverse
stakeholders (page 34).
≠ We contributed $311,000 through our Community Investment
Program to community events, donations and sponsorships,
including nearly $20,000 in university and college
scholarships (page 36 – 37).
≠ We were an official supplier of the Vancouver 2010 Olympic
and Paralympic Winter Games, the first time a port has
participated in the delivery of the Games, and the first time
a Canadian port authority has participated in a government-
controlled integrated security unit (page 38).
Compiling this report has confirmed for us that we can, and need
to, lead by example and work together with our partners and
stakeholders on port-wide environmental, economic and social
issues. Through shared accountability and active collaboration, we
can have an even greater positive impact on the sustainability of
the Gateway. This is the path we are completely committed to.
Our history in this region is long and rich, dating as far back
as 1792, when Captain George Vancouver, the first European
to explore Burrard Inlet, noted that the naturally deep waters
would make an ideal port location. We know there is tremendous
potential to continue this rich history long into the future, to the
benefit of our customers, our stakeholders, our neighbouring
communities and indeed all of Canada. By focusing on our
sustainability journey, we know we are on the right track.
Robin Silvester President & Chief Executive Officer
Robin Silvester President and Chief Executive Officer June 21, 2011
2 Port Metro Vancouver
Within this report, we have focused our attention on the sustainability aspects over which we have direct control and influence, while also providing a narrative for select port-wide initiatives carried out across the Vancouver Gateway. This approach recognizes that, while it is important for our organization to tackle sustainability aspects over which we have direct control, the greatest opportunities to bring about change exist port-wide and in the extended supply chain.
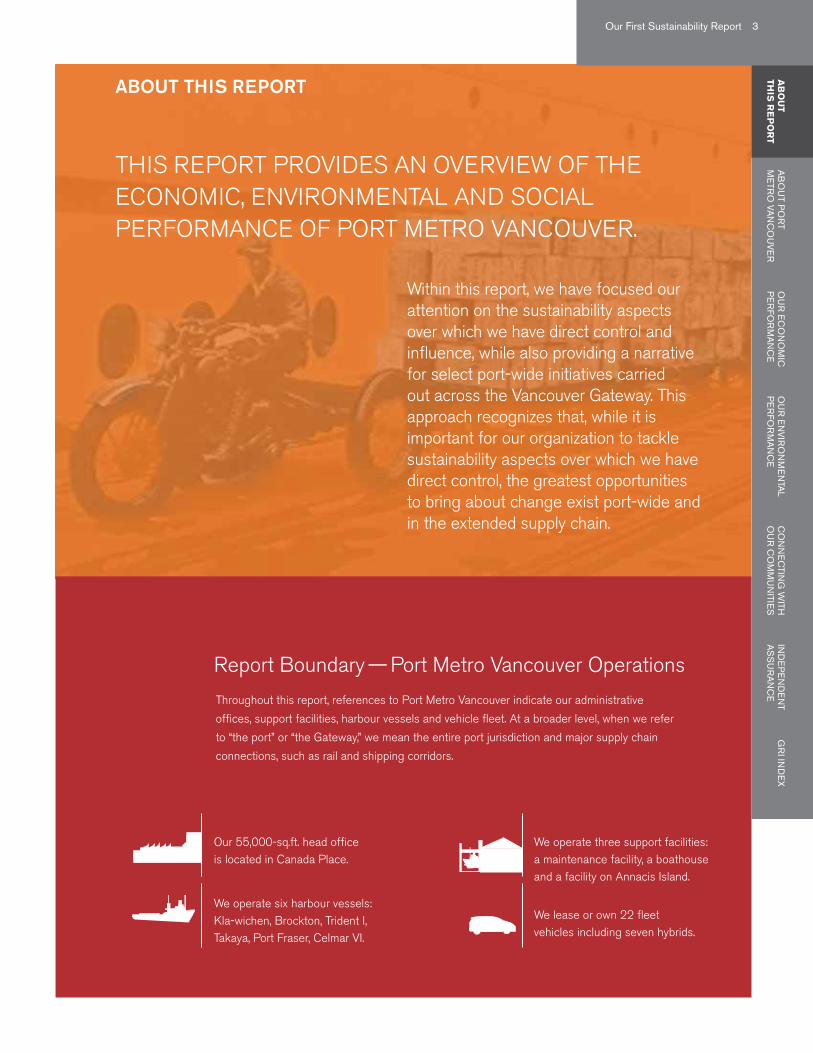
ABOUT THIS REPORT
Report Boundary — Port Metro Vancouver Operations
Throughout this report, references to Port Metro Vancouver indicate our administrative
offices, support facilities, harbour vessels and vehicle fleet. At a broader level, when we refer
to “the port” or “the Gateway,” we mean the entire port jurisdiction and major supply chain
connections, such as rail and shipping corridors.
Our 55,000-sq.ft. head office is located in Canada Place.
We operate three support facilities: a maintenance facility, a boathouse and a facility on Annacis Island.
We operate six harbour vessels: Kla-wichen, Brockton, Trident I, Takaya, Port Fraser, Celmar VI.
We lease or own 22 fleet vehicles including seven hybrids.
THIS REPORT PROVIDES AN OVERVIEW OF THE ECONOMIC, ENVIRONMENTAL AND SOCIAL PERFORMANCE OF PORT METRO VANCOUVER.
Our First Sustainability Report 3G
RI In
de
xIN
DE
PE
ND
EN
TA
SS
UR
AN
CE
AB
OU
T TH
IS R
EP
OR
TA
BO
UT P
OR
T m
eTR
O VA
NC
OU
Ve
RO
UR
EC
ON
OM
IC
PE
RFO
RM
AN
CE
OU
R E
NV
IRO
NM
EN
TAL
PE
RFO
RM
AN
CE
CO
NN
EC
TING
WITH
O
UR
CO
MM
UN
ITIES
Global Reporting Initiative
This report has been prepared in accordance with the
Global Reporting Initiative’s (GRI) G3 Sustainability
Reporting Guidelines, which provide a globally recognized
framework for reporting on economic, social and
environmental performance (globalreporting.org).
Sustainability reports based on the GRI Framework can
be used to demonstrate organizational commitment to
sustainable development, to compare organizational
performance over time, and to measure organizational
performance with respect to laws, norms, standards and
voluntary initiatives.
For our first report, we have achieved a GRI B+ Application
Level. The requirements for a B+ Report are outlined in the
diagram on page 5.
Independent Assurance
We believe external review is an essential component to
ensuring a transparent and accountable representation
of our sustainability performance. As such, Ernst & Young
LLP has provided third-party assurance of the performance
indicators contained within this report. In addition, Ernst
& Young has checked our report and confirmed it to be
consistent with a GRI B+ Application Level. You can read
Ernst & Young’s Assurance Report on pages 40 – 43.
Why Report?
For our diverse stakeholders — including employees,
customers, government and First Nations partners, and
communities — we hope this report offers a reasonable
assessment of our sustainability performance and serves as
a basis for continued dialogue, collaboration and feedback.
Producing this report has enabled us to review our
sustainability performance from a new perspective. This
process has given us a better understanding of our
achievements and shortcomings, as well as the future
challenges we face as an organization. Our goal is to address
these challenges and document our progress in subsequent
reports in a transparent and accountable manner.
Published in June 2011, this is our first annual Sustainability Report. It covers the period from January 1, 2010 to December 31, 2010, to coincide with our fiscal year.
4 Port Metro Vancouver
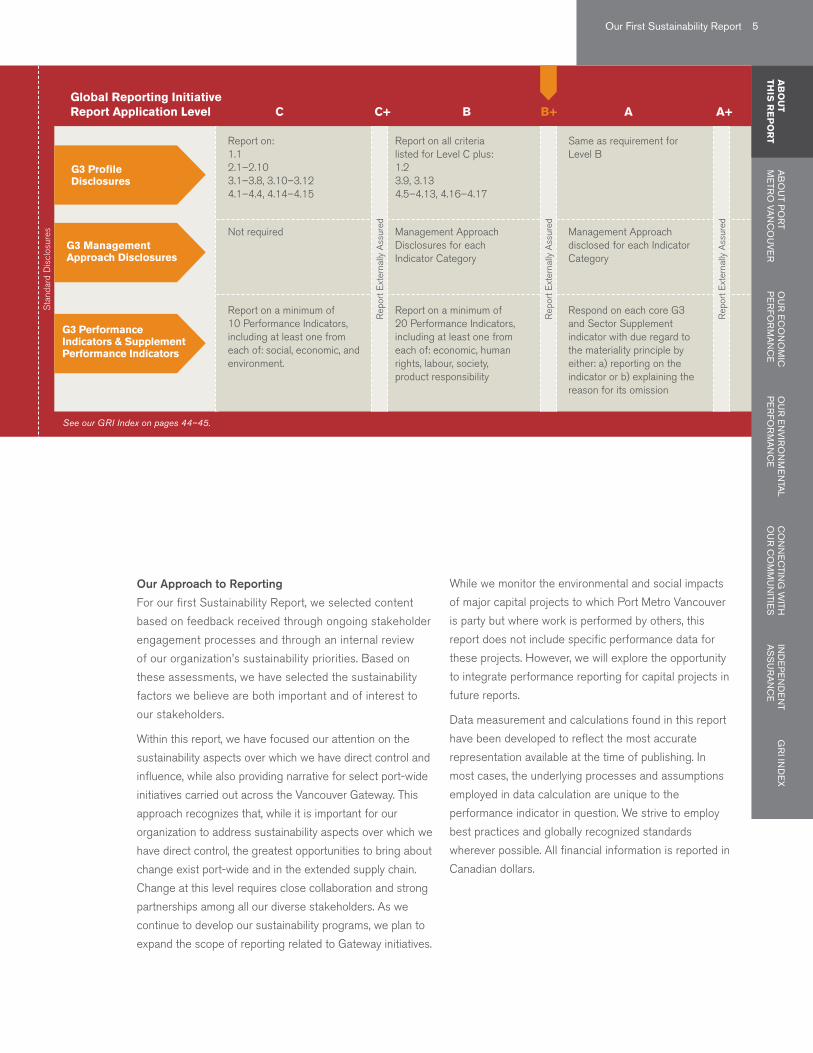
Global Reporting InitiativeReport Application Level C B AC+ B+ A+
G3 ProfileDisclosures
G3 Management Approach Disclosures
G3 Performance Indicators & Supplement Performance Indicators
Sta
ndar
d D
iscl
osur
es
Rep
ort E
xter
nally
Ass
ured
Rep
ort E
xter
nally
Ass
ured
Rep
ort E
xter
nally
Ass
ured
Report on:1.12.1–2.103.1–3.8, 3.10–3.124.1–4.4, 4.14–4.15
Report on all criteria listed for Level C plus:1.23.9, 3.134.5–4.13, 4.16–4.17
Same as requirement for Level B
Not required Management Approach Disclosures for each Indicator Category
Management Approach disclosed for each Indicator Category
Report on a minimum of 10 Performance Indicators, including at least one from each of: social, economic, and environment.
Report on a minimum of 20 Performance Indicators, including at least one from each of: economic, human rights, labour, society, product responsibility
Respond on each core G3 and Sector Supplement indicator with due regard to the materiality principle by either: a) reporting on the indicator or b) explaining the reason for its omission
Our Approach to Reporting
For our first Sustainability Report, we selected content
based on feedback received through ongoing stakeholder
engagement processes and through an internal review
of our organization’s sustainability priorities. Based on
these assessments, we have selected the sustainability
factors we believe are both important and of interest to
our stakeholders.
Within this report, we have focused our attention on the
sustainability aspects over which we have direct control and
influence, while also providing narrative for select port-wide
initiatives carried out across the Vancouver Gateway. This
approach recognizes that, while it is important for our
organization to address sustainability aspects over which we
have direct control, the greatest opportunities to bring about
change exist port-wide and in the extended supply chain.
Change at this level requires close collaboration and strong
partnerships among all our diverse stakeholders. As we
continue to develop our sustainability programs, we plan to
expand the scope of reporting related to Gateway initiatives.
While we monitor the environmental and social impacts
of major capital projects to which Port Metro Vancouver
is party but where work is performed by others, this
report does not include specific performance data for
these projects. However, we will explore the opportunity
to integrate performance reporting for capital projects in
future reports.
Data measurement and calculations found in this report
have been developed to reflect the most accurate
representation available at the time of publishing. In
most cases, the underlying processes and assumptions
employed in data calculation are unique to the
performance indicator in question. We strive to employ
best practices and globally recognized standards
wherever possible. All financial information is reported in
Canadian dollars.
See our GRI Index on pages 44–45.
GR
I Ind
ex
IND
EP
EN
DE
NT
AS
SU
RA
NC
EA
BO
UT
THIS
RE
PO
RT
AB
OU
T PO
RT
me
TRO
VAN
CO
UV
eR
OU
R E
CO
NO
MIC
P
ER
FOR
MA
NC
EO
UR
EN
VIR
ON
ME
NTA
L P
ER
FOR
MA
NC
EC
ON
NE
CTIN
G W
ITH
OU
R C
OM
MU
NITIE
S
Our First Sustainability Report 5
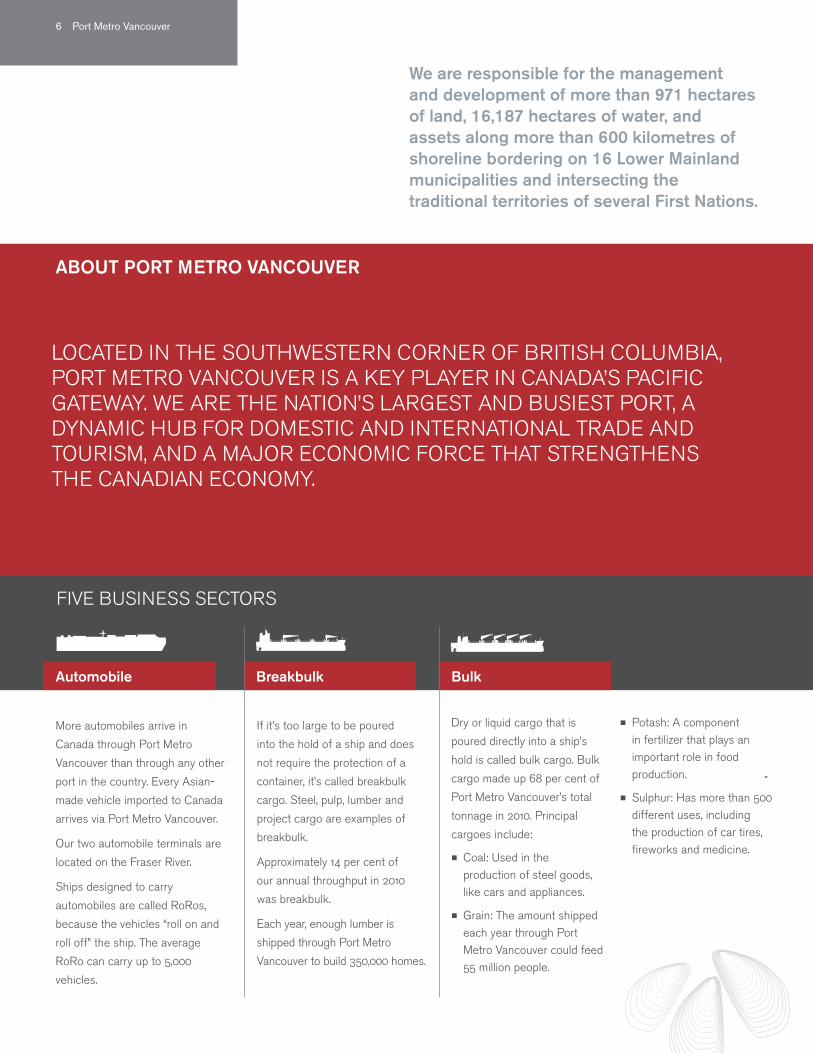
ABOUT PORT METRO VANCOUVER
FIVE BUSINESS SECTORS
LOCATED IN THE SOUTHWESTERN CORNER OF BRITISH COLUMBIA, PORT METRO VANCOUVER IS A KEY PLAYER IN CANADA’S PACIFIC GATEWAY. WE ARE THE NATION’S LARGEST AND BUSIEST PORT, A DYNAMIC HUB FOR DOMESTIC AND INTERNATIONAL TRADE AND TOURISM, AND A MAjOR ECONOMIC FORCE THAT STRENGTHENS THE CANADIAN ECONOMY.
More automobiles arrive in
Canada through Port Metro
Vancouver than through any other
port in the country. Every Asian-
made vehicle imported to Canada
arrives via Port Metro Vancouver.
Our two automobile terminals are
located on the Fraser River.
Ships designed to carry
automobiles are called RoRos,
because the vehicles “roll on and
roll off” the ship. The average
RoRo can carry up to 5,000
vehicles.
If it’s too large to be poured
into the hold of a ship and does
not require the protection of a
container, it’s called breakbulk
cargo. Steel, pulp, lumber and
project cargo are examples of
breakbulk.
Approximately 14 per cent of
our annual throughput in 2010
was breakbulk.
Each year, enough lumber is
shipped through Port Metro
Vancouver to build 350,000 homes.
Dry or liquid cargo that is
poured directly into a ship’s
hold is called bulk cargo. Bulk
cargo made up 68 per cent of
Port Metro Vancouver’s total
tonnage in 2010. Principal
cargoes include:
≠ Coal: Used in the production of steel goods, like cars and appliances.
≠ Grain: The amount shipped each year through Port Metro Vancouver could feed 55 million people.
≠ Potash: A component in fertilizer that plays an important role in food production.
≠ Sulphur: Has more than 500 different uses, including the production of car tires, fireworks and medicine.
We are responsible for the management and development of more than 971 hectares of land, 16,187 hectares of water, and assets along more than 600 kilometres of shoreline bordering on 16 Lower Mainland municipalities and intersecting the traditional territories of several First Nations.
Automobile Breakbulk Bulk
6 Port Metro Vancouver
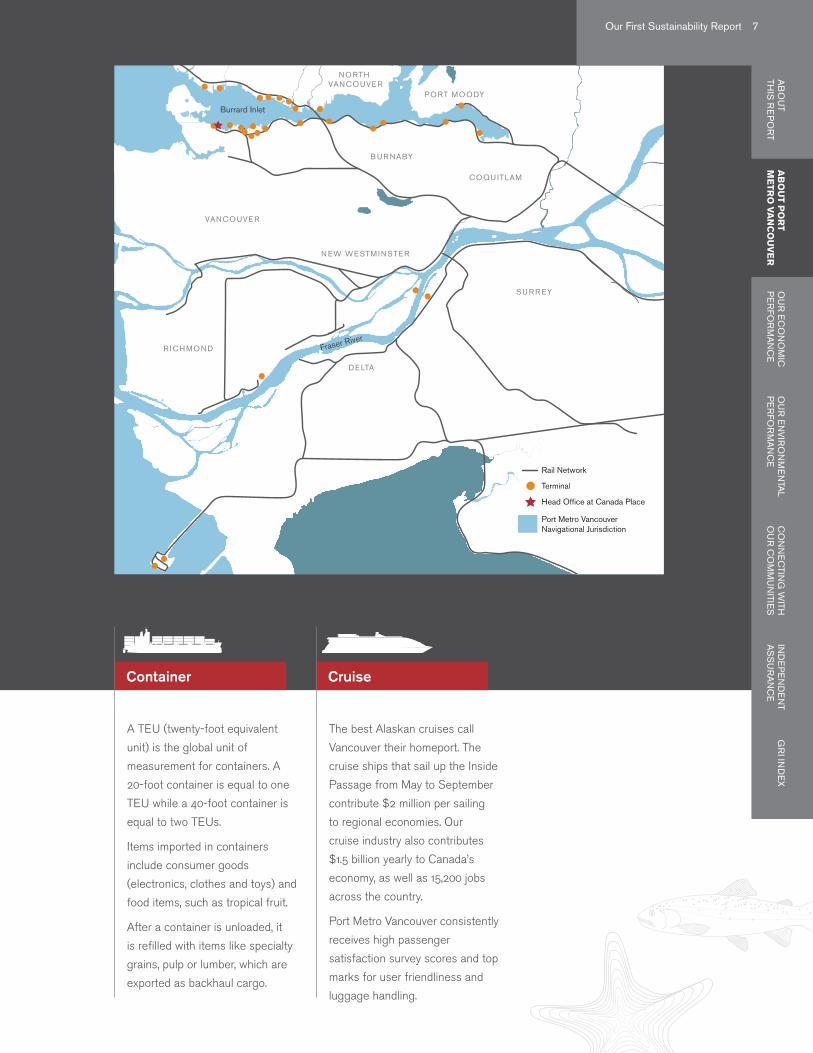
Burrard Inlet
Fraser River
NORTH VANCOUVE R
PORT MOODY
B U R NABY
VANCOUVE R
R ICH MON D
DE LTA
SU R R EY
N EW WESTM I NSTE R
COQU ITLAM
Rail Network
Terminal
Head Office at Canada Place
Port Metro VancouverNavigational Jurisdiction
A TEU (twenty-foot equivalent
unit) is the global unit of
measurement for containers. A
20-foot container is equal to one
TEU while a 40-foot container is
equal to two TEUs.
Items imported in containers
include consumer goods
(electronics, clothes and toys) and
food items, such as tropical fruit.
After a container is unloaded, it
is refilled with items like specialty
grains, pulp or lumber, which are
exported as backhaul cargo.
The best Alaskan cruises call
Vancouver their homeport. The
cruise ships that sail up the Inside
Passage from May to September
contribute $2 million per sailing
to regional economies. Our
cruise industry also contributes
$1.5 billion yearly to Canada’s
economy, as well as 15,200 jobs
across the country.
Port Metro Vancouver consistently
receives high passenger
satisfaction survey scores and top
marks for user friendliness and
luggage handling.
Container Cruise
Our First Sustainability Report 7G
RI In
de
xIN
DE
PE
ND
EN
TA
SS
UR
AN
CE
AB
OU
T TH
IS R
EP
OR
TO
UR
EC
ON
OM
IC
PE
RFO
RM
AN
CE
OU
R E
NV
IRO
NM
EN
TAL
PE
RFO
RM
AN
CE
CO
NN
EC
TING
WITH
O
UR
CO
MM
UN
ITIES
AB
OU
T PO
RT
ME
TRO
VA
NC
OU
VE
R
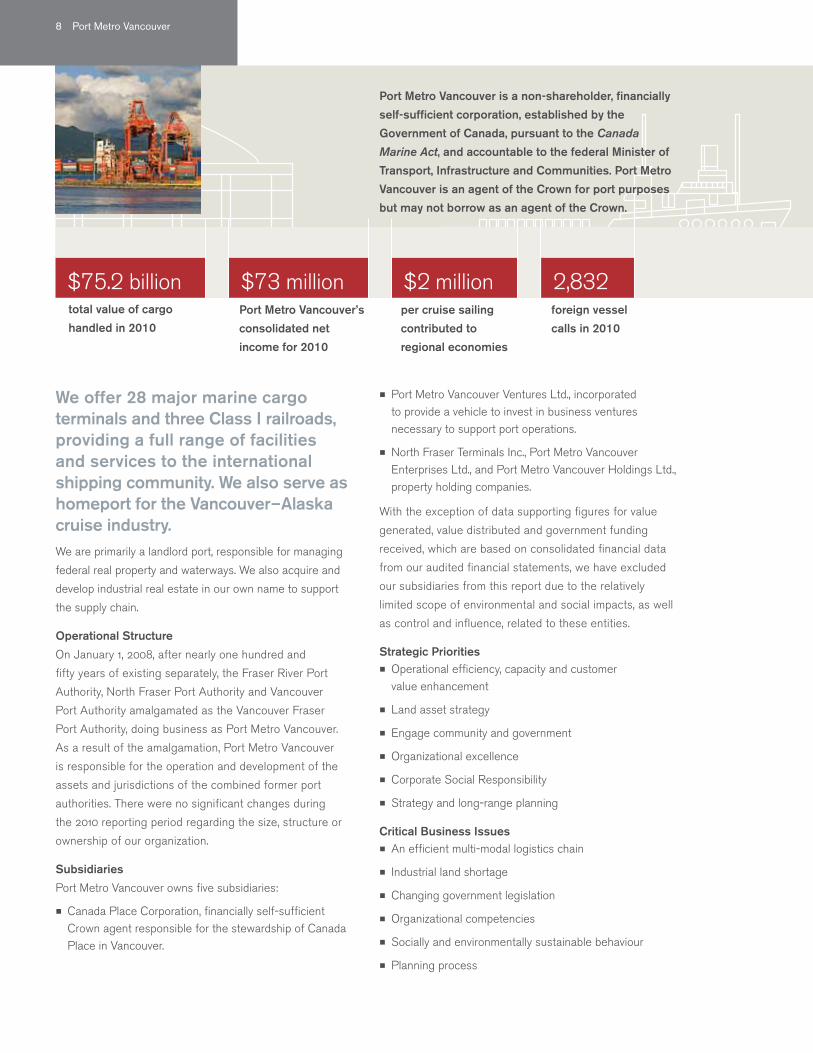
$75.2 billion $73 million $2 million 2,832
Port Metro Vancouver is a non-shareholder, financially
self-sufficient corporation, established by the
Government of Canada, pursuant to the Canada
Marine Act, and accountable to the federal Minister of
Transport, Infrastructure and Communities. Port Metro
Vancouver is an agent of the Crown for port purposes
but may not borrow as an agent of the Crown.
≠ Port Metro Vancouver Ventures Ltd., incorporated to provide a vehicle to invest in business ventures necessary to support port operations.
≠ North Fraser Terminals Inc., Port Metro Vancouver Enterprises Ltd., and Port Metro Vancouver Holdings Ltd., property holding companies.
With the exception of data supporting figures for value
generated, value distributed and government funding
received, which are based on consolidated financial data
from our audited financial statements, we have excluded
our subsidiaries from this report due to the relatively
limited scope of environmental and social impacts, as well
as control and influence, related to these entities.
Strategic Priorities ≠ Operational efficiency, capacity and customer value enhancement
≠ Land asset strategy
≠ Engage community and government
≠ Organizational excellence
≠ Corporate Social Responsibility
≠ Strategy and long-range planning
Critical Business Issues ≠ An efficient multi-modal logistics chain
≠ Industrial land shortage
≠ Changing government legislation
≠ Organizational competencies
≠ Socially and environmentally sustainable behaviour
≠ Planning process
We offer 28 major marine cargo terminals and three Class I railroads, providing a full range of facilities and services to the international shipping community. We also serve as homeport for the Vancouver – Alaska cruise industry.We are primarily a landlord port, responsible for managing
federal real property and waterways. We also acquire and
develop industrial real estate in our own name to support
the supply chain.
Operational Structure
On January 1, 2008, after nearly one hundred and
fifty years of existing separately, the Fraser River Port
Authority, North Fraser Port Authority and Vancouver
Port Authority amalgamated as the Vancouver Fraser
Port Authority, doing business as Port Metro Vancouver.
As a result of the amalgamation, Port Metro Vancouver
is responsible for the operation and development of the
assets and jurisdictions of the combined former port
authorities. There were no significant changes during
the 2010 reporting period regarding the size, structure or
ownership of our organization.
Subsidiaries
Port Metro Vancouver owns five subsidiaries:
≠ Canada Place Corporation, financially self-sufficient Crown agent responsible for the stewardship of Canada Place in Vancouver.
total value of cargo
handled in 2010Port Metro Vancouver’s
consolidated net
income for 2010
per cruise sailing
contributed to
regional economies
foreign vessel
calls in 2010
8 Port Metro Vancouver
OVERALL:1. China2. Japan 3. South Korea
IMPORTS:1. China2. US3. South Korea
EXPORTS:1. China2. Japan3. South Korea
2010 Awards and Nominations
≠ GLOBE: EcoFREIGHT Sustainable
Transportation Award
≠ Association of Professional Engineers
and Geoscientists of BC: 2010
Environmental Award of Excellence
≠ Shortlisted for 2010 Sustainable
Shipping Awards — Clean Air Category
Major Trading Economies
Our Approach to Sustainability
Commitment to Sustainability Performance
At Port Metro Vancouver, sustainability is embedded in
our mission, vision and corporate values. We recognize the
importance of maintaining a balanced approach to port
development to ensure that economic, environmental and
social needs are met without compromising the ability of
future generations to meet their needs. We are committed
to the ongoing accomplishment of our mission through
integrating environmental, social and economic sustainability
into all areas of our operations.
This commitment is part of our promise of marine
industry leadership, as we work to support port industry,
communities and the environment for our mutual prosperity.
By strengthening our partnerships and encouraging
innovation, we are constantly seeking to improve our
performance — and, by extension, the Vancouver Gateway’s
performance — in a sustainable way.
Corporate Social Responsibility
We integrate social, economic and environmental matters
into our values, culture, decision making, strategy,
development and operations in a transparent and
accountable manner. We ensure that corporate social
responsibility (CSR) considerations are incorporated into our
processes and activities to establish better practices within
the organization, create economic value, and improve society.
Our governance structure supports this approach with a
cross-functional CSR Team that advances related initiatives.
This team reports, through the Chief Executive Officer, to the
Community and Corporate Social Responsibility Committee
of the Board of Directors.
Our Balanced Scorecard and Workplace Footprint
The first year we employed a Balanced Scorecard
approach to help measure our sustainability performance
was 2010. Through the scorecard, we track our performance
in economic, environmental and social priorities, as well as
our corporate strategic initiatives. The Balanced Scorecard
is shared with the entire organization on a monthly basis
and is used as a component of employee compensation.
The Balanced Scorecard contains a CSR Reporting
component, consisting of two parts. The first part relates to
our Workplace Footprint and includes measures for waste,
energy and employee commuting. The second part relates
to broader port-related issues and tracks noise in the
community, truck congestion and air quality.
A Leader in Port Sustainability
As Canada’s busiest port, our vision is to be a global leader
in port sustainability. We strive to lead by example by
demonstrating opportunities for sustainable development in
our own operations and by collaborating with our partners
to improve performance port-wide.
Investing in our own sustainability performance creates
a sound platform for engaging our partners to follow
or share knowledge on how we can improve and grow
together. Programs such as the Northwest Ports Clean Air
Strategy, the Canada Place shore power installation and our
EcoAction Program for ocean-going vessels are examples of
ways we work with our partners to build a sustainable future
(see pages 26 – 27).
Our First Sustainability Report 9G
RI In
de
xIN
DE
PE
ND
EN
TA
SS
UR
AN
CE
AB
OU
T TH
IS R
EP
OR
TA
BO
UT P
OR
T M
ETR
O V
AN
CO
UV
ER
OU
R E
CO
NO
MIC
P
ER
FOR
MA
NC
EO
UR
EN
VIR
ON
ME
NTA
L P
ER
FOR
MA
NC
EC
ON
NE
CTIN
G W
ITH
OU
R C
OM
MU
NITIE
S
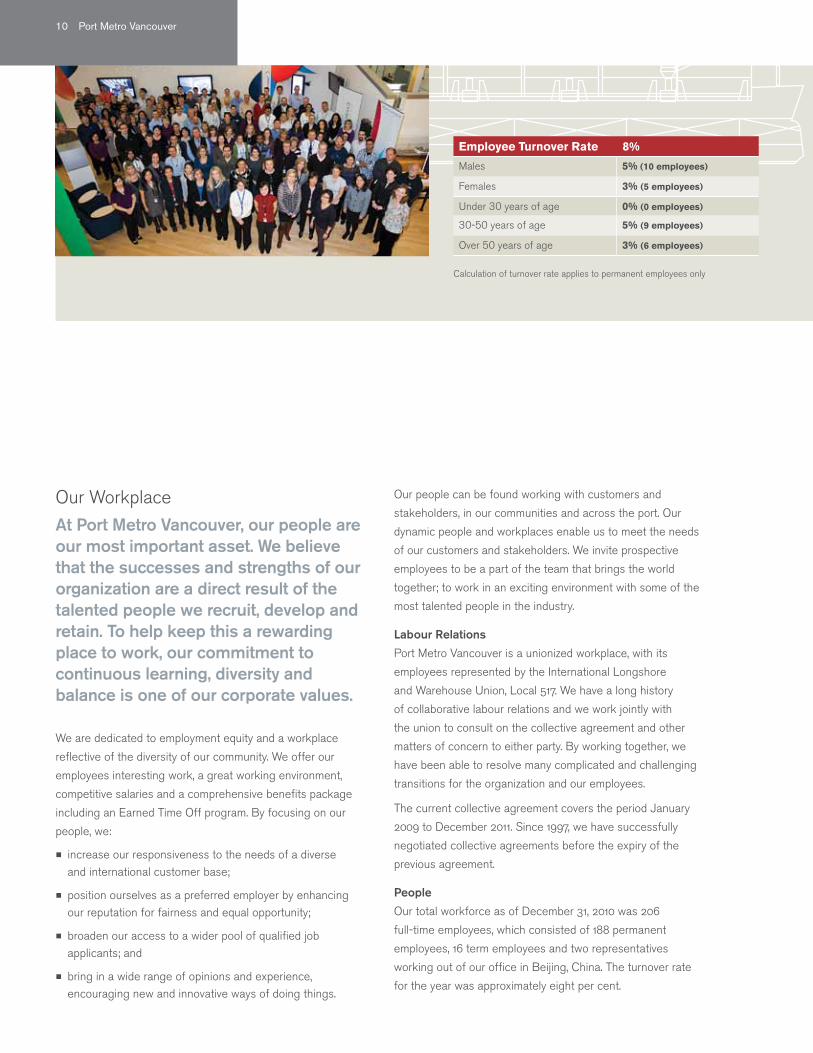
Employee Turnover Rate 8%
Males 5% (10 employees)
Females 3% (5 employees)
Under 30 years of age 0% (0 employees)
30-50 years of age 5% (9 employees)
Over 50 years of age 3% (6 employees)
Calculation of turnover rate applies to permanent employees only
We are dedicated to employment equity and a workplace
reflective of the diversity of our community. We offer our
employees interesting work, a great working environment,
competitive salaries and a comprehensive benefits package
including an Earned Time Off program. By focusing on our
people, we:
≠ increase our responsiveness to the needs of a diverse and international customer base;
≠ position ourselves as a preferred employer by enhancing our reputation for fairness and equal opportunity;
≠ broaden our access to a wider pool of qualified job applicants; and
≠ bring in a wide range of opinions and experience, encouraging new and innovative ways of doing things.
Our people can be found working with customers and
stakeholders, in our communities and across the port. Our
dynamic people and workplaces enable us to meet the needs
of our customers and stakeholders. We invite prospective
employees to be a part of the team that brings the world
together; to work in an exciting environment with some of the
most talented people in the industry.
Labour Relations
Port Metro Vancouver is a unionized workplace, with its
employees represented by the International Longshore
and Warehouse Union, Local 517. We have a long history
of collaborative labour relations and we work jointly with
the union to consult on the collective agreement and other
matters of concern to either party. By working together, we
have been able to resolve many complicated and challenging
transitions for the organization and our employees.
The current collective agreement covers the period January
2009 to December 2011. Since 1997, we have successfully
negotiated collective agreements before the expiry of the
previous agreement.
People
Our total workforce as of December 31, 2010 was 206
full-time employees, which consisted of 188 permanent
employees, 16 term employees and two representatives
working out of our office in Beijing, China. The turnover rate
for the year was approximately eight per cent.
Our Workplace
At Port Metro Vancouver, our people are our most important asset. We believe that the successes and strengths of our organization are a direct result of the talented people we recruit, develop and retain. To help keep this a rewarding place to work, our commitment to continuous learning, diversity and balance is one of our corporate values.
10 Port Metro Vancouver
Employee Turnover Rate 8%
Males 5% (10 employees)
Females 3% (5 employees)
Under 30 years of age 0% (0 employees)
30-50 years of age 5% (9 employees)
Over 50 years of age 3% (6 employees)
Port Metro Vancouver employees fill a wide variety of
positions in disciplines such as engineering, accounting,
environmental sciences, communications, human resources,
real estate, marine operations and trade development. The
diversity of positions within our organization allows for a
range of perspectives on challenging and complex issues
as we work to be responsive to the needs of our customers
and stakeholders.
We strive to create an attractive workplace that draws
talented and dedicated professionals through meaningful
work, a positive atmosphere, and competitive wage and
benefit packages. Port Metro Vancouver’s lowest hourly
wage in 2010 was $23.29 per hour. This wage is nearly
three times the $8-per-hour minimum wage that was in
effect in British Columbia in 2010.
Our Culture
In 2010 we engaged in a collaborative process involving all
employees in articulating our Corporate Values. Our values
were finalized in December 2010, and work continues in 2011
to embed them in our business processes. Our values are:
≠ Collaboration and Teamwork
≠ Customer Responsiveness
≠ Innovation
≠ Leadership and Accountability
≠ Our People
≠ Sustainability
We are committed to the safe and efficient
movement of goods and passengers through Port
Metro Vancouver and employ a 24/7 operations
and security department, as well as contracted
security providers. All our internal security
personnel are trained in our human rights policies
and our contracted security providers complete
basic security training that covers human rights
legislation. We work closely with federal agencies
to apply security measures for standardized
Marine Security (MARSEC) response levels.
With security measures that meet or exceed North
American standards, Port Metro Vancouver has
a well-earned reputation as a secure, safe and
dependable place to do business. We continue
to implement innovative security solutions that
safeguard and enhance the movement of cargo and
passengers through Canada’s largest port, such as
≠ fully operational 24/7 land and marine security surveillance
≠ card-only and gate access in place at all port terminals and port roadways
≠ continuous video surveillance of port roadways and terminals
≠ full security coverage of port lands
≠ advanced gamma ray container screening
≠ radiation portal program at container terminals
≠ 100 per cent passenger and baggage screening at cruise terminals
≠ lighting, perimeter security, intrusion detection, and signage on port properties
≠ incident reporting program to track suspicious activity
Security
Our First Sustainability Report 11G
RI In
de
xIN
DE
PE
ND
EN
TA
SS
UR
AN
CE
AB
OU
T TH
IS R
EP
OR
TA
BO
UT P
OR
T M
ETR
O V
AN
CO
UV
ER
OU
R E
CO
NO
MIC
P
ER
FOR
MA
NC
EO
UR
EN
VIR
ON
ME
NTA
L P
ER
FOR
MA
NC
EC
ON
NE
CTIN
G W
ITH
OU
R C
OM
MU
NITIE
S
Employee Engagement
We have a long history of using employee surveys to gather
perspectives on our employees’ experience within the
organization. In 1990, we developed and implemented an
independent survey. Results from the survey were used to
develop initiatives designed to encourage Support, People,
Interaction, Respect, Involvement and Trust (SPIRIT).
In 2009, we retired the SPIRIT survey and began our
participation in the Best Small and Medium Employer
Survey, which allows us to measure our results against
other organizations. Our survey is promoted by a cross-
functional team of employees and results are shared
with all employees. The survey team then goes through a
process of understanding the results by developing insight
into the underlying issues and then moving to action. Our
most recent survey results led to employee focus groups, a
commitment to build a culture of recognition at Port Metro
Vancouver and a renewed focus on education and training
throughout the organization. Survey results were also used
to inform our management training programs.
All employees are invited to monthly Town Hall meetings
where we review our corporate Balanced Scorecard,
share our monthly financials, profile a customer, welcome
new employees and celebrate employee accomplishments
and promotions.
We have an active Social Committee, which plans events
throughout the year both during and outside of the work day.
Additionally, we have a program that supports employee-
initiated team building events. PMV employees can be found
polishing their teamwork skills while dragon boating, playing
soccer, and participating in the annual Vancouver Sun Run
and the Mission to Seafarers Cycling fundraiser.
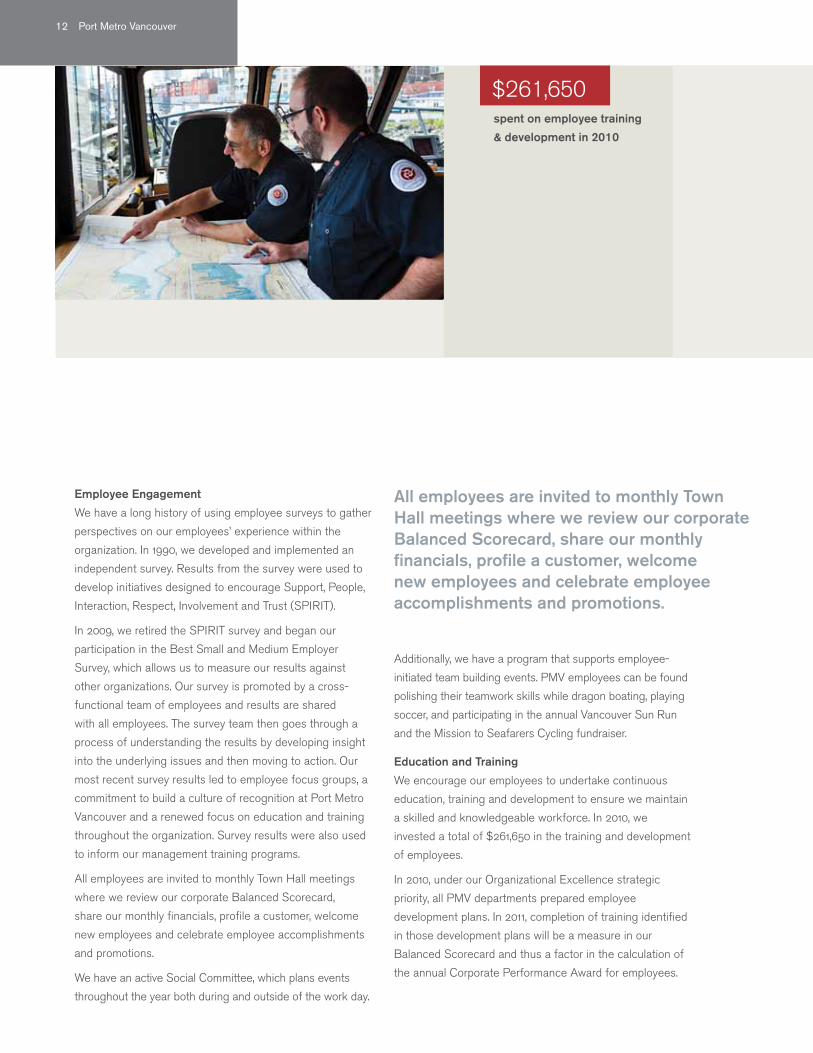
Education and Training
We encourage our employees to undertake continuous
education, training and development to ensure we maintain
a skilled and knowledgeable workforce. In 2010, we
invested a total of $261,650 in the training and development
of employees.
In 2010, under our Organizational Excellence strategic
priority, all PMV departments prepared employee
development plans. In 2011, completion of training identified
in those development plans will be a measure in our
Balanced Scorecard and thus a factor in the calculation of
the annual Corporate Performance Award for employees.
spent on employee training
& development in 2010
All employees are invited to monthly Town Hall meetings where we review our corporate Balanced Scorecard, share our monthly financials, profile a customer, welcome new employees and celebrate employee accomplishments and promotions.
$261,650
12 Port Metro Vancouver
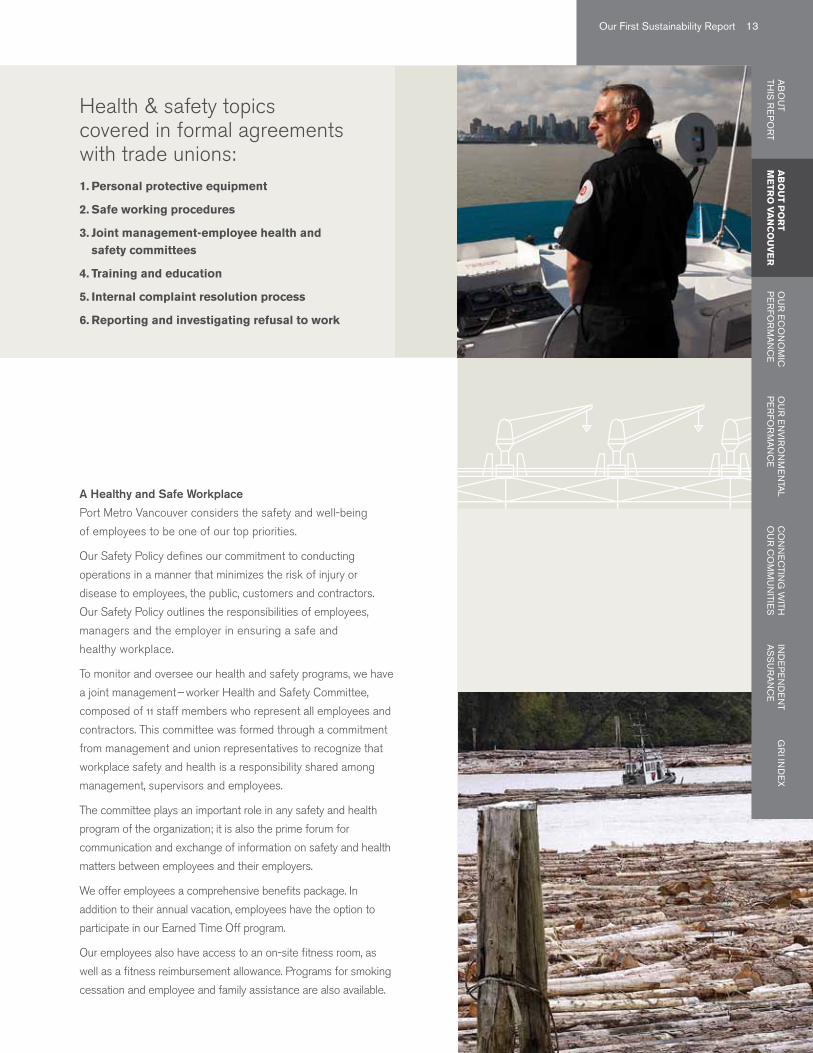
Health & safety topics covered in formal agreements with trade unions: 1. Personal protective equipment
2. Safe working procedures
3. Joint management-employee health and safety committees
4. Training and education
5. Internal complaint resolution process
6. Reporting and investigating refusal to work
A Healthy and Safe Workplace
Port Metro Vancouver considers the safety and well-being
of employees to be one of our top priorities.
Our Safety Policy defines our commitment to conducting
operations in a manner that minimizes the risk of injury or
disease to employees, the public, customers and contractors.
Our Safety Policy outlines the responsibilities of employees,
managers and the employer in ensuring a safe and
healthy workplace.
To monitor and oversee our health and safety programs, we have
a joint management – worker Health and Safety Committee,
composed of 11 staff members who represent all employees and
contractors. This committee was formed through a commitment
from management and union representatives to recognize that
workplace safety and health is a responsibility shared among
management, supervisors and employees.
The committee plays an important role in any safety and health
program of the organization; it is also the prime forum for
communication and exchange of information on safety and health
matters between employees and their employers.
We offer employees a comprehensive benefits package. In
addition to their annual vacation, employees have the option to
participate in our Earned Time Off program.
Our employees also have access to an on-site fitness room, as
well as a fitness reimbursement allowance. Programs for smoking
cessation and employee and family assistance are also available.
Our First Sustainability Report 13G
RI In
de
xIN
DE
PE
ND
EN
TA
SS
UR
AN
CE
AB
OU
T TH
IS R
EP
OR
TA
BO
UT P
OR
T M
ETR
O V
AN
CO
UV
ER
OU
R E
CO
NO
MIC
P
ER
FOR
MA
NC
EO
UR
EN
VIR
ON
ME
NTA
L P
ER
FOR
MA
NC
EC
ON
NE
CTIN
G W
ITH
OU
R C
OM
MU
NITIE
S
Our Governance
Our governance structure supports long-term planning and competitiveness while ensuring independence, transparency and accountability. We are governed by a diverse Board of Directors that is appointed by government and industry; able to make independent and timely decisions on business plans and capital spending; clearly focused on the needs of port users; and guided by a vision for long-term development and competitiveness.
Board of Directors & Committees
Port Metro Vancouver is guided by an independent Board of
Directors, which oversees the activities of the organization,
acting honestly and in good faith with a view to the best
interests of the organization. Specifically, the board is
responsible for reviewing and approving our strategic
direction and related land use, business, operating and
capital plans, selecting qualified management, overseeing
our business activities and material risks, and developing a
succession-planning process.
Our board is composed of 11 members, appointed by the
following bodies: Government of Canada (eight members);
the Province of British Columbia (one); and the Prairie
Provinces of Alberta, Saskatchewan and Manitoba (one).
In addition, one member is appointed by the municipalities
in which we operate. Of the members appointed by
the Government of Canada, seven are identified by a
nominating committee comprised of port users. Neither the
Chair nor the Vice-Chair of the Board of Directors serves
as an executive officer of the organization; they are elected
into those positions by their fellow members of the board,
for terms not to exceed two years.
Board candidates are appointed based on two main criteria:
their experience and stature within the transportation
industry or business community, and the knowledge they
have regarding the management of business and port trade.
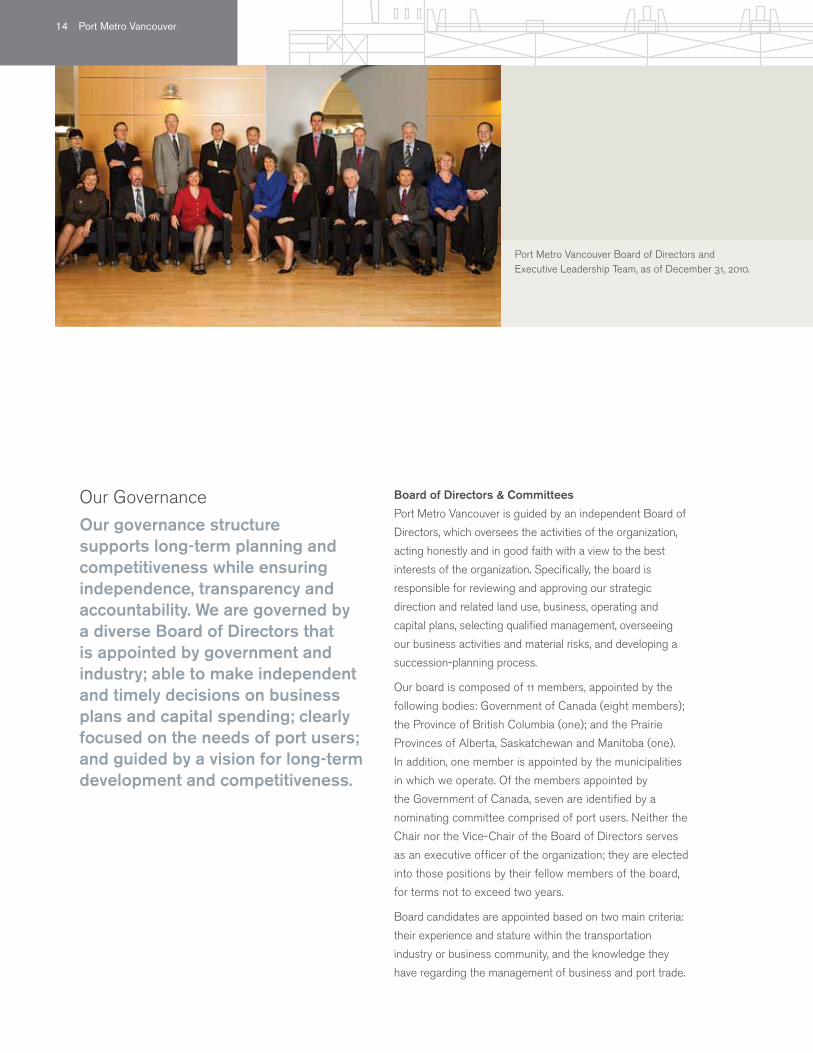
Port Metro Vancouver Board of Directors and Executive Leadership Team, as of December 31, 2010.
14 Port Metro Vancouver
On an annual basis, each director and officer of Port Metro
Vancouver acknowledges in writing that they have read and
understood the organization’s Code of Conduct. This code
establishes clear conflict-of-interest rules for directors
and officers of the organization, and aims to preserve and
enhance public confidence in the integrity and impartiality
of our Board of Directors.
To assist it with its work, the board has established the
following standing committees. These committees regularly
receive input from employees and management on a
variety of issues:
≠ Audit
≠ Community and Corporate Social Responsibility
≠ Governance and Conduct
≠ Human Resources and Compensation
≠ Major Capital Projects
Risk Management
The board retains the ultimate responsibility for risk
management and for determining the appropriate level of
risk in the conduct of Port Metro Vancouver’s business
activities.
Jointly, the CEO and Executive Leadership Team are
responsible for overseeing the implementation and ongoing
execution of risk management processes within their areas
of responsibility, and for accurately reporting to the board
on risk and the status of risk management.
Employees are responsible for a general duty of care
and for participating with management to identify,
evaluate, mitigate and internally report on risks in
connection with the application of this policy. At all
times, reasonable care is taken to prevent or adequately
mitigate adverse consequences to the organization.
Port Metro Vancouver’s Risk Management Policy
requires that processes be applied in strategy-setting
and in business activities to identify, evaluate and
manage risks. Performance reports, which include
issues pertaining to sustainability performance and
risk, are issued bi-monthly to the Community and
Corporate Social Responsibility Committee, the board
and the President.
In 2010, 100 per cent of Port Metro Vancouver’s five
divisions and 15 business units were assessed for
corruption-related risks as part of our Enterprise Risk
Management initiative.
Key Risks ≠ Supply chain capacity
≠ Project costs
≠ Strike, terrorist act or similar disruptive action
≠ Loss of community acceptance
≠ Industrial land shortage
≠ Climate change and other environmental issues
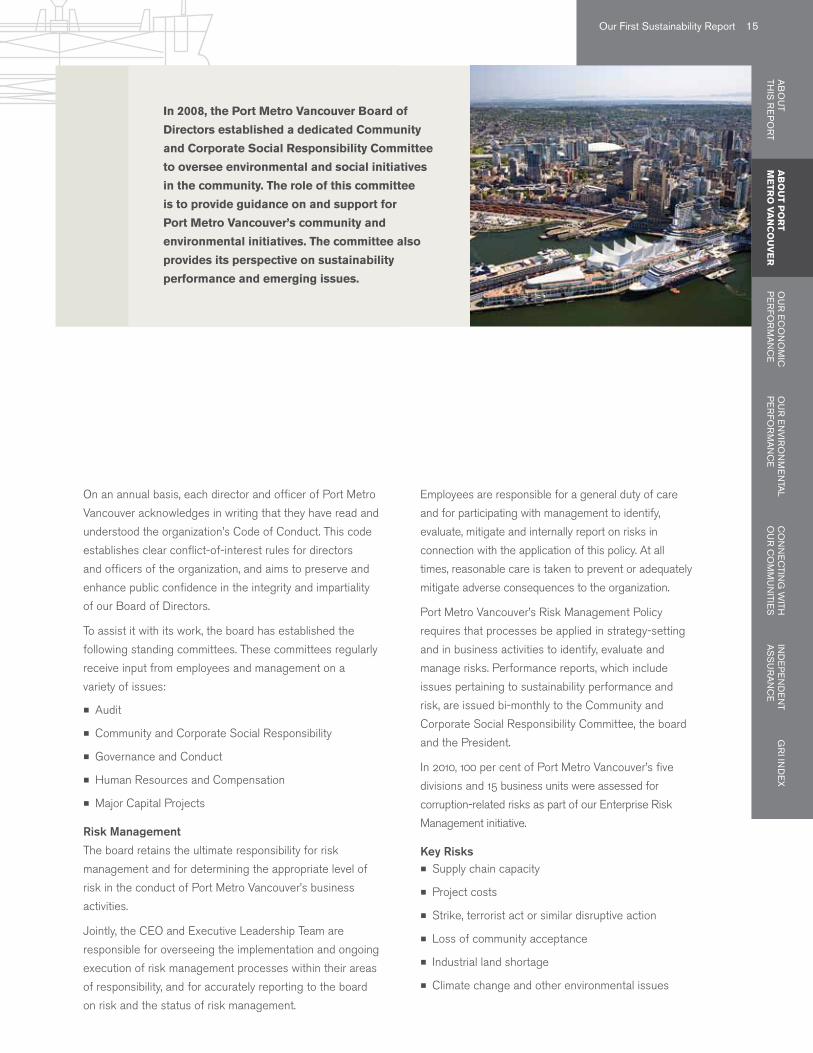
In 2008, the Port Metro Vancouver Board of
Directors established a dedicated Community
and Corporate Social Responsibility Committee
to oversee environmental and social initiatives
in the community. The role of this committee
is to provide guidance on and support for
Port Metro Vancouver’s community and
environmental initiatives. The committee also
provides its perspective on sustainability
performance and emerging issues.
Our First Sustainability Report 15G
RI In
de
xIN
DE
PE
ND
EN
TA
SS
UR
AN
CE
AB
OU
T TH
IS R
EP
OR
TA
BO
UT P
OR
T M
ETR
O V
AN
CO
UV
ER
OU
R E
CO
NO
MIC
P
ER
FOR
MA
NC
EO
UR
EN
VIR
ON
ME
NTA
L P
ER
FOR
MA
NC
EC
ON
NE
CTIN
G W
ITH
OU
R C
OM
MU
NITIE
S
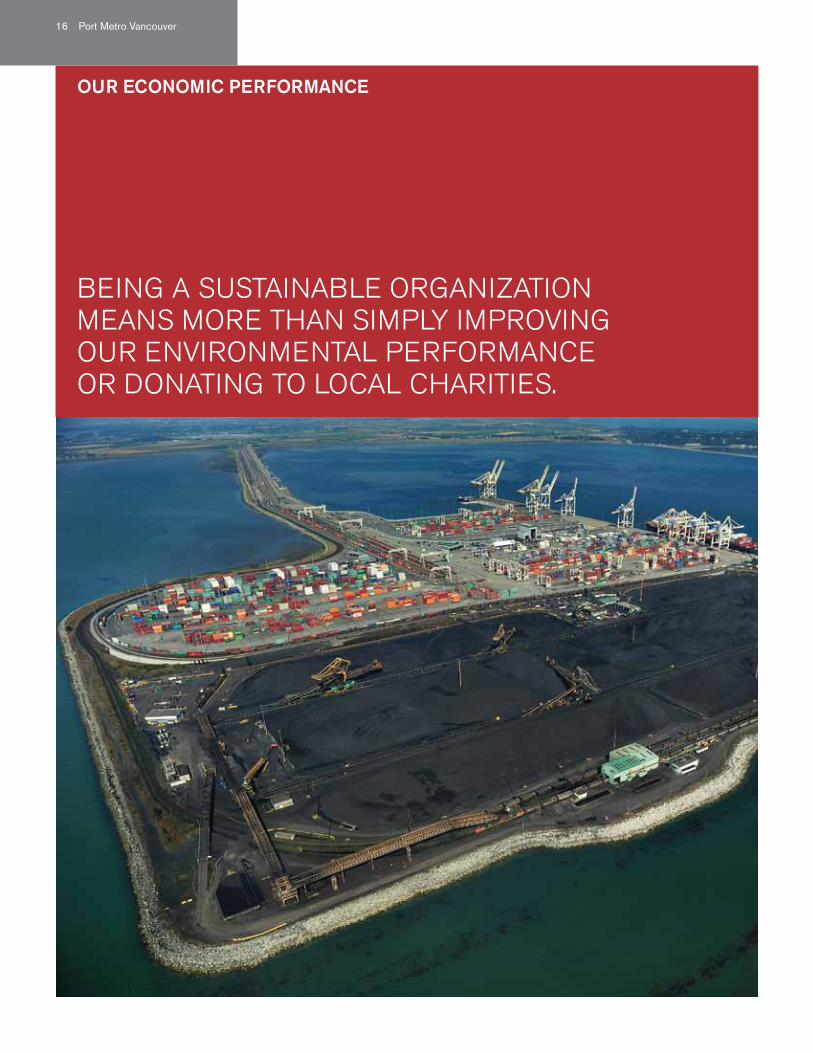
BEING A SUSTAINABLE ORGANIzATION MEANS MORE THAN SIMPLY IMPROVING OUR ENVIRONMENTAL PERFORMANCE OR DONATING TO LOCAL CHARITIES.
OUR ECONOMIC PERFORMANCE
16 Port Metro Vancouver
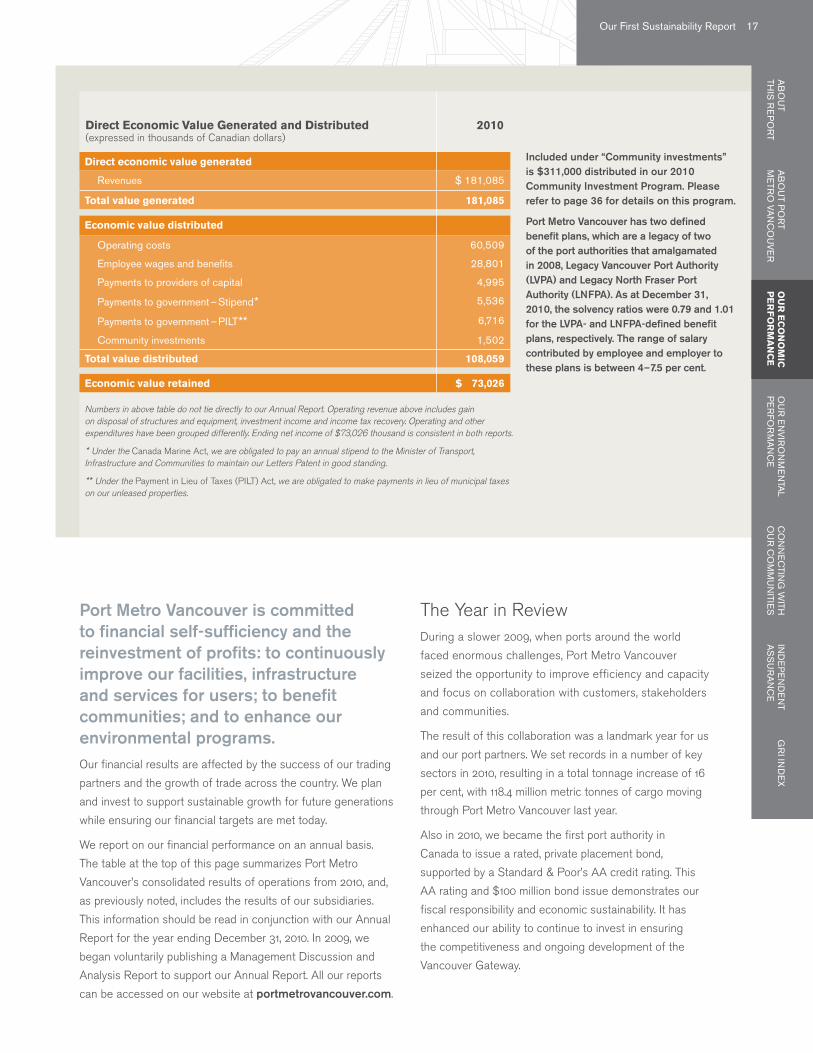
Direct economic value generated
Revenues $ 181,085
Total value generated 181,085
Economic value distributed
Operating costs 60,509
Employee wages and benefits 28,801
Payments to providers of capital 4,995
Payments to government – Stipend * 5,536
Payments to government – PILT ** 6,716
Community investments 1,502
Total value distributed 108,059
Economic value retained $ 73,026
Direct Economic Value Generated and Distributed(expressed in thousands of Canadian dollars)
2010
Port Metro Vancouver is committed to financial self-sufficiency and the reinvestment of profits: to continuously improve our facilities, infrastructure and services for users; to benefit communities; and to enhance our environmental programs.Our financial results are affected by the success of our trading
partners and the growth of trade across the country. We plan
and invest to support sustainable growth for future generations
while ensuring our financial targets are met today.
We report on our financial performance on an annual basis.
The table at the top of this page summarizes Port Metro
Vancouver’s consolidated results of operations from 2010, and,
as previously noted, includes the results of our subsidiaries.
This information should be read in conjunction with our Annual
Report for the year ending December 31, 2010. In 2009, we
began voluntarily publishing a Management Discussion and
Analysis Report to support our Annual Report. All our reports
can be accessed on our website at portmetrovancouver.com.
The Year in ReviewDuring a slower 2009, when ports around the world
faced enormous challenges, Port Metro Vancouver
seized the opportunity to improve efficiency and capacity
and focus on collaboration with customers, stakeholders
and communities.
The result of this collaboration was a landmark year for us
and our port partners. We set records in a number of key
sectors in 2010, resulting in a total tonnage increase of 16
per cent, with 118.4 million metric tonnes of cargo moving
through Port Metro Vancouver last year.
Also in 2010, we became the first port authority in
Canada to issue a rated, private placement bond,
supported by a Standard & Poor’s AA credit rating. This
AA rating and $100 million bond issue demonstrates our
fiscal responsibility and economic sustainability. It has
enhanced our ability to continue to invest in ensuring
the competitiveness and ongoing development of the
Vancouver Gateway.
Included under “Community investments” is $311,000 distributed in our 2010 Community Investment Program. Please refer to page 36 for details on this program.
Port Metro Vancouver has two defined benefit plans, which are a legacy of two of the port authorities that amalgamated in 2008, Legacy Vancouver Port Authority (LVPA) and Legacy North Fraser Port Authority (LNFPA). As at December 31, 2010, the solvency ratios were 0.79 and 1.01 for the LVPA- and LNFPA-defined benefit plans, respectively. The range of salary contributed by employee and employer to these plans is between 4 – 7.5 per cent.
Numbers in above table do not tie directly to our Annual Report. Operating revenue above includes gain on disposal of structures and equipment, investment income and income tax recovery. Operating and other expenditures have been grouped differently. Ending net income of $73,026 thousand is consistent in both reports.
* Under the Canada Marine Act, we are obligated to pay an annual stipend to the Minister of Transport, Infrastructure and Communities to maintain our Letters Patent in good standing.
** Under the Payment in Lieu of Taxes (PILT) Act, we are obligated to make payments in lieu of municipal taxes on our unleased properties.
Our First Sustainability Report 17G
RI In
de
xIN
DE
PE
ND
EN
TA
SS
UR
AN
CE
AB
OU
T TH
IS R
EP
OR
TA
BO
UT P
OR
T m
eTR
O VA
NC
OU
Ve
RO
UR
EC
ON
OM
IC
PE
RF
OR
MA
NC
EO
UR
EN
VIR
ON
ME
NTA
L P
ER
FOR
MA
NC
EC
ON
NE
CTIN
G W
ITH
OU
R C
OM
MU
NITIE
S
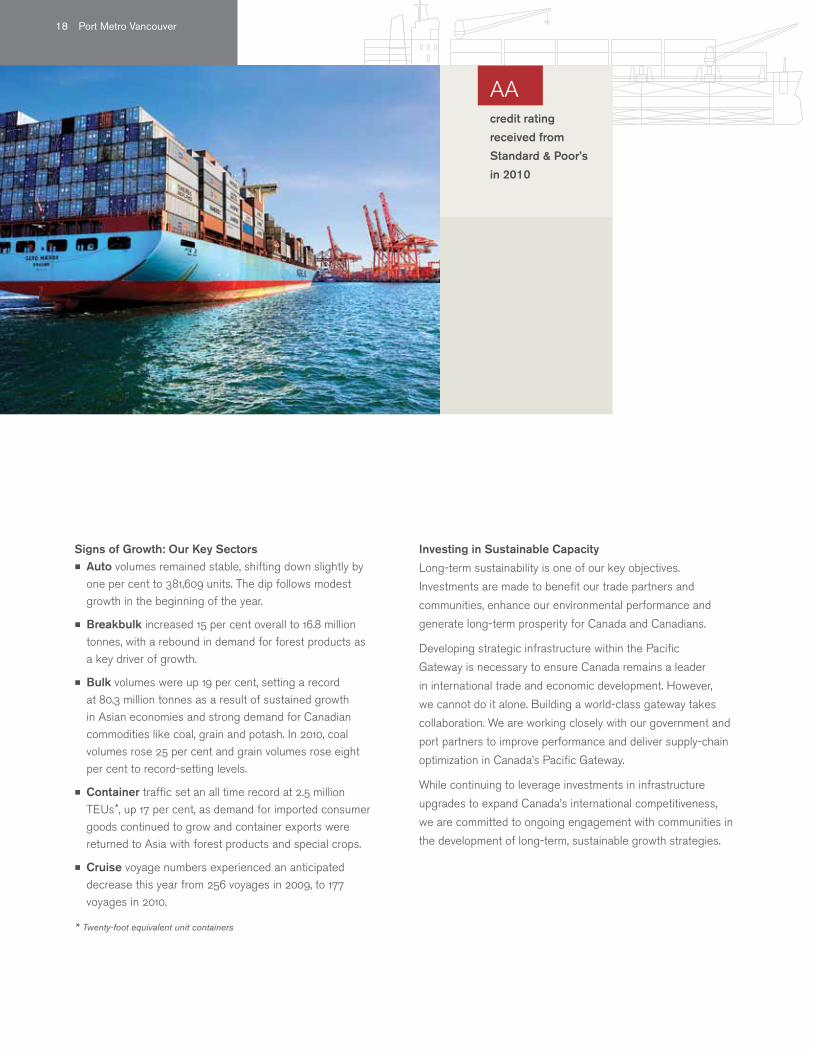
Signs of Growth: Our Key Sectors ≠ Auto volumes remained stable, shifting down slightly by one per cent to 381,609 units. The dip follows modest growth in the beginning of the year.
≠ Breakbulk increased 15 per cent overall to 16.8 million tonnes, with a rebound in demand for forest products as a key driver of growth.
≠ Bulk volumes were up 19 per cent, setting a record at 80.3 million tonnes as a result of sustained growth in Asian economies and strong demand for Canadian commodities like coal, grain and potash. In 2010, coal volumes rose 25 per cent and grain volumes rose eight per cent to record-setting levels.
≠ Container traffic set an all time record at 2.5 million TEUs *, up 17 per cent, as demand for imported consumer goods continued to grow and container exports were returned to Asia with forest products and special crops.
≠ Cruise voyage numbers experienced an anticipated decrease this year from 256 voyages in 2009, to 177 voyages in 2010.
* Twenty-foot equivalent unit containers
credit rating
received from
Standard & Poor’s
in 2010
Investing in Sustainable Capacity
Long-term sustainability is one of our key objectives.
Investments are made to benefit our trade partners and
communities, enhance our environmental performance and
generate long-term prosperity for Canada and Canadians.
Developing strategic infrastructure within the Pacific
Gateway is necessary to ensure Canada remains a leader
in international trade and economic development. However,
we cannot do it alone. Building a world-class gateway takes
collaboration. We are working closely with our government and
port partners to improve performance and deliver supply-chain
optimization in Canada’s Pacific Gateway.
While continuing to leverage investments in infrastructure
upgrades to expand Canada’s international competitiveness,
we are committed to ongoing engagement with communities in
the development of long-term, sustainable growth strategies.
AA
18 Port Metro Vancouver
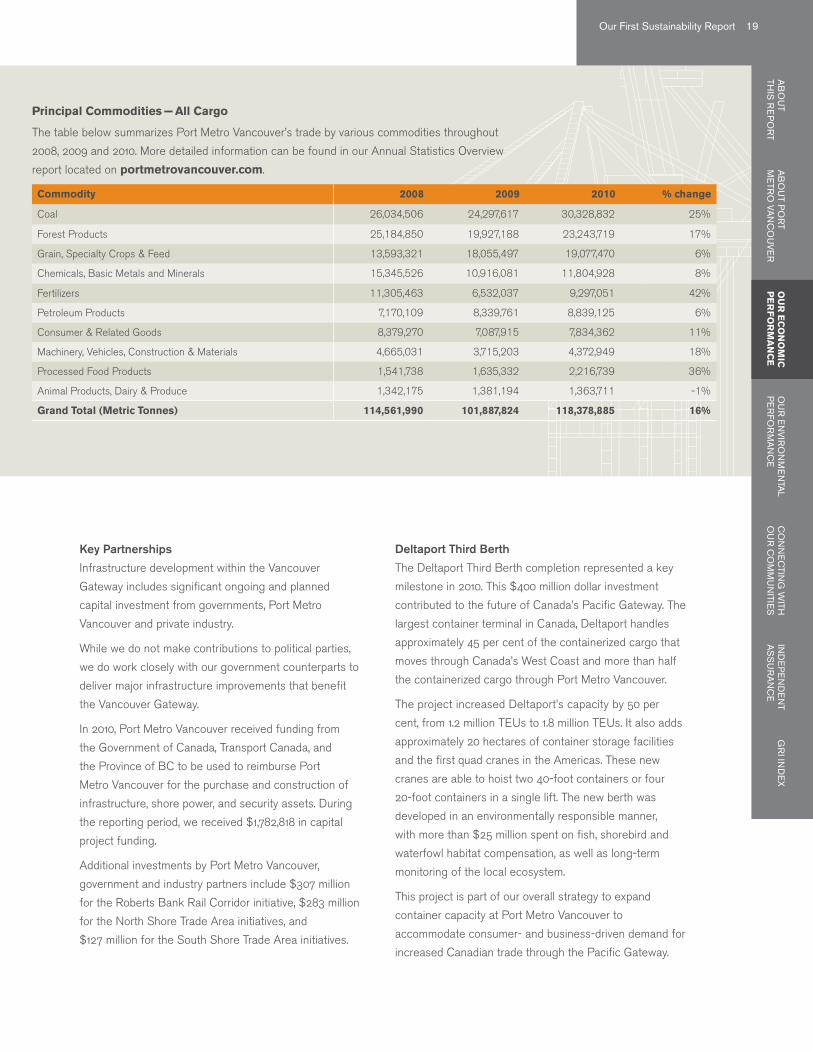
Commodity 2008 2009 2010 % change
Coal 26,034,506 24,297,617 30,328,832 25%
Forest Products 25,184,850 19,927,188 23,243,719 17%
Grain, Specialty Crops & Feed 13,593,321 18,055,497 19,077,470 6%
Chemicals, Basic Metals and Minerals 15,345,526 10,916,081 11,804,928 8%
Fertilizers 11,305,463 6,532,037 9,297,051 42%
Petroleum Products 7,170,109 8,339,761 8,839,125 6%
Consumer & Related Goods 8,379,270 7,087,915 7,834,362 11%
Machinery, Vehicles, Construction & Materials 4,665,031 3,715,203 4,372,949 18%
Processed Food Products 1,541,738 1,635,332 2,216,739 36%
Animal Products, Dairy & Produce 1,342,175 1,381,194 1,363,711 -1%
Grand Total (Metric Tonnes) 114,561,990 101,887,824 118,378,885 16%
Principal Commodities — All Cargo
The table below summarizes Port Metro Vancouver’s trade by various commodities throughout
2008, 2009 and 2010. More detailed information can be found in our Annual Statistics Overview
report located on portmetrovancouver.com.
Key Partnerships
Infrastructure development within the Vancouver
Gateway includes significant ongoing and planned
capital investment from governments, Port Metro
Vancouver and private industry.
While we do not make contributions to political parties,
we do work closely with our government counterparts to
deliver major infrastructure improvements that benefit
the Vancouver Gateway.
In 2010, Port Metro Vancouver received funding from
the Government of Canada, Transport Canada, and
the Province of BC to be used to reimburse Port
Metro Vancouver for the purchase and construction of
infrastructure, shore power, and security assets. During
the reporting period, we received $1,782,818 in capital
project funding.
Additional investments by Port Metro Vancouver,
government and industry partners include $307 million
for the Roberts Bank Rail Corridor initiative, $283 million
for the North Shore Trade Area initiatives, and
$127 million for the South Shore Trade Area initiatives.
Deltaport Third Berth
The Deltaport Third Berth completion represented a key
milestone in 2010. This $400 million dollar investment
contributed to the future of Canada’s Pacific Gateway. The
largest container terminal in Canada, Deltaport handles
approximately 45 per cent of the containerized cargo that
moves through Canada’s West Coast and more than half
the containerized cargo through Port Metro Vancouver.
The project increased Deltaport’s capacity by 50 per
cent, from 1.2 million TEUs to 1.8 million TEUs. It also adds
approximately 20 hectares of container storage facilities
and the first quad cranes in the Americas. These new
cranes are able to hoist two 40-foot containers or four
20-foot containers in a single lift. The new berth was
developed in an environmentally responsible manner,
with more than $25 million spent on fish, shorebird and
waterfowl habitat compensation, as well as long-term
monitoring of the local ecosystem.
This project is part of our overall strategy to expand
container capacity at Port Metro Vancouver to
accommodate consumer- and business-driven demand for
increased Canadian trade through the Pacific Gateway.
Our First Sustainability Report 19G
RI In
de
xIN
DE
PE
ND
EN
TA
SS
UR
AN
CE
AB
OU
T TH
IS R
EP
OR
TA
BO
UT P
OR
T m
eTR
O VA
NC
OU
Ve
RO
UR
EC
ON
OM
IC
PE
RF
OR
MA
NC
EO
UR
EN
VIR
ON
ME
NTA
L P
ER
FOR
MA
NC
EC
ON
NE
CTIN
G W
ITH
OU
R C
OM
MU
NITIE
S
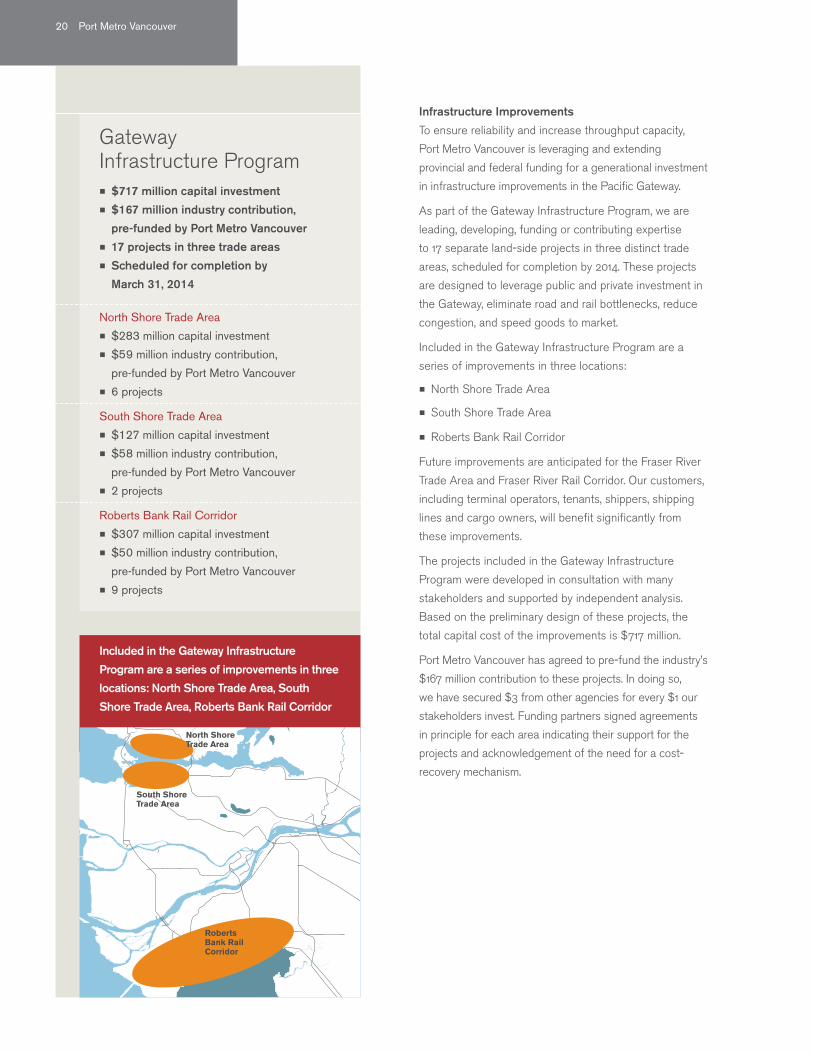
Included in the Gateway Infrastructure
Program are a series of improvements in three
locations: North Shore Trade Area, South
Shore Trade Area, Roberts Bank Rail Corridor
Gateway Infrastructure Program
≠ $717 million capital investment ≠ $167 million industry contribution,
pre-funded by Port Metro Vancouver ≠ 17 projects in three trade areas ≠ Scheduled for completion by
March 31, 2014
Infrastructure Improvements
To ensure reliability and increase throughput capacity,
Port Metro Vancouver is leveraging and extending
provincial and federal funding for a generational investment
in infrastructure improvements in the Pacific Gateway.
As part of the Gateway Infrastructure Program, we are
leading, developing, funding or contributing expertise
to 17 separate land-side projects in three distinct trade
areas, scheduled for completion by 2014. These projects
are designed to leverage public and private investment in
the Gateway, eliminate road and rail bottlenecks, reduce
congestion, and speed goods to market.
Included in the Gateway Infrastructure Program are a
series of improvements in three locations:
≠ North Shore Trade Area
≠ South Shore Trade Area
≠ Roberts Bank Rail Corridor
Future improvements are anticipated for the Fraser River
Trade Area and Fraser River Rail Corridor. Our customers,
including terminal operators, tenants, shippers, shipping
lines and cargo owners, will benefit significantly from
these improvements.
The projects included in the Gateway Infrastructure
Program were developed in consultation with many
stakeholders and supported by independent analysis.
Based on the preliminary design of these projects, the
total capital cost of the improvements is $717 million.
Port Metro Vancouver has agreed to pre-fund the industry’s
$167 million contribution to these projects. In doing so,
we have secured $3 from other agencies for every $1 our
stakeholders invest. Funding partners signed agreements
in principle for each area indicating their support for the
projects and acknowledgement of the need for a cost-
recovery mechanism.
North Shore Trade Area ≠ $283 million capital investment ≠ $59 million industry contribution,
pre-funded by Port Metro Vancouver ≠ 6 projects
South Shore Trade Area ≠ $127 million capital investment ≠ $58 million industry contribution,
pre-funded by Port Metro Vancouver ≠ 2 projects
Roberts Bank Rail Corridor ≠ $307 million capital investment ≠ $50 million industry contribution,
pre-funded by Port Metro Vancouver ≠ 9 projects
North Shore Trade Area
South Shore Trade Area
Roberts Bank Rail Corridor
20 Port Metro Vancouver
To make rail operations more efficient in the
North Shore Trade Area, Port Metro Vancouver
and our partners built a new rail bridge over Lynn
Creek. The project facilitates improved railway
access to and from Neptune Bulk Terminal and
Lynnterm West Terminal in North Vancouver.
Rail is the most fuel-efficient method of land
transportation for bulk commodities. This project
supports the use of longer trains, making rail
operations even more efficient. By accommodating
longer trains, the neighbouring communities will
also experience less noise from rail operations.
As part of the project, we upgraded nearby
Harbourview Park to preserve and enhance its
historical, recreational and natural resources,
including a revamped parking lot, a new lookout
with a seating area, and the restoration of native
trees and shrubs.
A new pedestrian walkway under the rail bridge
will connect the trails in Harbourview Park to the
rest of the Lynn Creek trail system. For the first
time, visitors will be able to walk along the entire
length of Lynn Creek.
The Lynn Creek Rail Project represents a unique
collaboration among governments and industry
to improve land in the community, while enabling
growth in international trade.
Lynn Creek Rail Bridge
Case Study
Our First Sustainability Report 21G
RI In
de
xIN
DE
PE
ND
EN
TA
SS
UR
AN
CE
AB
OU
T TH
IS R
EP
OR
TA
BO
UT P
OR
T m
eTR
O VA
NC
OU
Ve
RO
UR
EC
ON
OM
IC
PE
RF
OR
MA
NC
EO
UR
EN
VIR
ON
ME
NTA
L P
ER
FOR
MA
NC
EC
ON
NE
CTIN
G W
ITH
OU
R C
OM
MU
NITIE
S
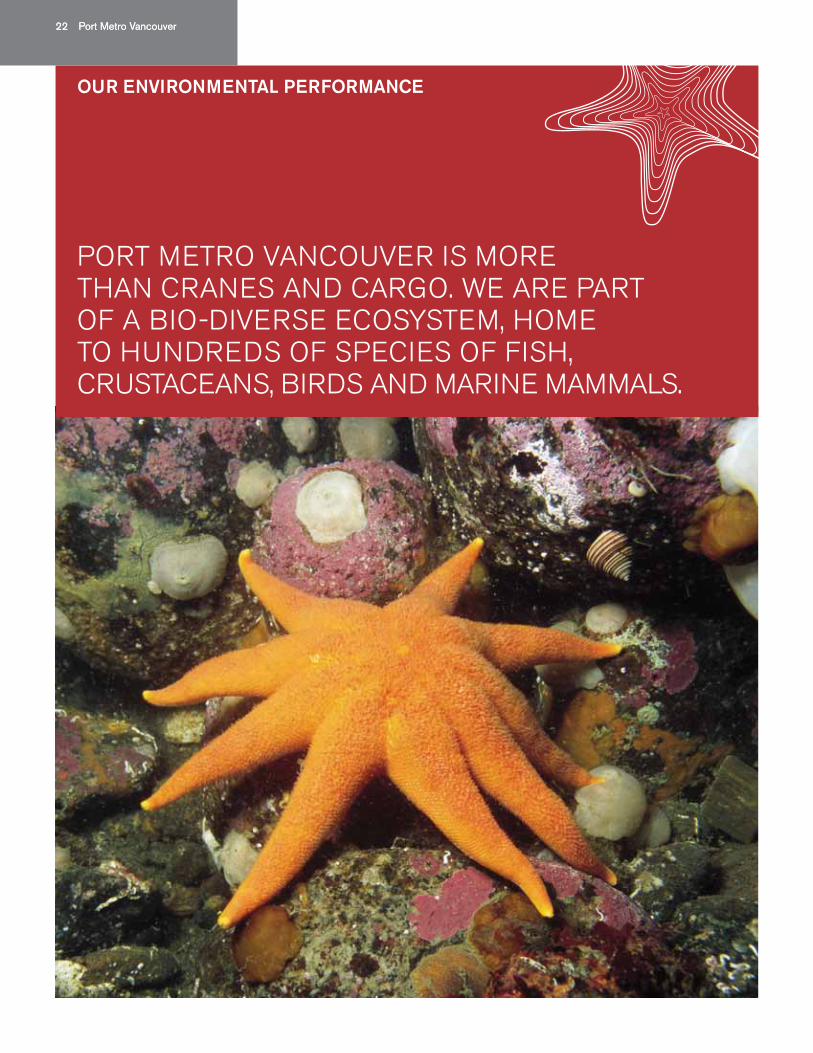
PORT METRO VANCOUVER IS MORE THAN CRANES AND CARGO. WE ARE PART OF A BIO-DIVERSE ECOSYSTEM, HOME TO HUNDREDS OF SPECIES OF FISH, CRUSTACEANS, BIRDS AND MARINE MAMMALS.
OUR ENVIRONMENTAL PERFORMANCE
22 Port Metro Vancouver22 Port Metro Vancouver
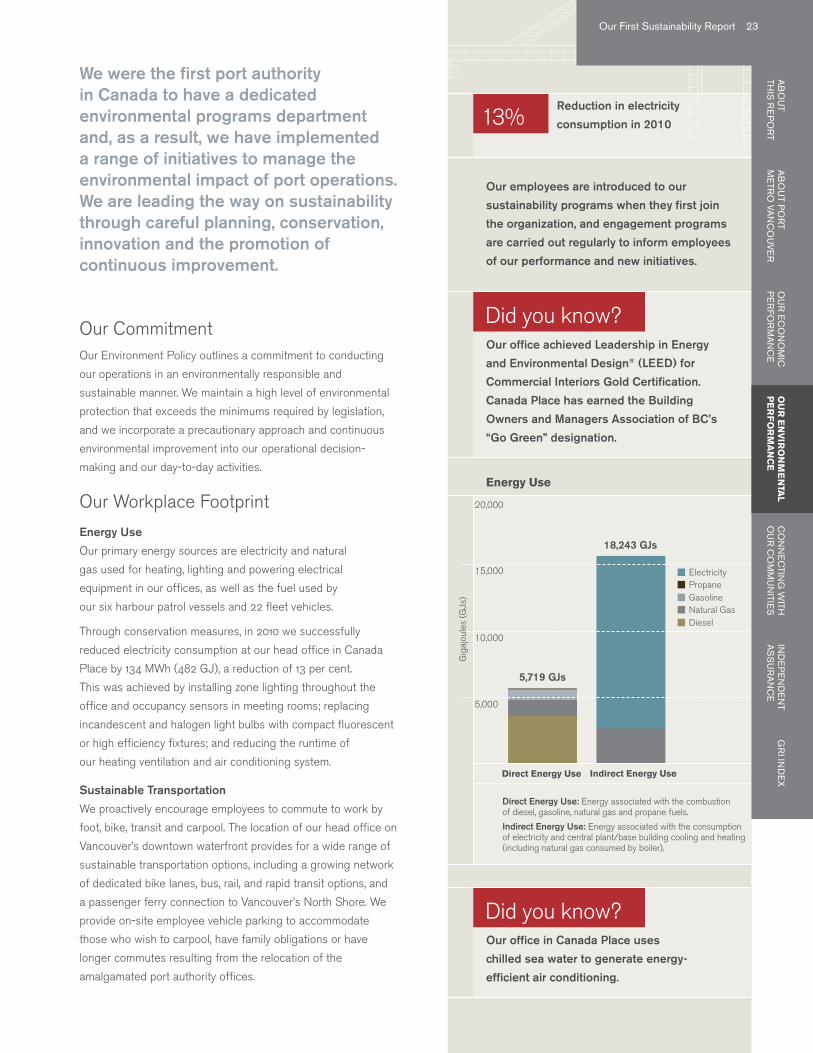
Energy Use
Direct Energy Use
20,000
Electricity
GasolinePropane
Natural GasDiesel
15,000
10,000
5,000
Indirect Energy Use
Gig
ajou
les
(Gjs
)
Direct Energy Use: Energy associated with the combustion of diesel, gasoline, natural gas and propane fuels.
Indirect Energy Use: Energy associated with the consumption of electricity and central plant/base building cooling and heating (including natural gas consumed by boiler).
We were the first port authority in Canada to have a dedicated environmental programs department and, as a result, we have implemented a range of initiatives to manage the environmental impact of port operations. We are leading the way on sustainability through careful planning, conservation, innovation and the promotion of continuous improvement.
Our CommitmentOur Environment Policy outlines a commitment to conducting
our operations in an environmentally responsible and
sustainable manner. We maintain a high level of environmental
protection that exceeds the minimums required by legislation,
and we incorporate a precautionary approach and continuous
environmental improvement into our operational decision-
making and our day-to-day activities.
Our Workplace Footprint
Energy Use
Our primary energy sources are electricity and natural
gas used for heating, lighting and powering electrical
equipment in our offices, as well as the fuel used by
our six harbour patrol vessels and 22 fleet vehicles.
Through conservation measures, in 2010 we successfully
reduced electricity consumption at our head office in Canada
Place by 134 MWh (482 GJ), a reduction of 13 per cent.
This was achieved by installing zone lighting throughout the
office and occupancy sensors in meeting rooms; replacing
incandescent and halogen light bulbs with compact fluorescent
or high efficiency fixtures; and reducing the runtime of
our heating ventilation and air conditioning system.
Sustainable Transportation
We proactively encourage employees to commute to work by
foot, bike, transit and carpool. The location of our head office on
Vancouver’s downtown waterfront provides for a wide range of
sustainable transportation options, including a growing network
of dedicated bike lanes, bus, rail, and rapid transit options, and
a passenger ferry connection to Vancouver’s North Shore. We
provide on-site employee vehicle parking to accommodate
those who wish to carpool, have family obligations or have
longer commutes resulting from the relocation of the
amalgamated port authority offices.
Our employees are introduced to our
sustainability programs when they first join
the organization, and engagement programs
are carried out regularly to inform employees
of our performance and new initiatives.
Our office achieved Leadership in Energy
and Environmental Design® (LEED) for
Commercial Interiors Gold Certification.
Canada Place has earned the Building
Owners and Managers Association of BC’s
“Go Green” designation.
Reduction in electricity
consumption in 2010
Our office in Canada Place uses
chilled sea water to generate energy-
efficient air conditioning.
Port Metro Vancouver 23
5,719 GJs
18,243 GJs
13%
Did you know?
Did you know?
Our First Sustainability Report 23G
RI In
de
xIN
DE
PE
ND
EN
TA
SS
UR
AN
CE
AB
OU
T TH
IS R
EP
OR
TA
BO
UT P
OR
T m
eTR
O VA
NC
OU
Ve
RO
UR
EC
ON
OM
IC
PE
RFO
RM
AN
CE
OU
R E
NV
IRO
NM
EN
TAL
PE
RF
OR
MA
NC
EC
ON
NE
CTIN
G W
ITH
OU
R C
OM
MU
NITIE
S
We have a number of initiatives to encourage our
employees to consider sustainable transportation options,
including:
≠ Participation in the TransLink Employer Pass Program, which provides reduced-cost, tax-deductible transit passes for employees;
≠ The provision of secure bike storage and shower facilities to make cycling a more attractive option;
≠ In 2010, our Guaranteed Ride Home program was introduced, assuring a ride home for employees who commute on sustainable transportation when they are required to work late or in the event of an emergency;
≠ Also in 2010, we ran a Commuter Challenge, in which 43 per cent of our employees committed to using sustainable transportation three days a week, for a minimum of four weeks.
In addition to supporting our employees with their
sustainable transportation choices, we work hard to
reduce the environmental impact of our business travel.
We provide transit passes for employees who conduct
business in areas with access to public transit. When
a vehicle is required, employees have access to seven
hybrid vehicles. In 2010, our employees travelled a total of
82,600 kilometres in these hybrid vehicles, saving 1,925
litres of fuel and 4.6 tCO2e emissions, when compared
with travelling the same distance in standard vehicles. 1
1 Reporting period for hybrid vehicle travel is February 2010 to February 2011.
2 Data reported is for our head office only.
3 Data reported is for our head office from April 8, 2010 onwards, when our composting program was established.
4 Data reported is loose leaf paper use only. Other paper-based products and paper used for reports printed externally are not currently recorded.
Materials and Waste
We recognize the importance of procuring sustainable
products and managing our waste in a responsible way.
The majority of our corporate activities and employees are
office-based so we ensure that nearly 100 per cent of the
5,176 kg of paper we consume contains 30 per cent post-
consumer recycled content. 4
In 2010, we implemented a Sort Smart waste management
program at our Canada Place office to promote waste
diversion and the principles of reduce, reuse and recycle.
This program includes a robust recycling system for paper,
glass, metals and plastics. In April 2010, we introduced a
composting service for organic waste, diverting 2,970 kg of
organics from the landfill in just eight months. 3
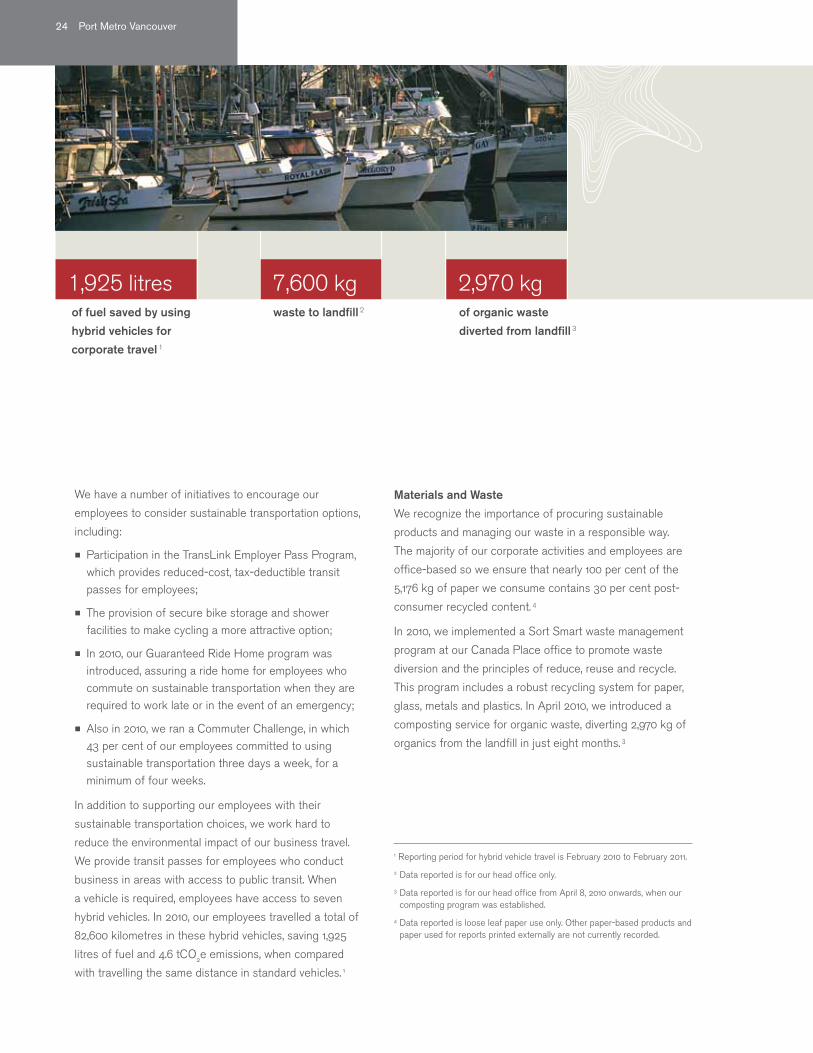
1,925 litres 7,600 kg 2,970 kgwaste to landfill 2 of organic waste
diverted from landfill 3of fuel saved by using
hybrid vehicles for
corporate travel 1
24 Port Metro Vancouver
Greenhouse Gases
Criteria Air Contaminants 3
Air Emissions
Scope 1 emissions 402 Direct fuel consumption from six harbour vessels, 22 fleet vehicles and building heating.
kg
Nitrogen oxides (NOx) 6,986
Sulfur oxides (SOx) 121
Particulate matter (PM) ≤2.5 µm 188
Legend tCO2e
Scope 2 emissions 275 Electricity consumption at our head office and three support facilities, including electricity and central plant/base building cooling and heating.
Scope 3 emissions 2 522 Business travel, employee commuting, waste generation and paper consumption.
100
300
500
Met
ric to
nnes
of
carb
on
diox
ide
equi
vale
nts
(tC
O2e)
Scope 1 Scope 2 Scope 3
402
275
522
Corporate Emissions
In 2010, we reduced emissions associated with energy use
at our head office by 3.4 tCO2e through energy conservation
measures. We also invested in 1,265 tonnes of BC-based
carbon offsets through the Pacific Carbon Trust. These
offsets mitigated the remaining emissions from our corporate
activities, thereby rendering our operations carbon neutral 1
for the 2010 calendar year, including our participation in the
2010 Winter Olympics.
Air Action ProgramAt Port Metro Vancouver, we recognize that the impacts on
air quality from port-wide operations reach far beyond our
head office. Reducing emissions from port-related activities,
including ships, trucks, trains and terminal equipment, as well
as industrial processes, is a key component of making the
broader port sustainable.
A tremendous opportunity exists to work with our stakeholders,
as well as with other ports, the marine industry and government
agencies, to reduce port-related air emissions throughout
the Pacific Gateway. Therefore, in 2008, we developed our
award-winning Air Action Program to improve management of
air emissions.
1 Our emission inventory does not include capital projects or navigational dredging delivered by third parties through contracts.
2 Emissions from maintenance waste have been estimated from seven months of available data. Emissions from employee commuting are estimated based on survey responses and have been extrapolated to represent all employees.
3 We primarily have mobile source emissions and use accepted mobile emission models for Canada to calculate our emissions inventory. We have reported the most relevant emissions for our operations. Assurance for air contaminants excludes business travel, employee commuting, waste generation and paper consumption.
In 2010, our operations were carbon
neutral for the first time in our history.
metric tonnes of greenhouse
gas emissions (tCO2e)
Did you know?
1,199
Our First Sustainability Report 25G
RI In
de
xIN
DE
PE
ND
EN
TA
SS
UR
AN
CE
AB
OU
T TH
IS R
EP
OR
TA
BO
UT P
OR
T m
eTR
O VA
NC
OU
Ve
RO
UR
EC
ON
OM
IC
PE
RFO
RM
AN
CE
OU
R E
NV
IRO
NM
EN
TAL
PE
RF
OR
MA
NC
EC
ON
NE
CTIN
G W
ITH
OU
R C
OM
MU
NITIE
S
of container trucks within
Port Metro Vancouver meet
our stringent environmental
requirements
The Air Action Program consists of four primary components:
Northwest Ports Clean Air Strategy — There is a partnership
among Port Metro Vancouver, Port of Seattle and Port of Tacoma
to reduce port-related diesel particulate matter and greenhouse
gas emissions in the Georgia Basin – Puget Sound air shed
through voluntary, collaborative means.
EcoAction Program — We promote emissions reduction targets
for ocean-going vessels that enter our port by offering financial
incentives for those who excel in environmental stewardship. The
program is designed to support a wide variety of technology and
fuel options in order to promote emission reductions.
Landside Emissions Inventory — By estimating emissions
from cargo handling equipment, terminals, trucks, rail and our
tenants’ activities, this inventory provides vital information
about air emissions and energy consumption throughout the
Vancouver Gateway. This information enables us to identify
opportunities to conserve energy, reduce emissions and
promote clean energy technologies.
Truck Licensing Program — In 2008, we introduced increasingly
stringent environmental requirements into the Container Truck
Licensing Program. These requirements focus on phasing out
older trucks, mandatory opacity and idling limits, as well as
an awareness program. All container trucks within Port Metro
Vancouver must be compliant with the 2010 requirements, and we
continue to work with truck operators to reduce truck emissions
and bring the fleet up to the equivalent particulate matter
emissions of a 2007 truck or newer by 2017.
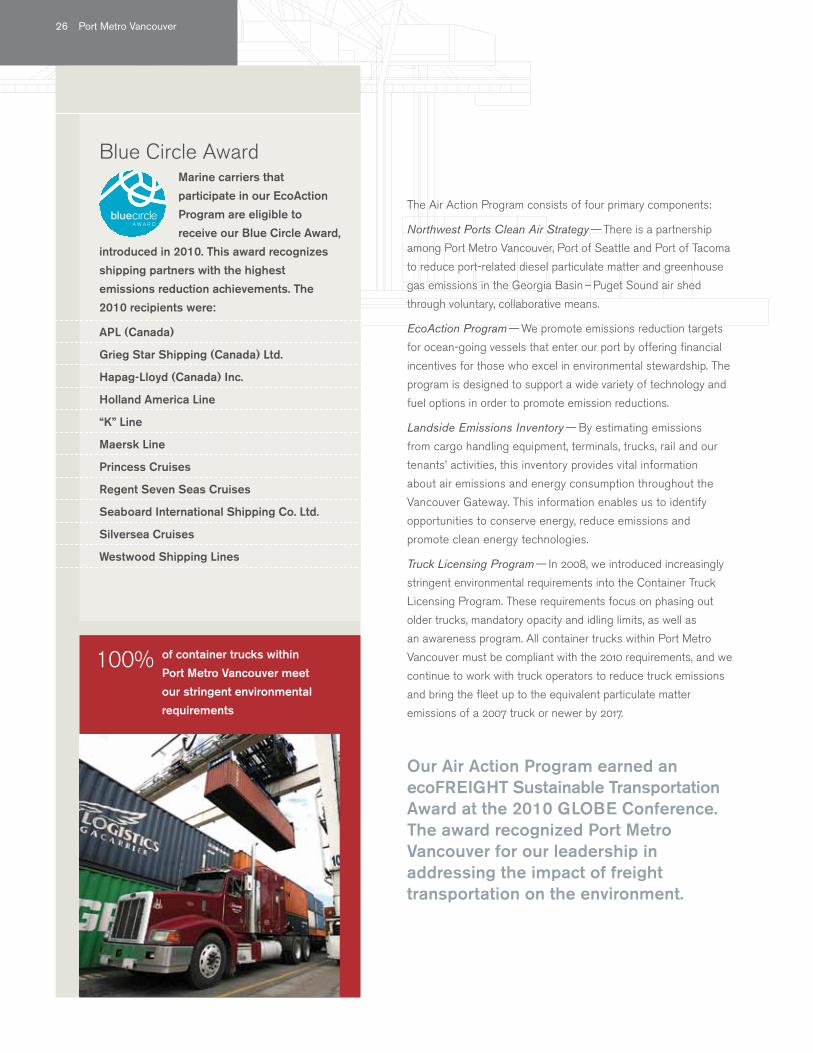
Blue Circle Award Marine carriers that
participate in our EcoAction
Program are eligible to
receive our Blue Circle Award,
introduced in 2010. This award recognizes
shipping partners with the highest
emissions reduction achievements. The
2010 recipients were:
APL (Canada)
Grieg Star Shipping (Canada) Ltd.
Hapag-Lloyd (Canada) Inc.
Holland America Line
“K” Line
Maersk Line
Princess Cruises
Regent Seven Seas Cruises
Seaboard International Shipping Co. Ltd.
Silversea Cruises
Westwood Shipping Lines
100%
Our Air Action Program earned an ecoFREIGHT Sustainable Transportation Award at the 2010 GLOBE Conference. The award recognized Port Metro Vancouver for our leadership in addressing the impact of freight transportation on the environment.
26 Port Metro Vancouver
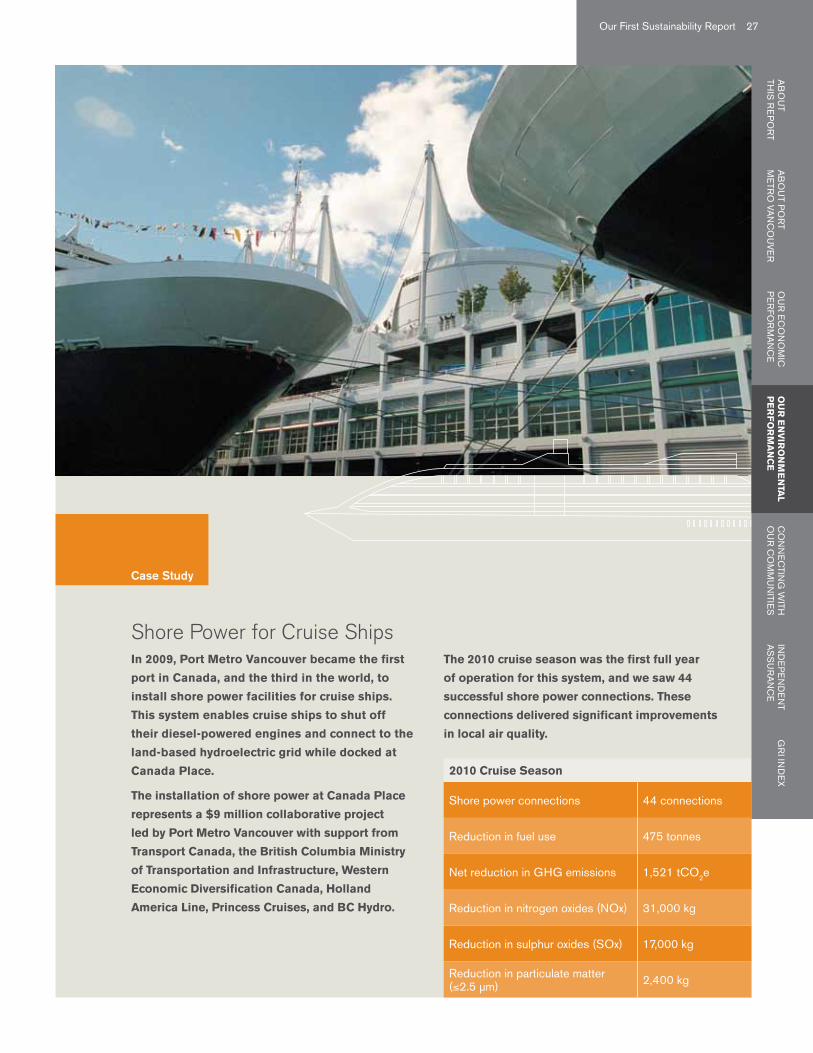
Shore power connections 44 connections
Reduction in fuel use 475 tonnes
Net reduction in GHG emissions 1,521 tCO2e
Reduction in nitrogen oxides (NOx) 31,000 kg
Reduction in sulphur oxides (SOx) 17,000 kg
Reduction in particulate matter (≤2.5 µm) 2,400 kg
2010 Cruise Season
In 2009, Port Metro Vancouver became the first
port in Canada, and the third in the world, to
install shore power facilities for cruise ships.
This system enables cruise ships to shut off
their diesel-powered engines and connect to the
land-based hydroelectric grid while docked at
Canada Place.
The installation of shore power at Canada Place
represents a $9 million collaborative project
led by Port Metro Vancouver with support from
Transport Canada, the British Columbia Ministry
of Transportation and Infrastructure, Western
Economic Diversification Canada, Holland
America Line, Princess Cruises, and BC Hydro.
The 2010 cruise season was the first full year
of operation for this system, and we saw 44
successful shore power connections. These
connections delivered significant improvements
in local air quality.
Shore Power for Cruise Ships
Case Study
Our First Sustainability Report 27G
RI In
de
xIN
DE
PE
ND
EN
TA
SS
UR
AN
CE
AB
OU
T TH
IS R
EP
OR
TA
BO
UT P
OR
T m
eTR
O VA
NC
OU
Ve
RO
UR
EC
ON
OM
IC
PE
RFO
RM
AN
CE
OU
R E
NV
IRO
NM
EN
TAL
PE
RF
OR
MA
NC
EC
ON
NE
CTIN
G W
ITH
OU
R C
OM
MU
NITIE
S
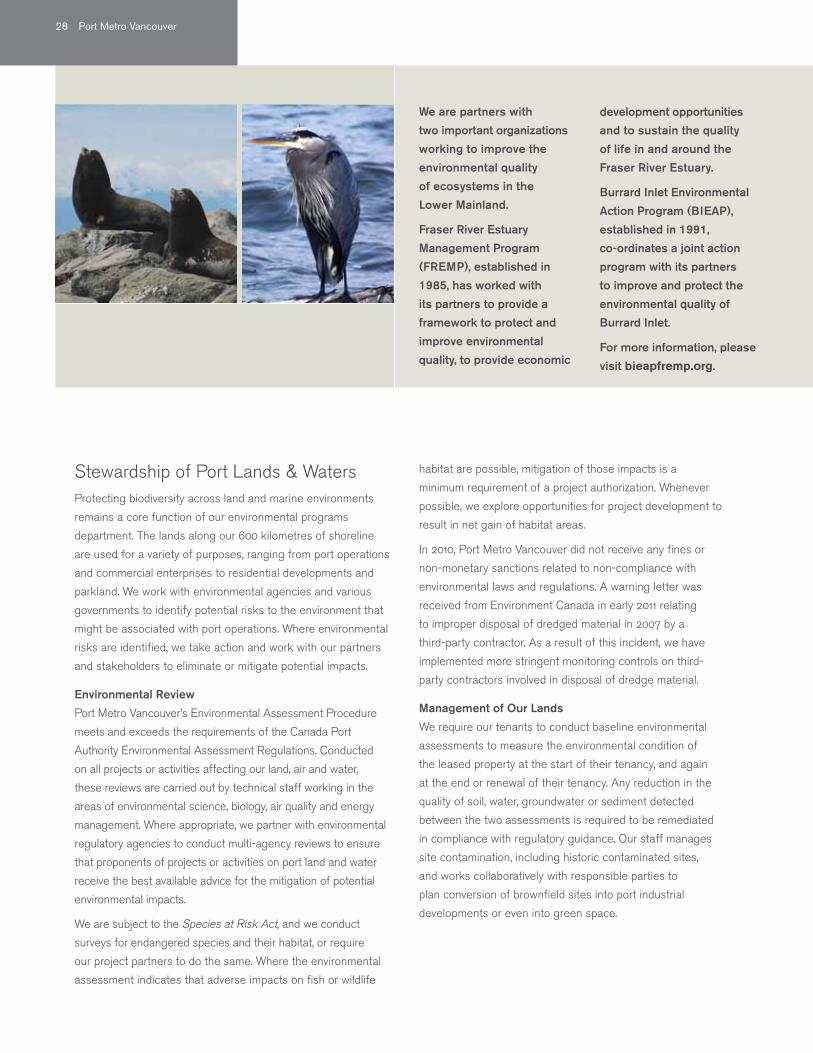
Stewardship of Port Lands & WatersProtecting biodiversity across land and marine environments
remains a core function of our environmental programs
department. The lands along our 600 kilometres of shoreline
are used for a variety of purposes, ranging from port operations
and commercial enterprises to residential developments and
parkland. We work with environmental agencies and various
governments to identify potential risks to the environment that
might be associated with port operations. Where environmental
risks are identified, we take action and work with our partners
and stakeholders to eliminate or mitigate potential impacts.
Environmental Review
Port Metro Vancouver’s Environmental Assessment Procedure
meets and exceeds the requirements of the Canada Port
Authority Environmental Assessment Regulations. Conducted
on all projects or activities affecting our land, air and water,
these reviews are carried out by technical staff working in the
areas of environmental science, biology, air quality and energy
management. Where appropriate, we partner with environmental
regulatory agencies to conduct multi-agency reviews to ensure
that proponents of projects or activities on port land and water
receive the best available advice for the mitigation of potential
environmental impacts.
We are subject to the Species at Risk Act, and we conduct
surveys for endangered species and their habitat, or require
our project partners to do the same. Where the environmental
assessment indicates that adverse impacts on fish or wildlife
habitat are possible, mitigation of those impacts is a
minimum requirement of a project authorization. Whenever
possible, we explore opportunities for project development to
result in net gain of habitat areas.
In 2010, Port Metro Vancouver did not receive any fines or
non-monetary sanctions related to non-compliance with
environmental laws and regulations. A warning letter was
received from Environment Canada in early 2011 relating
to improper disposal of dredged material in 2007 by a
third-party contractor. As a result of this incident, we have
implemented more stringent monitoring controls on third-
party contractors involved in disposal of dredge material.
Management of Our Lands
We require our tenants to conduct baseline environmental
assessments to measure the environmental condition of
the leased property at the start of their tenancy, and again
at the end or renewal of their tenancy. Any reduction in the
quality of soil, water, groundwater or sediment detected
between the two assessments is required to be remediated
in compliance with regulatory guidance. Our staff manages
site contamination, including historic contaminated sites,
and works collaboratively with responsible parties to
plan conversion of brownfield sites into port industrial
developments or even into green space.
We are partners with
two important organizations
working to improve the
environmental quality
of ecosystems in the
Lower Mainland.
Fraser River Estuary
Management Program
(FREMP), established in
1985, has worked with
its partners to provide a
framework to protect and
improve environmental
quality, to provide economic
development opportunities
and to sustain the quality
of life in and around the
Fraser River Estuary.
Burrard Inlet Environmental
Action Program (BIEAP),
established in 1991,
co-ordinates a joint action
program with its partners
to improve and protect the
environmental quality of
Burrard Inlet.
For more information, please
visit bieapfremp.org.
28 Port Metro Vancouver

The Deltaport Third Berth project expanded
container operations at the Deltaport
container terminal in Delta, BC (see page 19
for more details).
The project was subject to environmental
assessment under both federal and provincial
legislation. During this review, Environment
Canada raised concerns about the project’s
potential impact on the inter-causeway
ecosystem. Port Metro Vancouver developed an
Adaptive Management Strategy in conjunction
with Environment Canada to address these
concerns and provide advance warning of any
emerging ecosystem trends. We also established a
Scientific Advisory Committee to provide technical
advice and recommendations, and to review
quarterly and annual monitoring reports. Based on
the results of the first three years of monitoring, no
significant negative ecosystem trends have been
observed in the inter-causeway area as a result of
the Deltaport Third Berth project.
The Adaptive Management Strategy at Deltaport Third Berth
Case Study
Our First Sustainability Report 29G
RI In
de
xIN
DE
PE
ND
EN
TA
SS
UR
AN
CE
AB
OU
T TH
IS R
EP
OR
TA
BO
UT P
OR
T m
eTR
O VA
NC
OU
Ve
RO
UR
EC
ON
OM
IC
PE
RFO
RM
AN
CE
OU
R E
NV
IRO
NM
EN
TAL
PE
RF
OR
MA
NC
EC
ON
NE
CTIN
G W
ITH
OU
R C
OM
MU
NITIE
S
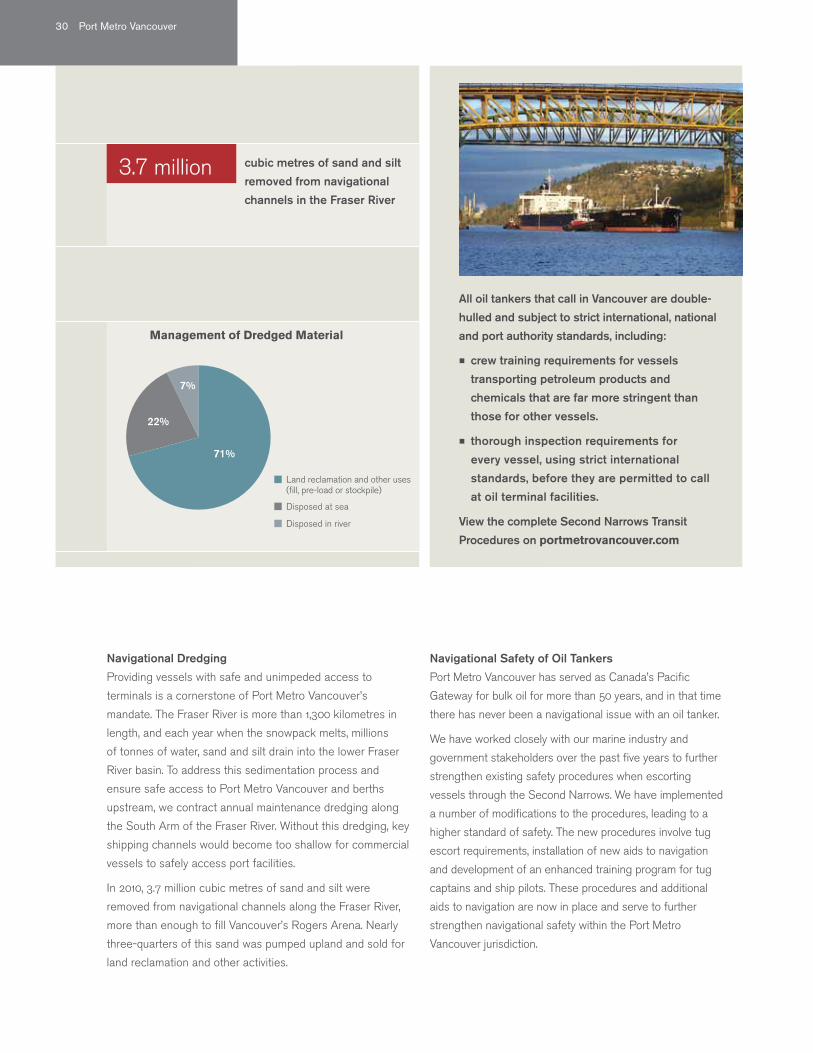
Management of Dredged Material
Land reclamation and other uses (fill, pre-load or stockpile)
Disposed at sea
Disposed in river
Navigational Dredging
Providing vessels with safe and unimpeded access to
terminals is a cornerstone of Port Metro Vancouver’s
mandate. The Fraser River is more than 1,300 kilometres in
length, and each year when the snowpack melts, millions
of tonnes of water, sand and silt drain into the lower Fraser
River basin. To address this sedimentation process and
ensure safe access to Port Metro Vancouver and berths
upstream, we contract annual maintenance dredging along
the South Arm of the Fraser River. Without this dredging, key
shipping channels would become too shallow for commercial
vessels to safely access port facilities.
In 2010, 3.7 million cubic metres of sand and silt were
removed from navigational channels along the Fraser River,
more than enough to fill Vancouver’s Rogers Arena. Nearly
three-quarters of this sand was pumped upland and sold for
land reclamation and other activities.
Navigational Safety of Oil Tankers
Port Metro Vancouver has served as Canada’s Pacific
Gateway for bulk oil for more than 50 years, and in that time
there has never been a navigational issue with an oil tanker.
We have worked closely with our marine industry and
government stakeholders over the past five years to further
strengthen existing safety procedures when escorting
vessels through the Second Narrows. We have implemented
a number of modifications to the procedures, leading to a
higher standard of safety. The new procedures involve tug
escort requirements, installation of new aids to navigation
and development of an enhanced training program for tug
captains and ship pilots. These procedures and additional
aids to navigation are now in place and serve to further
strengthen navigational safety within the Port Metro
Vancouver jurisdiction.
All oil tankers that call in Vancouver are double-
hulled and subject to strict international, national
and port authority standards, including:
≠ crew training requirements for vessels
transporting petroleum products and
chemicals that are far more stringent than
those for other vessels.
≠ thorough inspection requirements for
every vessel, using strict international
standards, before they are permitted to call
at oil terminal facilities.
View the complete Second Narrows Transit
Procedures on portmetrovancouver.com
cubic metres of sand and silt
removed from navigational
channels in the Fraser River
71%
22%
7%
3.7 million
30 Port Metro Vancouver
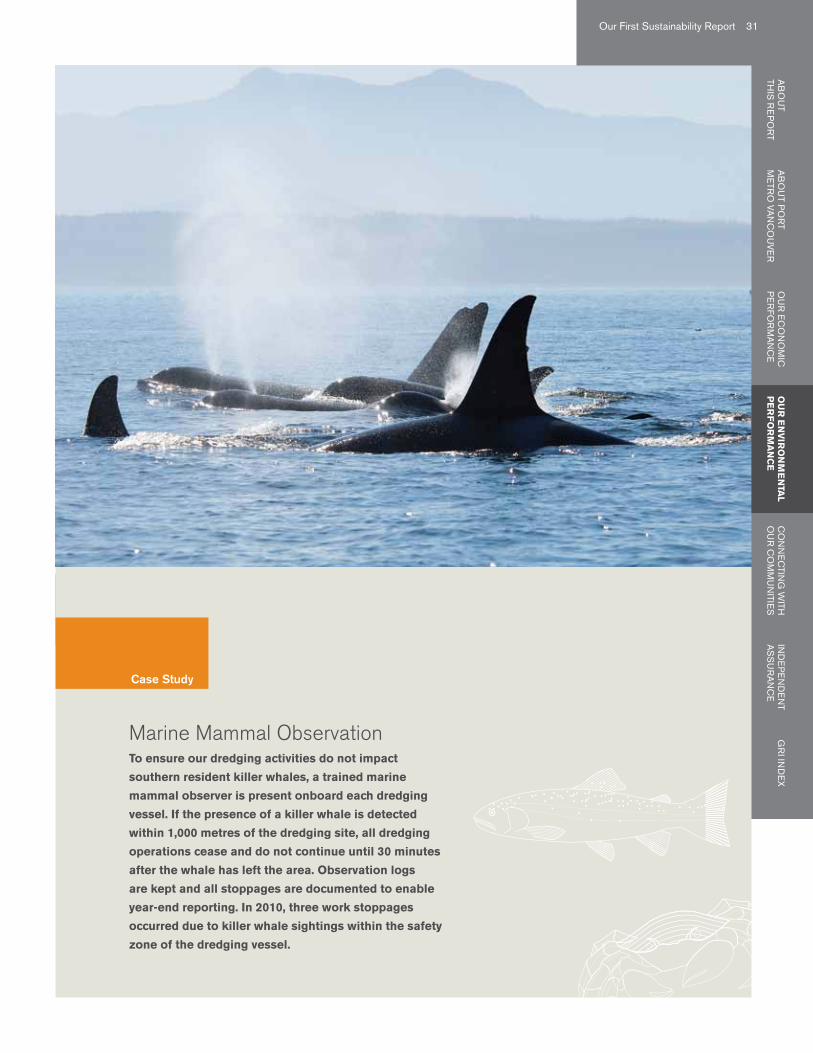
Marine Mammal ObservationTo ensure our dredging activities do not impact
southern resident killer whales, a trained marine
mammal observer is present onboard each dredging
vessel. If the presence of a killer whale is detected
within 1,000 metres of the dredging site, all dredging
operations cease and do not continue until 30 minutes
after the whale has left the area. Observation logs
are kept and all stoppages are documented to enable
year-end reporting. In 2010, three work stoppages
occurred due to killer whale sightings within the safety
zone of the dredging vessel.
Case Study
Our First Sustainability Report 31G
RI In
de
xIN
DE
PE
ND
EN
TA
SS
UR
AN
CE
AB
OU
T TH
IS R
EP
OR
TA
BO
UT P
OR
T m
eTR
O VA
NC
OU
Ve
RO
UR
EC
ON
OM
IC
PE
RFO
RM
AN
CE
OU
R E
NV
IRO
NM
EN
TAL
PE
RF
OR
MA
NC
EC
ON
NE
CTIN
G W
ITH
OU
R C
OM
MU
NITIE
S
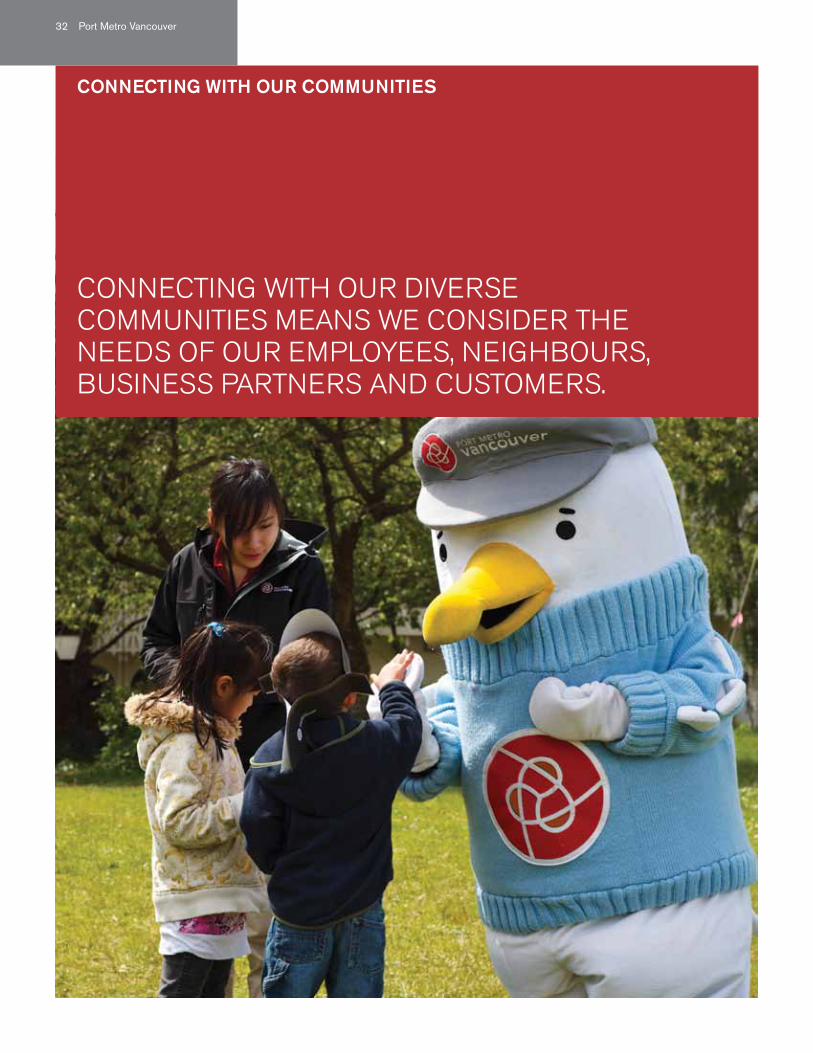
CONNECTING WITH OUR DIVERSE COMMUNITIES MEANS WE CONSIDER THE NEEDS OF OUR EMPLOYEES, NEIGHBOURS, BUSINESS PARTNERS AND CUSTOMERS.
CONNECTING WITH OUR COMMUNITIES
32 Port Metro Vancouver
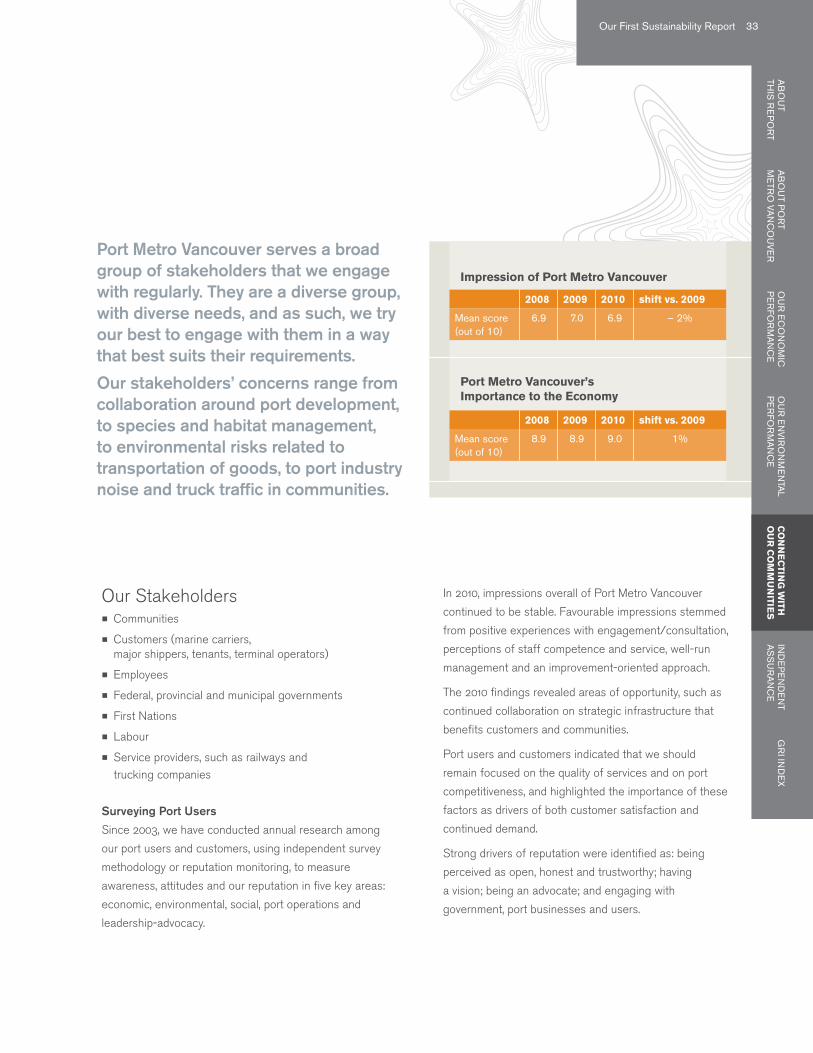
2008 2009 2010 shift vs. 2009
Mean score (out of 10)
6.9 7.0 6.9 – 2%
2008 2009 2010 shift vs. 2009
Mean score (out of 10)
8.9 8.9 9.0 1%
Impression of Port Metro Vancouver
Port Metro Vancouver’s Importance to the Economy
Port Metro Vancouver serves a broad group of stakeholders that we engage with regularly. They are a diverse group, with diverse needs, and as such, we try our best to engage with them in a way that best suits their requirements.
Our stakeholders’ concerns range from collaboration around port development, to species and habitat management, to environmental risks related to transportation of goods, to port industry noise and truck traffic in communities.
Our Stakeholders ≠ Communities
≠ Customers (marine carriers, major shippers, tenants, terminal operators)
≠ Employees
≠ Federal, provincial and municipal governments
≠ First Nations
≠ Labour
≠ Service providers, such as railways and trucking companies
Surveying Port Users
Since 2003, we have conducted annual research among
our port users and customers, using independent survey
methodology or reputation monitoring, to measure
awareness, attitudes and our reputation in five key areas:
economic, environmental, social, port operations and
leadership-advocacy.
In 2010, impressions overall of Port Metro Vancouver
continued to be stable. Favourable impressions stemmed
from positive experiences with engagement/consultation,
perceptions of staff competence and service, well-run
management and an improvement-oriented approach.
The 2010 findings revealed areas of opportunity, such as
continued collaboration on strategic infrastructure that
benefits customers and communities.
Port users and customers indicated that we should
remain focused on the quality of services and on port
competitiveness, and highlighted the importance of these
factors as drivers of both customer satisfaction and
continued demand.
Strong drivers of reputation were identified as: being
perceived as open, honest and trustworthy; having
a vision; being an advocate; and engaging with
government, port businesses and users.
Our First Sustainability Report 33G
RI In
de
xIN
DE
PE
ND
EN
TA
SS
UR
AN
CE
AB
OU
T TH
IS R
EP
OR
TA
BO
UT P
OR
T m
eTR
O VA
NC
OU
Ve
RO
UR
EC
ON
OM
IC
PE
RFO
RM
AN
CE
OU
R E
NV
IRO
NM
EN
TAL
PE
RFO
RM
AN
CE
CO
NN
EC
TING
WITH
O
UR
CO
MM
UN
ITIES
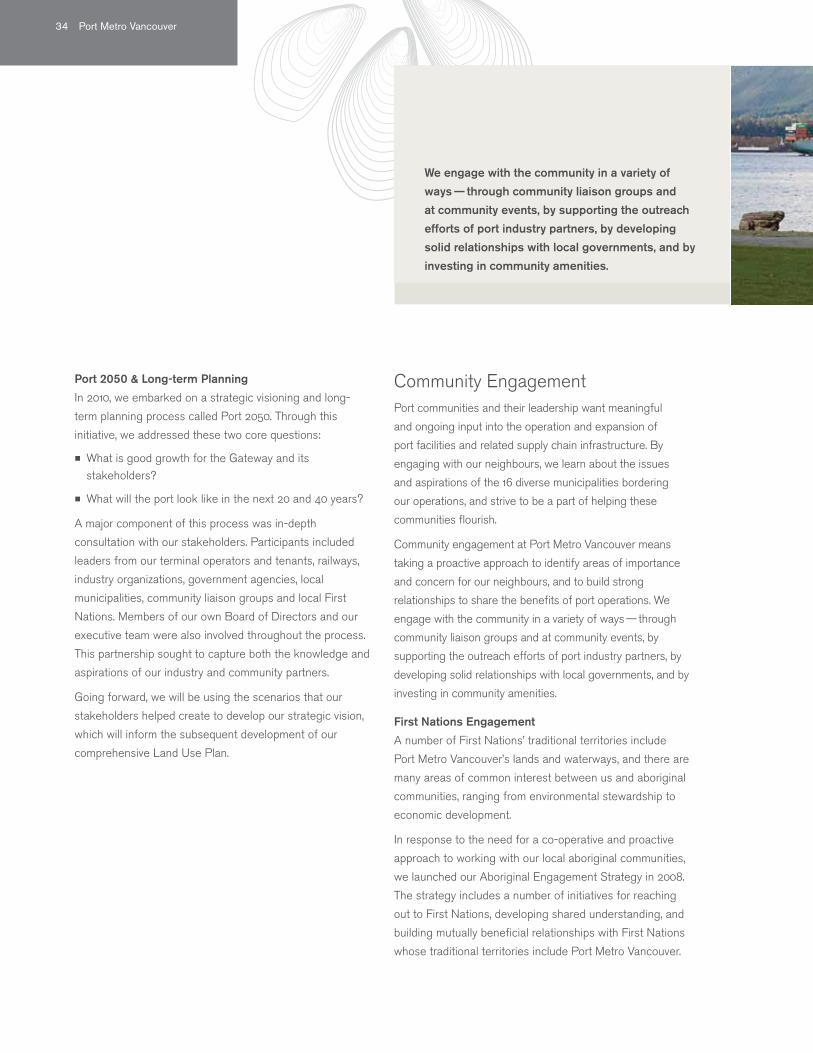
We engage with the community in a variety of
ways — through community liaison groups and
at community events, by supporting the outreach
efforts of port industry partners, by developing
solid relationships with local governments, and by
investing in community amenities.
Port 2050 & Long-term Planning
In 2010, we embarked on a strategic visioning and long-
term planning process called Port 2050. Through this
initiative, we addressed these two core questions:
≠ What is good growth for the Gateway and its stakeholders?
≠ What will the port look like in the next 20 and 40 years?
A major component of this process was in-depth
consultation with our stakeholders. Participants included
leaders from our terminal operators and tenants, railways,
industry organizations, government agencies, local
municipalities, community liaison groups and local First
Nations. Members of our own Board of Directors and our
executive team were also involved throughout the process.
This partnership sought to capture both the knowledge and
aspirations of our industry and community partners.
Going forward, we will be using the scenarios that our
stakeholders helped create to develop our strategic vision,
which will inform the subsequent development of our
comprehensive Land Use Plan.
Community EngagementPort communities and their leadership want meaningful
and ongoing input into the operation and expansion of
port facilities and related supply chain infrastructure. By
engaging with our neighbours, we learn about the issues
and aspirations of the 16 diverse municipalities bordering
our operations, and strive to be a part of helping these
communities flourish.
Community engagement at Port Metro Vancouver means
taking a proactive approach to identify areas of importance
and concern for our neighbours, and to build strong
relationships to share the benefits of port operations. We
engage with the community in a variety of ways — through
community liaison groups and at community events, by
supporting the outreach efforts of port industry partners, by
developing solid relationships with local governments, and by
investing in community amenities.
First Nations Engagement
A number of First Nations’ traditional territories include
Port Metro Vancouver’s lands and waterways, and there are
many areas of common interest between us and aboriginal
communities, ranging from environmental stewardship to
economic development.
In response to the need for a co-operative and proactive
approach to working with our local aboriginal communities,
we launched our Aboriginal Engagement Strategy in 2008.
The strategy includes a number of initiatives for reaching
out to First Nations, developing shared understanding, and
building mutually beneficial relationships with First Nations
whose traditional territories include Port Metro Vancouver.
34 Port Metro Vancouver
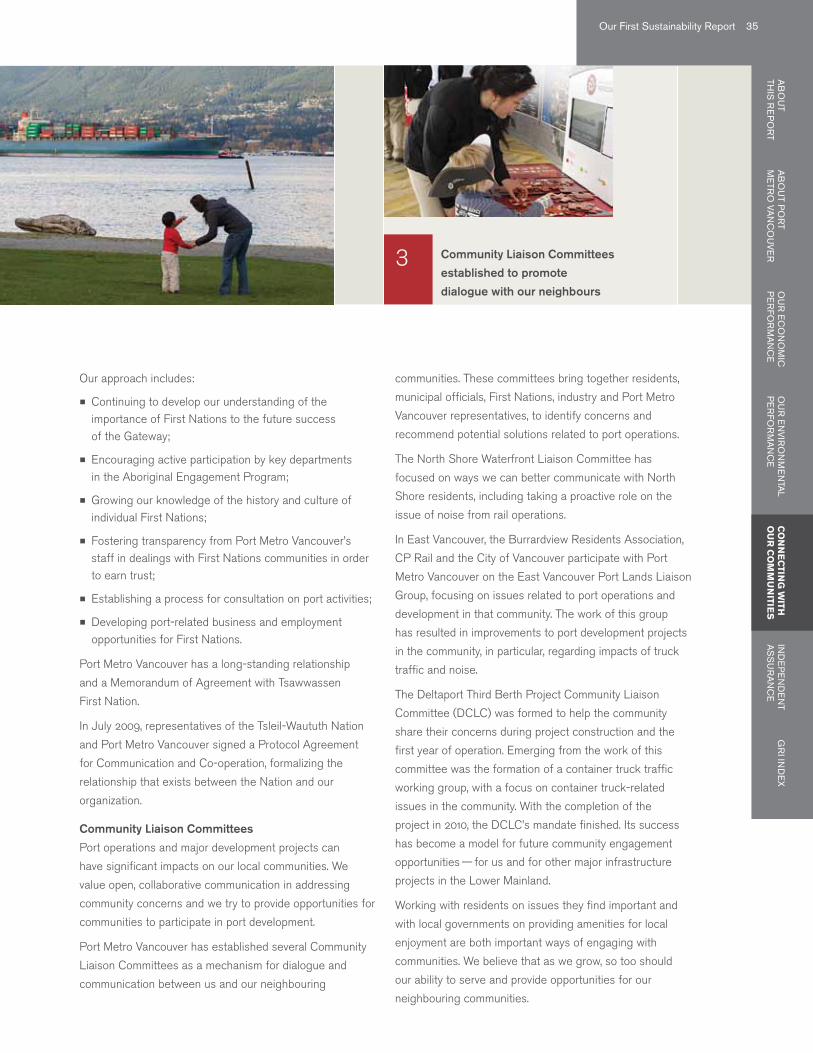
communities. These committees bring together residents,
municipal officials, First Nations, industry and Port Metro
Vancouver representatives, to identify concerns and
recommend potential solutions related to port operations.
The North Shore Waterfront Liaison Committee has
focused on ways we can better communicate with North
Shore residents, including taking a proactive role on the
issue of noise from rail operations.
In East Vancouver, the Burrardview Residents Association,
CP Rail and the City of Vancouver participate with Port
Metro Vancouver on the East Vancouver Port Lands Liaison
Group, focusing on issues related to port operations and
development in that community. The work of this group
has resulted in improvements to port development projects
in the community, in particular, regarding impacts of truck
traffic and noise.
The Deltaport Third Berth Project Community Liaison
Committee (DCLC) was formed to help the community
share their concerns during project construction and the
first year of operation. Emerging from the work of this
committee was the formation of a container truck traffic
working group, with a focus on container truck-related
issues in the community. With the completion of the
project in 2010, the DCLC’s mandate finished. Its success
has become a model for future community engagement
opportunities — for us and for other major infrastructure
projects in the Lower Mainland.
Working with residents on issues they find important and
with local governments on providing amenities for local
enjoyment are both important ways of engaging with
communities. We believe that as we grow, so too should
our ability to serve and provide opportunities for our
neighbouring communities.
Community Liaison Committees
established to promote
dialogue with our neighbours
3
Our approach includes:
≠ Continuing to develop our understanding of the importance of First Nations to the future success of the Gateway;
≠ Encouraging active participation by key departments in the Aboriginal Engagement Program;
≠ Growing our knowledge of the history and culture of individual First Nations;
≠ Fostering transparency from Port Metro Vancouver’s staff in dealings with First Nations communities in order to earn trust;
≠ Establishing a process for consultation on port activities;
≠ Developing port-related business and employment opportunities for First Nations.
Port Metro Vancouver has a long-standing relationship
and a Memorandum of Agreement with Tsawwassen
First Nation.
In July 2009, representatives of the Tsleil-Waututh Nation
and Port Metro Vancouver signed a Protocol Agreement
for Communication and Co-operation, formalizing the
relationship that exists between the Nation and our
organization.
Community Liaison Committees
Port operations and major development projects can
have significant impacts on our local communities. We
value open, collaborative communication in addressing
community concerns and we try to provide opportunities for
communities to participate in port development.
Port Metro Vancouver has established several Community
Liaison Committees as a mechanism for dialogue and
communication between us and our neighbouring
Our First Sustainability Report 35G
RI In
de
xIN
DE
PE
ND
EN
TA
SS
UR
AN
CE
AB
OU
T TH
IS R
EP
OR
TA
BO
UT P
OR
T m
eTR
O VA
NC
OU
Ve
RO
UR
EC
ON
OM
IC
PE
RFO
RM
AN
CE
OU
R E
NV
IRO
NM
EN
TAL
PE
RFO
RM
AN
CE
CO
NN
EC
TING
WITH
O
UR
CO
MM
UN
ITIES
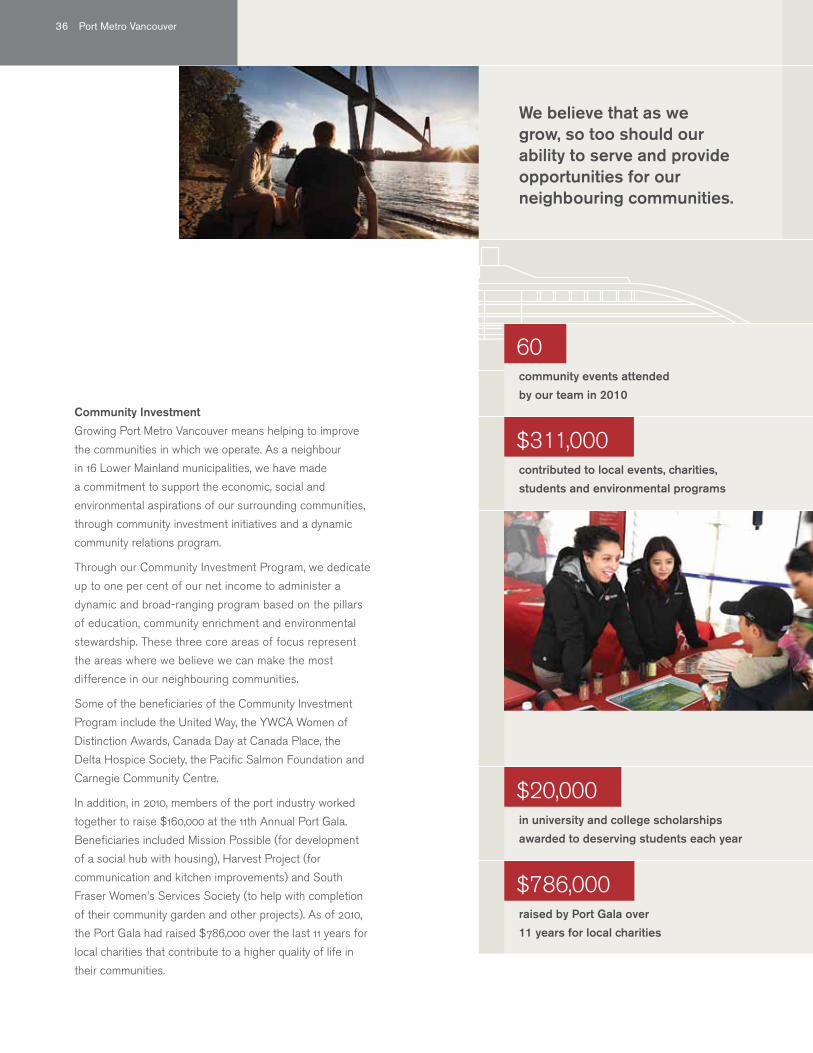
Community Investment
Growing Port Metro Vancouver means helping to improve
the communities in which we operate. As a neighbour
in 16 Lower Mainland municipalities, we have made
a commitment to support the economic, social and
environmental aspirations of our surrounding communities,
through community investment initiatives and a dynamic
community relations program.
Through our Community Investment Program, we dedicate
up to one per cent of our net income to administer a
dynamic and broad-ranging program based on the pillars
of education, community enrichment and environmental
stewardship. These three core areas of focus represent
the areas where we believe we can make the most
difference in our neighbouring communities.
Some of the beneficiaries of the Community Investment
Program include the United Way, the YWCA Women of
Distinction Awards, Canada Day at Canada Place, the
Delta Hospice Society, the Pacific Salmon Foundation and
Carnegie Community Centre.
In addition, in 2010, members of the port industry worked
together to raise $160,000 at the 11th Annual Port Gala.
Beneficiaries included Mission Possible (for development
of a social hub with housing), Harvest Project (for
communication and kitchen improvements) and South
Fraser Women’s Services Society (to help with completion
of their community garden and other projects). As of 2010,
the Port Gala had raised $786,000 over the last 11 years for
local charities that contribute to a higher quality of life in
their communities.
community events attended
by our team in 2010
in university and college scholarships
awarded to deserving students each year
raised by Port Gala over
11 years for local charities
contributed to local events, charities,
students and environmental programs
We believe that as we grow, so too should our ability to serve and provide opportunities for our neighbouring communities.
60
$311,000
$20,000
$786,000
36 Port Metro Vancouver
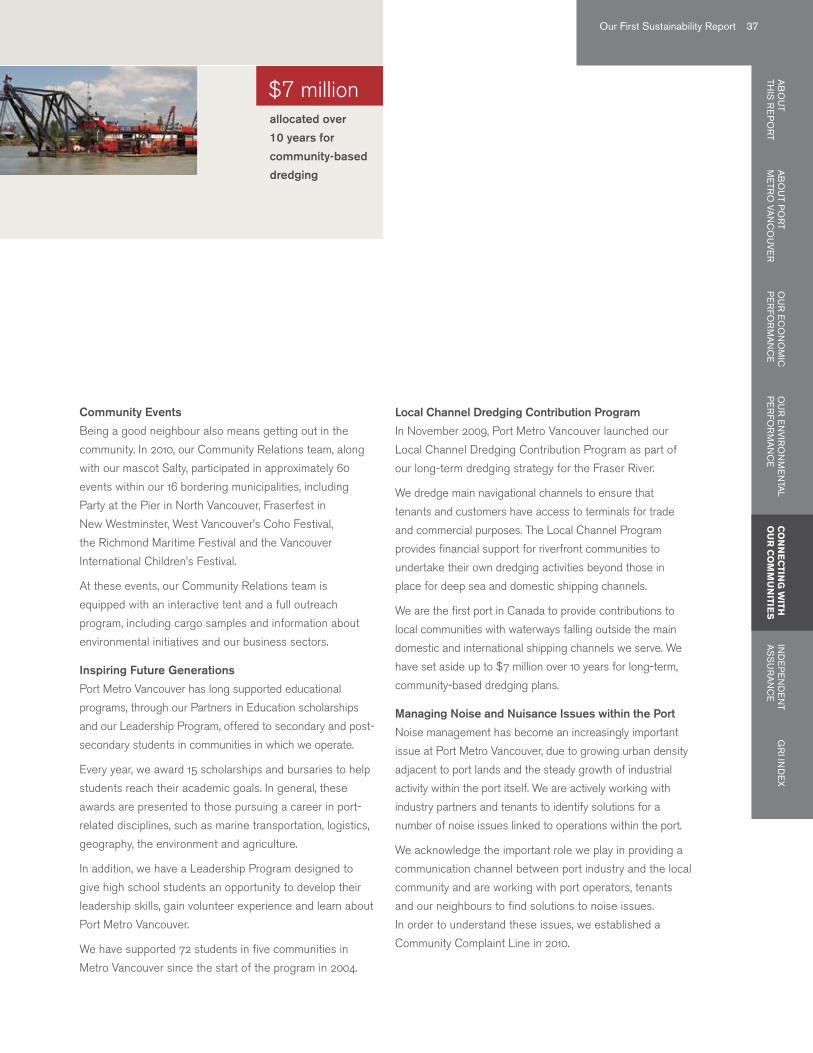
Community Events
Being a good neighbour also means getting out in the
community. In 2010, our Community Relations team, along
with our mascot Salty, participated in approximately 60
events within our 16 bordering municipalities, including
Party at the Pier in North Vancouver, Fraserfest in
New Westminster, West Vancouver’s Coho Festival,
the Richmond Maritime Festival and the Vancouver
International Children’s Festival.
At these events, our Community Relations team is
equipped with an interactive tent and a full outreach
program, including cargo samples and information about
environmental initiatives and our business sectors.
Inspiring Future Generations
Port Metro Vancouver has long supported educational
programs, through our Partners in Education scholarships
and our Leadership Program, offered to secondary and post-
secondary students in communities in which we operate.
Every year, we award 15 scholarships and bursaries to help
students reach their academic goals. In general, these
awards are presented to those pursuing a career in port-
related disciplines, such as marine transportation, logistics,
geography, the environment and agriculture.
In addition, we have a Leadership Program designed to
give high school students an opportunity to develop their
leadership skills, gain volunteer experience and learn about
Port Metro Vancouver.
We have supported 72 students in five communities in
Metro Vancouver since the start of the program in 2004.
Local Channel Dredging Contribution Program
In November 2009, Port Metro Vancouver launched our
Local Channel Dredging Contribution Program as part of
our long-term dredging strategy for the Fraser River.
We dredge main navigational channels to ensure that
tenants and customers have access to terminals for trade
and commercial purposes. The Local Channel Program
provides financial support for riverfront communities to
undertake their own dredging activities beyond those in
place for deep sea and domestic shipping channels.
We are the first port in Canada to provide contributions to
local communities with waterways falling outside the main
domestic and international shipping channels we serve. We
have set aside up to $7 million over 10 years for long-term,
community-based dredging plans.
Managing Noise and Nuisance Issues within the Port
Noise management has become an increasingly important
issue at Port Metro Vancouver, due to growing urban density
adjacent to port lands and the steady growth of industrial
activity within the port itself. We are actively working with
industry partners and tenants to identify solutions for a
number of noise issues linked to operations within the port.
We acknowledge the important role we play in providing a
communication channel between port industry and the local
community and are working with port operators, tenants
and our neighbours to find solutions to noise issues.
In order to understand these issues, we established a
Community Complaint Line in 2010.
allocated over
10 years for
community-based
dredging
$7 million
Our First Sustainability Report 37G
RI In
de
xIN
DE
PE
ND
EN
TA
SS
UR
AN
CE
AB
OU
T TH
IS R
EP
OR
TA
BO
UT P
OR
T m
eTR
O VA
NC
OU
Ve
RO
UR
EC
ON
OM
IC
PE
RFO
RM
AN
CE
OU
R E
NV
IRO
NM
EN
TAL
PE
RFO
RM
AN
CE
CO
NN
EC
TING
WITH
O
UR
CO
MM
UN
ITIES
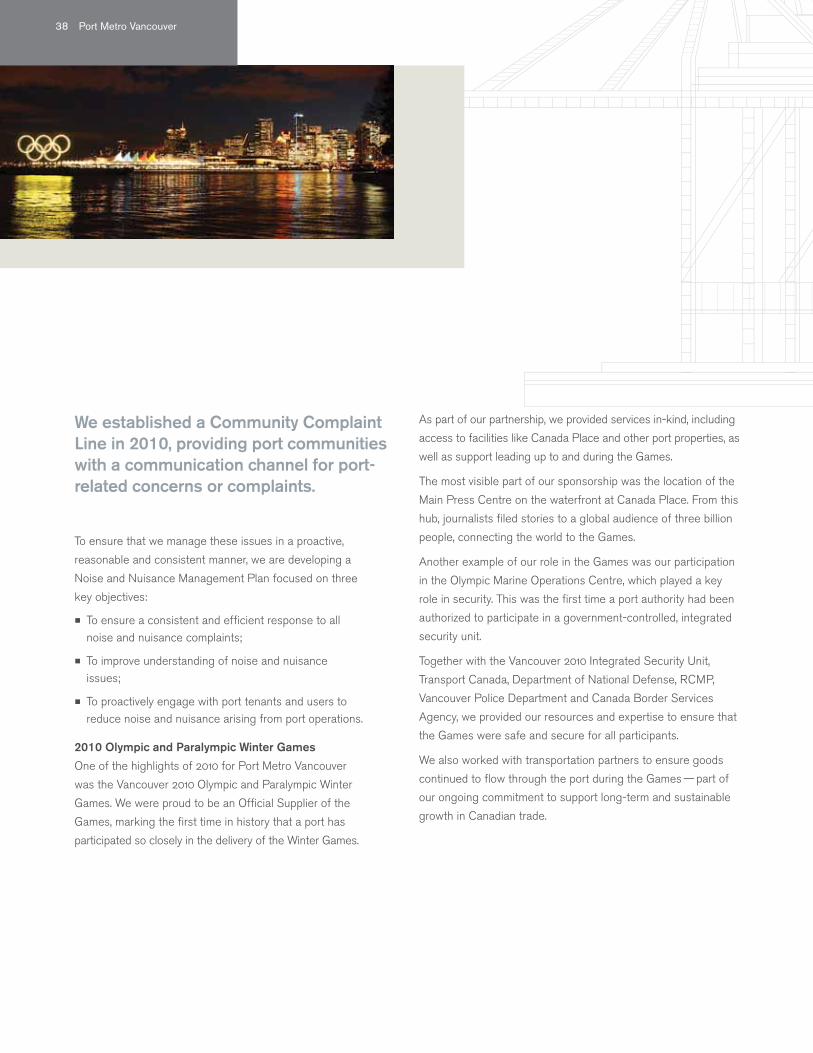
To ensure that we manage these issues in a proactive,
reasonable and consistent manner, we are developing a
Noise and Nuisance Management Plan focused on three
key objectives:
≠ To ensure a consistent and efficient response to all noise and nuisance complaints;
≠ To improve understanding of noise and nuisance issues;
≠ To proactively engage with port tenants and users to reduce noise and nuisance arising from port operations.
2010 Olympic and Paralympic Winter Games
One of the highlights of 2010 for Port Metro Vancouver
was the Vancouver 2010 Olympic and Paralympic Winter
Games. We were proud to be an Official Supplier of the
Games, marking the first time in history that a port has
participated so closely in the delivery of the Winter Games.
As part of our partnership, we provided services in-kind, including
access to facilities like Canada Place and other port properties, as
well as support leading up to and during the Games.
The most visible part of our sponsorship was the location of the
Main Press Centre on the waterfront at Canada Place. From this
hub, journalists filed stories to a global audience of three billion
people, connecting the world to the Games.
Another example of our role in the Games was our participation
in the Olympic Marine Operations Centre, which played a key
role in security. This was the first time a port authority had been
authorized to participate in a government-controlled, integrated
security unit.
Together with the Vancouver 2010 Integrated Security Unit,
Transport Canada, Department of National Defense, RCMP,
Vancouver Police Department and Canada Border Services
Agency, we provided our resources and expertise to ensure that
the Games were safe and secure for all participants.
We also worked with transportation partners to ensure goods
continued to flow through the port during the Games — part of
our ongoing commitment to support long-term and sustainable
growth in Canadian trade.
We established a Community Complaint Line in 2010, providing port communities with a communication channel for port-related concerns or complaints.
38 Port Metro Vancouver
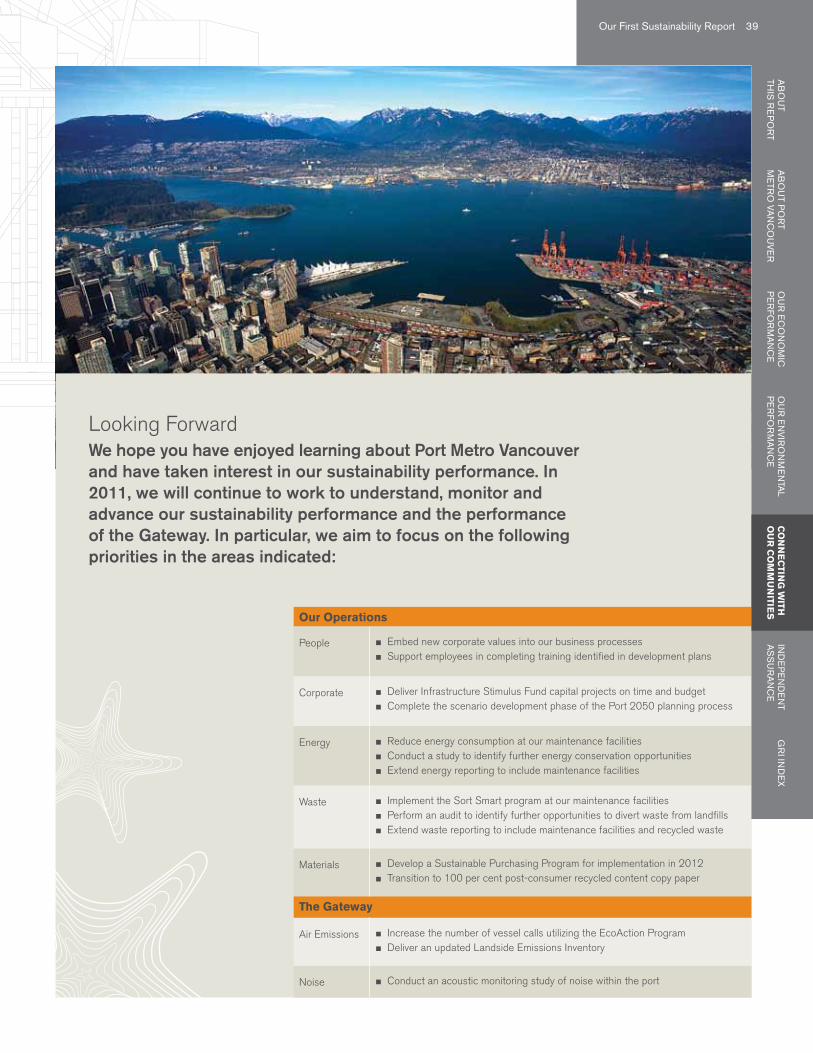
Our Operations
People ≠ Embed new corporate values into our business processes ≠ Support employees in completing training identified in development plans
Corporate ≠ Deliver Infrastructure Stimulus Fund capital projects on time and budget ≠ Complete the scenario development phase of the Port 2050 planning process
Energy ≠ Reduce energy consumption at our maintenance facilities ≠ Conduct a study to identify further energy conservation opportunities ≠ Extend energy reporting to include maintenance facilities
Waste ≠ Implement the Sort Smart program at our maintenance facilities ≠ Perform an audit to identify further opportunities to divert waste from landfills ≠ Extend waste reporting to include maintenance facilities and recycled waste
Materials ≠ Develop a Sustainable Purchasing Program for implementation in 2012 ≠ Transition to 100 per cent post-consumer recycled content copy paper
The Gateway
Air Emissions ≠ Increase the number of vessel calls utilizing the EcoAction Program ≠ Deliver an updated Landside Emissions Inventory
Noise ≠ Conduct an acoustic monitoring study of noise within the port
Looking ForwardWe hope you have enjoyed learning about Port Metro Vancouver and have taken interest in our sustainability performance. In 2011, we will continue to work to understand, monitor and advance our sustainability performance and the performance of the Gateway. In particular, we aim to focus on the following priorities in the areas indicated:
Our First Sustainability Report 39G
RI In
de
xIN
DE
PE
ND
EN
TA
SS
UR
AN
CE
AB
OU
T TH
IS R
EP
OR
TA
BO
UT P
OR
T m
eTR
O VA
NC
OU
Ve
RO
UR
EC
ON
OM
IC
PE
RFO
RM
AN
CE
OU
R E
NV
IRO
NM
EN
TAL
PE
RFO
RM
AN
CE
CO
NN
EC
TING
WITH
O
UR
CO
MM
UN
ITIES
Independent assurance statement
To the Board Members and Management
of Port Metro Vancouver,
Our Responsibilities
Our assurance engagement has been planned and
performed in accordance with the International Standard
on Assurance Engagements ISAE 3000 Assurance
Engagements other than Audits or Reviews of Historical
Financial Information, the Canadian Institute of Chartered
Accountants Handbook Section 5025 (“CICA HB Section
5025”), standard for assurance engagements and ISO
14064-Part 3 Specification with guidance for the validation
and verification of greenhouse gas assertions.
Scope of our Engagement
We have carried out a combined ‘reasonable’ and ‘limited’
assurance engagement over specified performance
information appearing in Port Metro Vancouver’s (“PMV”)
2010 Sustainability Report (the “Report”) for the period
January 1, 2010 to December 31, 2010 prepared by PMV
management. The scope of our engagement, as agreed
with management, is as follows:
≠ To obtain a limited level of assurance on the fair presentation of the specified performance information, as identified in Attachment A to this statement and to express an opinion thereon.
≠ To obtain a reasonable level of assurance on the fair presentation of PMV’s 2010 greenhouse gas assertions for the following specified performance information as presented in the Report and to express an opinion thereon:
— Total direct and indirect greenhouse gas (“GHG”) emissions by weight (EN16 and EN17)
— PMV’s carbon neutral assertion
≠ To obtain a limited level of assurance that PMV’s Report has achieved the Application Level of B+ in accordance with the Application Level Criteria set out in the GRI G3 Guidelines.
Criteria
The Specified Performance Information and the greenhouse
gas assertions have been prepared and reported in
accordance with the GRI G3 Guidelines or where relevant,
internally developed criteria as disclosed in the Report.
PMV Board’s and Management’s Responsibilities
The Report was prepared by management of PMV, who
is responsible for the collection and presentation of the
specified performance information, statements, and claims
in the Report, and the criteria used in determining that the
information is appropriate for the purpose of disclosure in
the Report. In addition, management is responsible for the
identification of stakeholders, determination of material
issues and definition of targets and commitments with
respect to performance information.
Management is also responsible for maintaining adequate
records and internal controls that are designed to support
the reporting process.
The Board is responsible for the integrity of non-financial
reporting, and for reviewing and approving the Report
format and content.
There are currently no prescribed requirements
relating to the preparation, publication and verification
of sustainability reports.
Work we Performed
In order for us to provide conclusions in relation to the
above scope of work, we have sought to answer the
following questions for the three selected subject matters:
Specified Performance Information ≠ Has PMV provided fair representation of their Specified Performance Information and greenhouse gas assertions, with respect to the organizational boundaries and time period defined in the Report?
≠ Has PMV accurately collated corporate data relating to the Specified Performance Information and greenhouse gas assertions?
≠ Are the data for the Specified Performance Information and greenhouse gas assertions accurate and sufficiently detailed for stakeholders to assess PMV’s performance?
40 Port Metro Vancouver
Assurance Procedures
Our assurance procedures at PMV for concluding on the specified
performance information included, but were not limited to:
≠ Interviewing selected personnel, including the GRI Reporting Team to understand the reporting process
≠ Interviewing selected personnel to understand the materiality assessment process and identify key sustainability issues
≠ Interviewing personnel responsible for the specified performance information and understanding processes for the collection and reporting
≠ Where relevant, performing walkthroughs of systems and processes for data aggregation and reporting
≠ Verifying the accuracy of calculations performed
≠ Verifying that data and statements had been correctly transcribed from corporate systems and/or supporting evidence into the Report
≠ Verifying key assumptions and the evidence to support the assumptions
≠ Re-performance of a sample of the GHG emissions calculations to assess the correct calculation of emissions based on the source data and emissions factors selected
≠ Review of receipts and records for carbon offset purchase
Limitations
Our scope of work did not include providing conclusions in relation to:
≠ The completeness or accuracy of information relating to areas other than the specified performance information
≠ Information reported by PMV other than in its Report, such as information contained on its website
≠ Management’s forward-looking statements
≠ Any comparisons made by PMV against historical data
≠ The appropriateness of definitions for internally developed criteria applied to indicators other than the specified performance
information.
Our Conclusions
Subject to the limitations noted above and on the basis of
our procedures for this assurance engagement, we provide
the following conclusions:
Specified Performance Information
Nothing has come to our attention that causes us to believe
that the specified performance information is not, in all
material respects, in accordance with the GRI G3 Guidelines
or with the criteria internally developed by management.
Greenhouse Gas Assertion
In our opinion, the Report presents fairly, in all material
respects, the greenhouse gas and carbon neutral assertions
for the year ended December 31, 2010 in accordance with
GRI G3 Guidelines or with the criteria internally developed by
management.
Application Level
Nothing has come to our attention that causes us to believe
that the Report does not, in all material respects, achieve
the application level B+ in accordance with the GRI G3
Guidelines.
Independence, Competence and Experience
All professional personnel involved in this engagement meet
the independence requirements in accordance with the
ethical requirements of ISAE 3000 and CICA HB Section
5025. Our team has been drawn from our Climate Change
and Sustainability Services Practice and has the required
competencies and experience to perform this engagement.
Vancouver, Canada
6 june 2011
Our First Sustainability Report 41G
RI In
de
xIN
DE
PE
ND
EN
TA
SS
UR
AN
CE
AB
OU
T TH
IS R
EP
OR
TA
BO
UT P
OR
T m
eTR
O VA
NC
OU
Ve
RO
UR
EC
ON
OM
IC
PE
RFO
RM
AN
CE
OU
R E
NV
IRO
NM
EN
TAL
PE
RFO
RM
AN
CE
CO
NN
EC
TING
WITH
O
UR
CO
MM
UN
ITIES
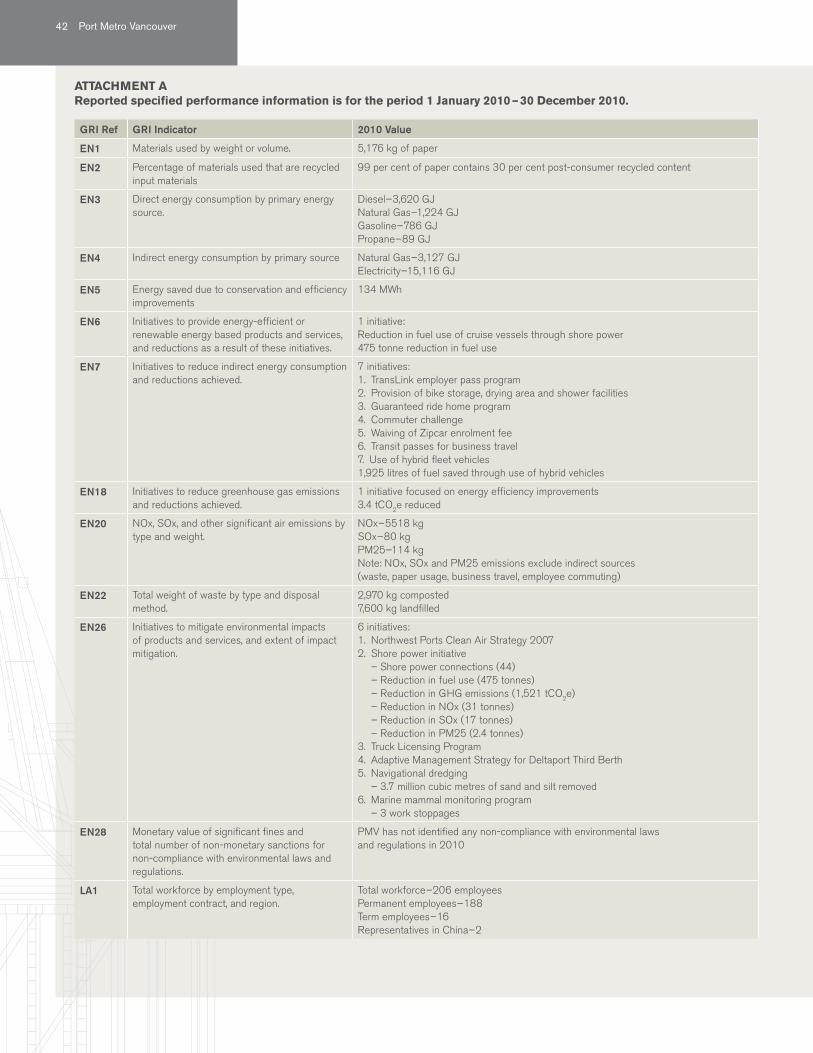
GRI Ref GRI Indicator 2010 Value
EN1 Materials used by weight or volume. 5,176 kg of paper
EN2 Percentage of materials used that are recycled input materials
99 per cent of paper contains 30 per cent post-consumer recycled content
EN3 Direct energy consumption by primary energy source.
Diesel – 3,620 GjNatural Gas –1,224 GjGasoline – 786 GjPropane – 89 Gj
EN4 Indirect energy consumption by primary source Natural Gas – 3,127 Gj Electricity –15,116 Gj
EN5 Energy saved due to conservation and efficiency improvements
134 MWh
EN6 Initiatives to provide energy-efficient or renewable energy based products and services, and reductions as a result of these initiatives.
1 initiative:Reduction in fuel use of cruise vessels through shore power475 tonne reduction in fuel use
EN7 Initiatives to reduce indirect energy consumption and reductions achieved.
7 initiatives:1. TransLink employer pass program2. Provision of bike storage, drying area and shower facilities3. Guaranteed ride home program4. Commuter challenge5. Waiving of zipcar enrolment fee 6. Transit passes for business travel7. Use of hybrid fleet vehicles1,925 litres of fuel saved through use of hybrid vehicles
EN18 Initiatives to reduce greenhouse gas emissions and reductions achieved.
1 initiative focused on energy efficiency improvements3.4 tCO2e reduced
EN20 NOx, SOx, and other significant air emissions by type and weight.
NOx – 5518 kg SOx – 80 kgPM25 –114 kgNote: NOx, SOx and PM25 emissions exclude indirect sources (waste, paper usage, business travel, employee commuting)
EN22 Total weight of waste by type and disposal method.
2,970 kg composted7,600 kg landfilled
EN26 Initiatives to mitigate environmental impacts of products and services, and extent of impact mitigation.
6 initiatives:1. Northwest Ports Clean Air Strategy 20072. Shore power initiative
– Shore power connections (44)– Reduction in fuel use (475 tonnes)– Reduction in GHG emissions (1,521 tCO2e)– Reduction in NOx (31 tonnes)– Reduction in SOx (17 tonnes)– Reduction in PM25 (2.4 tonnes)
3. Truck Licensing Program4. Adaptive Management Strategy for Deltaport Third Berth 5. Navigational dredging
– 3.7 million cubic metres of sand and silt removed6. Marine mammal monitoring program
– 3 work stoppages
EN28 Monetary value of significant fines and total number of non-monetary sanctions for non-compliance with environmental laws and regulations.
PMV has not identified any non-compliance with environmental laws and regulations in 2010
LA1 Total workforce by employment type, employment contract, and region.
Total workforce – 206 employeesPermanent employees – 188 Term employees – 16 Representatives in China – 2
ATTACHMENT AReported specified performance information is for the period 1 January 2010 – 30 December 2010.
42 Port Metro Vancouver
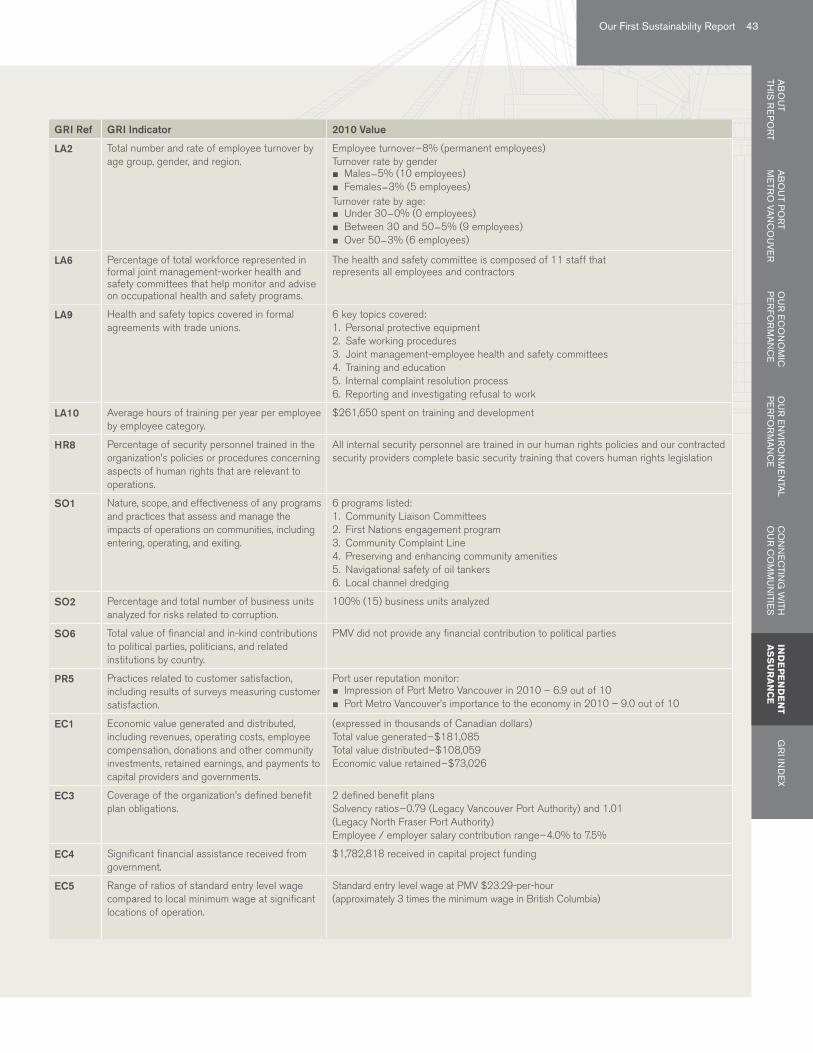
GRI Ref GRI Indicator 2010 Value
LA2 Total number and rate of employee turnover by age group, gender, and region.
Employee turnover – 8% (permanent employees) Turnover rate by gender
≠ Males – 5% (10 employees) ≠ Females – 3% (5 employees)
Turnover rate by age: ≠ Under 30 – 0% (0 employees) ≠ Between 30 and 50 – 5% (9 employees) ≠ Over 50 – 3% (6 employees)
LA6 Percentage of total workforce represented in formal joint management-worker health and safety committees that help monitor and advise on occupational health and safety programs.
The health and safety committee is composed of 11 staff that represents all employees and contractors
LA9 Health and safety topics covered in formal agreements with trade unions.
6 key topics covered:1. Personal protective equipment2. Safe working procedures3. joint management-employee health and safety committees4. Training and education5. Internal complaint resolution process 6. Reporting and investigating refusal to work
LA10 Average hours of training per year per employee by employee category.
$261,650 spent on training and development
HR8 Percentage of security personnel trained in the organization’s policies or procedures concerning aspects of human rights that are relevant to operations.
All internal security personnel are trained in our human rights policies and our contracted security providers complete basic security training that covers human rights legislation
SO1 Nature, scope, and effectiveness of any programs and practices that assess and manage the impacts of operations on communities, including entering, operating, and exiting.
6 programs listed:1. Community Liaison Committees2. First Nations engagement program3. Community Complaint Line 4. Preserving and enhancing community amenities5. Navigational safety of oil tankers 6. Local channel dredging
SO2 Percentage and total number of business units analyzed for risks related to corruption.
100% (15) business units analyzed
SO6 Total value of financial and in-kind contributions to political parties, politicians, and related institutions by country.
PMV did not provide any financial contribution to political parties
PR5 Practices related to customer satisfaction, including results of surveys measuring customer satisfaction.
Port user reputation monitor: ≠ Impression of Port Metro Vancouver in 2010 – 6.9 out of 10 ≠ Port Metro Vancouver’s importance to the economy in 2010 – 9.0 out of 10
EC1 Economic value generated and distributed, including revenues, operating costs, employee compensation, donations and other community investments, retained earnings, and payments to capital providers and governments.
(expressed in thousands of Canadian dollars)Total value generated – $181,085Total value distributed – $108,059 Economic value retained – $73,026
EC3 Coverage of the organization’s defined benefit plan obligations.
2 defined benefit plansSolvency ratios – 0.79 (Legacy Vancouver Port Authority) and 1.01 (Legacy North Fraser Port Authority)Employee / employer salary contribution range – 4.0% to 7.5%
EC4 Significant financial assistance received from government.
$1,782,818 received in capital project funding
EC5 Range of ratios of standard entry level wage compared to local minimum wage at significant locations of operation.
Standard entry level wage at PMV $23.29-per-hour (approximately 3 times the minimum wage in British Columbia)
Our First Sustainability Report 43G
RI In
de
xIN
DE
PE
ND
EN
TA
SS
UR
AN
CE
AB
OU
T TH
IS R
EP
OR
TA
BO
UT P
OR
T m
eTR
O VA
NC
OU
Ve
RO
UR
EC
ON
OM
IC
PE
RFO
RM
AN
CE
OU
R E
NV
IRO
NM
EN
TAL
PE
RFO
RM
AN
CE
CO
NN
EC
TING
WITH
O
UR
CO
MM
UN
ITIES
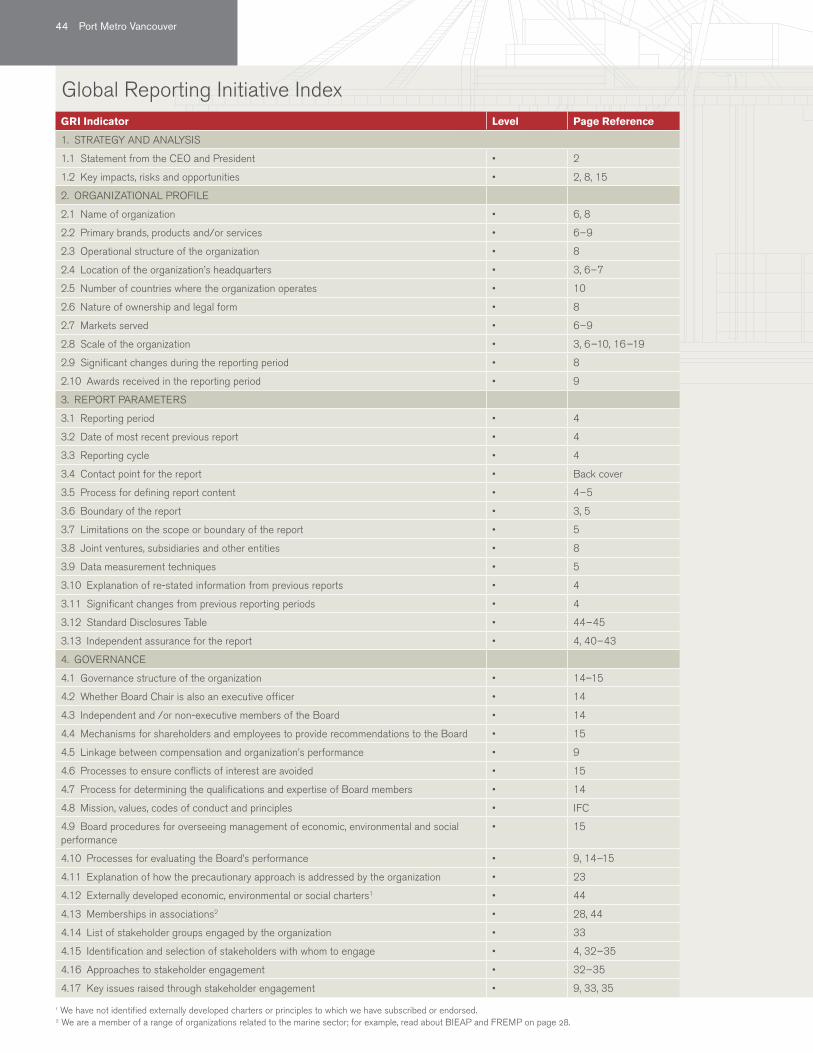
GRI Indicator Level Page Reference
1. STRATEGY AND ANALYSIS
1.1 Statement from the CEO and President • 2
1.2 Key impacts, risks and opportunities • 2, 8, 15
2. ORGANIzATIONAL PROFILE
2.1 Name of organization • 6, 8
2.2 Primary brands, products and/or services • 6 – 9
2.3 Operational structure of the organization • 8
2.4 Location of the organization’s headquarters • 3, 6 – 7
2.5 Number of countries where the organization operates • 10
2.6 Nature of ownership and legal form • 8
2.7 Markets served • 6 – 9
2.8 Scale of the organization • 3, 6 –10, 16 –19
2.9 Significant changes during the reporting period • 8
2.10 Awards received in the reporting period • 9
3. REPORT PARAMETERS
3.1 Reporting period • 4
3.2 Date of most recent previous report • 4
3.3 Reporting cycle • 4
3.4 Contact point for the report • Back cover
3.5 Process for defining report content • 4 – 5
3.6 Boundary of the report • 3, 5
3.7 Limitations on the scope or boundary of the report • 5
3.8 joint ventures, subsidiaries and other entities • 8
3.9 Data measurement techniques • 5
3.10 Explanation of re-stated information from previous reports • 4
3.11 Significant changes from previous reporting periods • 4
3.12 Standard Disclosures Table • 44 – 45
3.13 Independent assurance for the report • 4, 40 – 43
4. GOVERNANCE
4.1 Governance structure of the organization • 14–15
4.2 Whether Board Chair is also an executive officer • 14
4.3 Independent and /or non-executive members of the Board • 14
4.4 Mechanisms for shareholders and employees to provide recommendations to the Board • 15
4.5 Linkage between compensation and organization’s performance • 9
4.6 Processes to ensure conflicts of interest are avoided • 15
4.7 Process for determining the qualifications and expertise of Board members • 14
4.8 Mission, values, codes of conduct and principles • IFC
4.9 Board procedures for overseeing management of economic, environmental and social performance
• 15
4.10 Processes for evaluating the Board’s performance • 9, 14 –15
4.11 Explanation of how the precautionary approach is addressed by the organization • 23
4.12 Externally developed economic, environmental or social charters1 • 44
4.13 Memberships in associations2 • 28, 44
4.14 List of stakeholder groups engaged by the organization • 33
4.15 Identification and selection of stakeholders with whom to engage • 4, 32 – 35
4.16 Approaches to stakeholder engagement • 32 – 35
4.17 Key issues raised through stakeholder engagement • 9, 33, 35
1 We have not identified externally developed charters or principles to which we have subscribed or endorsed.2 We are a member of a range of organizations related to the marine sector; for example, read about BIEAP and FREMP on page 28.
Global Reporting Initiative Index
44 Port Metro Vancouver

Key
AR Annual ReportIFC Inside Front Cover IBC Inside Back Cover
Level of reporting
• Fullyreportedo Partially reportedN/A Not applicable
GRI Indicator Level Page Reference
ECONOMIC PERFORMANCE INDICATORS
Management Approach • 8 – 9, 17 – 21
EC1 Direct economic value generated and distributed • 17
EC3 Coverage of defined benefit plan obligations o 17
EC4 Financial assistance received from government • 8, 19
EC5 Ratio of standard entry level wage compared to local minimum wage • 11
ENVIRONMENTAL PERFORMANCE INDICATORS
Management Approach • 22 – 31
EN1 Materials used by weight or volume o 24
EN2 Percentage of materials used that are recycled input materials • 24
EN3 Direct energy consumption by primary energy source • 23
EN4 Indirect energy consumption by primary energy source • 23
EN5 Energy saved due to conservation and efficiency improvements • 23
EN6 Initiatives to provide energy-efficient or renewable energy based products and services • 27
EN7 Initiatives to reduce indirect energy consumption and reductions achieved • 23 – 24
EN16 Total direct and indirect greenhouse gas emissions • 25
EN17 Other relevant indirect greenhouse gas emissions • 25
EN18 Initiatives to reduce greenhouse gas emissions and reductions achieved • 23 – 25
EN20 NO, SO and other significant air emissions • 25
EN22 Total weight of waste by type and disposal method • 24
EN26 Initiatives to mitigate environmental impacts of products and services • 25 – 31
EN28 Monetary value of significant fines and total number of non-monetary sanctions for non-compliance with environmental laws and regulations
• 28
LABOUR PRACTICES AND DECENT WORK PERFORMANCE INDICATORS
Management Approach • 10 –13
LA1 Total workforce • 10
LA2 Employee turnover • 10
LA6 Workforce represented in formal health and safety committees • 13
LA9 Health safety topics covered in formal agreements with trade unions • 13
LA10 Average hours of training for employees o 12
HUMAN RIGHTS PERFORMANCE INDICATORS
Management Approach • 11
HR8 Security personnel trained in human rights procedures • 11
SOCIETY PERFORMANCE INDICATORS
Management Approach • 19, 28, 32 – 38
SO1 Programs and practices to assess and manage impacts of operations on communities • 26 – 31, 34 – 38
SO2 Business units analyzed for corruption risks • 15
SO6 Financial and in-kind contributions to political parties, politicians, and related institutions o 19
PRODUCT RESPONSIBILITY PERFORMANCE INDICATORS
Management Approach • 28 – 31, 33
PR5 Practices related to customer satisfaction • 33
Our First Sustainability Report 45G
RI In
de
xIN
DE
PE
ND
EN
TA
SS
UR
AN
CE
AB
OU
T TH
IS R
EP
OR
TA
BO
UT P
OR
T m
eTR
O VA
NC
OU
Ve
RO
UR
EC
ON
OM
IC
PE
RFO
RM
AN
CE
OU
R E
NV
IRO
NM
EN
TAL
PE
RFO
RM
AN
CE
CO
NN
EC
TING
WITH
O
UR
CO
MM
UN
ITIES
We would like to hear from youTo provide your comments and feedback on
our 2010 Sustainability Report and our ongoing
sustainability efforts, please contact:
Ronan Chester
Manager, Strategic Environmental Initiatives
Port Metro Vancouver
100 The Pointe, 999 Canada Place
Vancouver, BC, Canada V6C 3T4
Telephone: 604.665.9000
Fax: 1.866.284.4271
Email: [email protected]
Twitter: @PortMetroVan
Web: portmetrovancouver.com
Design: signals.ca Printing: metprinters.com
FPO
For our first Sustainability Report, we elected to print a limited number
of paper copies to distribute to our key stakeholders. We plan on
publishing future reports in web-format only. We are proud to support
sustainable forestry practices and responsible paper consumption
through selection of Forest Stewardship Council (FSC)® certified,
100% post-consumer, process chlorine-free paper. The following
summary outlines the environmental benefits associated with the paper
we selected for this report. Calculations are based on 100 copies or
31.75 kg of paper. For more information on FSC visit, fsccanada.org.
1 tree preserved for the future
1,078 litres wastewater flow saved
14.5 kilograms solid waste not generated
28 kilograms net greenhouse gases prevented
467,000 BTUs energy not consumed