Embed Size (px)
Citation preview
2010 Sustainability Report
Table of ContentsFrom Our Chairman 1
Our Sustainability Management Structure 2
Dialogue with Stakeholders 3
Ethical Business Conduct 5
Product Stewardship
REACH Implementation 6
Responsible Care® 6
Shrinking Customers’ Environmental Footprint 7
Economic Sustainability 10
Environmental Sustainability 14
Social Sustainability 20
United Nations Global Compact and CEO Water Mandate
Communications on Progress 30
Global Reporting Initiative (GRI) Content Index 31
Nalco Safety, Health, Environment and Sustainability Principles 32
About Nalco
Nalco Company (NYSE: NLC) is the world’s largest sustainability services company focused on industrial water, energy and air applications — delivering significant environmental, social and economic performance benefits to our customers. Our programs and services are used in water treatment applications to prevent corrosion, contamination and the buildup of harmful deposits. They are used in production processes to enhance process efficiency, extend asset life, improve our customers' end products, and enhance air quality. We help customers reduce energy, water and other natural resource consumption, enhance air quality, minimize environmental releases and improve productivity and end products while boosting the bottom line. Together our comprehensive solutions contribute to the sustainable development of customer operations. We report on three business segments: Water Services—serves the global water treatment and process chemistry needs of a variety of
industries including aerospace, chemical, pharmaceutical, steel, power, food and beverage, medium and light manufacturing as well as institutions such as hospitals, universities and hotels.
Paper Services—serves the process chemistry and water treatment needs of the global pulp and paper industry.
Energy Services—serves the process chemistry and water treatment needs of the global petroleum and petrochemical industries in both upstream and downstream applications.
For more information visit www.nalco.com. Follow us on Twitter at www.twitter.com/Nalco_News and www.twitter.com/NalcoCompany.
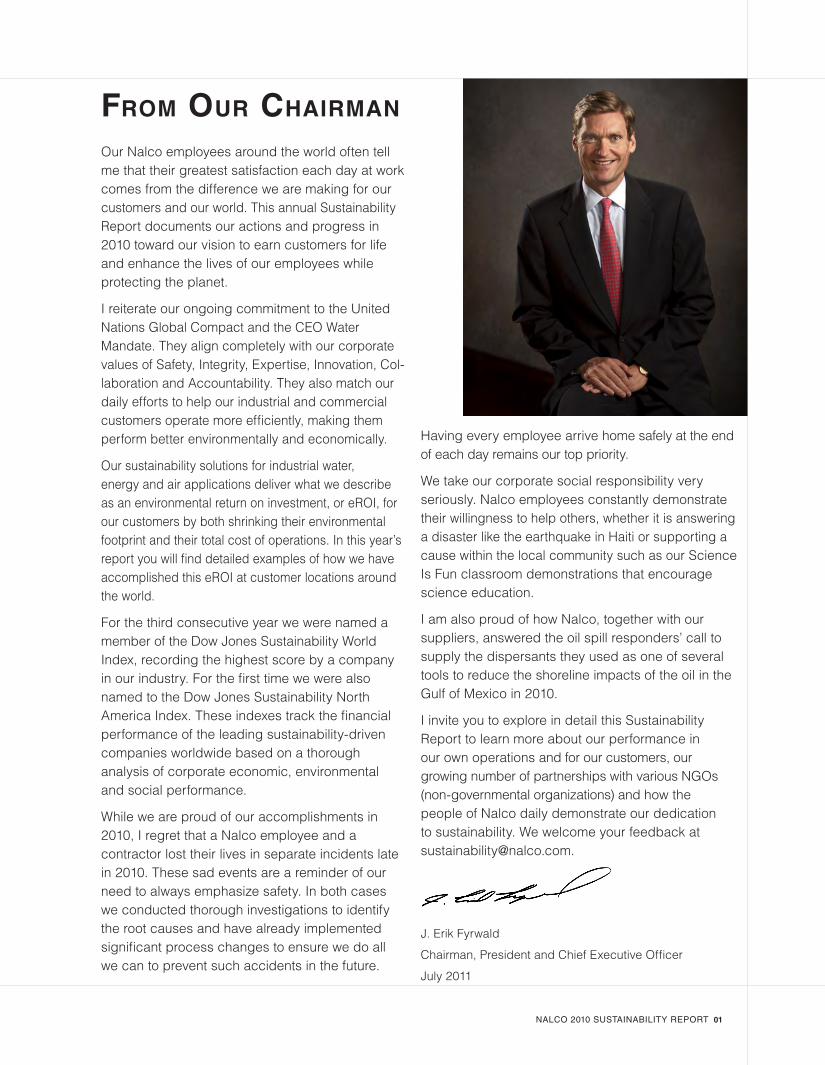
From our Chairman
Our Nalco employees around the world often tell me that their greatest satisfaction each day at work comes from the difference we are making for our customers and our world. This annual Sustainability Report documents our actions and progress in 2010 toward our vision to earn customers for life and enhance the lives of our employees while protecting the planet.
I reiterate our ongoing commitment to the United Nations Global Compact and the CEO Water Mandate. They align completely with our corporate values of Safety, Integrity, Expertise, Innovation, Col-laboration and Accountability. They also match our daily efforts to help our industrial and commercial customers operate more efficiently, making them perform better environmentally and economically.
Our sustainability solutions for industrial water, energy and air applications deliver what we describe as an environmental return on investment, or eROI, for our customers by both shrinking their environmental footprint and their total cost of operations. In this year’s report you will find detailed examples of how we have accomplished this eROI at customer locations around the world.
For the third consecutive year we were named a member of the Dow Jones Sustainability World Index, recording the highest score by a company in our industry. For the first time we were also named to the Dow Jones Sustainability North America Index. These indexes track the financial performance of the leading sustainability-driven companies worldwide based on a thorough analysis of corporate economic, environmental and social performance.
While we are proud of our accomplishments in 2010, I regret that a Nalco employee and a contractor lost their lives in separate incidents late in 2010. These sad events are a reminder of our need to always emphasize safety. In both cases we conducted thorough investigations to identify the root causes and have already implemented significant process changes to ensure we do all we can to prevent such accidents in the future.
NALCO 2010 SUSTAINABILITY REPORT 01
Having every employee arrive home safely at the end of each day remains our top priority.
We take our corporate social responsibility very seriously. Nalco employees constantly demonstrate their willingness to help others, whether it is answering a disaster like the earthquake in Haiti or supporting a cause within the local community such as our Science Is Fun classroom demonstrations that encourage science education.
I am also proud of how Nalco, together with our suppliers, answered the oil spill responders’ call to supply the dispersants they used as one of several tools to reduce the shoreline impacts of the oil in the Gulf of Mexico in 2010.
I invite you to explore in detail this Sustainability Report to learn more about our performance in our own operations and for our customers, our growing number of partnerships with various NGOs (non-governmental organizations) and how the people of Nalco daily demonstrate our dedication to sustainability. We welcome your feedback at [email protected].
J. Erik Fyrwald
Chairman, President and Chief Executive Officer
July 2011
02 NALCO 2010 SUSTAINABILITY REPORT
Our Sustainability Management Structure
Nalco’s dedication to sustainability is built into our
organization and starts at the top. Annually our
Chairman and Chief Executive Officer, Erik Fyrwald,
reviews our Safety, Health, Environment and
Sustainability Principles, makes any refinements and
re-signs them as a demonstration of that continuing
commitment. The current version of those principles
can be found on page 32 of this report.
Other than Mr. Fyrwald, our Board of Directors is
composed entirely of members who are independent
of the company and who provide Nalco with a
combination of industry, corporate management and
financial experience along with other skills. Together
with our overall corporate governance structure and
policies, this strikes an appropriate balance between
strong and consistent leadership and independent
oversight of our business and affairs. The global
governance rating agency Governance Metrics
International has given Nalco an overall global
corporate governance rating of 9 (well above
average) and a home market rating of 8.5 (above
average) on a scale of 1 to 10.
Our Board has four standing committees, including a
Safety, Health and Environment (SHE) Committee.
Information on the membership of these committees
and the charters under which these panels operate can
be found on our website at www.nalco.com/governance.
The SHE Committee monitors the company’s compli-
ance with safety, health and environmental laws and
regulations. It also oversees and reviews SHE policies
and ensures Nalco continuously earns the trust and
confidence of employees, customers, shareholders,
neighboring communities and other stakeholders.
The SHE Committee met four times in 2010, regularly
reviewing our safety dashboard of strategic safety KPIs
(key performance indicators) and other SHE issues.
The Committee’s review of two fatalities in 2010
(one a Nalco contractor in India, the second a Nalco
customer delivery specialist in the United States)
focused on analyzing root causes and further enhancing
our safety culture. More details on the specific actions
being taken can be found in the Social Sustainability
section of this report on page 20.
SHE Committee efforts to enhance safety training
for newly hired employees led to the development of
a new onboarding safety training CD. This new tool
includes competency tests and allows results to be
uploaded to our learning management system for
tracking. The portability of the CD format allows for
easier, more consistent global implementation of this
preventative policy.
A Sustainability Steering Team (SST) reports to our
Chief Executive and the Executive Council of Nalco.
This multi-functional team identifies sustainability
trends and helps the company establish goals,
policies and procedures that support our corporate
mission of creating value for customers while helping
them save water and energy, enhance production,
improve air quality and reduce total cost of operations.
Our Director of Sustainability coordinates SST activities
and is responsible for developing the policies, strategy
and messages that create, deliver, document and
communicate the value of our sustainability solutions
for our customers and other stakeholders.
NALCO 2010 SUSTAINABILITY REPORT 03
Nalco is committed to interacting with all of its stakeholders in order to share perspectives, build mutually beneficial relationships and improve our performance as a company.
CommunitiesWe take our involvement in the communities in which we do business seriously. Our community outreach efforts involve local schools, business associations such as chambers of commerce and local emergency responders, among others. Several of our major locations in the United States (Carson, Clearing, Freeport, Garyville and Sugar Land) are active members of local Community Advisory Panels. Advisory panels provide regular, on-site meetings among industry and community representatives to discuss our operations and identify and respond to community concerns. Details about specific community involvement activities can be found under Social Sustainability on page 23).
CustomersHearing the direct voice of Nalco customers is an important factor in increasing loyalty and retaining their business. We conduct thousands of individual surveys annually looking at customer loyalty and customer feedback. These global surveys, administered in 17 different languages, provide a comprehensive study of all the touch points that our customers experience.
These survey results are analyzed and validated by an independent research firm with expertise in cus-tomer loyalty. Our sales engineers then share feed-back survey results with individual customers and
Dialogue with Stakeholdersmutually establish a plan to respond to any gaps and concerns. Our customer loyalty surveys identify key drivers across multiple customers that impact loyalty to Nalco. We analyze these drivers in combination with local environmental, economic and cultural issues to identify the best ways to respond, retain and grow with that customer. A sharper understand-ing of customer perceptions of these critical value drivers enables Nalco to continuously improve our offerings and services to better meet customer needs.
EmployeesThe talent, experience and abilities of our people are important components of the solutions Nalco provides to customers. Our employees are our essential expertise. In the fall of 2010 we conducted an initial sample of an employee engagement survey as part of the follow up to a global employee survey in 2009. Full, annual surveys are planned with the 2011 survey already underway. Results of these sur-veys are driving our latest employee improvement efforts including an even greater focus on employee training and development, leadership development and organizational structure changes to improve innovation, marketing and sales interactions.
Investors and AnalystsOur outreach efforts with our shareholders included more than 500 calls and meetings with investors and prospective investors during the year. In May of 2010 we held an Investor Day at our Naperville headquarters that was attended by more than 50 analysts and investors with more than 100 more listening to the event webcast on our website (www.nalco.com/investors).
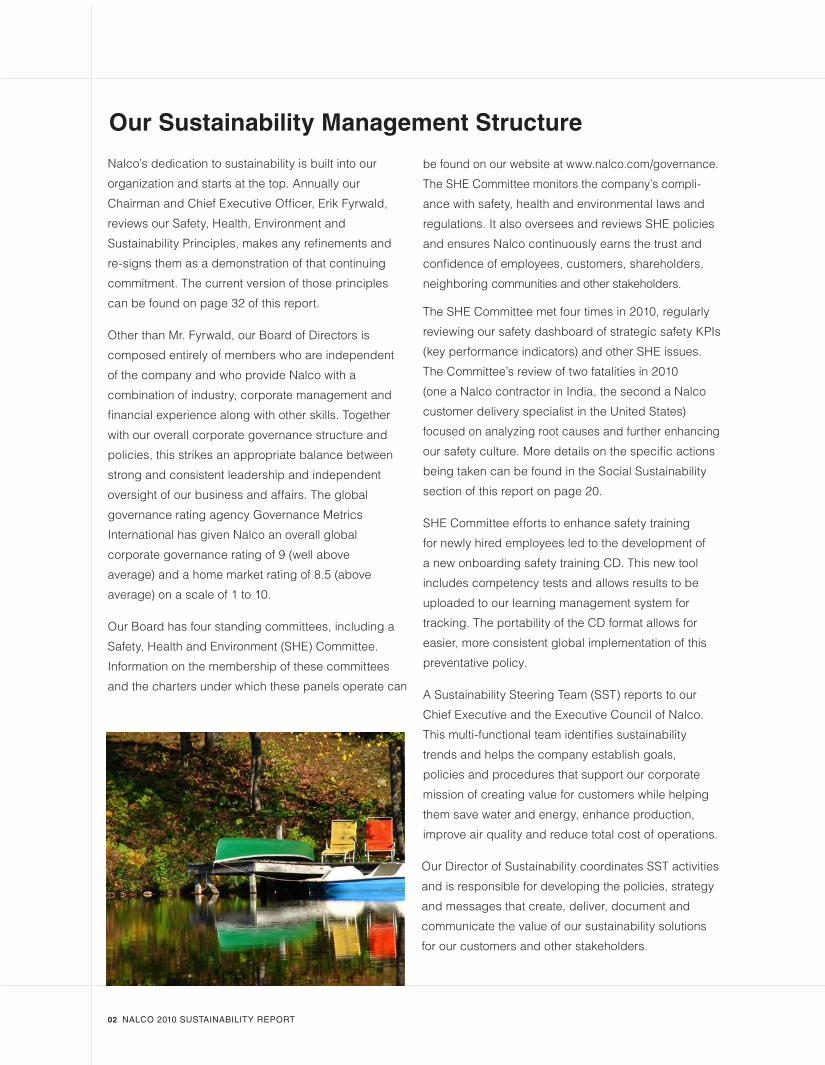
B4E Global Summit/Global Initiatives
04 NALCO 2010 SUSTAINABILITY REPORT
In addition to formal presentations from a number of senior Nalco executives, there were Q&A sessions throughout the event.
Each quarter both our Chairman and our Chief Financial Officer conduct a conference call with analysts that is also available as a live webcast and for later replay through our website. Nalco executives presented at more than a dozen investor conferences during the year with many of those presentations available globally through our website.
Legislators and RegulatorsBusiness can play an important role in providing government officials and regulators with an indus-try perspective to help develop the most effective policies. Sharing Nalco’s expertise in industrial water, energy and air applications can contribute to policy debates in water and water-efficient technologies, enhanced oil recovery and oil and gas production, air quality, energy efficiency, climate change and other related energy and environmental issues.
Our interactions with government officials at all levels and in all countries comply with the law and with all Nalco ethics policies including our Code of Ethical Business Conduct which guides all Nalco officers, managers and employees in creat-ing and maintaining an ethical work environment.
.
Non-Governmental Organizations In recent years Nalco has expanded our engage-ment with non-governmental organizations (NGOs) in recognition of the need for open dialogue and cooperation to find sustainable solutions for the global water and energy challenges we face.
We continue to deepen our commitment to Water For People (WFP), a global nonprofit humanitarian organization that focuses on increasing access to safe drinking water and preventing water- and sanitation-related illnesses. The partnership ranges from grants and in-kind contributions to employee volunteerism and board participation by Nalco executive Mary Kay Kaufmann. Nalco’s technical expertise was also brought to bear on Water For People’s new internal audit and rebranding initiatives. More information about our support of Water For People can be found in the Social Sustainability section of this report on page 24.
Nalco and World Wildlife Fund (WWF), one of the world’s foremost conservation groups, formed a partnership in 2010 to develop best practices to protect and conserve water. Nalco is applying our global experience in safe and efficient industrial water use to help define the needs of priority areas facing water scarcity, poor water quality, and degradation of freshwater habitats.
We are also providing financial support to the Global Water Roundtable, which is being organized by WWF and the Alliance for Water Stewardship, to develop credible water stewardship standards for fair and sustainable management of fresh water.
Since committing to the United Nations CEO Water Mandate, Nalco has provided ongoing sup-port to the Mandate. Mike Bushman, Division Vice President, Global Policy and Stakeholder Engage-ment, was a member of the group that developed the Mandate’s Guide to Responsible Corporate Engagement in Water Public Policy. Nalco co-sponsored the Mandate’s November 2010 working conference in Cape Town, South Africa that ad-dressed water scarcity, quality and availability both in southern Africa and globally.
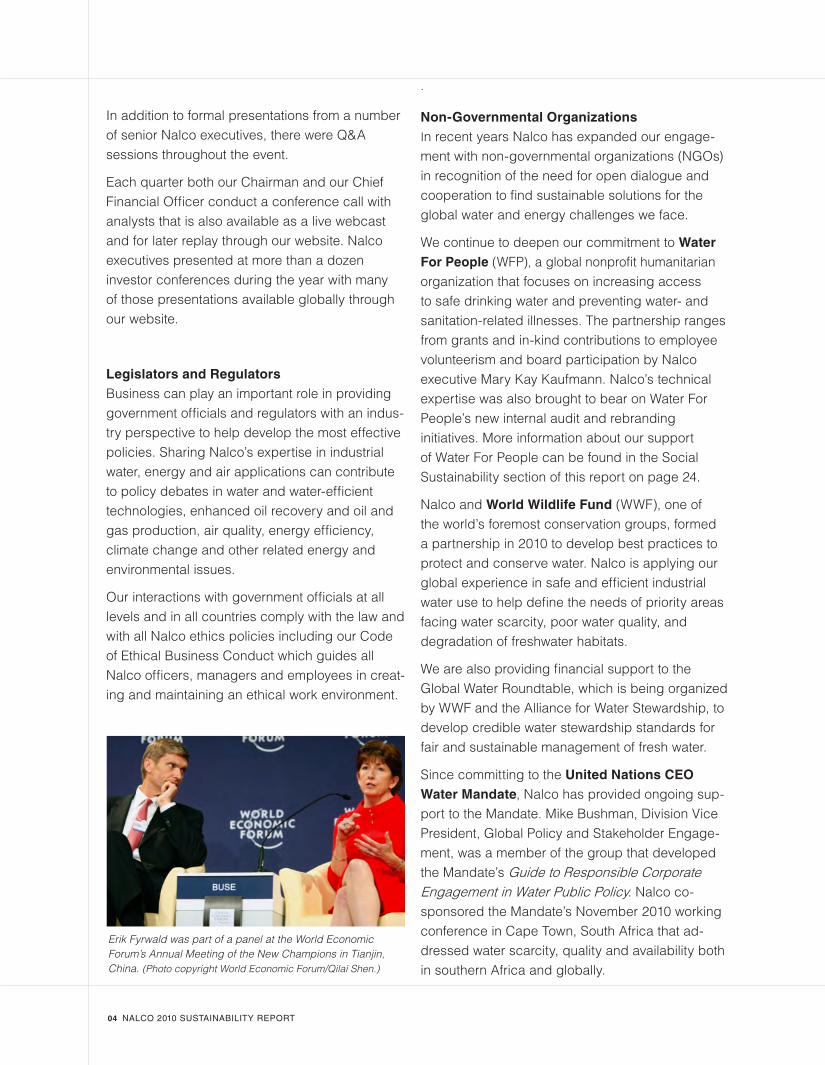
Erik Fyrwald was part of a panel at the World Economic Forum’s Annual Meeting of the New Champions in Tianjin, China. (Photo copyright World Economic Forum/Qilai Shen.)
NALCO 2010 SUSTAINABILITY REPORT 05
Our Chairman and CEO, Erik Fyrwald, is active in the World Economic Forum (WEF), an indepen-dent international organization that brings together business, political, academic and other leaders to share ideas on global and regional issues. In 2010 he participated in WEF’s Annual Meeting of the New Champions in China.
Nalco also co-sponsored and participated in the fourth Business for Environment (B4E) Global Summit, held in Seoul, South Korea, in conjunction with Earth Day. The summit brought together people from business, government, international agencies and NGOs to discuss a variety of environmental challenges and identify solutions.
In October 2010 Nalco organized its first Water
Stewardship Forum to provide an opportunity for
Ethical Business ConductNalco requires ethical business conduct by all employees. Our Code of Ethical Business Conduct is translated into multiple languages to aid em-ployees in understanding the standards they must uphold. It establishes guidelines and policies for making ethical decisions. Our executives and finan-cial officers are required to adhere to an additional Officer Code of Ethics. Both codes can be found on our website: www.nalco.com/governance.
Periodically, members of our Board of Directors, our officers and certain management employees are required to complete a conflict of interest question-naire and certify in writing that they have read and understand the Code of Ethical Business Conduct.
The Audit Committee of our Board of Directors, chaired by Rodney F. Chase, is responsible for
sharing best practices in optimizing industrial water use. The two-day event featured participants from NGOs including WWF, the Alliance for Water Stewardship and the Pacific Institute along with representatives from a variety of companies including Nestlé, USG Corporation, Hewlett- Packard, Pepsi, Dow and Archer Daniels Midland.
Attendees shared practical, tangible ways to build a business case for making water conservation and efficiency part of a broader sustainability-driven agenda. They learned how market-leading companies manage water risks and ultimately improve their water use. Companies also shared operational best practices on managing water risks by using a cascading approach of water conservation, reuse and recycle.
receiving, investigating and acting on the concerns of employees, shareholders and other interested parties. Anyone with a concern may contact Mr. Chase, or discuss any concern on an anonymous basis by contacting our Ethics Hotline at 888-749-1949. A series of non-U.S. phone numbers is also available on our website: http://www.nalco.com/ethics-hotline.htm.
All employees regularly receive an Ethics newslet-ter that focuses on a part of our Ethics Code and provides a possible scenario to demonstrate the proper ethical behavior. Each issue is translated into multiple languages and includes brief questions and answers to help further explain proper conduct. Annually all employees are sent a copy of the Code (available in 10 languages) for their review and an e-learning module is available to help employees understand and follow our Code of Ethics.
06 NALCO 2010 SUSTAINABILITY REPORT
Product Stewardship REACH Implementation
In 2010, Nalco successfully registered our portfolio of substances that fell under the first registration deadline of REACH. REACH (short for the Registration, Evaluation, Authorization and Restriction of Chemicals) is a European, substance-focused regulatory program. Its aims are to protect human health and the environment by mandating the provision of toxicological information and risk management advice.
This success was an important milestone for Nalco and marks the next step in ensuring the long-term sustainability of our technologies by enhancing our knowledge of their potential effects on people and the environment. In 2010, we registered 21 key chemistries and commissioned or participated in 100 new toxicity studies as part of REACH. Our intent is to harness this knowledge and demonstrate that Nalco technology represents a safer and more sustainable option, when compared to older, hazardous chemistry.
Also in 2010, we formed the REACH Centre of Excellence which will solidify the successful processes established over the past two years, assuring our customers a REACH-compliant product supply and also allowing us to respond globally as similar regulations develop in other regions. More information is available on our website www.nalco.com/REACH.
Responsible Care®
Responsible Care is a global industry initiative for the safe management of chemicals. As part of Nalco’s commitment to this initiative, we are implementing the International Council of Chemical Associations’ Global Product Strategy (GPS). GPS is intended to strengthen Product Stewardship by increasing both public and
stakeholder awareness and confidence that chemicals being used in commerce are safely managed throughout their lifecycle.
To complete this effort we are developing a series of Product Stewardship Summaries which include a risk characterization and risk management recommendations. In 2010 Nalco completed development of summaries for all of our Tier 1, high priority substances. That is two years ahead of the American Chemistry Council’s goal of completing all high priority chemicals by the end of 2012. Product Stewardship summaries are now being developed for substances in the moderate and low categories with a goal of completing them in stages through 2018.
These Tier 1 summaries, which cover 34 substances, are available through the Product Stewardship page on our website.
We continue to certify our manufacturing facilities worldwide to either ISO14001 or RC14001. In 2010, 26 of our plants were certified or recertified to one of these globally recognized management systems which are designed to protect the environment and continually improve environmental, health, safety and security performance.
Luxury Hotel in India
In Mumbai, India, one of the world’s most populous cities, water isn’t always available when you turn on the tap. As the water system serving the city’s burgeon-ing population strains to match an ever-growing need, cutting
unnecessary water use is a critical way to stretch a scarce resource further.
Providing an excellent guest experience at a hotel in the tropics requires a cooling system that works at peak efficiency. Marriott International’s Renais-sance Mumbai Convention Centre Hotel faced fouling problems in its cooling system that reduced that efficiency, causing increased water and energy use. Working with Nalco, the 583-room Marriott drastically reduced its water use and improved the operation of its system by implementing 3D TRASAR® Cooling Water Automation.
This patented technology, which combines innova-tive chemistry with state-of-the-art monitoring and control hardware and software, optimizes the 5-star hotel’s cooling system. It reduces fresh water needs by allowing the reuse of treated wastewater in the cooling system, saving 60,000 cubic meters (nearly 16 million gallons) of water each year. The amount of wastewater produced by the hotel was cut by
•
NALCO 2010 SUSTAINABILITY REPORT 07
Shrinking Customers’ Environmental Footprint
the same amount. These water savings equal 256 million glasses of water, that’s 18 glasses for each man, woman and child in Mumbai.
Improved cooling system performance – by preventing scale buildup, corrosion and micro-biological fouling – also prolongs equipment life and conserves 600,000 kWh of electricity, avoid-ing more than 400 metric tons of greenhouse gas emissions.
Marriott achieved an environmental return on investment (eROI) by both reducing its environ-mental impact on the Mumbai region and saving enough in water and energy costs in four months to pay for the annual cost of the Nalco system.
Major Papermaker in Brazil
Suzano Pulp and Paper, the second largest global pro-ducer of eucalyptus pulp and a regional leader in the paper market, developed a new set of KPIs (key performance indicators) for its paper-
making operations and asked Nalco to find ways to improve performance, reduce costs and optimize the use of natural resources.
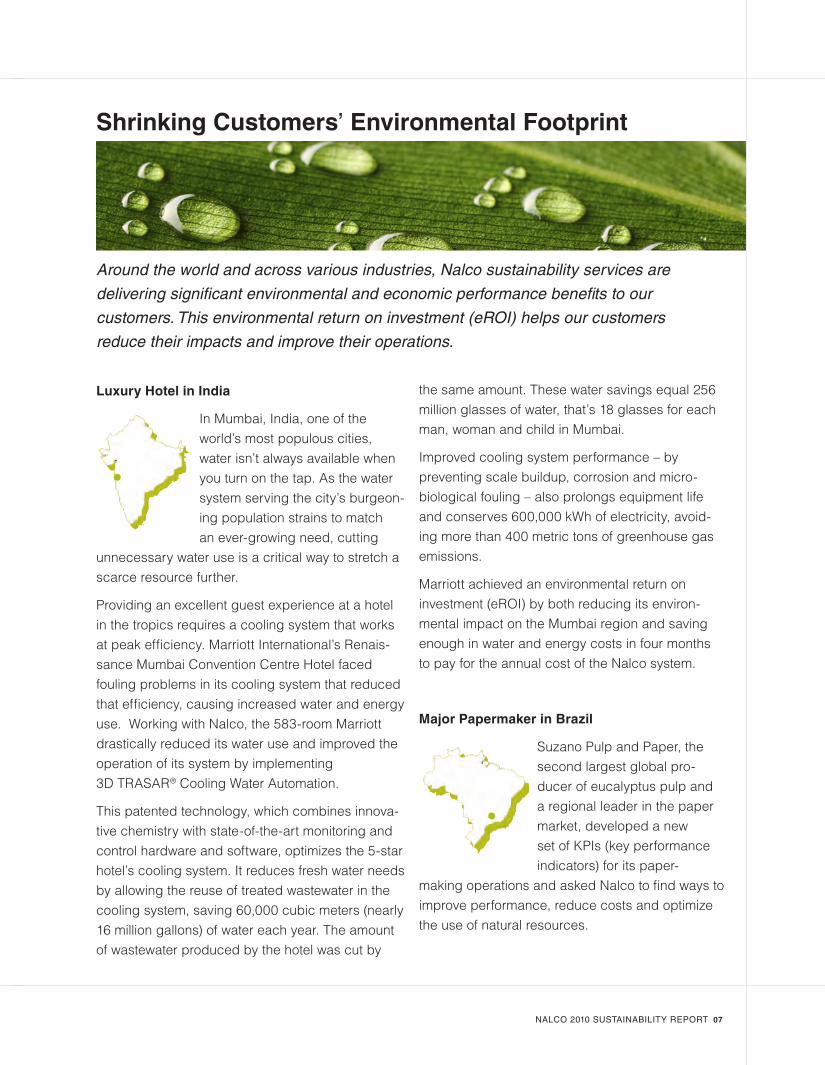
Around the world and across various industries, Nalco sustainability services are
delivering significant environmental and economic performance benefits to our
customers. This environmental return on investment (eROI) helps our customers
reduce their impacts and improve their operations.
•
08 NALCO 2010 SUSTAINABILITY REPORT
A 25 percent reduction in direct chemical costs and water savings of more than 10 million gallons per year were achieved on just one of the paper machines that the company has in the industrial unit located in Suzano, São Paulo – Brazil.
The combined operating and sustainability benefits provide Suzano an environmental return on investment (eROI). The success on the initial use for one papermaking machine led the customer to declare the solution a best practice within its operations and present Nalco with a supplier innovation award. PARETO technology has been expanded to a total of five machines at two of Suzano’s mills, yielding total water savings of 80 million gallons per year.
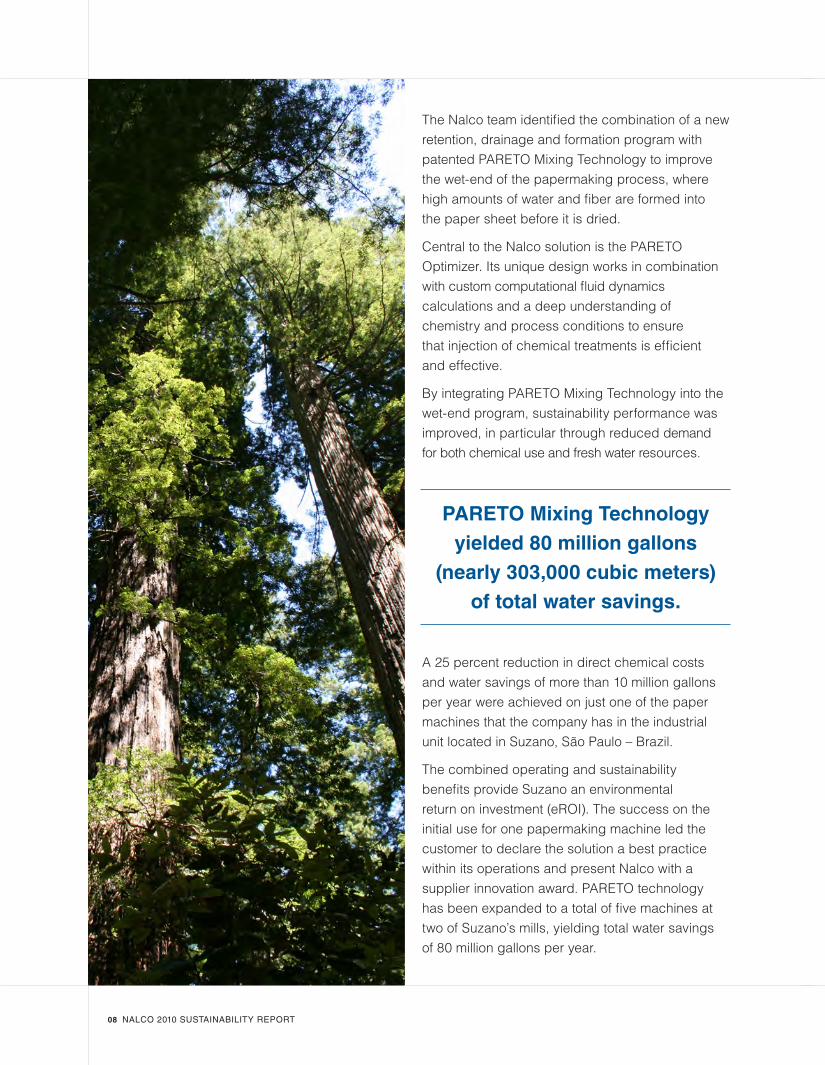
The Nalco team identified the combination of a new retention, drainage and formation program with patented PARETO Mixing Technology to improve the wet-end of the papermaking process, where high amounts of water and fiber are formed into the paper sheet before it is dried.
Central to the Nalco solution is the PARETO Optimizer. Its unique design works in combination with custom computational fluid dynamics calculations and a deep understanding of chemistry and process conditions to ensure that injection of chemical treatments is efficient and effective.
By integrating PARETO Mixing Technology into the wet-end program, sustainability performance was improved, in particular through reduced demand for both chemical use and fresh water resources.
PARETO Mixing Technology yielded 80 million gallons
(nearly 303,000 cubic meters) of total water savings.
NALCO 2010 SUSTAINABILITY REPORT 09
Power Plant in Poland
As in many parts of the world, European Union (EU) air emissions regulations are challenging coal-fired and biomass power plants to comply with strict limits for priority pollutants.
For example, tighter EU standards for NOx (oxides of nitrogen, a component of ground level ozone that causes a variety of health impacts) must be met by 2016.
The PGE Elektrownia Opole power plant in Poland wanted to find an optimum way to improve its sustainability performance by meeting these emissions regulations while allowing the plant to continue to operate at current production and profitability levels.
Nalco Mobotec offered a patented solution that in the case of PGE Elektrownia Opole is more cost- effective than traditional selective catalytic reduction technology. The project evaluated the plant’s Unit 3 generator including extensive review of boiler operation, using computational fluid dynamics modeling to understand the baseline performance of the 380-megawatt unit and to optimize the design of the solution using Nalco Mobotec’s ROFA® (Rotating Opposed Fire Air) and ROTAMIX® air technologies.
ROFA technology provides superior mixing of fuel and air in the furnace and improves temperature dis-tribution for a cleaner burn, reducing NOx emissions. The ROTAMIX system combines air injection nozzles with automatically regulated lances that inject urea solution into the furnace where the temperature is most favorable. This enhanced injection optimizes the chemical treatment, further reducing emissions.
The combined effect of burner modifications and Nalco Mobotec technology reduced NOx emissions from the plant’s Unit 3 generator well below the EU 2016 emission limit. This was the first modernization project in Poland to reduce NOx emissions enough to meet the more stringent standard.
Petrochemical Plant in China
CSPC (the CNOOC and Shell Petrochemicals Company Limited) is one of the largest Sino-foreign joint venture projects in China operating a giant petrochemical complex in Guangdong province
in southern China.
At the heart of the complex is a “cracker” which uses intense heat to break down petroleum prod-ucts into various commodity chemicals. Critical to production is the unit that compresses the gas stream for processing. Over time compressor efficiency was declining, reducing plant profitability.
Contaminants in the gas stream being compressed can foul the compressor. Proper maintenance helps maximize output. Despite continuous cleaning using wash oil, an initial steep decline in efficiency was followed by a continued slow decline. To maintain production CSPC faced increased energy consump-tion, reduced and – as compressor power reached its maximum – potential lost production of ethylene (the most profitable output).
To find a solution, engineers from CSPC and Nalco considered various options to improve compressor operations. Nalco services 90 percent of treated compressors in North America and nearly half of all treated compressors in the world. Based on these successes, the team recommended application of Nalco’s COMPTRENE® anti-foulant program com-bined with water injection into the first stage of the process to further reduce fouling.
The combined program reversed the downward trend and improved compressor efficiency, allowing the plant to reduce energy consumption and achieve production targets. These energy savings also reduce carbon dioxide emissions, helping support CSPC’s sustainable development principles to use resources efficiently and minimize environmental impact.
••
10 NALCO 2010 SUSTAINABILITY REPORT
economic sustainability
NALCO 2010 SUSTAINABILITY REPORT 11
economic sustainability
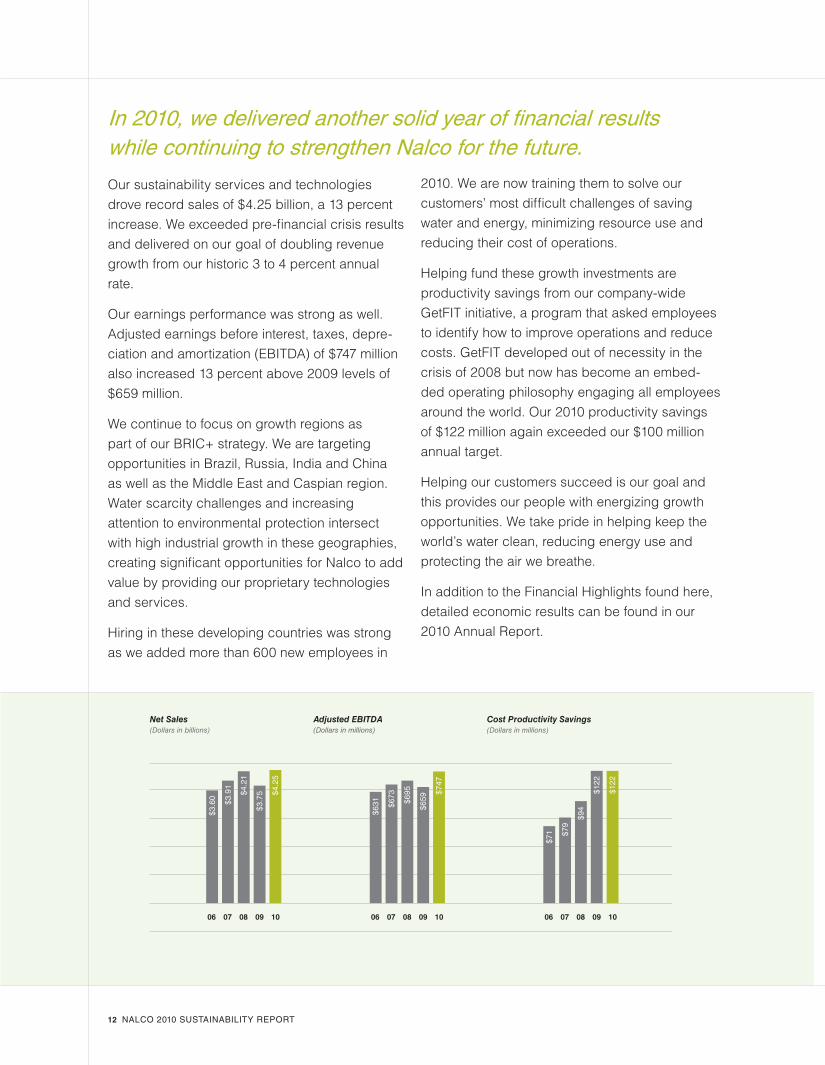
Our sustainability services and technologies drove record sales of $4.25 billion, a 13 percent increase. We exceeded pre-financial crisis results and delivered on our goal of doubling revenue growth from our historic 3 to 4 percent annual rate.
Our earnings performance was strong as well. Adjusted earnings before interest, taxes, depre-ciation and amortization (EBITDA) of $747 million also increased 13 percent above 2009 levels of $659 million.
We continue to focus on growth regions as part of our BRIC+ strategy. We are targeting opportunities in Brazil, Russia, India and China as well as the Middle East and Caspian region. Water scarcity challenges and increasing attention to environmental protection intersect with high industrial growth in these geographies, creating significant opportunities for Nalco to add value by providing our proprietary technologies and services.
Hiring in these developing countries was strong as we added more than 600 new employees in
2010. We are now training them to solve our customers’ most difficult challenges of saving water and energy, minimizing resource use and reducing their cost of operations.
Helping fund these growth investments are productivity savings from our company-wide GetFIT initiative, a program that asked employees to identify how to improve operations and reduce costs. GetFIT developed out of necessity in the crisis of 2008 but now has become an embed-ded operating philosophy engaging all employees around the world. Our 2010 productivity savings of $122 million again exceeded our $100 million annual target.
Helping our customers succeed is our goal and this provides our people with energizing growth opportunities. We take pride in helping keep the world’s water clean, reducing energy use and protecting the air we breathe.
In addition to the Financial Highlights found here, detailed economic results can be found in our 2010 Annual Report.
12 NALCO 2010 SUSTAINABILITY REPORT
In 2010, we delivered another solid year of financial results while continuing to strengthen Nalco for the future.
1inch x 1.5 incheswidth: 75%cluster: 85%
0.00
0.75
1.50
2.25
3.00
3.75
4.50
0.000000
133.333333
266.666667
400.000000
533.333333
666.666667
800.000000
0.000000
21.666700
43.333401
65.000101
86.666801
108.333502
06 07 08 09 10
Net Sales(Dollars in billions)
06 07 08 09 10
$631 $6
73
$695
$659
$747
Adjusted EBITDA(Dollars in millions)
06 07 08 09 10
$71 $7
9
$94
$122
$122
Cost Productivity Savings(Dollars in millions)
$3.6
0 $3.9
1
$4.2
1
$3.7
5 $4.2
5
0
1
2
3
4
5
0.00
0.15
0.30
0.45
0.60
0.75
0.0
0.2
0.4
0.6
0.8
0
0.2
0.4
0.6
0.8
Vehicle Accidents(Per million miles driven)
Total Vehicle Accident Rate
Severe Vehicle Accident Rate
4.2
4.0 4.
2
0.6
0.3
0.24
3.3
2.3
08 0906 07 08 09 10 10
Total Recordable Injury Rate(Per 100 full-time workers in a year)
06 07 08 09 10
2010 TotalTarget: 0.48
3500
3900
4300
4700
5100
5500
3.8
4.0
4.2
4.4
4.6
4.8
3000
3300
3600
3900
4200
4500
1550
1650
1750
1850
1950
2050
22000
23000
24000
25000
26000
27000
500
525
550
575
600
625
3.0
3.2
3.4
3.6
3.8
2000
2200
2400
2600
2800
3000
190
200
210
220
230
240
145
155
165
175
185
195
0.13
0.14
0.15
0.16
0.17
0.18
65
70
75
80
85
90
6
7
8
9
10
11
2012 TotalEnergy Target
06 07 08 09 10 06 07 08 09 10
Water
Water used (Thousands of cubic meters) Intensity (Cubic meters per ton produced)
Wastewater
Wastewater generated (Thousands of cubic meters) Intensity (Cubic meters per ton produced)
3500
3900
4300
4700
5100
3.8
4.0
4.2
4.4
4.6
3000
3300
3600
3900
4200
3.0
3.2
3.4
3.6
3.8
06 07 08 09 10
Total Energy
Energy used (Thousands of Gigajoules) Intensity (Gigajoules per ton produced)
2000
2200
2400
2600
2800
190
200
210
220
230
06 07 08 09 10
Total Greenhouse Gases (GHG)
GHG (Thousands of tons) Intensity (Tons of GHG per ton produced)
145
155
165
175
185
0.130
0.140
0.150
0.160
0.170
06 07 08 09 10
Total NOx and SOx Emissions
NOx (In tons) SOx (In tons)
65
70
75
80
85
6
7
8
9
10
Direct Energy Used(Thousands of Gigajoules)
06 07 08 09 10
1550
1650
1750
1850
1950
Total Waste(In tons)
06 07 08 09 10
22000
23000
24000
25000
26000
Indirect Energy Used(Thousands of Gigajoules)
06 07 08 09 10
500
525
550
575
600
1 2 3 4 5 6 7 8 9 10 11 12 13
NALCO 2010 SUSTAINABILITY REPORT 13
2010 2009 2008 2007 2006
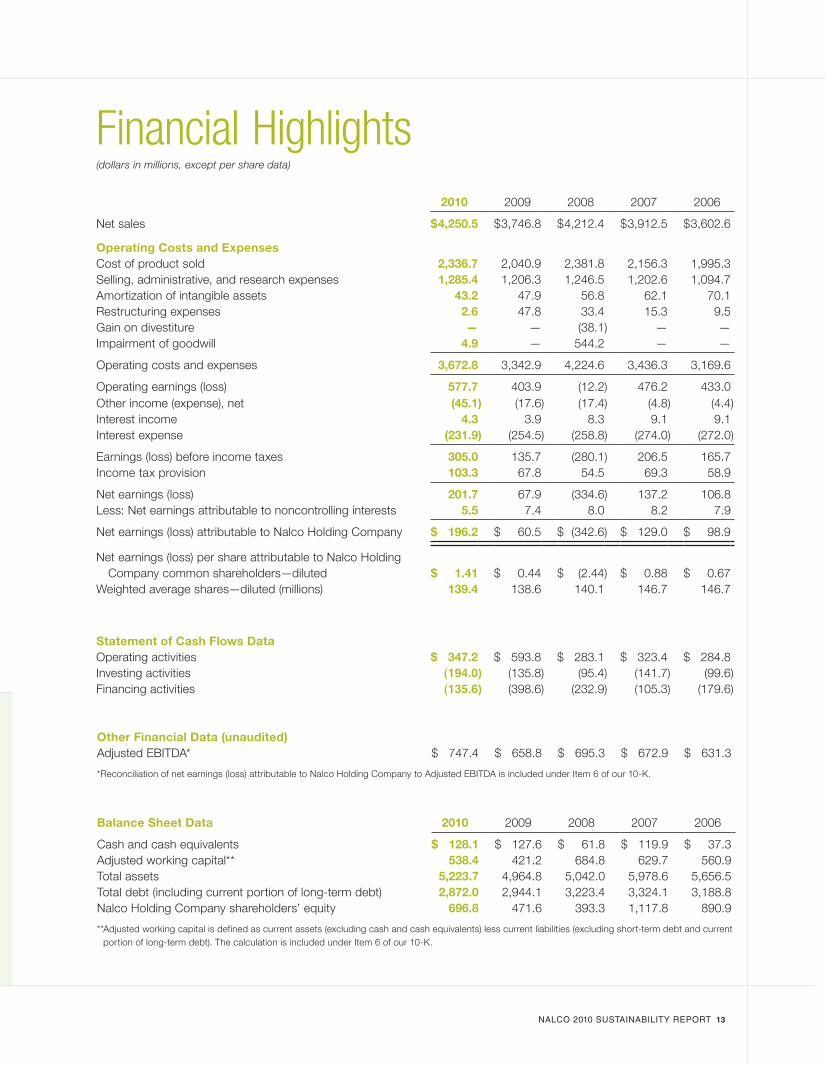
Net sales $ 4,250.5 $ 3,746.8 $ 4,212.4 $ 3,912.5 $ 3,602.6
Operating Costs and ExpensesCost of product sold 2,336.7 2,040.9 2,381.8 2,156.3 1,995.3Selling, administrative, and research expenses 1,285.4 1,206.3 1,246.5 1,202.6 1,094.7Amortization of intangible assets 43.2 47.9 56.8 62.1 70.1Restructuring expenses 2.6 47.8 33.4 15.3 9.5Gain on divestiture — — (38.1) — —Impairment of goodwill 4.9 — 544.2 — —
Operating costs and expenses 3,672.8 3,342.9 4,224.6 3,436.3 3,169.6
Operating earnings (loss) 577.7 403.9 (12.2) 476.2 433.0Other income (expense), net (45.1) (17.6) (17.4) (4.8) (4.4)Interest income 4.3 3.9 8.3 9.1 9.1Interest expense (231.9) (254.5) (258.8) (274.0) (272.0)
Earnings (loss) before income taxes 305.0 135.7 (280.1) 206.5 165.7Income tax provision 103.3 67.8 54.5 69.3 58.9
Net earnings (loss) 201.7 67.9 (334.6) 137.2 106.8Less: Net earnings attributable to noncontrolling interests 5.5 7.4 8.0 8.2 7.9
Net earnings (loss) attributable to Nalco Holding Company $ 196.2 $ 60.5 $ (342.6) $ 129.0 $ 98.9
Net earnings (loss) per share attributable to Nalco Holding Company common shareholders—diluted $ 1.41 $ 0.44 $ (2.44) $ 0.88 $ 0.67Weighted average shares—diluted (millions) 139.4 138.6 140.1 146.7 146.7
Financial Highlights(dollars in millions, except per share data)
Statement of Cash Flows DataOperating activities $ 347.2 $ 593.8 $ 283.1 $ 323.4 $ 284.8Investing activities (194.0) (135.8) (95.4) (141.7) (99.6)Financing activities (135.6) (398.6) (232.9) (105.3) (179.6)
Other Financial Data (unaudited)Adjusted EBITDA* $ 747.4 $ 658.8 $ 695.3 $ 672.9 $ 631.3
*Reconciliation of net earnings (loss) attributable to Nalco Holding Company to Adjusted EBITDA is included under Item 6 of our 10-K.
Balance Sheet Data 2010 2009 2008 2007 2006
Cash and cash equivalents $ 128.1 $ 127.6 $ 61.8 $ 119.9 $ 37.3Adjusted working capital** 538.4 421.2 684.8 629.7 560.9Total assets 5,223.7 4,964.8 5,042.0 5,978.6 5,656.5Total debt (including current portion of long-term debt) 2,872.0 2,944.1 3,223.4 3,324.1 3,188.8Nalco Holding Company shareholders’ equity 696.8 471.6 393.3 1,117.8 890.9
** Adjusted working capital is defined as current assets (excluding cash and cash equivalents) less current liabilities (excluding short-term debt and current portion of long-term debt). The calculation is included under Item 6 of our 10-K.
14 NALCO 2010 SUSTAINABILITY REPORT
environmental sustainability
environmental sustainability
NALCO 2010 SUSTAINABILITY REPORT 15
Off-‐Site Treatment Facility 71%
Surface Water 29%
Groundwater 0.2%
Treated Wa@tewater Ay Be@CnaCon 2010
16 NALCO 2010 SUSTAINABILITY REPORT
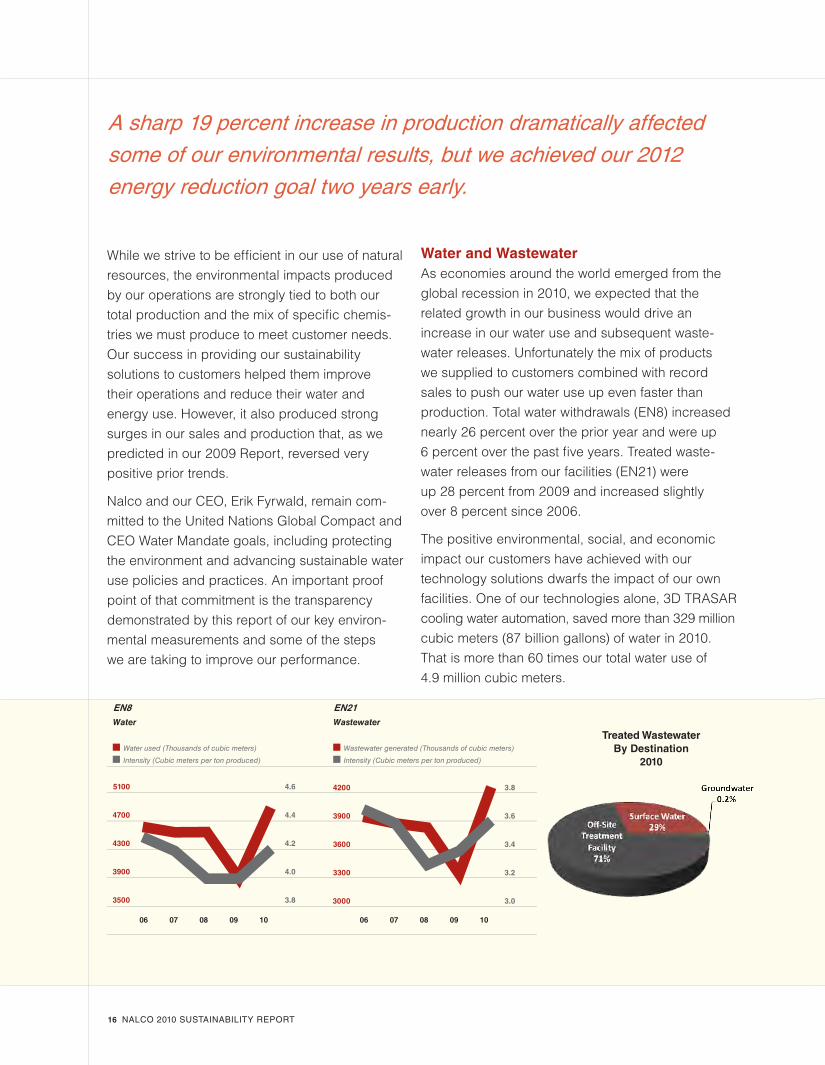
A sharp 19 percent increase in production dramatically affected some of our environmental results, but we achieved our 2012 energy reduction goal two years early.
Treated Wastewater By Destination
2010
EN8 EN21
While we strive to be efficient in our use of natural resources, the environmental impacts produced by our operations are strongly tied to both our total production and the mix of specific chemis-tries we must produce to meet customer needs. Our success in providing our sustainability solutions to customers helped them improve their operations and reduce their water and energy use. However, it also produced strong surges in our sales and production that, as we predicted in our 2009 Report, reversed very positive prior trends.
Nalco and our CEO, Erik Fyrwald, remain com-mitted to the United Nations Global Compact and CEO Water Mandate goals, including protecting the environment and advancing sustainable water use policies and practices. An important proof point of that commitment is the transparency demonstrated by this report of our key environ-mental measurements and some of the steps we are taking to improve our performance.
Water and WastewaterAs economies around the world emerged from the global recession in 2010, we expected that the related growth in our business would drive an increase in our water use and subsequent waste-water releases. Unfortunately the mix of products we supplied to customers combined with record sales to push our water use up even faster than production. Total water withdrawals (EN8) increased nearly 26 percent over the prior year and were up 6 percent over the past five years. Treated waste-water releases from our facilities (EN21) were up 28 percent from 2009 and increased slightly over 8 percent since 2006.
The positive environmental, social, and economic impact our customers have achieved with our technology solutions dwarfs the impact of our own facilities. One of our technologies alone, 3D TRASAR cooling water automation, saved more than 329 million cubic meters (87 billion gallons) of water in 2010. That is more than 60 times our total water use of 4.9 million cubic meters.
1inch x 1.5 incheswidth: 75%cluster: 85%
0.00
0.75
1.50
2.25
3.00
3.75
4.50
0.000000
133.333333
266.666667
400.000000
533.333333
666.666667
800.000000
0.000000
21.666700
43.333401
65.000101
86.666801
108.333502
06 07 08 09 10
Net Sales(Dollars in billions)
06 07 08 09 10
$631 $6
73
$695
$659
$747
Adjusted EBITDA(Dollars in millions)
06 07 08 09 10
$71 $7
9
$94
$122
$122
Cost Productivity Savings(Dollars in millions)
$3.6
0 $3.9
1
$4.2
1
$3.7
5 $4.2
5
0
1
2
3
4
5
0.00
0.15
0.30
0.45
0.60
0.75
0.0
0.2
0.4
0.6
0.8
0
0.2
0.4
0.6
0.8
Vehicle Accidents(Per million miles driven)
Total Vehicle Accident Rate
Severe Vehicle Accident Rate
4.2
4.0 4.
2
0.6
0.3
0.24
3.3
2.3
08 0906 07 08 09 10 10
Total Recordable Injury Rate(Per 100 full-time workers in a year)
06 07 08 09 10
2010 TotalTarget: 0.48
3500
3900
4300
4700
5100
5500
3.8
4.0
4.2
4.4
4.6
4.8
3000
3300
3600
3900
4200
4500
1550
1650
1750
1850
1950
2050
22000
23000
24000
25000
26000
27000
500
525
550
575
600
625
3.0
3.2
3.4
3.6
3.8
2000
2200
2400
2600
2800
3000
190
200
210
220
230
240
145
155
165
175
185
195
0.13
0.14
0.15
0.16
0.17
0.18
65
70
75
80
85
90
6
7
8
9
10
11
2012 TotalEnergy Target
06 07 08 09 10 06 07 08 09 10
Water
Water used (Thousands of cubic meters) Intensity (Cubic meters per ton produced)
Wastewater
Wastewater generated (Thousands of cubic meters) Intensity (Cubic meters per ton produced)
3500
3900
4300
4700
5100
3.8
4.0
4.2
4.4
4.6
3000
3300
3600
3900
4200
3.0
3.2
3.4
3.6
3.8
06 07 08 09 10
Total Energy
Energy used (Thousands of Gigajoules) Intensity (Gigajoules per ton produced)
2000
2200
2400
2600
2800
190
200
210
220
230
06 07 08 09 10
Total Greenhouse Gases (GHG)
GHG (Thousands of tons) Intensity (Tons of GHG per ton produced)
145
155
165
175
185
0.130
0.140
0.150
0.160
0.170
06 07 08 09 10
Total NOx and SOx Emissions
NOx (In tons) SOx (In tons)
65
70
75
80
85
6
7
8
9
10
Direct Energy Used(Thousands of Gigajoules)
06 07 08 09 10
1550
1650
1750
1850
1950
Total Waste(In tons)
06 07 08 09 10
22000
23000
24000
25000
26000
Indirect Energy Used(Thousands of Gigajoules)
06 07 08 09 10
500
525
550
575
600
1 2 3 4 5 6 7 8 9 10 11 12 13
Off-‐Site Treatment Facility 71%
Surface Water 29%
Groundwater 0.2%
Treated Wa@tewater Ay Be@CnaCon 2010
NALCO 2010 SUSTAINABILITY REPORT 17
In addition, we are constantly evaluating opportunities to reduce our water use. For example:
• PersonnelatourplantnearChicagointhe United States evaluated various aspects of its most water-intensive production process and identified opportunities to reduce required rinsing and flushing of equipment, substantially reduc-ing water use and saving more than 41,000 cubic meters (11 million gallons) of water per year.
• AwaterreuseprojectatourplantinSuzhou,China, cut water use by nearly 4,500 cubic meters (1.2 million gallons) per year.
• Maintenanceandprocesschanges,combinedwith efforts to identify and repair water and steam leaks at our facilities, reduced both water and energy use.
• Detectionandrepairofawaterleakinthefire-fighting water system at our plant in Oklahoma eliminated 50,000 gallons per month of water loss.
To further increase our transparency, for the first time we are reporting the ultimate destination of the treated wastewater released by our manufacturing sites and other facilities. The vast majority (71 percent) is sent to off-site facilities for further treatment before it is released to the environment. Most of the balance is treated by the Nalco facility before being released to local surface water.
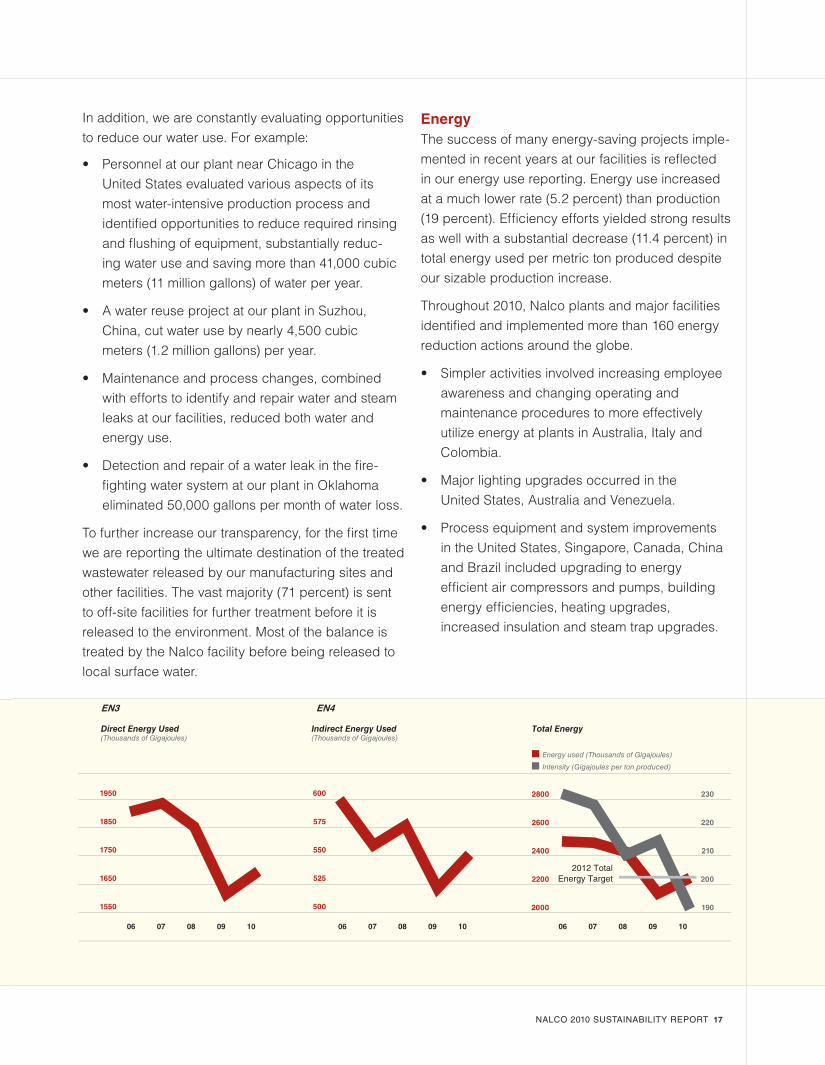
EnergyThe success of many energy-saving projects imple-mented in recent years at our facilities is reflected in our energy use reporting. Energy use increased at a much lower rate (5.2 percent) than production (19 percent). Efficiency efforts yielded strong results as well with a substantial decrease (11.4 percent) in total energy used per metric ton produced despite our sizable production increase.
Throughout 2010, Nalco plants and major facilities identified and implemented more than 160 energy reduction actions around the globe.
• Simpleractivitiesinvolvedincreasingemployeeawareness and changing operating and maintenance procedures to more effectively utilize energy at plants in Australia, Italy and Colombia.
• Majorlightingupgradesoccurredinthe United States, Australia and Venezuela.
• Processequipmentandsystemimprovementsin the United States, Singapore, Canada, China and Brazil included upgrading to energy efficient air compressors and pumps, building energy efficiencies, heating upgrades, increased insulation and steam trap upgrades.
EN3 EN4
1inch x 1.5 incheswidth: 75%cluster: 85%
0.00
0.75
1.50
2.25
3.00
3.75
4.50
0.000000
133.333333
266.666667
400.000000
533.333333
666.666667
800.000000
0.000000
21.666700
43.333401
65.000101
86.666801
108.333502
06 07 08 09 10
Net Sales(Dollars in billions)
06 07 08 09 10
$631 $6
73
$695
$659
$747
Adjusted EBITDA(Dollars in millions)
06 07 08 09 10
$71 $7
9
$94
$122
$122
Cost Productivity Savings(Dollars in millions)
$3.6
0 $3.9
1
$4.2
1
$3.7
5 $4.2
5
0
1
2
3
4
5
0.00
0.15
0.30
0.45
0.60
0.75
0.0
0.2
0.4
0.6
0.8
0
0.2
0.4
0.6
0.8
Vehicle Accidents(Per million miles driven)
Total Vehicle Accident Rate
Severe Vehicle Accident Rate
4.2
4.0 4.
2
0.6
0.3
0.24
3.3
2.3
08 0906 07 08 09 10 10
Total Recordable Injury Rate(Per 100 full-time workers in a year)
06 07 08 09 10
2010 TotalTarget: 0.48
3500
3900
4300
4700
5100
5500
3.8
4.0
4.2
4.4
4.6
4.8
3000
3300
3600
3900
4200
4500
1550
1650
1750
1850
1950
2050
22000
23000
24000
25000
26000
27000
500
525
550
575
600
625
3.0
3.2
3.4
3.6
3.8
2000
2200
2400
2600
2800
3000
190
200
210
220
230
240
145
155
165
175
185
195
0.13
0.14
0.15
0.16
0.17
0.18
65
70
75
80
85
90
6
7
8
9
10
11
2012 TotalEnergy Target
06 07 08 09 10 06 07 08 09 10
Water
Water used (Thousands of cubic meters) Intensity (Cubic meters per ton produced)
Wastewater
Wastewater generated (Thousands of cubic meters) Intensity (Cubic meters per ton produced)
3500
3900
4300
4700
5100
3.8
4.0
4.2
4.4
4.6
3000
3300
3600
3900
4200
3.0
3.2
3.4
3.6
3.8
06 07 08 09 10
Total Energy
Energy used (Thousands of Gigajoules) Intensity (Gigajoules per ton produced)
2000
2200
2400
2600
2800
190
200
210
220
230
06 07 08 09 10
Total Greenhouse Gases (GHG)
GHG (Thousands of tons) Intensity (Tons of GHG per ton produced)
145
155
165
175
185
0.130
0.140
0.150
0.160
0.170
06 07 08 09 10
Total NOx and SOx Emissions
NOx (In tons) SOx (In tons)
65
70
75
80
85
6
7
8
9
10
Direct Energy Used(Thousands of Gigajoules)
06 07 08 09 10
1550
1650
1750
1850
1950
Total Waste(In tons)
06 07 08 09 10
22000
23000
24000
25000
26000
Indirect Energy Used(Thousands of Gigajoules)
06 07 08 09 10
500
525
550
575
600
1 2 3 4 5 6 7 8 9 10 11 12 13
18 NALCO 2010 SUSTAINABILITY REPORT
*does not include mobile sourcesNote: All tons reported are metric tons.
EN16* EN20 EN22
These collective 2010 energy reduction efforts contributed an estimated annual energy use reduction of more than 111,000 gigajoules. (EN5)
Despite our increase in energy use we continued to hold total use below our stated goal of a global 10 percent reduction from 2007 levels by the end of 2012. However, continued strong growth in our business and changing product mix based on customer demand will tend to increase our energy use. We continue to identify additional opportunities for efficiency and reduc-tions to limit the impacts of growing production.
AirNalco was one of more than 3,000 companies to report their greenhouse gas emissions to the Carbon Disclosure Project (CDP) in 2010. CDP collects greenhouse gas emissions information and makes it available to more than 500 institu-tional investors and 60 purchasing organizations including Wal-Mart, PepsiCo and Dell. This data is made available for integration into local government, business and policy decision making. For more information visit www.cdproject.net.
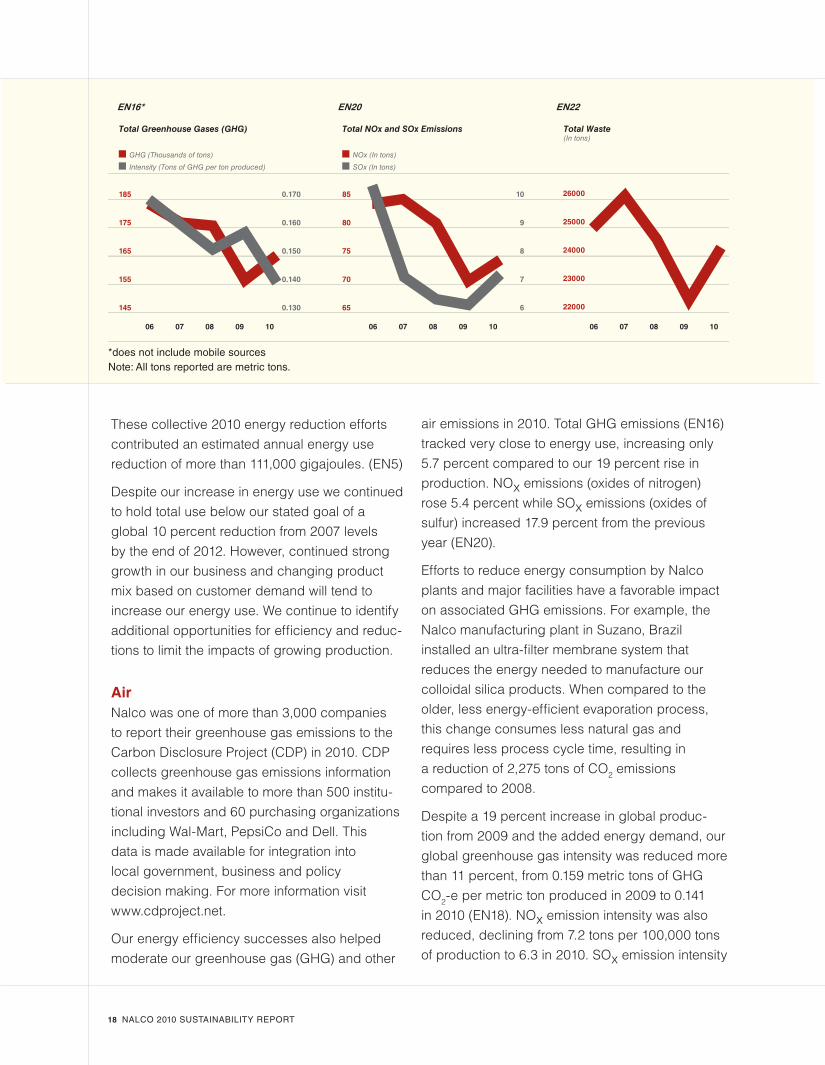
Our energy efficiency successes also helped moderate our greenhouse gas (GHG) and other
air emissions in 2010. Total GHG emissions (EN16) tracked very close to energy use, increasing only 5.7 percent compared to our 19 percent rise in production. NOx emissions (oxides of nitrogen) rose 5.4 percent while SOx emissions (oxides of sulfur) increased 17.9 percent from the previous year (EN20).
Efforts to reduce energy consumption by Nalco plants and major facilities have a favorable impact on associated GHG emissions. For example, the Nalco manufacturing plant in Suzano, Brazil installed an ultra-filter membrane system that reduces the energy needed to manufacture our colloidal silica products. When compared to the older, less energy-efficient evaporation process, this change consumes less natural gas and requires less process cycle time, resulting in a reduction of 2,275 tons of CO2 emissions compared to 2008.
Despite a 19 percent increase in global produc-tion from 2009 and the added energy demand, our global greenhouse gas intensity was reduced more than 11 percent, from 0.159 metric tons of GHG CO2-e per metric ton produced in 2009 to 0.141 in 2010 (EN18). NOx emission intensity was also reduced, declining from 7.2 tons per 100,000 tons of production to 6.3 in 2010. SOx emission intensity
1inch x 1.5 incheswidth: 75%cluster: 85%
0.00
0.75
1.50
2.25
3.00
3.75
4.50
0.000000
133.333333
266.666667
400.000000
533.333333
666.666667
800.000000
0.000000
21.666700
43.333401
65.000101
86.666801
108.333502
06 07 08 09 10
Net Sales(Dollars in billions)
06 07 08 09 10
$631 $6
73
$695
$659
$747
Adjusted EBITDA(Dollars in millions)
06 07 08 09 10
$71 $7
9
$94
$122
$122
Cost Productivity Savings(Dollars in millions)
$3.6
0
$3.9
1
$4.2
1
$3.7
5 $4.2
5
0
1
2
3
4
5
0.00
0.15
0.30
0.45
0.60
0.75
0.0
0.2
0.4
0.6
0.8
0
0.2
0.4
0.6
0.8
Vehicle Accidents(Per million miles driven)
Total Vehicle Accident Rate
Severe Vehicle Accident Rate
4.2
4.0 4.
2
0.6
0.3
0.24
3.3
2.3
08 0906 07 08 09 10 10
Total Recordable Injury Rate(Per 100 full-time workers in a year)
06 07 08 09 10
2010 TotalTarget: 0.48
3500
3900
4300
4700
5100
5500
3.8
4.0
4.2
4.4
4.6
4.8
3000
3300
3600
3900
4200
4500
1550
1650
1750
1850
1950
2050
22000
23000
24000
25000
26000
27000
500
525
550
575
600
625
3.0
3.2
3.4
3.6
3.8
2000
2200
2400
2600
2800
3000
190
200
210
220
230
240
145
155
165
175
185
195
0.13
0.14
0.15
0.16
0.17
0.18
65
70
75
80
85
90
6
7
8
9
10
11
2012 TotalEnergy Target
06 07 08 09 10 06 07 08 09 10
Water
Water used (Thousands of cubic meters) Intensity (Cubic meters per ton produced)
Wastewater
Wastewater generated (Thousands of cubic meters) Intensity (Cubic meters per ton produced)
3500
3900
4300
4700
5100
3.8
4.0
4.2
4.4
4.6
3000
3300
3600
3900
4200
3.0
3.2
3.4
3.6
3.8
06 07 08 09 10
Total Energy
Energy used (Thousands of Gigajoules) Intensity (Gigajoules per ton produced)
2000
2200
2400
2600
2800
190
200
210
220
230
06 07 08 09 10
Total Greenhouse Gases (GHG)
GHG (Thousands of tons) Intensity (Tons of GHG per ton produced)
145
155
165
175
185
0.130
0.140
0.150
0.160
0.170
06 07 08 09 10
Total NOx and SOx Emissions
NOx (In tons) SOx (In tons)
65
70
75
80
85
6
7
8
9
10
Direct Energy Used(Thousands of Gigajoules)
06 07 08 09 10
1550
1650
1750
1850
1950
Total Waste(In tons)
06 07 08 09 10
22000
23000
24000
25000
26000
Indirect Energy Used(Thousands of Gigajoules)
06 07 08 09 10
500
525
550
575
600
1 2 3 4 5 6 7 8 9 10 11 12 13
NALCO 2010 SUSTAINABILITY REPORT 19
EN28 # of Incidents Amount US$
2006 8 $56,837 2007 13 $145,430 2008 15 $921,717 2009 3 $23,000 2010 3 $20,660
remained flat for the third year in a row at 0.6 tons per 100,000 tons produced.
Waste Global waste generation (EN22) also increased (8.4 percent) but at a slower pace than our production (19 percent). The five-year trend for waste generation was positive, with a 2.8 percent reduction in total waste since 2006. The amount of waste generated compared to production also improved, down more than 8 percent from .0227 metric tons of waste to metric ton produced in 2009 to .0207 in 2010.
Process improvement teams at our largest manu-facturing site, in Garyville La., identified several waste reduction opportunities, winning an Environmental Leader Program award from the Louisiana Department of Environmental Quality. One change allowed 900,000 pounds of a major raw material to be reclaimed annually and a second change cut used waste oil disposal by 225,000 pounds. Changes in the plant’s wastewater system reduced the amount of nitrate compounds being released into the Mississippi River. Excess nitrogen in the river water causes hypoxia (oxygen depleted zones) in the Gulf of Mexico, harming sea life and impacting commercial fishing.
Global Fines and PenaltiesWe track and report both the number and amount paid (in U.S. dollars) for safety, health and environ-mental fines and penalties across our global organization. This figure also includes penalties related to product registration violations and transportation incidents.
More details of our environmental performance are available in the Detailed Appendix to this report.
20 NALCO 2010 SUSTAINABILITY REPORT
social sustainability
NALCO 2010 SUSTAINABILITY REPORT 21
social sustainability
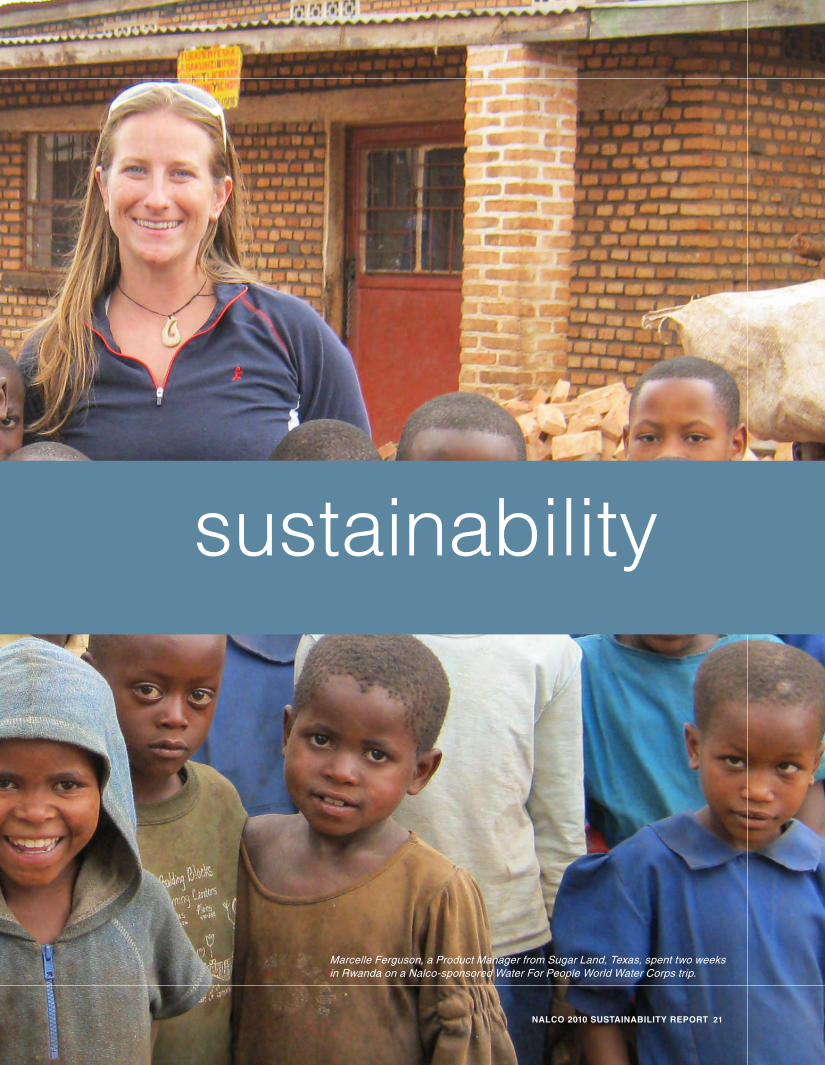
Marcelle Ferguson, a Product Manager from Sugar Land, Texas, spent two weeks in Rwanda on a Nalco-sponsored Water For People World Water Corps trip.
22 NALCO 2010 SUSTAINABILITY REPORT
SafetySafety is one of our core values and remains Nalco’s number one priority. The impact of the two lives lost in 2010 served to redouble our efforts to make safety personal and continue to focus on zero—zero accidents, zero injuries and zero fatalities.
To improve contractor and overall safety we have identified site safety leaders for all accounts to ensure clear accountability at sites where mul-tiple Nalco or contract personnel routinely work. This builds on our existing District Manager and Safety Champion networks. In addition customer site safety tools including a risk profile tool, risk assessment templates and site audit tools have been developed. We expect these steps to com-bine with an improved contractor selection pro-cess and new training to improve performance.
The employee fatality involved a delivery specialist who died after being ejected from the cab of his truck while not wearing a seat belt, in violation of Nalco policy. In response to this tragedy, we conducted a seat belt use commu-nications campaign with the theme “Everybody, Everywhere, Every time” including newsletters and posters to restate this longstanding policy.
A Pareto analysis of injury incidents sustained in 2009 was used to identify the three key behaviors which, if eliminated, would have contributed an 85 percent reduction in incidents. This analysis
and three key behaviors – eyes on your path and task, preplanning and wearing the appropri-ate PPE (personal protective equipment) – have been widely shared and used in safety coaching. We continue to engage employees in identifying and reporting unsafe acts and conditions. We regularly share Safety Alerts and Safety Lessons Learned based on that reporting. These notices relate the root causes, lessons learned and resulting recommendations from the investigation of an incident or near miss.
In addition to these steps, Nalco’s monthly global safety dashboard is a combination of lead-ing and lagging safety metrics to measure our performance. The leading metrics track training in a number of key areas including driving, risk assessment (to guide identification, evaluation and control of workplace hazards) and SOS or Safety On Site (which includes confined space, fall protection and other core elements) as well as near misses and safety audits.
Since 2007 more than 4,500 Nalco employees have completed our innovative SOS training across multiple training hubs in each region. The program combines classroom instruction with on-site, hands-on practical field exercises to reinforce the classroom work. These lead-ing measures are designed to ensure we have the proper programs in place to drive safe work practices as new hires begin their careers at Nalco. SOS refresher training is required for
2010 included many positives for Nalco such as continued overall strong safety performance and growing efforts in community outreach and philanthropy. However, it was also a year that included two fatalities.
NALCO 2010 SUSTAINABILITY REPORT 23
existing employees every three years thereafter, via webcast or in-person training.
2010 also saw the design and launch of Nalco's new Safety Leadership Course targeting middle management through executive leadership. The training captures a broader cross section of leadership than traditionally targeted for safety training and is being deployed globally in eight languages during 2011.
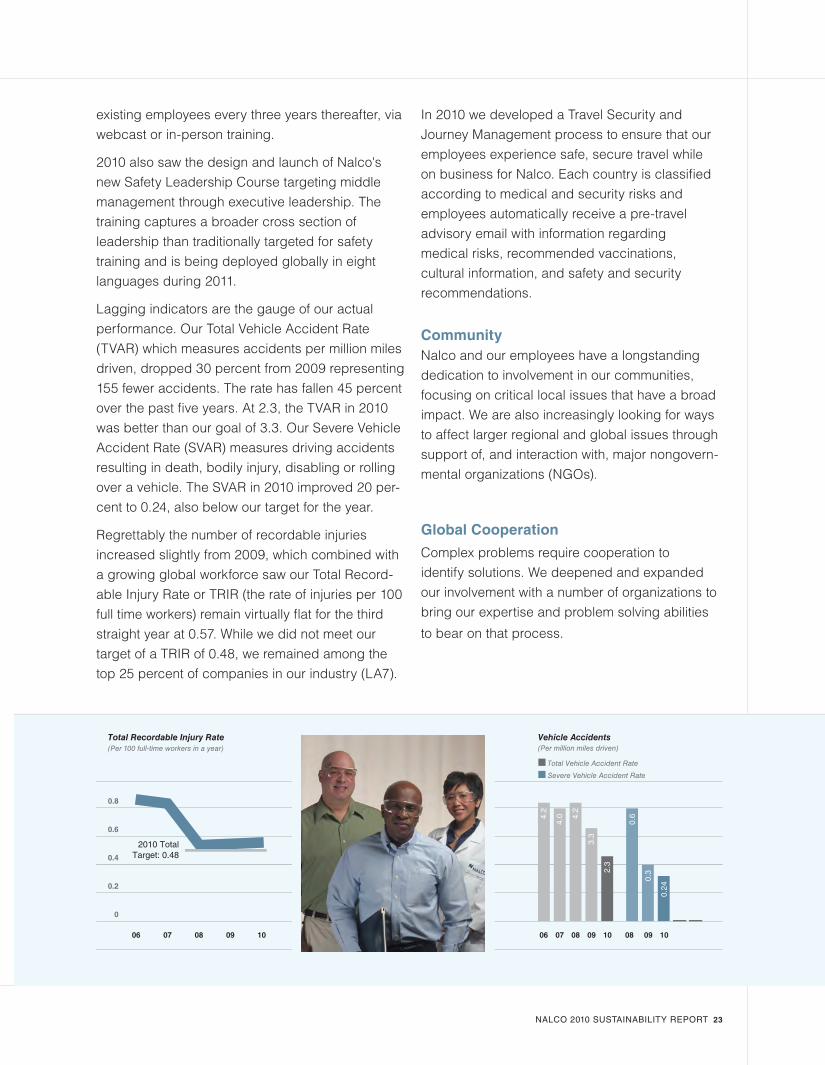
Lagging indicators are the gauge of our actual performance. Our Total Vehicle Accident Rate (TVAR) which measures accidents per million miles driven, dropped 30 percent from 2009 representing 155 fewer accidents. The rate has fallen 45 percent over the past five years. At 2.3, the TVAR in 2010 was better than our goal of 3.3. Our Severe Vehicle Accident Rate (SVAR) measures driving accidents resulting in death, bodily injury, disabling or rolling over a vehicle. The SVAR in 2010 improved 20 per-cent to 0.24, also below our target for the year.
Regrettably the number of recordable injuries increased slightly from 2009, which combined with a growing global workforce saw our Total Record-able Injury Rate or TRIR (the rate of injuries per 100 full time workers) remain virtually flat for the third straight year at 0.57. While we did not meet our target of a TRIR of 0.48, we remained among the top 25 percent of companies in our industry (LA7).
In 2010 we developed a Travel Security and Journey Management process to ensure that our employees experience safe, secure travel while on business for Nalco. Each country is classified according to medical and security risks and employees automatically receive a pre-travel advisory email with information regarding medical risks, recommended vaccinations, cultural information, and safety and security recommendations.
CommunityNalco and our employees have a longstanding dedication to involvement in our communities, focusing on critical local issues that have a broad impact. We are also increasingly looking for ways to affect larger regional and global issues through support of, and interaction with, major nongovern-mental organizations (NGOs).
Global Cooperation
Complex problems require cooperation to identify solutions. We deepened and expanded our involvement with a number of organizations to bring our expertise and problem solving abilities
to bear on that process.
1inch x 1.5 incheswidth: 75%cluster: 85%
0.00
0.75
1.50
2.25
3.00
3.75
4.50
0.000000
133.333333
266.666667
400.000000
533.333333
666.666667
800.000000
0.000000
21.666700
43.333401
65.000101
86.666801
108.333502
06 07 08 09 10
Net Sales(Dollars in billions)
06 07 08 09 10
$631 $6
73
$695
$659
$747
Adjusted EBITDA(Dollars in millions)
06 07 08 09 10
$71 $7
9
$94
$122
$122
Cost Productivity Savings(Dollars in millions)
$3.6
0 $3.9
1
$4.2
1
$3.7
5 $4.2
5
0
1
2
3
4
5
0.00
0.15
0.30
0.45
0.60
0.75
0.0
0.2
0.4
0.6
0.8
0
0.2
0.4
0.6
0.8
Vehicle Accidents(Per million miles driven)
Total Vehicle Accident Rate
Severe Vehicle Accident Rate
4.2
4.0 4.
2
0.6
0.3
0.24
3.3
2.3
08 0906 07 08 09 10 10
Total Recordable Injury Rate(Per 100 full-time workers in a year)
06 07 08 09 10
2010 TotalTarget: 0.48
3500
3900
4300
4700
5100
5500
3.8
4.0
4.2
4.4
4.6
4.8
3000
3300
3600
3900
4200
4500
1550
1650
1750
1850
1950
2050
22000
23000
24000
25000
26000
27000
500
525
550
575
600
625
3.0
3.2
3.4
3.6
3.8
2000
2200
2400
2600
2800
3000
190
200
210
220
230
240
145
155
165
175
185
195
0.13
0.14
0.15
0.16
0.17
0.18
65
70
75
80
85
90
6
7
8
9
10
11
2012 TotalEnergy Target
06 07 08 09 10 06 07 08 09 10
Water
Water used (Thousands of cubic meters) Intensity (Cubic meters per ton produced)
Wastewater
Wastewater generated (Thousands of cubic meters) Intensity (Cubic meters per ton produced)
3500
3900
4300
4700
5100
3.8
4.0
4.2
4.4
4.6
3000
3300
3600
3900
4200
3.0
3.2
3.4
3.6
3.8
06 07 08 09 10
Total Energy
Energy used (Thousands of Gigajoules) Intensity (Gigajoules per ton produced)
2000
2200
2400
2600
2800
190
200
210
220
230
06 07 08 09 10
Total Greenhouse Gases (GHG)
GHG (Thousands of tons) Intensity (Tons of GHG per ton produced)
145
155
165
175
185
0.130
0.140
0.150
0.160
0.170
06 07 08 09 10
Total NOx and SOx Emissions
NOx (In tons) SOx (In tons)
65
70
75
80
85
6
7
8
9
10
Direct Energy Used(Thousands of Gigajoules)
06 07 08 09 10
1550
1650
1750
1850
1950
Total Waste(In tons)
06 07 08 09 10
22000
23000
24000
25000
26000
Indirect Energy Used(Thousands of Gigajoules)
06 07 08 09 10
500
525
550
575
600
1 2 3 4 5 6 7 8 9 10 11 12 13
24 NALCO 2010 SUSTAINABILITY REPORT
Water For People
The Nalco Foundation has supported Water For People (WFP), a non-profit international development organization helping people in developing countries, since 2004. A $150,000 grant in 2010 supported a water and hygiene program in West Bengal, India. WFP partners with the local district assembly and local NGOs to construct and repair community water points. The program establishes water committees whose members are trained in the operation, maintenance and financial management of each water system. A hygiene education program helps improve health by reducing the incidence of illness caused by untreated or poorly treated water.
Nalco has provided administrative and technical expertise, office space, equipment and chemi-cal donations to directly impact WFP’s efforts. A Nalco senior executive, Group Vice President Mary Kay Kaufmann, volunteers on WFP’s board of directors.
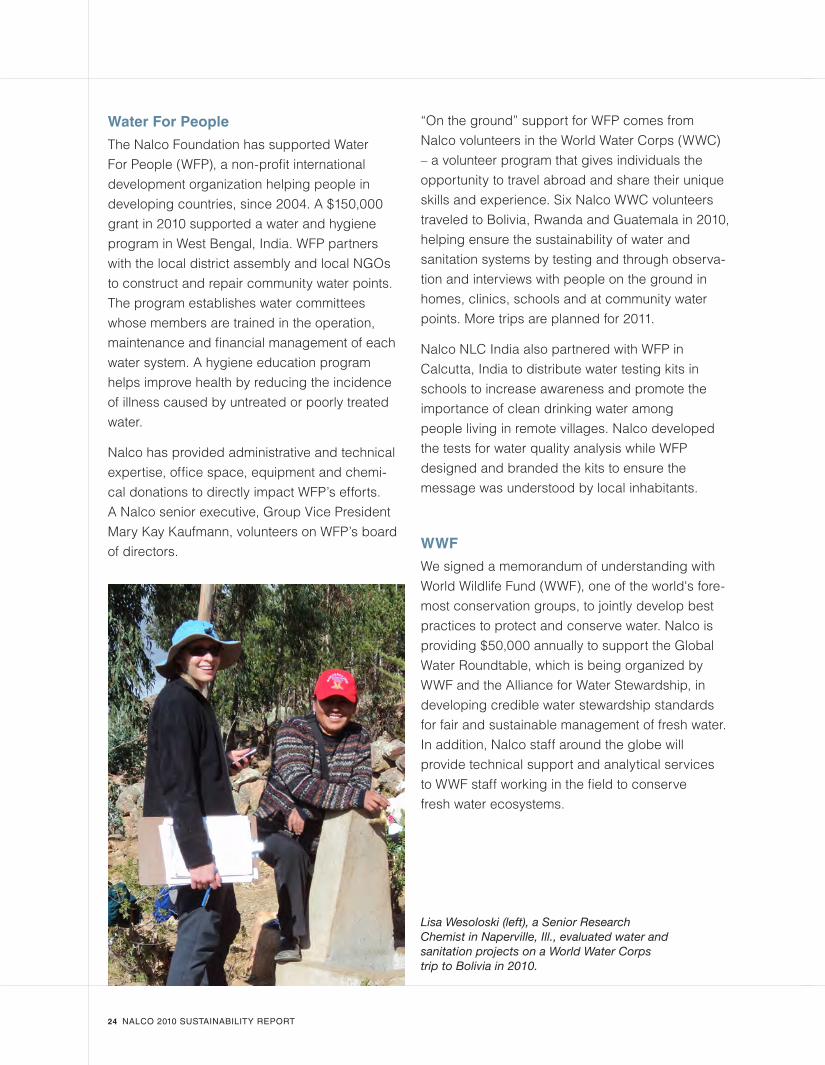
“On the ground” support for WFP comes from Nalco volunteers in the World Water Corps (WWC) – a volunteer program that gives individuals the opportunity to travel abroad and share their unique skills and experience. Six Nalco WWC volunteers traveled to Bolivia, Rwanda and Guatemala in 2010, helping ensure the sustainability of water and sanitation systems by testing and through observa-tion and interviews with people on the ground in homes, clinics, schools and at community water points. More trips are planned for 2011.
Nalco NLC India also partnered with WFP in Calcutta, India to distribute water testing kits in schools to increase awareness and promote the importance of clean drinking water among people living in remote villages. Nalco developed the tests for water quality analysis while WFP designed and branded the kits to ensure the message was understood by local inhabitants.
WWF
We signed a memorandum of understanding with World Wildlife Fund (WWF), one of the world's fore-most conservation groups, to jointly develop best practices to protect and conserve water. Nalco is providing $50,000 annually to support the Global Water Roundtable, which is being organized by WWF and the Alliance for Water Stewardship, in developing credible water stewardship standards for fair and sustainable management of fresh water. In addition, Nalco staff around the globe will provide technical support and analytical services to WWF staff working in the field to conserve fresh water ecosystems.
Lisa Wesoloski (left), a Senior Research Chemist in Naperville, Ill., evaluated water and sanitation projects on a World Water Corps trip to Bolivia in 2010.
NALCO 2010 SUSTAINABILITY REPORT 25
United Nations Global Compact
Our ongoing support for the Global Compact aligns with our daily efforts to deliver environmen-tal solutions to our customers, provide employees with a safe, rewarding workplace, operate ethi-cally and fairly, and conduct our own operations in a way that protects the planet. Our CEO, Erik Fyrwald, further demonstrated that commitment by signing the UN Convention against Corruption. In April, Nalco co-sponsored the fourth Business for Environment (B4E) Global Summit in South Korea and Dr. Manian Ramesh, our Chief Tech-nology Officer, was part of a panel on sustainable water management.
CEO Water Mandate
We helped the Water Mandate create the Guide to Responsible Corporate Engagement in Water Public Policy, which serves as a roadmap for companies to understand the best way to interact with governments and neighbors when developing and responding to water-related public policies. Nalco also co-sponsored and participated in the CEO Water Mandate’s Sixth Working Conference in Cape Town, South Africa in November.
Joint R&D Efforts
Our open innovation efforts include joint research and development projects with various colleges, universities and government facilities. A joint partnership with Argonne National Laboratory in the United States has worked on projects that include helping power plants reduce water consumption by using lower quality water in their cooling systems and decreasing the energy and cost of capturing carbon dioxide.
Water scarcity is a major issue in the Middle East, one of the most arid regions of the world. Nalco is a founding member of King Abdullah University of Science and Technology’s (KAUST) Industrial Collaboration Program in Saudi Arabia. The partnership with KAUST provides opportunities for advancing important environmental technologies such as water reuse, membranes and desalination.
Local Involvement
Our outreach encompasses a broad range of involvement including donating time, money, used furniture, clothing and other items as well as participating in community cleanups, child sports programs and the like.
When natural disasters occur, Nalco responds. Employees donated $37,000 to North America and International Red Cross agencies after the earthquake in Haiti and Nalco matched those contributions. A few months later when Chile was also struck by an earthquake, employees donated more than $8,000 that was matched by the Nalco Foundation. In Indonesia, Nalco donated cash to help victims in Yogyakarta, Central Java following the Mount Merapi volcano eruptions in October and November.
Seventeen Nalco employees, friends and family members participated in the two-day, 180-mile bicycle ride from Houston to Austin, Texas raising $13,740 to fight Multiple Sclerosis, with an additional $10,000 donated by the Nalco Foundation. More than 100 employees, their family and friends supported the Juvenile Diabetes Research Foundation annual fundraising walk in Chicago, collecting nearly $26,500 and Nalco donated an additional $50,000.
26 NALCO 2010 SUSTAINABILITY REPORT
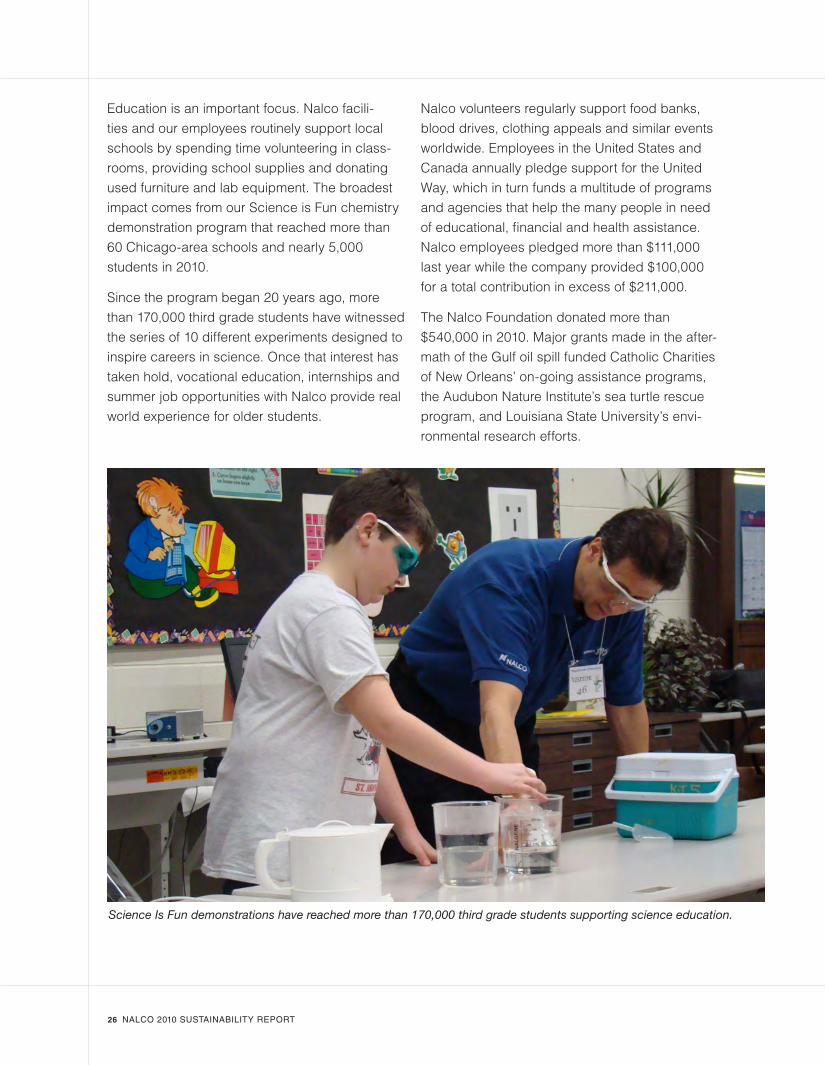
Education is an important focus. Nalco facili-ties and our employees routinely support local schools by spending time volunteering in class-rooms, providing school supplies and donating used furniture and lab equipment. The broadest impact comes from our Science is Fun chemistry demonstration program that reached more than 60 Chicago-area schools and nearly 5,000 students in 2010.
Since the program began 20 years ago, more than 170,000 third grade students have witnessed the series of 10 different experiments designed to inspire careers in science. Once that interest has taken hold, vocational education, internships and summer job opportunities with Nalco provide real world experience for older students.
Nalco volunteers regularly support food banks, blood drives, clothing appeals and similar events worldwide. Employees in the United States and Canada annually pledge support for the United Way, which in turn funds a multitude of programs and agencies that help the many people in need of educational, financial and health assistance. Nalco employees pledged more than $111,000 last year while the company provided $100,000 for a total contribution in excess of $211,000.
The Nalco Foundation donated more than $540,000 in 2010. Major grants made in the after-math of the Gulf oil spill funded Catholic Charities of New Orleans’ on-going assistance programs, the Audubon Nature Institute’s sea turtle rescue program, and Louisiana State University’s envi-ronmental research efforts.
Science Is Fun demonstrations have reached more than 170,000 third grade students supporting science education.
NALCO 2010 SUSTAINABILITY REPORT 27
Zero Defect Delivery Nalco developed the Zero Defect Delivery (ZDD) program more than 20 years ago to provide safe, error-free chemical deliveries to customer sites. ZDD focuses on stringent procedures and training to protect against spills, exposure and misdeliveries of the wrong chemical into the wrong tank and other delivery issues.
In the United States and Canada our fleet of trucks is operated by specially-trained Nalco delivery specialists, who carry out their responsibilities with precision. Employees for the dedicated carriers we use in addition to our fleet have also undergone training in our ZDD program. Regular retraining is an important part of the ZDD process.
At its heart, ZDD uses a system of unique serial numbers and product labels which are displayed on the tanks and fill lines, and then cross checked with bills of lading and all associated documentation to identify the delivery point and the appropriate product and quantity. If there is a discrepancy, the driver is instructed to stop and contact a designated source for further instructions and direction.
This system provides an excellent process for delivering the right quantity of the right product into the right tank at the right time, using the right safety and security procedures with no contamination and no spills.
Excellence in Reverse Logistics Nalco delivers our chemistry using a wide range of containers and other packaging materials specifically designed to match the types and specifications of the materials being stored. However, once those materials are consumed the return of those containers must be responsibly managed. We are partnering with one of our suppliers, Mauser’s National Container Group (NCG), to extend the life cycle of industrial packaging through “total recollect,” which increases opportunities for recovery and reuse of that packaging.
This program supports our commitment to the reuse of quality industrial packaging. Nalco and NCG developed a streamlined return and supply system which supports the recovery and reuse efforts of the Nalco PORTA-FEED® fleet of return-able containers, intermediate bulk containers, plastic drums and steel drums. Nalco and NCG expanded our efforts by designing a successful model for the reuse of intermediate bulk containers and drums which reduces the need for virgin resin and steel for new containers. Secondly, the program provides reductions in fuel consumption as independent recovery programs for each packaging type were eliminated. Multiple types of Nalco packaging are now recovered in combination, cutting the number of trucks used for “less than a truckload” returns.
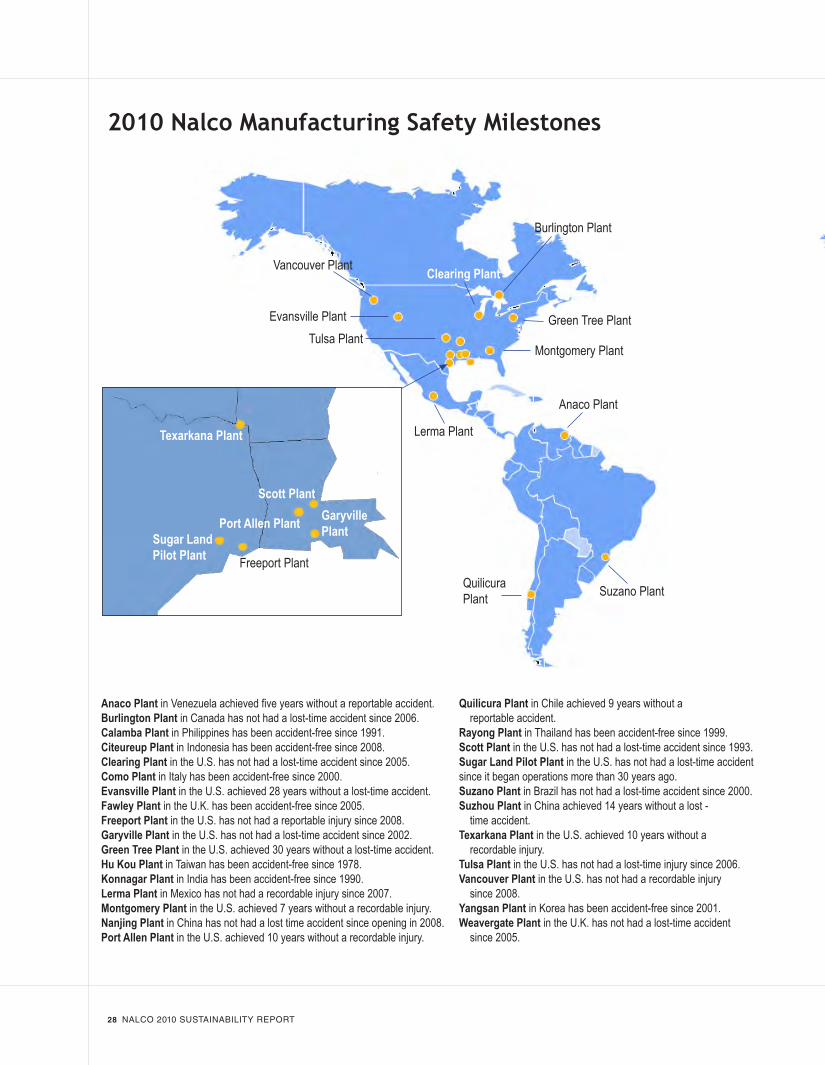
2010 Nalco Manufacturing Safety Milestones
Anaco Plant in Venezuela achieved five years without a reportable accident.Burlington Plant in Canada has not had a lost-time accident since 2006. Calamba Plant in Philippines has been accident-free since 1991. Citeureup Plant in Indonesia has been accident-free since 2008. Clearing Plant in the U.S. has not had a lost-time accident since 2005. Como Plant in Italy has been accident-free since 2000.Evansville Plant in the U.S. achieved 28 years without a lost-time accident. Fawley Plant in the U.K. has been accident-free since 2005.Freeport Plant in the U.S. has not had a reportable injury since 2008. Garyville Plant in the U.S. has not had a lost-time accident since 2002. Green Tree Plant in the U.S. achieved 30 years without a lost-time accident. Hu Kou Plant in Taiwan has been accident-free since 1978. Konnagar Plant in India has been accident-free since 1990. Lerma Plant in Mexico has not had a recordable injury since 2007. Montgomery Plant in the U.S. achieved 7 years without a recordable injury. Nanjing Plant in China has not had a lost time accident since opening in 2008. Port Allen Plant in the U.S. achieved 10 years without a recordable injury.
Quilicura Plant in Chile achieved 9 years without a reportable accident. Rayong Plant in Thailand has been accident-free since 1999. Scott Plant in the U.S. has not had a lost-time accident since 1993. Sugar Land Pilot Plant in the U.S. has not had a lost-time accident since it began operations more than 30 years ago. Suzano Plant in Brazil has not had a lost-time accident since 2000. Suzhou Plant in China achieved 14 years without a lost - time accident. Texarkana Plant in the U.S. achieved 10 years without a recordable injury.Tulsa Plant in the U.S. has not had a lost-time injury since 2006.Vancouver Plant in the U.S. has not had a recordable injury since 2008.Yangsan Plant in Korea has been accident-free since 2001.Weavergate Plant in the U.K. has not had a lost-time accident since 2005.
Suzano PlantQuilicuraPlant
Anaco Plant
Green Tree Plant
Montgomery Plant
Vancouver Plant
Burlington Plant
Clearing Plant
Lerma Plant
Evansville PlantTulsa Plant
Texarkana Plant
Freeport Plant
28 NALCO 2010 SUSTAINABILITY REPORT
Scott Plant
Port Allen Plant Garyville PlantSugar Land
Pilot Plant
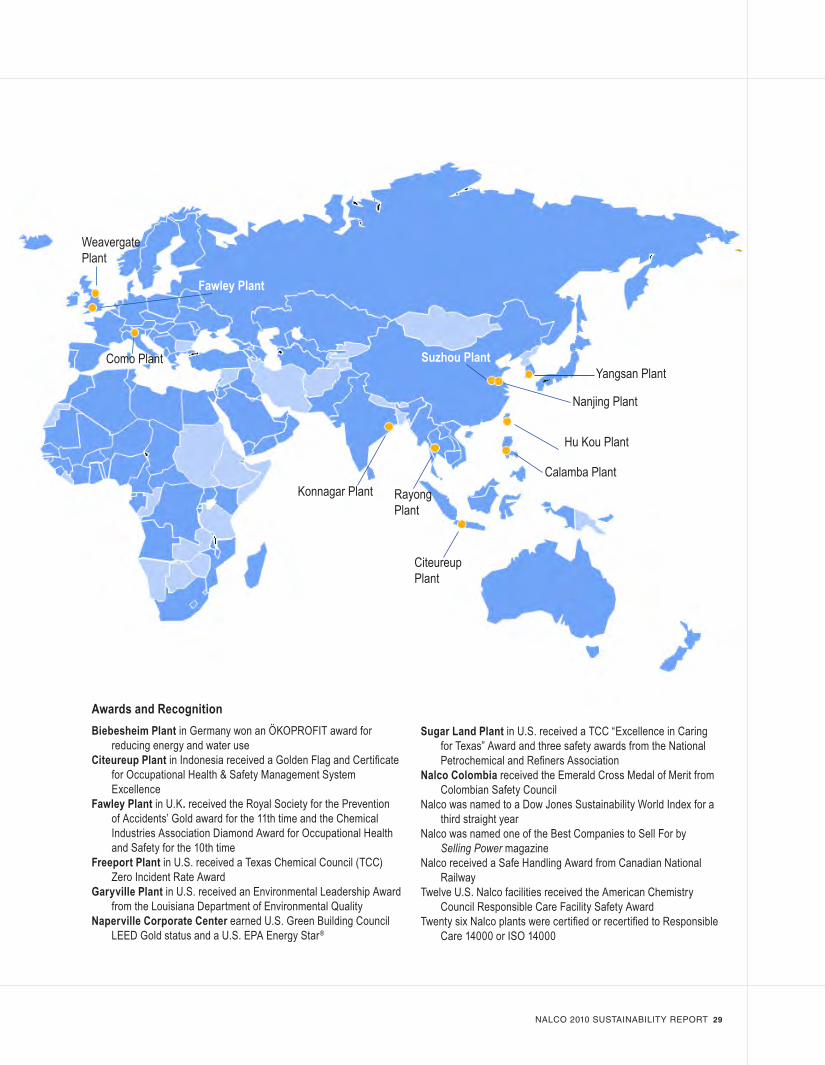
CiteureupPlant
Nanjing Plant
Yangsan Plant
Hu Kou Plant
Calamba PlantRayong Plant
Konnagar Plant
Suzhou PlantComo Plant
Fawley Plant
Weavergate Plant
NALCO 2010 SUSTAINABILITY REPORT 29
Awards and RecognitionBiebesheim Plant in Germany won an ÖKOPROFIT award for
reducing energy and water use Citeureup Plant in Indonesia received a Golden Flag and Certificate
for Occupational Health & Safety Management System Excellence
Fawley Plant in U.K. received the Royal Society for the Prevention of Accidents’ Gold award for the 11th time and the Chemical Industries Association Diamond Award for Occupational Health and Safety for the 10th time
Freeport Plant in U.S. received a Texas Chemical Council (TCC) Zero Incident Rate Award
Garyville Plant in U.S. received an Environmental Leadership Award from the Louisiana Department of Environmental Quality
Naperville Corporate Center earned U.S. Green Building Council LEED Gold status and a U.S. EPA Energy Star®
Sugar Land Plant in U.S. received a TCC “Excellence in Caring for Texas” Award and three safety awards from the National Petrochemical and Refiners Association
Nalco Colombia received the Emerald Cross Medal of Merit from Colombian Safety Council
Nalco was named to a Dow Jones Sustainability World Index for a third straight year
Nalco was named one of the Best Companies to Sell For by Selling Power magazine
Nalco received a Safe Handling Award from Canadian National Railway
Twelve U.S. Nalco facilities received the American Chemistry Council Responsible Care Facility Safety Award
Twenty six Nalco plants were certified or recertified to Responsible Care 14000 or ISO 14000
30 NALCO 2010 SUSTAINABILITY REPORT
United Nations Global Compact and CEO Water Mandate Communications on ProgressAs part of our effort to develop a comprehensive, streamlined approach to our corporate sustainability reporting we are now including our annual Communication on Progress for both the Global Compact and the CEO Water Mandate with our annual Sustainability Report.
J.Erik Fyrwald, our Chairman and Chief Executive Officer, reaffirms his support of both the United Nations Global Compact and the CEO Water Mandate in his opening letter for this Report.
Human Rights
Principle 1 Support and respect internationally Nalco is committed to the highest level of ethical performance throughout our proclaimed human rights organization as outlined in our Code of Ethical Business Conduct (which includes our equal employment and harassment policies) and a further Officer Code of Ethics which requires of each officer and financial officer honesty and ethical conduct in all areas. Principle 2 Ensure business is not complicit in More details are available on our website and in the Sustainability Management and human rights abuses. Ethics sections of this Report. Labor
Nalco provides a positive workplace that requires all employees to treat each other, customers and all third parties with dignity and respect, sensitive to the culture and customs of the countries where we operate. We do not engage in any form of forced or child labor. As our Code of Ethical Business Conduct states: “Nalco and each of its employees shall respect and comply with all applicable laws, rules and regulations.” The nature of our business is such that our employees must be skilled, technically trained and focused on safety. Details are available in the Social Sustainability section of this Report. Environment As the world’s largest sustainability services company Nalco helps customers reduce . energy, water and other natural resource consumption, enhance air quality and minimize environmental releases. Examples can be found in the customer success portion of this Report and on our website. Details of our own actions to minimize our impacts and operate safely can be found in the Environmental Sustainability and Social Sustainability sections of this Report. Anti-corruption
Principle 10 Work against corruption in all its forms, Nalco’s Code of Ethical Business Conduct requires all employees to deal fairly with including extortion and bribery. people, comply with all rules, regulations and laws, engage in responsible political activities and report all illegal and unethical behavior. We have internal policies, practices and training in place relating to compliance with this Code and the law.
Our Whistleblower Policy protects anyone who reports a complaint. Our Ethics Code specifically states all employees shall not directly or indirectly engage in bribery, kickbacks, payoffs or other corrupt business practices.
Principle 3 Uphold freedom of association and recognize the right to collective bargaining.Principle 4 Support elimination of all forms of forced and compulsory labor.Principle 5 Support effective elimination of child labor.Principle 6 Support elimination of discrimination in respect to employment and occupation.
Principle 7 Support a precautionary approach to environmental challengesPrinciple 8 Undertake initiatives to promote greater environmental responsibilityPrinciple 9 Encourage development and diffusion of environmentally friendly technologies
Details of our progress in support of the CEO Water Mandate are also included in this Sustainability Report. Our public policy actions and direct support of the CEO Water Mandate can be found in our Dialogue with Stakeholders section. Our global efforts to reduce industrial water use can be found in the section on customer successes and on our website. Our
direct water reduction efforts and measurements are recounted in the Environmental Sustainability section of this Report. Specific data on our performance can be found in the Detailed Appendix to this Report.
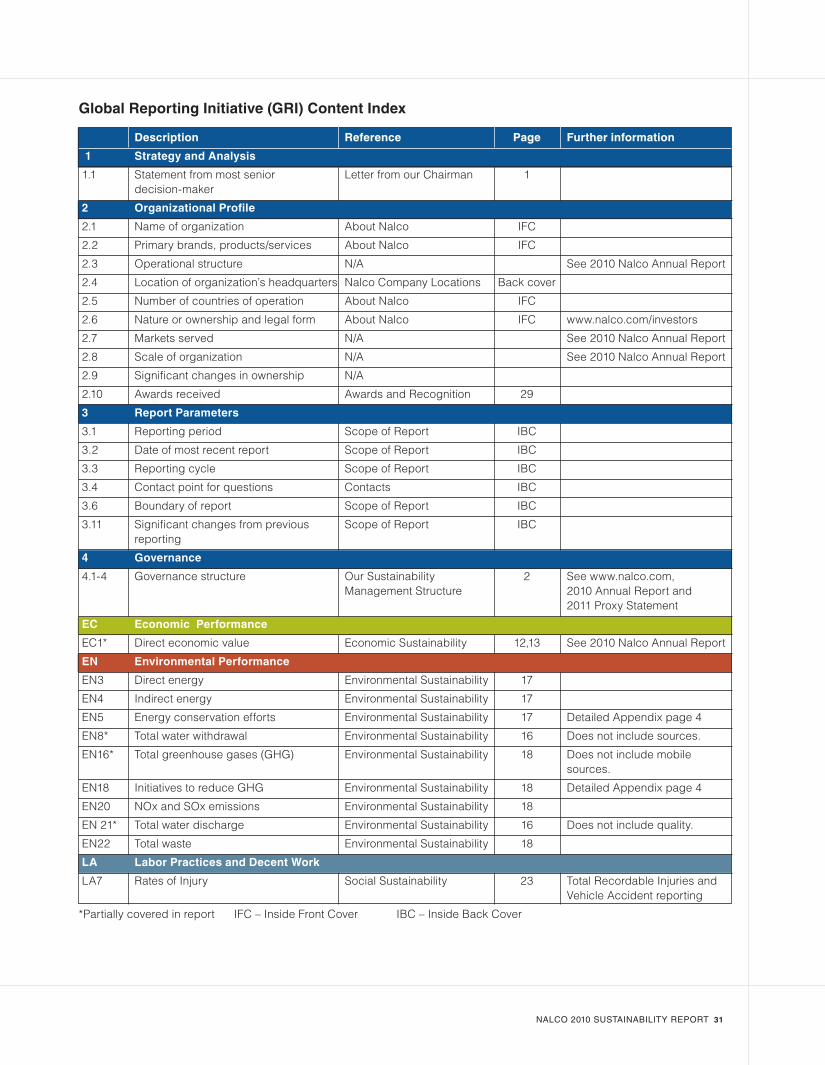
NALCO 2010 SUSTAINABILITY REPORT 31
Global Reporting Initiative (GRI) Content Index
Description Reference Page Further information
1 Strategy and Analysis
1.1 Statement from most senior Letter from our Chairman 1 decision-maker
2 Organizational Profile
2.1 Name of organization About Nalco IFC
2.2 Primary brands, products/services About Nalco IFC
2.3 Operational structure N/A See 2010 Nalco Annual Report
2.4 Location of organization’s headquarters Nalco Company Locations Back cover
2.5 Number of countries of operation About Nalco IFC
2.6 Nature or ownership and legal form About Nalco IFC www.nalco.com/investors
2.7 Markets served N/A See 2010 Nalco Annual Report
2.8 Scale of organization N/A See 2010 Nalco Annual Report
2.9 Significant changes in ownership N/A
2.10 Awards received Awards and Recognition 29
3 Report Parameters
3.1 Reporting period Scope of Report IBC
3.2 Date of most recent report Scope of Report IBC
3.3 Reporting cycle Scope of Report IBC
3.4 Contact point for questions Contacts IBC
3.6 Boundary of report Scope of Report IBC
3.11 Significant changes from previous Scope of Report IBC reporting
4 Governance
4.1-4 Governance structure Our Sustainability 2 See www.nalco.com, Management Structure 2010 Annual Report and 2011 Proxy Statement
EC Economic Performance
EC1* Direct economic value Economic Sustainability 12,13 See 2010 Nalco Annual Report
EN Environmental Performance
EN3 Direct energy Environmental Sustainability 17
EN4 Indirect energy Environmental Sustainability 17
EN5 Energy conservation efforts Environmental Sustainability 17 Detailed Appendix page 4
EN8* Total water withdrawal Environmental Sustainability 16 Does not include sources.
EN16* Total greenhouse gases (GHG) Environmental Sustainability 18 Does not include mobile sources.
EN18 Initiatives to reduce GHG Environmental Sustainability 18 Detailed Appendix page 4
EN20 NOx and SOx emissions Environmental Sustainability 18
EN 21* Total water discharge Environmental Sustainability 16 Does not include quality.
EN22 Total waste Environmental Sustainability 18
LA Labor Practices and Decent Work
LA7 Rates of Injury Social Sustainability 23 Total Recordable Injuries and Vehicle Accident reporting
*Partially covered in report IFC – Inside Front Cover IBC – Inside Back Cover
32 NALCO 2010 SUSTAINABILITY REPORT
Nalco manages its global operations with concern for the health and safety of individuals, the environment and with a commitment to global sustainable development. We operate by the following principles:
• Developenvironmentallysustainableandsafesolutions—throughour products, processes and technology—that bring value and confidence to our customers, employees, shareholders, communities and our business.
• Striveforcontinualimprovementofpersonnelsafetyandhealthandtheprotectionof the environment with the goal of zero injuries, illnesses, incidents, waste generation and emissions.
• Protecttheenvironmentbyincreasingtheefficientuseofnon-renewablenaturalresources, eliminating waste and minimizing the volume and impact of emissions to air, water and land.
• Conductbusinessinasafe,secureandenvironmentallysoundmanner,consistentwith Responsible Care, the chemical industry's commitment to ensuring a chemical product's safe evolution from concept through customer use, to disposal, recycle or reuse.
• Operateourfacilitiesinasecure,resource-efficientmanner,identifyingandmiti-gating process safety risks while protecting the environment and the health and safety of our employees, contractors and the communities in which we operate.
• Complywithapplicablelawsandregulationsandapplyresponsiblestandardswhere laws and regulations do not exist.
• Trainallemployeestoworksafely,preventinginjuriestothemselvesandothers,avoiding damage to property and protecting the public interest.
• Ensureauditablesystemsandprocessesareinplacetoimplementthese principles and to communicate openly about environment, health and safety issues.
• Supportoftheseprinciplesatalllevelsofmanagementandbyallemployees.
Nalco Safety, Health, Environment and Sustainability Principles
J. Erik Fyrwald
Chairman, President and Chief Executive Officer
July 2011
Scope of reportNalco has published an annual Safety Health and Environment report since 2004. This expanded
Corporate Sustainability Report covers our operations in calendar year 2010. It includes additional
information under the Global Reporting Initiative (GRI) G3 Sustainability Guidelines. Environmental and
Sustainability results are reported for all facilities that are under the control or significant influence of
Nalco. It excludes third party warehouses, district sales offices, stock points and offices for joint
venture companies including Nalco Mobotec and TIORCO, Inc. Our Health and Safety results include
all Nalco employees including these joint ventures and subsidiaries operated by Nalco.
ContactsFor any questions, comments or feedback on this report please email [email protected].
PORTA-FEED, COMPTRENE, PARETO, 3D TRASAR, NALCO and the logos are Trademarks of Nalco CompanyROFA, ROTAMIX are Trademarks of Mobotec AB, used with permissionResponsible Care is a Registered Service Mark of the American Chemistry Council©2011 Nalco Company All Rights Reserved 7-11 B-373
NALCO COMPANY LocationsNorth America: Global Headquarters – 1601 West Diehl Road • Naperville, Illinois 60563 • USA Energy Services Division – 7705 Highway 90-A • Sugar Land, Texas 77487 • USAEurope: A-One Business Center • Z.A. La Pièce 1 • Route de l’Etraz • 1180-Rolle • SwitzerlandAsia Pacific: 2 International Business Park • #02-20 The Strategy Tower 2 • Singapore 609930Latin America: Av. das Nações Unidas 17.891 • 6° Andar 04795-100 • São Paulo • SP • Brazil
www.nalco.com