Embed Size (px)
Citation preview

2007 annual reportLetter To Shareholders - Year In Review - Form 10-K

Quarter OneBusinessWeek publishes its first-ever ranking of
customer-service champs. Cabela’s ranks No. 15 and is
one of only two retailers to make the list.
In February, Cabela’s is named Company of the Year and
receives Sporting Classics magazine’s prestigious Award of
Excellence. Each year the editors of Sporting Classics, one
of North America’s top hunting and fishing publications,
selects a small contingent of craftsmen, artists and
companies in the outdoor industry which represent the best
in professionalism, innovation and ethics.
Quarter ThreeCabela’s opens its second store of the year in Hoffman
Estates, Illinois, a suburb of Chicago.
Cabela’s purchases S.I.R. Warehouse Sports Store, a
Winnipeg-based specialty retailer of hunting, fishing,
camping and related outdoor merchandise. S.I.R. is one
of Canada’s leading outdoor outfitters with a mail-order
operation and a 44,000-square-foot retail store that will
serve as headquarters for Cabela’s Canadian operations.
Quarter TwoCabela’s opens its first store of the year in Hazelwood,
Missouri, a suburb of St. Louis.
Cabela’s economic development bonds related to its
Wheeling, West Virginia, location are refinanced. As a
result, the company receives $43 million from the
retirement of these bonds. Proceeds were used for new
retail store expansion, including capital expenditures and
the purchase of economic development bonds.
Cabela’s sells $60 million of senior notes in a private
placement to qualified institutional buyers. Proceeds
from the offering were used for new retail store
expansion, including capital expenditures and the
purchase of economic development bonds, and general
corporate purposes.
Quarter FourCabela’s opens six additional stores in just a
two-month time frame.
• East Hartford, Connecticut
• Gonzales, Louisiana
• Hammond, Indiana
• Reno, Nevada
• Post Falls, Idaho
• Lacey, Washington
Cabela’s implements customer-service enhancements at
several retail stores ahead of schedule. Enhancements
include In-Store Pick Up, which allows customers to order
products from our direct business and pick them up at
one of our stores, and In-Store Kiosks, which allow
retail customers to order from our entire product
inventory and have the order shipped to their home or
one of our retail stores for pick up.
World’s Foremost Bank exceeds one million average
active credit card accounts in the quarter and more than
$2 billion in total credit card loans outstanding.
Consumer Reports publishes a reader survey report
ranking credit card issuers. The report ranked Cabela’s
branded credit card, Cabela’s CLUB® Visa, among the
top five in cardholder satisfaction, the highest rating held
by a bank-issued credit card.
Cabela’s Web site, www.cabelas.com, ends the year as
the most visited sporting goods industry e-commerce Web
site, according to Hitwise Incorporated.
Year In Review

Letter To ShareholdersDear Cabela’s Shareholders:
Refl ecting back on 2007, I have spent considerable time understanding where we successfully executed and where we did not execute in our business. On one hand, we accomplished signifi cant goals, such as opening eight new retail stores on or ahead of schedule, including seven in a two-month period. On the other hand, we had several challenges, most signifi cantly a tough retail environment in the back half of 2007. We also experienced challenges in our fast-growing retail business, revolving around the execution of our retail model. Adapting our business from a world-class direct marketing company to a fl uid retail business requires signifi cant changes to our core-operating model. Transition to retail is a big change for our company, and I will talk more about this later.
Not to be overshadowed by operating results, our company celebrated signifi cant accomplishments in 2007 by delivering record revenue and record diluted earnings per share. In addition, we added customer service enhancements in several retail stores, which allow customers to shop seamlessly across all channels. Through our In-Store Pick Up Program, customers now have the ability to order products from our direct business and pick them up at one of our stores. In addition, our new In-Store Kiosk Program allows retail customers to order from our entire product inventory, the largest product assortment in the outdoor industry. Also, our highly successful Web site, www.cabelas.com,
was once again the most visited e-commerce Web site in the sporting goods industry for 2007, according to Hitwise Incorporated.
And, in accordance with our plan to further expand our brand, we acquired S.I.R. Warehouse Sports Store in Winnipeg, Manitoba, Canada, which constitutes our fi rst retail presence in the Canadian market and will serve as headquarters for future Canadian expansion. Not only are we very excited about our entrance into the Canadian market, but our customers have shared their excitement with us as well. I look forward to leveraging our strong brand recognition in Canada and providing a new level of brand experience to Canadian consumers.
Our 2007 achievements provide a strong foundation for future growth, and I am very proud of the dedicated employees who made it happen.
Fiscal 2007 Financial Results
For fi scal 2007, we earned a record $88 million, or $1.31 per diluted share, as compared to $86 million, or $1.29 per diluted share, in fi scal 2006. Total revenue for 2007 increased 13.9% to $2.35 billion. Revenue from our direct business (catalog and Internet) increased a solid 3.9% to $1.13 billion. Despite a 1.2% decline in same store sales, retail revenue increased 27.2% to $1.04 billion due to a full-year contribution of four stores opened in 2006 and sales from eight new stores opened in 2007. Financial services revenue increased 15.9% to $159
million. We now have more than one million active credit card account holders who earn rewards redeemable across our multi-channel model. In 2007, purchases made by these cardholders represented more than 26% of our sales.
The Year Ahead
Given the challenging macro-economic environment we experienced in the second half of 2007 and expect to continue into 2008, we made the strategic decision to slow retail store expansion and focus on improving retail operations. As a result, we now plan to open just two new stores in 2008, one in Scarborough, Maine, and the other in Rapid City, South Dakota. Additionally, we have spent a signifi cant amount of time planning and designing our next generation store, designed to be smaller, more effi cient and more productive. Our Rapid City store, scheduled to open in the third quarter, will be our fi rst next generation store. You will be hearing more about our next generation store format in years to come.
From a retail operations perspective, we are taking immediate action to improve results across several key areas in the company. We have launched four specifi c initiatives to focus on improvements in advertising, retail operations, margins and inventory. The expected improvements from these initiatives will go a long way in addressing key challenges faced in 2007. We expect these initiatives to have a signifi cant positive impact on our 2008 operating results.
(continued on inside)
Fiscal Year(Dollars in thousands except per-share data) 2007 2006 2005Total Revenue $2,349,599 $2,063,524 $1,799,661
Gross Profi t $971,213 $859,125 $735,339
Gross Profi t Margin 41.3% 41.6% 40.9%
Operating Income $151,092 $143,745 $114,963
Operating Income Margin 6.4% 7.0% 6.4%
Net Income $87,879 $85,785 $72,569
Diluted Earnings Per Share $1.31 $1.29 $1.10
Diluted Weighted Average Shares Outstanding 67,275,531 66,643,856 66,268,374
Total Cash and Cash Equivalents $131,182 $172,903 $86,923
Inventories $608,159 $484,414 $396,635
Economic Development Bonds $98,035 $117,360 $145,744
Total Debt $503,385 $317,873 $119,826
Total Stockholders’ Equity $828,559 $733,858 $639,853
Financial Highlights
’04’05’06’07
’04’05’06’07
’04’05’06’07
Total Revenue ($ in millions)
Operating Income ($ in millions)
Net Income ($ in millions)
$1,556$1,800
$2,064
$97$115
$144
$65$73
$86
$2,350
$151
$88

About usCabela’s® is a leading specialty retailer, and the world’s
largest direct marketer, of hunting, fi shing, camping
and related outdoor merchandise. Since our founding in
1961, Cabela’s has grown to become one of the most well-
known outdoor recreation brands in the world, and has
long been recognized as the World’s Foremost Outfi tter®.
Through our growing number of retail stores and our well-
established direct business, we offer a wide and distinctive
selection of high-quality outdoor products at competitive
prices while providing superior customer service. We also
issue the Cabela’s CLUB® Visa credit card, which serves
as our primary customer loyalty rewards program.
• Advertising – Our goal is to increase sales lift from retail advertising and drive more traffi c to our stores. Areas of focus include optimizing product selection, density and placement in retail advertising; improving productivity of print advertising; and enhancing the advertising strategy related to new store openings.
• Retail Operations – Our goal is to signifi cantly impact retail store productivity and same store sales by focusing on increasing average ticket; improving overall productivity; enhancing outfi tter training; and addressing underperforming stores.
• Margins – With the goal of improving merchandise gross margins through improved planning and merchandising for our retail stores, we will focus on implementing a new merchandise planning process; enhancing product assortments; f lexing merchandise with more seasonal assortments; and improving visual merchandising.
• Inventory – Improving inventory turns in 2008 is the goal of this initiative. Areas of focus include better leveraging of existing technologies including our advanced replenishment system; reviewing and modifying minimum order quantities; and executing our “open to buy” process.
With these initiatives, we enter 2008 optimistic and determined to positively impact our business. We continue to evolve our business model by adapting and capitalizing on new ideas that will improve performance of our retail stores. For 2008, I am confi dent our employees and our initiatives are properly focused and will result in signifi cant improvements in our business for this year as well as provide a solid foundation for the future. I look forward to updating you on the progress of these initiatives throughout the year.
Cabela’s Advantage
I would like to express how extremely proud I am of the contribution of Cabela’s outfi tters and their response to the economic conditions that challenged us in the second half of 2007. Their true character was revealed as they buckled down to adapt to the changing economic climate in 2007 and willingly and quickly refocused on our strategic direction for 2008. Our outfi tters are certainly a competitive advantage, and I am extremely proud of their positive attitude and dedicated work ethic.
In closing, the management team and I are very committed to providing our shareholders an acceptable return. I recognize our performance, coupled with tough economic conditions, did not provide the return our shareholders expect and deserve. We
continue to live and believe in the values established by our founders Jim and Dick Cabela. We are confi dent the strength of the Cabela’s brand, superior product selection and commitment to customer service will continue to separate us from the competition and provide critical elements for us to enhance shareholder value.
Sincerely,
Dennis HighbyPresident and Chief Executive Offi cer
(letter continued)
Dennis Highby with a 31-inch Ontario, Canada, walleye.

Job TiTle Cabelas 10K Revision 9 seRial DaTe / Time Tuesday, March 11, 2008 /1:07 AM Job numbeR 159962 Type Current page no. 1 opeRaToR PM3
<12345678>
UNITED STATES SECURITIES AND EXCHANGE COMMISSION
Washington, D. C. 20549
Form 10-K
(Mark One)
ANNUAL REPORT PURSUANT TO SECTION 13 OR 15(d) OF THE SECURITIES EXCHANGE ACT OF 1934
For the fiscal year ended December 29, 2007OR
TRANSITION REPORT PURSUANT TO SECTION 13 OR 15(d) OF THE SECURITIES EXCHANGE ACT OF 1934
Commission File Number: 1-32227
CABELA’S INCORPORATED(Exact name of registrant as specified in its charter)
Delaware 20-0486586(State or other jurisdiction of
incorporation or organization)(I.R.S. Employer
Identification Number)
One Cabela Drive, Sidney, Nebraska 69160(Address of principal executive offices) (Zip Code)
Registrant’s telephone number, including area code: (308) 254-5505
Securities registered pursuant to Section 12 (b) of the Act:
Title of each class Name of each exchange on which registeredClass A Common Stock, par value $0.01 per share New York Stock Exchange
Securities registered pursuant to Section 12 (g) of the Act: None
Indicate by check mark if the registrant is a well-known seasoned issuer, as defined in Rule 405 of the Securities Act. Yes No
Indicate by check mark if the registrant is not required to file reports pursuant to Section 13 or 15(d) of the Act. Yes No
Indicate by check mark whether the registrant (1) has filed all reports required to be filed by Section 13 or 15(d) of the Securities Exchange Act of 1934 during the preceding 12 months (or for such shorter period that the registrant was required to file such reports), and (2) has been subject to the filing requirements for at least the past 90 days. Yes No
Indicate by check mark if disclosure of delinquent filers pursuant to Item 405 of Regulation S-K (§229.405 of this chapter) is not contained herein, and will not be contained, to the best of the registrant’s knowledge, in definitive proxy or information statements incorporated by reference in Part III of this Form 10-K or any amendment to this Form 10-K.
Indicate by check mark whether the registrant is a large accelerated filer, an accelerated filer, or a non-accelerated filer. See definition of “accelerated filer and large accelerated filer” in Rule 12b-2 of the Exchange Act).
Large accelerated filer Accelerated filer Non-accelerated file
Indicate by check mark whether the registrant is a shell company (as defined in Rule 12b-2 of the Exchange Act). Yes No
The aggregate market value of the voting and non-voting common equity held by non-affiliates of the registrant was approximately $814,744,121 as of June 29, 2007 (the last business day of the registrant’s most recently completed second fiscal quarter) based upon the closing price of the registrant’s Class A Common Stock on that date as reported on the New York Stock Exchange. For the purposes of this disclosure only, the registrant has assumed that its directors and executive officers and the beneficial owners of 5% or more of its voting common stock as of June 29, 2007, are affiliates of the registrant.
Indicate the number of shares outstanding of each of the issuer’s classes of common stock, as of the latest practicable date.
Common stock, $0.01 par value: 65,888,384 shares as of February 19, 2008.
DOCUMENTS INCORPORATED BY REFERENCE
Portions of the registrant’s definitive Proxy Statement for the Annual Meeting of Shareholders to be held May 13, 2008, are incorporated by reference into Part III of this Form 10-K to the extent stated herein.

Job TiTle Cabelas 10K Revision 9 seRial DaTe / Time Tuesday, March 11, 2008 /1:07 AM Job numbeR 159962 Type Current page no. 2 opeRaToR PM3
<12345678>
Special Note Regarding Forward-Looking Statements
This report contains “forward-looking statements” that are based on our beliefs, assumptions, and expectations of future events, taking into account the information currently available to us. All statements other than statements of current or historical fact contained in this report are forward-looking statements within the meaning of the Private Securities Litigation Reform Act. The words “believe,” “may,” “should,” “anticipate,” “estimate,” “expect,” “intend,” “objective,” “seek,” “plan,” and similar statements are intended to identify forward-looking statements. Forward-looking statements involve risks and uncertainties that may cause our actual results, performance, or financial condition to differ materially from the expectations of future results, performance, or financial condition we express or imply in any forward-looking statements. These risks and uncertainties include, but are not limited to:
• the strength of the economy;
• the level of discretionary consumer spending;
• changes in consumer preferences and demographic trends;
• our ability to successfully execute our multi-channel strategy;
• the ability to negotiate favorable purchase, lease, and/or economic development arrangements for new retail store locations;
• expansion into new markets;
• market saturation due to new retail store openings;
• the rate of growth of general and administrative expenses associated with building a strengthened corporate infrastructure to support our growth initiatives;
• increasing competition in the outdoor segment of the sporting goods industry;
• the cost of our products;
• trade restrictions;
• political or financial instability in countries where the goods we sell are manufactured;
• adverse fluctuations in foreign currencies;
• increases in postage rates or paper and printing costs;
• supply and delivery shortages or interruptions caused by system changes or other factors;
• adverse or unseasonal weather conditions;
• fluctuations in operating results;
• possible assessments from states for sales taxes on direct business sales prior to 2008;
• the cost of fuel increasing;
• road construction around our retail stores;
• labor shortages or increased labor costs;
• increased government regulation;
• inadequate protection of our intellectual property;
• our ability to protect our brand and reputation;
• decreased interchange fees received by our Financial Services business as a result of credit card industry litigation;
• other factors that we may not have currently identified or quantified; and
• other risks, relevant factors, and uncertainties identified in the “Risk Factors” section of this report.
Given the risks and uncertainties surrounding forward-looking statements, you should not place undue reliance on these statements. Our forward-looking statements speak only as of the date of this report. Other than as required by law, we undertake no obligation to update or revise forward-looking statements, whether as a result of new information, future events, or otherwise.

Job TiTle Cabelas 10K Revision 9 seRial DaTe / Time Tuesday, March 11, 2008 /1:07 AM Job numbeR 159962 Type Current page no. 3 opeRaToR PM3
<12345678>
CABELA’S INCORPORATED
FORM 10-K FOR THE FISCAL YEAR ENDED DECEMBER 29, 2007
TABLE OF CONTENTS
PagePART I
Item 1. Business . . . . . . . . . . . . . . . . . . . . . . . . . . . . . . . . . . . . . . . . . . . . . . . . . . . . . . . . . . . . . . . . . . . . . . 2Item 1A. Risk Factors . . . . . . . . . . . . . . . . . . . . . . . . . . . . . . . . . . . . . . . . . . . . . . . . . . . . . . . . . . . . . . . . . . . 9Item 1B. Unresolved Staff Comments. . . . . . . . . . . . . . . . . . . . . . . . . . . . . . . . . . . . . . . . . . . . . . . . . . . . . . . 20Item 2. Properties . . . . . . . . . . . . . . . . . . . . . . . . . . . . . . . . . . . . . . . . . . . . . . . . . . . . . . . . . . . . . . . . . . . . . 20Item 3. Legal Proceedings . . . . . . . . . . . . . . . . . . . . . . . . . . . . . . . . . . . . . . . . . . . . . . . . . . . . . . . . . . . . . . 21Item 4. Submission of Matters to a Vote of Security Holders . . . . . . . . . . . . . . . . . . . . . . . . . . . . . . . . . . . 21
PART IIItem 5. Market for Registrant’s Common Equity, Related Stockholder Matters
and Issuer Purchases of Equity Securities . . . . . . . . . . . . . . . . . . . . . . . . . . . . . . . . . . . . . . . . . 22Item 6. Selected Financial Data . . . . . . . . . . . . . . . . . . . . . . . . . . . . . . . . . . . . . . . . . . . . . . . . . . . . . . . . . . 24Item 7. Management’s Discussion and Analysis of Financial Condition and Results of Operations . . . . . 25Item 7A. Quantitative and Qualitative Disclosures About Market Risk . . . . . . . . . . . . . . . . . . . . . . . . . . . . 48Item 8. Financial Statements and Supplementary Data . . . . . . . . . . . . . . . . . . . . . . . . . . . . . . . . . . . . . . . . 50Item 9. Changes in and Disagreements With Accountants on Accounting and Financial Disclosure . . . . 83Item 9A. Controls and Procedures . . . . . . . . . . . . . . . . . . . . . . . . . . . . . . . . . . . . . . . . . . . . . . . . . . . . . . . . . . 83Item 9B. Other Information . . . . . . . . . . . . . . . . . . . . . . . . . . . . . . . . . . . . . . . . . . . . . . . . . . . . . . . . . . . . . . . 86
PART IIIItem 10. Directors, Executive Officers and Corporate Governance . . . . . . . . . . . . . . . . . . . . . . . . . . . . . . . 86Item 11. Executive Compensation . . . . . . . . . . . . . . . . . . . . . . . . . . . . . . . . . . . . . . . . . . . . . . . . . . . . . . . . . 86Item 12. Security Ownership of Certain Beneficial Owners and Management
and Related Stockholder Matters . . . . . . . . . . . . . . . . . . . . . . . . . . . . . . . . . . . . . . . . . . . . . . . . 86Item 13. Certain Relationships and Related Transactions, and Director Independence . . . . . . . . . . . . . . . . 86Item 14. Principal Accounting Fees and Services . . . . . . . . . . . . . . . . . . . . . . . . . . . . . . . . . . . . . . . . . . . . . 86
PART IVItem 15. Exhibits, Financial Statement Schedules . . . . . . . . . . . . . . . . . . . . . . . . . . . . . . . . . . . . . . . . . . . . . 87SIGNATURES . . . . . . . . . . . . . . . . . . . . . . . . . . . . . . . . . . . . . . . . . . . . . . . . . . . . . . . . . . . . . . . . . . . . . . . . . . . 92

Job TiTle Cabelas 10K Revision 9 seRial DaTe / Time Tuesday, March 11, 2008 /1:07 AM Job numbeR 159962 Type Current page no. 2 opeRaToR PM3
2
<12345678>
PART I
ITEM 1. BUSINESS
Overview
We are a leading specialty retailer, and the world’s largest direct marketer, of hunting, fishing, camping, and related outdoor merchandise. Since our founding in 1961, Cabela’s has grown to become one of the most well-known outdoor recreation brands in the world. We have long been recognized as the “World’s Foremost Outfitter.” Through our growing number of retail stores, and our well-established direct business, we believe we offer the widest, and most distinctive selection of high-quality outdoor products at competitive prices, while providing superior customer service. We also issue the Cabela’s CLUB Visa® credit card, which serves as our primary customer loyalty rewards program. Refer to Note 23 entitled “Segment Reporting” to our consolidated financial statements and our “Management’s Discussion and Analysis of Financial Condition and Results of Operations” for additional financial information regarding our Retail and Direct businesses, as well as our Financial Services business.
We were initially incorporated as a Nebraska corporation in 1965 and were reincorporated as a Delaware corporation in January 2004. In June 2004, we completed our initial public offering of common stock. Our common stock is listed on the New York Stock Exchange under the symbol “CAB.”
Retail Business
We currently operate 27 retail stores, 26 in 19 states and one in Canada. We opened eight retail stores in 2007, increasing our total retail square footage by 1.3 million square feet, or 49%. Retail store total square footage was 4.0 million square feet at the end of 2007. The eight retail stores opened in 2007 were in Hazelwood, Missouri; Hoffman Estates, Illinois; East Hartford, Connecticut; Gonzales, Louisiana; Hammond, Indiana; Reno, Nevada; Post Falls, Idaho; and Lacey, Washington. Our Retail store business operations generated revenue of $1.04 billion in 2007, representing 48.0% of our total revenue from our Retail and Direct businesses.
Customer Service Enhancements. In 2007, we implemented customer service enhancements directed at increasing sales and customer satisfaction in 10 of our retail stores. These enhancements included: 1) in-store pick-up for Internet website orders, 2) installation of Internet kiosks, and 3) the installation of catalog order desks. We expect these customer service enhancements to be available in all existing retail stores in early 2008. We continue to advance our efforts for offering customers integrated opportunities to access and use our retail store, catalog, and Internet channels, including our roll-out of Internet kiosks, catalog order desks, and in-store pick-up for catalog and Internet purchases. Our in-store pick-up program allows customers to have products ordered through our catalogs and Internet site and delivered to the retail store of their choice without incurring shipping costs, increasing foot traffic in our stores. Conversely, our expanding retail stores introduce customers to our Internet and catalog channels. Our multi-channel model employs the same merchandising team, distribution centers, customer database, and infrastructure, which we intend to further capitalize on by building on the strengths of each channel.
Store Format and Atmosphere. Our retail store concept is designed to appeal to the entire family and draw customers from a broad geographic and demographic range. Our retail stores range in size from 35,000 to 247,000 square feet and our large-format retail stores are 150,000 square feet or larger. Our large-format retail stores have been recognized in some states as one of the top tourist attractions, often attracting the construction and development of hotels, restaurants, and other retail establishments in areas adjacent to these stores.
Retail Store Expansion Strategy. Enhancing our retail store efficiencies and taking the necessary steps to improve our financial performance is a high priority in our strategic planning. As such, we continually review our previously announced stores to reconfirm our expectations based on what we have learned over the past year. Based on these ongoing reviews, we now expect to open two retail stores in 2008. We expect to fund our 2008 expansion from a $57 million debt offering completed in January 2008 and from operating cash flows. We are developing a next generation store format intended to improve our return on invested capital and to better serve our customers. In September 2007, we acquired S.I.R. Warehouse Sports in Winnipeg, Manitoba, which will serve as our platform for planned expansion into Canada.

Job TiTle Cabelas 10K Revision 9 seRial DaTe / Time Tuesday, March 11, 2008 /1:07 AM Job numbeR 159962 Type Current page no. 3 opeRaToR PM3
3
<12345678>
Store Locations and Ownership. We currently own 24 of our 27 retail stores. However, in connection with some of the economic development packages received from state or local governments where our stores are located, we have entered into agreements granting ownership of the taxidermy, diorama, or other portions of our stores to these state and local governments. Refer to Item 2 –“Properties” for the locations of our stores.
Direct Business
Our Direct business uses catalogs and the Internet as marketing tools to generate sales orders via the Internet, telephone, and mail. Our Direct business generated revenue of $1.13 billion in 2007, representing 52.0% of our total revenue from our Retail and Direct businesses.
Catalog Distributions. We have been marketing our products through our print catalog distributions to our customers and potential customers for over 46 years. We believe that our catalog distributions have been one of the primary drivers of the growth of our brand and serve as an important marketing tool for our Retail business. In 2007, we mailed more than 140 million catalogs to all 50 states and to more than 170 countries. Our master catalogs offer a broad range of products while our specialty catalogs offer products focused on one outdoor activity, such as fly fishing, archery, or waterfowl, or one product category, such as women’s clothing.
Many of our customers read and browse our catalogs, but order products through our website. Based on our customer surveys, we believe that our customers wish to continue to receive catalogs even though they purchase merchandise and services through our website. Accordingly, we remain committed to marketing our products through our catalogs, as we view our catalogs and the Internet as a unified selling and marketing tool.
Direct Business Marketing. We use our customer database to ensure that customers receive catalogs matching their merchandise preferences, to identify new customers, and to cross-sell merchandise to existing customers. The costs of providing our catalogs continue to increase as postage and printing prices increase. We utilize our marketing knowledge base to determine optimal circulation strategies to decrease our catalog costs while continuing to grow our business. We also market our products through our website which has a number of features, including product information and ordering capabilities, and general information on the outdoor lifestyle. This cost-effective medium is designed to offer a convenient, highly visual, user-friendly, and secure online shopping option for new and existing customers. In addition to the ability to order the same products available in our catalogs, our website gives customers the ability to purchase gift certificates, research outdoor activities, purchase rare and highly specialized merchandise, and choose from other services we provide. The number of visits to our website increased 30.2% in 2007 compared to 2006. Our website was the most visited sports and fitness website in 2007 according to Hitwise, Incorporated, an online measurement company.
Direct Business Acquisitions. We have acquired selected other businesses that comprise a portion of our Direct business, which we believe are an extension of our core competencies. These businesses include Van Dyke’s Restorers, offering home restoration products; Van Dyke’s Taxidermy, offering taxidermy supplies; Antique Home and Hardware, offering home decorating items; Wild Wings, offering wildlife prints and other collectibles; the Ducks Unlimited catalog, offering waterfowl products; and Dunn’s, offering hunting dog equipment and high-end hunting accessories. In 1996, we acquired the assets of the Gander Mountain direct business and integrated them into our business.
Financial Services Business
Through our wholly-owned subsidiary, World’s Foremost Bank, we issue and manage the Cabela’s CLUB Visa card and related customer loyalty rewards program. We believe the Cabela’s CLUB Visa card loyalty rewards program is an effective vehicle for strengthening our relationships with our customers, enhancing our brand name, and increasing our merchandise revenue. The primary purpose of our Financial Services business is to provide our merchandise customers with a rewards program that will enhance revenue, profitability, and customer loyalty in our Retail and Direct businesses.
Our bank subsidiary is an FDIC-insured, special purpose, Nebraska state-chartered bank. Our bank’s charter is limited to issuing credit cards and selling brokered certificates of deposit of $100,000 or more and it does not accept demand deposits or make non-credit card loans. During 2007, we had an average of 987,411 active accounts with an average balance of $1,712.
Job TiTle Cabelas 10K Revision 9 seRial DaTe / Time Tuesday, March 11, 2008 /1:07 AM Job numbeR 159962 Type Current page no. 4 opeRaToR PM3
4
<12345678>
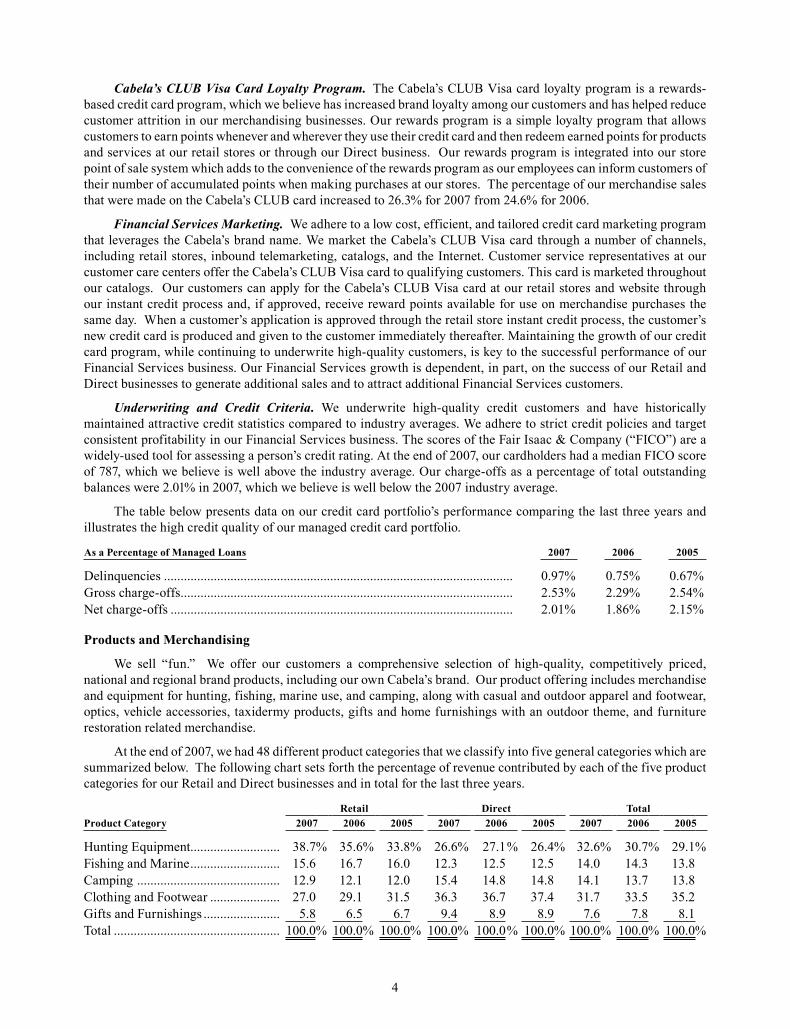
Cabela’s CLUB Visa Card Loyalty Program. The Cabela’s CLUB Visa card loyalty program is a rewards-based credit card program, which we believe has increased brand loyalty among our customers and has helped reduce customer attrition in our merchandising businesses. Our rewards program is a simple loyalty program that allows customers to earn points whenever and wherever they use their credit card and then redeem earned points for products and services at our retail stores or through our Direct business. Our rewards program is integrated into our store point of sale system which adds to the convenience of the rewards program as our employees can inform customers of their number of accumulated points when making purchases at our stores. The percentage of our merchandise sales that were made on the Cabela’s CLUB card increased to 26.3% for 2007 from 24.6% for 2006.
Financial Services Marketing. We adhere to a low cost, efficient, and tailored credit card marketing program that leverages the Cabela’s brand name. We market the Cabela’s CLUB Visa card through a number of channels, including retail stores, inbound telemarketing, catalogs, and the Internet. Customer service representatives at our customer care centers offer the Cabela’s CLUB Visa card to qualifying customers. This card is marketed throughout our catalogs. Our customers can apply for the Cabela’s CLUB Visa card at our retail stores and website through our instant credit process and, if approved, receive reward points available for use on merchandise purchases the same day. When a customer’s application is approved through the retail store instant credit process, the customer’s new credit card is produced and given to the customer immediately thereafter. Maintaining the growth of our credit card program, while continuing to underwrite high-quality customers, is key to the successful performance of our Financial Services business. Our Financial Services growth is dependent, in part, on the success of our Retail and Direct businesses to generate additional sales and to attract additional Financial Services customers.
Underwriting and Credit Criteria. We underwrite high-quality credit customers and have historically maintained attractive credit statistics compared to industry averages. We adhere to strict credit policies and target consistent profitability in our Financial Services business. The scores of the Fair Isaac & Company (“FICO”) are a widely-used tool for assessing a person’s credit rating. At the end of 2007, our cardholders had a median FICO score of 787, which we believe is well above the industry average. Our charge-offs as a percentage of total outstanding balances were 2.01% in 2007, which we believe is well below the 2007 industry average.
The table below presents data on our credit card portfolio’s performance comparing the last three years and illustrates the high credit quality of our managed credit card portfolio.
As a Percentage of Managed Loans 2007 2006 2005
Delinquencies ......................................................................................................... 0.97% 0.75% 0.67%Gross charge-offs .................................................................................................... 2.53% 2.29% 2.54%Net charge-offs ....................................................................................................... 2.01% 1.86% 2.15%
Products and Merchandising
We sell “fun.” We offer our customers a comprehensive selection of high-quality, competitively priced, national and regional brand products, including our own Cabela’s brand. Our product offering includes merchandise and equipment for hunting, fishing, marine use, and camping, along with casual and outdoor apparel and footwear, optics, vehicle accessories, taxidermy products, gifts and home furnishings with an outdoor theme, and furniture restoration related merchandise.
At the end of 2007, we had 48 different product categories that we classify into five general categories which are summarized below. The following chart sets forth the percentage of revenue contributed by each of the five product categories for our Retail and Direct businesses and in total for the last three years.
Retail Direct TotalProduct Category 2007 2006 2005 2007 2006 2005 2007 2006 2005
Hunting Equipment........................... 38.7% 35.6% 33.8% 26.6% 27.1% 26.4% 32.6% 30.7% 29.1%Fishing and Marine ........................... 15.6 16.7 16.0 12.3 12.5 12.5 14.0 14.3 13.8Camping ........................................... 12.9 12.1 12.0 15.4 14.8 14.8 14.1 13.7 13.8Clothing and Footwear ..................... 27.0 29.1 31.5 36.3 36.7 37.4 31.7 33.5 35.2Gifts and Furnishings ....................... 5.8 6.5 6.7 9.4 8.9 8.9 7.6 7.8 8.1Total .................................................. 100.0% 100.0% 100.0% 100.0% 100.0% 100.0% 100.0% 100.0% 100.0%

Job TiTle Cabelas 10K Revision 9 seRial DaTe / Time Tuesday, March 11, 2008 /1:07 AM Job numbeR 159962 Type Current page no. 5 opeRaToR PM3
5
<12345678>
Hunting equipment. We provide equipment, accessories, and consumable supplies for almost every type of hunting and sport shooting. Our hunting products are supported by services such as gun bore sighting, scope mounting, and bow tuning to serve the complete needs of our customer. We also provide items necessary for the completion of any taxidermy project through Van Dyke’s Taxidermy.
Fishing and marine equipment. We provide products for fresh water fishing, fly-fishing, salt water fishing, and ice-fishing. In addition, our fishing and marine equipment offering features a wide selection of electronics, boats and accessories, canoes, kayaks, and other flotation accessories.
Camping gear and equipment. We provide a diverse selection of camping gear and equipment for various experience levels of outdoor enthusiasts. This product category includes a full range of equipment and accessories supporting all outdoor activities, including food preparation, outdoor cooking, travel, and outdoor living. In addition, we include all-terrain vehicles (“ATVs”), as well as accessories for automobiles and ATVs in this category.
Clothing and footwear. Our clothing and footwear merchandise includes both lifestyle apparel and technical gear for the active outdoor enthusiast, as well as apparel and footwear for the casual customer.
Gifts and home furnishings. Our gifts merchandise includes games, food assortments, books, jewelry, and art with outdoor themes. Home furnishings merchandise includes furnishings and accents with outdoor themes for the home and cabin, as well as restoration products. Our home restoration products include unusual and hard-to-find antique furniture and vintage home restoration supplies.
Cabela’s branded products. In addition to national brands, we offer our exclusive Cabela’s branded merchandise. We have a significant penetration of Cabela’s branded merchandise in casual apparel and footwear as well as in selected hard goods categories such as camping, fishing, and optics. Where possible, we seek to protect our Cabela’s branded products by applying for trademark or patent protection for these products. Our Cabela’s branded products typically generate higher gross profit margins compared to our other branded products. In 2007, our Cabela’s branded merchandise accounted for approximately 35% of our merchandise revenue. By having an appropriate mix of Cabela’s branded and other branded merchandise, we strive to meet the expectations and needs of our customers and expand the recognition of the Cabela’s brand.
Marketing
We seek to increase the amount each customer spends on our merchandise through enhanced customer targeting, continued introduction of new catalog titles, and the development and marketing of new products. We have taken advantage of web-based technologies such as targeted promotional e-mails, on-line shopping engines, and Internet affiliate programs to increase sales. We also are improving our customer relationship management system, which we expect will allow us to better manage our customer relationships and more effectively tailor our marketing programs. We will use our expanding Retail business to capitalize on additional customer purchase history and information.
Our marketing strategy focuses on using our multi-channel model to build the strength and recognition of our brand by communicating our wide and distinctive offering of quality products to our customers, and potential customers, in a cost effective manner. Our largest marketing effort consists of distributing over 140 million catalogs annually in order to attract customers to our Retail and Direct businesses. We have also established our website to market our products to customers and potential customers who shop via the Internet. We use both our catalogs and our website to cross-market at our retail stores. Our marketing strategy is designed to convey our outdoor lifestyle image, enhance our brand, and emphasize our position in our target markets.
In addition to the use of our catalogs and our website, we also use a combination of promotional events, traditional advertising, and media programs as marketing tools. We engage in promotional activities related to Professional Bull Riding, the Iditarod Trail Sled Dog Race, and Dock Dogs, as well as sponsor sportsmen and women advocacy groups and wildlife conservation organizations, including U.S. Sportsmen’s Alliance, National Rifle Association, National Wild Turkey Federation, Women in the Outdoors, Rocky Mountain Elk Foundation, Whitetails Unlimited, Pheasants Forever, Ducks Unlimited, Delta Waterfowl, Trout Unlimited, and Safari Club International, in addition to national, regional, and local fishing tournaments and other related activities.
In addition, we have historically been able to count on extensive free publicity from the unique Cabela’s shopping experience when we open a store. As we enter more metropolitan markets, where the opening of a Cabela’s store is not headline news, we will need to supplement this free publicity with additional advertising to increase consumer awareness of new store openings.

Job TiTle Cabelas 10K Revision 9 seRial DaTe / Time Tuesday, March 11, 2008 /1:07 AM Job numbeR 159962 Type Current page no. 6 opeRaToR PM3
6
<12345678>
Competition
We compete in a number of large and highly fragmented and intensely competitive markets, including the outdoor recreation, and casual apparel and footwear markets. The outdoor recreation market is comprised of several categories including hunting, fishing, camping, and wildlife watching, and we believe it crosses over a wide range of geographic and demographic segments.
We compete directly or indirectly with other broad-line merchants, large-format sporting goods stores and chains, mass merchandisers, warehouse clubs, discount and department stores, small specialty retailers, and catalog and Internet-based retailers.
We believe that we compete effectively with our competitors on the basis of our wide and distinctive merchandise selection, and the superior customer service associated with the Cabela’s brand, as well as our commitment to understanding and providing merchandise that is relevant to our targeted customer base. We cater to the outdoor enthusiast and the casual customer, and believe we have an appealing store environment. We also believe that our multi-channel model enhances our ability to compete by allowing our customers to choose the most convenient sales channel. This model also allows us to reach a broader audience in existing and new markets and to continue to build on our nationally recognized Cabela’s brand.
Customer Service
Since our founding in 1961, we have been deeply committed to serving our customers by selling high-quality products through sales associates who deliver excellent customer service and in-depth product knowledge. We strive to provide superior customer service at the time of sale and after the sale through our 100-percent money-back guarantee. Our customers can always access well-trained, knowledgeable associates to answer their product use and merchandise selection questions. In the latter part of 2007, we began implementing customer service enhancements directed, in part, at increasing customer satisfaction. These enhancements continue our efforts at offering customers integrated opportunities to access and use our retail store, catalog, and Internet channels through our introduction of Internet kiosks, catalog order desks, and in-store pick-up for catalog and Internet purchases. Our in-store pick-up program allows customers to have products ordered through our catalogs and Internet site and delivered to the retail store of their choice without incurring shipping costs, increasing foot traffic in our stores. Conversely, our expanding retail stores introduce customers to our Internet and catalog channels. We believe that our ability to establish and maintain long-term relationships with our customers and encourage repeat visits and purchases is due, in part, to the strength of our customer support and service operations.
Distribution and Fulfillment
We operate distribution centers located in Sidney, Nebraska; Prairie du Chien, Wisconsin; and Wheeling, West Virginia. These distribution centers comprise nearly 3.0 million square feet of warehouse space for our retail store replenishment and Direct business activities. We ship merchandise to our Direct business customers via United Parcel Service and the U. S. Postal Service. We use common carriers and typically deliver inventory two to three times per week for replenishment of our retail stores.
Management Information Systems
Our management information and operational systems manage our Retail, Direct, and Financial Services businesses. These systems are designed to process customer orders, track customer data and demographics, order, monitor and maintain sufficient amounts of inventory, facilitate vendor transactions, and provide financial reporting. We continually evaluate, modify, and update our information technology systems supporting the supply chain, including our design, sourcing, merchandise planning, forecasting and purchase order, inventory, distribution, transportation, and price management systems. We are making modifications to our technology that will involve updating or replacing certain systems with successor systems during the course of several years, including improvements to our systems for multi-channel tracking and processing of inventory, and improvements to our customer relationship management system.

Job TiTle Cabelas 10K Revision 9 seRial DaTe / Time Tuesday, March 11, 2008 /1:07 AM Job numbeR 159962 Type Current page no. 7 opeRaToR PM3
7
<12345678>
Highlights during 2007 from our management information systems impacting our multi-channel distribution included:
• We rolled out to our retail stores in the first half of 2007 a new warehouse management system for tracking inventory in a multi-channel environment allowing us to more accurately and timely route inventory for distribution.
• We created in-house software to interface with our inventory replenishment system to ensure this system always has valid inventory counts so it will accurately replenish store merchandise, helping to increase customer satisfaction and sales. We also added additional vendors onto our inventory replenishment system.
• We continued working on our merchandise management system, which consolidates information related to our item master, vendor master, and purchase order system, and provides the foundation for how we account for and manage our merchandise process.
Employees
At the end of 2007, we employed approximately 15,000 employees, approximately 7,600 of whom were employed full time. We use part-time and temporary workers to supplement our labor force at peak times during our third and fourth quarters. None of our employees are represented by a labor union or are party to a collective bargaining agreement. We have not experienced any work stoppages and consider our relationship with our employees to be good.
Seasonality
We experience seasonal fluctuations in our revenue and operating results. Due to buying patterns around the holidays and the opening of hunting seasons, our merchandise revenue is traditionally higher in the third and fourth quarters than in the first and second quarters, and we typically earn a disproportionate share of our operating income in the fourth quarter. Because of our retail store expansion, and fixed costs associated with retail stores, our quarterly operating income may be further impacted by these seasonal fluctuations. Refer to Note 24 to our consolidated financial statements for quarterly results of operations for 2007 and 2006.
Government Regulation
Regulation of Our Bank Subsidiary. Our wholly-owned bank subsidiary is a Nebraska state-chartered bank with deposits insured by the Bank Insurance Fund of the Federal Deposit Insurance Corporation (“FDIC”). Our bank subsidiary is subject to comprehensive regulation and periodic examination by the Nebraska Department of Banking and Finance (“NDBF”) and the FDIC. We also are registered as a bank holding company with the NDBF and as such are subject to periodic examination by the NDBF.
Our bank subsidiary does not qualify as a “bank” under the Bank Holding Company Act of 1956, as amended, (“BHCA”), because it is in compliance with a credit card bank exemption from the BHCA. If it failed to meet the credit card bank exemption criteria, its status as an insured depository institution would make us subject to the provisions of the BHCA, including restrictions as to the types of business activities in which a bank holding company and its affiliates may engage. We could be required to either divest our bank subsidiary or divest or cease any activities not permissible for a bank holding company and its affiliates, including our Retail and Direct businesses. While the consequences of being subject to regulation under the BHCA would be severe, we believe that the risk of being subject to the BHCA is minimal as a result of the precautions we have taken in structuring our business.
There are various federal and Nebraska laws and regulations relating to minimum regulatory capital requirements and requirements concerning the payment of dividends from net profits or surplus, restrictions governing transactions between an insured depository institution and its affiliates, and general federal and Nebraska regulatory oversight to prevent unsafe or unsound practices. At the end of 2007, our bank subsidiary met the requirements for a “well capitalized” institution, the highest of the Federal Deposit Insurance Corporation Improvement Act’s (“FDICIA”) five capital ratio levels. A “well capitalized” classification should not necessarily be viewed as describing the condition or future prospects of a depository institution, including our bank subsidiary.

Job TiTle Cabelas 10K Revision 9 seRial DaTe / Time Tuesday, March 11, 2008 /1:07 AM Job numbeR 159962 Type Current page no. 8 opeRaToR PM3
8
<12345678>
FDICIA also requires the FDIC to implement a system of risk-based premiums for deposit insurance pursuant to which the premiums paid by a depository institution will be based on the probability that the FDIC will incur a loss in respect of that institution. The FDIC has since adopted a system that imposes insurance premiums based upon a matrix that takes into account an institution’s capital level and supervisory rating.
Subject to certain limitations, federal bank agencies may also require banking organizations such as our bank subsidiary to hold regulatory capital against the full risk-weighted amount of its retained securitization interests. We understand that these federal bank agencies continue to analyze interests in securitization transactions under their rules to determine the appropriate capital treatment. Any such determination could require our bank subsidiary to hold significantly higher levels of regulatory capital against such interests.
The activities of our bank subsidiary as a consumer lender also are subject to regulation under the various federal and state laws. We spend significant amounts of time ensuring we are in compliance with these laws and work with our service providers to ensure that actions they take in connection with services they perform for us are also in compliance with these laws. Depending on the underlying issue and applicable law, regulators are often authorized to impose penalties for violations of these statutes and, in some cases, to order our bank subsidiary to compensate injured borrowers. Borrowers may also have a private right of action to bring actions for some violations. Federal bankruptcy and state debtor relief and collection laws also affect the ability of our bank subsidiary to collect outstanding balances owed by borrowers.
Taxation Applicable to Us. We pay applicable corporate income, franchise, and other taxes to states in which our retail stores are physically located. As we open more retail stores, we will be subject to tax in an increasing number of state and local taxing jurisdictions. Upon entering a new state, we historically applied for a private letter ruling from the state’s revenue department stating which types of taxes our Retail and Direct businesses would be required to collect and pay in such state, and we accrued and remitted the applicable taxes based upon the private letter ruling. Although we believe we properly accrued for these taxes based on our interpretation of the tax code and prior private letter rulings, state taxing authorities may challenge our interpretation or attempt to revoke their prior private letter rulings. If state taxing authorities are successful, additional taxes, interest, and related penalties may be assessed. See “Risk Factors - Our historic sales tax collection policy for our Direct business may subject us to liabilities for unpaid sales taxes on past Direct business sales” and “-The customer service enhancements we are implementing at our retail stores will cause our Direct business to establish nexus in the states where our retail stores are located, which will cause our Direct business to pay additional income and sales taxes and may have an adverse effect on the profitability and cash flows of our Direct business.”
Other Regulations Applicable to Us. We must comply with federal, state, and local regulations, including the federal Brady Handgun Violence Prevention Act, which require us, as a federal firearms licensee, to perform a pre-sale background check of purchasers of hunting rifles and other firearms.
We also are subject to a variety of state laws and regulations relating to, among other things, advertising, pricing, and product safety/restrictions. Some of these laws prohibit or limit the sale, in certain states and locations, of certain items we offer such as black powder firearms, ammunition, bows, knives, and similar products. State and local government regulation of hunting can also affect our business.
We are subject to certain federal, state, and local laws and regulations relating to the protection of the environment and human health and safety. We believe that we are in substantial compliance with the terms of environmental laws and that we have no liabilities under such laws that we expect to have a material adverse effect on our business, results of operations, or financial condition.
Our Direct business is subject to the Mail or Telephone Order Merchandise Rule and related regulations promulgated by the Federal Trade Commission (“FTC”) which affect our catalog mail order operations. FTC regulations, in general, govern the solicitation of orders, the information provided to prospective customers, and the timeliness of shipments and refunds. In addition, the FTC has established guidelines for advertising and labeling many of the products we sell.

Job TiTle Cabelas 10K Revision 9 seRial DaTe / Time Tuesday, March 11, 2008 /1:07 AM Job numbeR 159962 Type Current page no. 9 opeRaToR PM3
9
<12345678>
Intellectual Property
Cabela’s®, Cabela’s CLUB®, Cabelas.com®, World’s Foremost Outfitter®, World’s Foremost Bank®, Bargain Cave®, Dunn’s®, Van Dyke’s®, Wild Wings® and Herters® are among our registered service marks or trademarks with the United States Patent and Trademark Office. We have numerous pending applications for trademarks. In addition, we own several other registered and unregistered trademarks and service marks involving advertising slogans and other names and phrases used in our business. We own certain patents associated with various products. We also own trade secrets, domain names, and copyrights, which have been registered for each of our catalogs.
We believe that our trademarks are valid and valuable and intend to maintain our trademarks and any related registrations. We do not know of any material pending claims of infringement or other challenges to our right to use our marks in the United States or elsewhere. We have no franchises or other concessions which are material to our operations.
Available Information
Our website address is www.cabelas.com. We make available on our website, free of charge, our annual reports on Form 10-K, quarterly reports on Form 10-Q, current reports on Form 8-K, and any amendments to those reports, as soon as reasonably practicable after we electronically file such material with or furnish it to the Securities and Exchange Commission (“SEC”). Our SEC reports can be accessed through the investor relations section of our website. The information on our website, whether currently posted or in the future, is not part of this or any other report we file with or furnish to the SEC.
ITEM 1A. RISK FACTORS
Risk Factors
Risks Related to Our Merchandising Business
A decline in discretionary consumer spending could reduce our revenue.
Our revenue depends on discretionary consumer spending, which may decrease due to a variety of factors beyond our control, including:
• unfavorable general business conditions;
• increases in interest rates;
• increases in inflation;
• wars, fears of war, and terrorist attacks and organizing activities;
• increases in consumer debt levels and decreases in the availability of consumer credit;
• adverse or unseasonal weather conditions or events;
• increases in gasoline prices reducing the willingness to travel to our retail stores;
• adverse changes in applicable laws and regulations;
• increases in taxation;
• adverse fluctuations of foreign currencies;
• adverse unemployment trends;
• adverse conditions in the subprime mortgage and housing markets; and
• other factors that adversely influence consumer confidence and spending.
Our customers’ purchases of discretionary items, including our products, could decline during periods when disposable income is lower or periods of actual or perceived unfavorable economic conditions. If this occurs, our revenue would decline.

Job TiTle Cabelas 10K Revision 9 seRial DaTe / Time Tuesday, March 11, 2008 /1:07 AM Job numbeR 159962 Type Current page no. 10 opeRaToR PM3
10
<12345678>
Competition in the outdoor recreation and casual apparel and footwear markets could reduce our revenue and profitability.
The outdoor recreation and casual apparel and footwear markets are highly fragmented and competitive. We compete directly or indirectly with the following types of companies:
• other specialty retailers that compete with us across a significant portion of our merchandising categories through retail store or direct businesses, such as Bass Pro Shops, Gander Mountain, Orvis, The Sportsman's Guide, and Sportsman's Warehouse;
• large-format sporting goods stores and chains, such as The Sports Authority, Dick's Sporting Goods, and Big 5 Sporting Goods;
• retailers that currently compete with us through retail businesses that may enter the direct business;
• mass merchandisers, warehouse clubs, discount stores, and department stores, such as Wal-Mart and Target; and
• casual outdoor apparel and footwear retailers, such as L.L. Bean, Lands’ End, and REI.
Many of our competitors have a larger number of stores, and some of them have substantially greater market presence, name recognition, and financial, distribution, marketing, and other resources than we have. In addition, if our competitors reduce their prices, we may have to reduce our prices in order to compete. Furthermore, some of our competitors have been aggressively building new stores in locations with high concentrations of our Direct business customers. As a result of this competition, we may need to spend more on advertising and promotion. Some of our mass merchandising competitors, such as Wal-Mart, do not currently compete in many of the product lines we offer. If these competitors were to begin offering a broader array of competing products, or if any of the other factors listed above occurred, our revenue could be reduced or our costs could be increased, resulting in reduced profitability.
If we fail to maintain the strength and value of our brand, our revenue is likely to decline.
Our success depends on the value and strength of the Cabela’s brand. The Cabela’s name is integral to our business as well as to the implementation of our strategies for expanding our business. Maintaining, promoting, and positioning our brand will depend largely on the success of our marketing and merchandising efforts and our ability to provide high quality merchandise and a consistent, high quality customer experience. Our brand could be adversely affected if we fail to achieve these objectives or if our public image or reputation were to be tarnished by negative publicity. Any of these events could result in decreases in revenue.
If we cannot successfully implement our retail store expansion strategy, our growth and profitability would be adversely impacted.
We continue to actively seek additional locations to open new retail stores. Our ability to open new retail stores in a timely manner and operate them profitably depends on a number of factors, many of which are beyond our control, including:
• our ability to manage the financial and operational aspects of our retail growth strategy;
• our ability to identify suitable locations, including our ability to gather and assess demographic and marketing data to determine consumer demand for our products in the locations we select;
• our ability to negotiate and obtain economic development packages with local and state governments where our new retail stores would be located;
• our ability to properly assess the implications of economic development packages and customer density to project the profitability of potential new retail store locations;
• our ability to secure required governmental permits and approvals;
• our ability to hire and train skilled store operating personnel, especially management personnel;
• the availability of construction materials and labor and the absence of significant construction delays or cost overruns;

Job TiTle Cabelas 10K Revision 9 seRial DaTe / Time Tuesday, March 11, 2008 /1:07 AM Job numbeR 159962 Type Current page no. 11 opeRaToR PM3
11
<12345678>
• our ability to provide a satisfactory mix of merchandise that is responsive to the needs of our customers living in the areas where new retail stores are built;
• our ability to supply new retail stores with inventory in a timely manner;
• our ability to properly assess operational and regulatory challenges involved in opening and successfully operating retail stores in Canada;
• our competitors building or leasing stores near our retail stores or in locations we have identified as targets for a new retail store;
• general economic and business conditions affecting consumer confidence and spending and the overall strength of our business; and
• the availability of financing on favorable terms.
We may not be able to sustain the growth in the number of our retail stores, the revenue growth historically achieved by our retail stores, or to maintain consistent levels of profitability in our Retail business, particularly as we expand into markets now served by other large-format sporting goods retailers and mass merchandisers. In particular, new retail stores typically generate lower operating margins because pre-opening costs are fully expensed in the year of opening and because fixed costs, as a percentage of revenue, are higher. In addition, the substantial management time and resources which our retail store expansion strategy requires may result in disruption to our existing business operations which may harm our profitability.
Our continued retail expansion will result in a higher number of retail stores, which could adversely affect the desirability of our retail stores, harm the operating results of our Retail business, and reduce the revenue of our Direct business.
As the number of our retail stores increases, our stores will become more highly concentrated in the geographic regions we serve. As a result, the number of customers and related revenue at individual stores may decline and the average amount of sales per square foot at our stores may be reduced. In addition, as we open more retail stores and as our competitors open stores with similar formats, our retail store format may become less unique and may be less attractive to customers as tourist and entertainment shopping locations. If either of these events occurs, the operating results of our Retail business could be adversely affected. The growth in the number of our retail stores may also draw customers away from our Direct business. If we are unable to properly manage the relationship between our Direct business and our Retail business, the revenue of our Direct business could be adversely affected.
Our failure to successfully manage our Direct business could have a material adverse effect on our operating results and cash flows.
During 2007, our Direct business accounted for 52.0% of the total revenue in our Retail and Direct businesses. Our Direct business is subject to a number of risks and uncertainties, some of which are beyond our control, including the following:
• our inability to properly adjust the fixed costs of a catalog mailing to reflect subsequent sales of the products marketed in the catalog;
• lower and less predictable response rates for catalogs sent to prospective customers;
• increases in U.S. Postal Service rates, paper costs, and printing costs resulting in higher catalog production costs and lower profits for our Direct business;
• failures to properly design, print, and mail our catalogs in a timely manner;
• failures to introduce new catalog titles;
• failures to timely fill customer orders;
• changes in consumer preferences, willingness to purchase goods through catalogs or the Internet, weak economic conditions and economic uncertainty, and unseasonal weather in key geographic markets;
• increases in software filters that may inhibit our ability to market our products through e-mail messages to our customers and increases in consumer privacy concerns relating to the Internet;

Job TiTle Cabelas 10K Revision 9 seRial DaTe / Time Tuesday, March 11, 2008 /1:07 AM Job numbeR 159962 Type Current page no. 12 opeRaToR PM3
12
<12345678>
• changes in applicable federal and state regulation;
• breaches of Internet security; and
• failures in our Internet infrastructure or the failure of systems of third parties, such as telephone or electric power service, resulting in website downtime, customer care center closures, or other problems.
Any one or more of these factors could result in lower-than-expected revenue for our Direct business. These factors could also result in increased costs, increased merchandise returns, slower turning inventories, inventory write-downs, and working capital constraints. Because our Direct business accounts for a significant portion of our total revenue, any performance shortcomings experienced by our Direct business would likely have a material adverse effect on our operating results and cash flows.
We are implementing substantial systems changes in support of our Direct business and retail store expansion that might disrupt our supply chain operations.
Our success depends on our ability to source merchandise efficiently through appropriate management information and operational systems and procedures. We regularly evaluate our information technology systems and are implementing modifications to our technology that will involve updating or replacing our systems with successor systems during the course of several years, including changes to our merchandising systems and improvements to our customer relationship management system. There are inherent risks associated with replacing or modifying these systems, including supply chain disruptions that could affect our ability to deliver products to our stores and our customers in an efficient manner. In addition, in updating and replacing our systems, we may be unable to accurately capture and transfer data. We may be unable to successfully launch these new systems, the launch of these new systems could result in supply chain disruptions, or the actual cost may exceed the estimated cost of these new systems, any of which could have an adverse effect on our financial condition and results of operations. Additionally, there is no assurance that successfully implemented new systems will deliver value to us.
Any disruption of the supply of products and services from our vendors could have an adverse impact on our revenue and profitability.
Our vendors and service providers include the following:
• vendors to supply our merchandise in sufficient quantities at competitive prices in a timely manner;
• outside printers and catalog production vendors to print and mail our catalogs and to convert our catalogs to digital format for website posting;
• shipping companies, such as United Parcel Service, the U.S. Postal Service, and common carriers, for timely delivery of our catalogs, shipment of merchandise to our customers, and delivery of merchandise from our vendors to us and from our distribution centers to our retail stores;
• telephone companies to provide telephone service to our in-house customer care centers;
• communications providers to provide our Internet users with access to our website and a website hosting service provider to host and manage our website;
• software providers to provide software and related services to run our operating systems for our Retail and Direct businesses; and
• third-party card processors, such as First Data Resources, that process Cabela’s CLUB Visa transactions.
Any disruption in these services could have a negative impact on our ability to market and sell our products, and serve our customers. Our ten largest trade vendors collectively represented approximately 13% of our total merchandise purchases in 2007. If we are unable to acquire suitable merchandise or lose one or more key vendors, we may not be able to offer products that are important to our merchandise assortment. We also are subject to risks, such as the unavailability of raw materials, labor disputes, union organizing activity, strikes, inclement weather, natural disasters, war and terrorism, and adverse general economic and political conditions that might limit our vendors’ ability to provide us with quality merchandise on a timely basis. We have no contractual arrangements providing for continued supply from our key vendors and our vendors may discontinue selling to us at any time. We may not be able

Job TiTle Cabelas 10K Revision 9 seRial DaTe / Time Tuesday, March 11, 2008 /1:07 AM Job numbeR 159962 Type Current page no. 13 opeRaToR PM3
13
<12345678>
to develop relationships with new vendors, and products from alternative sources, if any, may be of a lesser quality and more expensive than those we currently purchase. Any delay or failure in offering products to our customers could have an adverse impact on our revenue and profitability. In addition, if the cost of fuel rises, the cost to deliver merchandise to the customers of our Direct business and from our distribution centers to our retail stores may rise which could have an adverse impact on our profitability.
Political and economic uncertainty and unrest in foreign countries where our merchandise vendors are located could adversely affect our operating results.
In 2007, approximately 49% of our merchandise was obtained directly from vendors located in foreign countries, with approximately 43% of our merchandise being obtained from vendors located in China, Taiwan, Mexico, Vietnam, and Japan. In addition, we believe that a significant portion of our other vendors obtain their products from foreign countries that may also be subject to political and economic uncertainty. We are subject to risks and uncertainties associated with changing economic and political conditions in foreign countries where our vendors are located, such as:
• increased import duties, tariffs, trade restrictions, and quotas;
• work stoppages;
• economic uncertainties (including inflation);
• adverse foreign government regulations;
• wars, fears of war, and terrorist attacks and organizing activities;
• adverse fluctuations of foreign currencies; and
• political unrest.
We cannot predict when, or the extent to which, the countries in which our products are manufactured will experience any of the above events. Any event causing a disruption or delay of imports from foreign locations would likely increase the cost or reduce the supply of merchandise available to us and would adversely affect our operating results, particularly if imports of our Cabela’s branded merchandise were adversely affected as our margins are higher on our Cabela’s branded merchandise.
Our ability to source our merchandise, or to source our merchandise at all, as well as the related profitability, could be hurt if new trade restrictions are imposed or existing trade restrictions become more burdensome.
Trade restrictions, including increased tariffs, safeguards, or quotas, on apparel and accessories, could increase the cost or reduce the supply of merchandise available to us. Under the World Trade Organization (“WTO”) Agreement, effective January 1, 2005, the United States and other WTO member countries removed quotas on goods from WTO members, which in certain instances affords us greater flexibility in importing textile and apparel products from WTO countries from which we source our merchandise. However, as the removal of quotas resulted in an import surge from China, the United States in May 2005 imposed safeguard quotas on seven categories of goods and apparel imported from China. Effective January 1, 2006, the United States imposed quotas on certain categories of goods and apparel from China, and may impose additional quotas in the future. These and other trade restrictions could have a significant impact on our sourcing patterns in the future. Trade restrictions, including increased tariffs or quotas, embargoes, safeguards, and customs restrictions against apparel items, as well as U.S. or foreign labor strikes, work stoppages, or boycotts could increase the cost or reduce the supply of merchandise available to us or may require us to modify our current business practices, any of which could hurt our profitability.
Due to the seasonality of our business, our annual operating results would be adversely affected if our revenue during the fourth quarter was substantially below expectations.
We experience seasonal fluctuations in our revenue and operating results. Historically, we have realized a significant portion of our revenue and earnings for the year in the fourth quarter. In 2007, we generated 37.9% of our revenue, and 64.0% of our net income, in the fourth quarter. We incur significant additional expenses in the fourth quarter due to higher customer purchase volumes and increased staffing. If we miscalculate the demand for our products generally or for our product mix during this quarter, our revenue could decline, which would harm our

Job TiTle Cabelas 10K Revision 9 seRial DaTe / Time Tuesday, March 11, 2008 /1:07 AM Job numbeR 159962 Type Current page no. 14 opeRaToR PM3
14
<12345678>
financial performance. In addition, abnormally warm weather conditions during the fourth quarter can reduce sales of many of the products normally sold during this time period and inclement weather can reduce store traffic or cause us to temporarily close stores causing a reduction in revenue. Because a substantial portion of our operating income is derived from our fourth quarter revenue, a shortfall in expected fourth quarter revenue would cause our annual operating results to suffer significantly.
If we lose key management or are unable to attract and retain the talent required for our business, our operating results could suffer.
Our future success depends to a significant degree on the skills, experience and efforts of Dennis Highby, our President and Chief Executive Officer, and other key personnel including our senior executive management and merchandising teams. With the exception of our Chairman, Richard N. Cabela, and our Vice Chairman, James W. Cabela, none of our senior management or directors has employment agreements other than our Management Change of Control Severance Agreements. We do not carry key-man life insurance on any of our executives or key management personnel. In addition, our corporate headquarters is located in a sparsely populated rural area which may make it difficult to attract and retain qualified individuals for key management positions. The loss of the services of any of these individuals or the inability to attract and retain qualified individuals for our key management positions could cause our operating results to suffer.
Our business depends on our ability to meet our labor needs, and if we are unable to do so, our retail store expansion strategy may be delayed and our revenue growth may suffer.
Our success depends on hiring, training, managing, and retaining quality managers, sales associates, and employees in our retail stores and customer care centers. Our corporate headquarters, distribution centers, return center, and some of our retail stores are located in sparsely populated rural areas. It may be difficult to attract and retain qualified personnel, especially management and technical personnel, in these areas. Competition for qualified management and technical employees could require us to pay higher wages or grant above market levels of stock compensation to attract a sufficient number of employees. If we are unable to attract and retain qualified personnel as needed, the implementation of our retail store expansion strategy may be delayed and our revenue growth may suffer.
Our historic sales tax collection policy for our Direct business may subject us to liabilities for unpaid sales taxes on past Direct business sales.
Many states have attempted to require that out-of-state direct marketers, whose only contacts with the state are solicitations and delivery to their residents of products purchased through the mail or the Internet, collect sales taxes on the sale of these products. In addition, a private litigant, purportedly on behalf of various states, has initiated litigation against several out-of-state direct marketers alleging that the failure to collect and remit sales tax violates various state false claims laws. The U.S. Supreme Court has held that states, absent congressional legislation, may not impose tax collection obligations on out-of-state direct marketers unless the out-of-state direct marketer has nexus with the state. Nexus generally is created by the physical presence of the direct marketer, its agents or its property within the state. Our sales tax collection policy for our Direct business is to collect and remit sales tax in states where our Direct business has established nexus. Prior to the opening of a retail store, we historically sought a private letter ruling from the state in which the store would be located as to whether our Direct business would have nexus with that state as a result of the store opening. Some states have enacted legislation that requires sales tax collection by direct marketers with no physical presence in that state. In some instances, the legislation assumes nexus exists because of the physical presence of an affiliated entity engaged in the same line of business. We may receive future assessments from states for unpaid sales taxes on prior Direct business sales. In addition, a competitor has commenced an action against us alleging that our failure to collect and remit sales tax in certain states constitutes unfair competition. We presently intend to vigorously contest any future sales tax assessments and this action, but we may not prevail. If we do not prevail, we could be held liable for sales taxes on prior Direct business sales which could be substantial.

Job TiTle Cabelas 10K Revision 9 seRial DaTe / Time Tuesday, March 11, 2008 /1:07 AM Job numbeR 159962 Type Current page no. 15 opeRaToR PM3
15
<12345678>
The customer service enhancements we are implementing at our retail stores will cause our Direct business to establish nexus in the states where our retail stores are located, which will cause our Direct business to pay additional income and sales taxes and may have an adverse effect on the profitability and cash flows of our Direct business.
The customer service enhancements we are implementing at our retail stores are designed to increase customer convenience, purchasing, and delivery options. These enhancements include Internet kiosks, catalog order desks, and in-store pick-up areas for catalog and Internet purchases. Because these enhancements will cause our Direct business to establish nexus in states where our retail stores are located, we began, effective January 2008, collecting and remitting sales taxes on Direct business sales to customers located in these states. The establishment of nexus and imposition of income and use taxes by states on sales of our Direct business:
• will increase the tax collection and payment obligations of our Direct business, which could create administrative burdens for us;
• could increase the total cost of our products in our Direct business to our customers relative to our competitors that do not collect sales taxes on Direct business sales; and
• could decrease the sales of our Direct business or cause us to reduce the underlying prices for the products sold through our Direct business.
These events could have an adverse effect on the profitability and cash flows of our Direct business.
We must successfully order and manage our inventory to reflect customer demand and anticipate changing consumer preferences and buying trends or our revenue and profitability will be adversely affected.
Our success depends upon our ability to successfully manage our inventory and to anticipate and respond to merchandise trends and customer demands in a timely manner. We cannot predict consumer preferences with certainty and they may change over time. We usually must order merchandise well in advance of the applicable selling season. The extended lead times for many of our purchases may make it difficult for us to respond rapidly to new or changing product trends or changes in prices. If we misjudge either the market for our merchandise or our customers’ purchasing habits, our revenue may decline significantly and we may not have sufficient quantities of merchandise to satisfy customer demand or we may be required to mark down excess inventory, either of which would result in lower profit margins. In addition, as we implement our retail store expansion strategy, we will need to construct additional distribution centers or expand the size of our existing distribution centers to support our growing number of retail stores. If we are unable to find suitable locations for new distribution centers or to timely integrate new or expanded distribution centers into our inventory control process, we may not be able to deliver inventory to our retail stores in a timely manner, which could have an adverse effect on the revenue and cash flows of our Retail business.
A natural disaster or other disruption at our distribution centers or return facility could cause us to lose merchandise and be unable to effectively deliver to our direct customers and retail stores.
We currently rely on distribution centers in Sidney, Nebraska; Prairie du Chien, Wisconsin; and Wheeling, West Virginia, to handle our distribution needs. We operate a return center in Oshkosh, Nebraska; and our Wheeling, West Virginia, distribution center also processes returns. Any natural disaster or other serious disruption to these centers due to fire, tornado, or any other calamity could damage a significant portion of our inventory, and materially impair our ability to adequately stock our retail stores, deliver merchandise to customers, and process returns to vendors and could result in lost revenue, increased costs, and reduced profits.
Our failure to obtain or negotiate economic development packages with local and state governments could cause us to significantly alter our retail store strategy or format and/or delay the construction of one or more of our retail stores and could adversely affect our revenue, cash flows and profitability.
We have received economic development packages from many of the local and state governments where our retail stores are located. In some locations, we have experienced an increased amount of government and citizen resistance and critical review of pending and existing economic development packages. This resistance and critical review may cause local and state government officials in future locations to deny or limit economic development packages that might otherwise be available to us. The failure to obtain similar economic development packages in
Job TiTle Cabelas 10K Revision 9 seRial DaTe / Time Tuesday, March 11, 2008 /1:07 AM Job numbeR 159962 Type Current page no. 16 opeRaToR PM3
16
<12345678>
the future for any of these reasons could cause us to significantly alter our retail store strategy or format. As a result, we could be forced to invest less capital in our stores which could have an adverse effect on our ability to construct the stores as attractive tourist and entertainment shopping destinations, possibly leading to a decrease in revenue or revenue growth. In addition, the failure to obtain similar economic development packages for stores built in the future would have an adverse impact on our cash flows and on the return on investment in these stores.
The failure of properties to generate sufficient taxes to amortize economic development bonds owned by us that relate to the development of such properties would have an adverse impact on our cash flows and profitability.
We often purchase economic development bonds issued by state or local governmental entities in connection with the development of our retail stores. The proceeds of these bonds are then used to fund the construction and equipping of new retail stores and related infrastructure development. The repayments of principal and interest on these bonds are typically tied to sales, property, or lodging taxes generated from the related retail store and, in some cases, from other businesses in the surrounding area, over periods which range between 20 and 30 years. However, the governmental entity from which we purchase the bonds is not otherwise liable for repayment of principal and interest on the bonds to the extent that the associated taxes are insufficient to pay the bonds. At the time we purchase these bonds, we make estimates of the discounted future cash flow streams they are expected to generate in the form of interest and principal payments. Because these cash flows are based primarily on future property or sales tax collections at our retail stores and other facilities (which in many cases may not be operating at the time we make our estimates), these estimates are inherently subjective and the probability of ultimate realization is highly uncertain. If sufficient tax revenue is not generated by the subject properties, we will not receive the full amount of the expected payments due under the bonds, which would have an adverse impact on our cash flows and profitability.
Our failure to comply with the terms of current economic development agreements could result in our repayment of grant money or other adverse consequences that would affect our cash flows and profitability.
The economic development packages which we have received in connection with the construction of our current stores have, in some instances, contained forfeiture provisions and other remedies in the event we do not fully comply with the terms of the economic development agreements. Among the terms which could trigger these remedies are the failure to maintain certain employment and wage levels, failure to timely open and operate a retail store, and failure to develop property adjacent to a retail store. At the end of 2007, the total amount of grant funding subject to repayment pursuant to a specific contractual remedy was approximately $13 million. Other remedies that have been included in some economic development agreements are loss of priority to tax payments supporting the repayment of bonds held by us. Where specific remedies are not set forth, the local governments would be entitled to pursue general contract remedies. A default by us under these economic development agreements could have an adverse effect on our cash flows and profitability.
We may incur costs from litigation or increased regulation relating to products that we sell, particularly tree stands and firearms, which could adversely affect our revenue and profitability.
We may incur damages due to lawsuits relating to products we sell. We are currently a defendant in certain product liability lawsuits, including lawsuits relating to tree stands. We may incur losses due to lawsuits, including potential class actions, relating to our performance of background checks on firearms purchases and compliance with other sales laws as mandated by state and federal law. We may also incur losses from lawsuits relating to the improper use of firearms or ammunition sold by us, including lawsuits by municipalities or other organizations attempting to recover costs from manufacturers and retailers of firearms and ammunition. Our insurance coverage and the insurance provided by our vendors for certain products they sell to us may be inadequate to cover claims and liabilities related to products that we sell. In addition, claims or lawsuits related to products that we sell or the unavailability of insurance for product liability claims, could result in the elimination of these products from our product line reducing revenue. If one or more successful claims against us are not covered by or exceed our insurance coverage, or if insurance coverage is no longer available, our available working capital may be impaired and our operating results could be adversely affected. Even unsuccessful claims could result in the expenditure of funds and management time and could have a negative impact on our profitability and on future premiums we would be required to pay on our insurance policies.

Job TiTle Cabelas 10K Revision 9 seRial DaTe / Time Tuesday, March 11, 2008 /1:07 AM Job numbeR 159962 Type Current page no. 17 opeRaToR PM3
17
<12345678>
Current and future government regulation may negatively impact demand for our products and our ability to conduct our business.
Federal, state, and local laws and regulations can affect our business and the demand for products. These laws and regulations include:
• FTC regulations governing the manner in which orders may be solicited and prescribing other obligations in fulfilling orders and consummating sales;
• laws and regulations that prohibit or limit the sale, in certain states and localities, of certain items we offer such as firearms, black powder firearms, ammunition, bows, knives, and similar products;
• the Bureau of Alcohol, Tobacco, Firearms and Explosives governing the manner in which we sell firearms and ammunition;
• laws and regulations governing hunting and fishing;
• laws and regulations relating to the collecting and sharing of non-public customer information; and
• U.S. customs laws and regulations pertaining to proper item classification, quotas, payment of duties and tariffs, and maintenance of documentation and internal control programs which relate to importing taxidermy which we display in our retail stores.
Changes in these laws and regulations or additional regulation could cause the demand for and sales of our products to decrease. Moreover, complying with increased or changed regulations could cause our operating expenses to increase. This could adversely affect our revenue and profitability.
Our inability or failure to protect our intellectual property could have a negative impact on our operating results.
Our trademarks, service marks, copyrights, patents, trade secrets, domain names, and other intellectual property are valuable assets that are critical to our success. Effective trademark and other intellectual property protection may not be available in every country in which our products are made available. The unauthorized reproduction or other misappropriation of our intellectual property could diminish the value of our brands or goodwill and cause a decline in our revenue. Any infringement or other intellectual property claim made against us, whether or not it has merit, could be time-consuming, result in costly litigation, cause product delays, or require us to enter into royalty or licensing agreements. As a result, any such claim could have an adverse effect on our operating results.
Failure to successfully integrate any business we acquire could have an adverse impact on our profitability.
We may from time to time acquire businesses which we believe to be complementary to our business. Acquisitions may result in difficulties in assimilating acquired companies and may result in the diversion of our capital and our management’s attention from other business issues and opportunities. We may not be able to successfully integrate operations that we acquire, including their personnel, financial systems, distribution, operations, and general operating procedures. If we fail to successfully integrate acquisitions, we could experience increased costs associated with operating inefficiencies, which could have an adverse effect on our profitability.
Risks Related to Our Financial Services Business
We may experience limited availability of financing or variation in funding costs for our Financial Services business, which could limit growth of the business and decrease our profitability.
Our Financial Services business requires a significant amount of cash to operate. These cash requirements will increase if our credit card originations increase or if our cardholders’ balances or spending increase. Historically, we have relied upon external financing sources to fund these operations, and we intend to continue to access external sources to fund our growth. A number of factors such as our financial results, changes within our organization, disruptions in the capital markets, our corporate and regulatory structure, interest rate fluctuations, general economic conditions, and accounting and regulatory changes and relations could make such financing more difficult or impossible to obtain or more expensive.

Job TiTle Cabelas 10K Revision 9 seRial DaTe / Time Tuesday, March 11, 2008 /1:07 AM Job numbeR 159962 Type Current page no. 18 opeRaToR PM3
18
<12345678>
We have been, and will continue to be, particularly reliant on funding from securitization transactions for our Financial Services business. Securitization funding sources include both a commercial paper conduit facility and fixed and floating rate term securitizations. A failure to renew this facility, to resecuritize the term securitizations as they mature, or to add additional term securitizations and commercial paper conduits on favorable terms as it becomes necessary could increase our financing costs and potentially limit our ability to grow our Financial Services business. Unfavorable conditions in the asset-backed securities markets generally, including the unavailability of commercial bank liquidity support or credit enhancements, such as financial guaranty insurance, could have a similar effect.
Furthermore, even if we are able to securitize our credit card loans consistent with past practice, poor performance of our securitized loans, including increased delinquencies and credit losses, lower payment rates, or a decrease in excess spreads below certain thresholds, could result in a downgrade or withdrawal of the ratings on the outstanding securities issued in our securitization transactions, cause early amortization of these securities, or result in higher required credit enhancement levels. This could jeopardize our ability to complete other securitization transactions on acceptable terms, decrease our liquidity, and force us to rely on other potentially more expensive funding sources, to the extent available, which would decrease our profitability.
We may have to reallocate capital from our Retail and Direct businesses to meet the capital needs of our Financial Services business, which could alter our retail store expansion program.
Our bank subsidiary must satisfy the capital maintenance requirements of government regulators and its agreement with Visa U.S.A., Inc. (“Visa”). A variety of factors could cause the capital requirements of our bank subsidiary to exceed our ability to generate capital internally or from third party sources. For example, government regulators or Visa could unilaterally increase their minimum capital requirements. Also, we have significant potential obligations in the form of the unused credit lines of our cardholders. At the end of 2007, these unfunded amounts totaled approximately $12 billion. Draws on these lines of credit could materially exceed predicted line usage. In addition, the occurrence of certain events, such as significant defaults in payment of securitized loans or failure to comply with the terms of securitization covenants, may cause previously completed securitization transactions to amortize earlier than scheduled or be reclassified as a liability for financial accounting purposes, both of which would have a significant effect on our ability to meet the capital maintenance requirements of our bank subsidiary, as affected off-balance sheet loans would immediately be recorded on our consolidated balance sheet and would be subject to regulatory capital requirements. If any of these factors occur, we may have to contribute capital to our bank subsidiary, which may require us to raise additional debt or equity capital and/or divert capital from our Retail and Direct businesses, which in turn could significantly alter our retail store expansion strategy.
It may be difficult to sustain the historical growth and profitability of our Financial Services business, and we will be subject to various risks as we attempt to grow the business.
We may not be able to retain existing cardholders, grow account balances, or attract new cardholders and the profits from our Financial Services business could decline, for a variety of reasons, many of which are beyond our control, including:
• credit risk related to the loans we make to cardholders and the charge-off levels of our credit card accounts;
• lack of growth of potential new customers generated by our Retail and Direct businesses;
• liquidity and funding risk relating to our ability to create the liquidity necessary to extend credit to our cardholders and provide the capital necessary to meet the requirements of government regulators and Visa; and
• operational risk related to our ability to acquire the necessary operational and organizational infrastructure, manage expenses as we expand, and recruit management and operations personnel with the experience to run an increasingly complex and highly-regulated business.

Job TiTle Cabelas 10K Revision 9 seRial DaTe / Time Tuesday, March 11, 2008 /1:07 AM Job numbeR 159962 Type Current page no. 19 opeRaToR PM3
19
<12345678>
Economic downturns and social and other factors could cause our credit card charge-offs and delinquencies to increase, or credit card balances to decrease, which would decrease our profitability.
Economic downturns generally lead to increased charge-offs and credit losses in the consumer finance industry, which would cause us to experience increased charge-offs and delinquencies in our credit card loan portfolio. An economic downturn can hurt our financial performance as cardholders default on their balances or carry lower balances. A variety of social and other factors also may cause changes in credit card use, payment patterns, and the rate of defaults by cardholders. These social factors include changes in consumer confidence levels, the public’s perception of the use of credit cards, changing attitudes about incurring debt, and the stigma of personal bankruptcy. Additionally, credit card accounts tend to exhibit a rising trend in credit loss and delinquency rates between 18 to 30 months after they are issued. If the rate of growth in new account generation slows, the proportion of accounts in the portfolio that have been open for between 18 to 30 months will increase and the percentage of charge-offs and delinquencies may increase. Our underwriting criteria and product design may be insufficient to protect the growth and profitability of our Financial Services business during a sustained period of economic downturn or recession or a material shift in social attitudes, and may be insufficient to protect against these additional negative factors.
The performance of our Financial Services business may be negatively affected by the performance of our merchandising businesses.
Negative developments in our Retail and Direct businesses could affect our ability to grow or maintain our Financial Services business. We believe our ability to maintain cardholders and attract new cardholders is highly correlated with customer loyalty to our merchandising businesses and to the strength of the Cabela’s brand. In addition, transactions on cardholder accounts produce loyalty points which the cardholder may apply to future purchases from us. Adverse changes in the desirability of products we sell, negative trends in retail customer service and satisfaction, or the termination or modification of the loyalty program could have a negative impact on our bank subsidiary’s ability to grow its account base and to attract desirable co-branding opportunities with third parties.
Our Financial Services business faces the risk of a complex and changing regulatory and legal environment.
Our Financial Services business operates in a heavily regulated industry and is therefore subject to a wide array of banking and consumer lending laws and regulations. Failure to comply with these laws and regulations could result in financial, structural, and operational penalties being imposed. In addition, as a Visa member bank, our bank must comply with rules and regulations imposed by Visa. For example, our bank and Cabela’s could be fined by Visa for failing to comply with Visa’s data security standards.
Changes in interest rates could have a negative impact on our earnings.
In connection with our Financial Services business, we borrow money from institutions and accept funds by issuing certificates of deposit, which we then lend to cardholders. We earn interest on the cardholders’ account balances, and pay interest on the certificates of deposit and borrowings we use to fund those loans. Changes in these two interest rates affect the value of the assets and liabilities of our Financial Services business. If the rate of interest we pay on borrowings increases more (or more rapidly) than the rate of interest we earn on loans, our net interest income, and therefore our earnings, could fall. Our earnings could also be adversely affected if the rates on our credit card account balances fall more quickly than those on our borrowings. In addition, at the end of 2007, approximately 35.5% of our cardholders did not maintain balances on their credit card accounts. We do not earn any interest from these accounts but do earn other fees from these accounts such as Visa interchange fees. In the event interest rates rise, the spread between the interest rate we pay on our borrowings and the fees we earn from these accounts may change and our profitability may be adversely affected.
Credit card industry litigation could adversely impact the amount of revenue generated by our Financial Services business.
Our Financial Services business faces possible risk from the outcomes of certain credit card industry litigation. For example, a number of entities, each purporting to represent a class of retail merchants, have sued Visa and several member banks, and other credit card associations, alleging, among other things, that Visa and its member banks have violated U.S. antitrust laws by conspiring to fix the level of interchange fees. To date, we have not been named as a
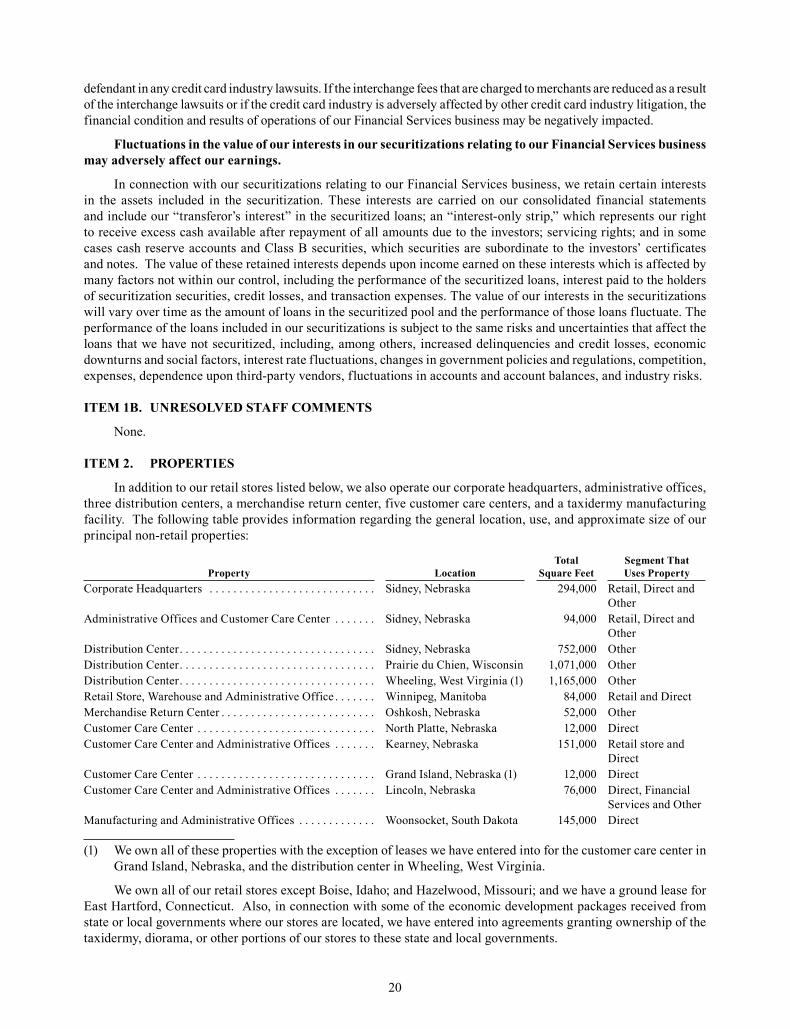
Job TiTle Cabelas 10K Revision 9 seRial DaTe / Time Tuesday, March 11, 2008 /1:07 AM Job numbeR 159962 Type Current page no. 20 opeRaToR PM3
20
<12345678>
defendant in any credit card industry lawsuits. If the interchange fees that are charged to merchants are reduced as a result of the interchange lawsuits or if the credit card industry is adversely affected by other credit card industry litigation, the financial condition and results of operations of our Financial Services business may be negatively impacted.
Fluctuations in the value of our interests in our securitizations relating to our Financial Services business may adversely affect our earnings.
In connection with our securitizations relating to our Financial Services business, we retain certain interests in the assets included in the securitization. These interests are carried on our consolidated financial statements and include our “transferor’s interest” in the securitized loans; an “interest-only strip,” which represents our right to receive excess cash available after repayment of all amounts due to the investors; servicing rights; and in some cases cash reserve accounts and Class B securities, which securities are subordinate to the investors’ certificates and notes. The value of these retained interests depends upon income earned on these interests which is affected by many factors not within our control, including the performance of the securitized loans, interest paid to the holders of securitization securities, credit losses, and transaction expenses. The value of our interests in the securitizations will vary over time as the amount of loans in the securitized pool and the performance of those loans fluctuate. The performance of the loans included in our securitizations is subject to the same risks and uncertainties that affect the loans that we have not securitized, including, among others, increased delinquencies and credit losses, economic downturns and social factors, interest rate fluctuations, changes in government policies and regulations, competition, expenses, dependence upon third-party vendors, fluctuations in accounts and account balances, and industry risks.
ITEM 1B. UNRESOLVED STAFF COMMENTS
None.
ITEM 2. PROPERTIES
In addition to our retail stores listed below, we also operate our corporate headquarters, administrative offices, three distribution centers, a merchandise return center, five customer care centers, and a taxidermy manufacturing facility. The following table provides information regarding the general location, use, and approximate size of our principal non-retail properties:
Property LocationTotal
Square FeetSegment That Uses Property
Corporate Headquarters . . . . . . . . . . . . . . . . . . . . . . . . . . . . Sidney, Nebraska 294,000 Retail, Direct and Other
Administrative Offices and Customer Care Center . . . . . . . Sidney, Nebraska 94,000 Retail, Direct and Other
Distribution Center . . . . . . . . . . . . . . . . . . . . . . . . . . . . . . . . . Sidney, Nebraska 752,000 OtherDistribution Center . . . . . . . . . . . . . . . . . . . . . . . . . . . . . . . . . Prairie du Chien, Wisconsin 1,071,000 OtherDistribution Center . . . . . . . . . . . . . . . . . . . . . . . . . . . . . . . . . Wheeling, West Virginia (1) 1,165,000 OtherRetail Store, Warehouse and Administrative Office . . . . . . . Winnipeg, Manitoba 84,000 Retail and DirectMerchandise Return Center . . . . . . . . . . . . . . . . . . . . . . . . . . Oshkosh, Nebraska 52,000 OtherCustomer Care Center . . . . . . . . . . . . . . . . . . . . . . . . . . . . . . North Platte, Nebraska 12,000 DirectCustomer Care Center and Administrative Offices . . . . . . . Kearney, Nebraska 151,000 Retail store and
DirectCustomer Care Center . . . . . . . . . . . . . . . . . . . . . . . . . . . . . . Grand Island, Nebraska (1) 12,000 DirectCustomer Care Center and Administrative Offices . . . . . . . Lincoln, Nebraska 76,000 Direct, Financial
Services and OtherManufacturing and Administrative Offices . . . . . . . . . . . . . Woonsocket, South Dakota 145,000 Direct
(1) We own all of these properties with the exception of leases we have entered into for the customer care center in Grand Island, Nebraska, and the distribution center in Wheeling, West Virginia.
We own all of our retail stores except Boise, Idaho; and Hazelwood, Missouri; and we have a ground lease for East Hartford, Connecticut. Also, in connection with some of the economic development packages received from state or local governments where our stores are located, we have entered into agreements granting ownership of the taxidermy, diorama, or other portions of our stores to these state and local governments.

Job TiTle Cabelas 10K Revision 9 seRial DaTe / Time Tuesday, March 11, 2008 /1:07 AM Job numbeR 159962 Type Current page no. 21 opeRaToR PM3
21
<12345678>
The following table shows the location, opening date, and approximate total square footage of our U. S. retail stores used in our Retail segment:
Location Opening DateTotal Square
FootageKearney, Nebraska . . . . . . . . . . . . . . . . . . . . . . . . . . . October, 1987 35,000Sidney, Nebraska . . . . . . . . . . . . . . . . . . . . . . . . . . . . July, 1991 104,000Owatonna, Minnesota . . . . . . . . . . . . . . . . . . . . . . . . March, 1998 159,000Prairie Du Chien, Wisconsin . . . . . . . . . . . . . . . . . . . September, 1998 53,000East Grand Forks, Minnesota . . . . . . . . . . . . . . . . . . . September, 1999 59,000Dundee, Michigan . . . . . . . . . . . . . . . . . . . . . . . . . . . March, 2000 228,000Mitchell, South Dakota . . . . . . . . . . . . . . . . . . . . . . . . August, 2000 84,000Kansas City, Kansas . . . . . . . . . . . . . . . . . . . . . . . . . . August, 2002 186,000Hamburg, Pennsylvania . . . . . . . . . . . . . . . . . . . . . . . September, 2003 247,000Wheeling, West Virginia . . . . . . . . . . . . . . . . . . . . . . August, 2004 176,000Fort Worth, Texas . . . . . . . . . . . . . . . . . . . . . . . . . . . . May, 2005 234,000Buda, Texas . . . . . . . . . . . . . . . . . . . . . . . . . . . . . . . . . June, 2005 192,000Lehi, Utah . . . . . . . . . . . . . . . . . . . . . . . . . . . . . . . . . . August, 2005 170,000Rogers, Minnesota . . . . . . . . . . . . . . . . . . . . . . . . . . . October, 2005 185,000Glendale, Arizona . . . . . . . . . . . . . . . . . . . . . . . . . . . . July, 2006 166,000Boise, Idaho . . . . . . . . . . . . . . . . . . . . . . . . . . . . . . . . August, 2006 132,000Richfield, Wisconsin . . . . . . . . . . . . . . . . . . . . . . . . . September, 2006 166,000La Vista, Nebraska . . . . . . . . . . . . . . . . . . . . . . . . . . . October, 2006 129,000Hazelwood, Missouri . . . . . . . . . . . . . . . . . . . . . . . . . April, 2007 132,000Hoffman Estates, Illinois . . . . . . . . . . . . . . . . . . . . . . September, 2007 195,000East Hartford, Connecticut . . . . . . . . . . . . . . . . . . . . . October, 2007 196,000Gonzales, Louisiana . . . . . . . . . . . . . . . . . . . . . . . . . . October, 2007 167,000Hammond, Indiana . . . . . . . . . . . . . . . . . . . . . . . . . . . October, 2007 189,000Reno, Nevada . . . . . . . . . . . . . . . . . . . . . . . . . . . . . . . November, 2007 129,000Post Falls, Idaho . . . . . . . . . . . . . . . . . . . . . . . . . . . . . November, 2007 129,000Lacey, Washington . . . . . . . . . . . . . . . . . . . . . . . . . . . November, 2007 194,000
At December 29, 2007, the total net book value of our property and equipment was $904 million. As of the end of 2007, we believe that our properties and equipment were suitable for their intended use.
ITEM 3. LEGAL PROCEEDINGS
We are party to certain lawsuits in the ordinary course of our business. The subject matter of these proceedings primarily includes commercial disputes, employment issues, and product liability lawsuits. We do not believe that the ultimate dispositions of these proceedings, individually or in the aggregate, will have a material adverse effect on our consolidated financial position, results of operations, or liquidity.
ITEM 4. SUBMISSION OF MATTERS TO A VOTE OF SECURITY HOLDERS
No matters were submitted to a vote of security holders during the fourth quarter of 2007.
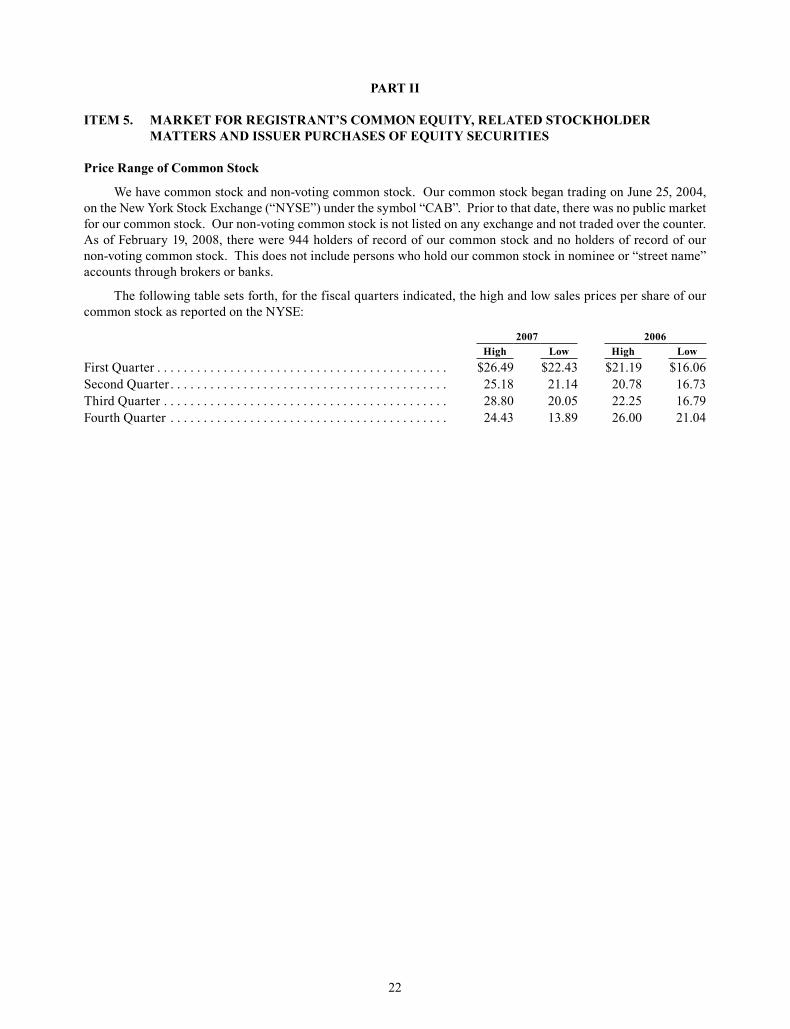
Job TiTle Cabelas 10K Revision 9 seRial DaTe / Time Tuesday, March 11, 2008 /1:07 AM Job numbeR 159962 Type Current page no. 22 opeRaToR PM3
22
<12345678>
PART II
ITEM 5. MARKET FOR REGISTRANT’S COMMON EQUITY, RELATED STOCKHOLDER MATTERS AND ISSUER PURCHASES OF EQUITY SECURITIES
Price Range of Common Stock
We have common stock and non-voting common stock. Our common stock began trading on June 25, 2004, on the New York Stock Exchange (“NYSE”) under the symbol “CAB”. Prior to that date, there was no public market for our common stock. Our non-voting common stock is not listed on any exchange and not traded over the counter. As of February 19, 2008, there were 944 holders of record of our common stock and no holders of record of our non-voting common stock. This does not include persons who hold our common stock in nominee or “street name” accounts through brokers or banks.
The following table sets forth, for the fiscal quarters indicated, the high and low sales prices per share of our common stock as reported on the NYSE:
2007 2006High Low High Low
First Quarter . . . . . . . . . . . . . . . . . . . . . . . . . . . . . . . . . . . . . . . . . . . . $26.49 $22.43 $21.19 $16.06Second Quarter . . . . . . . . . . . . . . . . . . . . . . . . . . . . . . . . . . . . . . . . . . 25.18 21.14 20.78 16.73Third Quarter . . . . . . . . . . . . . . . . . . . . . . . . . . . . . . . . . . . . . . . . . . . 28.80 20.05 22.25 16.79Fourth Quarter . . . . . . . . . . . . . . . . . . . . . . . . . . . . . . . . . . . . . . . . . . 24.43 13.89 26.00 21.04

Job TiTle Cabelas 10K Revision 9 seRial DaTe / Time Tuesday, March 11, 2008 /1:07 AM Job numbeR 159962 Type Current page no. 23 opeRaToR PM3
23
<12345678>
Stock Performance Graph
The following stock performance graph and table show Cabela’s cumulative total shareholder return on a quarterly basis since the beginning of our first full quarter following the date of our initial public offering. The graph also shows the cumulative total returns of the S&P 500 Retailing Index and the S&P 500 Index. The graph assumes that $100 was invested on July 2, 2004.
-
20
40
60
80
100
120
140
$160
7/2/04 12/31/04 7/1/05 12/30/05 6/30/06 12/29/06 6/29/07 12/28/07
Cabela's Inc. S&P Retailing Index S&P 500
Market closing price at closest date to end of periods ended:
July 2, 2004
Dec. 31, 2004
July 1, 2005
Dec. 30, 2005
June 30, 2006
Dec. 29, 2006
Mar. 31, 2007
June 30, 2007
Sept. 29, 2007
Dec. 29, 2007
Cabela’s Inc. . . . . . . . $100 $ 85 $ 78 $ 62 $ 72 $ 90 $ 92 $ 82 $ 88 $ 55S&P 500
Retailing Index . . 100 117 111 115 114 126 128 130 119 103S&P 500 Index . . . . . 100 108 106 111 113 126 126 134 136 131
Dividend Policy
We have never declared or paid any cash dividends on our common stock and do not anticipate paying any cash dividends on our common stock in the foreseeable future. In addition, our revolving credit facility and our senior notes limit our ability to pay dividends to our stockholders.
Equity Compensation Plans
For information on securities authorized for issuance under our equity compensation plans, see “Item 12 – Security Ownership of Certain Beneficial Owners and Management and Related Stockholder Matters.”

Job TiTle Cabelas 10K Revision 9 seRial DaTe / Time Tuesday, March 11, 2008 /1:07 AM Job numbeR 159962 Type Current page no. 24 opeRaToR PM3
24
<12345678>
ITEM 6. SELECTED FINANCIAL DATA
Fiscal Year (1)2007 2006 2005 2004 2003
(In Thousands Except Earnings per Share)Operations Data:Revenue:
Merchandise revenue . . . . . . . . . . . . . . $2,173,995 $1,908,801 $1,664,272 $1,474,415 $1,336,910Financial services revenue . . . . . . . . . . 159,335 137,423 105,831 69,060 49,823Other revenue . . . . . . . . . . . . . . . . . . . 16,269 17,300 29,558 12,499 5,690
Total revenue . . . . . . . . . . . . . . . . . 2,349,599 2,063,524 1,799,661 1,555,974 1,392,423Cost of revenue . . . . . . . . . . . . . . . . . . . . . 1,378,386 1,204,399 1,064,322 925,665 821,399
Selling, distribution, and administrative expenses. . . . . . . . . . . . 820,121 715,380 620,376 533,094 479,964
Operating income . . . . . . . . . . . . . . . . . . . 151,092 143,745 114,963 97,215 91,060Interest (expense) income, net . . . . . . . . . . (18,778) (16,126) (10,256) (7,577) (10,750)Other income . . . . . . . . . . . . . . . . . . . . . . . 6,913 9,637 10,663 10,443 5,612Income before provision for
income taxes. . . . . . . . . . . . . . . . . . . . . 139,227 137,256 115,370 100,081 85,922Provision for income taxes . . . . . . . . . . . . 51,348 51,471 42,801 35,085 30,577Net income available to common
stockholders . . . . . . . . . . . . . . . . . . . . $ 87,879 $ 85,785 $ 72,569 $ 64,996 $ 55,345
Basic earnings per share . . . . . . . . . . . . . . $ 1.34 $ 1.32 $ 1.12 $ 1.06 $ 1.06Diluted earnings per share. . . . . . . . . . . . . $ 1.31 $ 1.29 $ 1.10 $ 1.03 $ 1.00
Selected Balance Sheet Data:Cash and cash equivalents (2) . . . . . . . . . . $ 131,182 $ 172,903 $ 86,923 $ 123,934 $ 112,656Working capital (2) . . . . . . . . . . . . . . . . . . 263,284 335,387 145,559 274,746 234,709Total assets. . . . . . . . . . . . . . . . . . . . . . . . . 2,212,830 1,751,230 1,366,280 1,228,231 969,682Total debt . . . . . . . . . . . . . . . . . . . . . . . . . . 503,385 317,873 119,826 148,152 142,651Total stockholders’ equity . . . . . . . . . . . . . 828,559 733,858 639,853 566,354 376,469
Other Data:Depreciation and amortization . . . . . . . . . $ 59,863 $ 45,559 $ 34,912 $ 29,843 $ 26,715Property and equipment additions
including accrued amounts . . . . . . . . . 364,326 190,592 203,157 52,568 72,972Purchases of economic development
bonds . . . . . . . . . . . . . . . . . . . . . . . . . . 36,223 23,397 65,077 74,492 18,201
(1) Fiscal years are based on the 52-53 week period ending on the Saturday closest to December 31. Fiscal 2007, 2006, 2005 and 2004 each consisted of 52 weeks and fiscal 2003 consisted of 53 weeks.
(2) Cash and cash equivalents includes amounts for World’s Foremost Bank which were $123 million, $53 million, $81 million, $58 million, and $77 million at years ended 2007, 2006, 2005, 2004 and 2003. Due to regulatory restrictions, our ability to use this cash for non-banking operations, including for working capital for our Retail or Direct businesses or for retail store expansion, is limited.
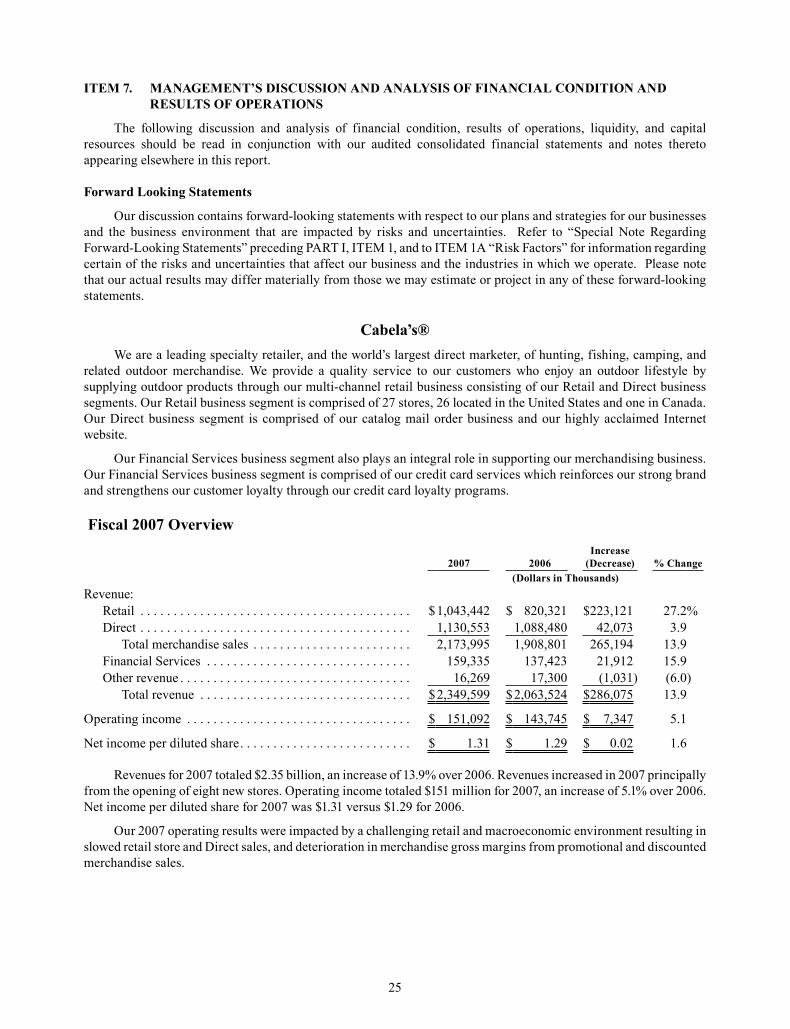
Job TiTle Cabelas 10K Revision 9 seRial DaTe / Time Tuesday, March 11, 2008 /1:07 AM Job numbeR 159962 Type Current page no. 25 opeRaToR PM3
25
<12345678>
ITEM 7. MANAGEMENT’S DISCUSSION AND ANALYSIS OF FINANCIAL CONDITION AND RESULTS OF OPERATIONS
The following discussion and analysis of financial condition, results of operations, liquidity, and capital resources should be read in conjunction with our audited consolidated financial statements and notes thereto appearing elsewhere in this report.
Forward Looking Statements
Our discussion contains forward-looking statements with respect to our plans and strategies for our businesses and the business environment that are impacted by risks and uncertainties. Refer to “Special Note Regarding Forward-Looking Statements” preceding PART I, ITEM 1, and to ITEM 1A “Risk Factors” for information regarding certain of the risks and uncertainties that affect our business and the industries in which we operate. Please note that our actual results may differ materially from those we may estimate or project in any of these forward-looking statements.
Cabela’s®We are a leading specialty retailer, and the world’s largest direct marketer, of hunting, fishing, camping, and
related outdoor merchandise. We provide a quality service to our customers who enjoy an outdoor lifestyle by supplying outdoor products through our multi-channel retail business consisting of our Retail and Direct business segments. Our Retail business segment is comprised of 27 stores, 26 located in the United States and one in Canada. Our Direct business segment is comprised of our catalog mail order business and our highly acclaimed Internet website.
Our Financial Services business segment also plays an integral role in supporting our merchandising business. Our Financial Services business segment is comprised of our credit card services which reinforces our strong brand and strengthens our customer loyalty through our credit card loyalty programs.
Fiscal 2007 Overview
2007 2006Increase
(Decrease) % Change(Dollars in Thousands)
Revenue:Retail . . . . . . . . . . . . . . . . . . . . . . . . . . . . . . . . . . . . . . . . . $1,043,442 $ 820,321 $223,121 27.2%Direct . . . . . . . . . . . . . . . . . . . . . . . . . . . . . . . . . . . . . . . . . 1,130,553 1,088,480 42,073 3.9
Total merchandise sales . . . . . . . . . . . . . . . . . . . . . . . . 2,173,995 1,908,801 265,194 13.9Financial Services . . . . . . . . . . . . . . . . . . . . . . . . . . . . . . . 159,335 137,423 21,912 15.9Other revenue . . . . . . . . . . . . . . . . . . . . . . . . . . . . . . . . . . . 16,269 17,300 (1,031) (6.0)
Total revenue . . . . . . . . . . . . . . . . . . . . . . . . . . . . . . . . $2,349,599 $2,063,524 $286,075 13.9
Operating income . . . . . . . . . . . . . . . . . . . . . . . . . . . . . . . . . . $ 151,092 $ 143,745 $ 7,347 5.1
Net income per diluted share. . . . . . . . . . . . . . . . . . . . . . . . . . $ 1.31 $ 1.29 $ 0.02 1.6
Revenues for 2007 totaled $2.35 billion, an increase of 13.9% over 2006. Revenues increased in 2007 principally from the opening of eight new stores. Operating income totaled $151 million for 2007, an increase of 5.1% over 2006. Net income per diluted share for 2007 was $1.31 versus $1.29 for 2006.
Our 2007 operating results were impacted by a challenging retail and macroeconomic environment resulting in slowed retail store and Direct sales, and deterioration in merchandise gross margins from promotional and discounted merchandise sales.

Job TiTle Cabelas 10K Revision 9 seRial DaTe / Time Tuesday, March 11, 2008 /1:07 AM Job numbeR 159962 Type Current page no. 26 opeRaToR PM3
26
<12345678>
Other significant items which directly impact comparisons of our operating results for 2007 were:
• new store pre-opening costs of $17 million in 2007 from the opening of eight new stores (six in the fourth quarter, one late in the third quarter, and one in the second quarter), an increase of $7 million compared to the pre-opening costs in 2006 from the opening of four stores;
• certain retail stores not meeting sales expectations;
• an increase in the proportion of lower margin hard goods sales to higher margin soft goods sales;
• costs from advertising and promotional strategies aimed at capturing additional market share; and
• increases in Financial Services revenue principally from growth in the number of average active credit card accounts and average managed credit card loans, partially offset by higher credit card loan charge-offs.
Current Year Achievements2007 was highlighted by the opening of eight new store locations, our expansion into Canada through an
acquisition, and operational achievements outlined below.
Retail Store Openings – We opened eight new retail stores, increasing our total retail store square footage by 1.3 million square feet, or 49% of total retail space, and bringing our total square footage to over 4.0 million square feet at the end of 2007.
Customer Service Enhancements – We completed implementation of customer service enhancements directed at increasing sales and customer satisfaction in 10 of our retail stores including:
• in-store pick-up for catalog and Internet orders,
• installation of Internet kiosks, and
• the installation of catalog order desks.
We expect these customer service enhancements to be available in all existing retail stores in early 2008 and are encouraged by early results.
Business Week magazine conducted its first ever Top 25 ranking of customer service champions – we ranked No. 15 and were one of only two retailers to make the list.
Internet – Our Internet website continued to receive awards and high praise for excellence, including the following awards and recognition:
• Our website was ranked in the top three among online retailers for reliability and responsiveness - an indication of download page speed and completing transactions for customers, according to a study on U. S. retail websites over the 2007 holiday season by research firm Keynote.
• The Cabelas.com website was listed in the annual “The Internet Retailer Hot 100 Retail Web Sites.” Websites were selected for being innovative and engaging, creating striking and effective site designs, or having certain critical features such as site search that was better than other sites.
• Our website was the most visited sporting goods industry eCommerce website according to a September 2007 publication from Hitwise, Incorporated, an online measurement company. Internet visits increased by 30.2% in 2007 over 2006.
• Our website ranked among the top websites for total eCommerce sales (measured by industry publications).
International Expansion – In September 2007, we acquired S.I.R. Warehouse Sports in Winnipeg, Manitoba, which will serve as our platform for expansion into Canada.
Cabela’s CLUB Visa Credit Card – Our Cabela’s CLUB Visa credit card was ranked among the Top 5 in customer satisfaction by Consumer Reports in a 2007 reader survey on their satisfaction as credit card holders.

Job TiTle Cabelas 10K Revision 9 seRial DaTe / Time Tuesday, March 11, 2008 /1:07 AM Job numbeR 159962 Type Current page no. 27 opeRaToR PM3
27
<12345678>
The FutureWhile we anticipate that the business environment in which we operate will be challenging in 2008, we believe
our multi-channel model and our strong brand name provides us with opportunities for growth and profitability. Over our history, we have built name recognition and a quality brand that is renowned and respected in the outdoor industry. Throughout our multi-channel business, our strategy is to continue our focus on providing legendary customer service, quality, and selection.
For 2008, our primary focus will be on managing our business efficiently to enhance near-term and long-term results for our shareholders, a significant portion of which are employees and directors of Cabela’s. Our focus will be on the following initiatives as established by our executives:
• improve our advertising strategy by using more targeted campaigns throughout our multi-channel model to increase store traffic;
• improve retail store sales and profitability through enhanced product assortment, streamlined flow of merchandise to our retail stores, and reduced operating expenses;
• maintain merchandise gross margins in our sales channels;
• improve inventory management by actively managing quantities and product deliveries through enhanced leveraging of existing technologies, and by reducing unproductive inventory;
• the opening of two new stores in 2008; and
• completion of customer service enhancements for better service including in-store pick-up, catalog desks, and Internet kiosks.
Retail Store Efficiencies – For 2008, our primary objective is to enhance our retail store efficiencies and improve our operating results. We intend to achieve this objective by enhancing and optimizing our retail store merchandising processes, management information systems, and distribution and logistics capabilities. To enhance our customer service at our retail stores, we are focusing on customer service through training and mentoring programs.
Leverage Our Multi-Channel Model – We will advance our efforts for offering customers integrated opportunities to access and use our retail store, catalog, and Internet channels, including completing our roll-out of Internet kiosks, catalog order desks, and in-store pick-up for catalog and Internet purchases. Our in-store pick-up program allows customers to order products through our catalogs and Internet site, and have them delivered to the retail store of their choice without incurring shipping costs, increasing foot traffic in our stores. Conversely, our expanding retail stores introduce customers to our Internet and catalog channels. Our multi-channel model employs the same merchandising team, distribution centers, customer database, and infrastructure, which we intend to further capitalize on by building on the strengths of each channel, primarily through improvements in our merchandise planning and replenishment systems. These systems will allow us to identify the correct product mix in each of our retail stores, and also help maintain the proper inventory levels to satisfy customer demand in both our Retail and Direct business channels, while also driving improvements in inventory turns.
Next Generation Stores – To enhance our returns on capital we are developing a next generation store format which incorporates the following objectives:
• a store development model that will be adaptable to more markets, faster to start-up, and more efficient to operate to reduce our investment and increase sales per square foot; and
• to provide shopper-friendly layouts with regionalized product mixes, concept shops, and new product displays/fixtures featuring an improved look.
Internet Expansion – We will pursue the following key growth objectives to continue our leadership position in this channel:
• natural growth by offering industry-leading selection, service, value, and quality;
• category expansion to capitalize on the general outdoor enthusiast;
• an enhanced focus on the Canadian market by building on our 2007 Canada acquisition; and
• targeted marketing designed to increase sales overall and to transition customers from the catalog channel.
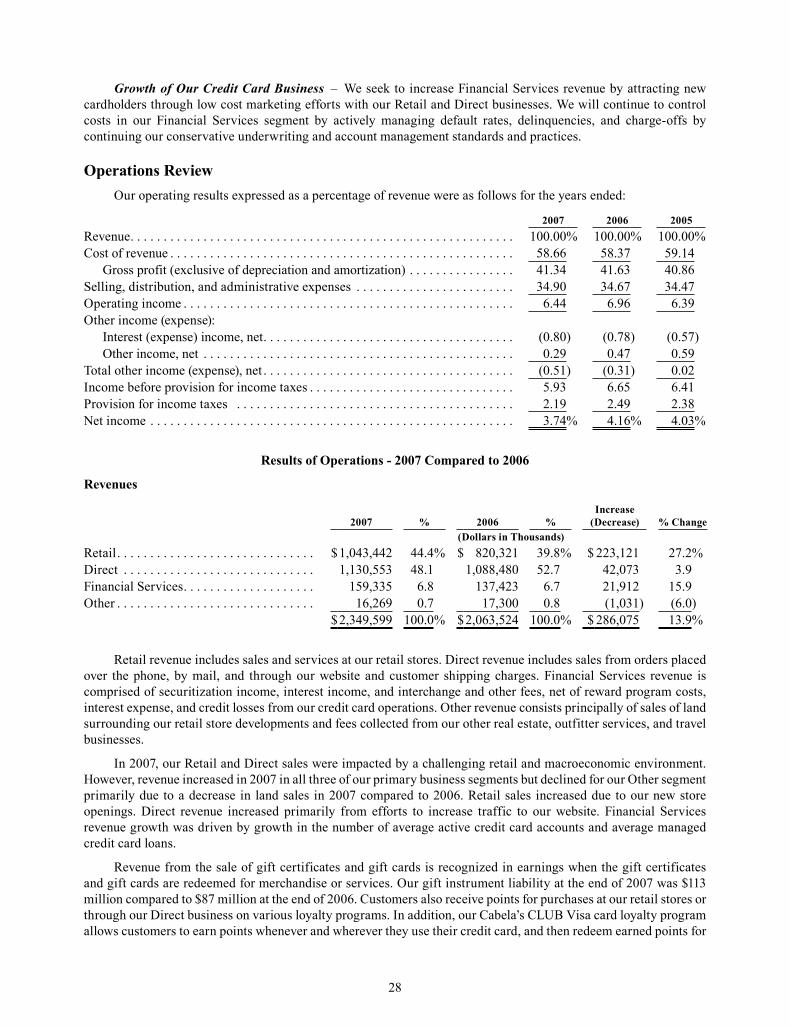
Job TiTle Cabelas 10K Revision 9 seRial DaTe / Time Tuesday, March 11, 2008 /1:07 AM Job numbeR 159962 Type Current page no. 28 opeRaToR PM3
28
<12345678>
Growth of Our Credit Card Business – We seek to increase Financial Services revenue by attracting new cardholders through low cost marketing efforts with our Retail and Direct businesses. We will continue to control costs in our Financial Services segment by actively managing default rates, delinquencies, and charge-offs by continuing our conservative underwriting and account management standards and practices.
Operations ReviewOur operating results expressed as a percentage of revenue were as follows for the years ended:
2007 2006 2005Revenue . . . . . . . . . . . . . . . . . . . . . . . . . . . . . . . . . . . . . . . . . . . . . . . . . . . . . . . . . . 100.00% 100.00% 100.00%Cost of revenue . . . . . . . . . . . . . . . . . . . . . . . . . . . . . . . . . . . . . . . . . . . . . . . . . . . . 58.66 58.37 59.14
Gross profit (exclusive of depreciation and amortization) . . . . . . . . . . . . . . . . 41.34 41.63 40.86Selling, distribution, and administrative expenses . . . . . . . . . . . . . . . . . . . . . . . . 34.90 34.67 34.47Operating income . . . . . . . . . . . . . . . . . . . . . . . . . . . . . . . . . . . . . . . . . . . . . . . . . . 6.44 6.96 6.39Other income (expense):
Interest (expense) income, net . . . . . . . . . . . . . . . . . . . . . . . . . . . . . . . . . . . . . . (0.80) (0.78) (0.57)Other income, net . . . . . . . . . . . . . . . . . . . . . . . . . . . . . . . . . . . . . . . . . . . . . . . 0.29 0.47 0.59
Total other income (expense), net . . . . . . . . . . . . . . . . . . . . . . . . . . . . . . . . . . . . . . (0.51) (0.31) 0.02Income before provision for income taxes . . . . . . . . . . . . . . . . . . . . . . . . . . . . . . . 5.93 6.65 6.41Provision for income taxes . . . . . . . . . . . . . . . . . . . . . . . . . . . . . . . . . . . . . . . . . . 2.19 2.49 2.38Net income . . . . . . . . . . . . . . . . . . . . . . . . . . . . . . . . . . . . . . . . . . . . . . . . . . . . . . . 3.74% 4.16% 4.03%
Results of Operations - 2007 Compared to 2006
Revenues
2007 % 2006 %Increase
(Decrease) % Change(Dollars in Thousands)
Retail . . . . . . . . . . . . . . . . . . . . . . . . . . . . . . $1,043,442 44.4% $ 820,321 39.8% $ 223,121 27.2%Direct . . . . . . . . . . . . . . . . . . . . . . . . . . . . . 1,130,553 48.1 1,088,480 52.7 42,073 3.9Financial Services . . . . . . . . . . . . . . . . . . . . 159,335 6.8 137,423 6.7 21,912 15.9Other . . . . . . . . . . . . . . . . . . . . . . . . . . . . . . 16,269 0.7 17,300 0.8 (1,031) (6.0)
$2,349,599 100.0% $2,063,524 100.0% $ 286,075 13.9%
Retail revenue includes sales and services at our retail stores. Direct revenue includes sales from orders placed over the phone, by mail, and through our website and customer shipping charges. Financial Services revenue is comprised of securitization income, interest income, and interchange and other fees, net of reward program costs, interest expense, and credit losses from our credit card operations. Other revenue consists principally of sales of land surrounding our retail store developments and fees collected from our other real estate, outfitter services, and travel businesses.
In 2007, our Retail and Direct sales were impacted by a challenging retail and macroeconomic environment. However, revenue increased in 2007 in all three of our primary business segments but declined for our Other segment primarily due to a decrease in land sales in 2007 compared to 2006. Retail sales increased due to our new store openings. Direct revenue increased primarily from efforts to increase traffic to our website. Financial Services revenue growth was driven by growth in the number of average active credit card accounts and average managed credit card loans.
Revenue from the sale of gift certificates and gift cards is recognized in earnings when the gift certificates and gift cards are redeemed for merchandise or services. Our gift instrument liability at the end of 2007 was $113 million compared to $87 million at the end of 2006. Customers also receive points for purchases at our retail stores or through our Direct business on various loyalty programs. In addition, our Cabela’s CLUB Visa card loyalty program allows customers to earn points whenever and wherever they use their credit card, and then redeem earned points for

Job TiTle Cabelas 10K Revision 9 seRial DaTe / Time Tuesday, March 11, 2008 /1:07 AM Job numbeR 159962 Type Current page no. 29 opeRaToR PM3
29
<12345678>
products and services at our retail stores or through our Direct business. The percentage of our merchandise sales that were made on the Cabela’s CLUB card increased to 26.3% for 2007 from 24.6% for 2006. The dollar amounts related to points are accrued as earned by the cardholder and recorded as a reduction in Financial Services revenue. The dollar amount of unredeemed credit card points and loyalty points was $71 million at the end of 2007 compared to $57 million at the end of 2006.
Product Sales Mix – Our five retail merchandise product categories, and the percentage of revenue contributed by each, are presented in the following table for our Retail and Direct businesses and in total for the years ended:
Retail Direct Total2007 2006 2007 2006 2007 2006
Hunting Equipment . . . . . . . . . . . . . . . . . . . . . . . . . . . 38.7% 35.6% 26.6% 27.1% 32.6% 30.7%Fishing and Marine . . . . . . . . . . . . . . . . . . . . . . . . . . . 15.6 16.7 12.3 12.5 14.0 14.3Camping. . . . . . . . . . . . . . . . . . . . . . . . . . . . . . . . . . . . 12.9 12.1 15.4 14.8 14.1 13.7Clothing and Footwear . . . . . . . . . . . . . . . . . . . . . . . . 27.0 29.1 36.3 36.7 31.7 33.5Gifts and Furnishings . . . . . . . . . . . . . . . . . . . . . . . . . 5.8 6.5 9.4 8.9 7.6 7.8Total . . . . . . . . . . . . . . . . . . . . . . . . . . . . . . . . . . 100.0% 100.0% 100.0% 100.0% 100.0% 100.0%
Retail Revenue – Retail revenue increased primarily due to an increase of $232 million in new store sales for 2007 compared to new store sales for 2006. Contributing to our Retail revenue growth were the eight new stores we opened in 2007 as follows:
• Hazelwood, Missouri . . . . . . . . . . . . . April
• Hoffman Estates, Illinois . . . . . . . . . . September
• East Hartford, Connecticut . . . . . . . . October
• Gonzales, Louisiana . . . . . . . . . . . . . October
• Hammond, Indiana . . . . . . . . . . . . . . October
• Reno, Nevada . . . . . . . . . . . . . . . . . . . November
• Post Falls, Idaho . . . . . . . . . . . . . . . . . November
• Lacey, Washington . . . . . . . . . . . . . . November
2007 2006Increase
(Decrease) % Change (Dollars in Thousands)
Comparable stores sales . . . . . . . . . . . . . . . . . . . . . . . . . . . . . $736,430 $745,357 $(8,927) (1.2)%Comparable stores sales growth percentage . . . . . . . . . . . . . (1.2)% 1.3%
Comparable store sales decreased $9 million, or 1.2%, for 2007 principally because of the challenging macroeconomic and retail industry environment, competition, and a lowering of overall consumer confidence in the United States which negatively impacted sales growth. A store is included in our comparable store sales base on the first day of the month following the fifteen month anniversary of 1) its opening or acquisition, or 2) any expansion by greater than 25% of its total square footage.
Average sales per square foot for stores that were open during the entire year were $332 for 2007 compared to $348 for 2006. The decrease in average sales per square foot results from certain stores not meeting sales expectations and a decrease in comparable store sales. The product category that contributed the largest dollar volume increase to our Retail revenue for 2007 was hunting equipment.

Job TiTle Cabelas 10K Revision 9 seRial DaTe / Time Tuesday, March 11, 2008 /1:07 AM Job numbeR 159962 Type Current page no. 30 opeRaToR PM3
30
<12345678>
Direct Revenue – Direct revenue increased $42 million, or 3.9%, primarily from growth in sales through our website. Catalog mail order sales continue to decrease as these sales transition to our Internet site and our new retail stores.
2007 2006Increase
(Decrease) % Change Percentage increase year over year in Internet website visits . . . . . . . 30.2% 32.1%Catalog circulation in pages (in millions) . . . . . . . . . . . . . . . . . . . . . . 36,499 36,705 (206) (0.6)%Number of separate catalog titles circulated . . . . . . . . . . . . . . . . . . . . 91 86 5
Internet site visits increased as we continue to focus our efforts on utilizing Direct marketing programs to increase traffic to our website. The camping product category contributed the largest dollar volume increase to our Direct revenue for 2007. The number of active Direct customers, which we define as those customers who have purchased merchandise from us in the last twelve months, increased by 2.0% over 2006.
Financial Services Revenue – Key statistics reflecting the performance of our Financial Services business are shown in the following chart for the years ended:
2007 2006Increase
(Decrease) % Change (Dollars in Thousands Except Average Balance per Account)
Average balance of managed credit card loans . . . . . . . . . . . . . $1,690,543 $1,357,671 $332,872 24.5%Number of average active credit card accounts . . . . . . . . . . . . . 987,411 853,187 134,224 15.7
Average balance per active credit card account . . . . . . . . . . . . $ 1,712 $ 1,591 $ 121 7.6
Net charge-offs . . . . . . . . . . . . . . . . . . . . . . . . . . . . . . . . . . . . . . 33,898 25,199 8,699 34.5Net charge-offs as a percentage of average managed credit
card loans . . . . . . . . . . . . . . . . . . . . . . . . . . . . . . . . . . . . . . . 2.01% 1.86% 0.15%
The balance of average managed credit card loans increased to $1.69 billion, or 24.5%, because of the increase in the number of accounts and the average balance per account. The number of accounts increased to 987,411, or 15.7%, due to our marketing efforts to add additional accounts. Net charge-offs increased to 2.01% for 2007 principally because of the challenging economic environment. Net charge-offs for 2007 approximate those levels experienced before the 2005 bankruptcy law changes.
The components of Financial Services revenue on a generally accepted accounting principles (“GAAP”) basis are as follows for the years ended:
2007 2006 2005(In Thousands)
Interest and fee income, net of provision for loan losses . . . . . . . . . . . . . . $ 28,974 $ 23,973 $ 17,196Interest expense . . . . . . . . . . . . . . . . . . . . . . . . . . . . . . . . . . . . . . . . . . . . . . (7,288) (5,008) (3,241)Net interest income, net of provision for loan losses . . . . . . . . . . . . . . . . . 21,686 18,965 13,955Non-interest income:
Securitization income (including gains on sales of credit card loans of $22,740 and $17,410) . . . . . . . . . . . . . . . . . . . . . . . . . . . . . . . . . . . . 194,516 169,173 133,032
Other non-interest income . . . . . . . . . . . . . . . . . . . . . . . . . . . . . . . . . . . 51,670 39,381 31,836Total non-interest income . . . . . . . . . . . . . . . . . . . . . . . . . . . . . . . 246,186 208,554 164,868
Less: Customer rewards costs . . . . . . . . . . . . . . . . . . . . . . . . . . . . . . . . . . . (108,537) (90,096) (72,992)Financial Services revenue . . . . . . . . . . . . . . . . . . . . . . . . . . . . . . . . . . . . . $ 159,335 $137,423 $105,831
Financial Services revenue increased $22 million, or 15.9%, in 2007 compared to 2006. Credit card loans securitized and sold are removed from our consolidated balance sheet, and the net earnings on these securitized assets, after paying costs associated with outside investors, are reflected as a component of our securitization income shown above on a GAAP basis. Net interest income includes operating results on our credit card loans receivable

Job TiTle Cabelas 10K Revision 9 seRial DaTe / Time Tuesday, March 11, 2008 /1:07 AM Job numbeR 159962 Type Current page no. 31 opeRaToR PM3
31
<12345678>
we own. Non-interest income includes servicing income, gains on sales of loans, and income recognized on our retained interests, as well as interchange income on the entire managed portfolio. Excluding the effect of gains on the sale of credit card loans, securitization income increased $20 million over 2006, due primarily to growth in the securitized loan portfolio. Other non-interest income increased $12 million primarily from increases in servicing fees on securitized loans year over year and account growth. Customer rewards costs increased $18 million from continued growth in the Cabela’s CLUB Visa card usage by our customers.
Managed credit card loans of the Financial Services business segment include both credit card loans receivable we own and securitized credit card loans. The process by which credit card loans are securitized converts interest income, interchange income, credit card fees, credit losses, and other income and expenses on the securitized loans into securitization income. Because the financial performance of the total managed portfolio has a significant impact on earnings we receive from servicing the portfolio, management believes evaluating the components of Financial Services revenue for both owned loans and securitized loans is important to analyzing results.
Non-GAAP Presentation – The “non-GAAP” presentation shown below presents the financial performance of the total managed portfolio of credit card loans. Although our consolidated financial statements are not presented in this manner, we review the performance of the managed portfolio as presented below. Interest income, interchange income (net of customer rewards), and fee income on both the owned and securitized portfolio are reflected in the respective line items. Interest paid to outside investors on the securitized credit card loans is included in interest expense. Credit losses on the entire managed portfolio are reflected in the provision for loan losses.
The following table sets forth the revenue components of our Financial Services segment managed portfolio on a non-GAAP basis for the years ended:
2007 2006 2005(Dollars in Thousands)
Interest income . . . . . . . . . . . . . . . . . . . . . . . . . . . . . . . . . . . . . . . . . . . . . . $186,341 $145,425 $102,824Interchange income, net of customer rewards costs . . . . . . . . . . . . . . . . . . 62,066 51,086 42,468Other fee income . . . . . . . . . . . . . . . . . . . . . . . . . . . . . . . . . . . . . . . . . . . . 27,233 22,829 20,738Interest expense . . . . . . . . . . . . . . . . . . . . . . . . . . . . . . . . . . . . . . . . . . . . . (83,120) (64,910) (41,654)Provision for loan losses . . . . . . . . . . . . . . . . . . . . . . . . . . . . . . . . . . . . . . . (35,415) (26,064) (24,254)Other . . . . . . . . . . . . . . . . . . . . . . . . . . . . . . . . . . . . . . . . . . . . . . . . . . . . . . 2,230 9,057 5,709Managed Financial Services revenue . . . . . . . . . . . . . . . . . . . . . . . . . . . . . $159,335 $137,423 $105,831
Managed Financial Services Revenue as a Percentage of Average Managed Credit Card Loans:
Interest income . . . . . . . . . . . . . . . . . . . . . . . . . . . . . . . . . . . . . . . . . . . . . . 11.0% 10.7% 9.4%Interchange income, net of customer rewards costs . . . . . . . . . . . . . . . . . . 3.7 3.8 3.9Other fee income . . . . . . . . . . . . . . . . . . . . . . . . . . . . . . . . . . . . . . . . . . . . 1.6 1.7 1.9Interest expense . . . . . . . . . . . . . . . . . . . . . . . . . . . . . . . . . . . . . . . . . . . . . (4.9) (4.8) (3.8)Provision for loan losses . . . . . . . . . . . . . . . . . . . . . . . . . . . . . . . . . . . . . . . (2.1) (1.9) (2.2)Other . . . . . . . . . . . . . . . . . . . . . . . . . . . . . . . . . . . . . . . . . . . . . . . . . . . . . . 0.1 0.6 0.5Managed Financial Services revenue . . . . . . . . . . . . . . . . . . . . . . . . . . . . . 9.4% 10.1% 9.7%
The increase in interest income of $41 million in 2007 from 2006 was due to an increase in interest rates and managed credit card loans. The increase in interchange income of $11 million in 2007 from 2006 was driven by net credit card purchases, which increased 20.6%. Other fee income increased $4 million due to increases of $2 million in late fees and $2 million in payment assurance fees. The increases in interest income and interchange income were offset by an increase in interest expense of $18 million from increases in securitized credit card loans, borrowings, and interest rates, and by an increase in loan losses of $9 million because of increases in managed credit card loans and increases in net charge-offs.
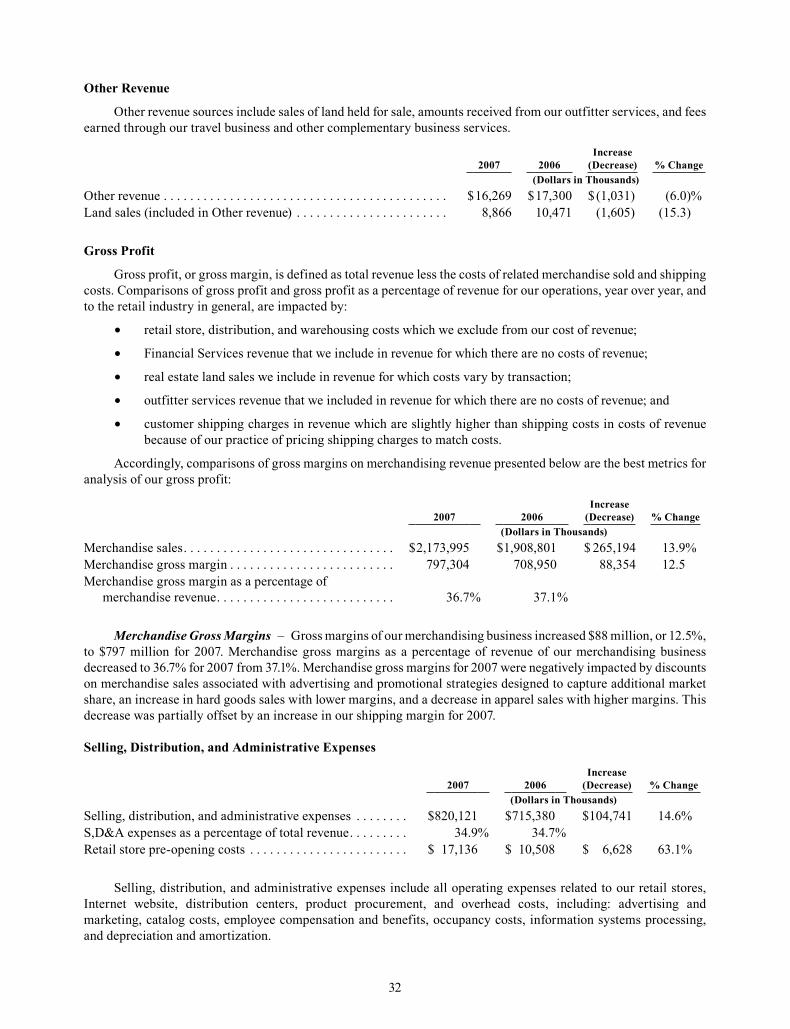
Job TiTle Cabelas 10K Revision 9 seRial DaTe / Time Tuesday, March 11, 2008 /1:07 AM Job numbeR 159962 Type Current page no. 32 opeRaToR PM3
32
<12345678>
Other Revenue
Other revenue sources include sales of land held for sale, amounts received from our outfitter services, and fees earned through our travel business and other complementary business services.
2007 2006Increase
(Decrease) % Change (Dollars in Thousands)
Other revenue . . . . . . . . . . . . . . . . . . . . . . . . . . . . . . . . . . . . . . . . . . . $16,269 $17,300 $(1,031) (6.0)%Land sales (included in Other revenue) . . . . . . . . . . . . . . . . . . . . . . . 8,866 10,471 (1,605) (15.3)
Gross Profit
Gross profit, or gross margin, is defined as total revenue less the costs of related merchandise sold and shipping costs. Comparisons of gross profit and gross profit as a percentage of revenue for our operations, year over year, and to the retail industry in general, are impacted by:
• retail store, distribution, and warehousing costs which we exclude from our cost of revenue;
• Financial Services revenue that we include in revenue for which there are no costs of revenue;
• real estate land sales we include in revenue for which costs vary by transaction;
• outfitter services revenue that we included in revenue for which there are no costs of revenue; and
• customer shipping charges in revenue which are slightly higher than shipping costs in costs of revenue because of our practice of pricing shipping charges to match costs.
Accordingly, comparisons of gross margins on merchandising revenue presented below are the best metrics for analysis of our gross profit:
2007 2006Increase
(Decrease) % Change(Dollars in Thousands)
Merchandise sales . . . . . . . . . . . . . . . . . . . . . . . . . . . . . . . . $2,173,995 $1,908,801 $ 265,194 13.9%Merchandise gross margin . . . . . . . . . . . . . . . . . . . . . . . . . 797,304 708,950 88,354 12.5 Merchandise gross margin as a percentage of
merchandise revenue . . . . . . . . . . . . . . . . . . . . . . . . . . . 36.7% 37.1%
Merchandise Gross Margins – Gross margins of our merchandising business increased $88 million, or 12.5%, to $797 million for 2007. Merchandise gross margins as a percentage of revenue of our merchandising business decreased to 36.7% for 2007 from 37.1%. Merchandise gross margins for 2007 were negatively impacted by discounts on merchandise sales associated with advertising and promotional strategies designed to capture additional market share, an increase in hard goods sales with lower margins, and a decrease in apparel sales with higher margins. This decrease was partially offset by an increase in our shipping margin for 2007.
Selling, Distribution, and Administrative Expenses
2007 2006Increase
(Decrease) % Change(Dollars in Thousands)
Selling, distribution, and administrative expenses . . . . . . . . $820,121 $715,380 $104,741 14.6%S,D&A expenses as a percentage of total revenue . . . . . . . . . 34.9% 34.7%Retail store pre-opening costs . . . . . . . . . . . . . . . . . . . . . . . . $ 17,136 $ 10,508 $ 6,628 63.1%
Selling, distribution, and administrative expenses include all operating expenses related to our retail stores, Internet website, distribution centers, product procurement, and overhead costs, including: advertising and marketing, catalog costs, employee compensation and benefits, occupancy costs, information systems processing, and depreciation and amortization.

Job TiTle Cabelas 10K Revision 9 seRial DaTe / Time Tuesday, March 11, 2008 /1:07 AM Job numbeR 159962 Type Current page no. 33 opeRaToR PM3
33
<12345678>
Selling, distribution, and administrative expenses on a consolidated basis increased $105 million, or 14.6%, for 2007 over 2006. The primary reason for the increase in 2007 was the addition of eight new stores in 2007 compared to four added in 2006 along with the addition of infrastructure necessary to support this store expansion. The most significant factors contributing to the increase in selling, distribution, and administrative expenses, and the infrastructure expansion required to support the revenue growth in 2007 from our retail store expansion, included increases in:
• employee compensation, benefits, training, and recruitment costs of $56 million;
• facility and information system depreciation of $15 million;
• advertising costs of $11 million;
• catalog and Internet marketing costs of $7 million;
• credit card processing fees of $6 million; and
• information systems costs of $4 million.
Significant selling, distribution, and administrative expense increases and decreases related to specific business segments included the following:
Retail Business Segment:
• New store pre-opening costs of $17 million, an increase of $7 million over 2006.
• Operating costs for new stores that were not open in the comparable period of 2006 of $54 million, including employee compensation and benefits costs of $31 million.
• A decrease in comparable store employee compensation and benefits of $1 million resulting from declining sales in comparable stores.
• Depreciation on new stores not open in the comparable period of 2006 of $9 million.
Direct Business Segment:
• An increase of $6 million in marketing costs primarily from Internet marketing and mailing promotions, catalog costs from higher postage and print rates, and the addition of five catalogs not circulated in 2006.
• Increases in employee compensation and benefits of $2 million principally for positions added to support our growth.
• Increases in incidental information system costs of $2 million specifically related to our website.
Financial Services:
• Increases in advertising and promotional costs of $1 million due to increases in new account acquisition costs, increases in Visa charges driven by increases in credit card transactions, and account retention tools.
• Third party data credit card processing services increased by $2 million as the number of credit card accounts and credit card transactions increased.
• Postage cost increases of $1 million from increases in the number of accounts and postage rate increases.
• An increase in employee compensation and benefits of $1 million to support our credit card account growth.

Job TiTle Cabelas 10K Revision 9 seRial DaTe / Time Tuesday, March 11, 2008 /1:07 AM Job numbeR 159962 Type Current page no. 34 opeRaToR PM3
34
<12345678>
Corporate Overhead, Distribution Centers, and Other:
• An increase in employee compensation and benefits of $9 million from the expansion and improvement of our infrastructure to support our growth.
• Depreciation expense increase of $3 million on information system upgrades implemented in 2006 and 2007.
• An increase in contract labor costs and software expense of $1 million on information system upgrades and expansion.
Operating Income
Operating income is revenue less cost of revenue and selling, distribution, and administrative expenses. Operating income for our business segments excludes costs associated with operating expenses of distribution centers, procurement activities, and other corporate overhead costs.
2007 2006Increase
(Decrease) % Change(Dollars in Thousands)
Total operating income . . . . . . . . . . . . . . . . . . . . . . . . . . . . . . . $151,092 $143,745 $ 7,347 5.1%Total operating income as a percentage of total revenue . . . . . 6.4% 7.0%Operating income by business segment:
Retail . . . . . . . . . . . . . . . . . . . . . . . . . . . . . . . . . . . . . . . . . . $127,744 $124,122 3,622 2.9Direct . . . . . . . . . . . . . . . . . . . . . . . . . . . . . . . . . . . . . . . . . . 190,046 179,182 10,864 6.1Financial Services . . . . . . . . . . . . . . . . . . . . . . . . . . . . . . . . 37,448 30,061 7,387 24.6
Operating income as a percentage of segment revenue:Retail . . . . . . . . . . . . . . . . . . . . . . . . . . . . . . . . . . . . . . . . . . 12.2% 15.1%Direct . . . . . . . . . . . . . . . . . . . . . . . . . . . . . . . . . . . . . . . . . . 16.8 16.5Financial Services . . . . . . . . . . . . . . . . . . . . . . . . . . . . . . . . 23.5 21.9
Operating income increased $7 million, or 5.1%, for 2007. Operating income as a percentage of revenue decreased to 6.4% for 2007 from 7.0% for 2006. Operating income comparisons between 2007 and 2006 are impacted by 1) the addition of new retail stores in 2007 and 2006, 2) sales increases for our Direct business, and 3) the profitability of our Financial Services business segment. The Financial Services segment incurs a marketing fee paid to the Retail and Direct business segments. This marketing fee is included in selling, distribution, and administrative expenses as an expense for the Financial Services segment and as a credit to expense for the Retail and Direct business segments. The marketing fee paid by the Financial Services segment to these two business segments increased $4 million in 2007 compared to 2006 – a $1 million increase to the Direct business segment and a $3 million increase to the Retail segment.
Interest (Expense) Income, Net
Interest expense, net of interest income, increased $3 million to $19 million for 2007 compared to 2006. The net increase in interest expense was primarily due to additional debt incurred for financing our retail store expansion. During 2007, we capitalized interest totaling $4 million on qualifying fixed assets relating primarily to retail store construction compared to $0.4 million during 2006.
Other Non-Operating Income, Net
Other income decreased $3 million to $7 million for 2007 from $10 million in 2006 due to a decrease in interest earned on economic development bonds. Our investment in economic development bonds was lower in 2007 than 2006 because of retirements as we monetized bonds in both years.
Provision for Income Taxes
Our effective tax rate was 36.9% for 2007 compared to 37.5% for 2006. The decrease in the effective tax rate for 2007 was due to less state income taxes in 2007 compared to 2006.

Job TiTle Cabelas 10K Revision 9 seRial DaTe / Time Tuesday, March 11, 2008 /1:07 AM Job numbeR 159962 Type Current page no. 35 opeRaToR PM3
35
<12345678>
Results of Operations - 2006 Compared to 2005
Financial Highlights 2006 2005Increase
(Decrease) % Change(Dollars in Thousands)
Net income. . . . . . . . . . . . . . . . . . . . . . . . . . . . . . . . . . $ 85,785 $ 72,569 $ 13,216 18.2%Net income as a percentage of revenue . . . . . . . . . . . . 4.2% 4.0%Net income per diluted share. . . . . . . . . . . . . . . . . . . . $ 1.29 $ 1.10 $ 0.19 17.3Revenue by segment:
Direct . . . . . . . . . . . . . . . . . . . . . . . . . . . . . . . . . . . $1,088,480 $1,044,167 $ 44,313 4.2Retail . . . . . . . . . . . . . . . . . . . . . . . . . . . . . . . . . . . 820,321 620,105 200,216 32.3Financial Services . . . . . . . . . . . . . . . . . . . . . . . . . 137,423 105,831 31,592 29.9Other. . . . . . . . . . . . . . . . . . . . . . . . . . . . . . . . . . . . 17,300 29,558 (12,258 ) (41.5)
Total revenue . . . . . . . . . . . . . . . . . . . . . . . . . . $2,063,524 $1,799,661 $ 263,863 14.7
New store sales . . . . . . . . . . . . . . . . . . . . . . . . . . . . . . $ 282,652 $ 88,226 $ 194,426 220.4Comparable store sales . . . . . . . . . . . . . . . . . . . . . . . . 537,669 531,010 6,659 1.3Average sales per square foot . . . . . . . . . . . . . . . . . . . 348 367 (19 ) (5.2)Gross Profit . . . . . . . . . . . . . . . . . . . . . . . . . . . . . . . . . $ 859,125 $ 735,339 123,786 16.8Gross Profit as a percent of revenue . . . . . . . . . . . . . . 41.6% 40.9%Merchandising gross margin . . . . . . . . . . . . . . . . . . . . $ 708,950 $ 620,244 88,706 14.3Merchandising gross margin as a percent of
merchandising revenue . . . . . . . . . . . . . . . . . . . . . 37.1% 37.3%Selling, distribution and administrative expenses . . . $ 715,380 $ 620,376 95,004 15.3Selling, distribution and administrative expenses
as a percent of revenue. . . . . . . . . . . . . . . . . . . . . . 34.7% 34.5%Operating income . . . . . . . . . . . . . . . . . . . . . . . . . . . . $ 143,745 $ 114,963 28,782 25.0Operating income margin . . . . . . . . . . . . . . . . . . . . . . 7.0% 6.4%
Revenue
Revenue increased by $264 million, or 14.7%, in 2006 from growth in the three major segments. Other revenue decreased in 2006 from a decrease in land sales.
Retail Revenue. Retail revenue increased by $200 million, or 32.3%, from new store sales of $194 million, and an increase in comparable store sales of $7 million, or 1.3%. Revenue increases are attributable to operational improvements in assortment and replenishment as well as advertising efforts. The product category that contributed the largest increase to our Retail revenue growth in 2006 was hunting equipment.
Direct Revenue. Direct revenue increased by $44 million, or 4.2%, due primarily to growth in Internet sales through our website. Circulation of our catalogs increased by 1.6 billion pages, or 4.5%, to 36.8 billion pages in 2006 from 35.2 billion pages in 2005. The number of active customers in our Direct business segment increased by 4.6%. The product category that contributed the largest dollar volume increase to our 2006 Direct revenue growth was hunting equipment.
Financial Services Revenue. Financial Services revenue increased by $32 million, or 29.9%. Securitization income increased $36 million primarily from growth in the securitized portfolio. Other non-interest income increased $8 million due to increases in servicing fees on securitized loans and card account growth. Net interest income on loans receivable increased $5 million. Customer rewards costs increased $17 million from continued growth in the Cabela’s CLUB Visa card usage by our customers.
We also measure the results of our Financial Services business on a non-GAAP managed basis as explained earlier. Interest income measured on a non-GAAP managed basis increased $43 million. The increase in interest income was due to an increase in interest rates and managed credit card loans. Interchange income, net of reward costs, increased by $9 million, or 20.3%. Interchange income is driven by net purchases, which increased 21.4%. The increases in interest income, interchange income, and other income were offset by an increase in interest expense
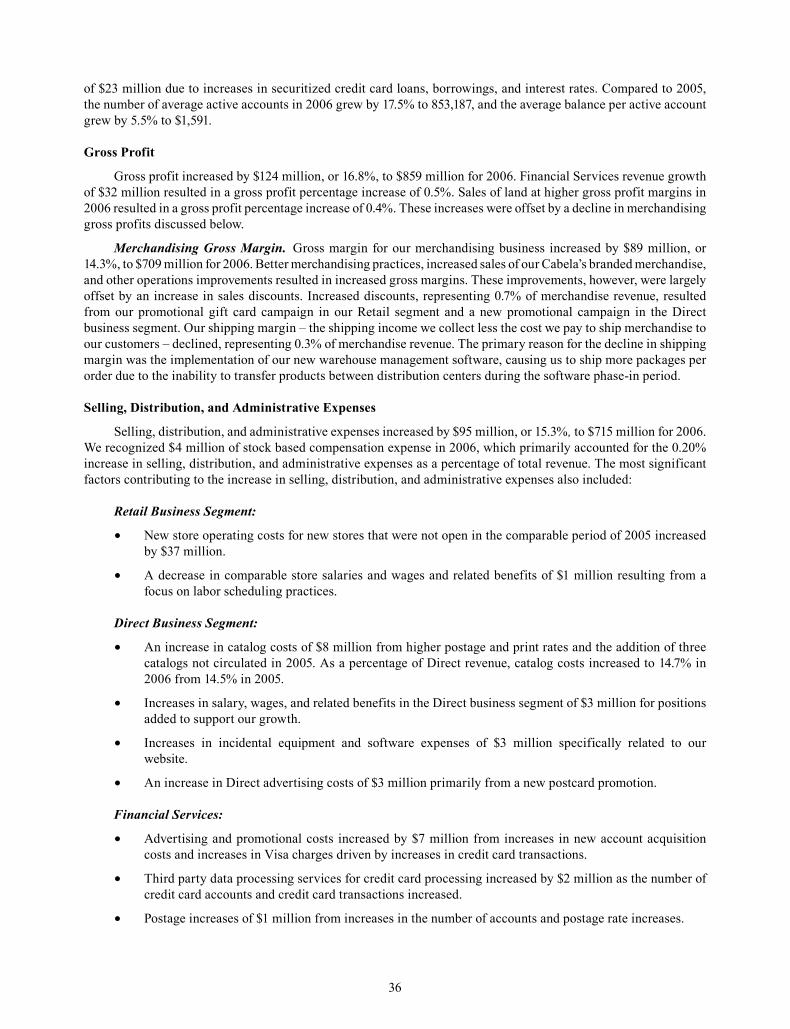
Job TiTle Cabelas 10K Revision 9 seRial DaTe / Time Tuesday, March 11, 2008 /1:07 AM Job numbeR 159962 Type Current page no. 36 opeRaToR PM3
36
<12345678>
of $23 million due to increases in securitized credit card loans, borrowings, and interest rates. Compared to 2005, the number of average active accounts in 2006 grew by 17.5% to 853,187, and the average balance per active account grew by 5.5% to $1,591.
Gross Profit
Gross profit increased by $124 million, or 16.8%, to $859 million for 2006. Financial Services revenue growth of $32 million resulted in a gross profit percentage increase of 0.5%. Sales of land at higher gross profit margins in 2006 resulted in a gross profit percentage increase of 0.4%. These increases were offset by a decline in merchandising gross profits discussed below.
Merchandising Gross Margin. Gross margin for our merchandising business increased by $89 million, or 14.3%, to $709 million for 2006. Better merchandising practices, increased sales of our Cabela’s branded merchandise, and other operations improvements resulted in increased gross margins. These improvements, however, were largely offset by an increase in sales discounts. Increased discounts, representing 0.7% of merchandise revenue, resulted from our promotional gift card campaign in our Retail segment and a new promotional campaign in the Direct business segment. Our shipping margin – the shipping income we collect less the cost we pay to ship merchandise to our customers – declined, representing 0.3% of merchandise revenue. The primary reason for the decline in shipping margin was the implementation of our new warehouse management software, causing us to ship more packages per order due to the inability to transfer products between distribution centers during the software phase-in period.
Selling, Distribution, and Administrative Expenses
Selling, distribution, and administrative expenses increased by $95 million, or 15.3%, to $715 million for 2006. We recognized $4 million of stock based compensation expense in 2006, which primarily accounted for the 0.20% increase in selling, distribution, and administrative expenses as a percentage of total revenue. The most significant factors contributing to the increase in selling, distribution, and administrative expenses also included:
Retail Business Segment:
• New store operating costs for new stores that were not open in the comparable period of 2005 increased by $37 million.
• A decrease in comparable store salaries and wages and related benefits of $1 million resulting from a focus on labor scheduling practices.
Direct Business Segment:
• An increase in catalog costs of $8 million from higher postage and print rates and the addition of three catalogs not circulated in 2005. As a percentage of Direct revenue, catalog costs increased to 14.7% in 2006 from 14.5% in 2005.
• Increases in salary, wages, and related benefits in the Direct business segment of $3 million for positions added to support our growth.
• Increases in incidental equipment and software expenses of $3 million specifically related to our website.
• An increase in Direct advertising costs of $3 million primarily from a new postcard promotion.
Financial Services:
• Advertising and promotional costs increased by $7 million from increases in new account acquisition costs and increases in Visa charges driven by increases in credit card transactions.
• Third party data processing services for credit card processing increased by $2 million as the number of credit card accounts and credit card transactions increased.
• Postage increases of $1 million from increases in the number of accounts and postage rate increases.

Job TiTle Cabelas 10K Revision 9 seRial DaTe / Time Tuesday, March 11, 2008 /1:07 AM Job numbeR 159962 Type Current page no. 37 opeRaToR PM3
37
<12345678>
Corporate Overhead, Distribution Centers and Other:
• Strategic initiatives to expand and improve our infrastructure to support our growth resulted in an increase in wages and benefits of $17 million primarily at our distribution centers.
• An increase in depreciation expense of $6 million from two system upgrades implemented at the end of 2005, new systems put in service during 2006, and new equipment purchases in our distribution centers.
• An increase in contract labor costs of $3 million from consulting costs related to system upgrades and expansion.
• An increase in computer equipment and software cost of $1 million primarily from increased software licenses.
Operating Income
Operating income increased by $29 million, or 25.0%, to $144 million for 2006. Operating income as a percentage of revenue increased to 7.0% for 2006 from 6.4% for 2005. Our Retail segment operating income as a percentage of revenue improved to 15.1% from 13.9% as the continued expansion helped to offset overhead costs, and our comparable store operating costs improved with a focus on efficient labor scheduling. Operating income as a percentage of revenue from our Direct segment was flat at 16.5% in both 2006 and 2005. Financial Services operating income as a percentage of revenue was comparable between years, up 0.1%, to 21.9% from 21.8%, as growth in our customer loyalty program continued to contribute positive returns. The Financial Services segment incurs a marketing fee paid to the Retail and Direct business segments. This marketing fee is included in selling, distribution, and administrative expenses as an expense for the Financial Services segment and as a credit to expense for the Retail and Direct business segments. The marketing fee paid by the Financial Services segment to these two business segments increased $16 million compared to 2005 – a $9 million increase to the Direct business segment and a $7 million increase to the Retail segment.
Interest (Expense) Income, Net
Interest expense, net of interest income, increased by $6 million for 2006 to $16 million from property and equipment expenditures funded by the $215 million private placement of notes completed in February 2006. This increase was partially offset by an increase in interest income earned on invested cash of $1 million in 2006.
Other Non-Operating Income, Net
Other income decreased by $1 million to $10 million for 2006 primarily due to a decrease in interest earned on economic development bonds. Our investment in economic development bonds decreased by $28 million from the monetization of certain bonds.
Provision for Income Taxes
Our effective tax rate was 37.5% for 2006 compared to 37.1% in 2005. The increase in our effective tax rate primarily resulted from higher state taxes in states we opened stores in during 2006.
Bank Asset Quality
Overview
We securitize a majority of our credit card loans. On a quarterly basis, we transfer eligible credit card loans into a securitization trust. We are required to own at least a minimum twenty day average of 5% of the interests in the securitization trust, which is our transferor’s interest that totaled $167 million at the end of 2007. Accordingly, retained credit card loans have the same characteristics as credit card loans sold to outside investors. Certain accounts are ineligible for securitization for reasons such as: 1) they are delinquent, 2) they originated from sources other than Cabela’s CLUB Visa credit cards, or 3) various other requirements. Loans ineligible for securitization totaled $15 million at the end of 2007.

Job TiTle Cabelas 10K Revision 9 seRial DaTe / Time Tuesday, March 11, 2008 /1:07 AM Job numbeR 159962 Type Current page no. 38 opeRaToR PM3
38
<12345678>
The quality of our managed credit card loan portfolio at any time reflects, among other factors: 1) the creditworthiness of cardholders, 2) general economic conditions, 3) the success of our account management and collection activities, and 4) the life-cycle stage of the portfolio. During periods of economic weakness, delinquencies and net charge-offs are more likely to increase. We have mitigated periods of economic weakness by selecting a customer base that is very creditworthy. The median FICO scores of our securitized loans were 787 in 2007 and 785 in 2006.
We believe that as our credit card accounts mature, they are less likely to result in a charge-off and less likely to be closed. The following table shows our managed credit card loans outstanding at the end of 2007 and 2006 segregated by the number of months passed since the accounts were opened.
2007 2006Loans
OutstandingPercentage of
TotalLoans
OutstandingPercentage of
TotalMonths Since Account Opened (Dollars in Thousands)6 months or less . . . . . . . . . . . . . . . . . . . . . . . . . . . . . . $ 138,021 6.7% $ 105,101 6.3%7 – 12 months . . . . . . . . . . . . . . . . . . . . . . . . . . . . . . . . 131,988 6.4 105,296 6.313 – 24 months . . . . . . . . . . . . . . . . . . . . . . . . . . . . . . . 272,830 13.3 223,209 13.325 – 36 months . . . . . . . . . . . . . . . . . . . . . . . . . . . . . . . 243,092 11.8 193,384 11.637 – 48 months . . . . . . . . . . . . . . . . . . . . . . . . . . . . . . . 205,909 10.0 186,078 11.149 – 60 months . . . . . . . . . . . . . . . . . . . . . . . . . . . . . . . 194,066 9.4 191,372 11.461 – 72 months . . . . . . . . . . . . . . . . . . . . . . . . . . . . . . . 196,949 9.6 197,928 11.873 – 84 months . . . . . . . . . . . . . . . . . . . . . . . . . . . . . . . 200,461 9.7 247,771 14.885 + months . . . . . . . . . . . . . . . . . . . . . . . . . . . . . . . . . 474,918 23.1 223,925 13.4
Total . . . . . . . . . . . . . . . . . . . . . . . . . . . . . . . . . . . . . $2,058,234 100.0% $1,674,064 100.0%
Delinquencies
We consider the entire balance of an account, including any accrued interest and fees, delinquent if the minimum payment is not received by the payment due date. Our aging method is based on the number of completed billing cycles during which a customer has failed to make a required payment. The following chart shows the percentage of our managed credit card loans that have been delinquent at year end:
Number of days delinquent 2007 2006 2005Greater than 30 days ................................................... 0.97% 0.75% 0.67%Greater than 60 days ................................................... 0.57 0.44 0.38Greater than 90 days ................................................... 0.28 0.18 0.16
Charge-offs
Charge-offs consist of the uncollectible principal, interest, and fees on a customer’s account. Recoveries are the amounts collected on previously charged-off accounts. Most bankcard issuers charge-off accounts at 180 days. Beginning in June 2007, we began charging off credit card loans on a daily basis after an account becomes at a minimum 130 days contractually delinquent to allow us to manage the collection process more efficiently. Accounts relating to cardholder bankruptcies, cardholder deaths, and fraudulent transactions are charged off earlier. Prior to June 2007, we charged-off credit card loans on the 24th day of the month after an account became 115 days contractually delinquent resulting in a 129-day average for charging-off an account. Our charge-off activity for the managed portfolio is summarized below for the years ended:
2007 2006 2005(Dollars in Thousands)
Charge-offs . . . . . . . . . . . . . . . . . . . . . . . . . . . . . . . . . $42,853 $31,068 $27,829Recoveries . . . . . . . . . . . . . . . . . . . . . . . . . . . . . . . . . . 8,955 5,869 4,227Net charge-offs . . . . . . . . . . . . . . . . . . . . . . . . . . . . . . $33,898 $25,199 $23,602Net charge-offs as a percentage of
average managed credit card loans . . . . . . . . . . . . 2.01% 1.86% 2.15%
Job TiTle Cabelas 10K Revision 9 seRial DaTe / Time Tuesday, March 11, 2008 /1:07 AM Job numbeR 159962 Type Current page no. 39 opeRaToR PM3
39
<12345678>
Liquidity and Capital Resources
Overview
Our Retail and Direct business segments and our Financial Services business segment have significantly differing liquidity and capital needs. The primary cash requirements of our merchandising business relate to capital for new retail stores, purchases of inventory, investments in our management information systems and infrastructure, purchases of economic development bonds related to the construction of new retail stores, and general working capital needs. We historically have met these requirements with cash generated from our merchandising business operations, borrowing under revolving credit facilities, issuing debt and equity securities, obtaining economic development grants from state and local governments in connection with developing our retail stores, collecting principal and interest payments on our economic development bonds, and from the retirement of economic development bonds.
Retail and Direct Business Segments – The cash flow we generate from our merchandising business is seasonal, with our peak cash requirements for inventory occurring from April through November. While we have consistently generated overall positive annual cash flow from our operating activities, other sources of liquidity are required by our merchandising business during these peak cash use periods. These sources historically have included short-term borrowings under our revolving credit facility and access to debt markets. While we generally have been able to manage our cash needs during peak periods, if any disruption occurred to our funding sources, or if we underestimated our cash needs, we would be unable to purchase inventory and otherwise conduct our merchandising business to its maximum effectiveness, which could result in reduced revenue and profits.
Financial Services Business Segment (the “bank”) – The primary cash requirements of our bank relate to the financing of credit card loans. The bank sources operating funds in the ordinary course of business through various financing activities, which include funding obtained from securitization transactions, borrowing under its credit agreement or federal funds purchase agreements, accepting certificates of deposit, and generating cash from operations. The bank is prohibited by regulations from lending money to Cabela’s or other affiliates. The bank is subject to capital requirements imposed by Nebraska banking law and the Visa membership rules, and its ability to pay dividends is also limited by Nebraska and Federal banking law.
We believe that we will have sufficient capital available from cash on hand, our revolving credit facility, and other borrowing sources to fund our cash requirements and near-term growth plans.
Operating, Investing and Financing Activities
The following table presents changes in our cash and cash equivalents for the years ended:
2007 2006 2005(In Thousands)
Net cash derived from operating activities ............................................. $ 31,828 $ 54,957 $ 72,564Net cash used in investing activities ....................................................... (331,493) (144,696) (80,617)Net cash provided by (used in) financing activities ................................ 257,944 175,719 (28,958)
2007 versus 2006
Operating Activities – Cash derived from operating activities decreased $23 million for 2007 compared to 2006. This net decrease in cash was primarily due to a net change of $31 million in inventories, as inventory balances increased $124 million over 2006 due to more new store openings in 2007. The inventory increase was funded by accounts payable, which had a net increase of $42 million compared to 2006. The net increase in accounts payable was impacted by a $40 million decrease compared to 2006 due to a decrease in the payable to the third party processor for the bank’s credit card transactions. In addition, land held for sale or development was up $11 million over 2006 as we increased our holdings in land investment. These uses of cash from operating activities were partially offset by an $18 million net increase between years related to the bank’s funding from securitization transactions. For 2007, the bank used cash for credit card originations (net of cash received from collections, proceeds from new securitizations, and changes in retained interests) of $53 million compared to $71 million in 2006. We received $17 million in tenant allowances during 2007, which accounts for most of the net increase of $19 million in other long-term liabilities;

Job TiTle Cabelas 10K Revision 9 seRial DaTe / Time Tuesday, March 11, 2008 /1:07 AM Job numbeR 159962 Type Current page no. 40 opeRaToR PM3
40
<12345678>
and the liability for gift certificates and credit card reward points increased $17 million over 2006 from increased sales of gift cards. In addition, depreciation and amortization increased $14 million offsetting cash used in operating activities.
We will incur a total cash outlay of approximately $19 million over four years based on our election in our 2007 federal income tax return to change our method of accounting for inventory from LIFO to FIFO for income tax purposes. At the end of 2007, we owed approximately $14 million, which is included in the current portion of deferred income taxes payable in our consolidated balance sheet.
Investing Activities – Cash used in investing activities increased $187 million for 2007 compared to 2006. This net increase was primarily due to expenditures related to the development and construction of new retail stores in 2007. For 2007, cash paid for property and equipment additions totaled $336 million. At December 29, 2007, we estimated total capital expenditures, including the purchase of economic development bonds, to be in the range of approximately $100-$125 million to be paid in 2008 relating to the development, construction, and completion of retail stores. Certain contractual aspects of our retail store locations are in various stages of negotiations, and are subject to customary conditions to closing. Economic development bonds totaling $1 million relating to our Lehi, Utah, retail store were redeemed in 2007. In addition, economic development bonds totaling $43 million and $53 million relating to our Wheeling, West Virginia, retail store and distribution center were retired during 2007 and 2006, respectively.
The following table highlights the growth of our retail stores, and the activity of economic development bonds related to the construction of these stores and related projects, for the years ended:
2007 2006(Dollars In Thousands)
Property and equipment additions . . . . . . . . . . . . . . . . . . . . . . . . . . . . . . . . . . . . . . . . . . . . . $ 335,644 $ 179,238Purchases of economic development bonds . . . . . . . . . . . . . . . . . . . . . . . . . . . . . . . . . . . . . . 36,223 23,397Acquisition of outdoor equipment retailer, net of cash acquired . . . . . . . . . . . . . . . . . . . . . . 9,277 —
Total . . . . . . . . . . . . . . . . . . . . . . . . . . . . . . . . . . . . . . . . . . . . . . . . . . . . . . . . . . . . . . . . . . $ 381,144 $ 202,635
Proceeds from retirements and maturities of economic development bonds . . . . . . . . . . . . $ 45,427 $ 54,065Number of new retail stores opened and acquired during the year . . . . . . . . . . . . . . . . . . . 9 4Number of retail stores at the end of the year . . . . . . . . . . . . . . . . . . . . . . . . . . . . . . . . . . . . 27 18
Financing Activities – Cash provided by financing activities increased $82 million for 2007 compared to 2006. This net increase from financing activities comparing periods was due to a net increase of $66 million in time deposits, the bank increasing its short-term borrowings to $100 million to fund its credit card operations, and a net increase of $35 million in borrowings primarily on lines of credit related to new stores which opened in 2007. In addition, unpresented checks net of bank balance increased $33 million due to timing of when checks cleared our bank. Partially offsetting these increases was a net decrease of $152 million in long-term debt ($215 million borrowed in 2006) used to support our retail store expansion.
The following table highlights the borrowing activity of our merchandising business and bank operations for the years ended:
2007 2006(In Thousands)
Borrowings on lines of credit and short-term debt, net of repayments . . . . . . . . . . . . . . . . . $ 49,691 $ 14,877Borrowing on variable funding facility – financial services subsidiary . . . . . . . . . . . . . . . . 100,000 —Issuances of long-term debt, net of repayments . . . . . . . . . . . . . . . . . . . . . . . . . . . . . . . . . . . 33,792 185,907
Total . . . . . . . . . . . . . . . . . . . . . . . . . . . . . . . . . . . . . . . . . . . . . . . . . . . . . . . . . . . . . . . . . . $183,483 $200,784

Job TiTle Cabelas 10K Revision 9 seRial DaTe / Time Tuesday, March 11, 2008 /1:07 AM Job numbeR 159962 Type Current page no. 41 opeRaToR PM3
41
<12345678>
The following table summarizes our availability under debt and credit facilities, excluding the bank’s facilities, at the end of years:
2007 2006(In Thousands)
Amounts available for borrowing under credit facilities . . . . . . . . . . . . . . . . . . . . . . . . . $ 340,000 $ 325,000Principal amounts outstanding . . . . . . . . . . . . . . . . . . . . . . . . . . . . . . . . . . . . . . . . . . . . . (58,023) —Outstanding letters of credit and standby letters of credit . . . . . . . . . . . . . . . . . . . . . . . . (59,596) (54,582)Remaining borrowing capacity . . . . . . . . . . . . . . . . . . . . . . . . . . . . . . . . . . . . . . . . . . . . $ 222,381 $ 270,418
In addition, the bank has total borrowing availability of $185 million under its transferor’s interest credit agreement and agreements to borrow federal funds. Our bank entered into a credit agreement in 2007 for a $100 million variable funding facility secured by a participation interest in the bank’s transferor’s interest of the Cabela’s Master Credit Card Trust. These funds were used to fund continued growth of the bank’s credit card portfolio. At the end of 2007, $100 million was outstanding under the bank’s transferor’s interest credit agreement, leaving $85 million of borrowing capacity remaining at the end of 2007.
In 2007, we issued $60 million aggregate principal amount of 6.08% senior unsecured notes. We used the proceeds from this offering for new retail store expansion, including property and equipment additions, purchase of economic development bonds, and general corporate purposes.
On January 16, 2008, we issued and sold $57 million of 7.20% unsecured notes to institutional buyers. The notes have a final maturity of 10 years and an average life of seven years. We intend to use the proceeds to pay down existing debt and for general corporate purposes.
2006 versus 2005
Operating Activities – Cash provided by operating activities decreased $18 million for 2006 compared to 2005. This net decrease was primarily due to a $51 million net decrease between years related to the bank’s funding from securitization transactions. For 2006, the bank used cash for credit card originations (net of cash received from collections, proceeds from new securitizations, and changes in retained interests) of $71 million compared to $20 million in 2005. Cash used for inventory increased $4 million over 2005 as we added four new retail stores. Cash used for income taxes payable also increased by $7 million over 2005 due to the timing of federal and state income tax payments and our increased profitability.
In addition, increases totaling $17 million comparing 2006 over 2005 relate to the use of cash from accounts receivable, land held for sale and other assets. Partially offsetting these decreases to cash from operating activities was a net increase of $41 million in net income adjusted for non-cash expenditures for deferred income taxes, depreciation and amortization, stock-based compensation, and other items. Cash provided from prepaid expenses and deferred catalog costs increased by $12 million over 2005 primarily due to the timing of catalog production costs. Cash was also provided from various liabilities and accruals that increased by a net of $4 million over 2005. In addition, accounts payable increased by $5 million from 2005 due to net increases in inventory payables of $10 million over 2005, partially offset by decreases of $4 million in the payable to the third party processor for the bank’s credit card transactions and $1 million in payables for catalog costs. The decreases were related to third party processor timing issues from 2005 and the timing in the catalog production work.
Investing Activities – Cash used in investing activities increased $64 million in 2006 compared to 2005. The net increase in cash used was primarily due to the purchases, net of maturities, of short-term investments of $124 million during 2006 compared to 2005. Partially offsetting this increase were net decreases in the purchases of economic development bonds of $42 million and in property and equipment expenditures of $15 million. The decrease in the purchases of economic development bonds related to the timing on the opening of certain new retail stores and the incentives related to those stores. In 2006, $53 million in bonds we owned related to our Wheeling, West Virginia, retail store and distribution center were retired in connection with a transaction whereby we took a subordinate position on the remaining bonds we held related to this location.
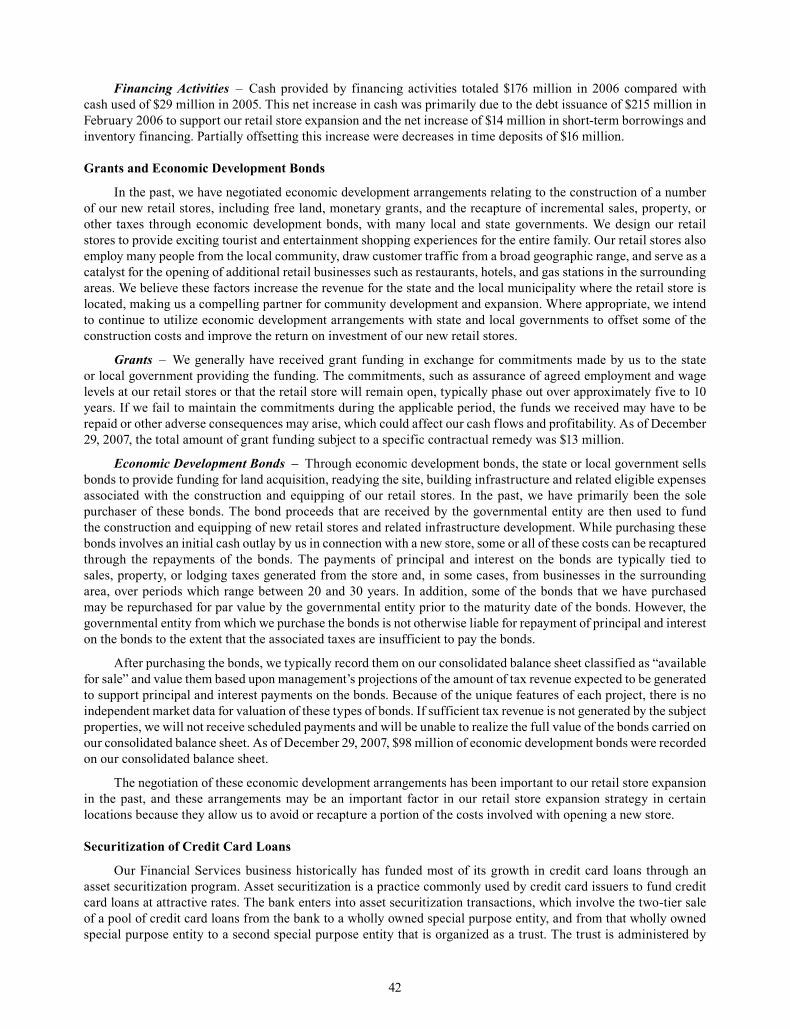
Job TiTle Cabelas 10K Revision 9 seRial DaTe / Time Tuesday, March 11, 2008 /1:07 AM Job numbeR 159962 Type Current page no. 42 opeRaToR PM3
42
<12345678>
Financing Activities – Cash provided by financing activities totaled $176 million in 2006 compared with cash used of $29 million in 2005. This net increase in cash was primarily due to the debt issuance of $215 million in February 2006 to support our retail store expansion and the net increase of $14 million in short-term borrowings and inventory financing. Partially offsetting this increase were decreases in time deposits of $16 million.
Grants and Economic Development Bonds
In the past, we have negotiated economic development arrangements relating to the construction of a number of our new retail stores, including free land, monetary grants, and the recapture of incremental sales, property, or other taxes through economic development bonds, with many local and state governments. We design our retail stores to provide exciting tourist and entertainment shopping experiences for the entire family. Our retail stores also employ many people from the local community, draw customer traffic from a broad geographic range, and serve as a catalyst for the opening of additional retail businesses such as restaurants, hotels, and gas stations in the surrounding areas. We believe these factors increase the revenue for the state and the local municipality where the retail store is located, making us a compelling partner for community development and expansion. Where appropriate, we intend to continue to utilize economic development arrangements with state and local governments to offset some of the construction costs and improve the return on investment of our new retail stores.
Grants – We generally have received grant funding in exchange for commitments made by us to the state or local government providing the funding. The commitments, such as assurance of agreed employment and wage levels at our retail stores or that the retail store will remain open, typically phase out over approximately five to 10 years. If we fail to maintain the commitments during the applicable period, the funds we received may have to be repaid or other adverse consequences may arise, which could affect our cash flows and profitability. As of December 29, 2007, the total amount of grant funding subject to a specific contractual remedy was $13 million.
Economic Development Bonds – Through economic development bonds, the state or local government sells bonds to provide funding for land acquisition, readying the site, building infrastructure and related eligible expenses associated with the construction and equipping of our retail stores. In the past, we have primarily been the sole purchaser of these bonds. The bond proceeds that are received by the governmental entity are then used to fund the construction and equipping of new retail stores and related infrastructure development. While purchasing these bonds involves an initial cash outlay by us in connection with a new store, some or all of these costs can be recaptured through the repayments of the bonds. The payments of principal and interest on the bonds are typically tied to sales, property, or lodging taxes generated from the store and, in some cases, from businesses in the surrounding area, over periods which range between 20 and 30 years. In addition, some of the bonds that we have purchased may be repurchased for par value by the governmental entity prior to the maturity date of the bonds. However, the governmental entity from which we purchase the bonds is not otherwise liable for repayment of principal and interest on the bonds to the extent that the associated taxes are insufficient to pay the bonds.
After purchasing the bonds, we typically record them on our consolidated balance sheet classified as “available for sale” and value them based upon management’s projections of the amount of tax revenue expected to be generated to support principal and interest payments on the bonds. Because of the unique features of each project, there is no independent market data for valuation of these types of bonds. If sufficient tax revenue is not generated by the subject properties, we will not receive scheduled payments and will be unable to realize the full value of the bonds carried on our consolidated balance sheet. As of December 29, 2007, $98 million of economic development bonds were recorded on our consolidated balance sheet.
The negotiation of these economic development arrangements has been important to our retail store expansion in the past, and these arrangements may be an important factor in our retail store expansion strategy in certain locations because they allow us to avoid or recapture a portion of the costs involved with opening a new store.
Securitization of Credit Card Loans
Our Financial Services business historically has funded most of its growth in credit card loans through an asset securitization program. Asset securitization is a practice commonly used by credit card issuers to fund credit card loans at attractive rates. The bank enters into asset securitization transactions, which involve the two-tier sale of a pool of credit card loans from the bank to a wholly owned special purpose entity, and from that wholly owned special purpose entity to a second special purpose entity that is organized as a trust. The trust is administered by
Job TiTle Cabelas 10K Revision 9 seRial DaTe / Time Tuesday, March 11, 2008 /1:07 AM Job numbeR 159962 Type Current page no. 43 opeRaToR PM3
43
<12345678>
an independent trustee. Because the trust qualifies as a “qualified special purpose entity” within the meaning of Statement of Financial Accounting Standards No. 140, Accounting for Transfers and Servicing of Financial Assets and Extinguishments of Liabilities (“FAS 140”), its assets and liabilities are not consolidated in our balance sheet in accordance with FAS 140.
The trust issues to outside investors various forms of certificates and notes each of which has an undivided interest in the assets of the trust. The trust pays to the holders of the certificates and notes a portion of future scheduled cash flows under preset terms and conditions, the receipt of which is dependent upon cash flows generated by the underlying performance of the assets of the trust.
We retain a “transferor’s interest” in the securitized loans, which ranks equal with the investor certificates and notes; an “interest-only strip,” which represent the right to receive excess cash available after repayment of all amounts to the investors; servicing rights; cash reserve accounts in some cases and Class B securities in one of the securitizations. Neither the investors nor the trust have recourse against us beyond the assets of the trust, other than for breaches of certain customary representations, warranties, and covenants and minimum account balance levels which must be maintained to support our retained interests. These representations, warranties, covenants, and the related indemnities do not protect the trust or the outside investors against credit-related losses on the loans.
We record our interest-only strips as an asset at fair value, which is an amount equal to the estimated present value of cash flows to be received by us over the expected outstanding period of the loans. These cash flows essentially represent finance charges and late fees in excess of the amounts paid to certificate and note holders, credit losses, and servicing and administration fees. We use certain valuation assumptions related to the average lives of the loans sold and anticipated credit losses, as well as the appropriate market discount rate, in determining the estimated present value of the interest-only strips. Changes in the average life of the loans sold, discount rate, and credit-loss percentage could adversely impact the actual value of the interest-only strips. Accordingly, actual results could differ materially from the estimates, and changes in circumstances could result in significant future changes to the assumptions currently being used.
Gains on securitization transactions, fair value adjustments, and earnings on our securitizations are included in consolidated revenue in the consolidated statement of income, and the cash reserve accounts, Class B securities, and the interest-only strips are included on our consolidated balance sheet as “retained interests in securitized loans.” All of the bank’s securitization transactions are currently accounted for as sale transactions. As a result, the loans relating to those pools of assets are not reflected on our consolidated balance sheet, other than our transferor’s interest, cash reserve accounts, Class B securities and interest-only strips.
A credit card loan represents a financial asset. Unlike a mortgage or other closed-end loan account, the terms of a credit card account permit a customer to borrow additional amounts and to repay each month an amount the customer chooses, subject to a monthly minimum payment requirement. The credit card account remains open after repayment of the balance and the customer may continue to use it to borrow additional amounts. We reserve the right to change the credit card account terms, including interest rates and fees, in accordance with the terms of the credit card agreement and applicable law. The credit card account is, therefore, separate and distinct from the loan. In a credit card securitization, the credit card account relationships are not sold to the securitization entity. We retain ownership of the credit card account relationship, including the right to change the terms of the credit card account.
We sell our credit card loans in the ordinary course of business through a commercial paper conduit program and longer-term fixed and floating rate securitization transactions. In a conduit securitization, our credit card loans are converted into securities and sold to commercial paper issuers, which pool the securities with those of other issuers. The amount securitized in a conduit structure is allowed to fluctuate within the terms of the facility, which may provide greater flexibility for liquidity needs.
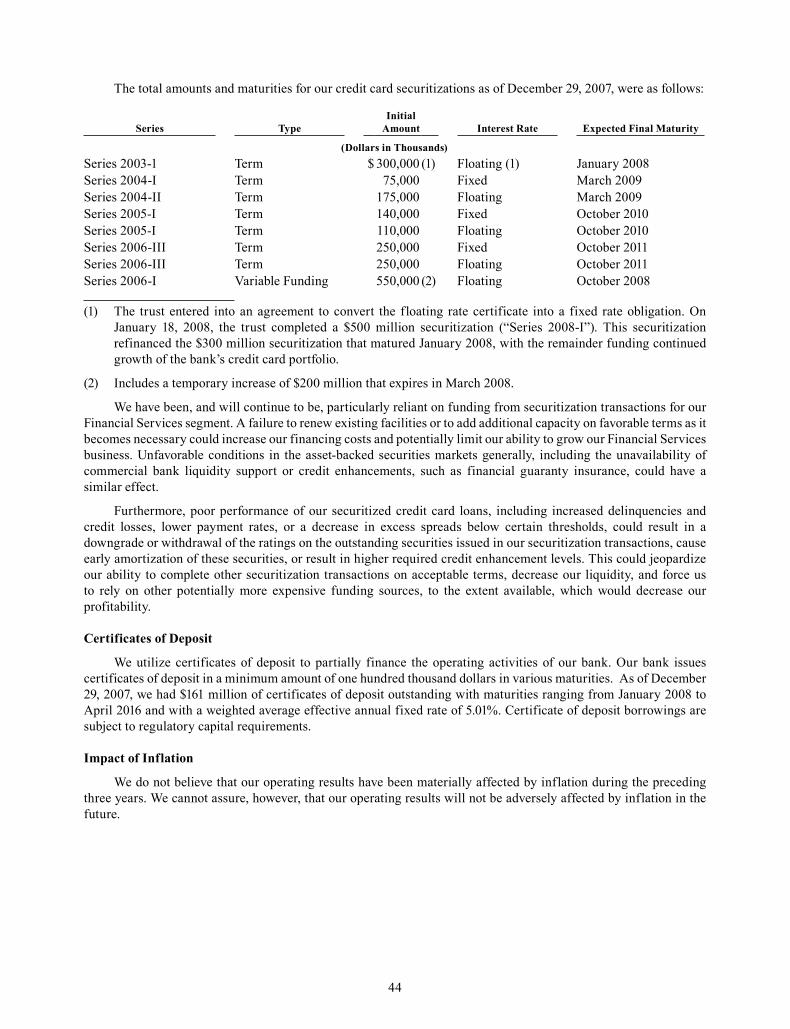
Job TiTle Cabelas 10K Revision 9 seRial DaTe / Time Tuesday, March 11, 2008 /1:07 AM Job numbeR 159962 Type Current page no. 44 opeRaToR PM3
44
<12345678>
The total amounts and maturities for our credit card securitizations as of December 29, 2007, were as follows:
Series TypeInitial
Amount Interest Rate Expected Final Maturity
(Dollars in Thousands)Series 2003-1 Term $ 300,000 (1) Floating (1) January 2008Series 2004-I Term 75,000 Fixed March 2009Series 2004-II Term 175,000 Floating March 2009Series 2005-I Term 140,000 Fixed October 2010Series 2005-I Term 110,000 Floating October 2010Series 2006-III Term 250,000 Fixed October 2011Series 2006-III Term 250,000 Floating October 2011Series 2006-I Variable Funding 550,000 (2) Floating October 2008
(1) The trust entered into an agreement to convert the floating rate certificate into a fixed rate obligation. On January 18, 2008, the trust completed a $500 million securitization (“Series 2008-I”). This securitization refinanced the $300 million securitization that matured January 2008, with the remainder funding continued growth of the bank’s credit card portfolio.
(2) Includes a temporary increase of $200 million that expires in March 2008.
We have been, and will continue to be, particularly reliant on funding from securitization transactions for our Financial Services segment. A failure to renew existing facilities or to add additional capacity on favorable terms as it becomes necessary could increase our financing costs and potentially limit our ability to grow our Financial Services business. Unfavorable conditions in the asset-backed securities markets generally, including the unavailability of commercial bank liquidity support or credit enhancements, such as financial guaranty insurance, could have a similar effect.
Furthermore, poor performance of our securitized credit card loans, including increased delinquencies and credit losses, lower payment rates, or a decrease in excess spreads below certain thresholds, could result in a downgrade or withdrawal of the ratings on the outstanding securities issued in our securitization transactions, cause early amortization of these securities, or result in higher required credit enhancement levels. This could jeopardize our ability to complete other securitization transactions on acceptable terms, decrease our liquidity, and force us to rely on other potentially more expensive funding sources, to the extent available, which would decrease our profitability.
Certificates of Deposit
We utilize certificates of deposit to partially finance the operating activities of our bank. Our bank issues certificates of deposit in a minimum amount of one hundred thousand dollars in various maturities. As of December 29, 2007, we had $161 million of certificates of deposit outstanding with maturities ranging from January 2008 to April 2016 and with a weighted average effective annual fixed rate of 5.01%. Certificate of deposit borrowings are subject to regulatory capital requirements.
Impact of Inflation
We do not believe that our operating results have been materially affected by inflation during the preceding three years. We cannot assure, however, that our operating results will not be adversely affected by inflation in the future.

Job TiTle Cabelas 10K Revision 9 seRial DaTe / Time Tuesday, March 11, 2008 /1:07 AM Job numbeR 159962 Type Current page no. 45 opeRaToR PM3
45
<12345678>
Contractual Obligations and Other Commercial Commitments
The following tables provide summary information concerning our future contractual obligations at the end of 2007.
2008 2009 2010 2011 2012 Thereafter Total
(In Thousands)
Long-term debt (1) . . . . . . . . . . . . . $ 26,547 $ 26,376 $ 7,990 $ 494 $51,096 $ 276,943 $ 389,446Short-term borrowings . . . . . . . . . 100,000 — — — — — 100,000Interest payments (2) . . . . . . . . . . . 19,353 17,994 16,675 16,645 16,615 61,583 148,865Capital lease obligations . . . . . . . . 1,003 1,092 1,000 1,000 1,000 23,500 28,595Operating leases . . . . . . . . . . . . . . 5,126 5,209 4,944 4,586 4,167 78,398 102,430Time deposits by maturity. . . . . . . 49,219 36,886 37,886 22,200 14,200 200 160,591Obligations under new store and
expansion arrangements (3) . . . 114,558 71,574 1,989 864 4,064 — 193,049Purchase obligations (4) . . . . . . . . 461,967 35,111 3,338 684 347 — 501,447Deferred compensation . . . . . . . . . 344 — — — — 5,035 5,379Unrecognized tax benefits. . . . . . . — — — — — 2,000 2,000
Total . . . . . . . . . . . . . . . . . . . . . $ 778,117 $ 194,242 $73,822 $46,473 $91,489 $ 447,659 $1,631,802
(1) Includes $51 million owed under our $325 million credit agreement, and $7 million owed under our $15 million credit agreement for operations in Canada. Excludes amounts owed under capital lease obligations.
(2) These amounts do not include estimated interest payments due under our revolving credit facilities because the amount that will be borrowed under these facilities in future years is uncertain.
(3) At December 29, 2007, obligations for new store and expansion arrangements include approximately $180 million of estimated contractual obligations associated with 1) the completion of our 2007 store expansion obligations, 2) two retail stores scheduled to open in 2008 and two in 2009, and 3) certain obligations under economic development bonds. The table does not include any amounts for contractual obligations associated with retail store locations where we are in the process of certain negotiations.
(4) Our purchase obligations relate primarily to purchases of inventory, shipping, and other goods and services in the ordinary course of business under binding purchase orders or contracts. The amount of purchase obligations shown is based on assumptions regarding the legal enforceability against us of purchase orders or contracts we had outstanding at the end of 2007. Under different assumptions regarding our rights to cancel our purchase orders, or different assumptions regarding the enforceability of the purchase orders under applicable laws, the amount of purchase obligations shown in the preceding table would be less.

Job TiTle Cabelas 10K Revision 9 seRial DaTe / Time Tuesday, March 11, 2008 /1:07 AM Job numbeR 159962 Type Current page no. 46 opeRaToR PM3
46
<12345678>
The following tables provide summary information concerning other commercial commitments at the end of 2007. 2008
(In Thousands)Letters of credit (1) . . . . . . . . . . . . . . . . . . . . . . . . . . . . . . . . . . . . . . . . . . . . . . . . . . . . . . . . . . . . . . . . $46,080Standby letters of credit (1) . . . . . . . . . . . . . . . . . . . . . . . . . . . . . . . . . . . . . . . . . . . . . . . . . . . . . . . . . . 13,516Revolving line of credit for boat and ATV inventory (2) . . . . . . . . . . . . . . . . . . . . . . . . . . . . . . . . . . . 7,988Open account document instructions . . . . . . . . . . . . . . . . . . . . . . . . . . . . . . . . . . . . . . . . . . . . . . . . . . 6,399Bank – federal funds (3) . . . . . . . . . . . . . . . . . . . . . . . . . . . . . . . . . . . . . . . . . . . . . . . . . . . . . . . . . . . . —
Total . . . . . . . . . . . . . . . . . . . . . . . . . . . . . . . . . . . . . . . . . . . . . . . . . . . . . . . . . . . . . . . . . . . . . . . . . $73,983
(1) Our credit agreement allows for maximum borrowings of $325 million including lender letters of credit and standby letters of credit. At December 29, 2007, the total amount available for borrowing under this revolving line of credit, including lender letters of credit and standby letters of credit, was $215 million. Our credit agreement for operations in Canada is for $15 million, with $8 million available for borrowing at December 29, 2007.
(2) The line of credit for boat and ATV financing is limited by the aforementioned $325 million revolving line of credit to $50 million of secured collateral.
(3) The maximum amount that can be borrowed on the federal funds agreements is $85 million.
Off-Balance Sheet Arrangements
Operating Leases – We lease various items of office equipment and buildings. Rent expense for these operating leases is recorded in selling, distribution, and administrative expenses in the consolidated statements of income. Future obligations are shown in the preceding contractual obligations table.
Credit Card Limits – The bank bears off-balance sheet risk in the normal course of its business. One form of this risk is through the bank’s commitment to extend credit to cardholders up to the maximum amount of their credit limits. The aggregate of such potential funding requirements totaled $12 billion above existing balances as of December 29, 2007. These funding obligations are not included on our consolidated balance sheet. While the bank has not experienced, and does not anticipate that it will experience, a significant draw down of unfunded credit lines by its cardholders, a significant draw down would create a cash need at the bank which likely could not be met by our available cash and funding sources. The bank has the right to reduce or cancel these available lines of credit at any time.
Securitizations – All of the bank’s securitization transactions have been accounted for as sales transactions and the credit card loans relating to those pools of assets are not reflected in our consolidated balance sheet.
Critical Accounting Policies and Use of Estimates
Our consolidated financial statements have been prepared in accordance with accounting principles generally accepted in the United States of America which requires management to make estimates and judgments that affect amounts reported in the consolidated financial statements and accompanying notes. Management has discussed the development, selection, and disclosure of critical accounting policies and estimates with the Audit Committee of Cabela’s Board of Directors. While our estimates and assumptions are based on our knowledge of current events and actions we may undertake in the future, actual results may ultimately differ from our estimates and assumptions. Our estimation processes contain uncertainties because they require management to make assumptions and apply judgment to make these estimates. Should actual results be different than our estimates, we could be exposed to gains or losses from differences that are material.
For a summary of our significant accounting policies, please refer to Note 1 of our consolidated financial statements. We believe the accounting policies discussed below are our accounting policies that are the most critical to understanding our consolidated financial statements.
Merchandise Revenue Recognition
Revenue is recognized on our Internet and catalog sales when merchandise is delivered to customers at the point of delivery, with the point of delivery based on our estimate of shipping time from our distribution centers to the customer. We recognize reserves for estimated product returns based upon our historical return experience
Job TiTle Cabelas 10K Revision 9 seRial DaTe / Time Tuesday, March 11, 2008 /1:07 AM Job numbeR 159962 Type Current page no. 47 opeRaToR PM3
47
<12345678>
and expectations. Sales of gift certificates and gift cards (“gift instruments”) are recorded in revenue when the gift instruments are redeemed in exchange for merchandise and as a liability prior to redemption. Had our estimate of merchandise in-transit to customers and our estimate of product returns been different by 10%, our operating income would have been higher or lower by approximately $2 million. We record breakage on gift instruments (gift instruments never presented for merchandise) as revenue when the probability of redemption is remote. Had our estimate of breakage on our recorded liability for gift instruments been different by 1% of the recorded liability at the end of 2007, our operating income would have been higher or lower by approximately $11 million.
Inventories
We estimate provisions for inventory shrinkage, damaged goods returned values, and obsolete and slow-moving items based on historical loss and product performance statistics and future merchandising objectives. While we do not believe there is a reasonable likelihood there will be a material change in the future impacting these estimates, actual losses can be higher or lower based on future merchandising decisions and retail economic trends. Had our estimated inventory reserves been different by 10% at the end of 2007, our cost of sales would have been higher or lower by approximately $1 million.
Catalog Costs
Deferred catalog costs consist of incremental internal and third-party direct costs incurred in the development, production, and circulation of our direct mail catalogs, composed principally of creative design, prepress/production, paper, printing, postal, and mailing costs. Deferred catalog costs are amortized over their expected period of future benefit or twelve months, whichever is shorter, based upon sales forecasts developed using historical sales for similar catalog offerings. Deferred catalog expenses are evaluated for recoverability at each reporting period by comparing the carrying amount associated with each catalog to actual sales data and to projected future cash flows. Had our amortization estimate of deferred catalog costs been different by 10% for 2007, our catalog costs expense would have been higher or lower by approximately $3 million.
Economic Development Bonds
We record economic development bonds based on estimates of the discounted future cash payments to be received under these bonds. These estimates are also the basis for our recognition of deferred grant revenue to be received under the economic development grants as an offset to construction costs which is amortized over the asset lives of the development. These cash flow estimates are dependent on property and/or sales tax collections derived from our operations, and potentially other businesses, some of which may be in the development stage. Had our fair value estimates been lower by 10% as of the end of 2007, the value of economic development bonds reflected in our consolidated financial statements would have been approximately $9 million less with the unrealized loss reflected in comprehensive income (loss) if the loss was deemed to be temporary. Any declines in the fair value of held-to-maturity and available-for-sale economic development bonds below cost that are deemed to be other than temporary are reflected in earnings as realized losses. Gains and losses on sales are recorded on the trade date and determined using the specific identification method.
Asset Securitization
We securitize the majority of our credit card loans, and recognize gains or losses on the sales, as well as record certain retained interests including seller’s transferor’s interest, interest only strips, and cash reserve accounts, which are all subject to significant valuation assumptions. The interests in securitized receivables, including the transferor’s interest, interest only strips, and cash reserve accounts, are reported at fair value or cost in the consolidated balance sheets. Certain estimates used in the determinations of gains on sales, and the related fair values of the asset accounts, are influenced by factors outside of our control, and as a result, such estimates could materially change in the near term. On a quarterly basis, we review and adjust, as appropriate, the assumptions and estimates used in determining the fair value of the related accounts recognized in connection with the our securitization transactions. If these assumptions change, or actual results differ from projected results, asset balances and securitization income would be affected. If we had made different assumptions for the periods covered by the consolidated financial statements, our financial position and results of operations could have differed materially.

Job TiTle Cabelas 10K Revision 9 seRial DaTe / Time Tuesday, March 11, 2008 /1:07 AM Job numbeR 159962 Type Current page no. 48 opeRaToR PM3
48
<12345678>
Certain of these assumptions and estimates will change in the future with changes in market and economic conditions. For example, rates paid to investors, as well as projected interest income, are primarily variable rates which change with market interest rate changes, and loan payment rates could fluctuate based on general economic conditions. Changes in these factors may result in future estimates of the excess spread and payment rates being materially different from the estimates used in 2007. Refer to Note 4 for the sensitivity analysis of the current fair value of retained interests and the impact on fair value from an immediate adverse change of 10% and 20% in the key economic assumptions used to determine fair value.
Recent Accounting Standards and Pronouncements
In September 2006, the FASB issued FAS No. 157, Fair Value Measurements (“FAS 157”). This statement defines fair value, establishes a framework for measuring fair value, and requires expanded disclosures about fair value measurements. FAS 157 is effective for financial statements issued in fiscal years beginning after November 15, 2007, or beginning in 2008 for us. We have evaluated the impact of this statement to us, and we do not believe that the adoption of the provisions of this statement will have a material impact on our financial position or results of operations.
In February 2007, the FASB issued FAS No. 159, The Fair Value Option for Financial Assets and Financial Liabilities – Including an Amendment of FASB Statement No. 115 (“FAS 159”). This statement permits entities to choose to measure many financial instruments and certain other items at fair value. FAS 159 is effective as of the beginning of an entity’s first fiscal year that begins after November 15, 2007. We evaluated the provisions of this statement and did not elect to adopt the fair value option on any financial instruments or other items held by us on December 29, 2007.
In December 2007, the FASB issued FAS No. 141R, Business Combinations (“FAS 141R), which replaces FAS No. 141. FAS 141R establishes principles and requirements for how the acquirer of a business recognizes and measures in its financial statements the identifiable assets acquired and the liabilities assumed. This statement applies prospectively to all business combinations for which the acquisition date is on or after the beginning of the first annual reporting period beginning on or after December 15, 2008. FAS 141R will be applicable to us beginning in 2009.
In December 2007, the FASB issued FAS No. 160, Noncontrolling Interests in Consolidated Financial Statements – an amendment of ARB No. 51 (“FAS 160”). This statement amends ARB No. 51 to establish accounting and reporting standards for the noncontrolling interest in a subsidiary and for the deconsolidation of a subsidiary. FAS 160 is effective for fiscal years beginning on or after December 15, 2008, including interim periods. We do not believe that the adoption of this statement will have a material effect on our financial position or results of operations.
ITEM 7A. QUANTITATIVE AND QUALITATIVE DISCLOSURES ABOUT MARKET RISK
We are exposed to interest rate risk through our bank’s operations and, to a lesser extent, through our merchandising operations. We also are exposed to foreign currency risk through our merchandising operations.
Financial Services Interest Rate Risk
Interest rate risk refers to changes in earnings or the net present value of assets and off-balance sheet positions, less liabilities (termed “economic value of equity”) due to interest rate changes. To the extent that interest income collected on managed credit card loans and interest expense do not respond equally to changes in interest rates, or that rates do not change uniformly, securitization earnings and economic value of equity could be affected. Our net interest income on managed credit card loans is affected primarily by changes in short term interest rate indices such as London Inter-Bank Offered Rate (“LIBOR”) and the prime rate. The variable rate credit card loans are indexed to the prime rate. Securitization certificates and notes are indexed to LIBOR-based rates of interest and are periodically repriced. Certificate of deposits are priced at the current prevailing market rate at the time of issuance. We manage and mitigate our interest rate sensitivity through several techniques, but primarily by modifying the contract terms with our cardholders, including interest rates charged, in response to changing market conditions. Additional techniques we use include managing the maturity, repricing, and distribution of assets and liabilities by issuing fixed rate securitization certificates and notes, and by entering into interest rate swaps to hedge our fixed rate exposure from interest strips. The table below shows the mix of our credit card account balances at the years ended:

Job TiTle Cabelas 10K Revision 9 seRial DaTe / Time Tuesday, March 11, 2008 /1:07 AM Job numbeR 159962 Type Current page no. 49 opeRaToR PM3
49
<12345678>
2007 2006 2005As a percentage of total balances outstanding:Balances carrying interest rate based upon the national prime lending rate . . . . . . . . 61.1% 60.2% 58.0%Balances carrying an interest rate of 9.99% . . . . . . . . . . . . . . . . . . . . . . . . . . . . . . . . . 3.1 3.3 3.0Balances carrying an interest rate of 0.00% . . . . . . . . . . . . . . . . . . . . . . . . . . . . . . . . 0.3 0.1 0.1Balances not carrying interest because their previous
month’s balance was paid in full . . . . . . . . . . . . . . . . . . . . . . . . . . . . . . . . . . . . . . . 35.5 36.4 38.9100.0% 100.0% 100.0%
Charges on the credit cards issued by our Financial Services segment are priced at a margin over the defined national prime lending rate, subject to certain interest rate floors. However, purchases of Cabela’s merchandise, certain other charges, and balance transfer programs are financed at a fixed interest rate of 9.99%. Together, the balances on these credit cards represent 64.2% of total balances outstanding at the end of 2007. No interest is charged if the account is paid in full within 20 days of the billing cycle, which represent 35.5% of total balances outstanding. Credit card balances with a zero percentage interest rate have increased over prior years due to an increase in promotional merchandise offers.
Management has performed an interest rate gap analysis to measure the effects of the timing of the repricing of our interest sensitive assets and liabilities. Based on this analysis, we believe that if there had been an immediate 100 basis point, or 1.0%, increase in the market rates for which our assets and liabilities are indexed during the next twelve months, our projected operating results would not be materially affected. Management also has performed a projected interest rate gap analysis for the same future twelve month period to measure the effects of a change in the spread between the prime interest rate and the LIBOR interest rate. Based on this analysis, we believe that an immediate spread decrease of 50 basis point, or 0.5%, would cause a pre-tax decrease to income of $5 million, and an immediate spread increase of 50 basis points would cause a pre-tax increase to income of $7 million on our Financial Services segment over the next twelve months, which could have a material effect on our operating results.
Merchandising Business Interest Rate Risk
One of our economic development bond agreements, priced at a variable interest rate, had a portion of those bonds retired in June 2006, and the interest rates were renegotiated. The remaining $43 million of these particular economic development bonds were redeemed in full in April 2007.
The interest payable on our line of credit is based on variable interest rates and therefore affected by changes in market interest rates. If interest rates on existing variable rate debt increased 1.0%, our interest expense and results from operations and cash flows would not be materially affected.
Foreign Currency Risk
We purchase a significant amount of inventory from vendors outside of the United States in transactions that are primarily U. S. dollar transactions. A small percentage of our international purchase transactions are in currencies other than the U. S. dollar. Any currency risks related to these transactions are immaterial to us. A decline in the relative value of the U. S. dollar to other foreign currencies could, however, lead to increased merchandise costs. For our retail store in Canada, we intend to fund all transactions in Canadian dollars, and we will utilize our unsecured revolving credit agreement for $14.9 million to fund such operations.

Job TiTle Cabelas 10K Revision 9 seRial DaTe / Time Tuesday, March 11, 2008 /1:07 AM Job numbeR 159962 Type Current page no. 50 opeRaToR PM3
50
<12345678>
ITEM 8. FINANCIAL STATEMENTS AND SUPPLEMENTARY DATA
TABLE OF CONTENTS
Page
REPORT OF INDEPENDENT REGISTERED PUBLIC ACCOUNTING FIRM . . . . . . . . . . . . . . . . . . . . . 51CONSOLIDATED FINANCIAL STATEMENTS:
Consolidated Statements of Income. . . . . . . . . . . . . . . . . . . . . . . . . . . . . . . . . . . . . . . . . . . . . . . . . . . . . . . 52Consolidated Balance Sheets . . . . . . . . . . . . . . . . . . . . . . . . . . . . . . . . . . . . . . . . . . . . . . . . . . . . . . . . . . . . 53Consolidated Statements of Cash Flows . . . . . . . . . . . . . . . . . . . . . . . . . . . . . . . . . . . . . . . . . . . . . . . . . . . 54Consolidated Statements of Stockholders’ Equity . . . . . . . . . . . . . . . . . . . . . . . . . . . . . . . . . . . . . . . . . . . . 55Notes to Consolidated Financial Statements . . . . . . . . . . . . . . . . . . . . . . . . . . . . . . . . . . . . . . . . . . . . . . . . 56

Job TiTle Cabelas 10K Revision 9 seRial DaTe / Time Tuesday, March 11, 2008 /1:07 AM Job numbeR 159962 Type Current page no. 51 opeRaToR PM3
51
<12345678>
REPORT OF INDEPENDENT REGISTERED PUBLIC ACCOUNTING FIRM
To the Board of Directors and Stockholders of Cabela’s Incorporated and Subsidiaries Sidney, Nebraska
We have audited the accompanying consolidated balance sheets of Cabela’s Incorporated and Subsidiaries (the “Company”) as of December 29, 2007 and December 30, 2006, and the related consolidated statements of income, stockholders’ equity, and cash flows for each of the three years in the period ended December 29, 2007. Our audits also included the financial statement schedule listed in the Index at Item 15. These financial statements and financial statement schedule are the responsibility of the Company’s management. Our responsibility is to express an opinion on the financial statements and financial statement schedule based on our audits.
We conducted our audits in accordance with the standards of the Public Company Accounting Oversight Board (United States). Those standards require that we plan and perform the audit to obtain reasonable assurance about whether the financial statements are free of material misstatement. An audit includes examining, on a test basis, evidence supporting the amounts and disclosures in the financial statements. An audit also includes assessing the accounting principles used and significant estimates made by management, as well as evaluating the overall financial statement presentation. We believe that our audits provide a reasonable basis for our opinion.
In our opinion, such consolidated financial statements present fairly, in all material respects, the financial position of Cabela’s Incorporated and Subsidiaries as of December 29, 2007 and December 30, 2006, and the results of their operations and their cash flows for each of the three years in the period ended December 29, 2007, in conformity with accounting principles generally accepted in the United States of America. Also, in our opinion, such financial statement schedule, when considered in relation to the basic consolidated financial statements taken as a whole, presents fairly, in all material respects, the information set forth therein.
We have also audited, in accordance with the standards of the Public Company Accounting Oversight Board (United States), the Company’s internal control over financial reporting as of December 29, 2007, based on the criteria established in Internal Control—Integrated Framework issued by the Committee of Sponsoring Organizations of the Treadway Commission and our report dated February 26, 2008 expressed an unqualified opinion on the Company’s internal control over financial reporting.
/s/ Deloitte & Touche LLPDELOITTE & TOUCHE LLP
Omaha, NebraskaFebruary 26, 2008

Job TiTle Cabelas 10K Revision 9 seRial DaTe / Time Tuesday, March 11, 2008 /1:07 AM Job numbeR 159962 Type Current page no. 52 opeRaToR PM3
52
<12345678>
CABELA’S INCORPORATED AND SUBSIDIARIES CONSOLIDATED STATEMENTS OF INCOME(Dollars in Thousands Except Earnings Per Share)
Fiscal Years2007 2006 2005
Revenue:Merchandise sales . . . . . . . . . . . . . . . . . . . . . . . . . . . . . . . . . . $ 2,173,995 $ 1,908,801 $ 1,664,272Financial services revenue . . . . . . . . . . . . . . . . . . . . . . . . . . . . 159,335 137,423 105,831Other revenue . . . . . . . . . . . . . . . . . . . . . . . . . . . . . . . . . . . . . . 16,269 17,300 29,558
Total revenue . . . . . . . . . . . . . . . . . . . . . . . . . . . . . . . . . . . 2,349,599 2,063,524 1,799,661Cost of revenue:
Merchandise costs . . . . . . . . . . . . . . . . . . . . . . . . . . . . . . . . . . 1,376,691 1,199,851 1,044,028Cost of other revenue . . . . . . . . . . . . . . . . . . . . . . . . . . . . . . . . 1,695 4,548 20,294
Total cost of revenue (exclusive of depreciation and amortization) . . . . . . . . . . . . . . . . . . . . . . . . . . . . . . . . . 1,378,386 1,204,399 1,064,322
Selling, distribution, and administrative expenses . . . . . . . . . . . . 820,121 715,380 620,376Operating income . . . . . . . . . . . . . . . . . . . . . . . . . . . . . . . . . . . . . 151,092 143,745 114,963Interest (expense) income, net . . . . . . . . . . . . . . . . . . . . . . . . . . . . (18,778) (16,126) (10,256)Other non-operating income, net. . . . . . . . . . . . . . . . . . . . . . . . . . 6,913 9,637 10,663Income before provision for income taxes . . . . . . . . . . . . . . . . . . 139,227 137,256 115,370Provision for income taxes . . . . . . . . . . . . . . . . . . . . . . . . . . . . . . 51,348 51,471 42,801Net income. . . . . . . . . . . . . . . . . . . . . . . . . . . . . . . . . . . . . . . . . . . $ 87,879 $ 85,785 $ 72,569
Basic net income per share . . . . . . . . . . . . . . . . . . . . . . . . . . . . . . $ 1.34 $ 1.32 $ 1.12
Diluted net income per share. . . . . . . . . . . . . . . . . . . . . . . . . . . . . $ 1.31 $ 1.29 $ 1.10
Basic weighted average shares outstanding . . . . . . . . . . . . . . . . . 65,744,077 65,221,339 64,668,973
Diluted weighted average shares outstanding . . . . . . . . . . . . . . . . 67,275,531 66,643,856 66,268,374
Refer to notes to consolidated financial statements.

Job TiTle Cabelas 10K Revision 9 seRial DaTe / Time Tuesday, March 11, 2008 /1:07 AM Job numbeR 159962 Type Current page no. 53 opeRaToR PM3
53
<12345678>
CABELA’S INCORPORATED AND SUBSIDIARIES CONSOLIDATED BALANCE SHEETS(Dollars in Thousands Except Par Values)
December 29,2007
December 30,2006
ASSETS
CURRENTCash and cash equivalents . . . . . . . . . . . . . . . . . . . . . . . . . . . . . . . . . . . . . . . . . . . . . . . . . $ 131,182 $ 172,903Accounts receivable, net of allowance for doubtful accounts of $1,851 and $1,932 . . . . 46,857 37,812Credit card loans, net of allowances of $1,197 and $699 . . . . . . . . . . . . . . . . . . . . . . . . . 191,893 152,683Inventories . . . . . . . . . . . . . . . . . . . . . . . . . . . . . . . . . . . . . . . . . . . . . . . . . . . . . . . . . . . . . 608,159 484,414Prepaid expenses and other current assets . . . . . . . . . . . . . . . . . . . . . . . . . . . . . . . . . . . . . 116,297 106,409
Total current assets. . . . . . . . . . . . . . . . . . . . . . . . . . . . . . . . . . . . . . . . . . . . . . . . . . . . 1,094,388 954,221Property and equipment, net . . . . . . . . . . . . . . . . . . . . . . . . . . . . . . . . . . . . . . . . . . . . . . . . . . 904,052 600,065Land held for sale or development . . . . . . . . . . . . . . . . . . . . . . . . . . . . . . . . . . . . . . . . . . . . . 34,802 20,947Retained interests in securitized loans . . . . . . . . . . . . . . . . . . . . . . . . . . . . . . . . . . . . . . . . . . 51,777 39,033Economic development bonds. . . . . . . . . . . . . . . . . . . . . . . . . . . . . . . . . . . . . . . . . . . . . . . . . 98,035 117,360Other assets . . . . . . . . . . . . . . . . . . . . . . . . . . . . . . . . . . . . . . . . . . . . . . . . . . . . . . . . . . . . . . . 29,776 19,604
Total assets . . . . . . . . . . . . . . . . . . . . . . . . . . . . . . . . . . . . . . . . . . . . . . . . . . . . . . . . . . $ 2,212,830 $ 1,751,230
LIABILITIES AND STOCKHOLDERS’ EQUITYCURRENT
Accounts payable, including unpresented checks of $11,340 in 2007 . . . . . . . . . . . . . . . $ 281,391 $ 239,285Gift certificates, and credit card and loyalty rewards programs . . . . . . . . . . . . . . . . . . . . 184,257 144,210Accrued expenses. . . . . . . . . . . . . . . . . . . . . . . . . . . . . . . . . . . . . . . . . . . . . . . . . . . . . . . . 139,510 133,399Time deposits . . . . . . . . . . . . . . . . . . . . . . . . . . . . . . . . . . . . . . . . . . . . . . . . . . . . . . . . . . . 49,219 33,401Short-term borrowings of financial services subsidiary . . . . . . . . . . . . . . . . . . . . . . . . . . 100,000 6,491Current maturities of long-term debt . . . . . . . . . . . . . . . . . . . . . . . . . . . . . . . . . . . . . . . . . 26,785 26,803Income taxes payable. . . . . . . . . . . . . . . . . . . . . . . . . . . . . . . . . . . . . . . . . . . . . . . . . . . . . 34,341 17,267Deferred income taxes . . . . . . . . . . . . . . . . . . . . . . . . . . . . . . . . . . . . . . . . . . . . . . . . . . . . 15,601 17,978
Total current liabilities . . . . . . . . . . . . . . . . . . . . . . . . . . . . . . . . . . . . . . . . . . . . . . . . . 831,104 618,834Long-term debt, less current maturities . . . . . . . . . . . . . . . . . . . . . . . . . . . . . . . . . . . . . . . . . 376,600 284,579Long-term time deposits . . . . . . . . . . . . . . . . . . . . . . . . . . . . . . . . . . . . . . . . . . . . . . . . . . . . 111,372 68,795Deferred income taxes. . . . . . . . . . . . . . . . . . . . . . . . . . . . . . . . . . . . . . . . . . . . . . . . . . . 31,113 30,440Other long-term liabilities . . . . . . . . . . . . . . . . . . . . . . . . . . . . . . . . . . . . . . . . . . . . . . . . 34,082 14,724COMMITMENTS AND CONTINGENCIESSTOCKHOLDERS’ EQUITY
Preferred stock, $0.01 par value; Authorized – 10,000,000 shares; Issued – none . . . . . . — —Common stock, $0.01 par value:
Class A Voting, Authorized – 245,000,000 shares; Issued – 65,888,384 and 59,556,431 shares. . . . . . . . . . . . . . . . . . . . . . . . . . . . . . . . . . . . . . . . . . . . . . . . . . 659 596
Class B Non-voting, Authorized – 245,000,000 shares; Issued – none and 5,807,305 shares . . . . . . . . . . . . . . . . . . . . . . . . . . . . . . . . . . . . . . . . . . . . . . . . . . — 58
Additional paid-in capital . . . . . . . . . . . . . . . . . . . . . . . . . . . . . . . . . . . . . . . . . . . . . . . . . . . . 257,351 247,741Retained earnings . . . . . . . . . . . . . . . . . . . . . . . . . . . . . . . . . . . . . . . . . . . . . . . . . . . . . . . . . . 571,272 485,148Accumulated other comprehensive income (loss), net . . . . . . . . . . . . . . . . . . . . . . . . . . . . . . (723) 315
Total stockholders’ equity . . . . . . . . . . . . . . . . . . . . . . . . . . . . . . . . . . . . . . . . . . . . . . 828,559 733,858
Total liabilities and stockholders’ equity . . . . . . . . . . . . . . . . . . . . . . . . . . . . . . . . . . . $ 2,212,830 $ 1,751,230
Refer to notes to consolidated financial statements.

Job TiTle Cabelas 10K Revision 9 seRial DaTe / Time Tuesday, March 11, 2008 /1:07 AM Job numbeR 159962 Type Current page no. 54 opeRaToR PM3
54
<12345678>
CABELA’S INCORPORATED AND SUBSIDIARIESCONSOLIDATED STATEMENTS OF CASH FLOWS
(In Thousands)Fiscal Years
2007 2006 2005
CASH FLOWS FROM OPERATING ACTIVITIES:Net income . . . . . . . . . . . . . . . . . . . . . . . . . . . . . . . . . . . . . . . . . . . . . . . . . . . . . . . . . . . . . . . . $ 87,879 $ 85,785 $ 72,569Adjustments to reconcile net income to net cash flows from operating activities:
Depreciation and amortization. . . . . . . . . . . . . . . . . . . . . . . . . . . . . . . . . . . . . . . . . . . . . . 59,863 45,559 34,912Stock based compensation. . . . . . . . . . . . . . . . . . . . . . . . . . . . . . . . . . . . . . . . . . . . . . . . . 4,944 3,615 941Deferred income taxes . . . . . . . . . . . . . . . . . . . . . . . . . . . . . . . . . . . . . . . . . . . . . . . . . . . . (1,077) 24,030 11,308Other, net . . . . . . . . . . . . . . . . . . . . . . . . . . . . . . . . . . . . . . . . . . . . . . . . . . . . . . . . . . . . . . (167) 1,188 (354)
Change in operating assets and liabilities, net of business acquisition:Accounts receivable. . . . . . . . . . . . . . . . . . . . . . . . . . . . . . . . . . . . . . . . . . . . . . . . . . . . . . (8,425) (11,506) (3,803)Originations of credit card loans held for sale. . . . . . . . . . . . . . . . . . . . . . . . . . . . . . . . . . (378,186) (325,382) (250,671)Proceeds from securitizations of credit card loans . . . . . . . . . . . . . . . . . . . . . . . . . . . . . . 336,000 267,000 237,000Retained interests in securitized loans. . . . . . . . . . . . . . . . . . . . . . . . . . . . . . . . . . . . . . . . (11,244) (12,818) (6,492)Inventories . . . . . . . . . . . . . . . . . . . . . . . . . . . . . . . . . . . . . . . . . . . . . . . . . . . . . . . . . . . . . (119,051) (87,779) (83,633)Prepaid expenses and other current assets . . . . . . . . . . . . . . . . . . . . . . . . . . . . . . . . . . . . . (10,964) (14,974) (22,697)Land held for sale or development . . . . . . . . . . . . . . . . . . . . . . . . . . . . . . . . . . . . . . . . . . (10,379) 602 5,554Accounts payable and accrued expenses . . . . . . . . . . . . . . . . . . . . . . . . . . . . . . . . . . . . . . 9,756 73,936 63,243Gift certificates, and credit card and loyalty rewards programs . . . . . . . . . . . . . . . . . . . . 39,789 23,090 23,878Other long-term liabilities . . . . . . . . . . . . . . . . . . . . . . . . . . . . . . . . . . . . . . . . . . . . . . . . . 15,926 (3,269) (2,329)Income taxes payable. . . . . . . . . . . . . . . . . . . . . . . . . . . . . . . . . . . . . . . . . . . . . . . . . . . . . 17,164 (14,120) (6,862)
Net cash derived from operating activities . . . . . . . . . . . . . . . . . . . . . . . . . . . . . . . . . 31,828 54,957 72,564CASH FLOWS FROM INVESTING ACTIVITIES:
Property and equipment additions . . . . . . . . . . . . . . . . . . . . . . . . . . . . . . . . . . . . . . . . . . . . . . (335,644) (179,238) (194,659)Proceeds from dispositions of property and equipment . . . . . . . . . . . . . . . . . . . . . . . . . . . . . . 3,931 — —Purchases of economic development bonds . . . . . . . . . . . . . . . . . . . . . . . . . . . . . . . . . . . . . . . (36,223) (23,397) (65,077)Proceeds from retirements and maturities of economic development bonds . . . . . . . . . . . . . . 45,427 54,065 66,188Purchases of short-term investments . . . . . . . . . . . . . . . . . . . . . . . . . . . . . . . . . . . . . . . . . . . . — (131,225) (21,000)Proceeds from sales or maturities of short-term investments . . . . . . . . . . . . . . . . . . . . . . . . . . — 131,225 145,250Change in credit card loans receivable, net . . . . . . . . . . . . . . . . . . . . . . . . . . . . . . . . . . . . . . . 1,228 (5,308) (7,479)Acquisition, net of cash acquired . . . . . . . . . . . . . . . . . . . . . . . . . . . . . . . . . . . . . . . . . . . . . . . (9,277) — —Other investing changes, net . . . . . . . . . . . . . . . . . . . . . . . . . . . . . . . . . . . . . . . . . . . . . . . . . . . (935) 9,182 (3,840)
Net cash used in investing activities . . . . . . . . . . . . . . . . . . . . . . . . . . . . . . . . . . . . . . (331,493) (144,696) (80,617)CASH FLOWS FROM FINANCING ACTIVITIES:
Change in unpresented checks net of bank balance . . . . . . . . . . . . . . . . . . . . . . . . . . . . . . . . . 11,340 (21,652) (13,001)Change in time deposits, net . . . . . . . . . . . . . . . . . . . . . . . . . . . . . . . . . . . . . . . . . . . . . . . . . . . 58,395 (7,292) 8,829Changes in short-term borrowings of financial services subsidiary, net . . . . . . . . . . . . . . . . . 93,509 6,491 —Borrowings on revolving credit facilities and inventory financing . . . . . . . . . . . . . . . . . . . . . 510,939 391,589 554,137Repayments on revolving credit facilities and inventory financing . . . . . . . . . . . . . . . . . . . . . (454,757) (383,203) (553,116)Issuances of long-term debt . . . . . . . . . . . . . . . . . . . . . . . . . . . . . . . . . . . . . . . . . . . . . . . . . . . 60,800 215,000 —Payments on long-term debt . . . . . . . . . . . . . . . . . . . . . . . . . . . . . . . . . . . . . . . . . . . . . . . . . . . (27,008) (29,093) (28,326)Exercise of employee stock options . . . . . . . . . . . . . . . . . . . . . . . . . . . . . . . . . . . . . . . . . . . . . 3,978 3,832 2,519Other financing changes, net . . . . . . . . . . . . . . . . . . . . . . . . . . . . . . . . . . . . . . . . . . . . . . . . . . 748 47 —
Net cash provided by (used in) financing activities . . . . . . . . . . . . . . . . . . . . . . . . . . 257,944 175,719 (28,958)
Net change in cash and cash equivalents . . . . . . . . . . . . . . . . . . . . . . . . . . . . . . . . . . . . . . . . . . . . (41,721) 85,980 (37,011)
Cash and cash equivalents, at beginning of year . . . . . . . . . . . . . . . . . . . . . . . . . . . . . . . . . . . . . . 172,903 86,923 123,934Cash and cash equivalents, at end of year . . . . . . . . . . . . . . . . . . . . . . . . . . . . . . . . . . . . . . . . . . . $ 131,182 $ 172,903 $ 86,923
Refer to notes to consolidated financial statements.
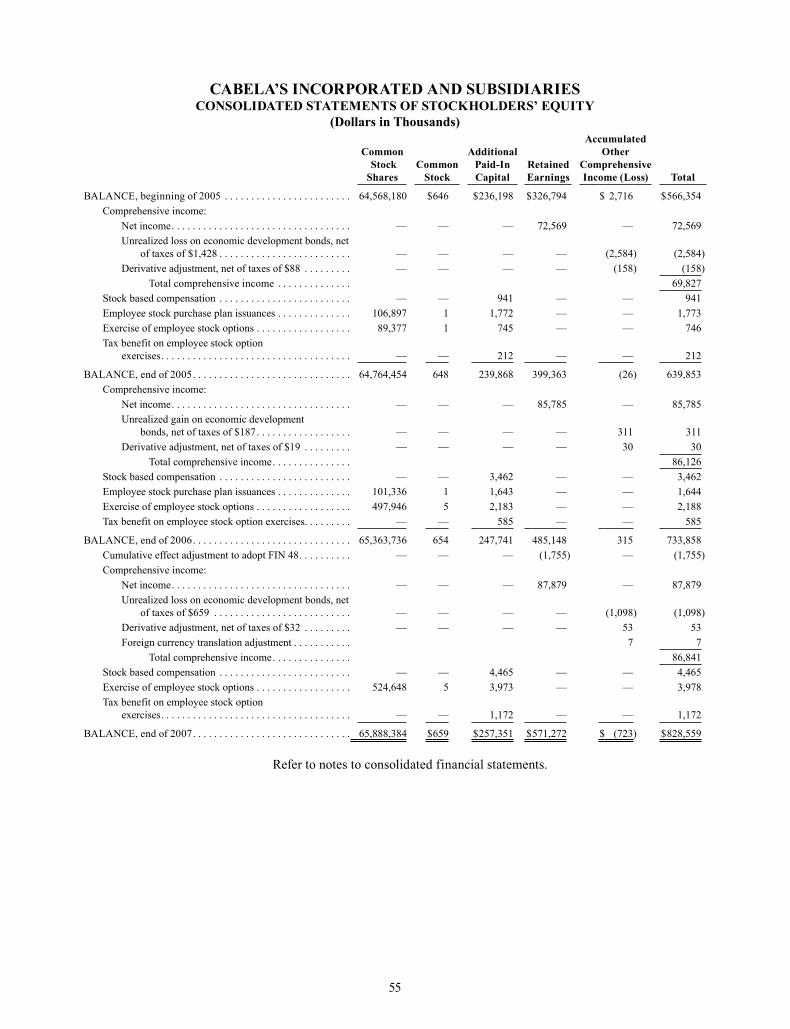
Job TiTle Cabelas 10K Revision 9 seRial DaTe / Time Tuesday, March 11, 2008 /1:07 AM Job numbeR 159962 Type Current page no. 55 opeRaToR PM3
55
<12345678>
CABELA’S INCORPORATED AND SUBSIDIARIES CONSOLIDATED STATEMENTS OF STOCKHOLDERS’ EQUITY
(Dollars in Thousands)
Common StockShares
CommonStock
AdditionalPaid-InCapital
RetainedEarnings
AccumulatedOther
ComprehensiveIncome (Loss) Total
BALANCE, beginning of 2005 . . . . . . . . . . . . . . . . . . . . . . . . 64,568,180 $646 $236,198 $326,794 $ 2,716 $566,354Comprehensive income:
Net income. . . . . . . . . . . . . . . . . . . . . . . . . . . . . . . . . . — — — 72,569 — 72,569Unrealized loss on economic development bonds, net
of taxes of $1,428 . . . . . . . . . . . . . . . . . . . . . . . . . — — — — (2,584) (2,584)Derivative adjustment, net of taxes of $88 . . . . . . . . . — — — — (158) (158)
Total comprehensive income . . . . . . . . . . . . . . 69,827Stock based compensation . . . . . . . . . . . . . . . . . . . . . . . . . — — 941 — — 941Employee stock purchase plan issuances . . . . . . . . . . . . . . 106,897 1 1,772 — — 1,773Exercise of employee stock options . . . . . . . . . . . . . . . . . . 89,377 1 745 — — 746Tax benefit on employee stock option
exercises. . . . . . . . . . . . . . . . . . . . . . . . . . . . . . . . . . . . — — 212 — — 212
BALANCE, end of 2005. . . . . . . . . . . . . . . . . . . . . . . . . . . . . . 64,764,454 648 239,868 399,363 (26) 639,853Comprehensive income:
Net income. . . . . . . . . . . . . . . . . . . . . . . . . . . . . . . . . . — — — 85,785 — 85,785Unrealized gain on economic development
bonds, net of taxes of $187. . . . . . . . . . . . . . . . . . — — — — 311 311Derivative adjustment, net of taxes of $19 . . . . . . . . . — — — — 30 30
Total comprehensive income. . . . . . . . . . . . . . . 86,126Stock based compensation . . . . . . . . . . . . . . . . . . . . . . . . . — — 3,462 — — 3,462Employee stock purchase plan issuances . . . . . . . . . . . . . . 101,336 1 1,643 — — 1,644Exercise of employee stock options . . . . . . . . . . . . . . . . . . 497,946 5 2,183 — — 2,188Tax benefit on employee stock option exercises. . . . . . . . . — — 585 — — 585
BALANCE, end of 2006. . . . . . . . . . . . . . . . . . . . . . . . . . . . . . 65,363,736 654 247,741 485,148 315 733,858Cumulative effect adjustment to adopt FIN 48. . . . . . . . . . — — — (1,755) — (1,755)Comprehensive income:
Net income. . . . . . . . . . . . . . . . . . . . . . . . . . . . . . . . . . — — — 87,879 — 87,879Unrealized loss on economic development bonds, net
of taxes of $659 . . . . . . . . . . . . . . . . . . . . . . . . . . — — — — (1,098) (1,098)Derivative adjustment, net of taxes of $32 . . . . . . . . . — — — — 53 53Foreign currency translation adjustment . . . . . . . . . . . 7 7
Total comprehensive income. . . . . . . . . . . . . . . 86,841Stock based compensation . . . . . . . . . . . . . . . . . . . . . . . . . — — 4,465 — — 4,465Exercise of employee stock options . . . . . . . . . . . . . . . . . . 524,648 5 3,973 — — 3,978Tax benefit on employee stock option
exercises. . . . . . . . . . . . . . . . . . . . . . . . . . . . . . . . . . . . — — 1,172 — — 1,172
BALANCE, end of 2007. . . . . . . . . . . . . . . . . . . . . . . . . . . . . . 65,888,384 $659 $257,351 $571,272 $ (723) $828,559
Refer to notes to consolidated financial statements.
Job TiTle Cabelas 10K Revision 9 seRial DaTe / Time Tuesday, March 11, 2008 /1:07 AM Job numbeR 159962 Type Current page no. 56 opeRaToR PM3
56
<12345678>
CABELA’S INCORPORATED AND SUBSIDIARIESNOTES TO CONSOLIDATED FINANCIAL STATEMENTS(Dollars in Thousands Except Share and Per Share Amounts)
1. NATURE OF BUSINESS AND SUMMARY OF SIGNIFICANT ACCOUNTING POLICIES
Nature of Business – Cabela’s Incorporated is a retailer of hunting, fishing, and outdoor gear, offering products through retail stores, the Internet, and regular and special catalog mailings. Cabela’s operates 27 retail stores, 26 located in 19 states and one located in Winnipeg, Manitoba. World’s Foremost Bank (“WFB” or “bank”), a wholly-owned subsidiary of Cabela’s, is a limited purpose bank formed under the Competitive Equality Banking Act of 1987. The lending activities of WFB are limited to credit card lending and its deposit issuance is limited to time deposits of at least one hundred thousand dollars.
Principles of Consolidation – The consolidated financial statements include the accounts of Cabela’s Incorporated and its wholly-owned subsidiaries (“Cabela’s,” “Company,” “we,” “our,” or “us”). All material intercompany accounts and transactions have been eliminated in consolidation.
Reporting Year – Our fiscal year ends on the Saturday nearest to December 31. Unless otherwise stated, the fiscal years referred to in the notes to these consolidated financial statements are the 52 weeks ended December 29, 2007 (“2007” or “year ended 2007”), the 52 weeks ended December 30, 2006 (“2006” or “year ended 2006”), and the 52 weeks ended December 31, 2005 (“2005” or “year ended 2005”). The year-end of WFB is December 31.
Use of Estimates – The preparation of financial statements in conformity with accounting principles generally accepted in the United States of America requires management to make estimates and assumptions that affect the reported amounts of assets and liabilities and disclosure of contingent assets and liabilities at the date of the financial statements and the reported amounts of revenue and expenses during the reporting period. Actual results could differ from those estimates.
Reclassifications – We reclassified an accrued interest receivable totaling $5,864 associated with our economic development bonds from accounts receivable to other current assets in the 2006 consolidated balance sheet to conform to the current year presentation. The corresponding line items in the consolidated statements of cash flows were also reclassified and there was no change in the total of net cash used in operating activities for 2006. Total current assets were not affected by this reclassification and there was no impact on cash flows or covenant provisions.
Revenue Recognition – Revenue is recognized for retail store sales at the time of the sale in the store and for Direct sales when the merchandise is delivered to the customer. We record a reserve for estimated product returns based on our historical returns experience. Shipping fees charged to customers are included in net revenue and shipping costs are included in cost of revenue. Revenue from the sale of gift certificates and gift cards (“gift instruments”) is recognized in revenue when the gift instruments are redeemed for merchandise or services. We record gift instrument breakage as revenue when the probability of redemption is remote. Our gift instrument liability at the end of 2007 and 2006 was $113,302 and $86,974, respectively. WFB recognizes gains on sales of credit card loans as these loans are securitized and sold. Interchange income is earned when a charge is made to a customer’s account.
Credit Card Interest and Fees – Financial Services revenue includes credit card interest and fees relating to late payments, over limit, returned check, and cash advance transactions. These fees are assessed according to the terms of the related cardholder agreements and recognized as revenue when charged to the cardholders’ accounts. Interest and fees are accrued in accordance with the terms of the applicable cardholder agreement on credit card loans until the date of charge-off. Charge-offs are typically recorded when accounts are, at a minimum, 130 days contractually delinquent. Accounts relating to cardholder bankruptcies, cardholder deaths, and fraudulent transactions are charged off earlier. Prior to 2007, our policy was to charge-off accounts on the 24th day of the month after an account became 115 days contractually past due, except in the case of cardholder bankruptcies, cardholder deaths, and fraudulent transactions, which were charged off earlier. Interest income is accrued on accounts that carry a balance from the statement date through the end of the month.

Job TiTle Cabelas 10K Revision 9 seRial DaTe / Time Tuesday, March 11, 2008 /1:07 AM Job numbeR 159962 Type Current page no. 57 opeRaToR PM3
57
<12345678>
CABELA’S INCORPORATED AND SUBSIDIARIESNOTES TO CONSOLIDATED FINANCIAL STATEMENTS(Dollars in Thousands Except Share and Per Share Amounts)
Cost of Revenue and Selling, Distribution, and Administrative Expenses – Our cost of revenue primarily consists of merchandise acquisition costs, including freight-in costs, as well as shipping costs. Our selling, distribution, and administrative expenses consist of the costs associated with selling, marketing, warehousing, retail store replenishment, and other operating expense activities. All depreciation and amortization expense is associated with selling, distribution, and administrative activities, and accordingly, is included in this same category on the consolidated statement of operations.
Cash and Cash Equivalents – Cash equivalents include commercial paper and other investments that are readily convertible into cash and have original maturities of three months or less, and credit card and debit card receivables from other banks, which settle within one to four business days. Receivables from other banks totaled $9,711 and $10,050 at the end of 2007 and 2006, respectively. Unpresented checks, net of available cash bank balances, are classified as current liabilities. Cash and cash equivalents of WFB were $123,163 and $52,830 at the end of 2007 and 2006, respectively. Due to regulatory restrictions on our bank, we are restricted from using cash held by WFB for non-banking operations.
Securitization of Credit Card Loans – WFB sells the majority of its credit card loans to a securitization trust and recognizes related gains or losses as a component of securitization income in Financial Services revenue. Credit card loans classified as held for sale, which includes WFB’s transferor’s interest in securitized credit card loans, are carried at the lower of cost or market. Net unrealized losses, if any, are recognized in income through a valuation allowance. Although WFB continues to service the underlying credit card accounts and maintains the customer relationships, these securitization transactions are treated as sales and the securitized loans are not included in our consolidated balance sheet. Gains or losses are recognized at the time of sale, and depend, in part, on the carrying amount assigned to the credit card loans sold, which is allocated between the assets sold and retained interest based on their relative fair values at date of transfer. For 2007, 2006 and 2005, WFB recognized gains on sales totaling $22,740, $17,410 and $17,020, respectively. A servicing asset or liability is not recognized as WFB receives adequate compensation relative to current market servicing rates.
WFB retains certain interests in securitized loans, including a transferor’s interest, interest-only strips, servicing rights, and in some cases, cash reserve accounts, and Class B securities. For interest-only strips, the Company estimates related fair values based on the present value of future expected cash flows using assumptions for credit losses, payment rates, and discount rates commensurate with the risks involved. WFB retains the rights to remaining cash flows (including interchange fees) after the other costs of the trust are paid. However, future expected cash flows for valuation of the interest-only strips do not include interchange income since interchange income is earned only when a charge is made to a customer’s account. Interchange income on securitized credit card loans is reflected as a component of securitization income included in Financial Services revenue.
WFB is required to maintain a cash reserve account under certain securitization programs. In addition, WFB owns Class B securities from one of the securitizations. The fair value of the cash reserve accounts are estimated by discounting future cash flows using a rate reflecting the risks commensurate with similar types of instruments. For the Class B securities, fair value approximates the book value of the underlying loans. Interest-only strips are recorded at fair value with fair value changes recorded to income.
Inventories – Inventories are stated at the lower of cost or market. Effective December 31, 2006, we changed our method for valuing inventories from the last-in, first-out (“LIFO”) method to the first-in, first-out (“FIFO”) method. The effect of this change was not material to our consolidated financial statements for 2007, 2006, or 2005. Refer to Note 2 for additional information on this change.
All inventories are finished goods. The shrink reserve, estimated based on cycle counts and physical inventories, was $6,875 and $3,193 at the end of 2007 and 2006, respectively. The reserves for returns of damaged goods, obsolescence, and slow-moving items, estimated based upon historical experience, inventory aging, and specific identification, were $6,805 and $5,862 at the end of 2007 and 2006, respectively.
Job TiTle Cabelas 10K Revision 9 seRial DaTe / Time Tuesday, March 11, 2008 /1:07 AM Job numbeR 159962 Type Current page no. 58 opeRaToR PM3
58
<12345678>
CABELA’S INCORPORATED AND SUBSIDIARIESNOTES TO CONSOLIDATED FINANCIAL STATEMENTS(Dollars in Thousands Except Share and Per Share Amounts)
Vendor Allowances – Vendor allowances include price allowances, volume rebates, store opening costs reimbursements, and advertising reimbursements received from vendors under vendor contracts. Vendor merchandise allowances are recognized as a reduction of the costs of merchandise as sold. Vendor reimbursements of costs are recorded as a reduction to expense in the period the related cost is incurred based on actual costs incurred. Any cost reimbursements exceeding expenses incurred are recognized as a reduction of the cost of merchandise sold. Volume allowances may be estimated based on historical purchases and estimates of projected purchases.
Deferred Catalog Costs and Advertising – Advertising production costs are expensed as the advertising occurs except for catalog costs which are amortized over the expected period of benefit estimated at 3 to 12 months after mailing. Unamortized catalog costs totaled $32,569 and $34,869 at the end of 2007 and 2006, respectively. Advertising expense, including catalog costs amortization, and website marketing paid search fees, was $207,373, $191,533 and $170,024 for 2007, 2006 and 2005, respectively. Advertising vendor reimbursements netted in advertising expense above totaled $7,058, $4,546 and $4,783 for 2007, 2006 and 2005, respectively.
Store Pre-opening Expenses – Non-capital costs associated with the opening of new stores is expensed as incurred.
Property and Equipment – Property and equipment are stated at cost. Depreciation and amortization are provided over the estimated useful lives of the assets, including assets held under capital leases, on a straight-line basis. Leasehold improvements are amortized over the lease term or, if shorter, the useful lives of the improvements. Assets held under capital lease agreements are amortized using the straight-line method over the shorter of the estimated useful lives of the assets or the lease term. The costs of major improvements that extend the useful life of an asset are capitalized. Long-lived assets are reviewed for impairment whenever events or changes in circumstances indicate that the carrying amount of an asset may not be recoverable. Capitalized interest on projects during the construction period totaled $4,069 and $355, for 2007 and 2006, respectively. Costs related to internally developed software are capitalized and amortized on a straight-line basis over their estimated useful lives.
Intangible Assets – Intangible assets, recorded in other assets, include deferred financing costs, non-compete agreements, and goodwill. At the end of 2007 and 2006, intangible assets totaled $8,123 and $3,172, net of accumulated amortization of $4,509 and $3,847, respectively. Intangible assets, excluding goodwill, are amortized over three to 17 years. Amortization expense for these intangible assets for the next five years is estimated to approximate $744 (2008), $743 (2009), $739 (2010), $606 (2011) and $392 (2012).
On September 27, 2007, we purchased the net assets, and assumed certain liabilities, of an outdoors specialty retailer located in Winnipeg, Manitoba, totaling $11,162. The purchase price has been allocated to tangible and identifiable assets acquired and liabilities assumed based on their estimated fair values at the date of acquisition. The excess of the purchase price over the fair value of the net assets acquired was recorded as goodwill of $3,505. We recorded goodwill related to this acquisition based on expected future economic benefits as this acquisition will serve as our platform for expansion into Canada. Results of operations for this acquisition for the last three months of 2007 are included in our consolidated income statement.
Land Held for Sale or Development – Proceeds from the sale of land from development activities are recognized in other revenue and the corresponding costs of land sold are recognized in other costs of revenue.
Government Economic Assistance – When we construct a new retail store or retail development, we may receive economic assistance from local governments to fund a portion or all of our associated capital costs. This assistance typically comes in the form of cash and/or land grants and has been typically funded by the local government through proceeds from the sale of economic development bonds. We have historically purchased the majority of the bonds associated with our developments. Cash grants are made available to fund land, retail store construction, and/or development infrastructure costs. Economic development bonds are typically repaid through sales and/or property taxes generated by the retail store and/or within a designated development area. Cash and land
Job TiTle Cabelas 10K Revision 9 seRial DaTe / Time Tuesday, March 11, 2008 /1:07 AM Job numbeR 159962 Type Current page no. 59 opeRaToR PM3
59
<12345678>
CABELA’S INCORPORATED AND SUBSIDIARIESNOTES TO CONSOLIDATED FINANCIAL STATEMENTS(Dollars in Thousands Except Share and Per Share Amounts)
grants are recognized as deferred grant income as a reduction to the costs, or recognized fair value in the case of land grants, of the associated property and equipment. Deferred grant income is amortized to earnings, as a reduction of depreciation expense, over the average estimated useful life of the associated assets.
Deferred grant income estimates, and their associated present value, are updated quarterly. These estimates are determined when estimation of the fair value of associated economic development bonds are performed if there are related bond investments. When it is determined that recorded amounts will not be recovered through projected discounted cash flows, an adjustment is made to reduce deferred grant income, and accumulated amortization on the deferred grant at that point in time is reversed as an increase to depreciation expense.
We may agree to guarantee deficiencies in tax collections which fund the repayment of economic development bonds. We guaranteed an economic development bond totaling $3,695 and $3,960 at the end of years 2007 and 2006, respectively. As of December 29, 2007, cash flow projections reflect that any payments required by us under these guarantees would not have a material impact on our financial position, results of operations, or liquidity.
Land grants typically include land associated with the retail store and may include other land for sale and further development. Land grants are recognized at the fair value of the land on date of grant. Deferred grant income on land grants is recognized as a reduction to depreciation expense over the estimated life of the related assets of the developments. In 2007, we received land under land grants with a fair value of $19,000.
Certain grants contain covenants we are required to comply with regarding minimum employment levels, maintaining retail stores in certain locations, and maintaining office facilities in certain locations. For these grants we recognize grant revenue as the milestones associated with the grant are met. For 2007 and 2006, we were in compliance with all material requirements under these grants.
Economic Development Bonds – Economic development bonds (“bonds”) issued by state and local municipalities that management has the intent and ability to hold to maturity are classified as held-to-maturity and recorded at amortized cost. Other bonds are classified as available-for-sale and valued at their fair value. Fair values of bonds are estimated using discounted cash flow projections based on available market interest rates and management estimates including the estimated amounts and timing of expected future tax payments to be received by the municipalities under development zones. These fair values do not reflect any premium or discount that could result from offering these bonds for sale or through early redemption, or any related income tax impact. Declines in the fair value of held-to-maturity and available-for-sale economic development bonds below cost that are deemed to be other than temporary are reflected in earnings.
Credit Card and Loyalty Rewards Programs – Cabela’s CLUB Visa cardholders receive Cabela’s points based on the dollar amounts of transactions through WFB issued credit cards which may be redeemed for Cabela’s products and services. Points may also be awarded for special promotions for the acquisition and retention of accounts. The dollar amount of related points are accrued as earned by the cardholder and recorded as a reduction in Financial Services revenue. In addition to the WFB issued credit cards, customers receive points for purchases at Cabela’s from various loyalty programs. The dollar amount of unredeemed credit card points and loyalty points was $70,955 and $57,159 at the end of 2007 and 2006, respectively. The total cost incurred of all credit card rewards and loyalty programs was $109,619, $90,096, and $72,992 for 2007, 2006 and 2005, respectively.
Income Taxes – The Company files consolidated federal and state income tax returns with its wholly-owned subsidiaries. The consolidated group follows a policy of requiring each entity to provide for income taxes in an amount equal to the income taxes that would have been incurred if each were filing separately. We recognize deferred income tax assets and liabilities for the expected future tax consequences of temporary differences between the financial statement carrying amounts and the tax bases of our assets and liabilities. We establish valuation allowances if we believe it is more likely than not that some or all of our deferred tax assets will not be realized.

Job TiTle Cabelas 10K Revision 9 seRial DaTe / Time Tuesday, March 11, 2008 /1:07 AM Job numbeR 159962 Type Current page no. 60 opeRaToR PM3
60
<12345678>
CABELA’S INCORPORATED AND SUBSIDIARIESNOTES TO CONSOLIDATED FINANCIAL STATEMENTS(Dollars in Thousands Except Share and Per Share Amounts)
Stock-Based Compensation – We adopted the provisions of FAS No. 123 (revised 2004), Share-Based Payment (“FAS 123R”), on January 1, 2006, using the modified prospective transition method. Prior to January 1, 2006, we accounted for stock-based payments under the provisions of Accounting Principles Board (“APB”) Opinion No. 25, Accounting for Stock Issued to Employees, and related interpretations. Effective January 1, 2006, we also adopted FASB Staff Interpretation FAS 123(R)-3, Transition Election Related to Accounting for the Tax Effect of Share-Based Payment Awards, relating to transitional guidance on determining and reporting excess tax benefits from stock options exercised.
Under FAS 123R, we recognize compensation expense as follows. For equity awards issued after January 1, 2006, compensation expense is estimated based on grant date fair value on a straight-line basis over the requisite service period. For awards granted prior to, but not yet vested as of January 1, 2006, we estimated compensation expense based on the grant date fair value estimated under the provisions of APB Opinion No. 25. Costs associated with all awards are included in compensation expense as a component of selling, distribution, and administrative expenses.
Financial Instruments and Credit Risk Concentrations – Financial instruments which may subject us to concentrations of credit risk are primarily cash, investments, and accounts receivable. We invest primarily in money market accounts, tax-free municipal bonds, or commercial paper, with short-term maturities, limiting the amount of credit exposure to any one entity. Concentrations of credit risk on accounts receivable are limited due to the nature of our receivables.
Fair Value of Financial Instruments – The carrying amount of cash and cash equivalents, receivables, credit card loans held for sale, retained interests in asset securitizations, accounts payable, short-term borrowings, notes payable to banks, and accrued expenses approximate fair value because of the short maturity of these instruments. The fair values of our long-term debt instruments are based on the amount of future cash flows associated with each instrument discounted using current borrowing rates for similar debt instruments of comparable maturity. Time deposits are pooled in homogeneous groups, and the future cash flows of those groups are discounted using current market rates offered for similar products for purposes of estimating fair value.
Derivatives – We use derivatives for the purpose of hedging our exposure to changes in interest rates and foreign currency exchange rates. The fair value of each derivative is recognized in the consolidated balance sheets within current assets or current liabilities. For derivatives designated as a hedge and used to hedge an anticipated transaction, changes in the fair value of the derivatives are deferred in the consolidated balance sheets within accumulated other comprehensive income (loss) to the extent the hedge is effective in mitigating the exposure to the related anticipated transaction. Any ineffectiveness associated with the hedge is recognized immediately in earnings. Amounts deferred within accumulated other comprehensive income (loss) are recognized in the consolidated income statements in the same period during which the hedged transaction affects earnings. For derivatives that do not qualify for hedge accounting, changes in fair values are recognized immediately in earnings.
Comprehensive Income – Comprehensive income consists of net income, derivative adjustments, unrealized gains and losses on available-for-sale economic development bonds, and foreign currency translation adjustments, net of related income taxes.
Currency Translation – Assets and liabilities of our Canadian operations are translated into U. S. dollars at currency exchange rates in effect at the end of a reporting period. Gains and losses from translation into U. S. dollars are included in accumulated other comprehensive income (loss) in our consolidated balance sheets. Revenues and expenses are translated at average monthly currency exchange rates.
Earnings Per Share – Basic earnings per share (“EPS”) is computed by dividing net income by the weighted average number of shares of common stock outstanding during the period. Diluted EPS is computed by dividing net income by the sum of the weighted average number of shares outstanding plus all additional common shares that would have been outstanding if potentially dilutive common share equivalents had been issued. Options exercised prior to vesting for 2006 and 2005 have not been considered in the basic EPS calculation, but are considered in the computation of diluted EPS.

Job TiTle Cabelas 10K Revision 9 seRial DaTe / Time Tuesday, March 11, 2008 /1:07 AM Job numbeR 159962 Type Current page no. 61 opeRaToR PM3
61
<12345678>
CABELA’S INCORPORATED AND SUBSIDIARIESNOTES TO CONSOLIDATED FINANCIAL STATEMENTS(Dollars in Thousands Except Share and Per Share Amounts)
2. CHANGE IN ACCOUNTING PRINCIPLES
Inventories:
Effective the beginning of 2007, we changed our method for valuing inventories from the LIFO method to the FIFO method. Due to merchandise unit cost increases for new and higher-priced product lines we offer, and because of the market volatility for certain materials in the manufacture of other product lines (primarily firearms and ammunition), we believe this change was preferable as the FIFO method better reflects our inventory at current costs. Further, our adoption of the FIFO method enhances the comparability of our consolidated financial statements by changing to the predominant method utilized in our industry, and reflects the inventory of all of our operations on the same accounting method. The effect of the change did not have a material impact to our consolidated financial statements for the years ended 2007, 2006 and 2005. Because the effect of the change on all periods is not material, no adjustments have been made to our consolidated financial statements to reflect a retrospective application.
At December 30, 2006, $18,697 was included in the current portion of deferred income taxes payable in our consolidated balance sheet related to the book-tax difference resulting from the LIFO method used for income tax purposes. Although the use of the LIFO method under income tax regulations requires conformity of methods for financial reporting purposes, it does allow selection of alternative methods of calculation. Our LIFO calculation for income tax purposes utilizes a simplified LIFO approach which results in a book-tax difference. The change to the FIFO method in the first quarter of 2007 increased the current portion of income taxes payable by $4,674 and reduced the current deferred income tax liability by $4,674. We will incur a cash outlay totaling $18,697 over the next four years since we elected in our 2007 federal income tax return to change our method of accounting for inventory from LIFO to FIFO for income tax purposes.
Uncertainty in Income Taxes:
On December 31, 2006, we adopted the provisions of FASB Interpretation No. 48, Accounting for Uncertainty in Income Taxes – an Interpretation of FASB Statement No. 109 (“FIN 48”). FIN 48 prescribes a recognition threshold and measurement attribute for the financial statement recognition and measurement of a tax position taken or expected to be taken in a tax return. The recognition threshold requires that we determine whether it is more likely than not that a tax position will be sustained upon examination, and then the position is measured at the largest amount of the benefit that is greater than 50 percent likely of being realized upon ultimate settlement. Unrecognized tax benefits are tax benefits claimed on our tax returns that do not meet these recognition and measurement standards.
As a result of adopting FIN 48 we recognized additional liabilities for unrecognized tax benefits of $8,569. Of this amount, $966 after-tax was recorded as a one-time decrease to our beginning retained earnings. The remaining amount was previously accrued under FAS 5, Accounting for Contingencies, or FAS 109, Accounting for Income Taxes. In addition, we recorded $1,196 before-tax, or $789 after-tax, of accrued interest on the estimated unrecognized tax benefits as a one-time decrease to our beginning retained earnings. The cumulative effect of adopting FIN 48 totaled $1,755 as a decrease to our beginning retained earnings.

Job TiTle Cabelas 10K Revision 9 seRial DaTe / Time Tuesday, March 11, 2008 /1:07 AM Job numbeR 159962 Type Current page no. 62 opeRaToR PM3
62
<12345678>
CABELA’S INCORPORATED AND SUBSIDIARIESNOTES TO CONSOLIDATED FINANCIAL STATEMENTS(Dollars in Thousands Except Share and Per Share Amounts)
3. ACCOUNTING PRONOUNCEMENTS
In September 2006, the FASB issued FAS No. 157, Fair Value Measurements. This statement defines fair value, establishes a framework for measuring fair value, and requires expanded disclosures about fair value measurements. FAS 157 is effective for financial statements issued in fiscal years beginning after November 15, 2007, or beginning in 2008 for us. We have evaluated the impact of this statement to Cabela’s, and we do not believe that the adoption of the provisions of this statement will have a material impact on our financial position or results of operations.
In February 2007, the FASB issued FAS No. 159, The Fair Value Option for Financial Assets and Financial Liabilities — Including an Amendment of FASB Statement No. 115. This statement permits entities to choose to measure many financial instruments and certain other items at fair value. FAS 159 is effective as of the beginning of an entity’s first fiscal year that begins after November 15, 2007. We evaluated the provisions of this statement and did not elect to adopt the fair value option on any financial instruments or other items held by the Company on December 29, 2007.
In December 2007, the FASB issued FAS No. 141R, Business Combinations, which replaces FAS No. 141. FAS 141R establishes principles and requirements for how the acquirer of a business recognizes and measures in its financial statements the identifiable assets acquired and the liabilities assumed. This statement applies prospectively to all business combinations for which the acquisition date is on or after the beginning of the first annual reporting period beginning on or after December 15, 2008. FAS 141R will be applicable to us beginning in 2009.
In December 2007, the FASB issued FAS No. 160, Noncontrolling Interests in Consolidated Financial Statements – an amendment of ARB No. 51. This statement amends ARB No. 51 to establish accounting and reporting standards for the noncontrolling interest in a subsidiary and for the deconsolidation of a subsidiary. FAS 160 is effective for fiscal years beginning on or after December 15, 2008, including interim periods. We do not believe that the adoption of this statement will have a material effect on our financial position or results of operations.
4. CREDIT CARD LOANS AND SECURITIZATION
WFB has established a trust for the purpose of routinely securitizing and selling credit card loans. WFB maintains responsibility for servicing the securitized loans and receives a servicing fee based on the average outstanding loans in the trust. Servicing fees are paid monthly and reflected as a component of Financial Services revenue. The trust issues commercial paper, long-term bonds, or long-term notes. Variable bonds and notes are priced at a benchmark rate plus a spread. Fixed rate notes are priced on a five-year swap rate plus a spread. WFB retains rights to future cash flows arising after investors have received the return to which they are entitled and after certain administrative costs of operating the trust. This portion of the retained interests is known as interest-only strips and is subordinate to investor’s interests. The value of the interest-only strips is subject to credit, payment rate, and interest rate risks on the loans sold. The investors have no recourse to the assets of WFB for failure of debtors to pay. However, as contractually required, WFB establishes certain cash accounts, known as cash reserve accounts, to be used as collateral for the benefit of investors.

Job TiTle Cabelas 10K Revision 9 seRial DaTe / Time Tuesday, March 11, 2008 /1:07 AM Job numbeR 159962 Type Current page no. 63 opeRaToR PM3
63
<12345678>
CABELA’S INCORPORATED AND SUBSIDIARIESNOTES TO CONSOLIDATED FINANCIAL STATEMENTS(Dollars in Thousands Except Share and Per Share Amounts)
Credit card loans consisted of the following for the years ended:
2007 2006
Credit card loans held for sale (including transferor’s interest of $166,700 and $122,824) . . . . . . . . . . . . . . . . . . . . . . . . . . . . . . . . . . . . . . . . . . . . . . . . . . . . . $ 178,258 $ 136,072
Credit card loans receivable, net of allowances of $1,197 and $699 . . . . . . . . . . . 13,635 16,611Total . . . . . . . . . . . . . . . . . . . . . . . . . . . . . . . . . . . . . . . . . . . . . . . . . . . . . . . . . $ 191,893 $ 152,683
Composition of credit card loans at year end:Loans serviced . . . . . . . . . . . . . . . . . . . . . . . . . . . . . . . . . . . . . . . . . . . . . . . . . $ 2,058,235 $ 1,674,064Loans securitized and sold to outside investors . . . . . . . . . . . . . . . . . . . . . . . . (1,850,000) (1,514,000)Securitized loans with securities owned by WFB which are classified as
retained interests . . . . . . . . . . . . . . . . . . . . . . . . . . . . . . . . . . . . . . . . . . . . . (12,650) (4,922)195,585 155,142
Less adjustments to market value and allowance for loan losses . . . . . . . . . . (3,692) (2,459)Total (including transferor’s interest of $166,700 and $122,824) . . . . . . . . . . . . . $ 191,893 $ 152,683
Transferor’s interest restricted for repayment of secured borrowing at year end . . . . . . . . . . . . . . . . . . . . . . . . . . . . . . . . . . . . . . . . . . . . . . . . . . . . . . . . . . $ 133,333 $ —
Delinquent loans in the managed credit card loan portfolio at year end:30-89 days . . . . . . . . . . . . . . . . . . . . . . . . . . . . . . . . . . . . . . . . . . . . . . . . . . . . 14,319 9,58990 days or more and still accruing . . . . . . . . . . . . . . . . . . . . . . . . . . . . . . . . . . 5,835 3,095
Total net charge-offs on the managed credit card loans portfolio for the year ended . . . . . . . . . . . . . . . . . . . . . . . . . . . . . . . . . . . . . . . 33,898 25,199
Annual average credit card loans:Managed credit card loans . . . . . . . . . . . . . . . . . . . . . . . . . . . . . . . . . . . . . . . . 1,690,543 1,357,671Securitized credit card loans including transferor’s interest . . . . . . . . . . . . . . 1,656,078 1,325,149
Total net charge-offs as a percentage of annual average managed credit card loans . . . . . . . . . . . . . . . . . . . . . . . . . . . . . . . . . . . . . . . . 2.01% 1.86%
Retained Interests:
Retained interests in securitized loans consisted of the following at the years ended:
2007 2006
Cash reserve account . . . . . . . . . . . . . . . . . . . . . . . . . . . . . . . . . . . . . . . . . . . . . . . . . . . . . . . . . $11,965 $ 9,638 Interest-only strips . . . . . . . . . . . . . . . . . . . . . . . . . . . . . . . . . . . . . . . . . . . . . . . . . . . . . . . . . . . 27,162 24,473 Class B securities . . . . . . . . . . . . . . . . . . . . . . . . . . . . . . . . . . . . . . . . . . . . . . . . . . . . . . . . . . . . 12,650 4,922
$51,777 $39,033

Job TiTle Cabelas 10K Revision 9 seRial DaTe / Time Tuesday, March 11, 2008 /1:07 AM Job numbeR 159962 Type Current page no. 64 opeRaToR PM3
64
<12345678>
CABELA’S INCORPORATED AND SUBSIDIARIESNOTES TO CONSOLIDATED FINANCIAL STATEMENTS(Dollars in Thousands Except Share and Per Share Amounts)
Key Assumptions:
The following are the key economic assumptions used to estimate the fair value of the interest-only strips resulting from the securitization of credit card loans for the years ended:
2007 2006
Weighted average payment rates . . . . . . . . . . . . . . . . . . . . . . . . . . . . . . . . . . 29.88 to 33.16% 33.05 to 35.27%Weighted average life in years . . . . . . . . . . . . . . . . . . . . . . . . . . . . . . . . . . . . 0.542 to 0.708 0.542 to 0.625
Weighted average expected credit losses . . . . . . . . . . . . . . . . . . . . . . . . . . . . 2.57 to 3.06% 2.59 to 2.96%
Servicing fee . . . . . . . . . . . . . . . . . . . . . . . . . . . . . . . . . . . . . . . . . . . . . . . . . . 1.25 to 2.00% 1.25 to 2.00%Discount rate . . . . . . . . . . . . . . . . . . . . . . . . . . . . . . . . . . . . . . . . . . . . . . . . . . 10.12 to 16.60% 10.37 to 11.39%Weighted average interest rate paid to investors . . . . . . . . . . . . . . . . . . . . . . 5.47 to 5.64% 5.46 to 5.62%
Sensitivity Analysis:
The key economic assumptions used and the sensitivity of the current fair value of retained interests of $51,777 at December 29, 2007, to immediate 10% and 20% adverse changes in those assumptions are as follows:
AssumptionImpact on Fair Value ofan Adverse Change of
10% 20%
Weighted average payment rates . . . . . . . . . . . . . . . . . . . . . . . . . . . . 29.88% $ (1,329) $ (2,562)Weighted average expected credit losses . . . . . . . . . . . . . . . . . . . . . . 3.06 (1,362) (2,678)Discount rate . . . . . . . . . . . . . . . . . . . . . . . . . . . . . . . . . . . . . . . . . . . . 15.60 and 16.60 (257) (516)Weighted average interest paid to investors . . . . . . . . . . . . . . . . . . . . 5.57 (1,320) (2,640)
The sensitivity analysis is hypothetical and is as of a specific point in time. As a result, these scenarios should be used with caution. As the table indicates, changes in fair value based on 10% variation in assumptions generally cannot be extrapolated because the relationship of the change in assumption to the change in fair value may not be linear. Also, in this table, the effect of a variation in a particular assumption on the fair values of the retained interests are calculated without changing any other assumption; in reality, changes in one factor may result in changes in another, which might magnify or counteract the sensitivities.

Job TiTle Cabelas 10K Revision 9 seRial DaTe / Time Tuesday, March 11, 2008 /1:07 AM Job numbeR 159962 Type Current page no. 65 opeRaToR PM3
65
<12345678>
CABELA’S INCORPORATED AND SUBSIDIARIESNOTES TO CONSOLIDATED FINANCIAL STATEMENTS(Dollars in Thousands Except Share and Per Share Amounts)
Cash Flows from Securitizations:
The following table summarizes the cash flows received from the securitization trust during the years ended:
2007 2006 2005
Proceeds from new securitizations, net . . . . . . . . . . . . . . . . . . . . . . . . . . $ 336,000 $ 267,000 $ 237,000Collections used by the trust to purchase new balances in
revolving credit card securitizations . . . . . . . . . . . . . . . . . . . . . . . . . . 8,040,206 6,727,177 5,578,746Servicing fees received . . . . . . . . . . . . . . . . . . . . . . . . . . . . . . . . . . . . . . . 30,077 24,352 19,468Other cash flows received by the transferor other than
servicing fees . . . . . . . . . . . . . . . . . . . . . . . . . . . . . . . . . . . . . . . . . . . 188,633 157,259 124,396
Certain restrictions exist related to securitization transactions that protect certificate and note holders against declining performance of the credit card loans. In the event performance declines outside stated parameters and waivers are not granted by certificate holders, note holders and/or credit enhancement providers, a rapid amortization of the certificates and notes could potentially occur. The credit card loans were performing within established guidelines during 2007, 2006 and 2005.
5. PROPERTY AND EQUIPMENT
Property and equipment included the following at the years ended:
Depreciable Lifein Years 2007 2006
Land and improvements . . . . . . . . . . . . . . . . . . . . . . . . . . . . . . . . . . . Up to 20 $ 172,582 $ 91,561Buildings and improvements . . . . . . . . . . . . . . . . . . . . . . . . . . . . . . . 7 to 40 470,067 303,600Furniture, fixtures and equipment . . . . . . . . . . . . . . . . . . . . . . . . . . . 3 to 15 378,050 281,521Assets held under capital lease . . . . . . . . . . . . . . . . . . . . . . . . . . . . . . 30 14,562 14,363Property and equipment . . . . . . . . . . . . . . . . . . . . . . . . . . . . . . . . . . . 1,035,261 691,045Less accumulated depreciation and amortization . . . . . . . . . . . . . . . (246,178) (190,912)
789,083 500,133Construction in progress . . . . . . . . . . . . . . . . . . . . . . . . . . . . . . . . . . 114,969 99,932
$ 904,052 $ 600,065

Job TiTle Cabelas 10K Revision 9 seRial DaTe / Time Tuesday, March 11, 2008 /1:07 AM Job numbeR 159962 Type Current page no. 66 opeRaToR PM3
66
<12345678>
CABELA’S INCORPORATED AND SUBSIDIARIESNOTES TO CONSOLIDATED FINANCIAL STATEMENTS(Dollars in Thousands Except Share and Per Share Amounts)
6. ECONOMIC DEVELOPMENT BONDS
Economic development bonds consisted of the following at the years ended:
2007
Cost
GrossUnrealized
Gains
GrossUnrealized
LossesFair
ValueClassified as:
Available-for-sale . . . . . . . . . . . . . . . . . . . . . . . . . . $91,427 $ 9 $(1,299) $90,137Held to maturity . . . . . . . . . . . . . . . . . . . . . . . . . . . 7,898 — — 7,898
$99,325 $ 9 $(1,299) $98,035
2006
Cost
GrossUnrealized
Gains
GrossUnrealized
LossesFair
ValueClassified as:
Available-for-sale . . . . . . . . . . . . . . . . . . . . . . . . $105,431 $467 $— $105,898Held to maturity . . . . . . . . . . . . . . . . . . . . . . . . . 11,462 — — 11,462
$116,893 $467 $— $117,360
The carrying value and fair value of economic development bonds by contractual maturity at the end of 2007 was as follows:
Available-for-Sale Held to Maturity
CostFair
ValueCost and
Fair Value2008 . . . . . . . . . . . . . . . . . . . . . . . . . . . . . . . . . . . . . . $ 847 $ 759 $ 7022009 . . . . . . . . . . . . . . . . . . . . . . . . . . . . . . . . . . . . . . 895 755 7032010 . . . . . . . . . . . . . . . . . . . . . . . . . . . . . . . . . . . . . . . 1,183 917 5902011 . . . . . . . . . . . . . . . . . . . . . . . . . . . . . . . . . . . . . . . 1,897 1,079 6372012 . . . . . . . . . . . . . . . . . . . . . . . . . . . . . . . . . . . . . . . 2,531 2,086 686Thereafter . . . . . . . . . . . . . . . . . . . . . . . . . . . . . . . . . . 84,074 84,541 4,580
$91,427 $90,137 $7,898
At the end of 2007, the fair value of two economic development bonds were determined to be below carrying value, with the decline in fair value deemed to be other than temporary. These fair value adjustments totaling $6,733 reduced the carrying value of the economic development bond portfolio.
Interest earned on the economic development bonds totaled $5,680, $9,574 and $10,549 for 2007, 2006 and 2005, respectively. There were no realized gains or losses in 2007, 2006 or 2005.

Job TiTle Cabelas 10K Revision 9 seRial DaTe / Time Tuesday, March 11, 2008 /1:07 AM Job numbeR 159962 Type Current page no. 67 opeRaToR PM3
67
<12345678>
CABELA’S INCORPORATED AND SUBSIDIARIESNOTES TO CONSOLIDATED FINANCIAL STATEMENTS(Dollars in Thousands Except Share and Per Share Amounts)
7. PREPAID EXPENSES AND OTHER ASSETS
Prepaid expenses and other assets (current and long-term) consisted of the following at the years ended:
2007 2006Prepaid expenses and other current assets:
Deferred catalog costs . . . . . . . . . . . . . . . . . . . . . . . . . . . . . . . . . . . . . . . . . . . . . . . . . $ 32,569 $ 34,892Interest and notes receivable . . . . . . . . . . . . . . . . . . . . . . . . . . . . . . . . . . . . . . . . . . . . 5,520 10,092Financial Services - Visa interchange funding . . . . . . . . . . . . . . . . . . . . . . . . . . . . . . . 31,067 25,524Financial Services accrued interest and other receivables . . . . . . . . . . . . . . . . . . . . . 34,575 28,254Other . . . . . . . . . . . . . . . . . . . . . . . . . . . . . . . . . . . . . . . . . . . . . . . . . . . . . . . . . . . . . . 12,566 7,647
$ 116,297 $106,409Other assets:
Goodwill. . . . . . . . . . . . . . . . . . . . . . . . . . . . . . . . . . . . . . . . . . . . . . . . . . . . . . . . . . . . $ 4,474 $ 969Intangible assets, net . . . . . . . . . . . . . . . . . . . . . . . . . . . . . . . . . . . . . . . . . . . . . . . . . . 3,649 2,203Financial Services deferred financing and new account costs . . . . . . . . . . . . . . . . . . . 6,942 7,537Long-term notes and other receivables . . . . . . . . . . . . . . . . . . . . . . . . . . . . . . . . . . . . 12,382 8,452Other (2007 balance includes mortgage-backed securities of $1,630,
at cost, which approximates fair value) . . . . . . . . . . . . . . . . . . . . . . . . . . . . . . . . . 2,329 443$ 29,776 $ 19,604
8. ACCRUED EXPENSES
Accrued expenses consisted of the following at the years ended:
2007 2006Accrued employee compensation and benefits . . . . . . . . . . . . . . . . . . . . . . . . . . . . . . . . . $ 61,519 $ 61,277Accrued property, sales, and other taxes . . . . . . . . . . . . . . . . . . . . . . . . . . . . . . . . . . . . . . 17,926 12,223Deferred revenue and accrued sales returns . . . . . . . . . . . . . . . . . . . . . . . . . . . . . . . . . . . 27,710 33,482Accrued interest . . . . . . . . . . . . . . . . . . . . . . . . . . . . . . . . . . . . . . . . . . . . . . . . . . . . . . . . . 6,305 6,025Accrued credit card fees . . . . . . . . . . . . . . . . . . . . . . . . . . . . . . . . . . . . . . . . . . . . . . . . . . 6,306 5,502Other . . . . . . . . . . . . . . . . . . . . . . . . . . . . . . . . . . . . . . . . . . . . . . . . . . . . . . . . . . . . . . . . . 19,744 14,890
$ 139,510 $133,399
9. OTHER LONG-TERM LIABILITIES
Other long-term liabilities consisted of the following at the years ended:
2007 2006Deferred lease tenant allowances . . . . . . . . . . . . . . . . . . . . . . . . . . . . . . . . . . . . . . . . . . . . $ 17,018 $ —Deferred grant income . . . . . . . . . . . . . . . . . . . . . . . . . . . . . . . . . . . . . . . . . . . . . . . . . . . . 9,685 9,550Deferred compensation . . . . . . . . . . . . . . . . . . . . . . . . . . . . . . . . . . . . . . . . . . . . . . . . . . . . 5,379 5,174FIN 48 unrecognized tax benefits . . . . . . . . . . . . . . . . . . . . . . . . . . . . . . . . . . . . . . . . . . . 2,000 —
$ 34,082 $ 14,724

Job TiTle Cabelas 10K Revision 9 seRial DaTe / Time Tuesday, March 11, 2008 /1:07 AM Job numbeR 159962 Type Current page no. 68 opeRaToR PM3
68
<12345678>
CABELA’S INCORPORATED AND SUBSIDIARIESNOTES TO CONSOLIDATED FINANCIAL STATEMENTS(Dollars in Thousands Except Share and Per Share Amounts)
10. TIME DEPOSITS
WFB accepts time deposits only in amounts of at least one hundred thousand dollars. All time deposits are interest bearing. The aggregate amount of time deposits by maturity at the end of 2007 was as follows:
2008 . . . . . . . . . . . . . . . . . . . . . . . . . . . . . . . . . . . . . . $ 49,2192009 . . . . . . . . . . . . . . . . . . . . . . . . . . . . . . . . . . . . . . 36,8862010 . . . . . . . . . . . . . . . . . . . . . . . . . . . . . . . . . . . . . . . 37,8862011 . . . . . . . . . . . . . . . . . . . . . . . . . . . . . . . . . . . . . . . 22,2002012 . . . . . . . . . . . . . . . . . . . . . . . . . . . . . . . . . . . . . . . 14,200Thereafter . . . . . . . . . . . . . . . . . . . . . . . . . . . . . . . . . . 200
160,591Less current maturities . . . . . . . . . . . . . . . . . . . . . . . . (49,219)Deposits classified as non-current liabilities . . . . . . . $111,372
For purposes of estimating fair value, time deposits are pooled in homogeneous groups and the future cash flows of those groups are discounted using current market rates offered for similar products. At the end of 2007 and 2006, the carrying amounts of the bank’s time deposits were $160,591 and $102,196, respectively, with estimated fair values of $162,939 and $102,739, respectively.
11. REVOLVING CREDIT FACILITIES
We have a credit agreement that provides for a $325,000 unsecured revolving credit facility. Effective August 15, 2007, we entered into an agreement to amend this credit facility - changing the expiration date of the revolving commitment to June 30, 2012, from June 30, 2010; increasing the limit of letters of credit to $200,000 from $150,000; and amending certain covenants. The credit facility may be increased to $450,000, and permits the issuance of up to $200,000 in letters of credit and standby letters of credit, which are applied against the overall credit limit available under the credit facility.
At December 29, 2007, the principal amount outstanding under this credit agreement totaled $50,576 and the average principal balance outstanding during 2007 was $66,840. Letters of credit and standby letters of credit totaling $59,596 were outstanding at December 29, 2007.
The weighted average interest rate for borrowings on the line of credit was 5.67% during 2007. During the term of the facility, we are required to pay a quarterly facility fee, which ranges from 0.10% to 0.25% of the average daily unused principal balance on the line of credit. Interest on advances on this credit facility is determined at the greater of 1) the lead lender’s prime rate, 2) the average rate on the federal funds rate in effect for the day plus one-half of one percent, or 3) the Eurodollar rate of interest plus a margin, as defined.
The credit agreement requires that Cabela’s comply with certain financial and other customary covenants, including 1) a fixed charge coverage ratio (as defined) of no less than 1.50 to 1.00 as of the last day of any quarter; 2) a cash flow leverage ratio (as defined) of no more than 3.00 to 1.00 as of the last day of any quarter; and 3) a minimum tangible net worth standard (as defined).
The credit agreement includes a dividend provision limiting the amount that Cabela’s could pay to stockholders, which at December 29, 2007, was not in excess of $108,933. The agreement also has a provision permitting acceleration by the lenders in the event there is a change in control, as defined. In addition, the credit agreement contains cross default provisions to other outstanding debt. In the event that we fail to comply with these covenants, a default is triggered. In the event of default, all outstanding letters of credit and all principal and outstanding interest would immediately become due and payable. We were in compliance with all financial debt covenants at December 29, 2007.

Job TiTle Cabelas 10K Revision 9 seRial DaTe / Time Tuesday, March 11, 2008 /1:07 AM Job numbeR 159962 Type Current page no. 69 opeRaToR PM3
69
<12345678>
CABELA’S INCORPORATED AND SUBSIDIARIESNOTES TO CONSOLIDATED FINANCIAL STATEMENTS(Dollars in Thousands Except Share and Per Share Amounts)
On September 19, 2007, we entered into an unsecured revolving credit agreement for $14,933 ($15,000 Canadian) in conjunction with the acquisition of the net assets of an outdoors specialty retailer located in Winnipeg, Manitoba. Interest is variable, computed at rates as defined in the agreement, plus a margin, and payable monthly. At December 29, 2007, the interest rate was 5.60%.
The $325,000 credit agreement was previously amended eliminating certain limitations regarding pay downs of revolving loans advanced; therefore, advances made pursuant to this credit agreement are classified as long-term debt. The credit agreement for our Canada operations is also classified as long-term debt.
We also have financing agreements that allow certain boat and all-terrain vehicle merchandise vendors to give us extended payment terms. The vendors are responsible for all interest payments, with certain exceptions, for the financing period and the financing company holds a security interest in the specific inventory held Cabela’s. We record this merchandise in inventory. Our revolving credit facility limits this security interest to $50,000. The extended payment terms to the vendor do not exceed one year. The outstanding liability, included in accounts payable, was $7,988 and $9,829 at the end of 2007 and 2006, respectively.
12. SHORT-TERM BORROWINGS OF FINANCIAL SERVICES SUBSIDIARY
At December 29, 2007, the principal amount of $100,000 is outstanding under a variable funding facility credit agreement entered into by WFB. This facility is secured by a participation interest in the transferor’s interest of the Cabela’s Master Credit Card Trust. The facility limit was entered into on June 21, 2007, for $50,000, and was increased to $100,000 on November 29, 2007. The facility carries a liquidity fee of 0.15% on the outstanding commitment and a program fee of 0.10% on the principal amount outstanding. The interest rate on the facility is based upon the interest rate for commercial paper issued by the lender and was 5.11% at the end of 2007. The weighted average interest rate was 5.31% during 2007. The credit agreement expires on June 20, 2008.
WFB has an unsecured federal funds purchase agreement with a financial institution. The maximum amount that can be borrowed is $25,000. All federal funds transactions are on a daily origination and return basis. Daily interest charges are determined upon mutual agreement by the parties. There were no amounts outstanding at the end of 2007 and 2006.
WFB also has an unsecured federal funds purchase agreement with another financial institution. The maximum amount that can be borrowed is $60,000. The interest rate for the purchase agreement is based on the current federal funds rate. There were no amounts outstanding as of December 29, 2007, and at December 30, 2006, there was $6,491 outstanding at 5.75%.
13. LONG-TERM DEBT AND CAPITAL LEASES
Long-term debt and capital leases consisted of the following at the years ended:
2007 2006Unsecured revolving credit facility expiring June 30, 2012 . . . . . . . . . . . . . . . . . . . . . . . $ 50,576 $ —Unsecured senior notes due 2008-2009 with interest at 4.95% . . . . . . . . . . . . . . . . . . . . 50,000 75,000Unsecured notes payable due 2016 with interest at 5.99% . . . . . . . . . . . . . . . . . . . . . . . . 215,000 215,000Senior unsecured notes payable due 2017 with interest at 6.08% . . . . . . . . . . . . . . . . . . 60,000 —Unsecured revolving credit facility for Canadian
operations expiring June 30, 2010 . . . . . . . . . . . . . . . . . . . . . . . . . . . . . . . . . . . . . . . . . . 7,447 —Capital lease obligations payable through 2036 . . . . . . . . . . . . . . . . . . . . . . . . . . . . . . . . . 13,939 13,948Other long-term debt . . . . . . . . . . . . . . . . . . . . . . . . . . . . . . . . . . . . . . . . . . . . . . . . . . . . . . . . . 6,423 7,434
Total debt . . . . . . . . . . . . . . . . . . . . . . . . . . . . . . . . . . . . . . . . . . . . . . . . . . . . . . . . . . . . . . . . 403,385 311,382Less current portion of debt . . . . . . . . . . . . . . . . . . . . . . . . . . . . . . . . . . . . . . . . . . . . . . . . . . (26,785) (26,803)
Long-term debt, less current maturities . . . . . . . . . . . . . . . . . . . . . . . . . . . . . . . . . . . . . $376,600 $284,579

Job TiTle Cabelas 10K Revision 9 seRial DaTe / Time Tuesday, March 11, 2008 /1:07 AM Job numbeR 159962 Type Current page no. 70 opeRaToR PM3
70
<12345678>
CABELA’S INCORPORATED AND SUBSIDIARIESNOTES TO CONSOLIDATED FINANCIAL STATEMENTS(Dollars in Thousands Except Share and Per Share Amounts)
On June 15, 2007, we issued $60,000 of 6.08% senior unsecured notes pursuant to a supplement to our February 2006 debt issuance of $215,000. The notes mature on June 15, 2017, with interest on the notes payable semi-annually. These notes contain the same default provisions and covenants as those pertaining to the February 2006 debt issuance, including limitations on indebtedness and financial covenants relating to net worth and fixed charges.
Certain of the long-term debt agreements contain various covenants and restrictions such as the maintenance of minimum debt coverage, net worth, and financial ratios. The significant financial ratios and net worth requirements in the long-term debt agreements are 1) a limitation of funded debt to be less than 60% of consolidated total capitalization; 2) cash flow fixed charge coverage ratio, as defined, of no less than 2.00 to 1.00 as of the last day of the any quarter; and 3) a minimum consolidated adjusted net worth (as defined).
In addition, the debt contains cross default provisions to other outstanding credit facilities. In the event that we failed to comply with these covenants and the failure to comply would go beyond 30 days, a default would trigger and all principal and outstanding interest would immediately be due and payable. At December 29, 2007, we were in compliance with all financial covenants under credit agreements and unsecured notes.
At the end of 2007 and 2006, the total carrying amount of long-term debt was $403,385 and $311,382, respectively, with an estimated fair value of $387,743 and $315,979, respectively.
We have a lease agreement for our distribution facility in Wheeling, West Virginia. The lease term is through June 2036. The monthly installments are $83 with the lease contains a bargain purchase option at the end of the lease term. We are accounting for this lease as a capital lease and have recorded the additional leased asset at the present value of the future minimum lease payments using a 5.9% implicit rate. The additional leased asset was recorded at $5,649 and is being amortized on a straight-line basis over 30 years.
Aggregate expected maturities of long-term debt and scheduled capital lease payments for the years shown are as follows:
Scheduled Capital Lease Payments
Long-Term Debt Maturities
2008 . . . . . . . . . . . . . . . . . . . . . . . . . . . . . . . . . . . . . . . . . . . . . . . . . $ 1,003 $ 26,5472009 . . . . . . . . . . . . . . . . . . . . . . . . . . . . . . . . . . . . . . . . . . . . . . . . . 1,092 26,3762010 . . . . . . . . . . . . . . . . . . . . . . . . . . . . . . . . . . . . . . . . . . . . . . . . . . 1,000 7,9902011 . . . . . . . . . . . . . . . . . . . . . . . . . . . . . . . . . . . . . . . . . . . . . . . . . . 1,000 4942012 . . . . . . . . . . . . . . . . . . . . . . . . . . . . . . . . . . . . . . . . . . . . . . . . . . 1,000 51,096Thereafter . . . . . . . . . . . . . . . . . . . . . . . . . . . . . . . . . . . . . . . . . . . . . 23,500 276,943
28,595 389,446Capital lease amount representing interest. . . . . . . . . . . . . . . . . . . . (14,656)Present value of net scheduled lease payments . . . . . . . . . . . . . . . . $ 13,939 13,939
Total long-term debt and capital leases . . . . . . . . . . . . . . . . . . . $403,385

Job TiTle Cabelas 10K Revision 9 seRial DaTe / Time Tuesday, March 11, 2008 /1:07 AM Job numbeR 159962 Type Current page no. 71 opeRaToR PM3
71
<12345678>
CABELA’S INCORPORATED AND SUBSIDIARIESNOTES TO CONSOLIDATED FINANCIAL STATEMENTS(Dollars in Thousands Except Share and Per Share Amounts)
14. INTEREST (EXPENSE) INCOME, NET
Interest expense, net of interest income, consisted of the following for years ended:
2007 2006 2005Interest expense . . . . . . . . . . . . . . . . . . . . . . . . . . . . . . . . . . . . . . . . $ (24,312) $(18,302) $(11,299)Capitalized interest . . . . . . . . . . . . . . . . . . . . . . . . . . . . . . . . . . . . . . 4,069 355 371Interest income . . . . . . . . . . . . . . . . . . . . . . . . . . . . . . . . . . . . . . . . . 1,465 1,821 672
$ (18,778) $(16,126) $(10,256)
15. INCOME TAXES
The provision for income taxes consisted of the following for the years ended:
2007 2006 2005Current:
Federal . . . . . . . . . . . . . . . . . . . . . . . . . . . . . . . . . . . . . . . . . . . $47,431 $24,601 $28,874State . . . . . . . . . . . . . . . . . . . . . . . . . . . . . . . . . . . . . . . . . . . . . 4,993 2,840 2,619
52,424 27,441 31,493Deferred:
Federal . . . . . . . . . . . . . . . . . . . . . . . . . . . . . . . . . . . . . . . . . . . (599) 22,225 10,723State . . . . . . . . . . . . . . . . . . . . . . . . . . . . . . . . . . . . . . . . . . . . . (477) 1,805 585
(1,076) 24,030 11,308$51,348 $51,471 $42,801
A reconciliation of the statutory federal income tax rate to the effective income tax rate is as follows for the years ended:
2007 2006 2005Statutory federal rate . . . . . . . . . . . . . . . . . . . . . . . . . . . . . . . . . . 35.0% 35.0% 35.0%State income taxes, net of federal tax benefit . . . . . . . . . . . . . . . 1.8 1.8 1.2Other nondeductible items . . . . . . . . . . . . . . . . . . . . . . . . . . . . . . 0.1 0.1 (0.1)Other, net . . . . . . . . . . . . . . . . . . . . . . . . . . . . . . . . . . . . . . . . . . . — 0.6 1.0
36.9% 37.5% 37.1%

Job TiTle Cabelas 10K Revision 9 seRial DaTe / Time Tuesday, March 11, 2008 /1:07 AM Job numbeR 159962 Type Current page no. 72 opeRaToR PM3
72
<12345678>
CABELA’S INCORPORATED AND SUBSIDIARIESNOTES TO CONSOLIDATED FINANCIAL STATEMENTS(Dollars in Thousands Except Share and Per Share Amounts)
Deferred tax assets and liabilities consisted of the following for the years ended:
2007 2006Deferred tax assets:
Deferred compensation . . . . . . . . . . . . . . . . . . . . . . . . . . . . . . . . . . . . . . . . . . . $ 5,547 $ 3,907Deferred revenue . . . . . . . . . . . . . . . . . . . . . . . . . . . . . . . . . . . . . . . . . . . . . . . . 3,744 3,276Reserve for returns . . . . . . . . . . . . . . . . . . . . . . . . . . . . . . . . . . . . . . . . . . . . . . . 7,550 8,032Accrued expenses. . . . . . . . . . . . . . . . . . . . . . . . . . . . . . . . . . . . . . . . . . . . . . . . 5,121 4,360Gift certificates liability . . . . . . . . . . . . . . . . . . . . . . . . . . . . . . . . . . . . . . . . . . . 3,401 —Allowance for doubtful accounts . . . . . . . . . . . . . . . . . . . . . . . . . . . . . . . . . . . . 2,505 1,822Other. . . . . . . . . . . . . . . . . . . . . . . . . . . . . . . . . . . . . . . . . . . . . . . . . . . . . . . . . . 3,623 2,298
31,491 23,695Deferred tax liabilities:
Prepaid expenses . . . . . . . . . . . . . . . . . . . . . . . . . . . . . . . . . . . . . . . . . . . . . . . . 17,773 14,249Property and equipment . . . . . . . . . . . . . . . . . . . . . . . . . . . . . . . . . . . . . . . . . . . 34,519 28,955Inventories . . . . . . . . . . . . . . . . . . . . . . . . . . . . . . . . . . . . . . . . . . . . . . . . . . . . . 14,902 16,999Retained interests in securitized loans . . . . . . . . . . . . . . . . . . . . . . . . . . . . . . . . 10,050 9,055Other . . . . . . . . . . . . . . . . . . . . . . . . . . . . . . . . . . . . . . . . . . . . . . . . . . . . . . . . . 45 2,855
77,289 72,113Valuation allowance. . . . . . . . . . . . . . . . . . . . . . . . . . . . . . . . . . . . . . . . . . . . . . . . . (916) —Net deferred tax liability . . . . . . . . . . . . . . . . . . . . . . . . . . . . . . . . . . . . . . . . . . . . . (46,714) (48,418)Less current deferred income taxes. . . . . . . . . . . . . . . . . . . . . . . . . . . . . . . . . . . . . 15,601 17,978Long-term deferred income taxes . . . . . . . . . . . . . . . . . . . . . . . . . . . . . . . . . . . . . . $(31,113) $ (30,440)
As of December 29, 2007, state net operating losses totaling $15,656 are being carried forward which begin to expire in 2014. These losses will expire completely by 2021. A full valuation allowance has been established against net operating loss carryforwards as it is uncertain if we will generate sufficient taxable income in these jurisdictions to recognize the tax benefit of these losses.
We adopted the provisions of FIN 48 in 2007 as discussed in Note 2. The reconciliation of unrecognized tax benefits, the balance of which is classified as other long-term liabilities in the consolidated balance sheet, is as follows for the year ended 2007:
Unrecognized tax benefits, beginning of year . . . . . . . . . . . . . . . . . . . . . . . . . . . . . . . . . . . . . . . . . $ 8,569Decreases on items related to prior periods . . . . . . . . . . . . . . . . . . . . . . . . . . . . . . . . . . . . . . . . . . . (6,866)Increases from current period items . . . . . . . . . . . . . . . . . . . . . . . . . . . . . . . . . . . . . . . . . . . . . . . . 297Unrecognized tax benefits, end of year . . . . . . . . . . . . . . . . . . . . . . . . . . . . . . . . . . . . . . . . . . . . . . $ 2,000

Job TiTle Cabelas 10K Revision 9 seRial DaTe / Time Tuesday, March 11, 2008 /1:07 AM Job numbeR 159962 Type Current page no. 73 opeRaToR PM3
73
<12345678>
CABELA’S INCORPORATED AND SUBSIDIARIESNOTES TO CONSOLIDATED FINANCIAL STATEMENTS(Dollars in Thousands Except Share and Per Share Amounts)
Our policy is to accrue interest expense, and penalties as appropriate, on estimated unrecognized tax benefits as a charge to interest expense in the consolidated statements of income. We recorded a net credit of $346 against interest expense during 2007 due to the gross decrease of certain unrecognized tax benefits. No penalties were accrued. The liability for estimated interest on unrecognized tax benefits totaling $850 at the end of 2007 is included in other long-term liabilities in the consolidated balance sheet. We do not anticipate a substantial change in the balance of unrecognized tax benefits in the next twelve months.
The total amount of unrecognized tax benefits that, if recognized, would affect the effective tax rate is $1,587. We file income tax returns in the United States, Canada, and various states. The tax years 2003 through 2006 remain open to examination by major taxing jurisdictions to which Cabela’s is subject.
16. COMMITMENTS AND CONTINGENCIES
We lease various buildings, computer equipment, signs, and storage space under operating leases, which expire on various dates through April 2033. Rent expense on these leases as well as other month to month rentals was $12,938, $8,896 and $6,793 for 2007, 2006 and 2005, respectively. The following is a schedule of future minimum rental payments under operating leases as of December 29, 2007:
2008 . . . . . . . . . . . . . . . . . . . . . . . . . . . . . . . . . . . . . . $ 5,1262009 . . . . . . . . . . . . . . . . . . . . . . . . . . . . . . . . . . . . . . 5,2092010 . . . . . . . . . . . . . . . . . . . . . . . . . . . . . . . . . . . . . . . 4,9442011 . . . . . . . . . . . . . . . . . . . . . . . . . . . . . . . . . . . . . . . 4,5862012 . . . . . . . . . . . . . . . . . . . . . . . . . . . . . . . . . . . . . . . 4,167 Thereafter . . . . . . . . . . . . . . . . . . . . . . . . . . . . . . . . . . 78,398
$102,430
We have entered into certain lease agreements for retail store locations. Certain leases include tenant allowances that will be amortized over the life of the lease. In 2007, we received $17,018 in tenant allowances. Certain leases require us to pay contingent rental amounts based on a percentage of sales, in addition to real estates taxes, insurance, maintenance, and other operating expenses associated with the leased premises. These leases include options to renew with lease periods, including extensions, varying from 10 to 70 years.
We have entered into real estate purchase, construction, and/or economic development agreements for various new retail store site locations. At December 29, 2007, we had total estimated cash commitments of approximately $180,000 for 2008 and 2009 for projected retail store-related expenditures and the purchase of future economic development bonds connected with the development, construction, and completion of new retail stores. This does not include any amounts for contractual obligations associated with retail store locations where we are in the process of certain negotiations.
Under various grant programs, state or local governments provide funding for certain costs associated with developing and opening a new retail store. We generally receive grant funding in exchange for commitments, such as assurance of agreed employment and wage levels at the retail store or that the retail store will remain open, made by us to the state or local government providing the funding. The commitments typically phase out over approximately five to ten years. If we fail to maintain the commitments during the applicable period, the funds received may have to be repaid or other adverse consequences may arise, which could affect our cash flows and profitability. As of December 29, 2007, the total amount of grant funding subject to a specific contractual remedy was $13,049. In addition, at December 29, 2007, we had an obligation under our open account document instructions program to pay $6,399 to participating vendors.
Job TiTle Cabelas 10K Revision 9 seRial DaTe / Time Tuesday, March 11, 2008 /1:07 AM Job numbeR 159962 Type Current page no. 74 opeRaToR PM3
74
<12345678>
CABELA’S INCORPORATED AND SUBSIDIARIESNOTES TO CONSOLIDATED FINANCIAL STATEMENTS(Dollars in Thousands Except Share and Per Share Amounts)
WFB enters into financial instruments with off balance sheet risk in the normal course of business through the origination of unsecured credit card loans. These financial instruments consist of commitments to extend credit, totaling $11,635,000 and $9,528,000, in addition to any other balances a cardholder might have, at years ended 2007 and 2006, respectively. These instruments involve, to varying degrees, elements of credit risk in excess of the amount recognized in the consolidated balance sheet. The principal amounts of these instruments reflect the maximum exposure WFB has in the instruments. WFB has not experienced and does not anticipate that all of the customers will exercise their entire available line of credit at any given point in time. WFB has the right to reduce or cancel these available lines of credit at any time.
Litigation – We are engaged in various legal actions arising in the ordinary course of business. The subject matter of these proceedings primarily includes commercial disputes, employment issues, and product liability lawsuits. After taking into consideration legal counsel’s evaluation of such actions, management is of the opinion that the ultimate outcome will not have a material adverse effect on our financial position or results of operations.
Self-Insurance – We are self-insured for health claims up to $300 per individual. We have established a liability for health claims submitted and for those claims incurred prior to year end but not yet reported totaling $3,929 and $3,934 at the end of 2007 and 2006, respectively.
We are also self-insured for workers’ compensation claims up to $500 per individual. We have established a liability for workers’ compensation claims submitted and for those claims incurred prior to year end but not yet reported totaling $4,326 and $3,843 at the end of 2007 and 2006, respectively.
Our liabilities for health and workers’ compensation claims incurred but not reported are based upon internally developed calculations. These estimates are regularly evaluated for adequacy based on the most current information available, including historical claim payments, expected trends, and industry factors.
17. REGULATORY CAPITAL REQUIREMENTS
WFB is subject to various regulatory capital requirements administered by the FDIC and the Nebraska State Department of Banking and Finance. Under capital adequacy guidelines and the regulatory framework for prompt corrective action, WFB must meet specific capital guidelines that involve quantitative measures of WFB’s assets, liabilities, and certain off-balance sheet items as calculated under regulatory accounting practices. WFB’s capital amounts and classification are also subject to qualitative judgment by the regulators with respect to components, risk weightings, and other factors.
The quantitative measures established by regulation to ensure capital adequacy require that WFB maintain minimum amounts and ratios (defined in the regulations) as set forth in the following table. WFB exceeded the minimum requirements for the well-capitalized category under the regulatory framework for prompt corrective action provisions for both periods presented.
At the end of 2007 and 2006, the most recent notification from the FDIC categorized WFB as well capitalized under the regulatory framework for prompt corrective action. To be categorized as well capitalized WFB must maintain certain amounts and ratios as set forth in the following table. There are no conditions or events since that notification that management believes have changed the institution’s category.
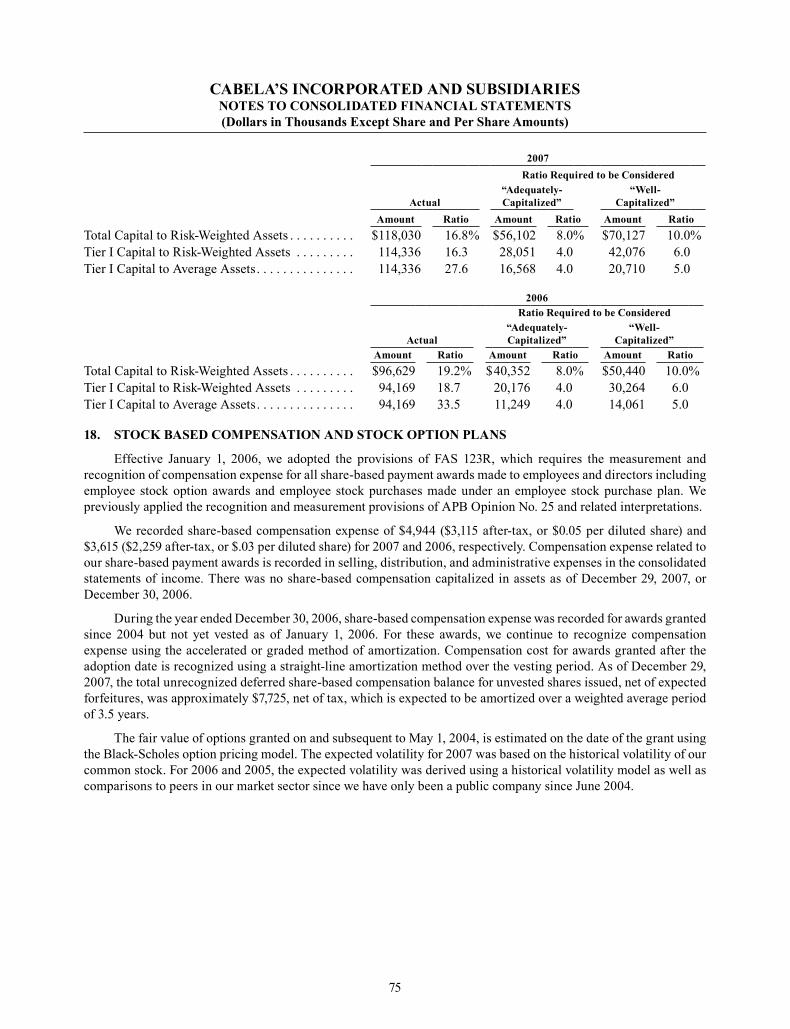
Job TiTle Cabelas 10K Revision 9 seRial DaTe / Time Tuesday, March 11, 2008 /1:07 AM Job numbeR 159962 Type Current page no. 75 opeRaToR PM3
75
<12345678>
CABELA’S INCORPORATED AND SUBSIDIARIESNOTES TO CONSOLIDATED FINANCIAL STATEMENTS(Dollars in Thousands Except Share and Per Share Amounts)
2007Ratio Required to be Considered
Actual“Adequately-Capitalized”
“Well- Capitalized”
Amount Ratio Amount Ratio Amount RatioTotal Capital to Risk-Weighted Assets . . . . . . . . . . $118,030 16.8 % $56,102 8.0% $70,127 10.0 %Tier I Capital to Risk-Weighted Assets . . . . . . . . . 114,336 16.3 28,051 4.0 42,076 6.0Tier I Capital to Average Assets . . . . . . . . . . . . . . . 114,336 27.6 16,568 4.0 20,710 5.0
2006Ratio Required to be Considered
Actual“Adequately-Capitalized”
“Well-Capitalized”
Amount Ratio Amount Ratio Amount RatioTotal Capital to Risk-Weighted Assets . . . . . . . . . . $96,629 19.2% $40,352 8.0% $50,440 10.0%Tier I Capital to Risk-Weighted Assets . . . . . . . . . 94,169 18.7 20,176 4.0 30,264 6.0Tier I Capital to Average Assets . . . . . . . . . . . . . . . 94,169 33.5 11,249 4.0 14,061 5.0
18. STOCK BASED COMPENSATION AND STOCK OPTION PLANS
Effective January 1, 2006, we adopted the provisions of FAS 123R, which requires the measurement and recognition of compensation expense for all share-based payment awards made to employees and directors including employee stock option awards and employee stock purchases made under an employee stock purchase plan. We previously applied the recognition and measurement provisions of APB Opinion No. 25 and related interpretations.
We recorded share-based compensation expense of $4,944 ($3,115 after-tax, or $0.05 per diluted share) and $3,615 ($2,259 after-tax, or $.03 per diluted share) for 2007 and 2006, respectively. Compensation expense related to our share-based payment awards is recorded in selling, distribution, and administrative expenses in the consolidated statements of income. There was no share-based compensation capitalized in assets as of December 29, 2007, or December 30, 2006.
During the year ended December 30, 2006, share-based compensation expense was recorded for awards granted since 2004 but not yet vested as of January 1, 2006. For these awards, we continue to recognize compensation expense using the accelerated or graded method of amortization. Compensation cost for awards granted after the adoption date is recognized using a straight-line amortization method over the vesting period. As of December 29, 2007, the total unrecognized deferred share-based compensation balance for unvested shares issued, net of expected forfeitures, was approximately $7,725, net of tax, which is expected to be amortized over a weighted average period of 3.5 years.
The fair value of options granted on and subsequent to May 1, 2004, is estimated on the date of the grant using the Black-Scholes option pricing model. The expected volatility for 2007 was based on the historical volatility of our common stock. For 2006 and 2005, the expected volatility was derived using a historical volatility model as well as comparisons to peers in our market sector since we have only been a public company since June 2004.

Job TiTle Cabelas 10K Revision 9 seRial DaTe / Time Tuesday, March 11, 2008 /1:07 AM Job numbeR 159962 Type Current page no. 76 opeRaToR PM3
76
<12345678>
CABELA’S INCORPORATED AND SUBSIDIARIESNOTES TO CONSOLIDATED FINANCIAL STATEMENTS(Dollars in Thousands Except Share and Per Share Amounts)
The fair value of options in the years presented was estimated using the Black-Scholes model with the following weighted average assumptions:
2007 2006 2005Risk-free interest rate based on U.S. Treasury yield curve in effect
at the grant date . . . . . . . . . . . . . . . . . . . . . . . . . . . . . . . . . . . . . . . 3.31 to 4.63% 5.01% 3.87 to 4.38%Dividend yield . . . . . . . . . . . . . . . . . . . . . . . . . . . . . . . . . . . . . . . . . . . — — —Expected volatility . . . . . . . . . . . . . . . . . . . . . . . . . . . . . . . . . . . . . . . 30 to 33% 50% 50%Weighted average expected life based on historical information . . . 5.0 years 6.0 years 4.5 years Weighted average grant date fair value of options granted . . . . . . . . $7.82 $10.45 $9.14
The following table summarizes our option activity during 2007:
Options Available for Grant
All Options Non-Vested Options
Number of Options
Weighted Average Exercise
PriceNumber
of Options
WeightedAverage
Grant Date Fair Value
Outstanding, beginning of year. . . . . . . . . . . . . . . . 39,434 4,887,409 $14.01 2,833,599 $6.61Additional options authorized . . . . . . . . . . . . . . 3,500,000Granted . . . . . . . . . . . . . . . . . . . . . . . . . . . . . . . . (1,115,000) 1,115,000 22.19 1,115,000 7.82Vested . . . . . . . . . . . . . . . . . . . . . . . . . . . . . . . . . — — — (885,777) 5.67Exercised . . . . . . . . . . . . . . . . . . . . . . . . . . . . . . — (524,648) 7.72 — —Forfeited (1) (2) . . . . . . . . . . . . . . . . . . . . . . . . . 104,762 (165,317) 16.21 (147,507) 6.55
Outstanding, end of year (3) . . . . . . . . . . . . . . . . . . 2,529,196 5,312,444 16.28 2,915,315 7.36
(1) Options forfeited under the 1997 Plan do not become available for grant under the 2004 Plan.
(2) Options forfeited under the 2004 Plan are immediately available for grant.
(3) Options outstanding at the end of 2007 were comprised of 1,089,191 of incentive stock options and 4,223,253 of nonqualified stock options.
The following table provides information relating to our equity share-based payment awards at December 29, 2007:
Shares
WeightedAverage
Exercise Price
WeightedAverage
Fair Value
Aggregate Intrinsic
Value
Weighted AverageRemaining
Contractual Life (in Years)
Vested and exercisable . . . . . . . . . . . . . . . . . 2,397,129 $14.83 $6.49 $ 5,839 4.94Non-vested . . . . . . . . . . . . . . . . . . . . . . . . . . 2,915,315 17.47 7.36 4,407 6.72Total outstanding . . . . . . . . . . . . . . . . . . . . . 5,312,444 16.28 6.97 $10,246 5.91Expected to vest after
December 29, 2007 . . . . . . . . . . . . . . . . . 2,791,051 17.33 7.28 $ 4,406 6.64
The aggregate intrinsic value of awards exercised was $8,188, $3,473 and $1,000 during 2007, 2006 and 2005, respectively. The total fair value of shares vested was $5,025, $3,843 and $6,304 in 2007, 2006 and 2005, respectively. Based on our closing stock price of $14.80 as of December 29, 2007, the total number of in-the-money awards exercisable as of December 29, 2007, was approximately 1,241,694.

Job TiTle Cabelas 10K Revision 9 seRial DaTe / Time Tuesday, March 11, 2008 /1:07 AM Job numbeR 159962 Type Current page no. 77 opeRaToR PM3
77
<12345678>
CABELA’S INCORPORATED AND SUBSIDIARIESNOTES TO CONSOLIDATED FINANCIAL STATEMENTS(Dollars in Thousands Except Share and Per Share Amounts)
The stock options outstanding and exercisable for equity share-based payment awards as of December 29, 2007, were in the following exercise price ranges:
Options Outstanding Options Exercisable
ExercisePrice Shares
WeightedAverage
Exercise Price
AverageRemaining
Contractual Life (in Years) Shares
WeightedAverage
Exercise Price$0.00 to $5.00 . . . . . . . . . . . . . . . . . . . . . . . . 176,160 $ 4.17 0.82 133,954 $ 4.12$5.01 to $10.00 . . . . . . . . . . . . . . . . . . . . . . . 618,075 8.26 3.31 281,352 8.18$10.01 to $15.00 . . . . . . . . . . . . . . . . . . . . . . . 1,409,228 11.73 3.54 826,388 11.72$15.01 to $20.00 . . . . . . . . . . . . . . . . . . . . . . 2,058,981 19.72 7.45 1,149,435 19.89$20.01 to $25.00 . . . . . . . . . . . . . . . . . . . . . . 1,046,000 22.38 8.48 2,000 21.77$25.01 to $30.00 . . . . . . . . . . . . . . . . . . . . . . 4,000 27.26 6.58 4,000 27.26
5,312,444 16.28 5.91 2,397,129 14.83
19. STOCK OPTION AND OTHER EMPLOYEE BENEFIT PLANS
Employee Stock Option Plans – The Cabela’s Incorporated 2004 Stock Plan (the “2004 Plan”) provides for the grant of non-qualified stock options, incentive stock options, stock appreciation rights, restricted stock, restricted stock units, and other stock-based awards to employees, directors, and consultants. Options granted under the 2004 Plan will have a term of no greater than ten years from the grant date and will become exercisable in accordance with the vesting schedule determined at the time the awards are granted. As of December 29, 2007, there were 3,608,879 shares subject to options and 2,529,196 shares authorized and available for grant under the 2004 Plan. Our policy has been to issue new shares for the exercise of stock options.
As of December 29, 2007, under our 1997 Stock Option Plan (the “1997 Plan”), there were 1,703,565 shares subject to options with no shares available for grant. Options issued expire on the fifth or the tenth anniversary of the date of the grant under the 1997 Plan.
Employee Stock Purchase Plan – The maximum number of shares of common stock available for issuance under our Employee Stock Purchase Plan (the “ESPP”) is 1,835,000. During 2007, there were 133,606 shares issued under the ESPP. As of December 29, 2007, 1,445,276 shares were authorized and available for issuance. We intend to utilize market purchases, rather than new issuances, whenever possible.
401(k) Savings Plan – All employees are eligible to defer up to 80% of their wages to Cabela’s 401(k) savings plan, subject to certain limitations. The Company matches 100% of eligible employee deferrals up to 6% of eligible wages. Total expense for employer contributions was $7,007, $6,502 and $10,307 in 2007, 2006 and 2005, respectively.
Deferred Compensation Plan – We have a self-funded, nonqualified deferred compensation plan for certain key employees that was amended on December 31, 2004, to restrict any further contributions. Participants’ balances earn interest with the rate adjusting on a semi-annual basis. Upon certain conditions participants can receive their balance in either a lump sum or in equal annual payments over various time periods. The charge to interest expense under this plan was $525, $503 and $633 for 2007, 2006 and 2005, respectively.

Job TiTle Cabelas 10K Revision 9 seRial DaTe / Time Tuesday, March 11, 2008 /1:07 AM Job numbeR 159962 Type Current page no. 78 opeRaToR PM3
78
<12345678>
CABELA’S INCORPORATED AND SUBSIDIARIESNOTES TO CONSOLIDATED FINANCIAL STATEMENTS(Dollars in Thousands Except Share and Per Share Amounts)
20. STOCKHOLDERS’ EQUITY AND DIVIDEND RESTRICTIONS
Preferred Stock – We are authorized to issue 10,000,000 shares of preferred stock having a par value of $0.01 per share. None of the shares of the authorized preferred stock have been issued. The board of directors is authorized to issue these shares of preferred stock without stockholder approval in different classes and series and, with respect to each class or series, to determine the dividend rate, the redemption provisions, conversion provisions, liquidation preference, and other rights, privileges, and restrictions. The issuance of any preferred stock could have the effect of diluting the voting power of the holders of common stock, restricting dividends on the common stock, impairing the liquidation rights of the common stock, or delaying or preventing a change in control without further action by the stockholders.
Class A Voting Common Stock – The holders of our Class A common stock are entitled to receive ratably dividends, if any, the board of directors may declare from time to time from funds legally available therefore, subject to the preferential rights of the holders of any shares of preferred stock that we may issue in the future. The holders of our Class A common stock are entitled to one vote per share on any matter to be voted upon by stockholders.
Upon any voluntary or involuntary liquidation, dissolution, or winding up of company affairs, the holders of our Class A common stock are entitled to share ratably with the holders of Class B non-voting common stock in all assets remaining after payment to creditors and subject to prior distribution rights of any shares of preferred stock that the Company may issue in the future. All of the outstanding shares of Class A common stock are fully paid and non-assessable.
Class B Non-voting Common Stock – The holders of our Class B non-voting common stock are not entitled to any voting rights, except that the holders may vote as a class, with each holder receiving one vote per share of Class B non-voting common stock, on any amendment, repeal, or modification of any provision of our Amended and Restated Certificate of Incorporation that adversely affects the powers, preferences, or special rights of holders of Class B non-voting common stock. Shares of the Class B non-voting common stock are convertible into the same number of shares of Class A voting common stock at any time. However, no holder of shares of Class B non-voting common stock is entitled to convert any of its shares into shares of Class A common stock, to the extent that, as a result of such conversion, the holder directly, or indirectly, would own, control, or have the power to vote a greater number of shares of Class A common stock or other securities of any kind issued by us than the holder is legally permitted to own, control, or have the power to vote. Subject to the prior rights of holders of preferred stock, if any, holders of Class B non-voting common stock, which rates equally with the Class A common stock in respect of dividends, are entitled to receive ratably dividends, if any, as may be lawfully declared from time to time by our board of directors.
Upon any voluntary or involuntary liquidation, dissolution, or winding up of company affairs, the holders of Class B non-voting common stock are entitled to share ratably with the holders of Class A common stock in all assets remaining after payment to creditors and subject to prior distribution rights of any shares of preferred stock that we may issue in the future.
Retained Earnings – The most significant restrictions on the payment of dividends are the covenants contained in our revolving credit agreement and unsecured senior notes purchase agreements. Nebraska banking laws also govern the amount of dividends that WFB can pay to Cabela’s. We have unrestricted retained earnings of $108,933 available for dividends.
Shelf Registration – On September 2, 2005, we filed with the SEC a Form S-3 Registration Statement (Registration No. 333-128100) to register 6,252,768 shares of our common stock (the “Form S-3 Registration Statement”). On March 8, 2007, we entered into an underwriting agreement providing for the sale by the selling stockholders named in the underwriting agreement (the “Selling Stockholders”) of 4,736,868 shares of our common stock. On March 9, 2007, we filed with the SEC a prospectus supplement to the effective Form S-3 Registration Statement relating to the underwritten public offering of the 4,736,868 shares of our common stock by the Selling Stockholders. The sale of the shares of our common stock by the Selling Stockholders closed on March 14, 2007, and the public offering price was $24.05 per share. We did not receive any proceeds from the sale of this common stock by the Selling Stockholders.

Job TiTle Cabelas 10K Revision 9 seRial DaTe / Time Tuesday, March 11, 2008 /1:07 AM Job numbeR 159962 Type Current page no. 79 opeRaToR PM3
79
<12345678>
CABELA’S INCORPORATED AND SUBSIDIARIESNOTES TO CONSOLIDATED FINANCIAL STATEMENTS(Dollars in Thousands Except Share and Per Share Amounts)
Other Comprehensive Income (Loss) – The components of accumulated other comprehensive income (loss), net of related taxes, are as follows for the years ended:
2007 2006Accumulated net unrealized holding gains (losses) on available-for-sale bonds . . . . . . . . . . . . . . $(806) $292Accumulated net unrealized holding gains on derivatives . . . . . . . . . . . . . . . . . . . . . . . . . . . . . . . 76 23Cumulative foreign currency translation adjustment . . . . . . . . . . . . . . . . . . . . . . . . . . . . . . . . . . . . 7 —Total accumulated other comprehensive income (loss) . . . . . . . . . . . . . . . . . . . . . . . . . . . . . . . . . . $(723) $315
21. EARNINGS PER SHARE
The following table reconciles the number of shares utilized in the earnings per share calculations for the years ended:
2007 2006 2005Weighted average number of shares:
Common shares – basic . . . . . . . . . . . . . . . . . . . . . . . . . . . . . . . . . . . 65,744,077 65,221,339 64,668,973Effect of incremental dilutive securities:
Stock options and employee stock purchase plan shares . . . . 1,531,454 1,422,517 1,599,401 Common shares – diluted. . . . . . . . . . . . . . . . . . . . . . . . . . . . . . . . . . 67,275,531 66,643,856 66,268,374
Options outstanding considered anti-dilutive . . . . . . . . . . . . . . . . . . . . . 1,048,000 6,000 1,444,186
22. SUPPLEMENTAL CASH FLOW INFORMATION
The following table sets forth non-cash financing and investing activities and other cash flow information for the years ended:
2007 2006 2005Non-cash financing and investing activities:Accrued property and equipment additions (1). . . . . . . . . . . . . . . . . . . . . . . . . . $48,534 $19,852 $ 8,498Capital lease obligations . . . . . . . . . . . . . . . . . . . . . . . . . . . . . . . . . . . . . . . . . . . 201 5,649 —Contribution of land. . . . . . . . . . . . . . . . . . . . . . . . . . . . . . . . . . . . . . . . . . . . . . . 19,000 — —
Other cash flow information:Interest paid . . . . . . . . . . . . . . . . . . . . . . . . . . . . . . . . . . . . . . . . . . . . . . . . . . $30,273 $ 19,017 $14,968Capitalized interest . . . . . . . . . . . . . . . . . . . . . . . . . . . . . . . . . . . . . . . . . . . . (4,069) (355) (371)Interest paid, net of capitalized interest . . . . . . . . . . . . . . . . . . . . . . . . . . . . . $26,204 $18,662 $14,597Income taxes, net . . . . . . . . . . . . . . . . . . . . . . . . . . . . . . . . . . . . . . . . . . . . . . $ 33,575 $ 41,012 $38,354
(1) Accrued property and equipment additions are recognized in the consolidated statements of cash flows in the period they are paid.
23. SEGMENT REPORTING
We have three reportable segments: Retail, Direct, and Financial Services. The Retail segment sells products and services through our retail stores; the Direct segment sells products through direct mail catalogs and e-commerce websites (Cabelas.com and complementary websites); and the Financial Services segment issues co-branded credit cards. For the Retail segment, operating costs primarily consist of labor, advertising, depreciation, and occupancy costs of retail stores. For the Direct segment, operating costs primarily consist of catalog costs, e-commerce advertising costs, and order processing costs. For the Financial Services segment, operating costs primarily consist of advertising and promotion, marketing fees, third party services for processing credit card transactions, salaries, and other general and administrative costs.

Job TiTle Cabelas 10K Revision 9 seRial DaTe / Time Tuesday, March 11, 2008 /1:07 AM Job numbeR 159962 Type Current page no. 80 opeRaToR PM3
80
<12345678>
CABELA’S INCORPORATED AND SUBSIDIARIESNOTES TO CONSOLIDATED FINANCIAL STATEMENTS(Dollars in Thousands Except Share and Per Share Amounts)
Revenues included in Corporate Overhead and Other are primarily made up of land sales. Corporate Overhead and Other expenses include unallocated shared-service costs, operations of various ancillary subsidiaries such as real estate development and travel, and eliminations. Unallocated shared-service costs include receiving, distribution, and storage costs of inventory, merchandising, and quality assurance costs, as well as corporate headquarters occupancy costs.
Segment assets are those directly used in or clearly allocable to an operating segment’s operations. For the Retail segment, assets primarily include inventory in the retail stores, land, buildings, fixtures, and leasehold improvements. For the Direct segment, assets primarily include deferred catalog costs and fixed assets. Included in the assets of the Direct and Retail segments is goodwill of $4,474 that has been allocated $969 to the Direct segment and $3,505 to the Retail segment as of December 29, 2007. For the Financial Services segment, assets primarily include cash, credit card loans, retained interest, buildings, and fixtures. Corporate and other assets include corporate headquarters, merchandise distribution inventory, shared technology infrastructure, as well as corporate cash and cash equivalents, economic development bonds, prepaid expenses, and other assets. Depreciation, amortization, and property and equipment expenditures of each segment are allocated to each respective segment. Unallocated assets include corporate cash and cash equivalents, merchandise distribution inventory for the Retail or Direct segments, the net book value of corporate facilities and related information systems, deferred income taxes, and other corporate long-lived assets. The accounting policies of the segments, where applicable, are the same as those described in the summary of significant accounting policies in our notes to consolidated financial statements. Intercompany revenue between segments has been eliminated in consolidation.
Results by business segment are presented in the following tables for 2007, 2006 and 2005:
Fiscal Year 2007 Retail DirectFinancialServices
CorporateOverheadand Other Total
Revenue from external . . . . . . . . . . . . . . . . $1,040,664 $1,127,942 $159,943 $ 21,050 $2,349,599Revenue (loss) from internal . . . . . . . . . . . . 2,778 2,611 (608) (4,781) —
Total revenue . . . . . . . . . . . . . . . . . . . . . $1,043,442 $1,130,553 $159,335 $ 16,269 $2,349,599Operating income (loss). . . . . . . . . . . . . . . . $ 127,744 $ 190,046 $ 37,448 $(204,146) $ 151,092
As a percentage of revenue . . . . . . . . . . 12.2% 16.8% 23.5% N/A 6.4%Depreciation and amortization . . . . . . . . . . $ 29,830 $ 4,462 $ 1,129 $ 24,442 $ 59,863Assets . . . . . . . . . . . . . . . . . . . . . . . . . . . . . . 1,065,234 480,341 450,616 216,639 2,212,830Property and equipment additions
including accrued amounts . . . . . . . . . . 324,272 8,466 1,037 30,551 364,326
Fiscal Year 2006 Retail DirectFinancialServices
CorporateOverheadand Other Total
Revenue from external . . . . . . . . . . . . . . . . $817,836 $1,086,162 $138,164 $ 21,362 $2,063,524Revenue (loss) from internal . . . . . . . . . . . . 2,485 2,318 (741) (4,062) —
Total revenue . . . . . . . . . . . . . . . . . . . . . $820,321 $1,088,480 $137,423 $ 17,300 $2,063,524Operating income (loss). . . . . . . . . . . . . . . . $124,122 $ 179,182 $ 30,061 $(189,620) $ 143,745
As a percentage of revenue . . . . . . . . . . 15.1% 16.5% 21.9% N/A 7.0%Depreciation and amortization . . . . . . . . . . $ 19,050 $ 4,371 $ 941 $ 21,197 $ 45,559Assets . . . . . . . . . . . . . . . . . . . . . . . . . . . . . . 602,513 496,963 316,417 335,337 1,751,230Property and equipment additions
including accrued amounts . . . . . . . . . . 161,585 5,680 1,735 21,592 190,592

Job TiTle Cabelas 10K Revision 9 seRial DaTe / Time Tuesday, March 11, 2008 /1:07 AM Job numbeR 159962 Type Current page no. 81 opeRaToR PM3
81
<12345678>
CABELA’S INCORPORATED AND SUBSIDIARIESNOTES TO CONSOLIDATED FINANCIAL STATEMENTS(Dollars in Thousands Except Share and Per Share Amounts)
Fiscal Year 2005 Retail DirectFinancialServices
CorporateOverheadand Other Total
Revenue from external . . . . . . . . . . . . . . . . . . $ 618,044 $1,042,219 $106,439 $ 32,959 $1,799,661Revenue (loss) from internal . . . . . . . . . . . . . . 2,061 1,948 (608) (3,401) —
Total revenue . . . . . . . . . . . . . . . . . . . . . . . $ 620,105 $1,044,167 $105,831 $ 29,558 $1,799,661Operating income (loss). . . . . . . . . . . . . . . . . . $ 85,895 $ 171,908 $ 23,060 $(165,900) $ 114,963
As a percentage of revenue . . . . . . . . . . . . 13.9% 16.5% 21.8% N/A 6.4%Depreciation and amortization . . . . . . . . . . . . $ 12,916 $ 5,308 $ 1,089 $ 15,599 $ 34,912Assets . . . . . . . . . . . . . . . . . . . . . . . . . . . . . . . . 460,776 405,303 262,799 237,402 1,366,280Property and equipment additions
including accrued amounts . . . . . . . . . . . . 163,123 5,853 603 33,578 203,157
The components and amounts of total revenue for the Financial Services business segment were as follows for the years ended:
2007 2006 2005Interest and fee income, net of provision for loan losses . . . . . . . . . . . . . . . . . $ 28,974 $ 23,973 $ 17,196Interest expense . . . . . . . . . . . . . . . . . . . . . . . . . . . . . . . . . . . . . . . . . . . . . . . . . (7,288) (5,008) (3,241)
Net interest income, net of provision for loan losses . . . . . . . . . . . . . . . 21,686 18,965 13,955Non-interest income:
Securitization income . . . . . . . . . . . . . . . . . . . . . . . . . . . . . . . . . . . . . . . 194,516 169,173 133,032Other non-interest income . . . . . . . . . . . . . . . . . . . . . . . . . . . . . . . . . . . 51,670 39,381 31,836
Total non-interest income . . . . . . . . . . . . . . . . . . . . . . . . . . . . . . . . . 246,186 208,554 164,868Less: Customer rewards costs. . . . . . . . . . . . . . . . . . . . . . . . . . . . . . . . . (108,537) (90,096) (72,992)
Financial Services total revenue . . . . . . . . . . . . . . . . . . . . . . . . . . . . . . . . . . . . $ 159,335 $137,423 $105,831
Our products are principally marketed to individuals within the United States. Net sales realized from other geographic markets, primarily Canada, have collectively been less than 2% of consolidated net merchandise sales in each reported period. No single customer accounted for 10% or more of consolidated net sales. No single product or service accounts for a significant percentage of our consolidated revenue.

Job TiTle Cabelas 10K Revision 9 seRial DaTe / Time Tuesday, March 11, 2008 /1:07 AM Job numbeR 159962 Type Current page no. 82 opeRaToR PM3
82
<12345678>
CABELA’S INCORPORATED AND SUBSIDIARIESNOTES TO CONSOLIDATED FINANCIAL STATEMENTS(Dollars in Thousands Except Share and Per Share Amounts)
24. QUARTERLY FINANCIAL INFORMATION (Unaudited)
The following table sets forth unaudited financial and operating data in each quarter for the years ended 2007 and 2006:
2007 2006First
QuarterSecond Quarter
Third Quarter
Fourth Quarter
First Quarter
Second Quarter
Third Quarter
Fourth Quarter
Total revenue . . . . . . . . . . . . . . . . . . . $462,091 $451,199 $546,809 $889,500 $404,805 $387,263 $490,453 $781,003Operating income . . . . . . . . . . . . . . . 12,391 20,252 24,346 94,103 14,203 14,545 26,851 88,146Net income . . . . . . . . . . . . . . . . . . . . 7,142 11,264 13,232 56,241 9,083 8,356 14,994 53,352Earnings per share — Basic (1) . . . . 0.11 0.17 0.20 0.85 0.14 0.13 0.23 0.82Earnings per share — Diluted (1) . . . 0.11 0.17 0.20 0.84 0.14 0.13 0.23 0.80
(1) Basic and diluted earnings per share are computed independently for each of the quarters presented.
Revenue is typically higher in our third and fourth quarters than in the first and second quarters due to holiday buying patterns and hunting and fishing season openings across the United States. Our quarterly operating results may fluctuate significantly as a result of these events and a variety of other factors, and operating results for any quarter are not necessarily indicative of results for a full year.
25. SUBSEQUENT EVENTS
On January 18, 2008, the Cabela’s Credit Card Master Note Trust completed the sale of $500,000 in asset-backed notes, Series 2008-I. The securitization transaction included the issuance of six classes of notes with an expected life of approximately three years (a legal maturity of approximately six years). This securitization refinanced an existing $300,000 securitization that matured January 2008, with the remaining amount to fund continued growth of the bank’s credit card portfolio. These notes are obligations of the aforementioned trust, and are not in the consolidated balance sheet of the Company.
On January 16, 2008, we issued $57,000 of 7.20% unsecured notes to institutional buyers. The notes have a final maturity of 10 years and an average life of seven years. We intend to use the proceeds to pay down existing debt and for general corporate purposes.
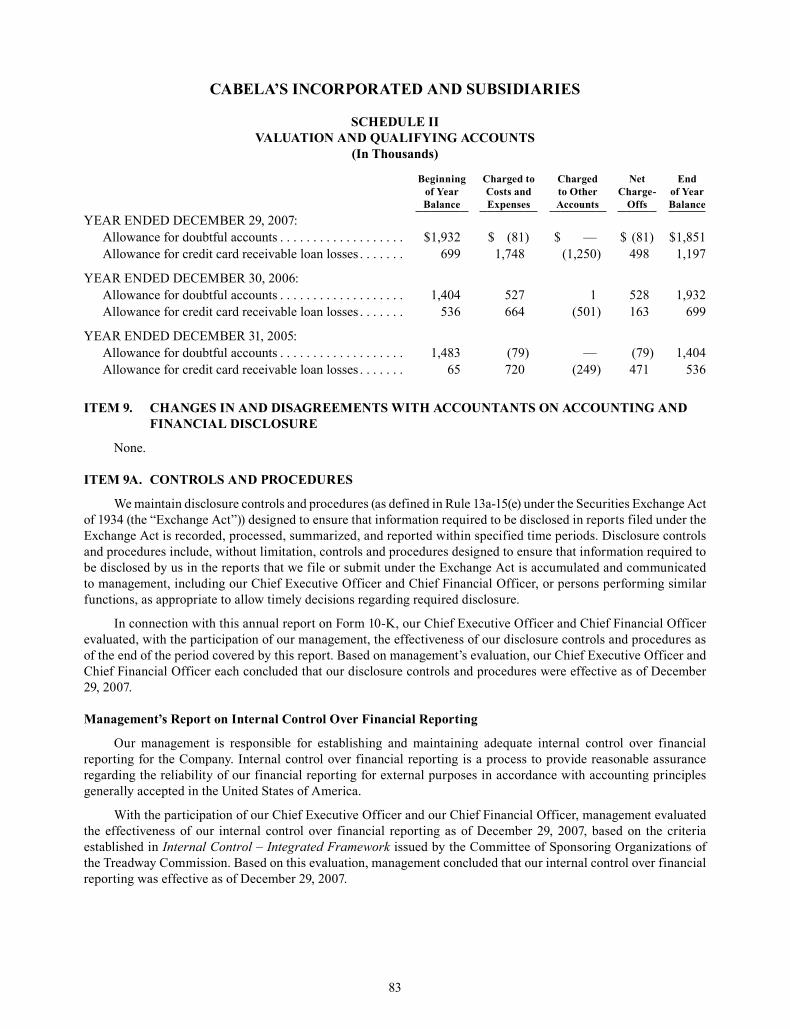
Job TiTle Cabelas 10K Revision 9 seRial DaTe / Time Tuesday, March 11, 2008 /1:07 AM Job numbeR 159962 Type Current page no. 83 opeRaToR PM3
83
<12345678>
CABELA’S INCORPORATED AND SUBSIDIARIES
SCHEDULE II VALUATION AND QUALIFYING ACCOUNTS
(In Thousands)
Beginningof YearBalance
Charged toCosts andExpenses
Chargedto OtherAccounts
NetCharge-
Offs
Endof YearBalance
YEAR ENDED DECEMBER 29, 2007:Allowance for doubtful accounts . . . . . . . . . . . . . . . . . . . $1,932 $ (81) $ — $ (81) $1,851Allowance for credit card receivable loan losses . . . . . . . 699 1,748 (1,250) 498 1,197
YEAR ENDED DECEMBER 30, 2006:Allowance for doubtful accounts . . . . . . . . . . . . . . . . . . . 1,404 527 1 528 1,932Allowance for credit card receivable loan losses . . . . . . . 536 664 (501) 163 699
YEAR ENDED DECEMBER 31, 2005:Allowance for doubtful accounts . . . . . . . . . . . . . . . . . . . 1,483 (79) — (79) 1,404Allowance for credit card receivable loan losses . . . . . . . 65 720 (249) 471 536
ITEM 9. CHANGES IN AND DISAGREEMENTS WITH ACCOUNTANTS ON ACCOUNTING AND FINANCIAL DISCLOSURE
None.
ITEM 9A. CONTROLS AND PROCEDURES
We maintain disclosure controls and procedures (as defined in Rule 13a-15(e) under the Securities Exchange Act of 1934 (the “Exchange Act”)) designed to ensure that information required to be disclosed in reports filed under the Exchange Act is recorded, processed, summarized, and reported within specified time periods. Disclosure controls and procedures include, without limitation, controls and procedures designed to ensure that information required to be disclosed by us in the reports that we file or submit under the Exchange Act is accumulated and communicated to management, including our Chief Executive Officer and Chief Financial Officer, or persons performing similar functions, as appropriate to allow timely decisions regarding required disclosure.
In connection with this annual report on Form 10-K, our Chief Executive Officer and Chief Financial Officer evaluated, with the participation of our management, the effectiveness of our disclosure controls and procedures as of the end of the period covered by this report. Based on management’s evaluation, our Chief Executive Officer and Chief Financial Officer each concluded that our disclosure controls and procedures were effective as of December 29, 2007.
Management’s Report on Internal Control Over Financial Reporting
Our management is responsible for establishing and maintaining adequate internal control over financial reporting for the Company. Internal control over financial reporting is a process to provide reasonable assurance regarding the reliability of our financial reporting for external purposes in accordance with accounting principles generally accepted in the United States of America.
With the participation of our Chief Executive Officer and our Chief Financial Officer, management evaluated the effectiveness of our internal control over financial reporting as of December 29, 2007, based on the criteria established in Internal Control – Integrated Framework issued by the Committee of Sponsoring Organizations of the Treadway Commission. Based on this evaluation, management concluded that our internal control over financial reporting was effective as of December 29, 2007.
Job TiTle Cabelas 10K Revision 9 seRial DaTe / Time Tuesday, March 11, 2008 /1:07 AM Job numbeR 159962 Type Current page no. 84 opeRaToR PM3
84
<12345678>
The independent registered public accounting firm of Deloitte & Touche LLP, as auditors of our consolidated financial statements included in this annual report on Form 10-K, has issued an attestation report on the effectiveness of our internal control over financial reporting based on the criteria established in Internal Control—Integrated Framework issued by the Committee of Sponsoring Organizations of the Treadway Commission. Their report is included in this Item 9A.
Changes in Internal Control Over Financial Reporting
There were no changes in our internal control over financial reporting that occurred during the quarter ended December 29, 2007, that materially affected, or are reasonably likely to materially affect, our internal control over financial reporting.

Job TiTle Cabelas 10K Revision 9 seRial DaTe / Time Tuesday, March 11, 2008 /1:07 AM Job numbeR 159962 Type Current page no. 85 opeRaToR PM3
85
<12345678>
REPORT OF INDEPENDENT REGISTERED PUBLIC ACCOUNTING FIRM
To the Board of Directors and Stockholders of Cabela’s Incorporated and Subsidiaries Sidney, Nebraska
We have audited the internal control over financial reporting of Cabela’s Incorporated and Subsidiaries (the “Company”) as of December 29, 2007, based on criteria established in Internal Control — Integrated Framework issued by the Committee of Sponsoring Organizations of the Treadway Commission. The Company’s management is responsible for maintaining effective internal control over financial reporting and for its assessment of the effectiveness of internal control over financial reporting, included in the accompanying Management’s Report on Internal Control Over Financial Reporting. Our responsibility is to express an opinion on the Company’s internal control over financial reporting based on our audit.
We conducted our audit in accordance with the standards of the Public Company Accounting Oversight Board (United States). Those standards require that we plan and perform the audit to obtain reasonable assurance about whether effective internal control over financial reporting was maintained in all material respects. Our audit included obtaining an understanding of internal control over financial reporting, assessing the risk that a material weakness exists, testing and evaluating the design and operating effectiveness of internal control based on the assessed risk, and performing such other procedures as we considered necessary in the circumstances. We believe that our audit provides a reasonable basis for our opinion.
A company’s internal control over financial reporting is a process designed by, or under the supervision of, the company’s principal executive and principal financial officers, or persons performing similar functions, and effected by the company’s board of directors, management, and other personnel to provide reasonable assurance regarding the reliability of financial reporting and the preparation of financial statements for external purposes in accordance with generally accepted accounting principles. A company’s internal control over financial reporting includes those policies and procedures that (1) pertain to the maintenance of records that, in reasonable detail, accurately and fairly reflect the transactions and dispositions of the assets of the company; (2) provide reasonable assurance that transactions are recorded as necessary to permit preparation of financial statements in accordance with generally accepted accounting principles, and that receipts and expenditures of the company are being made only in accordance with authorizations of management and directors of the company; and (3) provide reasonable assurance regarding prevention or timely detection of unauthorized acquisition, use, or disposition of the company’s assets that could have a material effect on the financial statements.
Because of the inherent limitations of internal control over financial reporting, including the possibility of collusion or improper management override of controls, material misstatements due to error or fraud may not be prevented or detected on a timely basis. Also, projections of any evaluation of the effectiveness of the internal control over financial reporting to future periods are subject to the risk that the controls may become inadequate because of changes in conditions, or that the degree of compliance with the policies or procedures may deteriorate.
In our opinion, the Company maintained, in all material respects, effective internal control over financial reporting as of December 29, 2007, based on the criteria established in Internal Control — Integrated Framework issued by the Committee of Sponsoring Organizations of the Treadway Commission.
We have also audited, in accordance with the standards of the Public Company Accounting Oversight Board (United States), the consolidated financial statements and financial statement schedule as of and for the year ended December 29, 2007 of the Company and our report dated February 26, 2008 expressed an unqualified opinion on those consolidated financial statements and financial statement schedule.
/s/ Deloitte & Touche LLPDELOITTE & TOUCHE LLP
Omaha, Nebraska February 26, 2008
Job TiTle Cabelas 10K Revision 9 seRial DaTe / Time Tuesday, March 11, 2008 /1:07 AM Job numbeR 159962 Type Current page no. 86 opeRaToR PM3
86
<12345678>
ITEM 9B. OTHER INFORMATION
None.
PART III
ITEM 10. DIRECTORS, EXECUTIVE OFFICERS AND CORPORATE GOVERNANCE
The information under the headings “Proposal One – Election of Directors,” “Executive Officers of the Company,” “Corporate Governance – Committees of the Board of Directors – Audit Committee,” and “Section 16 (a) Beneficial Ownership Reporting Compliance,” in our Proxy Statement relating to our 2008 Annual Meeting of Shareholders (our “Proxy Statement”) is incorporated herein by reference. With the exception of the foregoing information and other information specifically incorporated by reference into this Report on Form 10-K, our Proxy Statement is not being filed as a part hereof.
The policies comprising our code of ethics are set forth in our Business Code of Conduct and Ethics. These policies satisfy the SEC’s requirements for a “code of ethics,” and apply to all of our directors, officers, and employees. Our Business Code of Conduct and Ethics is posted on our website at www.cabelas.com. We intend to satisfy the disclosure requirements under Item 5.05 of Form 8-K regarding certain amendments to, or waivers from, the provisions of our Business Code of Conduct and Ethics by posting such information on our website at the address specified above. Information contained on our website, whether currently posted or posted in the future, is not part of this document or the documents incorporated by reference in this document.
On June 12, 2007, we filed with the NYSE the Annual CEO Certification regarding the company’s compliance with the NYSE’s Corporate Governance listing standards as required by Section 303A.12(a) of the NYSE Listed Company Manual.
ITEM 11. EXECUTIVE COMPENSATION
The information under the headings “Executive Compensation” and “Director Compensation” in our Proxy Statement is incorporated herein by reference.
ITEM 12. SECURITY OWNERSHIP OF CERTAIN BENEFICIAL OWNERS AND MANAGEMENT AND RELATED STOCKHOLDER MATTERS
The information under the headings “Executive Compensation – Equity Compensation Plan Information as of Fiscal Year-End” and “Security Ownership of Certain Beneficial Owners and Management” in our Proxy Statement is incorporated herein by reference.
ITEM 13. CERTAIN RELATIONSHIPS AND RELATED TRANSACTIONS, AND DIRECTOR INDEPENDENCE
The information under the headings “Transactions with Related Persons” and “Corporate Governance – Board of Directors” in our Proxy Statement is incorporated herein by reference.
ITEM 14. PRINCIPAL ACCOUNTING FEES AND SERVICES
The information under the heading “Proposal Three – Ratification of Independent Registered Public Accounting Firm” in our Proxy Statement is incorporated herein by reference.

Job TiTle Cabelas 10K Revision 9 seRial DaTe / Time Tuesday, March 11, 2008 /1:07 AM Job numbeR 159962 Type Current page no. 87 opeRaToR PM3
87
<12345678>
PART IV
ITEM 15. EXHIBITS, FINANCIAL STATEMENT SCHEDULES
(a) The following documents are filed as part of this report:
1. Financial Statements:
• Report of Independent Registered Public Accounting Firm
• Consolidated Statements of Income –Years ended December 29, 2007, December 30, 2006 and December 31, 2005
• Consolidated Balance Sheets – December 29, 2007 and December 30, 2006
• Consolidated Statements of Cash Flows – Years ended December 29, 2007, December 30, 2006 and December 31, 2005
• Consolidated Statements of Stockholders’ Equity – Years ended December 29, 2007, December 30, 2006 and December 31, 2005
• Notes to Consolidated Financial Statements
2. Financial Statement Schedules:
• Schedule II – Valuation and Qualifying Accounts
All other schedules for which provision is made in the applicable accounting regulations of the SEC are not required under the related instructions or are inapplicable and, therefore, have been omitted.
3. Exhibits: See Item 15(b) below.
(b) Exhibits
Exhibit Number Exhibit Description
3.1 Amended and Restated Certificate of Incorporation of Cabela’s Incorporated (incorporated by reference from Exhibit 3.1 of our Quarterly Report on Form 10-Q, filed on August 13, 2004, File No. 001-32227)
3.2 Certificate of Amendment of Amended and Restated Certificate of Incorporation of Cabela’s Incorporated (incorporated by reference from Exhibit 3.1 of our Current Report on Form 8-K, filed on May 15, 2006, File No. 001-32227)
3.3 Amended and Restated Bylaws of Cabela’s Incorporated (incorporated by reference from Exhibit 3 of our Current Report on Form 8-K, filed on August 30, 2007, File No. 001-32227)
4.1 Specimen Stock Certificate (incorporated by reference from Exhibit 4.1 of our Registration Statement on Form S-1, filed on March 23, 2004, Registration No. 333-113835)
4.2 Registration Rights Agreement dated as of September 23, 2003, among Cabela’s Incorporated and the security holders named therein (incorporated by reference from Exhibit 4.2 of our Registration Statement on Form S-1, filed on March 23, 2004, Registration No. 333-113835)
4.3 Form of 7.2% Senior Note, Series 2008-A, due January 16, 2018 (incorporated by reference from Exhibit 4.1 of our Current Report on Form 8-K, filed on January 22, 2008, File No. 001-32227)
4.4
Form of 6.08% Senior Note, Series 2007-A, due June 15, 2007 (incorporated by reference from Exhibit 4.2 of our Current Report on Form 8-K, filed on June 20, 2007, File No. 001-32227)
4.5 Form of 5.99% Senior Note, Series 2006-A, due February 27, 2016 (incorporated by reference from Exhibit 4.7 of our Current Report on Form 8-K, filed on June 20, 2007, File No. 001-32227)
4.6 Form of 4.95% Senior Note due September 2009 (incorporated by reference from Exhibit 4.8 of our Current Report on Form 8-K, filed on June 20, 2007, File No. 001-32227)
Job TiTle Cabelas 10K Revision 9 seRial DaTe / Time Tuesday, March 11, 2008 /1:07 AM Job numbeR 159962 Type Current page no. 88 opeRaToR PM3
88
<12345678>
4.7 Form of 9.19% Senior Note, Series C, due January 2010 (incorporated by reference from Exhibit 4.9 of our Current Report on Form 8-K, filed on June 20, 2007, File No. 001-32227)
4.8 Note Purchase Agreements dated as of February 27, 2006, among Cabela’s Incorporated and various purchasers party thereto (incorporated by reference from Exhibit 4.2 of our Current Report on Form 8-K, filed on March 3, 2006, File No. 001-32227)
4.9 First Supplement to Note Purchase Agreements dated as of February 27, 2006, among Cabela’s Incorporated and various purchasers party thereto (incorporated by reference from Exhibit 4.1 of our Current Report on Form 8-K, filed on June 20, 2007, File No. 001-32227)
4.10 Second Supplement to Note Purchase Agreements dated as February 27, 2006, among Cabela’s Incorporated and various purchasers party thereto (incorporated by reference from Exhibit 4.2 of our Current Report on Form 8-K, filed on January 22, 2008, File No. 001-32227)
4.11 Amendment No. 1 to Note Purchase Agreements dated as of February 27, 2006, among Cabela’s Incorporated and various purchasers party thereto (incorporated by reference from Exhibit 4.4 of our Current Report on Form 8-K, filed on June 20, 2007, File No. 001-32227)
4.12 Note Purchase Agreements dated as of September 5, 2002, among Cabela’s Incorporated and various purchasers party thereto (incorporated by reference from Exhibit 4.7 of our Registration Statement on Form S-1, filed on March 23, 2004, Registration No. 333-113835)
4.13 First Amendment Agreement to Note Purchase Agreements dated as of September 5, 2002, among Cabela’s Incorporated and various purchasers party thereto (incorporated by reference from Exhibit 10 of our Quarterly Report of Form 10-Q, filed on November 4, 2005, File No. 001-32227)
4.14 Second Amendment Agreement to Note Purchase Agreements dated as of September 5, 2002, among Cabela’s Incorporated and various purchasers party thereto (incorporated by reference from Exhibit 4.3 of our Current Report on Form 8-K, filed on March 3, 2006, File No. 001-32227)
4.15 Third Amendment Agreement to Note Purchase Agreements dated as of September 5, 2002, among Cabela’s Incorporated and various purchasers party thereto (incorporated by reference from Exhibit 4.5 of our Current Report on Form 8-K, filed on June 20, 2007, File No. 001-32227)
4.16 Note Agreements dated as of January 1, 1995, among Cabela’s Incorporated and various purchasers party thereto (incorporated by reference from Exhibit 4.8 of our Registration Statement on Form S-1, filed on March 23, 2004, Registration No. 333-113835)
4.17 Amendment No. 1 to Note Agreements dated as of January 1, 1995, among Cabela’s Incorporated and various purchasers party thereto (incorporated by reference from Exhibit 4.9 of our Registration Statement on Form S-1, filed on March 23, 2004, Registration No. 333-113835)
4.18 Amendment No. 2 to Note Agreements dated as of January 1, 1995, among Cabela’s Incorporated and various purchasers party thereto (incorporated by reference from Exhibit 4.10 of our Registration Statement on Form S-1, filed on March 23, 2004, Registration No. 333-113835)
4.19 Amendment No. 3 to Note Agreements dated as of January 1, 1995, among Cabela’s Incorporated and various purchasers party thereto (incorporated by reference from Exhibit 4.11 of our Registration Statement on Form S-1, filed on March 23, 2004, Registration No. 333-113835)
4.20 Amendment No. 4 to Note Agreements dated as of January 1, 1995, among Cabela’s Incorporated and various purchasers party thereto (incorporated by reference from Exhibit 4.12 of our Registration Statement on Form S-1, filed on March 23, 2004, Registration No. 333-113835)
4.21 Amendment No. 5 to Note Agreements dated as of January 1, 1995, among Cabela’s Incorporated and various purchasers party thereto (incorporated by reference from Exhibit 4.13 of our Registration Statement on Form S-1, filed on March 23, 2004, Registration No. 333-113835)

Job TiTle Cabelas 10K Revision 9 seRial DaTe / Time Tuesday, March 11, 2008 /1:07 AM Job numbeR 159962 Type Current page no. 89 opeRaToR PM3
89
<12345678>
4.22 Amendment No. 6 to Note Agreements dated as of January 1, 1995, among Cabela’s Incorporated and various purchasers party thereto (incorporated by reference from Exhibit 4.4 of our Current Report on Form 8-K, filed on March 3, 2006, File No. 001-32227)
4.23 Amendment No. 7 to Note Agreements dated as of January 1, 1995, among Cabela’s Incorporated and various purchasers party thereto (incorporated by reference from Exhibit 4.6 of our Current Report on Form 8-K, filed on June 20, 2007, File No. 001-32227)
10.1 Executive Employment Agreement dated as of January 4, 2004, between Cabela’s Incorporated and Richard N. Cabela (incorporated by reference from Exhibit 10.1 of our Registration Statement on Form S-1, filed on March 23, 2004, Registration No. 333-113835)*
10.2 Addendum to Executive Employment Agreement dated as of January 4, 2004, between Cabela’s Incorporated and Richard N. Cabela (incorporated by reference from Exhibit 10.1 of our Quarterly Report of Form 10-Q, filed on May 12, 2005, File No. 001-32227)*
10.3 Executive Employment Agreement dated as of January 4, 2004, between Cabela’s Incorporated and James W. Cabela (incorporated by reference from Exhibit 10.2 of our Registration Statement on Form S-1, filed on March 23, 2004, Registration No. 333-113835)*
10.4 Addendum to Executive Employment Agreement dated as of January 4, 2004, between Cabela’s Incorporated and James W. Cabela (incorporated by reference from Exhibit 10.2 of our Quarterly Report of Form 10-Q, filed on May 12, 2005, File No. 001-32227)*
10.5 Employee Lease Agreement dated as of January 1, 2005, between Cabela’s Incorporated and Mudhead Enterprises, LLC (incorporated by reference from Exhibit 10.5 of our Quarterly Report on Form 10-Q, filed on May 12, 2005, File No. 001-32227)
10.6 1997 Stock Option Plan (incorporated by reference from Exhibit 10.6 of our Registration Statement on Form S-1, filed on March 23, 2004, Registration No. 333-113835)*
10.7
First Amendment to 1997 Stock Option Plan (incorporated by reference from Exhibit 10.7 of our Registration Statement on Form S-1, filed on March 23, 2004, Registration No. 333-113835)*
10.8 Second Amendment to 1997 Stock Option Plan (incorporated by reference from Exhibit 10.8 of our Registration Statement on Form S-1, filed on March 23, 2004, Registration No. 333-113835)*
10.9 Third Amendment to 1997 Stock Option Plan (incorporated by reference from Exhibit 10.9 of our Registration Statement on Form S-1, filed on March 23, 2004, Registration No. 333-113835)*
10.10 Fourth Amendment to 1997 Stock Option Plan (incorporated by reference from Exhibit 10.9.1 of our Registration Statement on Form S-1, filed on March 23, 2004, Registration No. 333-113835)*
10.11 Fifth Amendment to 1997 Stock Option Plan (incorporated by reference from Exhibit 10 of our Quarterly Report of Form 10-Q, filed on August 6, 2007, File No. 001-32227)*
10.12 Form of 1997 Employee Stock Option Agreement (incorporated by reference from Exhibit 10.10 of our Registration Statement on Form S-1, filed on March 23, 2004, Registration No. 333-113835)*
10.13 Form of Employee Stock Purchase Agreement (incorporated by reference from Exhibit 10.11 of our Registration Statement on Form S-1, filed on March 23, 2004, Registration No. 333-113835)*
10.14 2004 Stock Plan (as amended and restated effective May 15, 2007) (incorporated by reference from Exhibit 10 of our Current Report on Form 8-K, filed on May 21, 2007, File No. 001-32227)*
10.15 Form of 2004 Stock Plan Employee Stock Option Agreement (incorporated by reference from Exhibit 10.13 of our Registration Statement on Form S-1, filed on March 23, 2004, Registration No. 333-113835)*
10.16 Form of 2004 Stock Plan Employee Stock Option Agreement (2006) (incorporated by reference from Exhibit 10.1 of our Current Report on Form 8-K, filed on May 15, 2006, File No. 001-32227)*
Job TiTle Cabelas 10K Revision 9 seRial DaTe / Time Tuesday, March 11, 2008 /1:07 AM Job numbeR 159962 Type Current page no. 90 opeRaToR PM3
90
<12345678>
10.17 Form of 2004 Stock Plan Non-Employee Director Stock Option Agreement (2006) (incorporated by reference from Exhibit 10.2 of our Current Report on Form 8-K, filed on May 15, 2006, File No. 001-32227)*
10.18 2004 Employee Stock Purchase Plan (incorporated by reference from Exhibit 10.14 of our Registration Statement on Form S-1, filed on March 23, 2004, Registration No. 333-113835)*
10.19 Second Amended and Restated Credit Agreement dated as of July 15, 2005, among Cabela’s Incorporated, various lenders party thereto, and U.S. Bank National Association, as Administrative Agent (incorporated by reference from Exhibit 10 of our Current Report on Form 8-K, filed on July 15, 2005, File No. 001-32227)
10.20 Joinder Agreement made by Cabela’s Retail IL, Inc., to Second Amended and Restated Credit Agreement dated as of July 15, 2005, among Cabela’s Incorporated, various lenders party thereto, and U.S. Bank National Association, as Administrative Agent (incorporated by reference from Exhibit 10.2 of our Current Report on Form 8-K, filed on June 20, 2007, File No. 001-32227)
10.21 First Amendment to Second Amended and Restated Credit Agreement dated as of July 15, 2005, among Cabela’s Incorporated, various lenders party thereto, and U.S. Bank National Association, as Administrative Agent (incorporated by reference from Exhibit 10 of our Quarterly Report of Form 10-Q, filed on November 5, 2007, File No. 001-32227)
10.22 Fourth Amended and Restated Intercreditor Agreement dated as of June 15, 2007, among Cabela’s Incorporated, various noteholders party thereto, various lenders party thereto, and U.S. Bank National Association, as Collateral Agent (incorporated by reference from Exhibit 10.1 of our Current Report on Form 8-K, filed on June 20, 2007, File No. 001-32227)
10.23 Promissory Note dated October 22, 2007, among Cabela’s Incorporated and U.S. Bank National Association (incorporated by reference from Exhibit 10 of our Current Report on Form 8-K, filed on October 26, 2007, File No. 001-32227)
10.24 Form of Indemnification Agreement (incorporated by reference from Exhibit 10.18 of our Registration Statement on Form S-1, filed on March 23, 2004, Registration No. 333-113835)*
10.25 Form of Management Change of Control Severance Agreement (incorporated by reference from Exhibit 10.19 of our Registration Statement on Form S-1, filed on March 23, 2004, Registration No. 333-113835)*
10.26 Amended and Restated Management Change of Control Severance Agreement dated May 9, 2006, between Cabela’s Incorporated and Joseph M. Friebe (incorporated by reference from Exhibit 10.3 of our Current Report on Form 8-K, filed on May 15, 2006, File No. 001-32227)*
10.27 Restated Bonus Plan (incorporated by reference from Exhibit 10.20 of our Registration Statement on Form S-1, filed on March 23, 2004, Registration No. 333-113835)*
10.28 Cabela’s Incorporated Third Amended and Restated Deferred Compensation Plan (incorporated by reference from Exhibit 10.1 of our Current Report on Form 8-K, filed on March 1, 2005, File No. 001-32227)*
10.29 First Amendment of the Cabela’s Incorporated Third Amended and Restated Deferred Compensation Plan (incorporated by reference from Exhibit 10.1 of our Current Report on Form 8-K, filed on March 1, 2005, File No. 001-32227)*
10.30 Second Amendment of the Cabela’s Incorporated Third Amended and Restated Deferred Compensation Plan (incorporated by reference from Exhibit 10.28 of our Annual Report on Form 10-K, filed on February 28, 2007, File No. 001-32227)*
10.31 Summary of Non-Employee Director Compensation*
10.32 Summary of Named Executive Officer Compensation*

Job TiTle Cabelas 10K Revision 9 seRial DaTe / Time Tuesday, March 11, 2008 /1:07 AM Job numbeR 159962 Type Current page no. 91 opeRaToR PM3
91
<12345678>
10.33 Form of Confidentiality and Noncompetition Agreement (executed by Dennis Highby, Patrick A. Snyder, Michael Callahan, Brian J. Linneman, and Charles Baldwin) (incorporated by reference from Exhibit 10.3 of our Quarterly Report of Form 10-Q, filed on May 12, 2005, File No. 001-32227)*
10.34 Form of Confidentiality and Noncompetition Agreement – World’s Foremost Bank (executed by David A. Roehr and Ralph Castner effective April 14, 2005) (incorporated by reference from Exhibit 10.4 of our Quarterly Report of Form 10-Q, filed on May 12, 2005, File No. 001-32227)*
10.35 Retirement and General Release Agreement dated January 30, 2006, between Cabela’s Incorporated and David A. Roehr (incorporated by reference from Exhibit 10 of our Current Report of Form 8-K/A, filed on February 1, 2006, File No. 001-32227)*
10.36 Amended and Restated Lease Agreement with Option to Purchase dated April 26, 2005, between Ohio County Development Authority and Cabela’s Wholesale, Inc. (incorporated by reference from Exhibit 10.29 of our Annual Report of Form 10-K, filed on March 1, 2006, File No. 001-32227)
10.37 Performance Bonus Plan (incorporated by reference from Exhibit 10 of our Current Report on Form 8-K, filed February 19, 2007, File No. 001-32227)*
18 Letter re Change in Accounting Principle (incorporated by reference from Exhibit 18 of our Quarterly Report of Form 10-Q, filed on May 4, 2007, File No. 001-32227)
21.1 Subsidiaries of Cabela’s Incorporated
23.1 Consent of Deloitte & Touche LLP
24.1 Powers of Attorney
* Indicates management contract or compensatory plan or arrangement required to be filed as exhibits pursuant to Item 15(b) of this report.
(c) Financial Statement Schedules. See Item 15(a) above.

Job TiTle Cabelas 10K Revision 9 seRial DaTe / Time Tuesday, March 11, 2008 /1:07 AM Job numbeR 159962 Type Current page no. 92 opeRaToR PM3
92
<12345678>
SIGNATURES
Pursuant to the requirements of Section 13 or 15(d) of the Securities Exchange Act of 1934, the registrant has duly caused this report to be signed on its behalf by the undersigned, thereunto duly authorized.
CABELA’S INCORPORATED
Dated: February 26, 2008 By: /s/ Dennis Highby Dennis Highby President and Chief Executive Officer
Pursuant to the requirements of the Securities Exchange Act of 1934, this report has been signed below by the following persons on behalf of the registrant and in the capacities and on the dates indicated.
Signature Title Date
/s/ Dennis Highby President, Chief Executive Officer, and Director (Principal Executive Officer)
February 26, 2008Dennis Highby
/s/ Ralph W. Castner Vice President and Chief Financial Officer (Principal Financial Officer and Principal Accounting Officer)
February 26, 2008Ralph W. Castner
* Chairman of the Board and Director February 26, 2008Richard N. Cabela
* Vice-Chairman of the Board and Director February 26, 2008James W. Cabela
* Director February 26, 2008Theodore M. Armstrong
* Director February 26, 2008John H. Edmondson
* Director February 26, 2008John Gottschalk
* Director February 26, 2008Reuben Mark
* Director February 26, 2008Michael R. McCarthy
* Director February 26, 2008Stephen P. Murray
* By: /s/ Ralph W. Castner Ralph W. Castner Attorney-in-fact February 26, 2008

Job TiTle Cabelas 10K Revision 9 seRial DaTe / Time Tuesday, March 11, 2008 /1:07 AM Job numbeR 159962 Type Current page no. 93 opeRaToR PM3
93
<12345678>
Exhibit 31.1
CERTIFICATION
I, Dennis Highby, certify that:
1. I have reviewed this annual report on Form 10-K of Cabela’s Incorporated;
2. Based on my knowledge, this report does not contain any untrue statement of material fact or omit to state a material fact necessary to make the statements made, in light of the circumstances under which such statements were made, not misleading with respect to the period covered by this report;
3. Based on my knowledge, the financial statements, and other financial information included in this report, fairly present in all material respects the financial condition, results of operations and cash flows of the registrant as of, and for, the periods presented in this report;
4. The registrant’s other certifying officer and I are responsible for establishing and maintaining disclosure controls and procedures (as defined in Exchange Act Rules 13a-15(e) and 15d-15(e)) and internal control over financial reporting (as defined in Exchange Act Rules 13a-15(f) and 15d-15(f)) for the registrant and have:
a. Designed such disclosure controls and procedures, or caused such disclosure controls and procedures to be designed under our supervision, to ensure that material information relating to the registrant, including its consolidated subsidiaries, is made known to us by others within those entities, particularly during the period in which this report is being prepared;
b. Designed such internal control over financial reporting, or caused such internal control over financial reporting to be designed under our supervision, to provide reasonable assurance regarding the reliability of financial reporting and the preparation of financial statements for external purposes in accordance with generally accepted accounting principles;
c. Evaluated the effectiveness of the registrant’s disclosure controls and procedures and presented in this report our conclusions about the effectiveness of the disclosure controls and procedures, as of the end of the period covered by this report based on such evaluation; and
d. Disclosed in this report any change in the registrant’s internal control over financial reporting that occurred during the registrant’s most recent fiscal quarter (the registrant’s fourth fiscal quarter in the case of an annual report) that has materially affected, or is reasonably likely to materially affect, the registrant’s internal control over financial reporting; and
5. The registrant’s other certifying officer and I have disclosed, based on our most recent evaluation of internal control over financial reporting, to the registrant’s auditors and the audit committee of the registrant’s board of directors:
a. All significant deficiencies and material weaknesses in the design or operation of internal control over financial reporting which are reasonably likely to adversely affect the registrant’s ability to record, process, summarize and report financial information; and
b. Any fraud, whether or not material, that involves management or other employees who have a significant role in the registrant’s internal control over financial reporting.
Date: February 26, 2008
/s/ Dennis Highby Dennis Highby President and Chief Executive Officer

Job TiTle Cabelas 10K Revision 9 seRial DaTe / Time Tuesday, March 11, 2008 /1:07 AM Job numbeR 159962 Type Current page no. 94 opeRaToR PM3
94
<12345678>
Exhibit 31.2
CERTIFICATION
I, Ralph W. Castner, certify that:
1. I have reviewed this annual report on Form 10-K of Cabela’s Incorporated;
2. Based on my knowledge, this report does not contain any untrue statement of material fact or omit to state a material fact necessary to make the statements made, in light of the circumstances under which such statements were made, not misleading with respect to the period covered by this report;
3. Based on my knowledge, the financial statements, and other financial information included in this report, fairly present in all material respects the financial condition, results of operations and cash flows of the registrant as of, and for, the periods presented in this report;
4. The registrant’s other certifying officer and I are responsible for establishing and maintaining disclosure controls and procedures (as defined in Exchange Act Rules 13a-15(e) and 15d-15(e)) and internal control over financial reporting (as defined in Exchange Act Rules 13a-15(f) and 15d-15(f)) for the registrant and have:
a. Designed such disclosure controls and procedures, or caused such disclosure controls and procedures to be designed under our supervision, to ensure that material information relating to the registrant, including its consolidated subsidiaries, is made known to us by others within those entities, particularly during the period in which this report is being prepared;
b. Designed such internal control over financial reporting, or caused such internal control over financial reporting to be designed under our supervision, to provide reasonable assurance regarding the reliability of financial reporting and the preparation of financial statements for external purposes in accordance with generally accepted accounting principles;
c. Evaluated the effectiveness of the registrant’s disclosure controls and procedures and presented in this report our conclusions about the effectiveness of the disclosure controls and procedures, as of the end of the period covered by this report based on such evaluation; and
d. Disclosed in this report any change in the registrant’s internal control over financial reporting that occurred during the registrant’s most recent fiscal quarter (the registrant’s fourth fiscal quarter in the case of an annual report) that has materially affected, or is reasonably likely to materially affect, the registrant’s internal control over financial reporting; and
5. The registrant’s other certifying officer and I have disclosed, based on our most recent evaluation of internal control over financial reporting, to the registrant’s auditors and the audit committee of the registrant’s board of directors:
a. All significant deficiencies and material weaknesses in the design or operation of internal control over financial reporting which are reasonably likely to adversely affect the registrant’s ability to record, process, summarize and report financial information; and
b. Any fraud, whether or not material, that involves management or other employees who have a significant role in the registrant’s internal control over financial reporting.
Date: February 26, 2008
/s/ Ralph W. Castner Ralph W. Castner Vice President and Chief Financial Officer
Job TiTle Cabelas 10K Revision 9 seRial DaTe / Time Tuesday, March 11, 2008 /1:07 AM Job numbeR 159962 Type Current page no. 95 opeRaToR PM3
95
<12345678>
Exhibit 32.1
CERTIFICATIONSPURSUANT TO 18 U.S.C. SECTION 1350
In connection with the Annual Report of Cabela’s Incorporated (the “registrant”) on Form 10-K for the year ended December 29, 2007, as filed with the Securities and Exchange Commission on the date hereof (the “report”), each of the undersigned certifies, pursuant to 18 U.S.C. Section 1350, that to his knowledge:
(1) the report fully complies with the requirements of section 13(a) or 15(d) of the Securities Exchange Act of 1934 as amended; and
(2) the information contained in the report fairly presents, in all material respects, the financial condition and results of operations of the registrant.
Dated: February 26, 2008
/s/ Dennis Highby Dennis Highby President and Chief Executive Officer
/s/ Ralph W. Castner Ralph W. Castner Vice President and Chief Financial Officer

(This page intentionally left blank.)

(This page intentionally left blank.)

(This page intentionally left blank.)

Directors & Executive Officers
Board of Directors Executive Offi cersRichard N. CabelaChairman
Cabela’s Incorporated
James W. CabelaVice Chairman
Cabela’s Incorporated
Dennis HighbyPresident and Chief Executive Offi cer
Cabela’s Incorporated
Theodore M. ArmstrongRetired Chief Financial Offi cer
Angelica Corporation
John H. EdmondsonRetired Chief Executive Offi cer
West Marine, Inc.
John GottschalkChairman
Omaha World-Herald Company
Reuben MarkChairman
Colgate-Palmolive Company
Michael R. McCarthyChairman
McCarthy Group, LLC
Stephen P. MurrayPresident and Chief Executive Offi cer
CCMP Capital Advisors, LLC
Gerald E. MatzkeEmeritus Director
Partner
Matzke, Mattoon & Miller
Richard N. CabelaChairman
James W. CabelaVice Chairman
Dennis HighbyPresident and Chief Executive Offi cer
Patrick A. SnyderSenior Vice President of Merchandising,
Marketing and Retail Operations
Michael CallahanSenior Vice President of Business
Development and International Operations
Brian J. LinnemanSenior Vice President of
Global Supply Chain and Operations
Ralph W. CastnerVice President and Chief Financial Offi cer,
and Chairman of the Board of World’s
Foremost Bank
Joseph M. FriebeVice President, and President and Chief
Executive Offi cer of World’s Foremost Bank
Charles BaldwinVice President and
Chief Human Resources Offi cer
Corporate HeadquartersCabela’s IncorporatedOne Cabela DriveSidney, Nebraska 69160Telephone: (308)254-5505
Legal CounselKoley Jessen P.C., L.L.O.One Pacifi c Place1125 South 103 Street, Suite 800Omaha, Nebraska 68124
Independent Registered PublicAccounting FirmDeloitte & Touche LLPFirst National Tower1601 Dodge Street, Suite 3100Omaha, Nebraska 68102
Transfer Agent & RegistrarWells Fargo Shareowner ServicesP.O. Box 64874St. Paul, Minnesota 55164Telephone: (800)401-1957
Notice of Annual MeetingThe Annual Meeting of Shareholders will be held at 10:00 a.m. MT on Tuesday, May 13, 2008, at the Holiday Inn, 664 Chase Blvd., Sidney, Nebraska 69162Telephone: (308)254-2000
Investor Relations InquiriesQuestions and requests for information should be directed to Christopher Gay, Treasurer and Manager of Investor Relations, at (308)255-2905 or via e-mail at [email protected] or by visiting the Company’s Web site at www.cabelas.com.
Corporate Information

Cabela’s Incorporated
One Cabela Drive
Sidney, Nebraska 69160
Telephone: (308)254-5505
www.cabelas.com
NYSE:CAB