Embed Size (px)
Citation preview
Universal Compression Holdings, Inc.
Oppenheimer Equity Conference
Stephen A. SniderChairman, President and Chief Executive Officer
J. Michael AndersonSenior Vice President and Chief Financial Officer
August 9, 2007
Forward-Looking StatementsStatements about Universal Compression Holdings’ and Universal Compression Partners’ (collectively, the “Companies”)
outlook and all other statements in this presentation (and oral statements made regarding the subjects of this presentation) other than historical facts are forward-looking statements within the meaning of the Private Securities Litigation Reform Act of 1995. These forward-looking statements rely on a number of assumptions concerning future events and are subject to a number of uncertainties and factors, many of which are outside the Companies’ control, which could cause the Companies’actual results to differ materially from such statements. Forward-looking information includes, but is not limited to, statements regarding: the ability of Universal Compression Holdings and Hanover Compressor Company to complete their proposed merger; the belief that the merger will allow the Companies to realize anticipated synergies, will enhance value for stockholders, will enhance future growth of Universal Compression Partners and will close under the anticipated timing; the suggestion that fleet will continue to grow in large horsepower range, that fleet utilization will remain stable and that such stability will create recurring cash flow; the suggestion that Universal Compression Holdings’ efforts to address recent cost pressures in the domestic contract compression segment will be successful; the Companies’ improving credit ratios and planned refinancing strategy; market, industry and the Companies’ financial trends; intent to continue to expand aftermarket service base through acquisitions in international markets; Universal Compression Holdings’ intent to offer the reminder of its domestic contract compression fleet to Universal Compression Partners and intent that Universal Compression Partners will be its primary growth vehicle for domestic contract compression; and the expectation that Universal Compression Partners will seek approval to raise its cash distributions for the third quarter of 2007 by approximately $0.0375 to $0.05 per unit, or approximately $0.15 to $0.20 per unit on an annualized basis. While the Companies believe that the assumptions concerning future events are reasonable, it cautions that there are inherent difficulties in predicting certain important factors that could impact the future performance or results of their or Exterran’s business. Among the factors that could cause results to differ materially from those indicated by such forward-looking statements are: the conditions in the oil and gas industry, including a sustained decrease in the level of supply or demand for natural gas and the impact on the price of natural gas; Universal Compression Holdings’ ability to timely and cost-effectively obtain components necessary to conduct our business;changes in safety and environmental regulations pertaining to the production and transportation of natural gas; as to each of the Companies, the performance of the other entity; failure to receive shareholder approval for the merger, whether Hanover’s or Universal Compression Holdings’; the failure to satisfy various other conditions to the closing of the merger contemplated by the merger agreement; and if the merger closes, the failure to realize anticipated synergies from it.
These forward-looking statements are also affected by the risk factors, forward-looking statements and challenges and uncertainties described in the Companies’ Annual Reports on Form 10-K for the year ended December 31, 2006 and those set forth from time to time in the Companies’ filings with the Securities and Exchange Commission (“SEC”), which are available through our website www.universalcompression.com. The Companies expressly disclaim any intention or obligation to revise or update any forward-looking statements whether as a result of new information, future events, or otherwise.
(i)
Additional InformationIn connection with the proposed merger of Universal Compression Holdings and Hanover Compressor Company, a registration statement of the new company, Exterran Holdings, Inc. (formerly Iliad Holdings, Inc.), which includes definitive proxy statements of Universal Compression Holdings and Hanover, a prospectus of Exterran and other materials, has been filed with the SEC. INVESTORS AND SECURITY HOLDERS ARE URGED TO CAREFULLY READ THE DEFINITIVE PROXY STATEMENT/PROSPECTUS BECAUSE IT CONTAINS IMPORTANT INFORMATION ABOUT UNIVERSAL, HANOVER, EXTERRAN HOLDINGS AND THE PROPOSED TRANSACTION. Investors and security holders may obtain a free copy of the definitive proxy statement/prospectus without charge, at the SEC’s web site at www.sec.gov, Universal Compression Holdings’ web site at www.universalcompression.com, and Hanover’s web site at www.hanover-co.com. Copies of the preliminary proxy statement/prospectus, the definitive proxy statement/prospectus and the SEC filings that are and will be incorporated by reference therein may also be obtained for free by directing a request to either Investor Relations,Universal Compression Holdings, Inc., 713-335-7000 or to Investor Relations, Hanover Compressor Company, 832-554-4856.
Participants in SolicitationUniversal Compression Holdings and Hanover and their respective directors, officers and certain other members of management may be deemed to be participants in the solicitation of proxies from their respective stockholders in respect of the merger. Information about these persons can be found in the definitive proxy statement/prospectus that has been filed with the SEC in connection with the proposed transaction.
(ii)
Company Overview• Leading global compression services company• Experienced and successful management team• Equity market cap of $2.2 billion* (NYSE: UCO)• Universal Compression Partners, L.P.
– Equity market cap of $630 million* (NASDAQ: UCLP)– IPO completed in October 2006– Acquisition of additional UCO assets completed in July
• Proposed merger with Hanover Compressor Company (NYSE: HC)
* As of August 7, 20071
Merger with Hanover Compressor Company
• Merger agreement announced on February 5, 2007
• Termination of Hart-Scott-Rodino waiting period announced on July 5th
• Respective shareholder meetings of Hanover and Universal scheduled for August 16th
• Expect transaction to close on or about August 20th
2
Merger Rationale• Will create a global leader in the natural gas
compression services and production and processing equipment– Post-merger name – Exterran Holdings, Inc.
(expected trading symbol NYSE: EXH)• Expected annual pre-tax cost savings of
approximately $50 million• Provides a larger pool of domestic contract
compression units that can be offered for sale to UCLP – Post-merger name – Exterran Partners, L.P.
(expected trading symbol NASDAQ: EXLP)
3
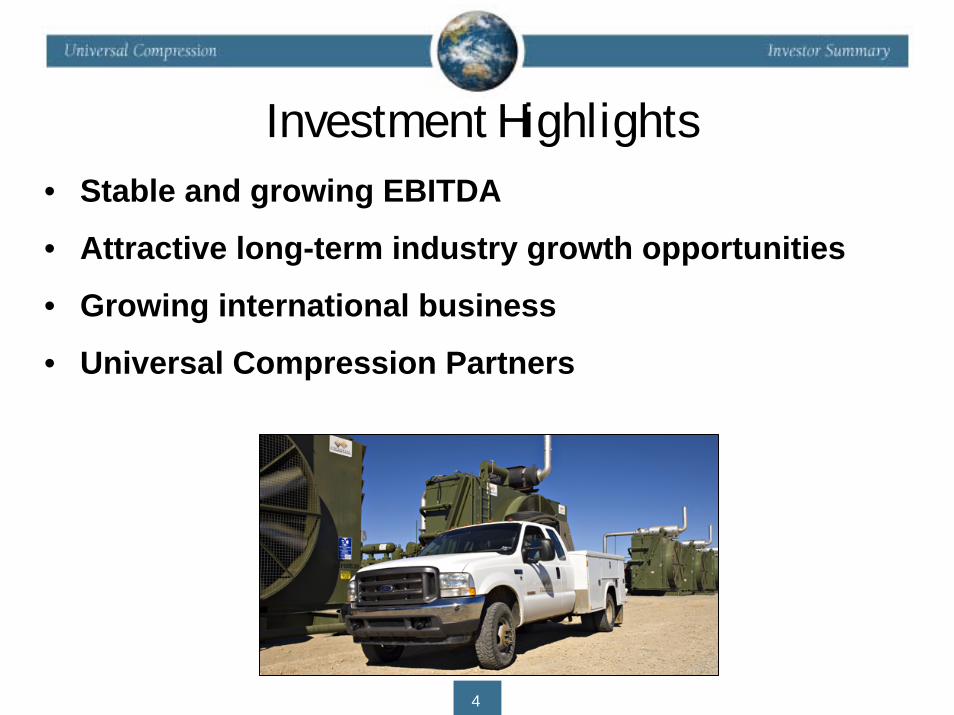
Investment Highlights• Stable and growing EBITDA
• Attractive long-term industry growth opportunities
• Growing international business
• Universal Compression Partners
4
Revenue Mix Gross Margin Mix
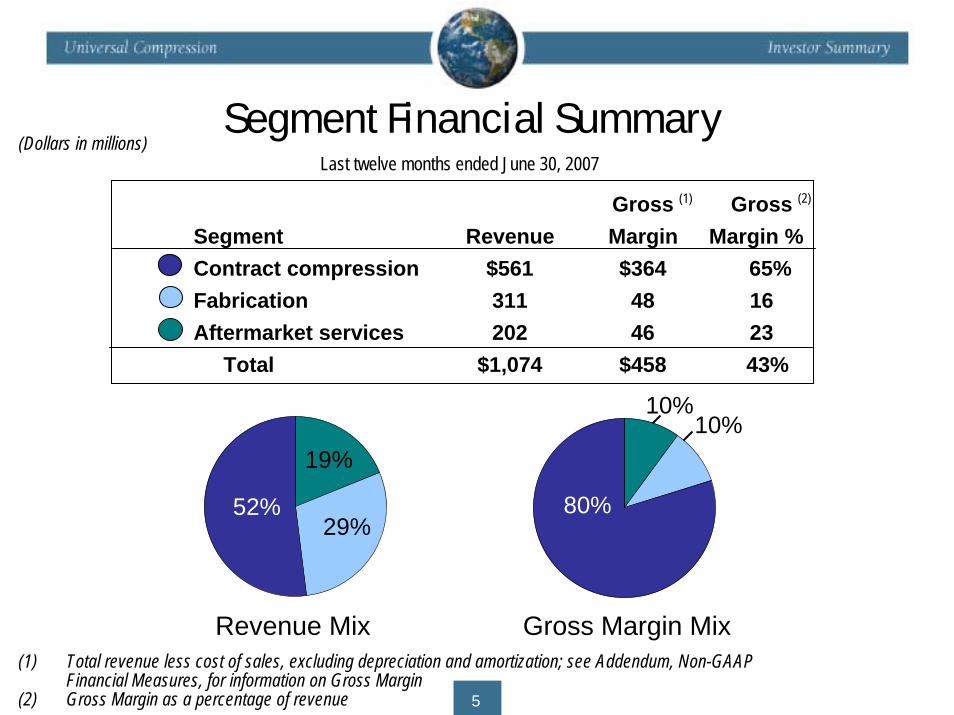
Segment Financial SummaryLast twelve months ended June 30, 2007
Gross GrossSegment Revenue Margin Margin %Contract compression $561 $364 65%Fabrication 311 48 16Aftermarket services 202 46 23
Total $1,074 $458 43%
(Dollars in millions)
52% 80%
19%
10%
29%
10%
(1) (2)
(1) Total revenue less cost of sales, excluding depreciation and amortization; see Addendum, Non-GAAP Financial Measures, for information on Gross Margin
(2) Gross Margin as a percentage of revenue 5
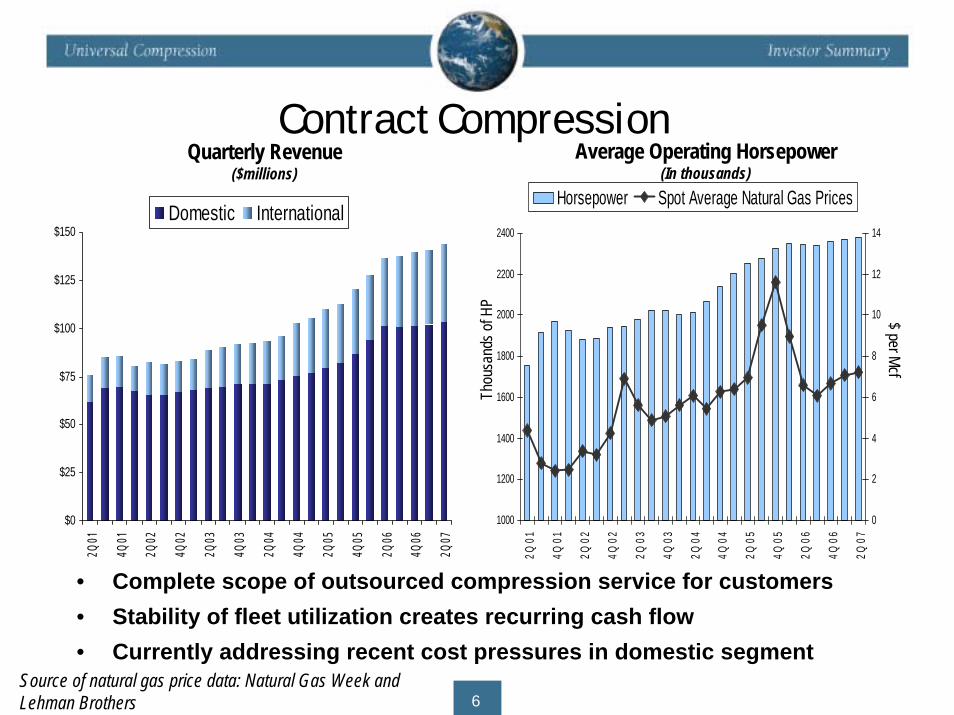
Contract Compression
$0
$25
$50
$75
$100
$125
$150
2Q01
4Q01
2Q02
4Q02
2Q03
4Q03
2Q04
4Q04
2Q05
4Q05
2Q06
4Q06
2Q07
Domestic International
1000
1200
1400
1600
1800
2000
2200
2400
2Q01
4Q01
2Q02
4Q02
2Q03
4Q03
2Q04
4Q04
2Q05
4Q05
2Q06
4Q06
2Q07
0
2
4
6
8
10
12
14
Horsepower Spot Average Natural Gas Prices
• Complete scope of outsourced compression service for customers• Stability of fleet utilization creates recurring cash flow• Currently addressing recent cost pressures in domestic segment
Quarterly Revenue($millions)
Thou
sand
s of H
P
$ per Mcf
Average Operating Horsepower(In thousands)
Source of natural gas price data: Natural Gas Week and Lehman Brothers 6
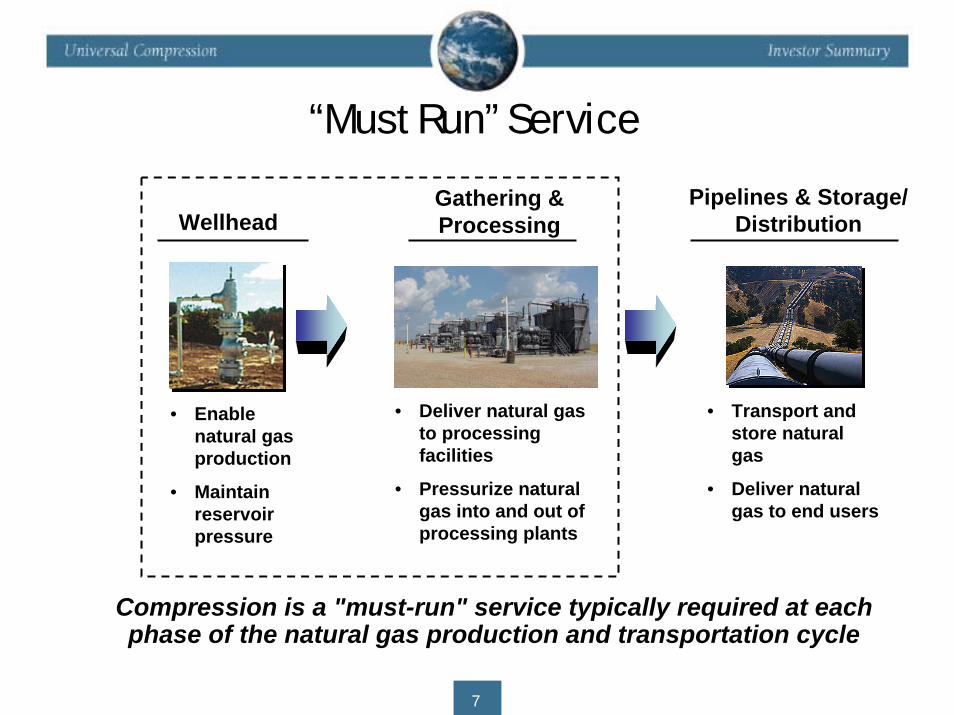
Compression is a "must-run" service typically required at each phase of the natural gas production and transportation cycle
• Enable natural gas production
• Maintain reservoir pressure
WellheadGathering & Processing
Pipelines & Storage/Distribution
• Deliver natural gas to processing facilities
• Pressurize natural gas into and out of processing plants
• Transport and store natural gas
• Deliver natural gas to end users
“Must Run” Service
7 12
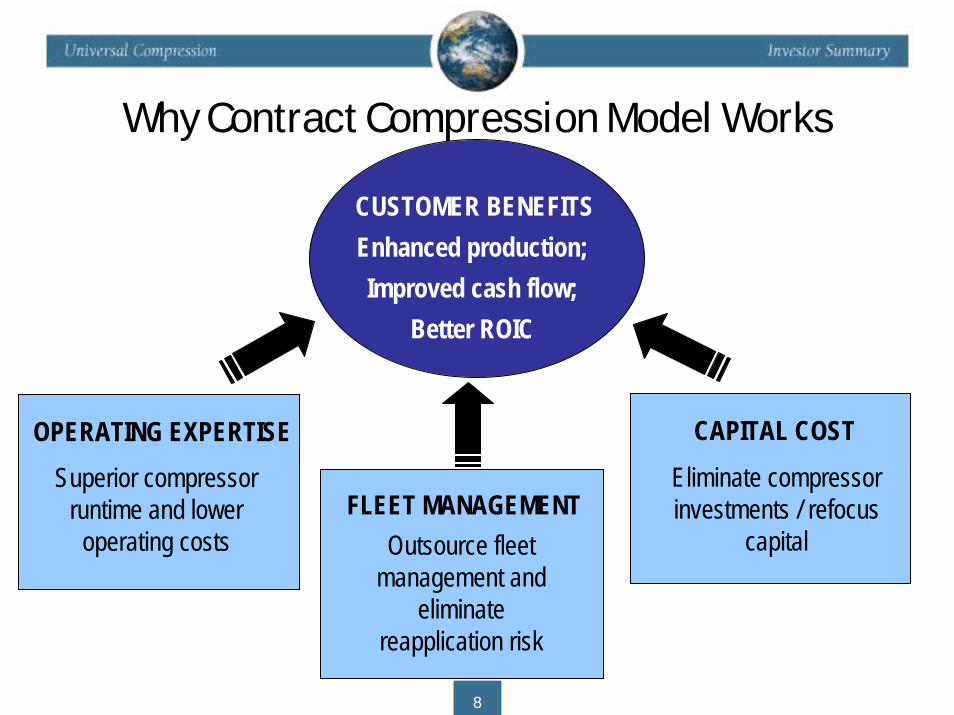
Why Contract Compression Model Works
CUSTOMER BENEFITSEnhanced production; Improved cash flow;
Better ROIC
CAPITAL COSTEliminate compressor investments / refocus
capital
OPERATING EXPERTISESuperior compressor
runtime and lower operating costs
FLEET MANAGEMENTOutsource fleet
management and eliminate
reapplication risk
8
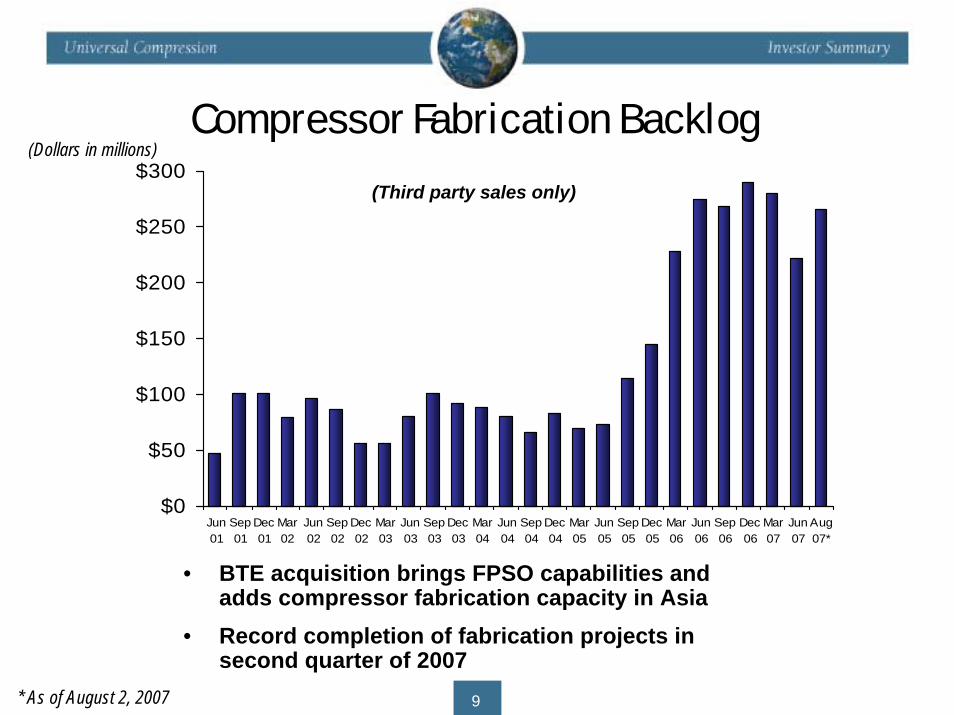
(Dollars in millions)
$0
$50
$100
$150
$200
$250
$300
Jun01
Sep01
Dec01
Mar02
Jun02
Sep02
Dec02
Mar03
Jun03
Sep03
Dec03
Mar04
Jun04
Sep04
Dec04
Mar05
Jun05
Sep05
Dec05
Mar06
Jun06
Sep06
Dec06
Mar07
Jun07
Aug07*
Compressor Fabrication Backlog
(Third party sales only)
• BTE acquisition brings FPSO capabilities and adds compressor fabrication capacity in Asia
• Record completion of fabrication projects in second quarter of 2007
* As of August 2, 2007 9
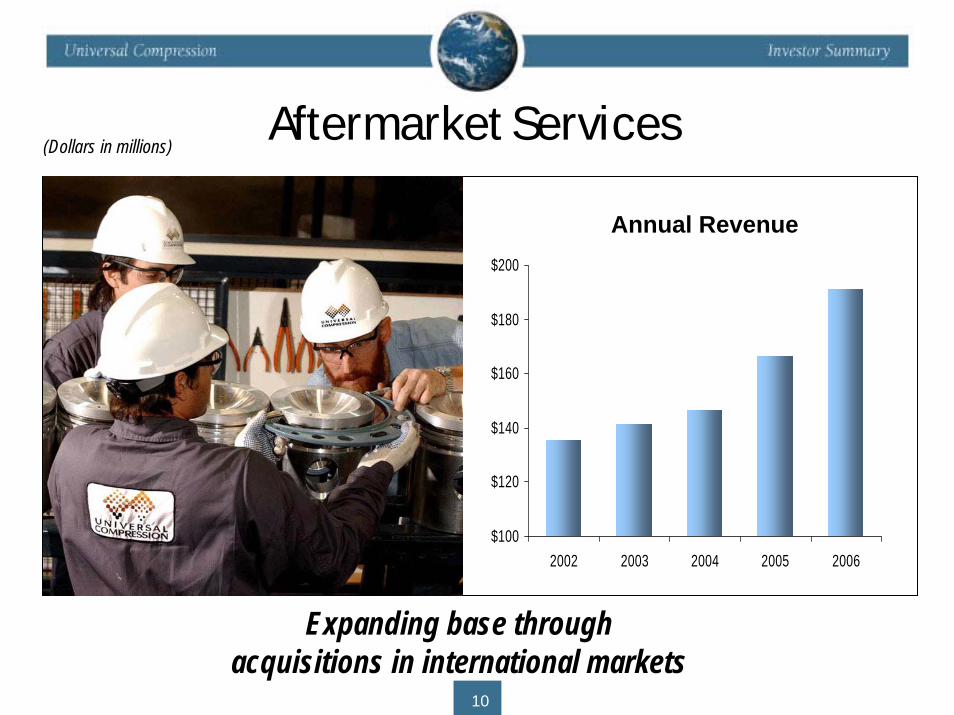
(Dollars in millions)Aftermarket Services
$100
$120
$140
$160
$180
$200
2002 2003 2004 2005 2006
Annual Revenue
Expanding base throughacquisitions in international markets
10
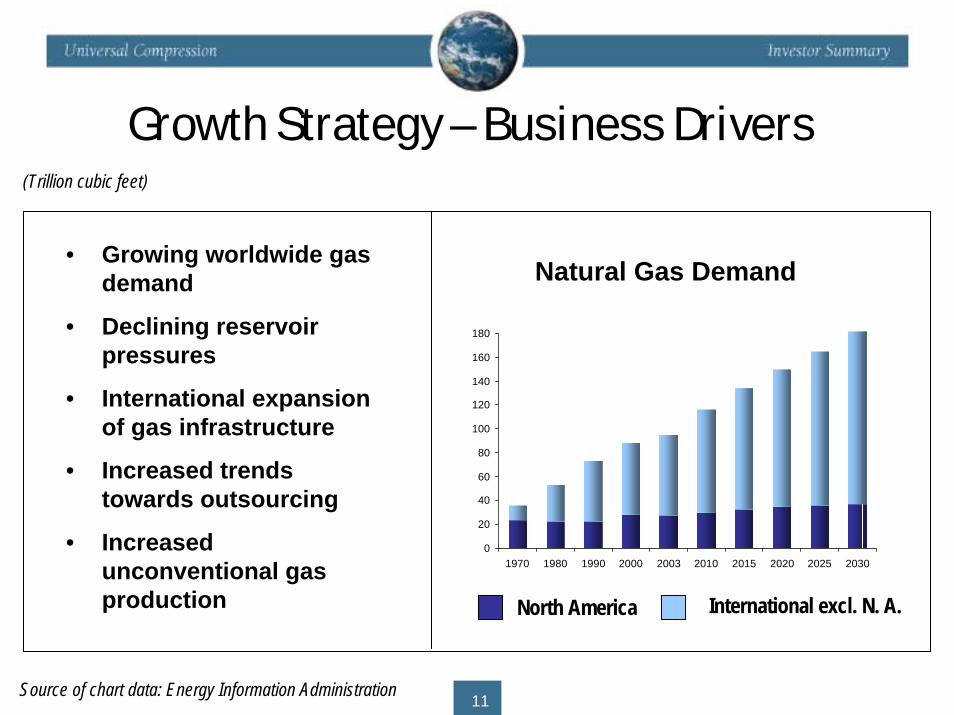
Growth Strategy – Business Drivers
• Growing worldwide gas demand
• Declining reservoir pressures
• International expansion of gas infrastructure
• Increased trends towards outsourcing
• Increased unconventional gas production
0
20
40
60
80
100
120
140
160
180
1970 1980 1990 2000 2003 2010 2015 2020 2025 2030
Natural Gas Demand
North America International excl. N. A.
(Trillion cubic feet)
Source of chart data: Energy Information Administration 11
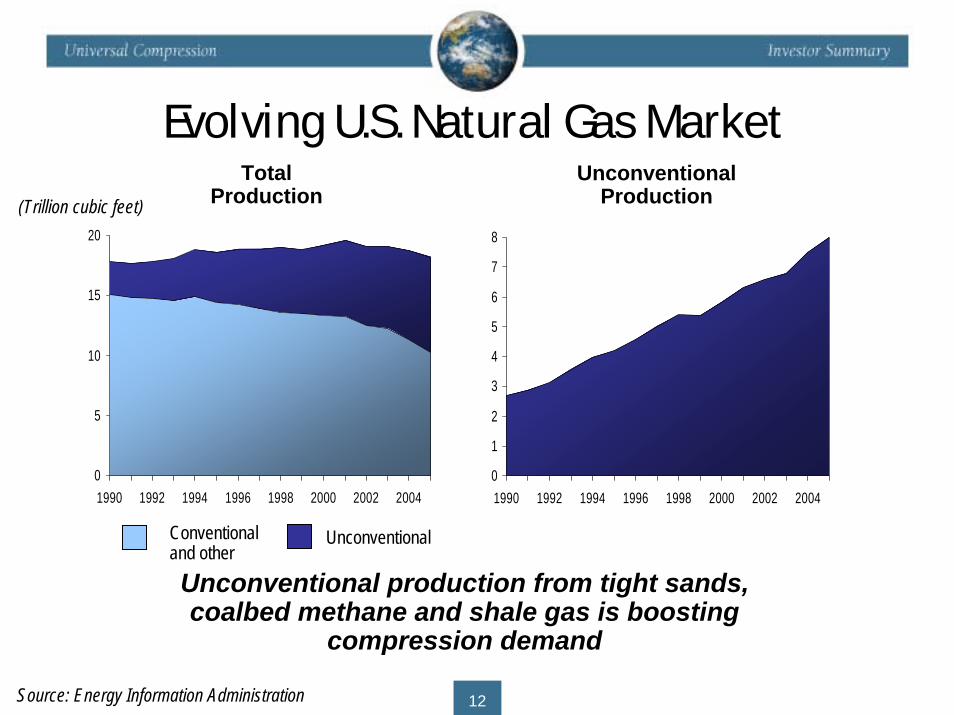
Evolving U.S. Natural Gas MarketTotal
Production
0
5
10
15
20
1990 1992 1994 1996 1998 2000 2002 20040
1
2
3
4
5
6
7
8
1990 1992 1994 1996 1998 2000 2002 2004
(Trillion cubic feet)
UnconventionalProduction
Conventionaland other
Unconventional
Unconventional production from tight sands, coalbed methane and shale gas is boosting
compression demand
Source: Energy Information Administration 12
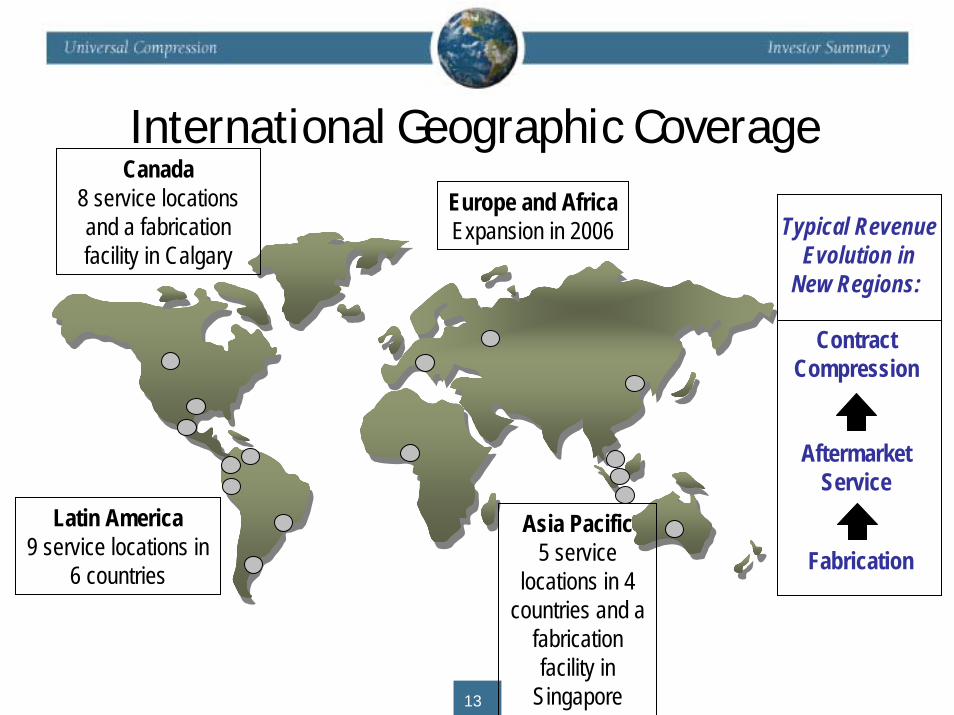
Canada8 service locations and a fabrication facility in Calgary
International Geographic Coverage
Asia Pacific5 service
locations in 4 countries and a
fabrication facility in
Singapore
Fabrication
AftermarketService
ContractCompression
Typical RevenueEvolution in
New Regions:
Europe and AfricaExpansion in 2006
Latin America9 service locations in
6 countries
13
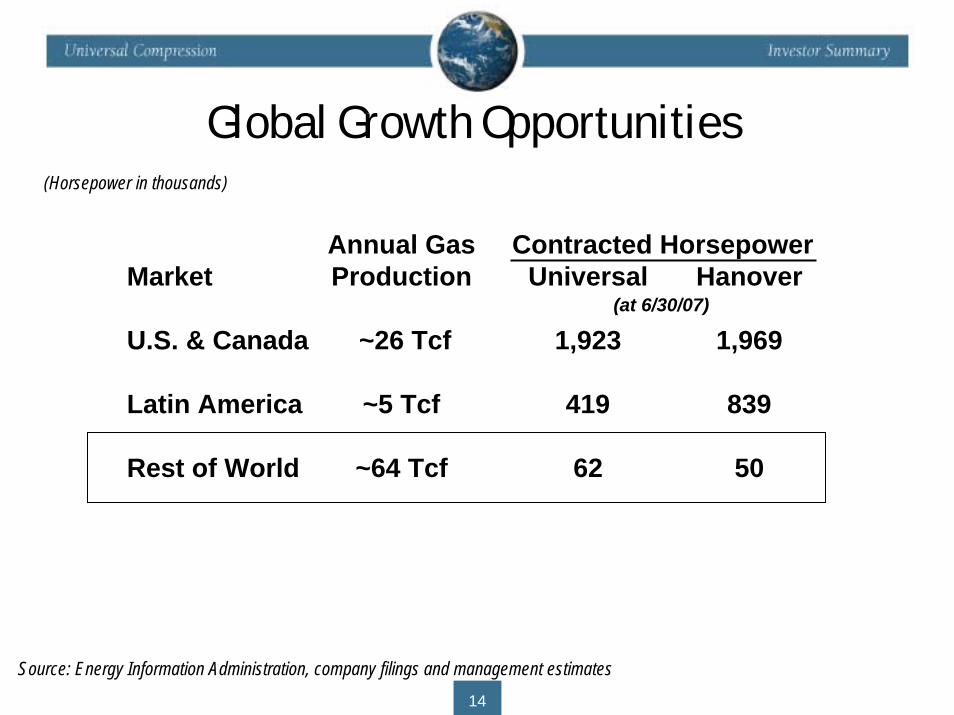
Global Growth Opportunities
Annual Gas Contracted Horsepower Market Production Universal Hanover
U.S. & Canada ~26 Tcf 1,923 1,969
Latin America ~5 Tcf 419 839
Rest of World ~64 Tcf 62 50
(Horsepower in thousands)
(at 6/30/07)
Source: Energy Information Administration, company filings and management estimates14
Financial Review
• Universal Compression Partners
• Strong financial results
• Stable and growing cash flow
• Attractive incremental returns
• Improved balance sheet and lower cost of debt
15
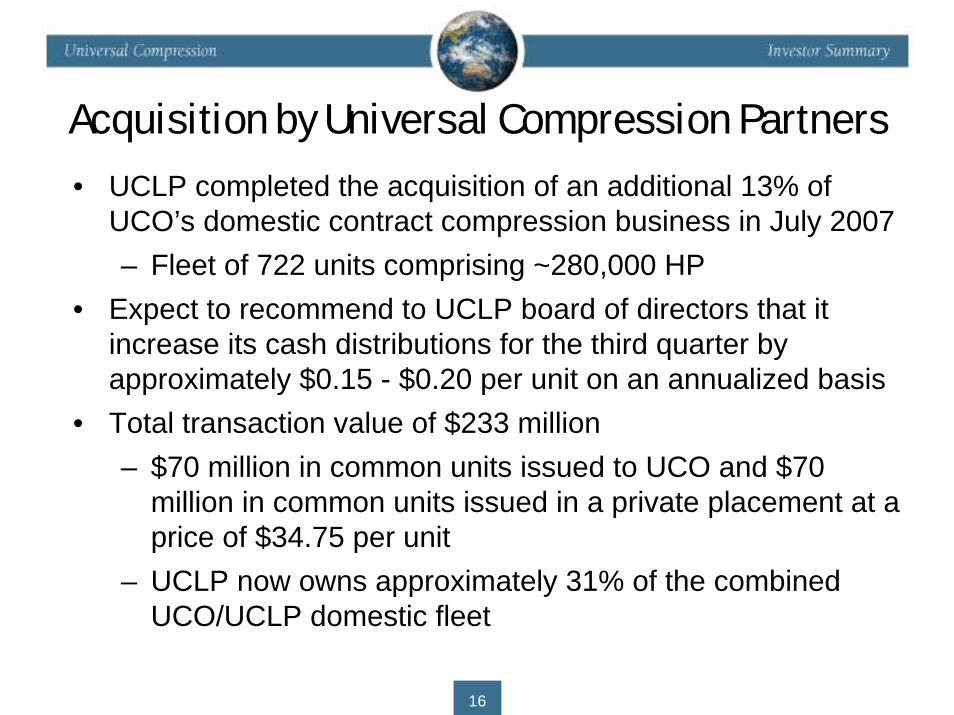
• UCLP completed the acquisition of an additional 13% of UCO’s domestic contract compression business in July 2007– Fleet of 722 units comprising ~280,000 HP
• Expect to recommend to UCLP board of directors that it increase its cash distributions for the third quarter by approximately $0.15 - $0.20 per unit on an annualized basis
• Total transaction value of $233 million– $70 million in common units issued to UCO and $70
million in common units issued in a private placement at a price of $34.75 per unit
– UCLP now owns approximately 31% of the combined UCO/UCLP domestic fleet
Acquisition by Universal Compression Partners
16 6

Cash Distributionsto LP and GP
Interests49% LP Interest2% GP Interest
Domestic CC(82% of Total
DCC Business)International CC Fabrication AMS
55% of LTM 6/30/07Gross Margin
25% of LTM 6/30/07Gross Margin
10% of LTM 6/30/07Gross Margin
10% of LTM 6/30/07Gross Margin
UCO intends to offer the remainder of its Domestic CC business to UCLP over time and for UCLP to be its
primary growth vehicle for the Domestic CC business(1) As of August 7, 2007(2) Includes 100% of Domestic CC business for LTM 6/30/07 (3) Pro forma for the July 2007 acquisition from UCO
Domestic CC(18% of Total
DCC Business)
(2)
Universal Compression Partners
17
Market Equity: (1) $2,224 MMDebt: 592 MMEnt. Value: $2,816 MM
Market Equity: (1) $630 MMDebt: 211 MMEnt. Value: $841 MM
UCO
UCLPDomestic CC(31% of Total
DCC Business)
At 6/30/07 Pro Forma(3)

UCLP Unit Price Performance
23
Current expected yield of 4.26% ** Based on unit price on August 7, 2007 and a pro forma cash distribution rate of $0.39375 per unit per complete quarter, or $1.575 per year, the mid-point of the expected range for the third quarter of 2007 in connection with the July 2007 acquisition from UCO 18
20
22
24
26
28
30
32
34
36
38
40
42
Oct-06 Nov-06 Dec-06 Jan-07 Feb-07 Mar-07 Apr-07 May-07 Jun-07 Jul-07
UC
LP U
nit P
rice
250
275
300
325
350
375
400
425
Alerian M
LP Index Value
UCLP Alerian MLP Index
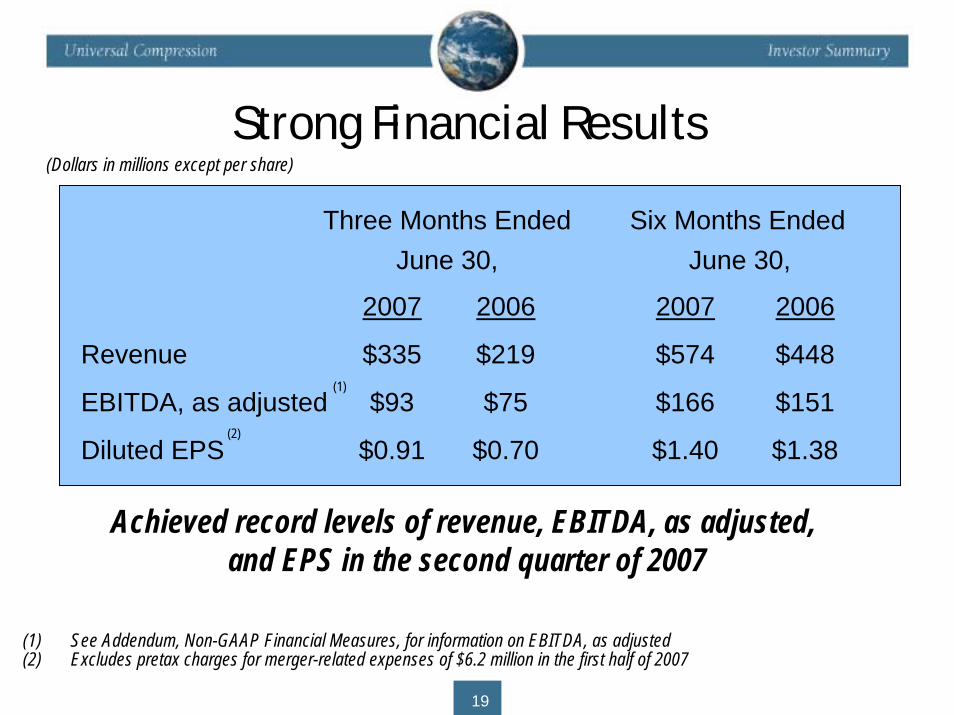
Strong Financial Results(Dollars in millions except per share)
(2)
(1)
Three Months Ended Six Months EndedJune 30, June 30,
2007 2006 2007 2006
Revenue $335 $219 $574 $448
EBITDA, as adjusted $93 $75 $166 $151
Diluted EPS $0.91 $0.70 $1.40 $1.38
Achieved record levels of revenue, EBITDA, as adjusted, and EPS in the second quarter of 2007
(1) See Addendum, Non-GAAP Financial Measures, for information on EBITDA, as adjusted(2) Excludes pretax charges for merger-related expenses of $6.2 million in the first half of 2007
19
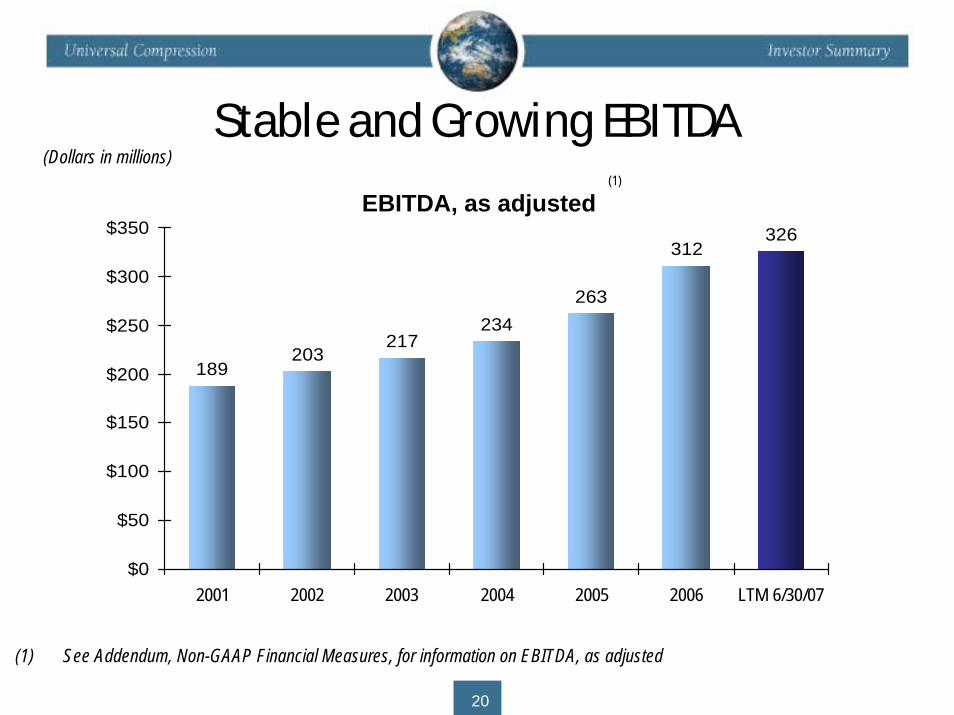
Stable and Growing EBITDA
189203
217234
263
312326
$0
$50
$100
$150
$200
$250
$300
$350
2001 2002 2003 2004 2005 2006 LTM 6/30/07
(Dollars in millions)
(1) See Addendum, Non-GAAP Financial Measures, for information on EBITDA, as adjusted
EBITDA, as adjusted(1)
20
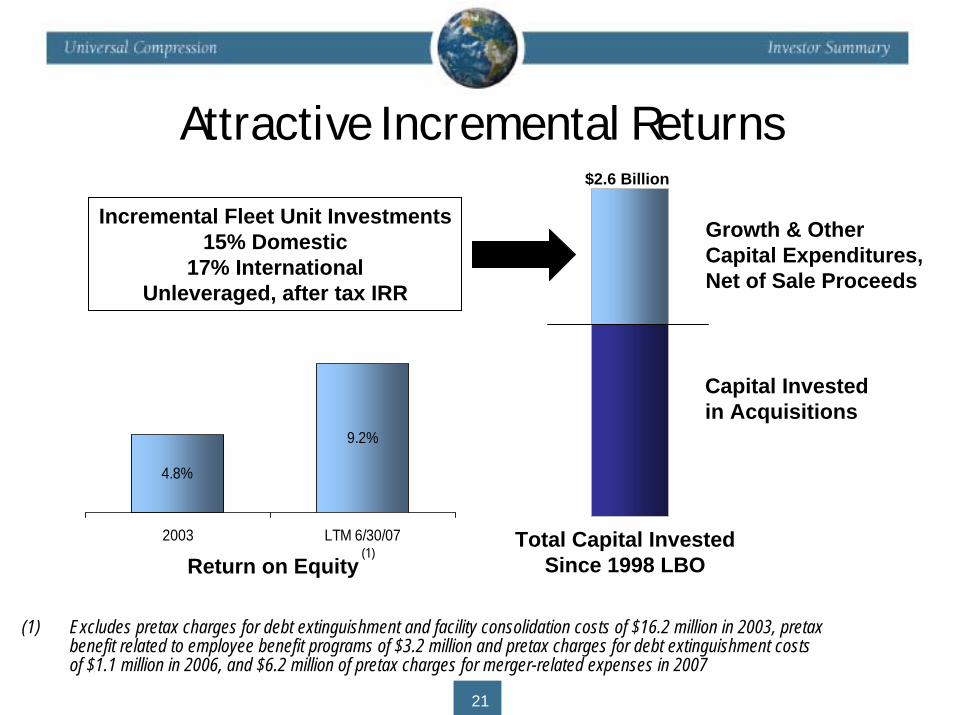
4.8%
9.2%
2003 LTM 6/30/07
Attractive Incremental Returns
Return on Equity
$2.6 Billion
Total Capital Invested Since 1998 LBO
Capital Investedin Acquisitions
Growth & OtherCapital Expenditures,Net of Sale Proceeds
Incremental Fleet Unit Investments15% Domestic
17% InternationalUnleveraged, after tax IRR
(1)
(1) Excludes pretax charges for debt extinguishment and facility consolidation costs of $16.2 million in 2003, pretax benefit related to employee benefit programs of $3.2 million and pretax charges for debt extinguishment costs of $1.1 million in 2006, and $6.2 million of pretax charges for merger-related expenses in 2007
21
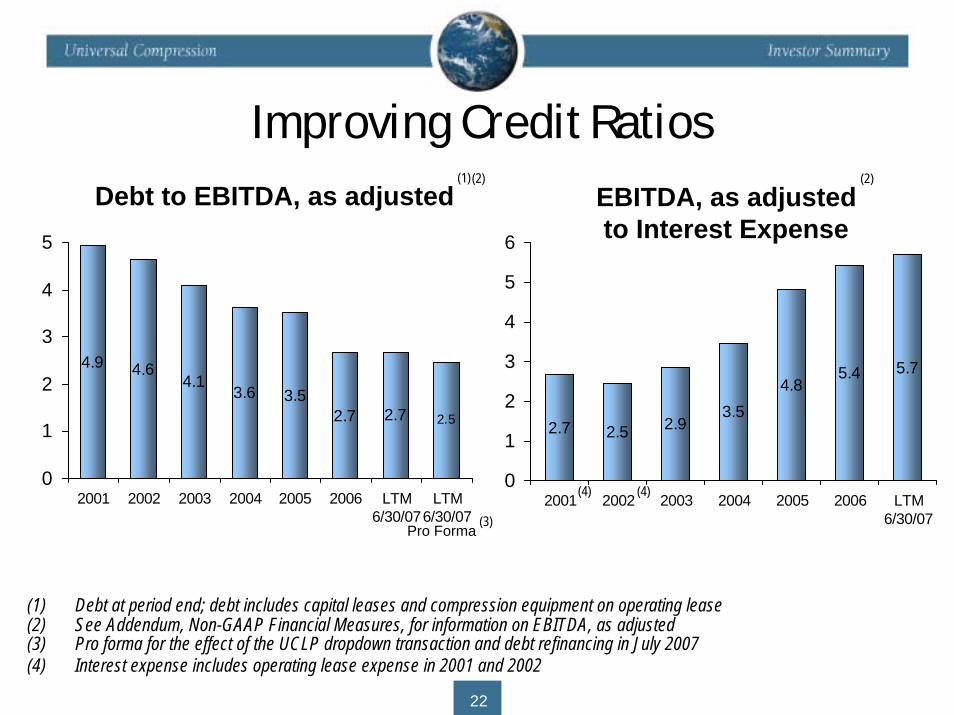
Improving Credit Ratios
(4)
4.9 4.64.1
3.62.7 2.7 2.5
3.5
0
1
2
3
4
5
2001 2002 2003 2004 2005 2006 LTM6/30/07
LTM6/30/07
Debt to EBITDA, as adjusted
(4)
2.7 2.5 2.93.5
5.4 5.74.8
0
1
2
3
4
5
6
2001 2002 2003 2004 2005 2006 LTM6/30/07
EBITDA, as adjustedto Interest Expense
(1)(2) (2)
Pro Forma(3)
(1) Debt at period end; debt includes capital leases and compression equipment on operating lease(2) See Addendum, Non-GAAP Financial Measures, for information on EBITDA, as adjusted(3) Pro forma for the effect of the UCLP dropdown transaction and debt refinancing in July 2007(4) Interest expense includes operating lease expense in 2001 and 2002
22
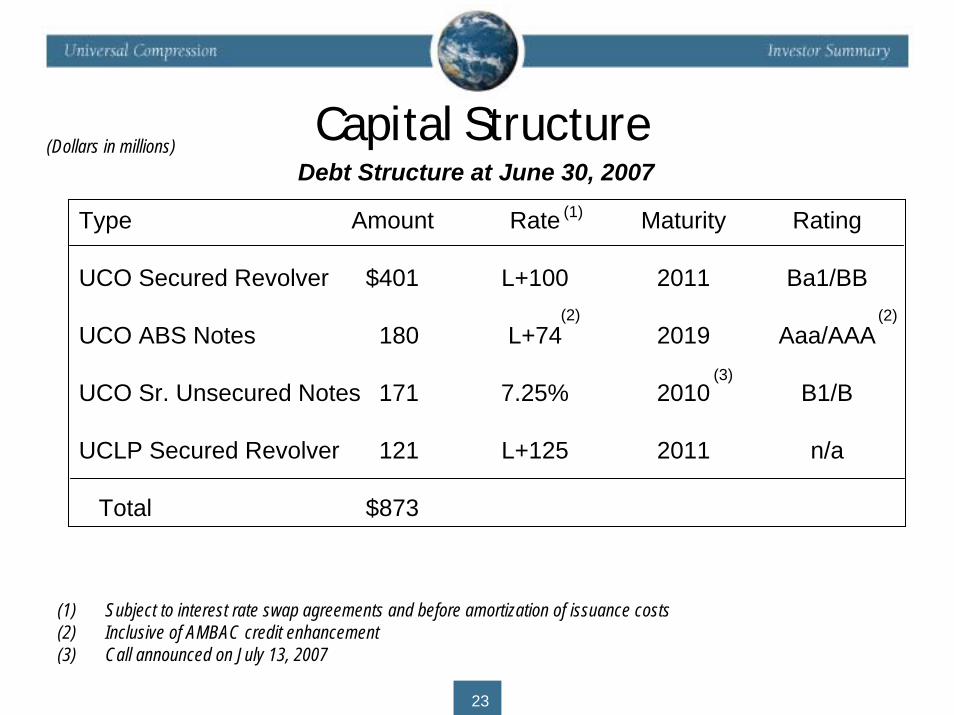
(Dollars in millions)Capital Structure
Type Amount Rate Maturity Rating
UCO Secured Revolver $401 L+100 2011 Ba1/BB
UCO ABS Notes 180 L+74 2019 Aaa/AAA
UCO Sr. Unsecured Notes 171 7.25% 2010 B1/B
UCLP Secured Revolver 121 L+125 2011 n/a
Total $873
(3)
Debt Structure at June 30, 2007
(2)(2)
(1)
(1) Subject to interest rate swap agreements and before amortization of issuance costs(2) Inclusive of AMBAC credit enhancement(3) Call announced on July 13, 2007
23
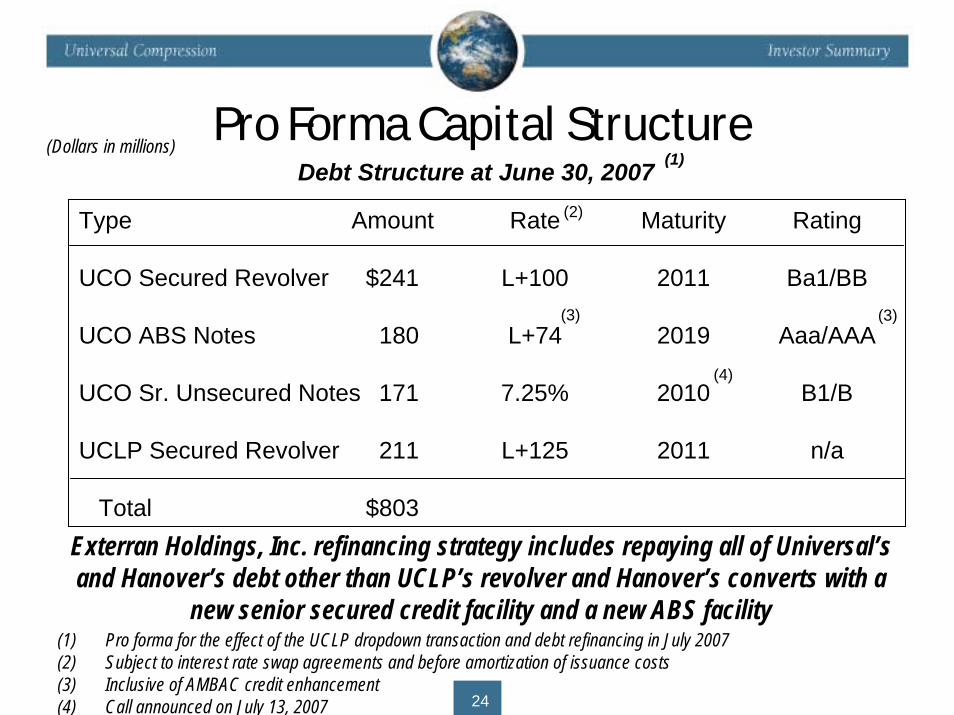
(Dollars in millions)Pro Forma Capital Structure
Type Amount Rate Maturity Rating
UCO Secured Revolver $241 L+100 2011 Ba1/BB
UCO ABS Notes 180 L+74 2019 Aaa/AAA
UCO Sr. Unsecured Notes 171 7.25% 2010 B1/B
UCLP Secured Revolver 211 L+125 2011 n/a
Total $803
(4)
Debt Structure at June 30, 2007
(3)(3)
(2)
(1)
Exterran Holdings, Inc. refinancing strategy includes repaying all of Universal’sand Hanover’s debt other than UCLP’s revolver and Hanover’s converts with a
new senior secured credit facility and a new ABS facility(1) Pro forma for the effect of the UCLP dropdown transaction and debt refinancing in July 2007(2) Subject to interest rate swap agreements and before amortization of issuance costs(3) Inclusive of AMBAC credit enhancement(4) Call announced on July 13, 2007 24
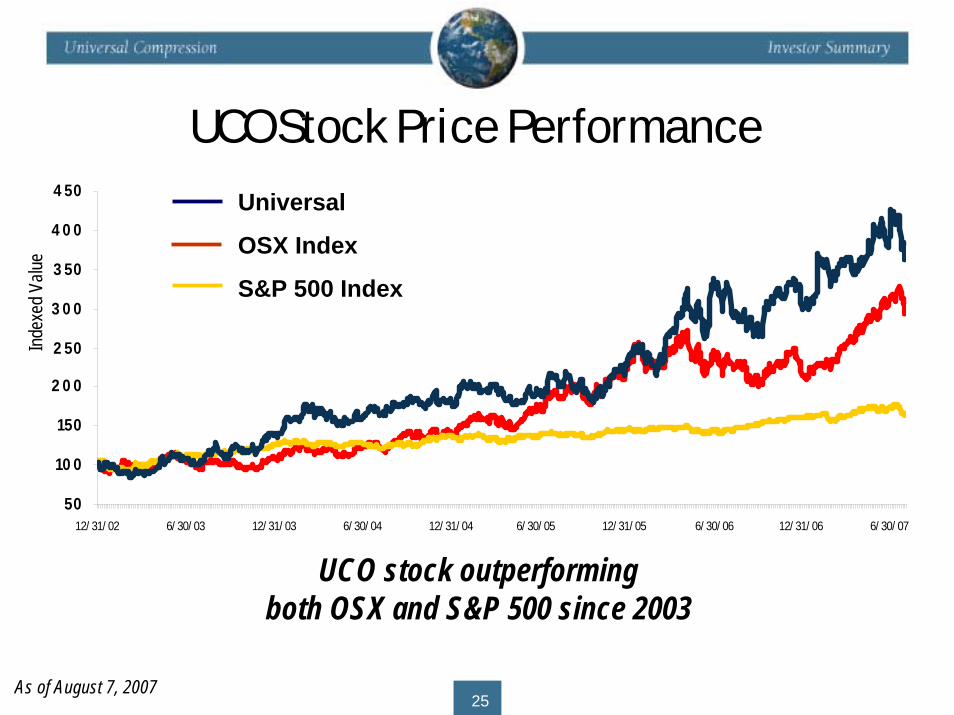
UCO Stock Price Performance
50
10 0
150
2 0 0
2 50
3 0 0
3 50
4 0 0
4 50
12/ 31/ 02 6/ 30/ 03 12/ 31/ 03 6/ 30/ 04 12/ 31/ 04 6/ 30/ 05 12/ 31/ 05 6/ 30/ 06 12/ 31/ 06 6/ 30/ 07
UCO stock outperformingboth OSX and S&P 500 since 2003
Universal
OSX Index
S&P 500 Index
Index
ed V
alue
As of August 7, 200725
Investment Highlights• Stable and growing EBITDA
• Attractive long-term industry growth opportunities
• Growing international business
• Universal Compression Partners
• Proposed merger with Hanover
26
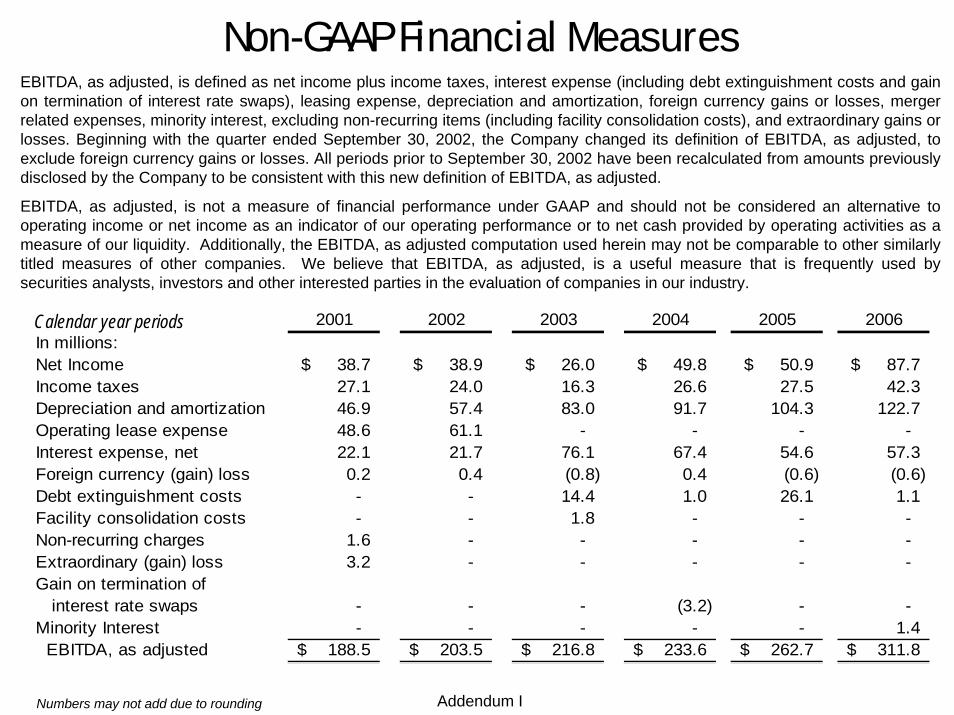
EBITDA, as adjusted, is defined as net income plus income taxes, interest expense (including debt extinguishment costs and gain on termination of interest rate swaps), leasing expense, depreciation and amortization, foreign currency gains or losses, mergerrelated expenses, minority interest, excluding non-recurring items (including facility consolidation costs), and extraordinary gains or losses. Beginning with the quarter ended September 30, 2002, the Company changed its definition of EBITDA, as adjusted, to exclude foreign currency gains or losses. All periods prior to September 30, 2002 have been recalculated from amounts previouslydisclosed by the Company to be consistent with this new definition of EBITDA, as adjusted.
EBITDA, as adjusted, is not a measure of financial performance under GAAP and should not be considered an alternative to operating income or net income as an indicator of our operating performance or to net cash provided by operating activities as ameasure of our liquidity. Additionally, the EBITDA, as adjusted computation used herein may not be comparable to other similarly titled measures of other companies. We believe that EBITDA, as adjusted, is a useful measure that is frequently used by securities analysts, investors and other interested parties in the evaluation of companies in our industry.
Non-GAAP Financial Measures
2001 2002 2003 2004 2005 2006In millions:Net Income 38.7$ 38.9$ 26.0$ 49.8$ 50.9$ 87.7$ Income taxes 27.1 24.0 16.3 26.6 27.5 42.3 Depreciation and amortization 46.9 57.4 83.0 91.7 104.3 122.7 Operating lease expense 48.6 61.1 - - - - Interest expense, net 22.1 21.7 76.1 67.4 54.6 57.3 Foreign currency (gain) loss 0.2 0.4 (0.8) 0.4 (0.6) (0.6) Debt extinguishment costs - - 14.4 1.0 26.1 1.1 Facility consolidation costs - - 1.8 - - - Non-recurring charges 1.6 - - - - - Extraordinary (gain) loss 3.2 - - - - - Gain on termination of interest rate swaps - - - (3.2) - - Minority Interest - - - - - 1.4 EBITDA, as adjusted 188.5$ 203.5$ 216.8$ 233.6$ 262.7$ 311.8$
Calendar year periods
Addendum INumbers may not add due to rounding

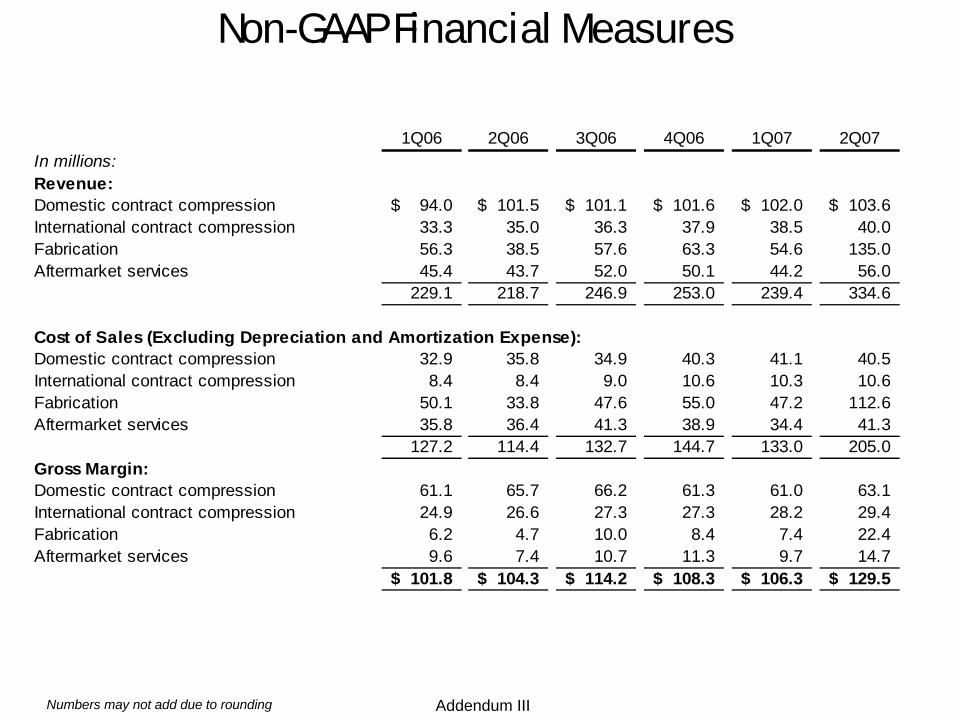
Non-GAAP Financial MeasuresGross margin is defined as total revenue less cost of sales (excluding depreciation and amortization expense). Gross margin represents the results of revenue and cost of sales (excluding depreciation and amortization expense), which are key components of our operations. Gross margin differs from gross profit, which includes depreciation expense. We believe gross margin is important because it focuses on the current operating performance of our operations and excludes the impact of the prior historical costs of the assets acquired or constructed that are utilized in those operations, the indirect costs associated with our selling, general and administrative activities, the impact of our financing methods and income taxes. Management uses this non-GAAP measure as a supplemental measure to other GAAP results to provide a more complete understanding of our performance. As an indicator of our operating performance, gross margin should not be considered an alternative to, or more meaningful than, net income as determined in accordance with GAAP.
1Q06 2Q06 3Q06 4Q06 1Q07 2Q07In millions:Net Income 20.9$ 21.8$ 25.0$ 20.0$ 14.3$ 25.2$ Income taxes 11.9 8.5 12.8 9.1 7.1 12.8 Depreciation and amortization 29.8 30.0 31.2 31.7 34.9 35.8 Interest expense, net 14.1 14.6 15.2 13.5 14.0 14.1 Foreign currency (gain) loss (0.6) 0.3 (0.0) (0.3) (0.7) (1.0) Merger related expenses - - - - 1.4 4.8 Minority interest - - - 1.4 1.3 1.6 Debt extinguishment costs - - - 1.1 - - EBITDA, as adjusted 76.0$ 75.2$ 84.0$ 76.5$ 72.3$ 93.3$ Selling, general and administrative 26.6 29.5 30.1 32.6 35.7 36.8 Other (income) loss, net (0.7) (0.4) 0.0 (0.8) (1.7) (0.5) Gross Margin 101.8$ 104.3$ 114.2$ 108.3$ 106.3$ 129.5$
Addendum IINumbers may not add due to rounding
Non-GAAP Financial Measures
1Q06 2Q06 3Q06 4Q06 1Q07 2Q07In millions:Revenue:Domestic contract compression 94.0$ 101.5$ 101.1$ 101.6$ 102.0$ 103.6$ International contract compression 33.3 35.0 36.3 37.9 38.5 40.0 Fabrication 56.3 38.5 57.6 63.3 54.6 135.0 Aftermarket services 45.4 43.7 52.0 50.1 44.2 56.0
229.1 218.7 246.9 253.0 239.4 334.6
Cost of Sales (Excluding Depreciation and Amortization Expense):Domestic contract compression 32.9 35.8 34.9 40.3 41.1 40.5 International contract compression 8.4 8.4 9.0 10.6 10.3 10.6 Fabrication 50.1 33.8 47.6 55.0 47.2 112.6 Aftermarket services 35.8 36.4 41.3 38.9 34.4 41.3
127.2 114.4 132.7 144.7 133.0 205.0 Gross Margin:Domestic contract compression 61.1 65.7 66.2 61.3 61.0 63.1 International contract compression 24.9 26.6 27.3 27.3 28.2 29.4 Fabrication 6.2 4.7 10.0 8.4 7.4 22.4 Aftermarket services 9.6 7.4 10.7 11.3 9.7 14.7
101.8$ 104.3$ 114.2$ 108.3$ 106.3$ 129.5$
Addendum IIINumbers may not add due to rounding