Embed Size (px)
Citation preview

AFRL-HE-WP-TR-2000-0037 UNITED STATES AIR FORCE
RESEARCH LABORATORY
PERCHLORATE IN FERTILIZERS
J.E. Eldridge, 2Lt.D.T. Tsui, Capt.
D.R. Mattie, Ph.D.OPERATIONAL TOXICOLOGY BRANCH, AFRL/HEST
2856 G STREETWRIGHT PATTERSON AFB, OH 45433-7400
J. Crown, Maj.
AFIT/ENO, BLDG. 6402950 P STREET
WRIGHT PATTERSON AFB, OH 45433-7765
R. ScottTRC ENVIRONMENTAL SOLUTION, INC.
21 TECHNOLOGY DRIVEIRVINE, CA 92618
T. BlackmanLOCKHEED-MARTIN, INC.
CORPORATE ENVIRONMENT, SAFETY AND HEALTH2550 NORTH HOLLYWOOD WAY
BURBANK, CA 91505
September 1999
Interim Report - February 1999 - August 1999
20060630305TRI.SERVICE TOXICOLOGY
CONSORTIUM tABRARY Human Effectiveness DirectorateDeployment and Sustainment DivisionOperational Toxicology Branch2856 G StreetWright-Patterson AFB OH 45433-7400
Approved for public release; distribution is unlimited. STINFO COPY

NOTICES
When US Government drawings, specifications or other data are used for any purpose othei thana definitely related Government procurement operation, the Government thereby incurs noresponsibility nor any obligation whatsoever, and the fact that the Government may haveformulated, furnished, or in any way supplied the said drawings, specifications, or other data isnot to be regarded by implication or otherwise, as in any manner licensing the holder or any otherperson or corporation, or conveying any rights or permission to manufacture, use, or sell anypatented invention that may in any way be related thereto.
Please do not request copies of this report from the Air Force Research Laboratory. Additionalcopies may be purchased from:
National Technical Information Service5285 Port Royal RoadSpringfield, Virginia 22161
Federal Government agencies and their contractors registered with the Defense TechnicalInformation Center should direct requests for copies of this report to:
Defense Technical Information Service8725 John J. Kingman Rd., Ste 0944Ft. Belvoir, Virginia 22060-6218
DISCLAIMER
This Technical Report is published as received and has notbeen edited by the Technical Editing Staff of the Air Force Research Laboratory.
TECHNICAL REVIEW AND APPROVAL
AFRL-HE-WP-TR-2000-0037
This report has been reviewed by the Office of Public Affairs (PA) and is releasable to theNational Technical Information Service (NTIS). At NTIS, it will be available to the generat"public, including foreign nations.
This technical report has been reviewed and is approved for publication.
FOR THE DIRECTOR
DAVID R. MATTIE, PH.DActing Branch Chief, Operational Toxicology BranchAir Force Research Laboratory

REPORT DOCUMENTATION PAGE Form ApprovedR R OMB No. 0704-0188
Public reporting burden for this collection of information is estimated to average 1 hour per response, including the time for reviewing instructions, searching existing data sources.gathering and maintaining the data needed, and completing and reviewing the collection of information. Send comments regarding this burden estimate or any other aspect of thiscollection of information, including suggestions for reducing this burden, to Washington Headquarters Services, Directorate for Information Operations and Reports, 1215 JeffersonDavis Highway, Suite 1204, Arlington, VA 22202-4302, and to the Office of Management and Budget, Paperwork Reduction Project (0704-0188), Washington, DC 20503.
1. AGENCY USE ONLY (Leave blank) 2. REPORT DATE I 3. REPORT TYPE AND DATES COVERED
I September 1999 Interim Report - February 1999 - August 19994. TITLE AND SUBTITLE 5. FUNDING NUMBERSPerchlorate in Fertilizers Contract F41624-96-C-9010
PE 62202FPR 1710
6. AUTHOR(S) TA 1710DEldridge, J., Tsui, D., Mattie, D., Crown,'J., Scott, R., Blackman, T. WU 1710D418
7. PERFORMING ORGANIZATION NAME(S) AND ADDRESS(ES) 8. PERFORMING ORGANIZATION
Human Effectiveness Directorate REPORT NUMBER
Air Force Research LaboratoryWright-Patterson AFB, OH 45433-7400
9. SPONSORING/MONITORING AGENCY NAME(S) AND ADDRESS(ES) 10. SPONSORING/MONITORING
Human Effectiveness Directorate AGENCY REPORT NUMBER
Air Force Research Laboratory AFRL-HE-WP-TR-2000-0037Wright-Patterson AFB, OH 45433-7400
11. SUPPLEMENTARY NOTES
12a. DISTRIBUTION AVAILABILITY STATEMENT 12b. DISTRIBUTION CODE
Approved for public release; distribution is unlimited.
13. ABSTRACT (Maximum 200 words)
This report documents an inter-laboratory collaborative study on the performance on ion chromatography (IC) methods forperchlorate analysis in lawn and garden fertilizers. Seven government, private, and commercial laboratories participated inthe analysis of 34 aqueous suspensions of the test materials, using similar ion chromatography systems. Two method variants(AS-I I and AS-16) were evaluated. Statistical evaluations by paired t-test for the means analysis found good agreements ineach of the methods variants and excellent agreement between the methods. The study also found no significant defferences inthe performance of the microbore column with respect to the standard bore column. This report also evaluates and comparesthe performance of IC with respect to capillary eletrophoresis (CE), Raman spectroscopy (RS), and titration for perchlorateanalysis. The study found excellent agreement between the ion chromatography and CE results, and little or no agreementbetween IC and RS or titration. As expected, compared to the IC results, titration is biased high.
14. SUBJECT TERMS 15. NUMBER OF PAGES
Ion chromatography Capillary electrophoresis Parts per billion 41AS- 16 Raman spectroscopy 16. PRICE CODE
AS-11 Fertilizer17. SECURITY CLASSIFICATION 18. SECURITY CLASSIFICATION 19. SECURITY CLASSIFICATION 20. LIMITATION OF ABSTRAC
OF REPORT OF TWIS PAGE OF ABSTRACT
UNCLASSIFIED UNCLASSIFIED UNCLASSIFIED ULStandard Form 298 (ERev. 2-89)Prescribed by ANSI Std. 239. 18Designed using Perform Pro. WHS/DIOR, Oct 94
THIS PAGE INTENTIONALLY LEFT BLANK.
TABLE OF CONTENTS
Page
LIST OF FIGURES AND TABLES .......................................................................... iv
PREFA CE ......................................................................................................... v
LIST OF ABBREVIATIONS ........... ........................................................................ vi
1.0 INTR OD UCTIO N ............................................................................................... 1
2.0 METHODS AND MATERIALS ....................................................................... 2
2.1 Test M aterials ............................................................................ 4
2.2 Analytical M ethod ..................................................................... 5
2.3 Statistical M ethod ..................................................................... 8
3.0 R E SU L TS ........................................................................................................... 11
3.1 Ion Chrom atography ................................................................... 11
3.2 Capillary Electrophoresis ............................................................ 15
3.3 Ram an Spectroscopy ................................................................... 15
3.4 Tetraphenylstibonium Sulfate Titration ..................................... 18
4.0 C onclusions .......................................................................................................... 19
5.0 REFEREN CES .................................................................................................... 23
6.0 ACKNOWLEDGEMENTS ................................................................................. 27
APPENDIX A: TEST MATERIALS, PURCHASED LOCATIONS, AND 29MANUFACTURES' INFORMATION ..............................................
APPENDIX B: SUMMARY OF ION CHROMATOGRAPHY METHODS ............ 31
APPENDIX C: RESULTS OF FERTILIZER ANALYSIS BY TITRATION, ION 32CHROMATOGRAPHY, CAPILLARY ELECTROPHORESIS,AND RAMAN SPECTROSCOPY ....................................................
APPENDIX D: PAIRED TWO SAMPLE TESTS FOR MEANS ANALYSIS ON 33AS-11 M ETH OD ...................................................................................
APPENDIX E: PERCHLORATE IN GARDEN AND LAWN FERTILIZERS BY 34"AS-I .........................................
APPENDIX F: PAIRED TWO SAMPLE TEST FOR MEANS ANALYSIS ON AS- 3511 VERSUS AS- 16, CAPILLARY ELECTROPHORESIS, RAMANSPECTROSCOPY, AND TITRATION ................................................
,ii

LIST OF FIGURES AND TABLES
Page
Table 3.1 REPORTED IC METHOD DETECTION LIM1TS FROM
PARTICIPATING LABORATORIES ................................................. 11
Table 3.2 ION CHROMATOGRAkPHY RESULTS OF BLANKS AND 100
j.g/L PERCHLORATE SPIKED CONTROLS ...................................... 13
Table 3.3 PERCHLORATE IN GARDEN AND LAWN FERTILIZERS BY
A S-11 .................................................................................................... 14
Figure 3.1 A PLOT OF PERCHLORATE CONCENTRATIONS VERSUS
PERCENT DIFFERENCES BETWEEN IC AND TITRATION
RESU LTS ............................................................................................. 20
iv

PREFACE
This report summarizes research that begun in February 1999. Research was completed
in August 1999 under Department of the Air Force Contract No. F41624-96-C-90 10. This study
was a collaborative effort between the Department of the Air Force representing the Inter-
Perchlorate Steering Committee, - the Perchlorate Study Group, and the United States
Environmental Protection Agency National Exposure Research Laboratory, Ecosystems Research
Division (EPA/NERJERD).
Laboratories who participated in the study were Chemical Testing Service (Diamond Bar,
CA), Del Mar Analytical Laboratories (Irvine, CA), American Pacific Corporation (Cedar City,
UT), United Technologies Corporation (San Jose, CA), Montgomery Watson Laboratories
(Pasadena, CA), Thiokol Corporation (Brigham City, UT), EPA/NERL/ERD (Athens, GA), and
AFRLJHEST (Wright-Patterson AFB, OH).
Tommy Blackman (Lockheed Martin, Corporate Environment, Safety and Health,
Burbank, CA) and Richard Scott (TRC Environmental Solutions Inc., Irvine, CA) served as the
coordinator for the Perchlorate Study Group. MacArthur Long served as the coordinator for
EPA/NERLIERD. Major Steve Channel served as Contract Technical Monitor for the United
States Air Force, AFRIMHEST.
v

LIST OF ABBREVIATIONS
a probability of Type I error
ASRS Anion Self Regenerating Suppressor
CDHS California Department of Health Services
CE capillary electrophoresis
CCD charge coupled device
CV cycle voltammetry
EOF Electro-osmotic flow
HPLC high performance liquid chromatography
i.d. inner diameter
IC ion chromatography
g gram
kV Kilo-volts
ISE ion selective electrode
L Liter
9g . microgram
PL micro-liter
mL milliliter
mm millimeter
min minutes
rna mega-Ohm
mW milli-watt
mM milli-molar
mmol milli-mole
mV milli-volt
nL Nanoliter
nm nanometer
o.d. outer diameter
ppm parts per million
vi

ppb parts per billion
%CV percent coefficient of variation
RS Raman spectroscopy
Sd Stdev, standard deviation
Sdi standard deviation of the sample measurements between laboratories
TDS total dissolve:solids
UV ultra violet
V volts
Vi

PERCHLORATE IN FERTILIZERS
1.0 INTRODUCTION
Perchlorate is a powerful oxidizer used in solid-rocket propellant mixtures, fireworks, and
munitions. Inorganic salts of the perchlorate anion are relatively soluble in water. The presence
of trace level perchlorate in drinking water poses a potential health risk, due to the interference of
perchlorate with the uptake of iodide necessary to produce hormones in the thyroid gland. The
EPA's current recommended acceptable level for perchlorate in drinking water is 18 parts per
billion (ppb) 110. Heightened awareness of perchlorate as a potential health risk has led to
increased activities in the investigation of perchlorate occurrence in the environment 11-1 2. Since
perchlorate and the ammonium, sodium, and potassium salts of perchlorate are better known in
their commercial and industrial applications, studies of occurrence have focused on surface and
ground water sources near regions where munitions, aerospace components, and fireworks were
manufactured, developed, and tested. However, reports have suggested that naturally occurring
perchlorate is present in fertilizers, nitrate deposits from northern Chile (caliche), and minerals
from arid environments with chloride deposits 15.,7. These new findings have sparked intense
efforts in the study of natural perchlorate occurrence in non-aqueous matrices and the application
of existing methodologies to accurately determine perchlorate levels. k,
The determination of perchlorate at trace (ppb) levels is a difficult analytical task. Early
techniques for perchlorate analysis in aqueous and solid matrices, such as gravimetric analysis 18-
22 titration 19,20,23-25, and liquid-liquid extraction/spectrophotometry 26.31, explored the formation
of water insoluble ionic complexes of perchlorate with organic dyes, such as nitron, brilliant
green, tetraphenylstibonium, and methylene blue. Because organic dyes are not specific for
perchlorate and have preferential selectivity for perchlorate and similar anions, potential exist for
those methods to over estimate perchlorate concentrations, leading to biased results.
= " " • •" "i i i !

More specific and selective methods, such as ion pair high performance liquid
chromatography (HPLC) 32-33, capillary electrophoresis (CE) 34-40, ion selective electrode (ISE) 40"
41 and Raman spectroscopy (RS) 42 have also been used in perchlorate analysis in complex
matrices. However, the sensitivity of these methods is limited to the ppm levels.
For the determination of trace level perchlorate in aqueous matrices, ion chromatography
coupled with a conductivity detector is the state of the art technology available to most analytical
laboratories 4347. Several IC methods have been developed for the inalysis of trace perchlorate
levels. In 1997, the California Department of Health Services (CDHS) using the AS-5 anion
separation column developed the so-called CDHS Method for the determination of trace level
perchlorate in drinking water ". In April 1998, the Dionex Application Laboratory developed an
improved IC method, using the AS-1I column, for perchlorate analysis 4-4. The performances of
both AS-5 and AS-11 methods for drinking water and groundwater were validated in an inter-
laboratory collaborative study sponsored by the Interagency Perchlorate Steering Committee
(IPSC). With respect to aqueous matrices having the same quality as drinking water -and
groundwater, the collaborative study found no differences between the two methods in terms of
bias and accuracy 4s. In March 1999, California Department of Health Services Division of
Sanitation Laboratory Services adopted both methods 49, and in July 1999 EPA proposed both47methods for national drinking water and groundwater analysis
Although both methods performed similarly, the AS-11 method has gained wider
acceptance over the AS-5 because the AS-5 method is incompatible with the newer suppressors
and is less rugged for matrices with high total dissolved solids (TDS). The p-cyanophenol
organic modifier used in the AS-5 methods is electrochemically active. Incompatible with the
newer electrochemical suppressor, the p-cyanophenol may de-grade the suppressor membrane
and cause elevated baselines and lower IC performance 48-53 High TDS effects perchlorate
analysis by giving non-specific baseline rise that could mask the perchlorate peak. In a review
sponsored by East Valley Water District, Shen and Harrington , showed that with respect to
mixed water analysis containing TDS at greater 1,000 ppm, the performance of the AS-5 column
is not as robust as the AS-1i. Furthermore, in separate experiments, Eaton et al. and the IPSC
analytical subcommittee demonstrated that although samples with high TDS pose a challenge to
2

both methods, the AS-11 column is more rugged than the AS-5. At greater than 2500 ppm TDS,
the AS-5 method could not effectively resolve trace perchlorate at 5 ppb 4 s3-6.
To accommodate samples with high TDS, the AS-16 column was introduced, and an
extensive methods development study based on the AS-16 column was completed in May 1999
. 53. The optimized AS-16 method calls for a Dionex IonPaco AS-16 column with a 35-mM
mobile phase flowing at 1.25 mL/mifi. The reported AS-16 method detection limit is 1 ppb, with
a 1,000-pL injection loop volume and an ASRS-Ultra suppressor. The AS-16 column, with
significantly higher column capacity and more hydrophilic functional groups than the AS-11
column, was developed to accommodate matrices with higher TDS and provide better separation
for perchlorate. Whereas the AS-I l is limited in resolving 50-ppb perchlorate at around 6,800
ppm TDS, the AS-16 is capable to resolving 50-ppb perchlorate at TDS levels as high as 20,000
ppm. Shortly after this study began, the EPA proposed the AS-16 column as a replacement for
both the AS-5 and AS-11 columns 5'
This report documents the results of a collaborative study conducted by the IPSC
Analytical Sub-Committee with the EPA Office of Research and Development, National
Exposure Research Laboratory, Ecosystems Research Division in Athens, GA. The objective of
this collaborative (co-lab) study is to compare the performance of IC methods for the
measurement of perchlorate in the liquid extracts of lawn and garden fertilizers containing high
TDS. Additionally, this report evaluates the performance of capillary electrophoresis, titration,
and Raman spectroscopy for perchlorate analysis.
3
3

2.0 METHODS AND MATERIALS
2.1 Test Materials
Test materials were purchased from various commercial and retail sources located in
Missouri, New York, and California. Appendix A lists the test materials and corresponding
sample number, manufacturer, and primary constituents appearing on the manufacture's labels.
All-Purpose Plant Food (Peters Inc.) having different lot numbers was purchased from
three different locations: California (ps06), Kansas City, MO (ps05), and Long Island, NY
(psl6). Samples psl7 and ps24 are duplicate samples of Fall Fertilizer (Johnathan Green Co.)
purchased in Long Island, New York. Samples psi5 and ps21 are duplicate samples of Lawn
Restorer (Ringer Inc.) purchased in Long Island, New York. Samples ps02 and ps09 are
duplicate samples of Supreme Gardens (Ringer Inc.) purchased from Kansas City, MO. Samples
ps08 and psl2 are duplicate samples taken from one lot of Vegetable and Bedding Plant Food
bought in Kansas City, MO and sample psl9 was taken from another lot purchased in Long
Island.
The caliche sample (ps34, Chilean nitrate) was collected from Region I of the Soquimich
Nitrate Works located in Calama, Chile. The langbeinite ore sample (ps30) was obtained from
IMC Minerals (Albuquerque, NM). The potassium nitrate used in the Champion (sample
number ps3 1) and Best K-Power (ps32 and ps33) and Chilean Nitrate fertilizers were also
collected from the Soquimich Nitrate Works.
Important to note, these raw test materials were heterogeneous. Regardless of mixing
time and mesh quality, dividing the raw test materials for laboratory analysis represented sub-
sampling of the test materials and the result for each sub-sample is inherently different from
another. Although not a factor in the liquid extracts shipped in this study, shipment and storage
of bagged fertilizer could bias theresults due to changes in moisture content.
Consistent with the preliminary nature of this round robin, a homogenous suspension of
subsamples of a nonrepresentative subsample of each fertilizer and raw test material was
prepared and shipped to seven laboratories for blind analysis. The suspension was prepared by
4

mixing the solid sample with deionized water. The mixing ratio was 1 gram of solid sample per
10 mL of de-ionized water. De-ionized water used in this study was Type I reagent grade, with a
resistance of 18 rmQ or better. The mixture was shaken over 48 hours, and the liquid phase was
removed after the suspension had settled. Approximately 50 mL of the liquid phase from each of
the thirty-four test materials was transferred to an amber glass bottle and shipped to the
cooperating laboratories for perchlorate analysis. Two 100-pglL positive controls (LCS1 and
LCS2) and one negative control accompanied each set of thirty-four liquid test samples. The
100-g.g/L perchlorate controls were prepared gravimetrically from sodium perchlorate (Fisher
Scientific, Inc., Lot # 78164) and de-ionized water. The negative control blank was prepared
from de-ionized water alone.
2.2 Analytical Methods
Ion Chromatography.
All seven laboratories performed the ion chromatography analysis on similar ion chromatography
systems manufactured by Dionex Corp. of Sunnyvale, CA. A system consists of AS-40
autosampler for sample injection, GP-40 gradient pump for eluent delivery, and CD-20
conductivity detector for detection. Method variations differed in the ion separation columns and
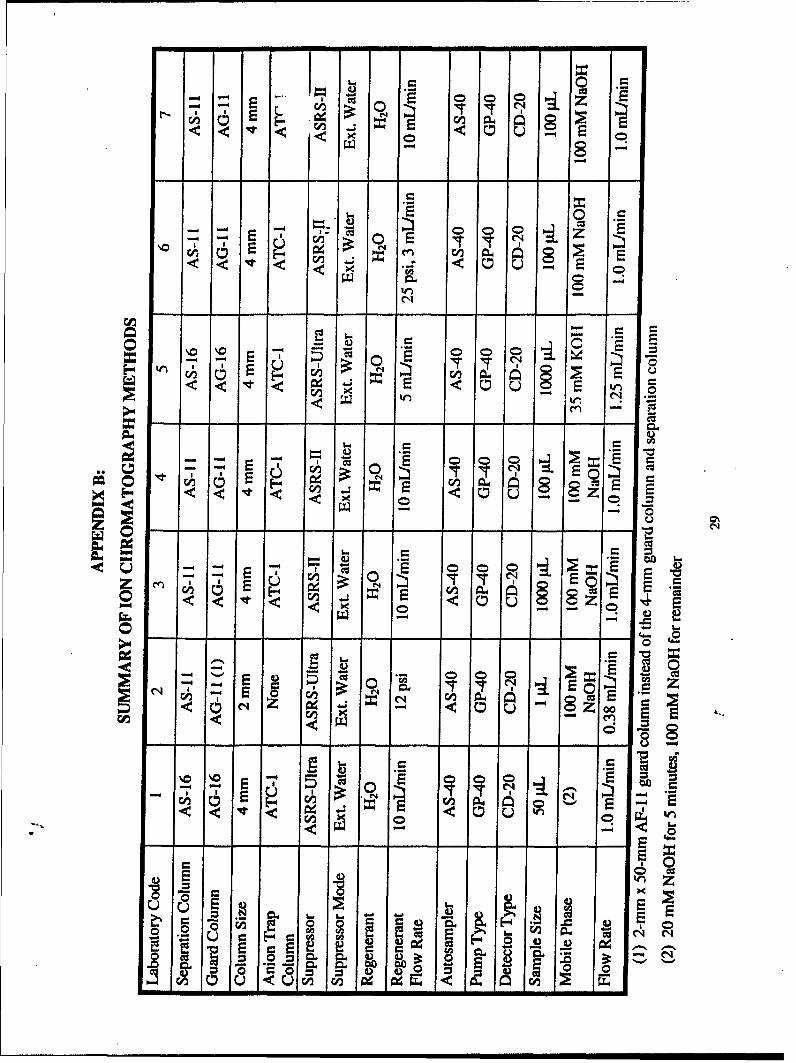
eluent conditions; both AS-I1 and AS-16 columns were used in this study. Appendix B lists the
differences in eluent conditions among laboratories. &.
Laboratories 3, 4, 6, and 7 employed the AS-11 method with identical method conditions.
Perchlorate was chromatographically separated on a Dionex ATC-1 anion trap column, AG-11
guard column (4 mm x 50 mm), and AS-Il anion separation column (4 mm x 250 mm), with 100
mM NaOH mobile phase flowing at 1.0 mLlmin. as eluent. All four laboratories used the Anion
Self-Regenerating Suppressor-lI (ASRS-il) operating in the external water mode for eluent
suppression. Laboratory 3 used a 1,000-pJ injection volume loop; and labs 4, 6, and 7 used 100-
I.L injection volume loops.
5
Laboratory 2 used a micro-bore equivalent of the standard AS-11 method. Instead of the
4-mm guard and separation column, Laboratory 2 used a 2-mm x 50-mm AG-11 guard column
and a 2-mm x 250-mm AS-11 column for perchlorate separation. Accordingly, the 100-mM
NaOH eluent flow rate was reduced from 1 mLImin to 0.38 mlimin. To avoid overloading the
column, the sample injection volume was reduced proportionally from 1,000 piL to 1 jtL. Eluent
suppression was achieved using an A-SRS-Ultra suppressor operating in the external water mode.
Laboratories I and 5 used the AS-16 method for perchlorate analysis. For the AS-16
method, perchlorate separation was obtained on a Dionex IonPac AS-16 separation column (4 x
250-mm) with an AG-16 guard column (4 x 50 mm) and an ATC-1 anion trap column.
Laboratory 5 used the recommended 1,000-p.L sample loop volume and an isocratic program
with 35-mM NaOH mobile phase flowing at a rate of 1.25 mlimin. Laboratory 1 used a 50-jtL
sample loop injection with a gradient program: 20 mM NaOH for 5 minutes and 100-mM NaOH
for the remainder of the analysis.
Capillary Electrophoresis.
Laboratory 6 performed the CE analysis. A Beckman P/ACE 5000 capillary
electrophoresis system was used for indirect UV-detection (214 nM) of perchlorate in fertilizer
samples. All data analysis was performed on Beckman System Gold Software. Liquid test
materials diluted 1:10 to 1:100 were injected hydrodynamically for 5 seconds on a 47-cm fused
silica (40-cm end to detection, 300-jim outside diameter and 75-jim inside diameter). The
column temperature and voltage were set at 23*C and 20 kV, respectively. The running buffer
consisted of 40-mM phosphate (pH 7.0) containing 2.24-mM pyromellitic acid visualizing agent
and 0.5-mM tetradecyl trimethyl ammonium bromide for reduction of the electroosmotic flow.
Perchlorate is non-UV active 32. The displacement of pyromellitic acid by analyte in the running
buffer gives negative peaks as the analyte passes the detector. For quantitation, the detector
polarity is reversed to give a positive peak. Between sample analyses, the capillary was flushed
for 1 minute with deionized water, 4 minutes with 0.1 M NaOH, 4 minutes with water, and 4
minutes with the running buffer. Sample run time was 6 minutes.
6

Raman Spectroscopy Analysis.
Laboratory 6 also performed the RS analysis. For Rama. spectroscopy analysis, 5-mL of
the undiluted liquid test samples were analyzed on a Kaiser OF,• al Systems HoloProbe, using
785-nm laser excitation from a diode laser. The laser light was coupled to a remote probe head
via a 1.9 meter-long fiber optic cable. The laser light was brought to focus with a series of
lenses, at approximately 2.5 inches: beyond the end of the probe head assembly. A standard
quartz cuvette containing the sample was placed in the path of the beam such that the focus of the
beam fell in the center of the cuvette. The power of the laser light at the sample was
approximately 135 mW.
Raman scattered light from the sample was collected by the probe head along the same
path as the excitation laser beam (i.e., 1800 back scattering geometry). The probe head was
coupled to a separate 1.9 meter-long fiber optic cable for delivery to the f /1.8 axial transmissive-
type spectrograph. A holographic notch filter removed elastically scattered laser light from the
probe head and a 50 p.tm slit focused Raman scattered light through. a volume holographic
transmissive grating. The dispersed Raman spectrum was collected by a charge coupled device
(CCD) detector which allowed simultaneous acquisition of the entire Raman spectrum with
useable Stokes Raman shift of about 3280 to .95 cm' in a single exposure (with spectral
resolution of 5 cm'-). The CCD detector used a back-illuminated, near-infrared optimized
Princeton CCD-1024EHRB chip. The chip was thermoelectrically cooled at -65'C.
Tetraphenyistibonium Titration.
Chemical Test Service of Diamond Bar, CA performed tetraphenylstibonium titration of
all samples. For titration, the suspension was transferred onto an ion exchange column
containing 25 grams of Dowex-1 resin (VWR Inc.) and eluted with 100 mL of 0.01-M potassium
bicarbonate solution (VWR Inc.) to remove nitrate, chloride, chlorite, and chlorate ions. The
solutions were monitored using a perchlorate selective electrode (Orion Inc., Model 938101), to
determine if a portion of the perchlorate eluted in the rinse. If the perchlorate selective electrode
indicated over 10-ppm perchlorate, the sample preparation step was repeated with using a larger
dilution. When perchlorate was no longer detectable in the effluent by the perchlorate selective
electrode, the ion exchange column was rinsed first with 75 mL of 0.05-M sodium fluoroborate
7

solution followed by 25 mL of the same solution to de-sorb the perchlorate from the ion
exchange column. Both rinses were collected. The combined sodium fluoroborate solution was
then analyzed using the perchlorate selective electrode. To determine the efficiency of the
extraction process, various control samples and duplicate samples were also extracted and
analyzed. A 25-mL aliquot was removed from the combined sodium fluoroborate solution,
diluted with 10 mL of de-ionized water and titrated with 0.01M (3.6 mg/mL)
tetraphenylstibonium sulfate using six drops of bromocresol green as an indicator. The endpoint
was clearly visible for each titration, with the bromocresol green color disappearing, producing a
clear solution.
2.3 Statistical Method
Due to method variations, it would be erroneous to determine the variability in IC
measurements by pooling the data from all seven laboratories. There are not enough data points
to form a representative population for each method variation. Only three of the laboratories
used the same methodology; the others used significant modifications to the method. Therefore,
the first goal of this analysis was to investigate the consistency of Laboratories 3, 4, and 7, which
used the unaltered AS-11 IC method.
The consistency of data from laboratories 3, 4, and 7 was tested using the paired t-test for
a series of null hypotheses:
Ho: data from laboratories 3 and 4 are from the same population
Ho: data from laboratories 3 and 7 are from the same population
Ho: data from laboratories 4 and 7 are from the same population
The paired t-test was appropriate because most of the laboratories involved did not
analyze replicates. The paired t-test statistic looks at the normalized differences between
analyses of the same sample conducted by two different laboratories. For a given level of
significance, the resulting t statistic is compared to zero to see if the difference is significantly
different from zero. If the difference is not significantly different from zero, the two sets of
8

values are assumed to be from the same population, or in practical terms, the same to within a
small probability of error.
To avoid undue weighting of the difference between large concentrations and the
difference between small concentrations, the data were normalized. Lacking a clear definition of
the probability distribution of the population of the measurements of the split samples, the
normalization of dividing the measurements by the standard deviation of the sample
measurements (values from laboratories 1, 2, 3, 4, 5, and 7) was applied. The normalized
difference di is
xi -M, Yi -Mi xi - Yi
di =SD
where xi is the analysis of split sample i = ps0l, ps02, ps03, ... , ps34 by laboratory x, yi is the
analysis of split sample i = ps0l, ps02, ps03, ... , ps34 by laboratory y, Mi is the mean of the
sample measurements between laboratories i = x, y, z, ..., m in which m is the total number of
laboratories in a pool of results (i.e., m = 6 for a pool of results from laboratories 1, 2, 3, 4, 5, and
7), and SDi is the standard deviation of the sample measurements between laboratories for each
split sample i = ps0l, ps02, ps03, ... , ps34.
Since the only assumption necessary to use the paired t-test is that the di values follow a
normal distribution, the Shapiro-Wilk test of normality was applied to ensure the set of pair-wise
differences in the analysis between any two laboratories was normally distributed. The
probability of 0.01 was selected to test normality of these differences. If the population of a set
of differences was not normally distributed, the non-parametric Wilcoxon-Signed Rank test was
used to test for consistency in measurement between laboratories instead of the paired t-test57-..
The probability a of making a Type I error of rejecting the null hypothesis that mean
differences between laboratories is not significantly different from zero, when this is true, was
selected as the 0.01 level of significance. Using the Bonferroni 58 approach, the individual pair-
wise comparisons of the laboratories were made at a/k significance level, where k is the total
number of pair-wise comparisons that need to be made. This limits the chance of making one
mistake in the k different paired tests to Ca = 0.01.
Based on these criteria, each test was conducted as follows:
9

Null Hypothesis Ho: measurements from laboratory x are not significantly
different from those of laboratory y
Alternative Hypothesis Ha: measurements from laboratory x are significantly
different from those of laboratory y
n
Test Statistic t in-
Decision Rule If probability of jtl < a/k, then reject Ho
When none of the null hypotheses were rejected for the initial comparisons between
laboratories 3, 4, and 7, then the measurements for each sample split from labs 3, 4, and 7 were
pooled and a "golden mean" was obtained for comparison with other methods to determine
consistency. Paired t-tests were conducted between the "golden mean" for the AS-11 method
and each IC method variant to see if the hypothesis of measurement consistency can be rejected
at the ak level of significance. Then, the AS- 11 mean was compared to CE, RS, and Titration,
individually.
In the absence of adequate controls to determine accuracy in this round robin, the term"golden mean" reflects a practical choice of the most likely point of comparison, not necessarily
the most accurate point of comparison. For example, other methods like ion chromatography
using the new AS-16 column or capillary electrophoresis may prove to be more accurate than ion
chromatography using the AS-1 1 column.
10

3.0 RESULTS AND DISCUSSIONS
3.1 Ion Chromatography
Analytical results obtained: from ion chromatography analyses are summarized in
Appendix C. Laboratory 6 did not report result for sample ps03 because the sample container
arrived at Laboratory 6 damaged. Except for Laboratory 6, all laboratories that performed IC
analysis submitted the results within a month after sample preparation. Laboratory 6 reported
instrument and technical difficulties during the study. The initial set of data from Laboratory 6
showed obvious disagreement with the data from the rest of the laboratories and the data was
rejected at the Lab's request. Laboratory 6 re-analyzed the samples three months after sample
preparation; these will be evaluated separately.
All seven laboratories using ion chromatography for perchlorate analysis reported non-
detects for samples psi0, psi3, and psi7. From individual laboratories, reported method
detection limits perchlorate standard prepared in de-ionized water were 5 tg/L or lower. Table
3.1 lists the reported method detection limits in mg perchlorate per kg of test material, after
adjusting for injection volume, dilution and extraction ratio. Laboratory 2 reported a higher
adjusted detection limit because of the small injection volume required by the microbore column.
Method detection limit from Laboratory 6 was unavailable.
TABLE 3.1 REPORTED IC METHOD DETECTION LIMITSFROM PARTICIPATING LABORATORIES
Adjusted Reported Detection LimitLaboratory (mg/kg)
1 6.002 40.03 0.404 3.005 1.006 NA7 4.00
11

Laboratories 3, 4, and 7 used the AS-11 method with the same instrument conditions
and parameters; the results were compared by paired two sample tests, as described in Section
2.3. Individual hypothesis tests by paired two sample tests for means analyses are shown in
Appendix D. In general, Laboratory 7's results were lower than Laboratory 3's, which were a
little lower than Laboratory 4's. The hypothesis of agreement between Laboratory 7 and
Laboratory 3 had a p-value of 0.0592, and therefore not rejected. A p-value smaller than a/3 =
0.0033 leads to rejection of the null hypothesis. The hypothesis test of agreement between
Laboratory 3 and Laboratory 4 had a p-value of 0.1874, and thus failed to reject also. In the last
of the three pair-wise combinations, the hypothesis test of agreement between Laboratory 7 and
Laboratory 4 had a p-value of 0.0031, which is right at the rejection point of c/3 = .0033.
Laboratory 4's result for sample ps30 was a statistical outlier, contributing to this difference.
Removing the outlier resulted in good agreement between the two laboratories.
All three sets of the normalized differences were approximately normal as discussed in
Section II, thus the paired t-test was used. Since the results from laboratories 3, 4, and 7 were not
statistically different from each other, it was reasonable to average the three values to obtain a"golden mean" for AS-11 perchlorate concentration in each of the 34 samples. As shown in
Appendix E, for each sample, the percent coefficient of variation (% CV) was less than ten,
showing good precision and little variability among the laboratories using the standard AS-11
method.
Laboratory 2 used a 2-mm AS- 11 microbore column instead of a 4-mm AS- 11 standard
bore column for perchlorate analysis. The Shapiro-Wilk test of normality was used to compare
the sample split differences between the AS-i1 "golden mean" results and the results from_
Laboratory 2. These differences were not normally distributed at a probability of less than 0.01.
Therefore non-parametric analysis was used to show that the results from Laboratory 2 were not
different from the "golden mean" using the standard AS-1i method. The non-parametric test
statistic for the differences, p was 0.295 (Appendix E), indicating good agreement in perchlorate
measurements using the AS-11 standard bore method and the microbore.
Laboratories 1 and 5 used an AS-16 column, but the eluent conditions were not the same.
A comparison between Laboratory 1 values and AS-11 "golden mean" in a paired t-test is shown
in Appendix E, and the results from Laboratory 1 were not different than the "golden mean"
12

using the AS-1l method. The hypothesis of consistency had a p-value of 0.0101, which when
testing at the 0.01 confidence level, failed to reject the null hypothesis. Lab 5 results were also
not significantly different from the AS-il "golden mean" (p-value of 0.0560). Overall,
Laboratory 5 reported smaller concentrations than Laboratory I in all but 8 of the 33 samples.
Averaging the two AS-16 laboratory measurements and comparing them to the AS-11"golden mean" values gave the best match of any comparison conducted in this study. The p-
value for paired t-test comparison between the mean AS-I l results and the average AS-16 data
was 0.9248, indicating that the average of the AS-16 results was very close to the AS- 1l results
for each sample.
Although Laboratory 6 used the same AS-I I method, comparison of Laboratory 6 results
to the AS-Il means did not show agreement. The p-value was 0.0001, indicating less than
0.01% chance that the data from Lab 6 agreed with the mean AS-il data. Since Laboratory 6
also analyzed the samples by CE and RS, attempts were made to compare Lab 6's IC data to that
of RS and CE, and there were no agreement among the data. Null hypothesis tests by paired two
sample tests for means analysis for Lab 6' IC and RS data showed absolutely no agreement.
Furthermore, there were no agreement between IC and CE, and CE and RS.
Results for the negative control blanks and positive (100-i.tg/L) perchlorate spikes are
shown in Table 3.2. All seven laboratories reported non-detect for the blank negative control.
Except for Laboratory 6, all labs reported results within 94 to 104% of the expected value,
showing excellent agreement and accuracy. Laboratory 6 did not report results for the spiked
controls.
TABLE 3.2 ION CHROMATOGRAPHY RESULTS OF BLANKSAND 100-gxg/L PERCHLORATE SPIKED CONTROLS
Reported Expected Reported ExpectedLaboratory Blank LCS1 LCS1 LCS2 LCS2
1 ND 96 100 104 100"2 ND 99 100 94 1003 ND 100 100 99 1004 ND 94 100 97 1005 ND 99 100 98 1006 ND NA 100 NA 1007 ND 99 100 99 100
13

Although the laboratories reported excellent duplicate recoveries for the spiked
controls, duplicate sample analyses were shown to vary widely. The disparity in duplicate
sample analyses reflected intra-lot and inter-lot variability. Table 3.3 showed the AS-11 mean
values for duplicate sample analyses. Duplicate samples from a same lot of All Natural Lawn
Restorer psi5 (5,827 mg/kg) and pi21 (2,767 mg/kg) showed an absolute difference of 58%.
The absolute difference for duplicate Supreme Gardens fertilizer sample ps02 (3180 mg/kg) and
the duplicate ps09 (4,193 mg/kg) was about 24%. For duplicate Fall Fertilizer samples, 2,360
mg/kg was reported for psl7 and non-detect (ND) for ps24. Three samples taken from three
different lots of All-Purpose Plant Food had perchlorate concentrations ranging from 3,093 to
7,303 mg/kg. Samples ps08 (937 mg/kg) and psi2 (550 mg/kg) taken from a same lot of
Vegetable Bedding Plant Food showed an absolute difference of 43%. Both ps08 and psi2 were
significantly different than the reported result for sample ps19 (2,620 mg/kg) which taken from a
different lot of Vegetable/Bedding Plant Food.
TABLE 3.3 DUPLICATE ANALYSIS OF TEST MVIATERIALS BY AS-11
METHOD
PerchloratePurchase Concentration
Samples Brand Name Location (mg/kg)psl5 All Natural Lawn Restorer Long Island 5827ps21 All Natural Lawn Restorer Long Island 2767ps02 Supreme Gardens Kansas City 3180ps09 Supreme Gardens Kansas City 4193psl7 Fall Fertilizer Long Island NDps24 Fall Fertilizer Long Island 2360ps08 Vegetable/Bedding Plant Food Kansas City 973ps 12 Vegetable/Bedding Plant Food Kansas City 550psl9 Vegetable/Bedding Plant Food Long Island 2620ps06 All-Purpose Plant Food California 3093ps05 All-Purpose Plant Food Kansas City 6287psl6 All-Purpose Plant Food Long Island 7303
14

3.2 Capillary Electrophoresis
For capillary electrophoresis, a calibration curve was generated by plotting the
concentrations of aqueous sodium perchlorate standards (in deionized water) versus absorbance.
Solutions of 3, 7, 10, 15, 20, 30, 40, 50 and 60 mg/L sodium perchlorate were used to prepare the
standard curve. The correlation coefficient for regression of the calibration curve was better than
0.9973. The limit of detection based on a signal-to-noise ratio of 3:1 for perchlorate was about 3
mg/L (3 ppm). Each solution was analyzed twice and the resulting absorbance values were
averaged. Migration times for the perchlorate peak in all 18 analyses used for the standard curve
ranged from 3.73 to 3.81 min.
Liquid samples were analyzed as received or diluted 1:10 to 1:100 to avoid interference
from a large peak with a migration time matching that of the sulfate anion. Dilution reduced the
sulfate signal to the level where the perchlorate peak was easily distinguished and integrated by
the instrument if it was present above the detection level. Spike recovery analyses ensured
proper peak identifications. Each sample was analyzed in triplicate and an average of triplicate
analyses are reported and shown in Appendix C. The average %CV for the 30 samples in which
perchlorate was detected by CE was 4.4%, based on triplicate analysis of each sample. No
results were reported for ps03 because the sample arrived in a damaged container. No CE data
were reported for LCS1 or LCS2. Individual hypothesis testing between the AS-11 mean and
capillary electrophoresis by paired two sample tests for means analysis is shown in Appendix F,
where agreement is shown with p-value = 0.0225 at the 0.01 level of significance.
3.3 Raman Spectroscopy
The Raman spectra for the perchlorate standard showed four bands at 462, 629, 934, and
1113 cm", consistent with the predicted results using group theory for a tetrahedral molecule 42,
43 The (3N - 6) rule indicated nine normal vibrational modes. The weak lower frequency band
at 462 cm"1 was attributed to doubly degenerated deformation modes, e. The intense line (a,) at
934 cm"n was assigned to the symmetric stretching and contraction of the Cl-O bonds. This band
15

was only observed in the isotropic spectrum but not in the anisotropic spectrum. The two
remaining week bands were assigned to two triply degenerated modes,f 2. The band at 1113 cmn1
was attributed to the anti-symmetric Cl-O stretching modes, and the other at 629 cm'1 was
attributed to the deformation of the anti-symmetric modes. The assignment of the major and
minor peaks was consistent to reference values 42,60
Interference experiments were conducted to see if the 934 cm" peak of perchlorate could
be obscured by the presence of fertilizer components that are Raman active. Standards of nitrate,
sulfate, phosphate, urea, and a mixture of these anions were analyzed with or without
perchlorate. Except for phosphate, none of these common components were found to interfere
with Raman analysis. Phosphate was found to interfere with perchlorate when pH was above
10.5, as a peak at 937 cm" was present. However, protonating P043 species to HPO42- by
lowering the pH to 10.5 or below removed the interference. The pKa of P02- is 12.32. Below
the pH of 10.5, less than 1.5% of the phosphate exists as the PO43 species. All of the fertilizer
samples had pH's below 9.0. Therefore, interference from common fertilizer components is not
expected. A few small peaks, not attributed to nitrate, sulfate, phosphate, and urea, were
observed also, but they were all far removed from 934 cm'". Confidence level of the 934 cm'
peak of perchlorate at below pH 10.5 is high.
The intense 934 cm' peak was used for quantitation. Quantification was performed by
comparing the ratio of the area of the 934 cm" peak of perchlorate to the 2329 cm' peak of
atmospheric nitrogen that is observed in all spectra recorded with adequate laser power and
exposure time. This approach allowed spectra collected under different conditions to be
adequately normalized, and also corrected for minor changes in instrument performance, such as
laser power fluctuations. Two sets of 18 perchlorate standards prepared in de-ionized water
covering the range from 20 to 3,000 ppm were prepared, and 36 data points were used to
generate the calibration line. The calibration line was linear and typically described by the
equation Y = 434 * X - 36.82; where Y is the perchlorate concentration and X is the ratio of
perchlorate and nitrogen peaks. The correlation coefficient value is 0.9980 or better.
Each sample was first run with an exposure time of 20 sec and 5 accumulations co-added,
resulting in a total analysis of 7 min per sample. Results obtained by Raman spectroscopy are
shown in Appendix C. The reported RS method detection limit is 20 ppm. No result was
16

reported for ps0 3 because the sample arrived damaged. The Lab did not report results for LCS 1
and LCS2 because they were below their detection level. Additionally, sample ps34, which is
supposed to be Chilean Nitrate, does not exhibit a peak for nitrate in the Raman Spectrum.
The t-test comparison shows strong disagreement between the AS-Il means and the RS
results with the p-value at 0.0000. Over seventy percent of the RS values were lower than the
AS-II means. The disparity mighi have been caused by Tyndall scattering from the micro-
particles in the solution and fluorescent interference from the organic components of the test
materials 42
Six of the 34 samples exhibited excessive fluorescence; the Raman spectrum could not be
observed at the 20-second exposure time. For all but one of the six samples, the problem was
overcome by lowering the exposure time until the spectrum background near the 934 cm' peak
fell below 15,000 counts. At or below this level of fluorescence, perchlorate could be observed if
present in the sample at above 20 ppm or more. In ps28, the fluorescence was so severe that the
baseline could not be lowered below 15,000 counts without decreasing the exposure to such a
low level that the atmospheric nitrogen peak used as quantification standard was not observable.
In this sample, the sample was shaken with activated charcoal (-50 mg/mL) in order to remove
fluorescent interference. After filtering, the extract was clear and was analyzed at a 20-sec
exposure with no noticeable fluorescence. Use of activated charcoal is a common technique
employed to remove trace-level, high molecular weight organics.
It was suspected that treatment with charcoal would also reduce the level of perchlorate in
ps28. This was investigated by analyzing perchlorate standards in distilled water and in other
fertilizers with varying levels of perchlorate. In each case, the level of perchlorate was
determined before and after charcoal treatment. Charcoal treatment was found to lower the level
of perchlorate, but by a constant amount. It was demonstrated that 36 (± 13) percent of the
perchlorate was removed, regardless of the nature of the matrix. Thus, the value of the
perchlorate reported in Appendix C for ps28 is 1.36 times that actually measured in the charcoal-
treated sample.
17

3.4 Tetraphenylstibonium Sulfate Titration
For tetraphenylstibonium sulfate titration, a calibration curve was generated from
perchlorate standards at 100, 500, 1,000, and 5,000 ppm. Results obtained from titration are
shown in Appendix C. The reported titration method detection limit was 50 ppm (mgfkg). For
the positive 100-gg/L LCS1 and LCS2 controls, titration reported 90 and 104 p.g/L, respectively.
Non-detect was reported for the negative blank. As shown in Appendix E, titration results were
significantly different from the AS- 11 means with a p-value of 0.0002.
In fitting a model to the AS-i 1 perchlorate concentration means, the model given below
is reasonable. However, the model only explains 51.4% of the variability in the perchlorate
numbers, based on phosphorous, nitrogen, and potassium. Sample numbers ps22 and ps31 were
having too much influence on the model, so they were removed. A model should be robust, but
if small amounts of data are pulling the model around, their effect should be removed. After
these samples were removed, the model met all assumptions of the normal error model:
Predicted [C10 4] = 3057.54 + 205.93*[NO3"1 - 456.98*[PO43-] + 14.69*[PO43-] 2
What this model illustrates is that N0 3 is related to the perchlorate level in a linear
fashion with a positive slope, so a unit increases in the N0 3 level results in a 205.93 ppm
increase in the sample's C10 4 concentration, while holding the P043" level constant. Notice that
P043 exhibits a quadratic relationship with C10 4 , where the predicted C10 4" level in a sample
decreases as P043- goes from 0 to 15.55, but then the C10 4- level increases as P043" increases
above 15.55. KV is not in the model because K' did not show a direct relationship with C10 4".
K+ concentration has no predictive capability over C10 4-concentration.
This choice of variables in the model appeared robust no matter which Laboratory or
method was being modeled. Only the coefficients changed, when, for instance, predicting the
perchlorate values for the Titration method, which were significantly different than the AS-11
means. The model had the same variables but the coefficients were:
Predicted Perchlorate = 3454.25 + 219.09*[N0 3"] - 487.26*[PO43-] + 15.76*[PO43-] 2
18

The difference in coefficients iiakes the prediction steeper, so agreement with the AS-i l means
is not good. The Y-intercept changed from 3057.54 to 3454.25, indicating that Titration method
is generally larger than the AS-il values even when N0 3' and P02" levels were at zero.
4.0 Conclusions
A successful inter-laboratory collaborative study on the performance of ion
chromatography methods for perchlorate analysis -in aqueous fertilizer suspensions was
conducted. The study included seven government, private and commercial laboratories, and
evaluated two method variants (AS-11 and AS-16). Three of the laboratories employed the
widely used AS- 1i IC method for perchlorate analysis; the paired t-tests for the means analysis
showed acceptable agreement with little variability (<10% CV) among the data sets. Two
laboratories employed the AS-16 method; the statistical evaluation of the results showed
acceptable agreement. This study also showed good agreement between the microbore and the
standard bore AS-11 columns, rendering credibility in using the microbore column for
perchlorate in limited applications where the analyses are restricted by the sample size.
Furthermore, the study found excellent agreement between two method variants (AS-11
and AS-16). At 99 percent confidence level, the p-value for the means analysis of AS-11 and
AS-16 results by paired t-test comparison was 0.9248. The large p-value indicates that there was
a very high probability of finding the AS-11 and AS-16 mean values were the same. The good
precision between the two methods was also evidenced by the low percent relative deviations in
all five labs' results. The average relative standard deviations from the laboratories for all
samples were less than seven percent, consistent to that observed in the groundwater and
drinking water study . At the conclusion of that study, EPA adopted the AS-16 method as
Method 309.0 for perchlorate analysis in groundwater and drinking water; the EPA method 309.0
is currently being recommended for promulgation 5.
This study found poor agreement between ion chromatography and tetraphenylstibonium
titration results. Overall, compared to ion chromatography, tetraphenylstibonium titration tends
19
to over estimate the perchlorate titration values by about fourteen percent. Reasons accounting
for the over-estimations have been discussed elsewhere 24. This study found good agreement
between capillary electrophoresis and IC but poor agreement between Raman and IC.
This study found good agreement between capillary electrophoresis (CE) and IC
quantitative results. The precision of CE is also good; the average %CV for the 30 fertilizer
samples in which perchlorate was ditected was 4.4%, based on triplicate analyses. CE, like IC,
has no fingerprinting capability for qualitative analysis such as does Raman spectroscopy;
however, the precision for peak migration, shown by the %CV of <1, is good enough to provide
confidence in peak identify if questionable samples are spiked with perchlorate and the peak
area/height increase proportionately with no peak splitting. In summary, this CE method is
accurate, precise and moderately fast; a total sample analysis requires less than 20 min. IC is a
preferred method because of its greater sensitivity. However, for most of the fertilizer samples
CE was sensitive enough for the detection of perchlorate, with a detection limit of about 3-ppm
in the fortified matrix. If a laboratory possesses both IC and CE instrumentation, the CE would
be very useful for initial screening to determine the dilution factor need for IC analysis.
Additionally, the CE is useful for confirmation of IC results, since it is based on an entirely
different separation principle and complimentary to IC.
The disparity in the duplicate sample analyses reflected the inherent heterogeneity of the
fertilizer samples. As expected for any heterogeneous sample, the lawn and garden fertilizer
samples examined in this report exhibited both intra-lot and inter-lot variability. Each sample
tested in this study was essentially a sub-sampling of a fertilizer lot, and a single sub-sampling
datum taken from a heterogeneous sample can not represent the sample as a whole. Hence, the
values as presented in this report were the perchlorate concentrations in the extract of each sub-
sample for a given fertilizer, but the values did not necessarily represent the true concentrations
in the fertilizer brands examined in this study.
The determination of a true perchlorate concentration for a given type or brand of
fertilizer is beyond the scope of this project, since the purpose of this study was to verify methods
performance with respect to matrices having the same quality as the test materials. It would be
economically unfeasible for the collaborative study group to find the true perchlorate
concentration for all 27 brands of fertilizers examined in this study. Because multiple sampling
20

data are required per sample batch, per lot, and per brand, the number of data points and analyses
desired to generate statistically sound values for all of the 27 fertilizer brands would have
increased exponentially and overwhelmed the resources available to this collaborative study
group. This round robin effort was not to establish or define the occurrence of perchlorate for the
final risk assessment. The purpose was to standardize analytical approaches for gaining insight
into the occurrence of perchlorate in 1fertilizers.
Modeling efforts in correlating the perchlorate concentrations to that of potassium,
nitrate, and phosphate were unsuccessful. Multiple linear regression model found no correlation
between perchlorate and potassium, and the model was only able to predict 51.4% of the
variability (R2 = 0.5140) in correlating perchlorate concentration to that of nitrate and phosphate.
The poor prediction in the variability was attributed to data quality. Since fertilizers were shown
to be heterogeneous, the actual N-P-K values, similar to the perchlorate value, were expected to
differ from sub-sample to sub-sample. The N-P-K values used in the predictive modeling effort
were provided by the manufacturers and were not -experimentally determined for each sub-
sample. Manufacturers' N-P-K values were statistical values determined based on multiple
sampling. The actual N-P-K values for each sub-sample may have been higher or lower than the
values provided the manufacturers.
Although the predictability was low, the model was robust. Regardless of the lab or the
method, only the magnitudes or the coefficients changed. The variables (i.e. nitrate and
phosphate) having influence on the predictability of variability did not change. This is
interesting because the presence of perchlorate has been identified in nitrate and phosphate ores15. 61-63 Future perchlorate occurrence study design should carefully incorporate matrix
characterization measurements for pH, anions, and cations.
21

5.0 REFERENCES
1. Las Vegas Sun, September 23, 1997
2. Las Vegas Sun, September 24-25, 1997
3. Las Vegas Sun, September 20, i997
4. Las Vegas Sun, September 8, 1997
5. Las Vegas Sun, October 3, 1997
6. Las Vegas Sun, January 27, 1998
7. "Perchlorate: Overview of Perchlorate Issues." Office of Ground Water and Drinking
Water, United States Environmental Protection Agency, September 20, 1999,
http://www.epa.Lyov/OGWDW/ccl/perchlorlperchlo.html.
8. "Perchlorate in California Drinking Water." California Department of Health Services,
September 1997, http://www.dhs.cahwnet.aov/perevsrv/ddwem/perchl.htm - advice
9. "Region 9 Perchlorate Update." Region 9, United States Environmental Protection
Agency, June 1999, http://www.epa.gov/OGWDW/ccl/perchlor/r9699fac.pdf.
10. "Fact Sheet # 3: Perchlorate." Arizona Department of Environmental Quality, June 15,
1999, http://www.adeg.state.az.us/water/safe/fact.htm#3
11. "National Assessment of Perchlorate Contamination Occurrence, Request For Proposal
#2508, American Water Works Association Research Foundation, Denver, CO, 1998.
12. "Perchlorate: Occurrence." Office of Groundwater and Drinking Water, United States
Environmental Protection Agency, September 20, 1999,
http://www.epa.gov/OGWDW/ccl/perchlor/perchlo.html.
13. Lewis, S. L.; Susarla, S.; Wolfe, N. L.; McCutcheon, S. C. "Perchlorate Accumulation
from Fertilizer in Leafy Vegetation," presented at 218' American Chemical Society,
New Orleans, LA, 21-23 August 1999.
14. Susarla, S.; Collette, T. W.; Garrison, A. W.; Wolfe, N. L.; McCutheon, S. C.
"Perchlorate Identification in Fertilizers." Environmental Science and Technology,
1999.
15. Ericksen, G. E. "Geology and Origin of the Chilean Nitrate Deposits" in Geological
22

Survey Professional Paper 1188. United States Government Printing Office,
Washington DC, 1981, pp. 1-37.
16. Van Moort, J. C. "Natural Enrichment Processes of Nitrate, Sulfate, Chloride, Iodate,
Borate, Perchlorate and Chromate in the Caliches of Northen Chile" in IV Congreso
Geologico Chileno. Universada Del Norte Chile, Antofagasta, Chile, 1985, pp. 3-674 to
3-702.
17. Eldridge, J. E., Tsui, D. T., Perchlorate in Fertilizers, (Unpublished Data], May 1999.
18. Welcher, F. J. Organic Anal~ical Reagents, Vol. 3. Van Nostrand, New York, N.Y.,
1947, pp. 138-146.
19. Welcher, F. J. Organic Analytical Reagents, Vol. 3. Van Nostrand, New York, N.Y.,
1948, pp. 326-7.
20. Harris, D. C. Quantitative Chemical Analysis, 3rP ed. Freeman, New York, N.Y., 1991,
pp. 146, 722-723.
21. Hayes, 0. B. Mikrochim. Acta., 1968, 3, 647.
22. Chadwick, T. C. Anal. Chem. 1973, 45, 985-986.
23. Boyd, G. E.; Larson, Q. V., J. Amer. Chem. Soc. 1968, 90, 5092.
24. Morris, M. D. Anal. Chem. 1968, 37, 977.
25. Shapiro, S. S.; Wilk, M. B., Biometrika, 1965, 52, 591 - 611.
26. Bums, D. T.; Chimpalee, N.; Harriot, M. Anal. Chim. Acta., 1989, 217, 177.
27. Bums, D. T,; Hanprasopwattana, P. Anal. Chim. Acta., 1980, 118, 185.
28. Weiss, J.A.; Stanburry, J.B. Anal. Chem., 1972, 44, 619.
29. Kawase, J.; Nakae, A.; Yamanaka, M. Anal. Chem., 1979, 51, 1640.
30. Kawase, J. Anal. Chem., 1980, 52, 2124.
31. Yamamoto, Y.; Okamoto, N.; Tso, E., Anal. Chim. Acta., 1970,47, 185.
32. Avdalovic, N.; Pohl, C. A.; Rocklin, R. D.; Stillian, J. R. Anal. Chem. 1993, 65, 1470.
33. Nann, A.; Pretsch, E. J. Chromatogr. A. 1994, 676, 437.
34. Gross, L.; Yeung, E. S. J. Chromatogr. A. 1989,480, 169.
35. Okada, T. Chem. Commun. 1996, 6, 1779
36. Holderbeke, M. V.; Vanhoe, H.; Moens, L.; Dams, R. Biomed. Chromatogr. 1995, 9,
281.
23

37. De Backer, B. L.; Nagels, L. J.; Alderweireldt, F. C. Analytica. Chimca. Acta. 1993,
273,449.
38. Hauser, P. C.; Renner, N. D.; Hong, A. P. C. Analytica. Chimica. Acta. 1994, 295, 181-
186.
39. Hauser, P. C.; Hong, A. P. C.; Renner, N. D. J. Cap. Elec. 1995, 5, 209-212.
40. Guilbault, G. G.; Rohim, T. J. Intern. J. Environ. Anal. Chem. 1975, 4, 51-64.
41. Krokhin, 0. V.; Elefterov, A. I.; Obrezkov, 0. N.; Shpigun, 0. A. Zh. Anal. Khim. 1993,
48,111.
42. Grasselli, J. G.; Bulkin, B. J. Analytical Raman Spectroscopv: Chemical Analysis Vol
114. Wiley-Interscience Publication, 1991, pp. 62-77.
43. William, R. J. Anal. Chem. 1983, 55, 851-854.
44. California Department of Health Services, Sanitation and Radiation Laboratories
Branch. Determination of Perchlorate by Ion Chromatography. Rev. 0, June 3, 1997.
45. Dionex Application Note 121, Dionex Corporation, Sunnyvale, CA, 1998
46. Jackson, P. American Laboratory, April 1998.
47. "Standard Operating Procedure for Perchlorate," Office of Ground Water and Drinking
Water, United States EPA, http://www.epa.gov/OGWDW/ccl/perchlor/perchlo.html.
48. Chaudhuri, S., Okamoto, H., Pia, S., Tsui, D., "Inter-Agency Perchlorate Steering
Committee Analytical Subcommittee Report", Environmental Protection Agency
Collaborative Study, 1999.
49. California Department of Health Services, Sanitation and Radiation Laboratories
Branch. Determination of Perchlorate by Ion Chromatography. Rev. 1.0, March 3, 1999.
50. Jackson, P. E.; Streib, T.; Rohrer, J. S. "Determination of Trace-Level Perchlorate in
Drinking Water and Ground Water by Ion Chromatography," presented at 1999
Pittsburgh Conference, Orlando, FL, 7-12 March 1999.
51. Jackson, P. E.; Streib, T.; Rohrer, J. S. "Determination of Trace-Level Perchlorate in
Drinking Water and Ground Water by Ion Chromatography," presented at Perchlorate
Conference, Ontario, CA, 18-21 March 1999.
52. Tsui, David; Clewell, R.; Eldridge, J. E.; Mattie, D. R. Perchlorate Analysis by AS-16
Separation Column. Air Force Technical Report, May 1999.
24

53. Jackson, P. E.; Streib, T.; Rohrer, J. S. "Determination of Trace-Level Perchlorate in
Drinking Water and Ground Water by Ion Chromatography," presented at 218"
American Chemical Society, New Orleans, LA, 21-23 August 1999.
54. Shen, Y.; Harrington, P. "Observations Concerning the CDHS Method." [ Letter]
Orange County Water District. 27 April 1998.
55. Eaton, A.; Haghani A. "Analfysis of Perchlorate - Right or Wrong?" Presented at
Water Quality Technology Conference, Denver, CO, November, 1997.
56. Eaton, A.; Haghani, A.; Cox, N.; Wong, E. "A Comparison of the Ruggedness of
Different Analytical Methods for Perchlorate." Presented at Water Quality Technology
Conference, 1998.
57. Hautman, D. P.; Munch, D. J.; Eaton, A.; Haghani, A. W. "Draft: Method 314.0
Determination of Perchlorate in Drinking Water Using Ion Chromatography, Revision
1.0" USEPA, Office of Groundwater and Drinking Water, 12 October 1999.
58. Milton, J. S.; Arnold, J.C., Introduction to Probability and Statistics: Principles and
Applications for Engineering and the Computing Sciences, McGraw-Hill: New York,
1995, 354-359.
59. Neter, J.; Kutner, M.H.;Nachtsheim, C.J.; Wasserman, W., Applied Linear Statistical
Models, Irwin-McGraw-Hill:Chicago, 1996.
60. Nyquist, R. A.; Putzig, C. L.; Leugers, M. A. Eds. The Handbook of Infrared and Raman
Spectra of Inorganic Compounds and Organic Salts, Vol. 1, Academic Press, San Diego,
1997, 42.
61. Schumacher, J. C. Perchlorates: Their Properties, Manufacture and Uses, American
Chemical Society Monography 146, Reinhold Publisher, New York, 1960.
62. Nicolet, M. Planetary and Space Science, 1970, 18, 1111-1118.
63. Simonaitis, R.; Heicklen, J. Planetary and Space Science, 1975, 23, 1567-1569.
25
6.0 ACKNOWLEDGEMENTS
This work was a collaborative effort on many levels. The authors would like to
acknowledge the following laboratories without who's timely assistance the analyses would not
have been possible. Chemical Teiting Service (Diamond Bar, CA), Del Mar Analytical
Laboratories (Irvine, CA), American Pacific Corporation (Cedar City, UT), United Technologies
Corporation (San Jose, CA), Montgomery Watson Laboratories (Pasadena, CA), and Thiokol
Corporation (Brigham City, UT).
Special thanks goes to Rebecca Clewell and Teri Sterner (Wright-Patterson AFB, OH) for
their support and to Jimmy Avants (National Exposure Research Laboratory, Athens) for the
capillary electrophoresis analysis.
The Lab-6 IC, CE and RS data were supplied without interpretation by Dr. Steven
McCutcheon and Dr. Sridhar Susarla (NRC Associate), Dr. Wayne Garrison, and Dr. Timothy
Collette and Dr. Ted Williams (NRC Associate), respectively, USEPA, Athens Ecosystems
Research Division.
26

- m r- < oI
Ow C*4 e4z -.0 NC
z M -C14 N 1
z r
ca c a~ Wu Wu Wu u C02 Wu ca Cu Cu on toU2~~ Cl l,-, Cl r_ r_2 Cl _ cd cd2 U O
20 O E 0 C) 0 .>4 cn Zu En2 u zu zu z~C d uC u C
u Cu EE ~ C
Cd C
GC G
0u Z, 0
u 0 0 0000 - --- -
z 4-0Cu7
0 wJ=,C -- 0 E - - -

o 4 -4 N -M z z.- 0n 0n V. )0
a4z
jzzzzz z z z
0 0i 0d 0 0 - -
W~ 40 - - - - 4- 0- 40 11-
. u Cu Cu u u~00 000 0 0 0z
~ -C
E E 4- 4- z z
4- - 0 r- g E
000
S 0 ;R a.-1. ~ ~ (r 0 o3cv
0
13. 0 1% $
-0 0 : - a)E0
0 Cucn - ~ 0 c8O .2 0
o. 0 0 - 0 0
.. ca c c.) W c c 0 ca c
=w.) . m IO I. D
Ic"
C'4)
<- U E
0 E
21.
I-P
cq~ z
0 *
8 4)
r. .A
E) 4) 0g '
I- 4

APPENDIX C:
RESULTS OF FERTILIZER ANALYSIS BY TITRATION, ION CHROMATOGRAPHY,
CAPILLARY ELECTROPHORESIS (CE), AND RAMAN SPECTROSCOPY (RS)
Titration Labi Lab2 Lab3 Lab4 Lab 5 Lab 6 Lab 7 CE RSSamples (mgfkg) (mg/kg) (mg/kg) (mg/kg) (mg/kg) (mg/kg) (mg/kg) (mg/kg) (mg/kg) (makgPs01 5900 4680 5150 5300 4710 4872 5703 4700 5557 4637ps02 2950 3490 2360 3100 3240 3077 3954 3200 3752 2569s03 9900 8950 7730 9400 8860 7678 NR 8600 NR NRs04 6800 7620 6300 8000 7660 6908 9023 7400 4255 7186
ps05 7150 6700 4760 6200 6360 6898 7760 6300 6535 4677s06 3400 3220 3680 3000 3090 3128 3563 3190 4399 2169s07 5440 4730 8830 5000 4920 4369 5554 4800 5821 4979s08 1250 1090 968 970 1010 903 1034 940 917 726s09 5200 4380 5120 4300 4380 4049 4949 3900 4039 3836
psio < 50.0 < 6.0 < 40.0 < 0.4 < 3.0 < 1.0 <4.0 < 0.4 < 3.0 < 20.0pSl1 8600 8160 6260 8800 8290 7068 8559 7400 7592 7673psl 2 750 636 597 530 580 526 593 540 707 286
s13 <50.0 <6.0 <40.0 <0.8 0.6 < 1.0 ND 13 <3.0 <3.00s14 10350 9480 8640 9000 9920 6896 9688 8100 9476 8514s15 6140 6060 5190 6100 6080 4673 6278 5300 6146 5867
•s16 6980 7510 5640 7400 7210 6194 7439 7300 7196 6079s17 < 50.0 < 6.0 <40.0 < 2.2 < 3.0 < 1.0 <4.0 < 0.4 < 3.0 < 3.00s18 740 733 832.- 750 690 904 682 600 495 342s19 3100 2650 3270 2700 2660 2053 2648 2500 2687 2408s20 6250 5380 10000 4800 5560 7098 5768 5400 5470 4070s21 3400 2960 2560 2900 3000 2376 2943 2400 2918 2617s22 1700 1549 2646 1400 1530 1995 1433 1300 1894 1153s23 450 464 738 340 430 514 391 360 707 < 3.00s24 2850 2590 2840 2200 2480 2530 2600 2400 3493 2618s25 5250 4223 3680 4000 4310 3727 4586 4200 4528 4343s26 3550 3073 4810 3200 3160 2834 3474 3000 3722 3391s27 6300 6680 7120 5500 6450 6246 6816 5300 7117 4650s28 2800 2599 3623 2200 2490 3135 2840 2500 3185 1690s29 5800 5189 5290 5400 5420 4576 4819 4900 7186 4699s30 15600 14300 20090 14000 16400 13649 17397 13000 15644 15734s31 16800 13290 14380 13000 15100 11749 15603 12000 13817 14120s32 8200 6381 6300 6100 6560 5862 5477 6300 7416 6214s33 8250 7563 2600 7400 7870 7201 8018 7100 8302 7278s34 32800 26310 32980 27000 30900 26120 32454 30000 26013 28183
NR = Not Reported
30

APPENDIX D:
PAIRED TWO SAMPLE TESTS FOR MEANS ANALYSIS ON AS-li METHOD
ab 7 Vs. Laboratory 3 a = 0.01
Shapiro-Wilk Normality test W=0.9632Prob(<W) 0.3793
eaired t-testMean Difference -0.30738Std Error 0.157135Df 323t-Stat -1.95605p-value > Itt 0.0592
baboratory 7 Vs. Laboratory 4 c = 0.01
Shapiro-Wilk Normality test W=0.9397Prob(<W) 0.0828aired t-test
Mean Difference -0.53432Std Error 0.166783Df 3t-Stat -3.20367p-value > Itl 0.0031
Laboratory 3 Vs. Laboratory 4 C = 0.01
Shapiro-Wilk Normality test W=0.93326Prob(<W) 0.053212Paired t-testMean Difference -0.226955Std Error 0.168475Df 327t-Stat -1.34711p-value > ItI 0.1874
31

APPENDIX-E:
PERCHLORATE IN GARDEN AND LAWN FERTILIZERS BY AS-11
PercentLab 7 Lab 3 Lab 4 Average Standard Coefficient
Samples (mg/kg) (mg/kg) (mg/kg) (mg/kg) Deviation of VariationpsOl 4700 5300 4710 4903 344 7%ps02 3200 3100 3240 3180 72 2%ps03 8600 9400 8860 8953 408 5 %ps04 7400 8000 7660 7687 301 4 %ps05 6300 6200 6360 6287 81 1 %ps06 3190 3000 3090 3093 95 3 %ps07 4800 5000 4920 4907 101 2 %ps08 940 970 1010 973 35 4 %ps09 3900 4300 4380 4193 257 6 %psIl 7400 8800 8290 8163 709 9 %ps12 540 530 580 550 26 5 %psl4 8100 9000 9920 9007 910 10%ps15 5300 6100 6080 5827 456 8%ps16 7300 7400 7210 7303 95 1 %psl8 600 750 690 680 67 10%psl9 2500 2700 2660 2639 106 4%ps20 5400 4800 5560 5253 401 8 %ps21 2400 2900 3000 2767 71 3%ps22 1300 1400 1530 1410 115 8 %ps23 360 340 430 367 37 10%ps24 2400 2200 2480 2360 144 6 %ps25 4200 4000 4310 4170 157 4%ps26 3000 3200 3160 3120 106 3 %ps27 5300 5500 6450 5750 141 2 %ps28 2500 2200 2490 2397 170 7 %ps29 4900 5400 5420 5240 295 6 %ps3M 13000 14000 16400 14467 1747 10%ps31 12000 13000 15100 13367 1485 11 %
Ms32 6300 6100 6560 6320 231 4%ps33 7100 7400 7870 7457 388 5%ps34 30000 27000 30900 29300 2042 7 %
32

APPENDIX - F
PAIRED TWO SAMPLE TEST FOR MEANS ANALYSIS ON AS-li VERSUS AS-16,CAPILLARY ELECTROPHORESIS, RAMAN SPECTROSCOPY, AND TITRATION
S-11 Average Vs. Laboratory 2 c = 0.01
S hapiro-Wilk Normality t~st W--0.85902Prob(<W) 0.000Paired t-test (Nonparametric)
Df 3t-Stat -59.50p-value > ItI 0.295
S-11 Average Vs. Laboratory 1 (AS-16) a = 0.01
Shapiro-Wilk Normality test W=0.948665Prob(<W) 0.151aired t-test
Mean Difference -0.33115Std Error 0.121099Df 3t-Stat -2.7345p-value > ItI 0.0101
S-11 Average Vs. Laboratory 5 (AS-16) a = 0.01
,Shapiro-Wilk Normality test W =0.963Prob(<W) 0.388
4..aired t-test
Mean Difference 0.35321Std Error 0.178093Df 3t-Stat 1.98332p-value > Itl 0.0565
33

AS11 Average Vs. Lab 6 -IC Analysis a -- 0.01
Shapiro-Wilk Normality test W=0.882071Prob(<W) 0.002aired t-test (Nonparametric)
Df 2
t-Stat -182.5p-value > jtI 0.0001
S-ll Avera ge Vs. CE Analysis a = 0.01
Shapiro-Wilk Normality test W=0__.91428_8Prob(<W) 0.0211aired t-test
Mean Difference -1.024154Std Error 0.424712)Df 29t-Stat -2.411409Prob > It[ 0.0225
S-11 Average Vs. RS Analysis a= 0.01
Shapiro-Wilk Normality test W=0.88847Prob(<W) 0.0043Paired t-test (Nonparametric)
Df 2____t_-Stat 179.51__-value > _tl o0.o000
AS-11 Vs. Titration a = 0.01
Shapiro-Wilk Normality test W_=0.92719Prob(<W) 0.035Paired t-test
Mean Difference -1.42230"Std Error 0.341295Df 33t-Stat -4.167373Prob > It_ 0.0002
34