Embed Size (px)
Citation preview

2006Semiannual ReportFor the six months ended September 30, 2006

Thousands ofMillions of yen U.S. dollars
2006 2005 2006
For the period:
Net sales.................................................................................................................................................. ¥0,645,852 ¥0,593,579 $05,478,429
Operating income .................................................................................................................................. 25,562 12,577 216,829
Net income.............................................................................................................................................. 11,414 5,233 96,819
Research and development expenses.................................................................................................. 14,300 11,200 121,300
Depreciation and amortization.............................................................................................................. 14,879 14,384 126,211
Net cash provided by (used for) operating activities .......................................................................... (10,767) 11,216 (91,331)
Per share (in yen and U.S. dollars):
Net income.............................................................................................................................................. ¥ 7.33 ¥ 3.63 $ 0.06
Cash dividends ....................................................................................................................................... — — —
At end of the period:
Total assets.............................................................................................................................................. ¥1,319,100 ¥1,193,901 $11,189,244
Total shareholders’ equity ..................................................................................................................... 244,170 207,499 2,071,168
Orders received and outstanding:
Orders received during the period....................................................................................................... ¥0,763,844 ¥0,516,694 $06,479,294
Order backlog at end of the period ..................................................................................................... 1,424,960 1,191,717 12,087,200
Number of employees ......................................................................................................................... 29,461 29,024
Notes: 1. This semiannual report has been prepared in conformity with generally accepted accounting principles and practices in Japan.2. All dollar figures herein refer to U.S. currency. Yen amounts have been translated, for convenience only, at ¥117.89 to $1.00, the approximate rate of
exchange at September 30, 2006.
Net Sales (Billions of yen)
Apr. 2005—Mar. 2006
Apr. 2004—Mar. 2005
Apr. 2003—Mar. 2004
Apr. 2002—Mar. 2003
First half Second half
0 500 1,000 1,500
537.7
523.3
539.7
637.0
593.6
Apr. 2006—Mar. 2007 645.9
703.9
728.9
699.9
Net Income (Loss) (Billions of yen)
Apr. 2005—Mar. 2006
Apr. 2004—Mar. 2005
Apr. 2003—Mar. 2004
Apr. 2002—Mar. 2003
First half Second half
–5 0 5 10 15 20
5.2
Apr. 2006—Mar. 2007 11.4
3.4
(3.4)
(3.5) 16.5
8.1
11.3
9.7
Consolidated Financial HighlightsKawasaki Heavy Industries, Ltd. and Consolidated Subsidiaries For the six months ended September 30, 2006 and 2005

1
Preparation of a New Medium-Term Business Plan and Emphasis on Compliance
Under its previous medium-term business plan, which wasbased on the fundamental policy of “Quality Followed byQuantity,” the KHI Group has exercised selectivity and focus inits allocation of resources. As a consequence, the Group hasbeen able to restore the profitability of its activities, improveits financial position, and steadily improve the soundness of itsbusiness base. To move up to the next stage in growth anddevelopment, we have prepared a new medium-term businessplan entitled “Global K.” The new plan will begin in the cur-rent fiscal year and extend through the fiscal year endingMarch 31, 2011 and targets before-tax return on invested capital (ROIC)*1 of 14% and recurring profit*2 of ¥90 billion.
As we implement this new plan, we will be working to greatlyimprove the quality of our management activities. This willinclude strengthening our internal control systems, placingstrong emphasis on compliance, and endeavoring to fulfill our responsibilities to society. With these goals in mind, inOctober 2006, we formed a specialized unit, the CorporateSocial Responsibility (CSR) Department, which has the responsibility for driving our CSR activities.
The KHI Group is steadily implementing various policies tostrengthen profitability in all its business activities and reformits business portfolio, with the objective of enhancing its cor-porate value. We would like to take this opportunity to askyou, our shareholders, for your renewed support and coopera-tion.
December 2006
Tadaharu OhashiPresident
Further Gains in Operating Income and Net Income
The Japanese economy continued on an expansionary trendduring the interim period under review, ended September 30,2006, propelled by growth in personal consumption andexports as well as by increases in private capital investmentdriven by an improvement in corporate earnings. OutsideJapan, although some sectors in the U.S. economy slowed, the world economy continued to be generally strong, drivenespecially by expansion in Europe, China, and the rest of Asia.
Nevertheless, the operating environment for the KawasakiHeavy Industries (KHI) Group continued to present challenges.Lackluster conditions prevailed in the domestic public worksmarket, and prices of raw materials, such as steel and crude oil,remained at high levels, while prices of more costly materials,such as aluminum and titanium, rose sharply and shortagesemerged.
Amid these conditions, the KHI Group maintained its proactiveposture of confronting the challenges and aggressively pursu-ing market opportunities in the operating environment. As aconsequence, the Group’s net sales grew ¥52.3 billion, or 8.8%from the interim period of the previous year, to ¥645.9 billion,led especially by higher sales in the Aerospace and ConsumerProducts & Machinery segments.
Profitability showed further improvement, as a consequence of active measures to increase earnings in all aspects of theGroup’s operations. Operating income rose ¥13.0 billion, up103.2% over the interim period of the previous year, to ¥25.6billion. Net income for the period rose ¥6.2 billion, up 118.1%,to ¥11.4 billion.
Our basic policy is to pay dividends appropriate to earningsperformance, while giving careful attention to increasingretained earnings. After giving due consideration to the uncer-tainties in the operating environment for the full fiscal yearending March 31, 2007, we have decided not to pay a cash dividend for the interim period under review.
New Medium-Term Business Plan “Global K” Targeting Before-Tax ROIC of 14% and Recurring Profit of ¥90 Billion
To Our Shareholders
*1, *2 See page 6

2
What Each Business Should Be 10 Years in the Future
KHI’s new Medium-Term Business Plan “Global K” will begin in fiscal 2007, ending March 31, 2007, and extend through
fiscal 2011. The first step in preparing this plan was to create a vision for the KHI Group and each of its business domains
a decade into the future. Looking toward this vision of the future, KHI then developed this medium-term plan for growth
for the next five years. The plan will be revised as necessary in fiscal 2009.
Enriching Lifestyles and Helping Safeguard the Environment: Global KawasakiKHI aims to become a leading global enterprise that enriches lifestyles and helps safeguard the environment through its businesses,which encompass land, sea and air transportation systems, as well as the energy and environmental engineering sectors.
Medium-Term Business Plan “ ”“Global Kawasaki”—The Next Exciting Stage
Rolling StockA world-class maker of rolling stock systems that draws on
leading-edge technologies and feature top quality
AerospaceA leader in Japan’s aerospace industry, with solid competitive-
ness internationally in aircraft manufacturing
Gas Turbines & MachineryA prime mover manufacturer with world-class technologies
in the transportation equipment and energy fields
Consumer Products & MachineryA leisure vehicle and engine manufacturer with a top brand
recognized for high quality and high performance
Energy & Environmental EngineeringA global leader in energy and environmental engineering with
a reputation built on superb, proprietary technologies
Industrial RobotsA world-leading industrial robot manufacturer with a reputation
built on key and systems technologies for high-performance
and multifunctional robots
ShipbuildingA shipbuilder with world-class profitability that draws on
advanced technologies and a production site in China to
withstand market swings
Industrial Hydraulic ProductsOne of the world’s top five hydraulic equipment manufactur-
ers, with outstanding technologies and product quality
1 . C O R P O R A T E V I S I O N
Medium-Term Business Plan
33
2 . B A S I C O B J E C T I V E S
Quality Followed by Quantity
Selectivity and Concentration
Stronger Non-Price Competitiveness
KHI should make major leaps forward to become a highly profitable, globally recognized enterprise by
(1) Implementing ongoing reforms to establish a sustainable growth cycle
(2) Achieving steady growth in keeping with the Global Kawasaki Vision
(3) Building a solid Kawasaki brand by leveraging consumer trust
(4) Reinforcing the CSR organization to enhance corporate quality
3 . S E L E C T I V I T Y A N D C O N C E N T R A T I O N
“Global Kawasaki”
1. Positioning of KHI BusinessesFour Core Businesses Rolling Stock, Aerospace, Gas Turbines & Machinery, and Consumer Products & Machinery
Should be operating globally as earnings drivers of the KHI Group
Developing BusinessEnergy & Environmental Engineering(Redirecting the Plant & Infrastructure Engineering business toward energy-related and environmental-related activities to achieve further growth and development)
Should be nurtured as a new earnings driver of the Group by implementing various measures, including redirection of businesses and M&A
Self-Sufficient BusinessesIndustrial Robots, Shipbuilding, and Industrial Hydraulic Products
Should establish a position as a specialist in each business field and secure stable earnings
Rol
ling
Sto
ck
Aer
osp
ace
Gas
Tur
bin
es &
Mac
hine
ry
Con
sum
er P
rod
ucts
& M
achi
nery
Ene
rgy
& E
nvir
onm
enta
l Eng
inee
ring
Ind
ustr
ial R
obot
s, S
hip
bui
ldin
g,
and
Ind
ustr
ial H
ydra
ulic
Pro
duc
ts
FourCore Businesses
DevelopingBusiness
Self-SufficientBusinesses

4
Merchant vessels(production in China)
For construction machinery
Gigacells®
Biomass power generationsystemsTreatment of harmful substancesLNG tanksEnergy and environmentrelated facilities
Industrial robots
Industrial plants
Naval vesselsMerchant vessels (production in Kobe and Sakaide)
For industrial equipment and ships
Energy &EnvironmentalEngineering
Industrial Robots
Shipbuilding
IndustrialHydraulic Products
Note: Meaning of terms highlighted in red, which indicate new products under development, are as follows: (a) Gigacells®: Nickel-metal hydride batteries, Note: (b) LRV: Light rail vehicle, tram car with super-low floor, (c) P-X: Next maritime patrol aircraft, (d) P-X: Next transport aircraft
2. Positioning of Business Units/Products
PriorityBusinesses
DevelopingBusinesses
Businesses withStable Earnings
Businesses RequiringStructural Reform
Will drive sustainablegrowth. Expand earnings
through focused investments
Strengthen competitivenessthrough focused investments
Achieve consistent returns
Railcars for overseas markets
Defense aircraftCommercial aircraft
Engines forcommercial aircraft
Motorcycles forindustrialized markets
Railway systemsGigacell-powered LRVs
Policies will be decided going forward and focus will be on public-sector investment related areasin Japan.
Convert P-X and C-X tocommercial aviation useCommercial helicopters
Gas turbine powergeneration systemsGas engines
Motorcycles forindustrializing markets
Railcars forJapanese market
Guidance systems
Engines for defense sector(for aircraft and ships)Steam turbines for marine andindustrial applicationsAerodynamic machinery
General-purposegasoline engines
Rolling Stock
Aerospace
Gas Turbines & Machinery
Consumer Products & Machinery

5
Capital investment plan Invest ¥300 billion over five years, or ¥60 billion annually(This compares with an average of ¥47 billion over the past three years.)
R&D investment plan Invest ¥200 billion over five years, or ¥40 billion annually(This compares with an average of ¥27 billion over the past three years.)
Personnel plan To compensate for the increased number of employees reaching mandatory retirement age and to facilitate implementation of KHI’s expansion plans, KHI will hire 5,000 new staff over five years, or 1,000 people annually. This will result in an estimated increase in the number of employees to 31,000 at the end of fiscal 2011, 2,000 higher than at the end of fiscal 2006.
KHI will place emphasis on allocating management resources to priority businessesand developing businesses to ensure future growth.
4 . P L A N S F O R A L L O C A T I O N O F M A N A G E M E N T R E S O U R C E S
5 . P R I O R I T Y I N I T I A T I V E S
1) Strengthen technological capabilitiesWith renewed awareness that technology is a key source of earnings, reinforce technological development capabili-ties, production technology capabilities, and intellectualasset strategies.
2) Encourage market-oriented thinking and actionBecome more market-focused to strengthen non-pricecompetitiveness. Keep in mind that profits are generatedfrom the market. All thinking and action in all processes ofbusiness operations should stem from the market.
3) Accelerate global business developmentAimed at future growth, accelerate global business devel-opment in sales, production, and procurement, whilecooperating with partner companies.
4) Create and cultivate new products and businessCultivate next-generation core businesses throughout theduration of the Global K plan by upgrading technologiesand creating new businesses fulfilling high-priority socialneeds.
5) Strengthen Group management capabilitiesWhile maintaining the advantages of the internal companysystem of management efficiency and flexibility, reinforcethe Companywide strategy development and Group man-agement/oversight functions at headquarters aimed atincreasing the centripetal force of the KHI Group and har-monizing the optimization of the Company’s individualparts and the Group as a whole.
Create a smaller, strong, and more agile headquarters and selectively reinforce the operations of subsidiaries and affiliates.
6) Promote Corporate Social Responsibility (CSR)Improve management quality by promoting CSR with afocus on enhancing internal control systems and compli-ance, increase management transparency (commitmentand accountability), strengthen risk management capabili-ties, and conduct environment-friendly business operations.

Enriching lifestyles and helping safeguard the environment
“Global Kawasaki”
6
6 . Q U A N T I T A T I V E T A R G E T S
• Strengthen profitability• Reinforce financial position
• Increase ROIC • Increase the ratio of recurring • profit to net sales
Targets forFiscal 2011
• Before-tax ROIC*1: 14%• Recurring profit*2 to net sales ratio: 5.8%• Net sales: ¥1,560 billion• Operating income: ¥100 billion• Recurring profit: ¥90 billion• Debt-to-equity ratio*3: 100% or less• Shareholders’ equity ratio: 30% or more
*1: Before-tax ROIC: Earnings before interest and taxes (EBIT) divided by invested capital*2: Recurring profit is used in accounting standards generally accepted in Japan. It is the sum of *2: operating income, net interest income (expenses), dividend income, and other non-operating *2: but recurring items.*3: Debt-to-equity ratio: Ratio of interest-bearing debt to total shareholders’ equity
Policy for Shareholder Return: Gradually increase dividends in line with improvement in profitability. Set a medium- to long-term
Policy for Shareholder Return: target payout ratio of 30%, with dividends set based on financial projections and the progress
Policy for Shareholder Return: toward the implementation of the business plan.
Cautionary StatementThe performance outlook and forecasts stated in these materials were prepared by Kawasaki Heavy Industries, Ltd. (hereinafter, KHI),based on the circumstances as of the release date, and include potential risks and uncertain factors that relate to economic conditions,foreign currency exchange rates, tax rules, regulations, and other factors. Accordingly, please note that the actual operating results,financial position, and business development of KHI may sometimes differ considerably from the descriptions in the present projections.

7
This segment secured orders amount-ing to ¥69.5 billion, ¥31.0 billion, or80.7% higher than in the same period of the previous year. Orders wereobtained for 10 new vessels in total:one LNG carrier, seven bulk carriers,and two LPG carriers. This compared toorders a year earlier for three new ves-sels in total: two LNG carriers and oneLPG carrier.
Sales showed a decline of ¥11.6 billion,down 21.6%, to ¥42.1 billion, due tolower sales of newbuildings. The seg-ment reported an operating loss of ¥2.1 billion, mainly because of increasesin prices of materials.
Shipbuilding
This segment continued to secure largeorders for commuter train cars fromNorth America. As a result, orders leaped¥78.4 billion, or 101.0%, to ¥156.1 billion.
Sales were up ¥2.6 billion, or 3.1%, to¥86.9 billion. Although sales of rollingstock in Japan decreased, deliveries foroverseas customers, including the TaiwanHigh Speed Rail Corporation increased.
Operating income climbed ¥3.9 billion,up 171.1%, to ¥6.1 billion, owing to an improvement in the profitability of overseas projects.
Rolling Stock & Construction Machinery
Orders received increased ¥20.8 billion,or 42.1%, to ¥70.2 billion, because ofhigher demand from the commercial air-craft sector, principally orders from TheBoeing Company for component partsfor the Boeing 777 passenger aircraft.
Sales rose ¥23.2 billion, or 25.4%, to¥114.5 billion, due to the contributionof sales for the development of the P-X
next maritime patrol aircraft and C-Xnext transport aircraft for the JapanDefense Agency, an increase in sales ofcomponent parts for the Boeing 777passenger aircraft, and other factors.Operating income declined ¥0.5 billion,or 9.0%, to ¥5.1 billion, owing to theadverse impact of higher material costs.
Aerospace
Review of Operations

8
Sales came to ¥79.8 billion, a gain of¥19.6 billion, or 32.6%, over the sameperiod of the previous fiscal year, assales of the hydraulic machinery business
to customers in China increased.Operating income climbed ¥1.4 billion,up 47.5%, to ¥4.4 billion.
Other
Orders won by this segment increased¥2.2 billion, or 2.2%, to ¥99.3 billion, as a consequence of higher demand forindustrial gas turbines and other factors.
Sales climbed ¥11.4 billion, or 16.5%, to¥80.5 billion, mainly due to an increase
in sales for component parts for jetengines for commercial aircraft.Operating income rose a marked ¥3.5billion, up 258.4%, to ¥4.8 billion, drivenby growth in sales, favorable move-ments in foreign exchange rates, andother factors.
Gas Turbines & Machinery
This segment reported a sharp rise inorders of ¥68.8 billion, up 261.8%, to¥95.1 billion, on the strength of majororders from overseas customers. Theseincluded a cement plant in Vietnam anda ferronickel plant in Korea.
Sales declined ¥16.5 billion, down24.0%, to ¥52.1 billion, owing to adecline in sales of plants ordered
previously by overseas customers. This segment reported an operating loss of¥3.7 billion, which was a ¥1.9 billionimprovement from a larger operatingloss in the same period of the previousfiscal year, owing to better operatingresults in the industrial plant business.
Plant & Infrastructure Engineering
Sales increased ¥23.6 billion, up 14.2%,to ¥189.9 billion, boosted by higher rev-enues generated from motorcycles inNorth America and Europe. Operatingincome rose sharply by ¥5.8 billion, up112.0%, to ¥10.9 billion, supported byexpansion in profits of the industrial
robot business and the favorableimpact of movements in foreignexchange rates.
Consumer Products & Machinery

9
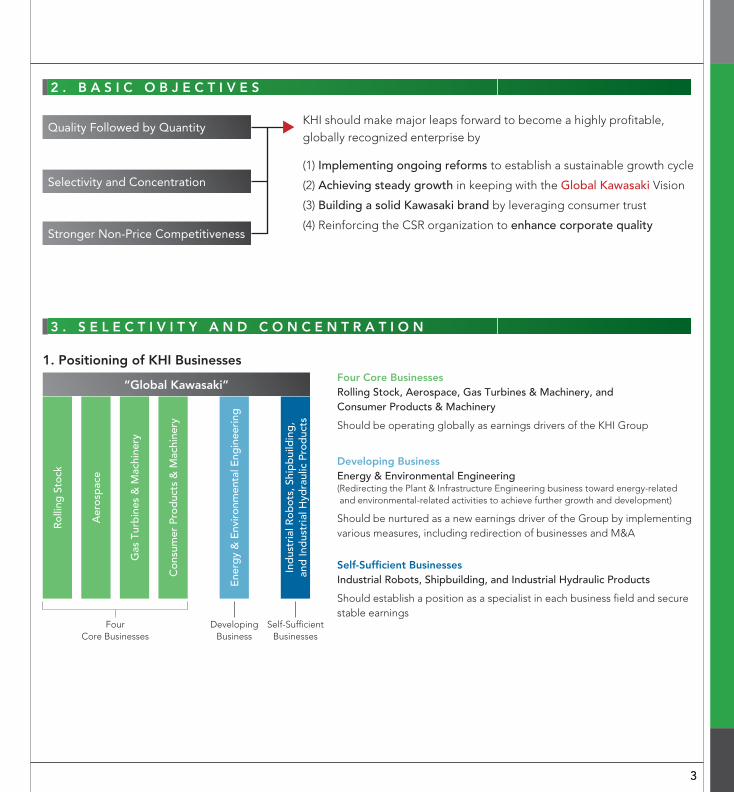
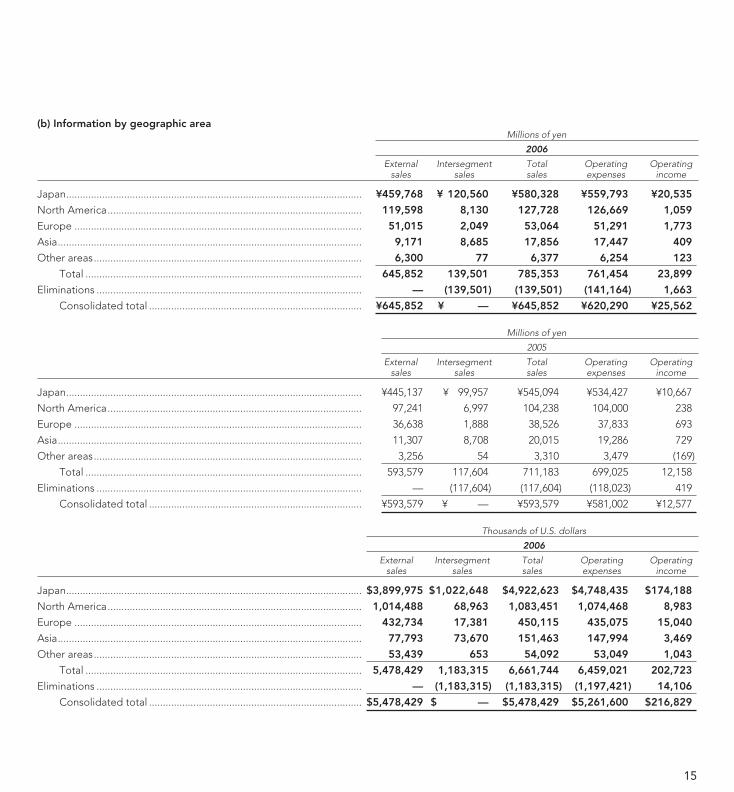
Sales in Japan rose ¥14.6 billion, up 3.3% in comparisonwith the interim period of the previous year, to ¥459.8 bil-lion, mainly because of an increase in sales of the parentcompany. Operating income climbed ¥9.9 billion, up92.5%, to ¥20.5 billion.
In North America, sales jumped ¥22.4 billion, up 23.0%, to ¥119.6 billion, boosted by robust sales of motorcyclesand other factors. Operating income rose ¥0.8 billion, up 345.0%, to ¥1.1 billion.
Sales in Europe expanded ¥14.4 billion, up 39.2%, to¥51.0 billion, because of strong sales of motorcycles in this region. Operating income rose ¥1.1 billion, up155.8%, to ¥1.8 billion.
In Asia, sales declined ¥2.1 billion, down 18.9%, to ¥9.2billion, owing to lower sales of motorcycles in Indonesiaand other factors. Operating income dropped ¥0.3 billion,or 43.9%, to ¥0.4 billion.
In other areas, sales grew ¥3.0 billion, up 93.5%, to ¥6.3billion, while operating income amounted to ¥0.1 billion,an improvement from an operating loss of ¥0.2 billion forthe same period a year earlier.
Review by Geographic Segment
Total assets at the end of the interim period were¥1,319.1 billion, ¥35.0 billion higher than at the end of the previous fiscal year (ended March 31, 2006), mainlybecause of an increase in inventories accompanying therise in orders. Interest-bearing debt rose ¥29.9 billion, to¥349.7 billion, accompanying the increase in the scale ofthe Group’s operations.
Among cash flows, net cash flows from operating activi-ties amounted to a net outflow of ¥10.8 billion, primarilyas a consequence of the previously mentioned increasein inventories, compared with a net inflow of ¥11.2 billionin the same period of the previous fiscal year.
Net cash used for investing activities amounted to ¥26.7billion, reflecting capital expenditures and other factors,compared with a net outflow of ¥7.7 billion in the same
period of the previous fiscal year. As a result, free cashflow amounted to a net outflow of ¥37.5 billion.
Net cash provided by financing activities amounted to¥24.8 billion, due mainly to an increase in short-term borrowings which was partially offset by an increase inthe repayment of corporate bonds. This compared with a net outflow of ¥15.5 billion in the same period of the previous fiscal year.
As a result of these movements in cash flows, cash andcash equivalents at the end of the interim period underreview were ¥24.9 billion, ¥12.6 billion lower than at theend of the previous fiscal year.
Financial Position

10
Thousands ofMillions of yen U.S. dollars
September 30, 2006 March 31, 2006 September 30, 2005 September 30, 2006(unaudited) (unaudited) (unaudited)
Assets:
Current assets:
Cash on hand and in banks........................................... ¥0,025,006 ¥0,037,650 ¥0,032,685 $ 212,113
Receivables, less allowance .......................................... 429,542 438,204 375,420 3,643,583
Inventories...................................................................... 425,754 383,017 375,367 3,611,451
Other current assets ...................................................... 57,832 57,028 53,533 490,559
Total current assets ................................................... 938,134 915,899 837,005 7,957,706
Investments and long-term loans, less allowance .......... 86,015 76,757 84,250 729,621
Net property, plant and equipment................................. 249,200 246,219 239,731 2,113,835
Intangible and other assets .............................................. 45,751 45,210 32,915 388,082
Total assets............................................................. ¥1,319,100 ¥1,284,085 ¥1,193,901 $11,189,244
Liabilities and shareholders’ equity:
Current liabilities:
Short-term borrowings and current
portion of long-term debt........................................... ¥0,182,746 ¥0,162,746 ¥0,145,614 $ 1,550,140
Payables.......................................................................... 404,909 409,942 331,495 3,434,634
Advances from customers............................................. 111,846 98,590 132,533 948,732
Other current liabilities.................................................. 122,631 131,381 91,006 1,040,215
Total current liabilities............................................... 822,132 802,659 700,648 6,973,721
Long-term liabilities:
Long-term debt, less current portion........................... 167,003 157,057 194,296 1,416,600
Others ............................................................................. 85,795 81,273 86,601 727,755
Total long-term liabilities .......................................... 252,798 238,330 280,897 2,144,355
Minority interests ............................................................... — 5,508 4,857 —
Shareholders’ equity:
Common stock............................................................... 92,106 92,085 81,427 781,288
Capital surplus ............................................................... 42,110 42,094 31,390 357,197
Retained earnings.......................................................... 107,457 100,776 90,135 911,502
Net unrealized gains on securities ............................... 12,720 14,097 19,155 107,897
Gain (loss) on hedging items ........................................ (3,698) — — (31,368)
Foreign currency translation adjustments ................... (11,620) (11,426) (14,467) (98,566)
Treasury stock ................................................................ (43) (38) (141) (365)
Minority interests ........................................................... 5,138 — — 43,583
Total shareholders’ equity ........................................ 244,170 237,588 207,499 2,071,168
Total liabilities and shareholders’ equity ............. ¥1,319,100 ¥1,284,085 ¥1,193,901 $11,189,244
Condensed Consolidated Balance SheetsKawasaki Heavy Industries, Ltd. and Consolidated Subsidiaries As of September 30 and March 31, 2006 and September 30, 2005

11
Thousands ofMillions of yen U.S. dollars
2006 2005 2006
Net sales ........................................................................................................................................................ ¥645,852 ¥593,579 $5,478,429
Cost of sales .................................................................................................................................................. 555,715 518,619 4,713,843
Gross profit............................................................................................................................................ 90,137 74,960 764,586
Selling, general and administrative expenses............................................................................................ 64,575 62,383 547,757
Operating income ................................................................................................................................ 25,562 12,577 216,829
Other income (expenses):
Interest and dividend income.................................................................................................................. 1,891 2,014 16,040
Equity in income of unconsolidated subsidiaries and affiliates............................................................ 855 (103) 7,253
Interest expense ....................................................................................................................................... (2,912) (2,678) (24,701)
Other, net .................................................................................................................................................. (5,156) (3,617) (43,736)
Income before income taxes and minority interests ......................................................................... 20,240 8,193 171,685
Income taxes ................................................................................................................................................. (8,577) (2,832) (72,754)
Minority interests in net income of consolidated subsidiaries ................................................................. (249) (128) (2,112)
Net income............................................................................................................................................ ¥ 11,414 ¥ 5,233 $ 96,819
Retained earnings:
Balance at beginning of the period ........................................................................................................ ¥ — ¥ 88,704 $ —
Net income for the period ....................................................................................................................... — 5,233 —
Cash dividends.......................................................................................................................................... — (3,606) —
Bonuses to directors and statutory auditors .......................................................................................... — (84) —
Reduction due to change of consolidation period of subsidiaries ...................................................... — — —
Other.......................................................................................................................................................... — (112) —
Balance at end of the period ....................................................................................................................... ¥ — ¥ 90,135 $ —
Condensed Consolidated Statements of Operations and Retained EarningsKawasaki Heavy Industries, Ltd. and Consolidated Subsidiaries For the six months ended September 30, 2006 and 2005 (unaudited)

12
Thousands ofMillions of yen U.S. dollars
2006 2005 2006
Cash flows from operating activities:
Income before income taxes and minority interests ............................................................................ ¥20,240 ¥ 8,193 $ 171,685
Adjustments to reconcile net income before income taxes and minority
interests to net cash provided by operating activities:
Depreciation and amortization........................................................................................................... 14,879 14,384 126,211
Increase in assets ................................................................................................................................. (34,449) (6,771) (292,213)
Increase in liabilities............................................................................................................................. 12,935 2,150 109,721
Other..................................................................................................................................................... (24,372) (6,740) (206,735)
Net cash provided by (used for) operating activities ...................................................................... (10,767) 11,216 (91,331)
Cash flows from investing activities:
Acquisition of tangible and intangible assets ....................................................................................... (15,909) (15,305) (134,948)
Acquisition of investments in securities................................................................................................. (11,850) (425) (100,517)
Other......................................................................................................................................................... 1,024 8,038 8,686
Net cash used for investing activities................................................................................................. (26,735) (7,692) (226,779)
Cash flows from financing activities:
Increase (Decrease) in short-term borrowings ...................................................................................... 39,513 (4,055) 335,168
Proceeds from long-term debt............................................................................................................... 18,355 15,503 155,696
Repayment of long-term debt................................................................................................................ (28,289) (23,189) (239,961)
Other......................................................................................................................................................... (4,807) (3,717) (40,775)
Net cash provided by (used for) financing activities ....................................................................... 24,772 (15,458) 210,128
Effect of exchange rate changes................................................................................................................. 118 173 1,001
Net decrease in cash and cash equivalents ............................................................................................... (12,612) (11,761) (106,981)
Cash and cash equivalents at beginning of the period........................................................................... 37,506 44,385 318,144
Decrease in cash and cash equivalents arising from exclusion of consolidated subsidiaries........... — (111) —
Cash and cash equivalents at end of the period ...................................................................................... ¥24,894 ¥32,513 $ 211,163
Condensed Consolidated Statements of Cash FlowsKawasaki Heavy Industries, Ltd. and Consolidated Subsidiaries For the six months ended September 30, 2006 and 2005 (unaudited)

13
Consolidated Statements of Shareholders’ EquityKawasaki Heavy Industries, Ltd. and Consolidated Subsidiaries For the six months ended September 30, 2006 (unaudited)
Thousands Millions of yen
2006
Balance at March 31, 2006 ....................... 1,557,715 ¥92,085 ¥42,094 ¥100,776 ¥14,097 ¥ — ¥(11,426) ¥(38) ¥5,508
Net income for the interim period...... — — — 11,414 — — — — —
Issue of new shares............................... 224 21 15 — — — — — —
Cash dividends ..................................... — — — (4,673) — — — — —
Treasury stock purchased, net............. — — 1 — — — — (5) —
Bonuses to directors and
statutory auditors.............................. — — — (14) — — — — —
Other .................................................... — — — (46) (1,377) (3,698) (194) — (370)
Balance at September 30, 2006 ......... 1,557,939 ¥92,106 ¥42,110 ¥107,457 ¥12,720 ¥(3,698) ¥(11,620) ¥(43) ¥5,138
Number of shares of
common stock
Common stock
Capitalsurplus
Retainedearnings
Net unrealized gains on securities
Gain (loss) on hedging items
Foreign currency translation
adjustments
Treasurystock
Minority interests
Thousands of U.S. dollars
2006
Balance at March 31, 2006 ............................................... $781,110 $357,062 $854,831 $119,578 $ — $(96,921) $(322) $46,722
Net income for the interim period .............................. — — 96,819 — — — — —
Issue of new shares ....................................................... 178 127 — — — — — —
Cash dividends.............................................................. — — (39,639) — — — — —
Treasury stock purchased, net ..................................... — 8 — — — — (42) —
Bonuses to directors and statutory auditors .............. — — (119) — — — — —
Other ............................................................................. — — (390) (11,680) (31,368) (1,646) — (3,139)
Balance at September 30, 2006............................... $781,288 $357,197 $911,502 $107,897 $(31,368) $(98,566) $(365) $43,583
Common stock
Capitalsurplus
Retainedearnings
Net unrealized gains on securities
Gain (loss) on hedging items
Foreign currency translation
adjustments
Treasurystock
Minority interests

14
(a) Information by industry segmentMillions of yen
2006
External Intersegment Total Operating Operatingsales sales sales expenses income (loss)
Shipbuilding ............................................................................................... ¥ 42,107 ¥ 1,296 ¥ 43,403 ¥ 45,456 ¥ (2,053)Rolling Stock & Construction Machinery ................................................. 86,925 260 87,185 81,040 6,145Aerospace................................................................................................... 114,452 614 115,066 109,968 5,098Gas Turbines & Machinery ........................................................................ 80,509 7,941 88,450 83,629 4,821Plant & Infrastructure Engineering ........................................................... 52,114 9,068 61,182 64,910 (3,728)Consumer Products & Machinery............................................................. 189,928 4,318 194,246 183,342 10,904Other........................................................................................................... 79,817 20,224 100,041 95,611 4,430
Total .................................................................................................... 645,852 43,721 689,573 663,956 25,617Eliminations ................................................................................................ — (43,721) (43,721) (43,666) (55)
Consolidated total ............................................................................. ¥645,852 ¥ 000— ¥645,852 ¥620,290 ¥25,562
Millions of yen
2005
External Intersegment Total Operating Operatingsales sales sales expenses income (loss)
Shipbuilding ............................................................................................... ¥ 53,736 ¥ 589 ¥ 54,325 ¥ 53,561 ¥ 764Rolling Stock & Construction Machinery ................................................. 84,331 465 84,796 82,529 2,267Aerospace................................................................................................... 91,293 951 92,244 86,643 5,601Gas Turbines & Machinery ........................................................................ 69,093 7,150 76,243 74,898 1,345Plant & Infrastructure Engineering ........................................................... 68,609 6,121 74,730 80,395 (5,665)Consumer Products & Machinery............................................................. 166,339 2,295 168,634 163,490 5,144Other........................................................................................................... 60,178 21,846 82,024 79,021 3,003
Total .................................................................................................... 593,579 39,417 632,996 620,537 12,459Eliminations ................................................................................................ — (39,417) (39,417) (39,535) 118
Consolidated total ............................................................................. ¥593,579 ¥ 000— ¥593,579 ¥581,002 ¥12,577
Thousands of U.S. dollars
2006
External Intersegment Total Operating Operatingsales sales sales expenses income (loss)
Shipbuilding ............................................................................................... $ 357,172 $ 10,993 $ 368,165 $ 385,580 $ (17,415)Rolling Stock & Construction Machinery ................................................. 737,340 2,205 739,545 687,420 52,125Aerospace................................................................................................... 970,837 5,208 976,045 932,802 43,243Gas Turbines & Machinery ........................................................................ 682,916 67,360 750,276 709,382 40,894Plant & Infrastructure Engineering ........................................................... 442,056 76,919 518,975 550,598 (31,623)Consumer Products & Machinery............................................................. 1,611,061 36,628 1,647,689 1,555,195 92,494Other........................................................................................................... 677,047 171,550 848,597 811,019 37,578
Total .................................................................................................... 5,478,429 370,863 5,849,292 5,631,996 217,296Eliminations ................................................................................................ — (370,863) (370,863) (370,396) (467)
Consolidated total ............................................................................. $5,478,429 $ 0,000— $5,478,429 $5,261,600 $216,829
Segment InformationKawasaki Heavy Industries, Ltd. and Consolidated Subsidiaries For the six months ended September 30, 2006 and 2005 (unaudited)
15
(b) Information by geographic areaMillions of yen
2006
External Intersegment Total Operating Operatingsales sales sales expenses income
Japan........................................................................................................... ¥459,768 ¥ 120,560 ¥580,328 ¥559,793 ¥20,535
North America............................................................................................ 119,598 8,130 127,728 126,669 1,059
Europe ........................................................................................................ 51,015 2,049 53,064 51,291 1,773
Asia.............................................................................................................. 9,171 8,685 17,856 17,447 409
Other areas................................................................................................. 6,300 77 6,377 6,254 123
Total .................................................................................................... 645,852 139,501 785,353 761,454 23,899
Eliminations ................................................................................................ — (139,501) (139,501) (141,164) 1,663
Consolidated total ............................................................................. ¥645,852 ¥ 000— ¥645,852 ¥620,290 ¥25,562
Millions of yen
2005
External Intersegment Total Operating Operatingsales sales sales expenses income
Japan........................................................................................................... ¥445,137 ¥ 99,957 ¥545,094 ¥534,427 ¥10,667
North America............................................................................................ 97,241 6,997 104,238 104,000 238
Europe ........................................................................................................ 36,638 1,888 38,526 37,833 693
Asia.............................................................................................................. 11,307 8,708 20,015 19,286 729
Other areas................................................................................................. 3,256 54 3,310 3,479 (169)
Total .................................................................................................... 593,579 117,604 711,183 699,025 12,158
Eliminations ................................................................................................ — (117,604) (117,604) (118,023) 419
Consolidated total ............................................................................. ¥593,579 ¥ 000— ¥593,579 ¥581,002 ¥12,577
Thousands of U.S. dollars
2006
External Intersegment Total Operating Operatingsales sales sales expenses income
Japan........................................................................................................... $3,899,975 $1,022,648 $4,922,623 $4,748,435 $174,188
North America............................................................................................ 1,014,488 68,963 1,083,451 1,074,468 8,983
Europe ........................................................................................................ 432,734 17,381 450,115 435,075 15,040
Asia.............................................................................................................. 77,793 73,670 151,463 147,994 3,469
Other areas................................................................................................. 53,439 653 54,092 53,049 1,043
Total .................................................................................................... 5,478,429 1,183,315 6,661,744 6,459,021 202,723
Eliminations ................................................................................................ — (1,183,315) (1,183,315) (1,197,421) 14,106
Consolidated total ............................................................................. $5,478,429 $ 0000— $5,478,429 $5,261,600 $216,829

16
(c) Overseas salesThousands of
Millions of yen % Millions of yen % U.S. dollars
2006 2005 2006
Overseas % of Overseas % of Overseassales net sales sales net sales sales
North America ................................................................................... ¥155,019 24.0% ¥125,730 21.2% $1,314,946
Europe................................................................................................ 57,932 8.9 51,991 8.8 491,407
Asia ..................................................................................................... 96,354 15.0 105,594 17.8 817,321
Other areas ........................................................................................ 60,221 9.3 46,077 7.7 510,824
Total............................................................................................ ¥369,526 57.2% ¥329,392 55.5% $3,134,498
Effective April 1, 2006, Kawasaki Heavy Industries, Ltd., and its consolidated subsidiaries adopted a new accounting standard for
“Presentation of Net Assets in the Balance Sheet” issued by the Accounting Standards Board of Japan. As a result of adopting the
standard, “Minority interests” and “Gain (loss) on hedging items” are presented in Shareholders’ equity.
Changes in Accounting Policies

17
Thousands ofMillions of yen U.S. dollars
2006 2005 2006
Net sales:Shipbuilding ................................................................................................................................................ ¥ 42,107 ¥ 53,736 $ 357,172Rolling Stock & Construction Machinery .................................................................................................. 86,925 84,331 737,340Aerospace ................................................................................................................................................... 114,452 91,293 970,837Gas Turbines & Machinery......................................................................................................................... 80,509 69,093 682,916Plant & Infrastructure Engineering ............................................................................................................ 52,114 68,609 442,056Consumer Products & Machinery.............................................................................................................. 189,928 166,339 1,611,061Other............................................................................................................................................................ 79,817 60,178 677,047
Total ......................................................................................................................................................... ¥645,852 ¥593,579 $5,478,429
Orders received:Shipbuilding ................................................................................................................................................ ¥ 69,507 ¥ 38,469 $ 589,592Rolling Stock & Construction Machinery .................................................................................................. 156,102 77,678 1,324,133Aerospace ................................................................................................................................................... 70,175 49,371 595,258Gas Turbines & Machinery......................................................................................................................... 99,313 97,161 842,421Plant & Infrastructure Engineering ............................................................................................................ 95,093 26,285 806,625Consumer Products & Machinery.............................................................................................................. 189,928 166,339 1,611,061Other............................................................................................................................................................ 83,726 61,391 710,204
Total ......................................................................................................................................................... ¥763,844 ¥516,694 $6,479,294
Thousands ofMillions of yen U.S. dollars
As of As of As of As ofSeptember 30, 2006 March 31, 2006 September 30, 2005 September 30, 2006
Order backlog:Shipbuilding ....................................................................... ¥ 315,263 ¥ 289,227 ¥ 252,825 $ 2,674,213Rolling Stock & Construction Machinery ......................... 412,985 346,310 297,326 3,503,139Aerospace .......................................................................... 256,954 301,599 247,671 2,179,608Gas Turbines & Machinery................................................ 214,002 195,108 194,754 1,815,268Plant & Infrastructure Engineering ................................... 187,030 144,147 169,345 1,586,479Consumer Products & Machinery..................................... — — — —Other................................................................................... 38,726 34,053 29,796 328,493
Total ................................................................................ ¥1,424,960 ¥1,310,444 ¥1,191,717 $12,087,200
Net Sales, Orders and Order Backlog by Industry SegmentFor the six months ended September 30, 2006 and 2005 (unaudited)

Kawasaki Corporate Data(As of September 30, 2006)
Kawasaki Heavy Industries, Ltd.
Kobe Head Office:Kobe Crystal Tower, 1-3, Higashikawasaki-cho 1-chome,Chuo-ku, Kobe, Hyogo 650-8680, Japan
Tokyo Head Office:World Trade Center Bldg.,4-1, Hamamatsu-cho 2-chome,Minato-ku, Tokyo 105-6116, Japan
Founded: 1878
Incorporated: 1896
Paid-in Capital: ¥92,106,094,655
Number of Shares Issued: 1,557,939,285
Number of Shareholders: 153,691
Number of Employees: 29,461
Stock Exchange Listings:Tokyo, Osaka, Nagoya
Newspaper in Which Public Notices Are Made:Nihon Keizai Shimbun
Transfer Agent:The Chuo Mitsui Trust and Banking Company, Limited33-1, Shiba 3-chome,Minato-ku, Tokyo 105-8574, Japan
Handling Office:The Chuo Mitsui Trust and Banking Company, LimitedOsaka Branch Office2-21, Kitahama 2-chome,Chuo-ku, Osaka 541-0041, Japan
Independent Auditors:KPMG AZSA & Co.Kobe Crystal Tower, 1-3, Higashikawasaki-cho 1-chome,Chuo-ku, Kobe, Hyogo 650-8680, Japan
ADR Facility:KHI has a sponsored American Depository Receipt (ADR) facility.ADRs are traded in the over-the-counter (OTC) market in theUnited States under CUSIP number 486 359 20 1 with each ADR representing four ordinary shares.
ADR Depository:The Bank of New York101 Barclay St., 22 West,New York, NY 10286, U.S.A.Phone: 1-212-815-2042U.S. Toll Free: 888-269-2377
(888-BNY-ADRS)http://adrbny.com
KHI Web Site at: http://www.khi.co.jp
Printed in Japan
This report was printed on 100% recycled paper with a whitenessdegree of 85% using the waterless printing process, which emits noharmful chemicals, and soy-based ink, which is made from plant material that emits only low levels of volatile organic chemicals.