Embed Size (px)
Citation preview
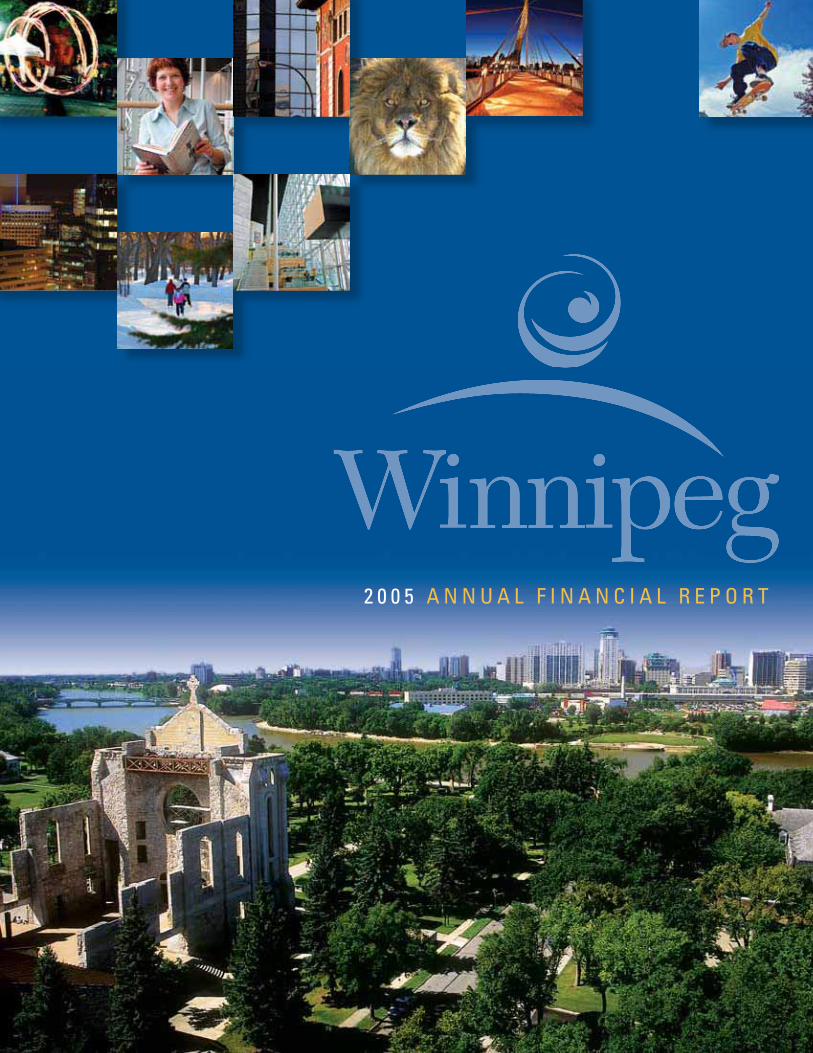
2 0 0 5 A N N U A L F I N A N C I A L R E P O R T

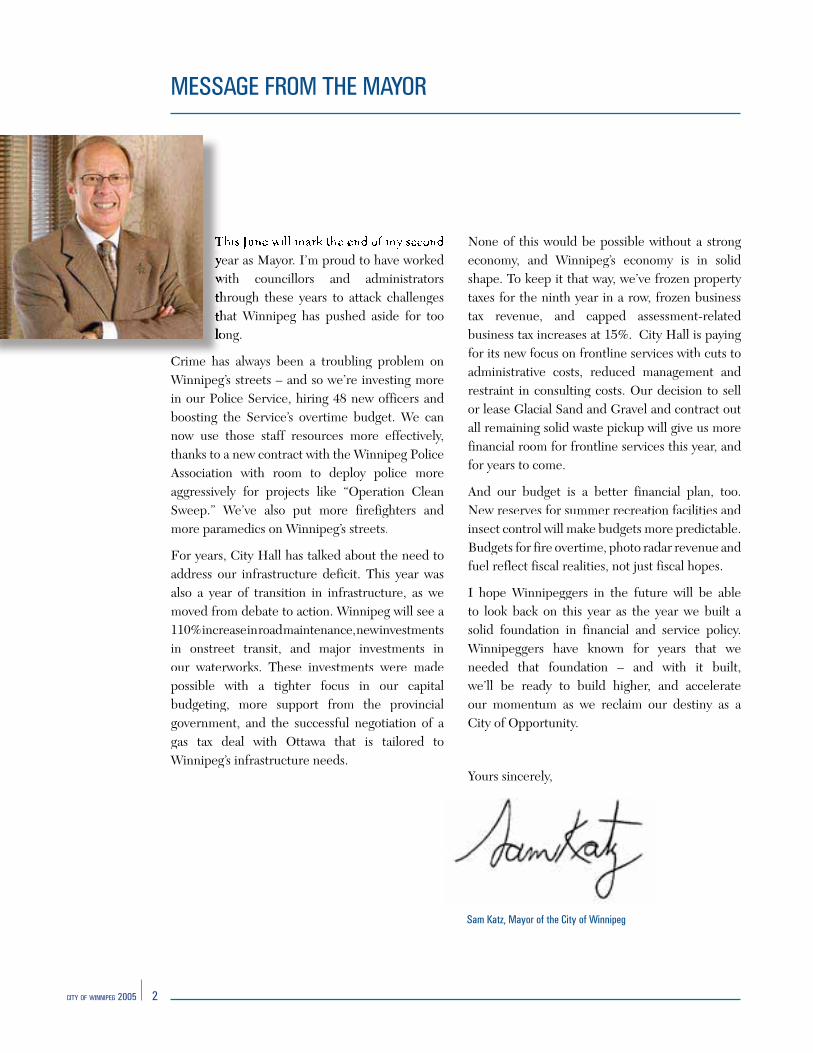
year as Mayor. I’m proud to have workedwith councillors and administratorshrough these years to attack challengeshat Winnipeg has pushed aside for too ong.
Crime has always been a troubling problem on Winnipeg’s streets – and so we’re investing more in our Police Service, hiring 48 new officers and boosting the Service’s overtime budget. We can now use those staff resources more effectively, thanks to a new contract with the Winnipeg PoliceAssociation with room to deploy police moreaggressively for projects like “Operation Clean Sweep.” We’ve also put more firefighters and more paramedics on Winnipeg’s streets.
For years, City Hall has talked about the need toaddress our infrastructure deficit. This year was also a year of transition in infrastructure, as wemoved from debate to action. Winnipeg will see a 110% increase in road maintenance, new investmentsin onstreet transit, and major investments in our waterworks. These investments were made possible with a tighter focus in our capital budgeting, more support from the provincial government, and the successful negotiation of a gas tax deal with Ottawa that is tailored toWinnipeg’s infrastructure needs.
None of this would be possible without a strongeconomy, and Winnipeg’s economy is in solid shape. To keep it that way, we’ve frozen property taxes for the ninth year in a row, frozen businesstax revenue, and capped assessment-related business tax increases at 15%. City Hall is paying for its new focus on frontline services with cuts to administrative costs, reduced management and restraint in consulting costs. Our decision to sell or lease Glacial Sand and Gravel and contract outall remaining solid waste pickup will give us morefinancial room for frontline services this year, andfor years to come.
And our budget is a better financial plan, too. New reserves for summer recreation facilities and insect control will make budgets more predictable. Budgets for fire overtime, photo radar revenue andfuel reflect fiscal realities, not just fiscal hopes.
I hope Winnipeggers in the future will be able to look back on this year as the year we built a solid foundation in financial and service policy. Winnipeggers have known for years that we needed that foundation – and with it built,we’ll be ready to build higher, and accelerate our momentum as we reclaim our destiny as a City of Opportunity.
Yours sincerely,

I am pleased to present The City of Winnipeg’s Annual Financial Report or 2005. It records, and reflects, the
progress the City has made in achieving City Council’s key goals. It reflects a vision of Winnipeg as a city of diversity, vitality, and opportunity – a vision that staff areworking hard to help Council achieve.
As a City, we believe strongly in providing affordable, accountable service to itizens. In 2005, Council cut business tax
downtown by 20%, froze property taxes, increased funding for police services, provided transitdiscounts for seniors, and maintained frontline services. The 2005 Capital Budget continued the City’s pay-as-you-go strategy, foregoing the assumption of any new tax-supported external debt for the next six years.
The City is continuing to make fiscal progress.Winnipeg’s net tax-supported debt has been reduced by 43% since 1999, resulting in lower debt servicing costs. In November 2005, Moody’s Investors Service maintained the City’s credit rating at Aa2; in October 2005, Standard & Poor’s had maintained this rating at AA. Standard & Poor’s identified the City’s strengths as:
The City’s three-year budget (from 2004-2006) received the Government Finance Officers’ Association Budget Award. Looking ahead, the City continues to improve its affordability with enhanced use of information technology, and the identification of internal economies. At the same time, the City is maintaining a high standard of service to citizens, in keeping with Council’s priorities and the goals of Plan Winnipeg.
Winnipeg is becoming a more appealing place to do business, as the City continues to implementrecommendations of the final report of the Mayor’s Red Tape Commission. The Permits X-Press Improvement Project is streamlining approval processes and making service more accessible to customers of our Planning, Property,and Development Department.
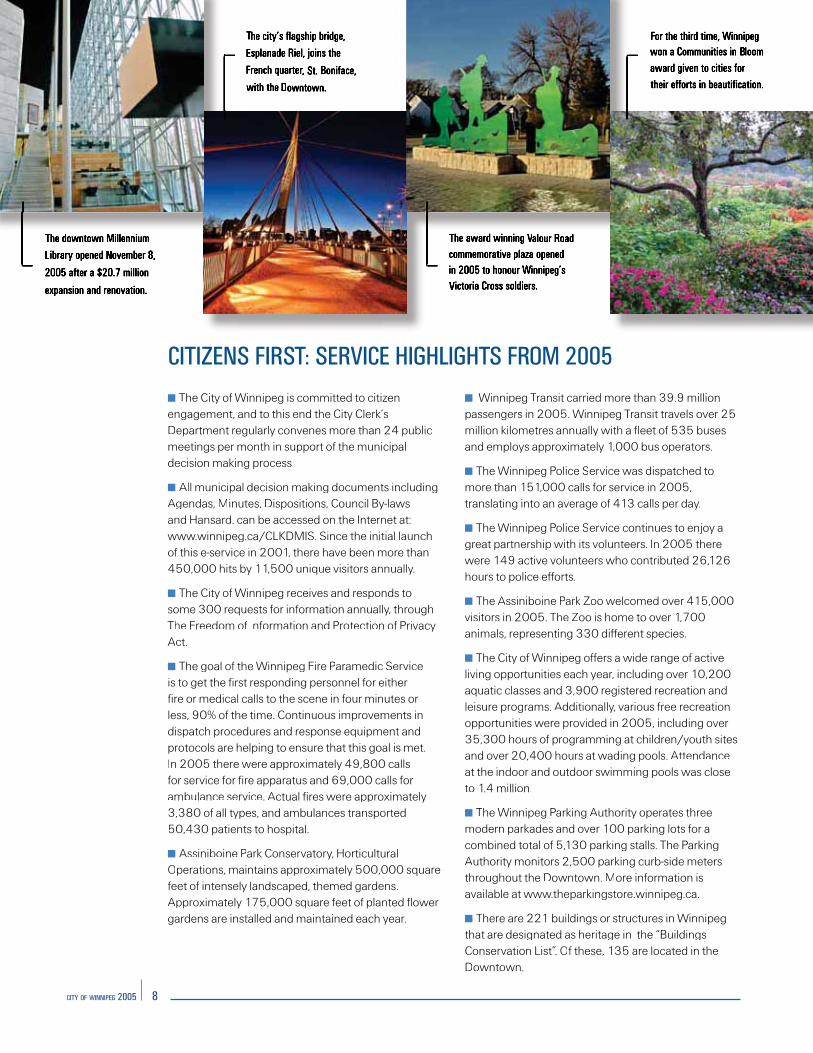
Winnipeggers have long identified quality of life as a goal that defines our community. It is a goalin which the City continues to invest. In 2005, the new Millennium Library opened its doors, a great community resource, and a landmark for generations to come.
We are becoming an even cleaner, even greener city. In 2005, recycling reached an all-time high, of over 42 million kilograms. Work on a new, state-of-the-art water treatment plant is continuing, with completion anticipated in 2008. Last summer, as well, Winnipeg received a “Communities in Bloom” national award, of which we are very proud.
We continue to promote excellence in all areas of service provision, from police and fire paramedic services to transit and the zoo. Through theWinnipeg Housing and Homelessness Initiative, the City facilitated the establishment of 380 dwelling units in 2005, many of which were in the downtown. Improving the quality of life for all our citizens, in every part of the city, is a responsibility we embrace with enthusiasm.
In 2006, we look forward to building on the fiscalprogress we have made, serving citizens better, and doing our part to make Winnipeg the vibrant,healthy and prosperous city Plan Winnipegenvisions.


Located at the geographic centre of Canada, Winnipeg is a culturally diverse city with over 100 languages spoken. It is a city rich in history. Once a centre for the fur trade, it has been a hub for commerce and transportation for more than 6,000 years. Winnipeg was permanently settled by colonists in 1812 but it was not until 1873 that it was finally incorporated as a city.
Today, Winnipeg is characterized as having one of the most diverse economies in Canada. In comparing economic diversities, the Conference Board of Canada rates Winnipeg at 0.93 out of 1.00, with the average of Canadian cities at 0.81. As a result the city has avoided large economic upswings or downturns while generating modest yet sustained growth.
Over the last six years (2000-2005) Winnipeg’s population has grown by 16,000 or 2.5%.
With a current population of 650,100, Winnipeg will continue to experience modest population growth relative to other large Canadian cities. The population growth is primarily due to migration, a significant increase in immigration as well as a significant reduction in inter-provincial migration. It is forecasted that total provincial immigration will reach 10,000 people in 2006. Historically, Winnipeg is destination to about 80% of immigrants to Manitoba.
Winnipeg is experiencing a significant change. There are now more people moving to Winnipeg than leaving. In 1997, Winnipeg lost about 5,000 people due to migration (on a net basis), while in 2005, Winnipeg experienced a net gain of almost 1,700 people.

With a projected population increase of 100,000 people over the next 22 years, the demand for housing will continue. It is estimated that 40,000 to 45,000 additional dwellings will need to be constructed to meet the housing demand.
“Housing markets in Winnipeg are being bolstered by population and household growths thanks in part to a recent turnaround in net migration to the city. As well, low unemployment and favourable mortgage rates are fueling demand for homeownership.”
Over the next five years, Winnipeg’s economy is expected to perform well, resulting in the creation of an additional 35,000 jobs.
A 2004 study by KPMG showed Winnipeg has among the lowest overall business costs of major cities. In all 17 industries studied by KPMG, Winnipeg was more cost competitive than the average. CanadianBusiness rated Winnipeg in the top 10 Canadian cities to do business in their latest two business cost surveys in 2003 and 2004.
Winnipeg’s median ranking out of 11 large Canadian cities:
Winnipeg’s steady and consistent economic growth is based on the foundation of business diversity. Key industries include:
88 89 90 91 92 93 94 95 96 97 98 99 00 01 02 03 04 05
0
610,000
620,000
630,000
640,000
650,000
660,000


I am pleased to present The City of Winni-peg’s 2005 consolidated financial statements, which are prepared in accordance with Canadian generally accepted accounting principles. Management has also prepared he following Financial Statement Discus-ion and Analysis, which comments on the
year’s activity, and should be read along with he audited financial statements.
The consolidated financial statements in-lude the assets, liabilities, revenues and
expenses of the City’s departments, special operating agencies, utilities, and corporations that the City owns or controls.
Located at the junction of the Assiniboine and Red Rivers, Winnipeg is at the geographic centre of North America. It is the seventh largest city in Canada with a population of approximately 650,000, and it is the provincial capital of Manitoba. The City has the most diverse economy of major cities in Canada.
The City of Winnipeg was created on January 1, 1972 pursuant to The City of Winnipeg Act, a statute of the Legislature of the Province of Manitoba. It continued as a body corporate by virtue of the enact-ment of The City of Winnipeg Charter on January 1, 2003. The City employs approximately 8,700 staff and provides a wide variety of services to its citizens. Services offered include police, fire, ambulance, transit, water and sewage, to name a few.
The Consolidated Statement of Operations and Net Assets reports the City’s changes in economic resources, obligations, and net assets for 2005, on a comparative basis. As the annual excess of revenues over expenses was positive, it indicates that the revenues raised during the year were sufficient to cover costs.
During the year, The City of Winnipeg recorded revenues of $1,003.5 million (2004 - $968.9 million) and expenses of $958.8 million (2004 - $929.9
million). As a result, net assets increased by $44.7 million (2004 - $39.0 million). Consolidated revenues increased by $34.6 million in 2005 from 2004, due mainly to a $16.0 million increase in sales of services and regulatory fees and a $11.7 million increase in taxation. Sales of services and regulatory fees include revenue sources such as water and sewage services, transit fares, and ambulance services. Increased revenue was generated partially by sewer services rates that increased to 3.39 per 100 cubic feet from 3.11 per 100 cubic feet. Also, Transit increased its fares and ridership by 3% each during the year.
The major components of taxation revenue are prop-erty, business, local improvements, and electricity and gas tax. Municipal property tax revenue, exclud-ing school property taxes, grew from its 2004 level of $366.2 million to $373.4 million as a result of assess-ment growth.
Consolidated expenses grew by $28.9 million from the previous year. This is comprised of increases and decreases to various expense categories. The major increase resulted from an additional $13.2 million spent on public works operations primarily due to heavy snowfall levels and summer storms.
The consolidated financial statements include the activities recorded in the General Revenue Fund, which reports on property tax-supported operations. These operations consist of services such as police, fire, recreation, library, street maintenance and other general government activities. Tax-supported servic-es are 52% (2004 - 52%) funded by municipal realty tax revenues.

During 2005, the General Revenue Fund recorded revenues and expenses of $711.5 million (2004 - $697.7 million).
The budget for the property tax-supported opera-tions was adopted by City Council on March 22, 2005. During the budget process the City faced sev-eral challenges to produce a balanced budget while maintaining its commitment to a competitive tax en-vironment. These challenges included inflationary increases, maintaining service levels to meet program needs, and infrastructure maintenance and renewal requirements. The result was another approved bud-get with no increase to property taxes following eight years of reductions and freezes. Within the budget, funding for public safety remained a priority, as did continued fiscal restraint, while frontline essential services were maintained. The business tax rate for businesses located in the Downtown geographic area was reduced to 7.75%, while the rate for other busi-nesses remained at its 1996 level of 9.75%.
During 2005, several unexpected events occurred that impacted the financial results of the City’s property tax-supported operations. The City experienced high snowfall levels, an increased contribution to the Transit System Fund largely as a result of increased diesel fuel prices, and higher policing costs. These areas were identified early in 2005, which allowed City Council and the Administration to initiate a discretionary spending freeze and transfer surpluses from various funds.
The Consolidated Statement of Financial Position reports the City’s financial and non-financial resources, obligations and net assets as at December 31, 2005, on a comparative basis. This statement is used to evaluate the City’s ability to finance its act-ivities and to meet its liabilities and commitments.
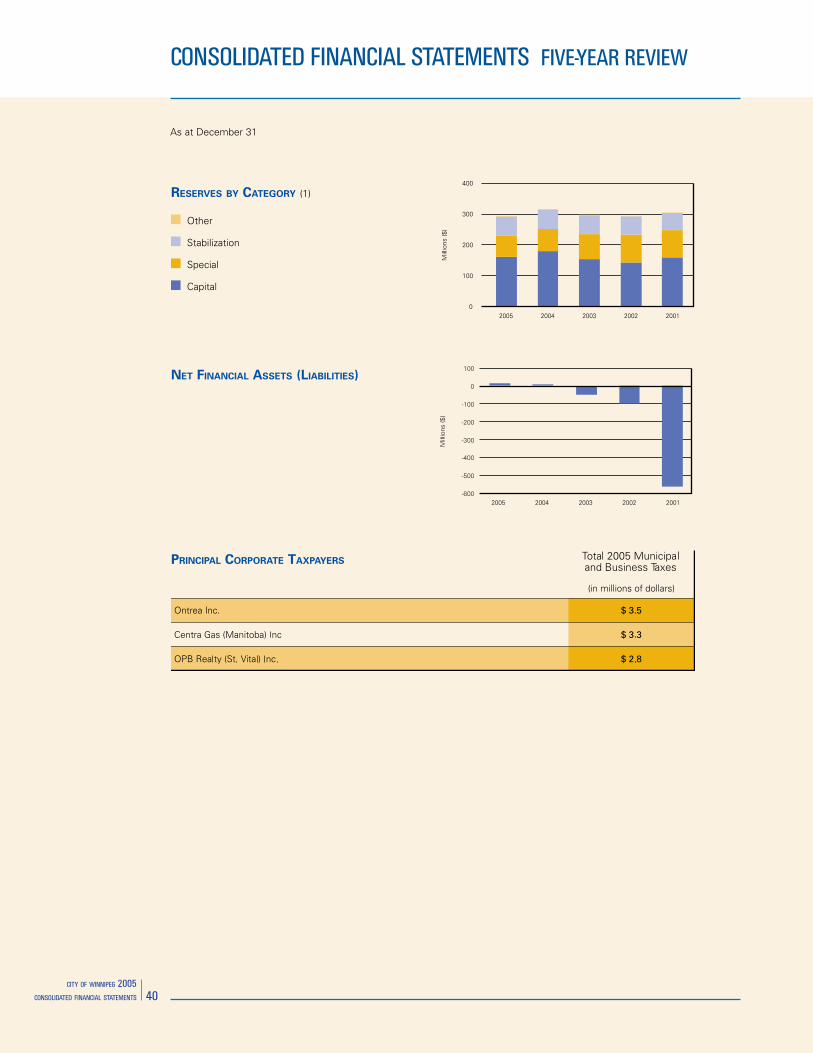
An important indicator on the Statement of Financial Position is the City’s reported net financial assets. This indicator is the difference between financial assets and liabilities, which provides an indication of the affordability of additional spending. As at December 31, 2005, the City was in a net financial asset position of $14.9 million (2004 - $8.7 million). The improved position is comprised of various positive elements including the increase in net revenues over expenses during the year.
Taxation andpayments-in-lieuof taxes 69%Government grants10%
Other 4%
Regulation fees 4%
Sales of goods andservices 6%
Transfers 7%
Protection andcommunityservices 48%
Other 3%
Contribution toTransit 5%
Property anddevelopment 5%
Finance andadministration 10%
Public works 29%
The City of Winnipeg has several types of debt obligations. The largest component of debt is sinking fund debentures. Under The City of Winnipeg Charter the City is required to make annual payments towards the retirement of sinking fund debt. These annual payments are invested in government and government-guaranteed bonds and debentures, which include City of Winnipeg debentures. By investing in bonds and debentures of investees that are considered to be high quality credits, the City reduces its credit risk. Credit risk arises from the potential for an investee to fail or to default on its contractual obligations.
During 2005 a sinking fund debenture originally issued in 1990 for $66.4 million at a rate of 11.7% matured and repayment in full was made from the Sinking Fund. By 2017, all of the outstanding sinking fund debt will mature. Repayment of debt will be made in full from the Sinking Fund except for $50.0 million that will become payable in 2009. This debenture will have a sinking fund shortfall of $31.0 million.
The City also has serial and installment debt that have varying maturities up to 2014 and carry a weighted average interest rate of 4.82% (2004 - 4.79%). Annual payments are made on both the principal and interest portion of the debt outstanding to investors. In addition, the City has guaranteed the payment of principal and interest on capital loans for several third parties totalling $7.3 million (2004 - $7.8 million). The City is confident that there will be no call for payment relating to these guarantees.
In 2005, Standard & Poor’s and Moody’s Investors Service advised the City that its credit rating would be maintained at AA and Aa2, respectively. These debt ratings contribute to the City’s ability to access capital markets.
Beginning in 1998, the City adopted a policy of not issuing new tax-supported debt. Under its current capital plan, all new tax-supported projects are financed internally. As a result, the level of tax-supported debt decreased by $198.9 million from 1999, and is expected to decrease continuously over the next few years along with the associated debt-servicing costs. Within the utilities, the City anticipates issuing $115.3 million in debt over the next few years to finance a water treatment plant estimated to cost $230.1 million. The Water Treatment Reserve, which was established on December 17, 1993, has a balance at December 31, 2005 of $73.7 million (2004 - $93.2 million). It is anticipated this Reserve will fund a significant percentage of the cost for this project.
In addition, the 2005 utilities capital budget includes $157.6 million in debt over the next six year period to fund projects mandated by the Province of Manitoba through the Clean Environment Commission (“CEC”). During 2003 the CEC, at the request of the Minister of Conservation, conducted public hearings to review and receive comments on the City’s 50 year wastewater collection and treatment improvement
Transit
Other
City-owned Utilities
Tax-supported
program. At the conclusion, the CEC recommended that the City implement these improvements over a 25 year period, which is estimated to cost $900 million. Partial funding for these improvements will be provided by the Environmental Projects Reserve, which has a balance at December 31, 2005 of $52.3 million.
The challenge in creating a capital budget is balancing infrastructure needs, protecting the environment and fiscal responsibility. The 2005 capital budget and the 2006 to 2010 five-year forecast was adopted by Council on December 13, 2004 and revisions were approved on March 22, 2005. The capital investment plan committed $1.3 billion in spending over the next six years with $298.5 million in 2005. Priority was given to the renewal and improvement of existing infrastructure with continued commitment to pay-as-you-go financing and no external debt for tax-supported programs. Areas of major capital investment included in the six-year plan were $370 million for the sewage disposal system, $249 million for the water system, $243 million for the street system including bridges, and $109 million for the transit system.
During 2005, the City spent $182.9 million on capital projects (2004 - $143.3 million), which included $104.8 million for tax-supported projects. Spending on tax-supported projects was made primarily on residential streets, the Kenaston Underpass, completion of the Millennium Library and the Maryland Twin Bridges Rehabilitation. Capital projects were financed from several sources, with funding primarily from the City’s current tax levies, various capital reserves, and grants from other levels of governments.
The City of Winnipeg builds reserves to meet specific future operating and capital expense requirements, and to provide for contingencies. Reserve balances have decreased by $22.8 million overall from the prior year. The City’s Capital Reserves balances dropped by $19.9 million. In particular, the Water Treatment Reserve declined by $19.5 million as work started on the water treatment plant. The Capital Reserves were established to finance current and anticipated
future capital projects, which reduce or eliminate the need to issue debt. Special Purpose Reserves, which were established to account for the use of designated revenue to fund expenditures such as the Snow Clearing Reserve, declined by $3.2 million.
Stabilization Reserves were created to offset the effect of major unexpected expenses or fund deficits recorded in the property tax-supported operating budget. During 2005, these Reserves increased by $1.7 million and are anticipated to grow until they reach a targeted level of 10% of the property tax-supported adopted budget expenses.
The significant accounting policies used in preparing the City’s consolidated financial statements are summarized in Note 2 to these statements. The accounting policies section of the financial statements sets out managements decisions concerning estimates that may significantly impact the City’s financial results. The precision of these estimates and the likelihood of future changes depend on a number of underlying variables and a range of possible outcomes. The following is a discussion of these critical accounting estimates.
The City provides pension and sick leave benefit plans for qualified employees. The cost of these employee
Other
Stabilization
Special
Capital
benefits are actuarially determined each year. These calculations use management’s best estimate of a number of assumptions. The critical assumptions made by management are the long-term rate of investment return on plan assets, certain employee-related factors such as turnover, retirement age and mortality, salary escalation and the discount rate used to value liabilities. Management applies judgment in the selection of these assumptions, based on past experience and on forecasts of future economic and investment conditions.
As these assumptions relate to factors that are long term in nature, they are subject to a degree of un-certainty. Differences between actual experience and the assumptions, as well as revisions to the assump-tions resulting from changes in future expectations, may lead to adjustments to the City’s pension and sick leave benefits expense in future years.
The City has a number of pension plans. The two major plans are The Winnipeg Civic Employees’ Pension Plan and The Winnipeg Police Pension Plan. Both Plans have funding surpluses that allow the City to take advantage of decreased contributions to the Plans.
The Winnipeg Civic Employees’ Pension Plan is similar to a defined contribution pension plan, the terms of which eliminate the City’s exposure to future unfunded liabilities. The Plan is a multi-employer contributory plan governed by an independent board of directors. The Police Plan is a defined benefit plan with the City being responsible for unfunded liabilities. The funded surpluses of the Plans are not recorded on the City’s consolidated financial statements.
The City is responsible for future landfill closure and post closure care requirements defined in accordance with the Environmental Act. In determining the City’s environmental liability management has estimated the total cost to cover and landscape the landfill along with site maintenance, available site capacity, and remaining life. The liability is measured on a discounted basis using the long-term cost of borrowing at year-end.
The City has historically recorded tangible capital assets to match corresponding outstanding debt, equity allocated internally and from reserves for the purchase of these assets. Tangible capital assets are amortized at an amount equal to the principal repayments of the debt.
In April 2003, the Public Sector Accounting Board (“PSAB”) approved a research project on accounting and reporting non-financial assets of local govern-ment. On March 9, 2006, PSAB issued an exposure draft, which if approved, would require local governments to record and amortize capital assets. At this time, the impact of the exposure draft on the City’s financial statements is not determinable.
On January 1, 2005, Winnipeg Parking Authority, a new Special Operating Agency (“SOA”), commenced operations. Its focus is on providing, maintaining, and optimizing the use of fee-based on-street and off-street parking, as well as the ongoing monitoring and management of municipally-owned parking spaces across the city.
There are four other SOAs operating within the City’s organization including, Animal Services (2000), Glacial Sand and Gravel (2001), Winnipeg Golf Services (2002), and Fleet Management (2003). SOAs provide services as special units of the City. They are granted more direct responsibility for results and increased management flexibility needed to attain planned levels of performance.
SOAs have been given the authority to provide direct public services, internal services, or regulatory and
enforcement programs. SOA status is granted when it is in the City’s interest that they remain within the government but require greater freedom to manage in a more business-like manner. Each SOA is gov-erned by its own operating charter and prepares an annual business plan for adoption by City Council.
Effective March 31, 2005, Winnipeg Enterprises Corporation (“WEC”) wound-down its operations and is being managed by The City of Winnipeg. WEC owned the Winnipeg Arena and the Winnipeg Stadium. In 2004, the MTS Centre commenced operations and the Arena was scheduled for demolition and the land was sold.
As with other municipalities in North America, the City of Winnipeg is experiencing a decline in the condition of its infrastructure. The City undertook a comprehensive review of its infrastructure and found that there is a considerable deferred maintenance component of the infrastructure that will require future consideration. On November 18, 2005, an “Agreement on the Transfer of Federal Gas Tax Revenues” was signed between The Governments of Canada and Manitoba. The agreement provides stable, reliable and predictable funding to the City for environmentally sustainable infrastructure. Eligible projects include public transit, water, wastewater, and solid waste. The 2006 six-year capital plan reflects $101.2 million from the federal government, which represents the City’s share of the federal gas tax revenue.
Over the past year a number of reviews were conducted by the City Auditor. Reviews included an audit of the City’s purchasing card system, the photo radar program and SOAs. Administration considers all internal control recommendations seriously and balances the cost of implementation against available resources and the extent of controls required to mitigate potential areas of concern. The City has a satisfactory level of controls required to ensure the accuracy of its financial statements.
On February 21, 2006, City Council approved the 2006 Capital Budget and the 2007 to 2011 Five-Year Forecast. This six-year plan includes $87.0 million of funding from the senior levels of government through the Canada Strategic Infrastructure Fund, which will go toward completion of the Kenaston Underpass project, three pollution control centres and recreation and leisure facilities. The plan also anticipates the federal government will provide $28.7 million under Bill C-66 over 2007 to 2008. In addition, the Province of Manitoba has continued with its commitment to fund capital projects through the new framework of the Building Manitoba Fund with approximately $59.6 million dedicated for roads and transit over the next 6 years. The City will also be working with the Province to select projects for funding under the new Manitoba/Winnipeg Infrastructure Program - formerly Urban Capital Project Allocation - totalling $70.0 million over six years.
On March 21, 2006, City Council approved the 2006 operating budget. The 2006 mill rate was reduced from 29.686 to 25.448 to reflect the recent general assessment. As a result 2006 property tax revenue will remain at 2005 levels, after adjusting for new assessable properties. Consequently, there will be nine years of property tax freezes or reductions. The City’s business tax rate remained fixed at the 2005 level of 7.75% for the Downtown geographic area, while being frozen at the 1996 level for areas outside the downtown. In addition, all increases in business taxes resulting from the 2006 general assessment will be limited to 15%. As a result the 2006 business tax revenue will remain at its 2005 level.
In closing, I would like to thank all those who contributed to the preparation of these financial statements.
The accompanying Consolidated Financial Statements and all other information contained in
this Annual Report are the responsibility of the management of The City of Winnipeg. The
preparation of periodic financial statements involves the use of estimates and approximations
because the precise determination of financial information frequently depends on future events.
These Consolidated Financial Statements have been prepared by management within reasonable
limits of materiality and within the framework of Canadian generally accepted accounting
principles for governments established by the Public Sector Accounting Board of the Canadian
Institute of Chartered Accountants.
In carrying out its responsibilities, management maintains appropriate systems of internal and
administrative controls designed to provide reasonable assurance that transactions are executed
in accordance with proper authorization, that assets are properly accounted for and safeguarded,
and that financial information produced is relevant and reliable.
Prior to their submission to Council, the Consolidated Financial Statements are reviewed and
approved by the Audit Committee - the Mayor, the Deputy Mayor, and the chairpersons of
Council’s Standing Committees. In addition, the Audit Committee meets periodically with
management and with both the City’s internal and external auditors to approve the scope
and timing of their respective audits, to review their findings and to satisfy itself that their
responsibilities have been properly discharged. The Committee is readily accessible to external
and internal auditors.
Ernst & Young LLP, Chartered Accountants, as the City’s appointed external auditors, have
audited the Consolidated Financial Statements. The Auditors’ Report is addressed to the Mayor
and members of Council and appears on the following page. Their opinion is based upon an
examination conducted in accordance with Canadian generally accepted auditing standards,
performing such tests and other procedures as they consider necessary to obtain reasonable
assurance that the Consolidated Financial Statements are free of material misstatement and
present fairly the financial position and results of operations of the City in accordance with
Canadian generally accepted accounting principles.
AUDITORS’ REPORT
To the Mayor and Members of City Council ofThe City of Winnipeg
We have audited the consolidated statement of financial position of The City of Winnipeg as at December 31, 2005 and the consolidated statements of operations and net assets, cash flows and change in netfinancial assets for the year then ended. These consolidated financial statements are the responsibility of the City’s management. Our responsibility is to express an opinion on these consolidated financial statements based on our audit.
We conducted our audit in accordance with Canadian generally accepted auditing standards. Those standards require that we plan and performan audit to obtain reasonable assurance whether the financial statementsare free of material misstatement. An audit includes examining, on a testbasis, evidence supporting the amounts and disclosures in the financialstatements. An audit also includes assessing the accounting principles usedand significant estimates made by management, as well as evaluating theoverall financial statement presentation.
In our opinion, these consolidated financial statements present fairly, inall material respects, the financial position of The City of Winnipeg asat December 31, 2005 and the results of its operations and its cash flows for the year then ended in accordance with Canadian generally accepted accounting principles.
Winnipeg, Canada, Ernst & YoungApril 7, 2006 Chartered Accountants
(RESTATED NOTE 21)
As at December 31 (in thousands of dollars)
2005 2004
FINANCIAL ASSETS
Cash and short-term investments $ 430,457 $ 551,697Accounts receivable (Note 3) 136,764 142,541Investments (Note 4) 349,943 368,019
917,164 1,062,257
LIABILITIES
Notes payable (Note 5) 137,570 250,777Accounts payable and accrued liabilities (Note 6) 138,730 129,939Deferred revenue 6,723 9,408
283,023 390,124
Debt (Note 7) 447,857 494,840Other liabilities (Note 8) 41,813 44,579Retirement allowance, compensated absences and other liabilities (Note 9) 129,607 123,969
902,300 1,053,512
NET FINANCIAL ASSETS 14,864 8,745
NON-FINANCIAL ASSETS
Tangible capital assets (Note 10) 942,408 903,714Inventories 14,457 13,699Prepaid expenses 2,996 3,909
959,861 921,322
NET ASSETS $ 974,725 $ 930,067
Commitments and contingencies (Notes 11, 14 and 18)
Comprised of
Surplus (Note 12) $ 681,041 $ 613,599Reserves (Note 13) 293,684 316,468
$ 974,725 $ 930,067
See accompanying notes to the consolidated financial statements
Approved on behalf of the Audit Committee:
Sam Katz – Mayor Mike O’Shaughnessy – Chairperson, Fiscal Issues Committee
(RESTATED NOTE 21)
For the years ended December 31 (in thousands of dollars)
2005 2004
REVENUES
Taxation (Note 14) $ 503,397 $ 491,698Sales of services and regulatory fees (Note 15) 344,207 328,206Government grants and transfers (Note 16) 102,509 94,100Interest 41,681 44,638Land sales and other revenue 11,697 10,241
Total Revenues 1,003,491 968,883
EXPENSES (Note 17)
Protection and community services 303,985 300,646Public works 227,617 214,463Utility operations 218,855 217,171Property and development 62,126 53,675Finance and administration 61,538 65,425General government 56,068 47,324Civic corporations 28,644 31,214
Total Expenses 958,833 929,918
Excess Revenues Over Expenses 44,658 38,965
NET ASSETS, BEGINNING OF YEAR 930,067 891,102
NET ASSETS, END OF YEAR $ 974,725 $ 930,067
See accompanying notes to the consolidated financial statements

(RESTATED NOTE 21)
For the years ended December 31 (in thousands of dollars)
2005 2004
NET INFLOW (OUTFLOW) OF CASH RELATED
TO THE FOLLOWING ACTIVITIES:
OPERATING
Excess Revenues Over Expenses $ 44,658 $ 38,965Non-cash charges to operations Amortization 78,178 76,214 Other 3,917 6,660
Working capital from operations 126,753 121,839 Net change in working capital other than cash assets 11,073 (11,979)
Cash provided by operating transactions 137,826 109,860
CAPITAL
Acquisition of tangible capital assets (Note 10) (138,749) (96,920)Government of Canada capital grants 6,814 6,089 Province of Manitoba capital grants 14,871 35,974
(117,064) (54,857)
FINANCING
Interest on funds on deposit with The Sinking Fund Trustees of The City of Winnipeg (“The Sinking Fund Trustees”) (9,520) (9,208)Debenture and serial debt retired (87,292) (49,216)Sinking fund investments applied to debt redemption 66,424 32,985 Sinking fund debenture installments (16,038) (17,899)Serial debt issued - 46,392 Other (549) (3,470)
(46,975) (416)
INVESTING
Sale (purchase) of investments 18,180 (1,744)
(Decrease) increase in cash assets (8,033) 52,843
CASH ASSETS, BEGINNING OF YEAR 300,920 248,077
CASH ASSETS, END OF YEAR $ 292,887 $ 300,920
COMPONENTS OF CASH ASSETS
Cash and short-term investments $ 430,457 $ 551,697Notes payable (137,570) (250,777)
$ 292,887 $ 300,920
See accompanying notes to the consolidated financial statements
(RESTATED NOTE 21)
For the years ended December 31 (in thousands of dollars)
2005 2004
EXCESS REVENUES OVER EXPENSES $ 44,658 $ 38,965
Amortization of tangible capital assets 78,178 76,214 Province of Manitoba grants for capital asset purchases 14,871 35,974 Government of Canada grants for capital asset purchases 6,814 6,089 Change in other non-financial assets 347 (1,620)Acquisition of tangible capital assets (Note 10) (138,749) (96,920)
INCREASE IN NET FINANCIAL ASSETS 6,119 58,702
NET FINANCIAL ASSETS (LIABILITIES), BEGINNING OF YEAR 8,745 (49,957)
NET FINANCIAL ASSETS, END OF YEAR $ 14,864 $ 8,745
See accompanying notes to the consolidated financial statements

As at December 31, 2005 (in thousands of dollars, except as noted)
1. STATUS OF THE CITY OF WINNIPEG
The City of Winnipeg (“the City”) is a municipality which was created on January 1, 1972 pursuant to The City of Winnipeg Act,a statute of the Legislature of the Province of Manitoba (“the Province”). The City continued as a body corporate by virtue ofthe enactment by the Province of The City of Winnipeg Charter on January 1, 2003. The City provides municipal services suchas police, fire, ambulance, public works, urban planning, parks and recreation, library and other general government operations.The City owns and operates a number of public utilities, has designated reserves and provides funding support for other financialentities involved in economic development, recreation, entertainment, convention, tourism and housing activities.
2. SUMMARY OF SIGNIFICANT ACCOUNTING POLICIES
These consolidated financial statements have been prepared by management in accordance with Canadian generally acceptedaccounting principles for governments established by the Public Sector Accounting Board of the Canadian Institute of CharteredAccountants. The significant accounting policies are summarized as follows:
a) Consolidation principles and basis of presentationThe consolidated financial statements of the City include the assets, liabilities, reserves, surpluses/deficits, revenues and expensesof those City funds and governmental functions or entities which have been determined to comprise a part of the aggregate Cityoperations based upon ownership or control exercised by the City. Interfund and intercorporate balances and transactions havebeen eliminated except for amounts related to services offered commercially including utility charges. In 2005, one new fund (*)was added.
The consolidated financial statements include the following:
Capital Reserves:• Watermain Renewal Reserve• Combined Sewer Renewal Reserve• Wastewater Sewer Renewal Reserve• Water Treatment Reserve• Environmental Projects Reserve• Brady Landfill Site Rehabilitation Reserve• Golf Course Reserve• Library Reserve• Transit Bus Replacement Reserve• Concession Equipment Replacement Reserve• Computer Replacement Reserve• Aqueduct Rehabilitation ReserveSpecial Purpose Reserves:• Workers Compensation Reserve• Perpetual Maintenance Fund
– Brookside Cemetery• Perpetual Maintenance Fund
– St. Vital Cemetery• Perpetual Maintenance Fund
– Transcona Cemetery• Insurance Reserve• Contributions in Lieu of Land
Dedication Reserve
Special Purpose Reserves: (continued)• Land Operating Reserve• Recreation Programming Reserve• Snow Clearing Reserve• Idea Bank Reserve• Commitment Reserve• Heritage Investment Reserve• Housing Rehabilitation Investment Reserve• Economic Development Investment Reserve• Assiniboine Park Enterprise Reserve• General Purpose Reserve• Multi-Family Dwelling Tax Investment ReserveStabilization Reserves: • Fiscal Stabilization Reserve• Mill Rate Stabilization ReserveOther Funds:• General Capital Fund• General Revenue Fund• General Revenue Enterprises Fund• Equity in Capital Assets• Transit System• Waterworks System• Sewage Disposal System
Other Funds: (continued)• Solid Waste Disposal• Equipment and Material Services• Civic Accommodations Fund• Building Services Fund• Animal Services – Special Operating Agency• Glacial Sand and Gravel
– Special Operating Agency• Golf Services
– Special Operating Agency• Fleet Management – Special Operating
Agency• Winnipeg Parking Authority
– Special Operating Agency*Other Entities:• Winnipeg Public Library Board• The Convention Centre Corporation• Destination Winnipeg Inc.• Winnipeg Enterprises Corporation• Winnipeg Housing Rehabilitation Corporation
(March 31st Year End)• CentreVenture Development Corporation
The employees’ pension and group life insurance funds of the City are administered on behalf of the pension and group lifeinsurance plan participants by the Board of Trustees of the Winnipeg Civic Employees’ Benefits Program (Pension Fund) forthe payment of pensions and life insurance benefits and accordingly are not included in the consolidated financial statements. In addition, certain trust funds administered by the City, amounting to $0.3 million (2004 - $0.3 million), are not included in theconsolidated statement of financial position nor have their operations been included in the consolidated statements of operationsand change in net financial assets.
Separate financial statements for each of the above-noted entities, including the pension, group life insurance and trust funds,are included in the 2005 Detailed Financial Statements Report, a companion document to the City’s 2005 Annual Report andConsolidated Financial Statements.
2. SUMMARY OF SIGNIFICANT ACCOUNTING POLICIES (CONTINUED)
b) Basis of accountingThe consolidated financial statements are prepared using the accrual basis of accounting. The accrual basis of accounting recordsrevenue as it is earned and measurable. Expenses are recognized as they are incurred and measurable based upon receipt of goodsor services and/or the creation of a legal obligation to pay.
c) School taxesThe City is required by The Public Schools Act to bill, collect and remit provincial education support levies in respect of residentialand other properties on behalf of the Province, and school division special levies on behalf of school divisions. The City has nojurisdiction or control over the school divisions’ operations or their mill rate increases. Therefore, the taxation, other revenues,expenses, assets and liabilities with respect to the operations of school boards are not reflected in these consolidated financialstatements.
d) Short-term investmentsShort-term investments consist of bankers’ acceptance and term deposits and are recorded at cost, which approximates theirquoted market value. These investments have varying maturities up to March 30, 2006, and have an effective average interestrate of 3.3% (2004 - 2.6%).
e) InvestmentsBonds and debentures are carried at amortized cost. Discounts and premiums arising on the purchase of these investments areamortized over the remaining terms to maturity with annual amortization computed at amounts which, when combined with actualincome received, result in a constant effective yield on the amortized book value.
Bond residues and coupons are carried at cost, plus accrued interest. Interest is accrued on the book value of the investments ata rate equivalent to the effective yield of each investment.
f) Assessment appeal costsThe City accrues a liability to reflect the amount of future payments related to the assessment period, net of certain assessments,which will be deferred and amortized over the balance of the reassessment period.
g) Solid waste landfillsThe estimated costs to close and maintain solid waste landfill sites are based on estimated future expenses in current dollars,adjusted for estimated inflation, and are charged to expense as the landfill sites’ capacity is used.
h) Environmental provisionsThe City provides for the cost of compliance with environmental legislation when conditions are identified which indicate non-compliance with environmental legislation and costs can be reasonably determined. The estimated amounts of future restorationcosts are reviewed regularly, based on available information and governing legislation.
i) Deferred revenueCertain amounts are received pursuant to legislation, regulation or agreement and may only be used in the conduct of certainprograms or in the completion of specific work. In addition, certain user charges and fees are collected for which the relatedservices have yet to be performed. These amounts are recognized as revenue in the fiscal year in which the related expenses areincurred or services performed.
j) Employee benefit plansThe costs of pensions and other retirement benefits are actuarially determined using the projected benefit method prorated onservices and management’s best estimate of retirement ages of employees, salary escalation and plan investment performance. Past service costs from plan amendments are amortized on a straight-line basis over the average remaining service period ofemployees active at the date of amendment. Actuarial gains and losses are amortized on a straight-line basis over the averageremaining service period.

2. SUMMARY OF SIGNIFICANT ACCOUNTING POLICIES (CONTINUED)
k) Non-financial assetsNon-financial assets are not available to discharge existing liabilities and are held for use in the provision of services. They haveuseful lives extending beyond the current year and are not intended for sale in the ordinary course of operations. The change innon-financial assets during the year, together with the excess of revenues over expenses, provides the Change in Net FinancialAssets for the year.
i) Tangible capital assetsTangible capital assets, including land, financed by debt are initially recorded at cost and amortized in the consolidated statementof operations and net assets at an amount equal to the principal repayments of the debt. Other, generally smaller, acquiredtangible capital assets are budgeted for and charged to expenses in the consolidated statement of operations and net assets.Assets financed by debentures that are retired prior to maturity are amortized over the remaining expected useful life of theasset.
The tangible capital assets of the Sewage Disposal System and Waterworks System Funds are recorded at cost and amortizedover their expected useful life commencing at various times from 2003 onwards, with the Transit System Fund commencingin 2005. Prior to these changes, these assets were expensed based on the funding arrangements. These changes have beenapplied prospectively.
Cost includes certain interest and overhead expenses incurred during the period the asset is acquired, constructed or developed. Contributions in aid of construction are recorded as a reduction in the cost of the tangible capital asset.
ii) LeasesLeases are classified as capital or operating leases. Leases which transfer substantially all of the benefits and risks incidentalto ownership of property are accounted for as capital leases. Tangible capital assets acquired under a capital lease are recordedat the amount of the related obligation. These capital leases are amortized based upon the principal portion of the capital leasepayments in the consolidated statement of operations and net assets. All other leases are accounted for as operating leases andthe related lease payments are charged to expenses as incurred.
iii) InventoriesInventories are recorded at the lower of cost and replacement cost.
l) EstimatesThe preparation of financial statements in conformity with Canadian generally accepted accounting principles requires managementto make estimates and assumptions on such areas as employee benefits, assessment appeals and environmental provisions. These estimates and assumptions are based on the City’s best information and judgment and may differ significantly from actualresults.
3. ACCOUNTS RECEIVABLE
2005 2004
Property, payments-in-lieu and business taxes receivable $ 37,698 $ 40,436 Allowance for property, payments-in-lieu and business tax arrears (6,364) (6,394)
31,334 34,042
Trade accounts and other receivables 70,114 65,731 Province of Manitoba 27,621 40,222 Government of Canada 10,967 5,435 Allowance for doubtful accounts (3,272) (2,889)
105,430 108,499
$ 136,764 $ 142,541
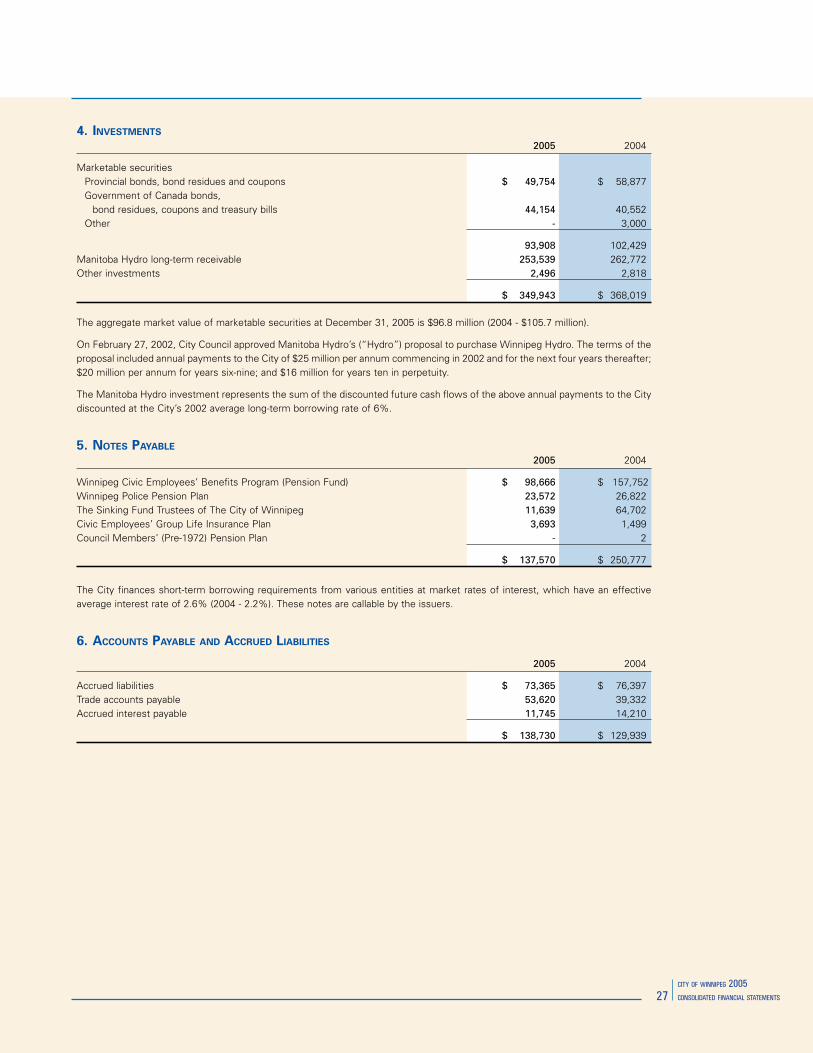
4. INVESTMENTS
2005 2004
Marketable securities Provincial bonds, bond residues and coupons $ 49,754 $ 58,877 Government of Canada bonds, bond residues, coupons and treasury bills 44,154 40,552 Other - 3,000
93,908 102,429 Manitoba Hydro long-term receivable 253,539 262,772 Other investments 2,496 2,818
$ 349,943 $ 368,019
The aggregate market value of marketable securities at December 31, 2005 is $96.8 million (2004 - $105.7 million).
On February 27, 2002, City Council approved Manitoba Hydro’s (“Hydro”) proposal to purchase Winnipeg Hydro. The terms of theproposal included annual payments to the City of $25 million per annum commencing in 2002 and for the next four years thereafter;$20 million per annum for years six-nine; and $16 million for years ten in perpetuity.
The Manitoba Hydro investment represents the sum of the discounted future cash flows of the above annual payments to the Citydiscounted at the City’s 2002 average long-term borrowing rate of 6%.
5. NOTES PAYABLE
2005 2004
Winnipeg Civic Employees’ Benefits Program (Pension Fund) $ 98,666 $ 157,752 Winnipeg Police Pension Plan 23,572 26,822 The Sinking Fund Trustees of The City of Winnipeg 11,639 64,702 Civic Employees’ Group Life Insurance Plan 3,693 1,499 Council Members’ (Pre-1972) Pension Plan - 2
$ 137,570 $ 250,777
The City finances short-term borrowing requirements from various entities at market rates of interest, which have an effectiveaverage interest rate of 2.6% (2004 - 2.2%). These notes are callable by the issuers.
6. ACCOUNTS PAYABLE AND ACCRUED LIABILITIES
2005 2004
Accrued liabilities $ 73,365 $ 76,397 Trade accounts payable 53,620 39,332 Accrued interest payable 11,745 14,210
$ 138,730 $ 129,939
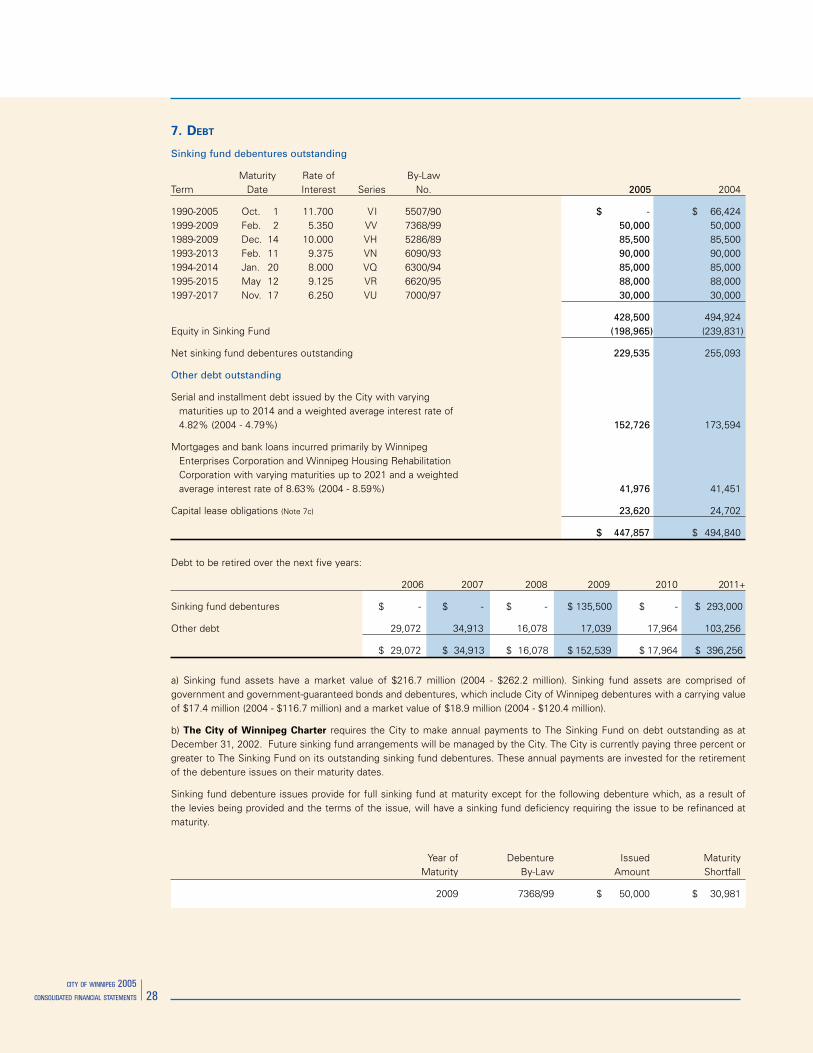
7. DEBT
Sinking fund debentures outstanding
Maturity Rate of By-LawTerm Date Interest Series No. 2005 2004
1990-2005 Oct. 1 11.700 VI 5507/90 $ - $ 66,4241999-2009 Feb. 2 5.350 VV 7368/99 50,000 50,0001989-2009 Dec. 14 10.000 VH 5286/89 85,500 85,5001993-2013 Feb. 11 9.375 VN 6090/93 90,000 90,0001994-2014 Jan. 20 8.000 VQ 6300/94 85,000 85,0001995-2015 May 12 9.125 VR 6620/95 88,000 88,0001997-2017 Nov. 17 6.250 VU 7000/97 30,000 30,000
428,500 494,924Equity in Sinking Fund (198,965) (239,831)
Net sinking fund debentures outstanding 229,535 255,093
Other debt outstanding
Serial and installment debt issued by the City with varying maturities up to 2014 and a weighted average interest rate of 4.82% (2004 - 4.79%) 152,726 173,594
Mortgages and bank loans incurred primarily by Winnipeg Enterprises Corporation and Winnipeg Housing Rehabilitation Corporation with varying maturities up to 2021 and a weighted average interest rate of 8.63% (2004 - 8.59%) 41,976 41,451
Capital lease obligations (Note 7c) 23,620 24,702
$ 447,857 $ 494,840
Debt to be retired over the next five years:
2006 2007 2008 2009 2010 2011+
Sinking fund debentures $ - $ - $ - $ 135,500 $ - $ 293,000
Other debt 29,072 34,913 16,078 17,039 17,964 103,256
$ 29,072 $ 34,913 $ 16,078 $ 152,539 $ 17,964 $ 396,256
a) Sinking fund assets have a market value of $216.7 million (2004 - $262.2 million). Sinking fund assets are comprised ofgovernment and government-guaranteed bonds and debentures, which include City of Winnipeg debentures with a carrying valueof $17.4 million (2004 - $116.7 million) and a market value of $18.9 million (2004 - $120.4 million).
b) The City of Winnipeg Charter requires the City to make annual payments to The Sinking Fund on debt outstanding as atDecember 31, 2002. Future sinking fund arrangements will be managed by the City. The City is currently paying three percent orgreater to The Sinking Fund on its outstanding sinking fund debentures. These annual payments are invested for the retirementof the debenture issues on their maturity dates.
Sinking fund debenture issues provide for full sinking fund at maturity except for the following debenture which, as a result ofthe levies being provided and the terms of the issue, will have a sinking fund deficiency requiring the issue to be refinanced atmaturity.
Year of Debenture Issued Maturity Maturity By-Law Amount Shortfall
2009 7368/99 $ 50,000 $ 30,981
(RESTATED NOTE 21)
7. DEBT (CONTINUED)
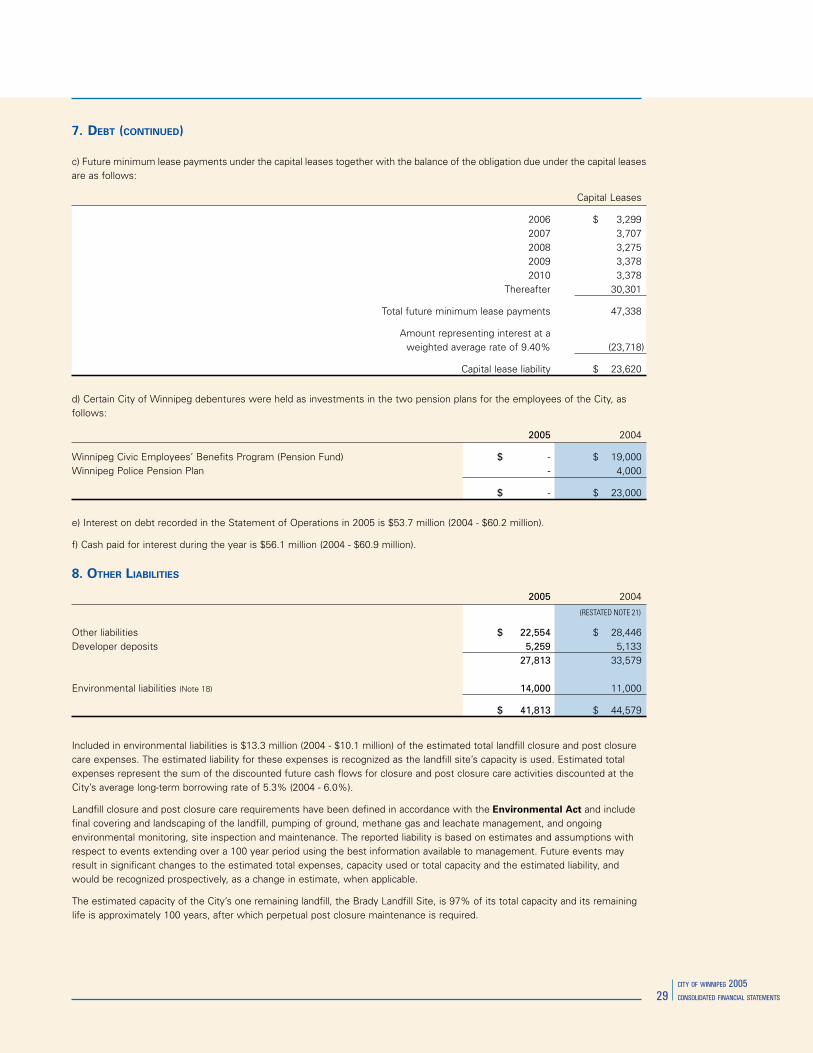
c) Future minimum lease payments under the capital leases together with the balance of the obligation due under the capital leasesare as follows:
Capital Leases
2006 $ 3,299 2007 3,707 2008 3,275 2009 3,378 2010 3,378 Thereafter 30,301
Total future minimum lease payments 47,338
Amount representing interest at a weighted average rate of 9.40% (23,718)
Capital lease liability $ 23,620
d) Certain City of Winnipeg debentures were held as investments in the two pension plans for the employees of the City, asfollows:
2005 2004
Winnipeg Civic Employees’ Benefits Program (Pension Fund) $ - $ 19,000 Winnipeg Police Pension Plan - 4,000
$ - $ 23,000
e) Interest on debt recorded in the Statement of Operations in 2005 is $53.7 million (2004 - $60.2 million).
f) Cash paid for interest during the year is $56.1 million (2004 - $60.9 million).
8. OTHER LIABILITIES
2005 2004
Other liabilities $ 22,554 $ 28,446 Developer deposits 5,259 5,133 27,813 33,579
Environmental liabilities (Note 18) 14,000 11,000
$ 41,813 $ 44,579
Included in environmental liabilities is $13.3 million (2004 - $10.1 million) of the estimated total landfill closure and post closurecare expenses. The estimated liability for these expenses is recognized as the landfill site’s capacity is used. Estimated totalexpenses represent the sum of the discounted future cash flows for closure and post closure care activities discounted at theCity’s average long-term borrowing rate of 5.3% (2004 - 6.0%).
Landfill closure and post closure care requirements have been defined in accordance with the Environmental Act and includefinal covering and landscaping of the landfill, pumping of ground, methane gas and leachate management, and ongoingenvironmental monitoring, site inspection and maintenance. The reported liability is based on estimates and assumptions withrespect to events extending over a 100 year period using the best information available to management. Future events mayresult in significant changes to the estimated total expenses, capacity used or total capacity and the estimated liability, andwould be recognized prospectively, as a change in estimate, when applicable.
The estimated capacity of the City’s one remaining landfill, the Brady Landfill Site, is 97% of its total capacity and its remaininglife is approximately 100 years, after which perpetual post closure maintenance is required.

(RESTATED NOTE 21)
8. OTHER LIABILITIES (CONTINUED)
The Brady Landfill Site Rehabilitation Reserve was established for the purpose of providing funding for the future developmentof the Brady Landfill Site. The reserve is financed through a transfer from the Solid Waste Disposal Fund and is based uponresidential and commercial tonnes. As at December 31, 2005, the reserve had a balance of $2.1 million (2004 - $1.8 million).
9. RETIREMENT ALLOWANCE, COMPENSATED ABSENCES AND OTHER LIABILITIES
2005 2004
Retirement allowance – accrued obligation $ 80,580 $ 75,328 Unamortized net actuarial loss (9,344) (5,545)
Retirement allowance – accrued liability 71,236 69,783 Compensated absences 47,808 45,193Other 10,563 8,993
Retirement allowance, compensated absences and other liabilities 129,607 123,969 Accrued liabilities recorded in the Funds’ financial statements (5,262) (5,479)
Unfunded retirement allowance, compensated absences and other liabilities (Note 12) $ 124,345 $ 118,490
Under the retirement allowance plan (including certain sick leave credits) for the majority of employees of the City, unused sickleave credits accumulate and employees with specified minimum service requirements become entitled to a cash paymentupon retirement, death or termination of service under certain conditions (not resignation). The costs are actuarially determinedusing the projected benefit valuation method pro-rated on services and reflects management’s best estimate of retirementages of employees, salary escalation and length of service. In addition, adjustments arising from plan amendment, changesin assumptions, and experience gains and losses are amortized on a straight-line basis over 11.1 years, which represents theexpected average remaining service life of the employee group. Amortization is calculated beginning in the year following theyear of occurrence of the actuarial gains or losses.
The City measures its accrued retirement allowance obligation as at December 31 of each year. The most recent actuarialvaluation report was at December 31, 2005.
Information about the City’s retirement allowance benefit plan is as follows:
2005 2004
Retirement allowance - accrued liability Balance, beginning of year $ 69,783 $ 67,983 Current service cost 3,649 3,636 Interest cost 3,877 3,927 Amortization of net actuarial loss 574 457 Benefit payments (6,647) (6,220)
Balance, end of year $ 71,236 $ 69,783
Retirement allowance expense consist of the following:
2005 2004
Current service cost $ 3,649 $ 3,636 Interest cost 3,877 3,927 Amortization of net actuarial loss 574 457
$ 8,100 $ 8,020
The significant actuarial assumptions adopted in measuring the retirement allowance obligation for the year ended December 31are as follows:
2005 2004
Valuation interest rate 4.50% 5.25%General increases in pay 3.00% 3.00%
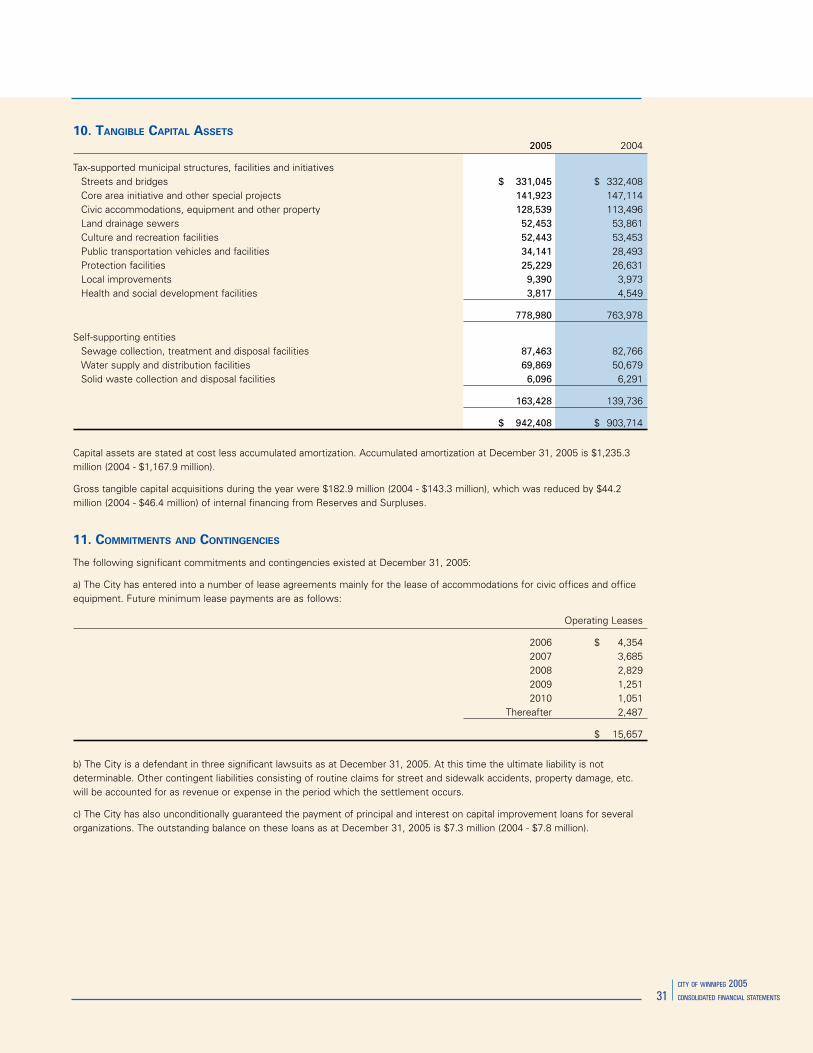
10. TANGIBLE CAPITAL ASSETS
2005 2004
Tax-supported municipal structures, facilities and initiatives Streets and bridges $ 331,045 $ 332,408 Core area initiative and other special projects 141,923 147,114 Civic accommodations, equipment and other property 128,539 113,496 Land drainage sewers 52,453 53,861 Culture and recreation facilities 52,443 53,453 Public transportation vehicles and facilities 34,141 28,493 Protection facilities 25,229 26,631 Local improvements 9,390 3,973 Health and social development facilities 3,817 4,549
778,980 763,978
Self-supporting entities Sewage collection, treatment and disposal facilities 87,463 82,766 Water supply and distribution facilities 69,869 50,679 Solid waste collection and disposal facilities 6,096 6,291
163,428 139,736
$ 942,408 $ 903,714
Capital assets are stated at cost less accumulated amortization. Accumulated amortization at December 31, 2005 is $1,235.3million (2004 - $1,167.9 million).
Gross tangible capital acquisitions during the year were $182.9 million (2004 - $143.3 million), which was reduced by $44.2million (2004 - $46.4 million) of internal financing from Reserves and Surpluses.
11. COMMITMENTS AND CONTINGENCIES
The following significant commitments and contingencies existed at December 31, 2005:
a) The City has entered into a number of lease agreements mainly for the lease of accommodations for civic offices and officeequipment. Future minimum lease payments are as follows:
Operating Leases
2006 $ 4,354 2007 3,685 2008 2,829 2009 1,251 2010 1,051 Thereafter 2,487
$ 15,657
b) The City is a defendant in three significant lawsuits as at December 31, 2005. At this time the ultimate liability is notdeterminable. Other contingent liabilities consisting of routine claims for street and sidewalk accidents, property damage, etc.will be accounted for as revenue or expense in the period which the settlement occurs.
c) The City has also unconditionally guaranteed the payment of principal and interest on capital improvement loans for severalorganizations. The outstanding balance on these loans as at December 31, 2005 is $7.3 million (2004 - $7.8 million).
(RESTATED NOTE 21)
(RESTATED NOTE 21)
12. SURPLUS
Consolidated surplus consists of the following individual fund surpluses/(deficits): 2005 2004
Appropriated Equity in Capital Assets $ 365,166 $ 335,267 Sewage Disposal System 69,236 40,181 Waterworks System 14,735 9,967 General Capital Fund 5,255 4,474 Transit System 4,897 -
459,289 389,889
Unappropriated Unamortized gain on Winnipeg Hydro sale 253,539 262,772 Waterworks System 63,324 28,502 Fleet Management – Special Operating Agency 24,199 25,320 Solid Waste Disposal 12,130 12,462 CentreVenture Development Corporation 10,980 9,869 General Revenue Enterprises Fund 5,028 5,445 Destination Winnipeg Inc. 1,001 989 The Sinking Fund Trustees of The City of Winnipeg 152 2,135 Other (223) (114) Golf Services - Special Operating Agency (1,127) (104) Glacial Sand and Gravel - Special Operating Agency (1,415) (604) Winnipeg Parking Authority - Special Operating Agency (1,533) - Sewage Disposal System (5,958) 6,528
360,097 353,200
Unfunded Environmental liabilities (Note 8) (14,000) (11,000) Retirement allowance, compensated absences and other liabilities (Note 9) (124,345) (118,490)
(138,345) (129,490)
$ 681,041 $ 613,599
The consolidated surplus represents the City’s combined operating and capital fund balances. Separate disclosure of theoperating and capital funds has not been presented as this information is not readily available.
Equity in Tangible Capital Assets is included in Net Assets which are determined as follows:
2005 2004
Non-financial assets $ 959,861 $ 921,322 Debt (Note 7) (447,857) (494,840) 512,004 426,482
Other surplus and reserve balances 462,721 503,585
Net Assets $ 974,725 $ 930,067
13. RESERVES
Consolidated reserves consist of the following restricted reserves: 2005 2004
Capital Reserves Water Treatment Reserve $ 73,680 $ 93,191 Environmental Projects Reserve 52,336 51,230 Combined Sewer Renewal Reserve 23,488 25,132 Brady Landfill Site Rehabilitation Reserve 2,114 1,845 Other 1,781 1,649 Golf Course Reserve 1,773 1,714 Watermain Renewal Reserve 1,710 2,005 Library Reserve 1,477 1,821 Computer Replacement Reserve 1,413 1,092
159,772 179,679
Special Purpose Reserves General Purpose Reserve 13,244 14,060 Perpetual Maintenance Fund – Brookside Cemetery 9,891 9,523 Heritage Investment Reserve 8,744 8,888 Insurance Reserve 7,340 6,721 Workers Compensation Reserve 6,887 6,146 Land Operating Reserve 5,975 5,920 Commitment Reserve 4,310 4,174 Contributions in Lieu of Land Dedication Reserve 4,130 2,914 Economic Development Investment Reserve 3,225 5,474
Other 1,842 1,494 Housing Rehabilitation Investment Reserve 1,304 1,138 Assiniboine Park Enterprise Reserve 1,226 1,164 Idea Bank Reserve 907 1,336
Snow Clearing Reserve - 3,272
69,025 72,224 Stabilization Reserves Fiscal Stabilization Reserve 35,350 34,712 Mill Rate Stabilization Reserve 28,654 27,613
64,004 62,325
Other Reserves 883 2,240
$ 293,684 $ 316,468
The change during the year to the Reserves is the result of the following: 2005 2004
Taxation revenue $ 28,552 $ 27,728 Interest revenue 9,406 8,992 Other revenue 8,661 8,576 Expended from the Reserves (15,394) (12,236)Net transfer to the operating and capital funds (54,009) (14,493)
$ (22,784) $ 18,567

14. TAXATION
2005 2004
Municipal and school property taxes $ 784,395 $ 779,677 Payments-in-lieu of property (municipal and school) and business taxes 42,086 44,117
826,481 823,794 Payments to Province and school divisions (435,205) (439,062)
Net property taxes and payments-in-lieu of property taxes available for municipal purposes 391,276 384,732
Business tax and license-in-lieu of business tax 61,243 60,891 Local improvement and frontage levies 28,136 27,479 Electricity and gas sales taxes 16,826 15,402 Amusement tax and mobile home license 5,916 3,194
$ 503,397 $ 491,698
The property tax roll includes school taxes of $411.0 million (2004 - $413.5 million) assessed and levied on behalf of theProvince of Manitoba and school divisions. Payments-in-lieu of school taxes assessed in 2005 totalled $24.2 million (2004 -$25.6 million) and are treated the same as school taxes. School taxes and payments-in-lieu of school taxes are remitted to theProvince and school divisions based upon a formula and schedule set by the Province of Manitoba. If property taxes are reduceddue to an assessment reduction the City is required by legislation to fund the repayment of both the municipal and school taxeswith applicable interest.
15. SALES OF SERVICES AND REGULATORY FEES
2005 2004
Water sales and sewage services $ 157,764 $ 145,926 Other sales of goods and services 93,226 93,150 Transit fares 55,358 52,529 Regulatory fees 37,859 36,601
$ 344,207 $ 328,206
16. GOVERNMENT GRANTS AND TRANSFERS
2005 2004
Province of Manitoba grants Tax sharing $ 49,368 $ 47,343 Ambulance, libraries and other 28,651 24,896 Unconditional 19,488 19,888 Transit 19,355 16,854 Support 9,061 8,496 Support for Provincial programs (23,650) (23,650)
102,273 93,827
Government of Canada grants Canada Mortgage and Housing Corporation 147 174 Dutch elm disease program, job training and other 89 99
236 273
$ 102,509 $ 94,100

(RESTATED NOTE 21)
17. EXPENSES BY OBJECT
2005 2004
Salaries and benefits $ 511,312 $ 496,048 Goods and services 300,889 285,594 Debt repayment and interest 121,970 129,042 Grants and other expenses 24,662 19,234
$ 958,833 $ 929,918
18. ENVIRONMENTAL LIABILITIES
In 2005, the City has accrued an overall liability for environmental matters in the amount of $14.0 million (2004 - $11.0 million)which represents management’s best estimate of this liability. By their nature, these estimates are subject to measurementuncertainty and the effect on the financial statements of changes in such estimates in future periods could be significant.
19. PENSION COSTS AND OBLIGATIONS
a) Winnipeg Civic Employees’ Benefits ProgramThe Program is a multi-employer contributory defined benefit program, providing pension and disability benefits to all City ofWinnipeg employees, other than police officers, and to employees of certain other participating employers. Program membersare currently required to make contributions of 6.5% of Canada Pension Plan earnings and 7.5% of pensionable earnings inexcess of Canada Pension Plan earnings. The City and participating employers are required to make matching contributions. Inthe event of unfavourable financial experience, Program member and employers contributions can be increased, on an equalbasis, to a rate not exceeding 8% of pensionable earnings.
An actuarial valuation of the Program was made at December 31, 2004, which indicated an excess of actuarial value of Programassets over actuarial liabilities of $429.3 million. The Pension Trust Agreement specifies how the excess of actuarial surplusescan be used but does not attribute the excess of actuarial surpluses to individual employers. However, a portion of the excess ofactuarial surpluses is allocated to a City Account that the City and other participating employers may use to finance reductions intheir contributions.
The balance of the City Account at December 31, 2005 is $125.2 million (2004 - $123.8 million). Total contributions by the City tothe Program in 2005 were $11.9 million (2004 - $10.9 million), which were expensed as incurred.
b) Winnipeg Police Pension PlanEffective January 1, 2003, the City entered into an agreement with its two Police Associations concerning the sharing ofsurpluses and risks under the Winnipeg Police Pension Plan. Under the terms of the agreement, the existing Regular Account(which financed the Plan’s defined pension benefits other than cost-of-living adjustments) and the Supplementary Account(which financed cost-of-living adjustments to pensioners) were merged into a single account and the actuarial surplus was usedto fully fund future cost-of-living adjustments on all accrued pension and deferred pension benefits at the rate of 75% of theinflation rate, as well as establish a contribution stabilization reserve to maintain the City’s contribution rate at 8% of pensionableearnings, which is the same rate as that at which police employees contribute to the Plan. Future actuarial surpluses, over andabove those required to fully fund future cost-of-living adjustments to pensions at 75% of the inflation rate and the contributionstabilization reserve sufficient to maintain the City’s contribution rate at 8% of pensionable earnings, will be shared equallybetween the City and the Plan members. The City will remain responsible for ensuring the financial solvency of the Plan withrespect to benefits other than cost-of-living adjustments to pensions.
19. PENSION COSTS AND OBLIGATIONS (CONTINUED)
b) Winnipeg Police Pension Plan (continued)An actuarial valuation of the Plan was carried out as at December 31, 2004 and the results were extrapolated to December 31,2005. The principal long-term assumptions on which the valuation was based were: discount rate of 6.25% per year; inflationrate of 2.25% per year; and general pay increases of 3.75% per year. The accrued pension obligation was valued using theprojected benefit method pro-rated on services. Based on this valuation and extrapolation, the funded status of the Plan is asfollows:
2005 2004
Pension fund assets, at actuarial value $ 786,585 $ 742,112
Accrued pension obligations $ 720,810 $ 685,847 Contribution stabilization reserve 55,361 54,036
$ 776,171 $ 739,883
The market value of the pension fund assets as at December 31, 2005 is $826.9 million (2004 - $751.2 million).
Total contributions made by the City to the Plan in 2005 were $6.8 million (2004 - $6.9 million). Total employee contributions tothe Plan in 2005 were $6.8 million (2004 - $6.9 million). Benefits paid from the Plan in 2005 were $28.8 million (2004 - $25.9million).
The expected rate of return on Plan assets in 2005 was 6.25% (2004 - 6.25%). The actual rate of return net of investmentexpenses, on Plan assets in 2005 was 12.1% (2004 - 10.3%).
c) Councillors’ Pension Plan
i) Pension Plan Established Under By-law 3553/83On November 2, 1992, the pension plan provided to members of Council was terminated, thereby not allowing new membersto be accepted to the plan and current members being entitled to receive retirement benefits once they become eligible. In2005, the City paid out $0.3 million (2004 - $0.3 million).
ii) Pension Plan Established Under By-law 7869/01On November 22, 2000, City Council adopted the policy that effective January 1, 2001, a Council Pension Plan be created forall members of Council for The City of Winnipeg which is consistent with the Civic Employees’ Pension Plan.
d) Group Life Insurance PlanEmployees of the City who are members of the Civic Employees’ Pension Plan and the Winnipeg Police Pension Plan mustbecome members of the Civic Employees’ Group Life Insurance Plan and the Police Employees’ Group Life Insurance Planrespectively. These plans provide life insurance coverage for members while employed and coverage can be continued intoretirement at the employees’ option. Plan members and the City share the cost of basic life insurance coverage. An actuarialvaluation indicated that this post-retirement liability is fully funded.
20. PROPERTY AND LIABILITY INSURANCE
The City purchases comprehensive insurance coverage for property and liability with a self-insured retention level of $250thousand per claim for most of the policies. The City has established an Insurance Reserve Fund that enables the City to carrya large self-insured retention level which mitigates the effect of poor claims experience in any given year. The balance of thereserve as at December 31, 2005 is $7.3 million (2004 - $6.7 million).
21. COMPARATIVE FIGURES
For 2005, included in the consolidated financial statements is a retroactive restatement for compensated absences resultingfrom retirement allowance plans as an actuarial valuation was not available until the current year. The 2005 opening surplus hasdecreased by $6.9 million (2004 - $6.5 million).
In addition, included in the consolidated financial statements is a retroactive restatement for developer deposits that should havebeen recognized in prior years’ revenue when the related expenses were incurred. The 2005 opening surplus has increased by$3.2 million (2004 - $3.4 million).
The effect of the restatements on the statement of operations and net assets for 2005 and 2004 was nominal.
Certain other comparative figures have been reclassified to conform with the current year’s presentation.

As at December 31 (“$” amounts in thousands of dollars, except as noted)
(Unaudited) 2005 2004 2003 2002 2001
1. Population (as restated per Statistics Canada) 650,100 646,800 642,800 639,800 637,000 Unemployment rate (per Statistics Canada)
• Winnipeg 4.8% 5.5% 5.2% 5.3% 5.1% • National average 6.8% 7.2% 7.6% 7.7% 7.2% 2. Average total employees 8,749 8,788 8,385 8,333 8,870
3. Number of taxable properties 201,262 200,193 199,118 198,827 198,252 Payments-in-lieu • Number of properties 813 783 872 825 859
4. Assessment • Residential $ 18,460,471 18,277,925 18,069,819 17,803,696 16,950,454 • Commercial and industrial 7,209,121 7,132,230 7,099,635 7,046,756 6,242,499 • Farm and golf 102,742 101,769 104,099 106,062 106,799 $ 25,772,334 25,511,924 25,273,553 24,956,514 23,299,752
Assessment per capita (in dollars) $ 39,644 39,443 39,318 39,007 36,577 Commercial and industrial as a percentage of assessment 27.97% 27.96% 28.09% 28.24% 26.79%
5. Tax arrears $ 37,698 40,436 42,761 47,978 45,283
6. Tax arrears per capita (in dollars) $ 57.99 62.52 66.52 74.99 71.09
7. Municipal mill rate 29.686 29.686 29.686 29.686 32.140 • Percentage change adjusted for portioning and reassessment 0.00% 0.00% 0.00% -2.00% -2.42%
8. Winnipeg consumer price index (annual average) • 1992 base year 100 131.20 127.90 125.50 123.30 121.50 • Percentage increase 2.58% 1.91% 1.78% 1.48% 2.88%
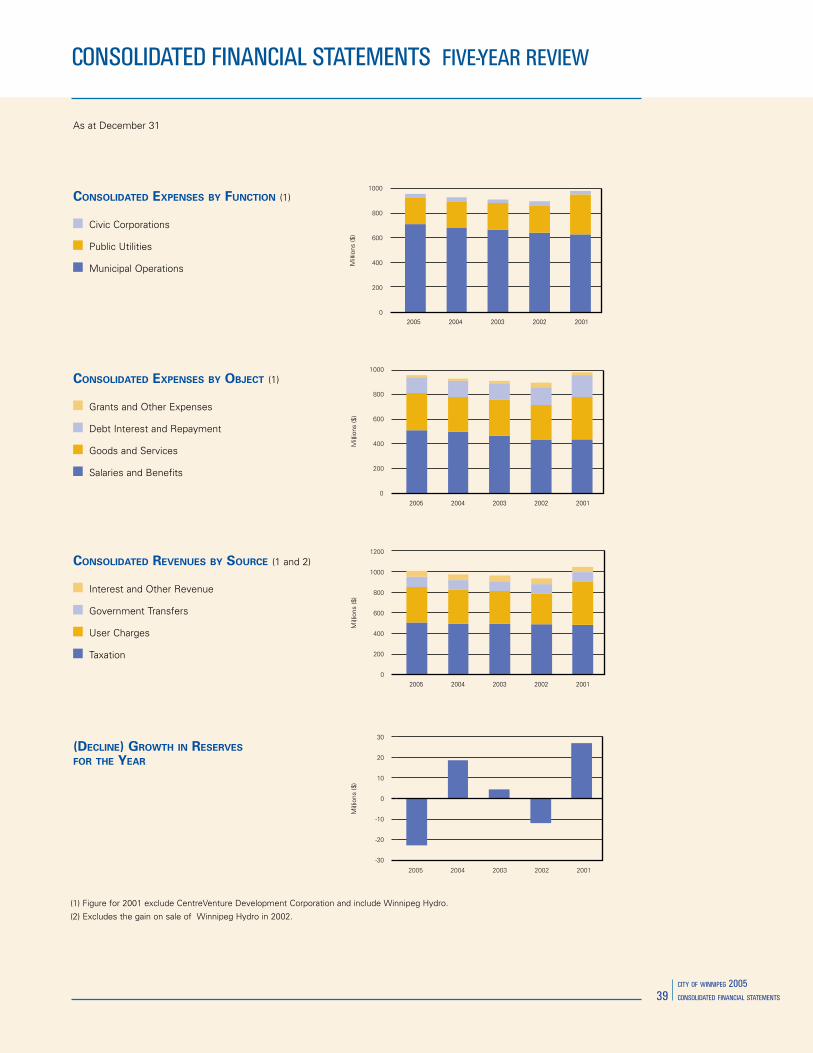
9. Consolidated revenue • Taxation $ 503,397 491,698 489,996 484,220 480,974 • User charges 344,207 328,206 318,605 295,893 416,408 • Government transfers 102,509 94,100 97,082 94,026 93,741 • Interest and other revenue 53,378 54,879 55,746 56,769 50,078 • Gain on sale of Hydro - - - 227,476 - $ 1,003,491 968,883 961,429 1,158,384 1,041,201 10. Consolidated expenses by function • Municipal operations $ 711,334 681,533 662,902 640,692 627,964 • Public utilities 218,855 217,171 218,246 223,814 324,858 • Civic corporations 28,644 31,214 29,855 30,307 27,758 $ 958,833 929,918 911,003 894,813 980,580
11. Growth in Surplus for the year $ 67,442 20,398 46,196 275,655 33,830 (Decline) Growth in Reserves for the year $ (22,784) 18,567 4,230 (12,084) 26,791
(Note: In 2002, the City conducted a general reassessment which moved from a 1996 level of value to a 1999 level of value.)
(Note: For 2001, the revenue, expenses, change in surplus, and net financial assets (liabilities) figures have not be restated for CentreVentureDevelopment Corporation.)
(Note: For 2003 - 2001, the revenue, expenses, change in surplus, and net financial assets (liabilities) figures have not be restated for compensatedabsences and developer deposits.)
(Note: The 2001 figures include Winnipeg Hydro’s operations.)
As at December 31 (“$” amounts in thousands of dollars, except as noted)
(Unaudited) 2005 2004 2003 2002 2001
12. Consolidated expenses by object • Salaries and benefits $ 511,312 496,048 465,442 433,185 437,557 • Goods and services 300,889 285,594 290,573 283,703 340,983 • Debt interest and repayment 121,970 129,042 133,537 143,856 176,253 • Grants and other expenses 24,662 19,234 21,451 34,069 25,787 $ 958,833 929,918 911,003 894,813 980,580
13. Payments to school authorities $ 435,205 439,062 425,053 414,140 395,404
14. Debt • Tax-supported $ 429,287 486,790 489,974 576,659 631,332 • Transit 27,520 35,092 33,606 38,007 42,607 • City-owned utilities 151,700 175,050 177,429 204,833 419,957 • Other 38,315 37,739 39,372 39,890 40,892 • Total gross debt 646,822 734,671 740,381 859,389 1,134,788 • Less: Sinking Fund 198,965 239,831 245,709 363,097 405,865 • Total net long-term debt $ 447,857 494,840 494,672 496,292 728,923 Percentage of total assessment 1.74% 1.94% 1.96% 1.99% 3.13%
15. Acquisition of tangible capital assets Gross purchase $ 182,872 143,286 164,384 157,511 135,693 Less: internally financed • Combined Sewer Renewal 21,163 16,290 15,398 18,074 16,957 • Watermain Renewal 7,299 6,281 6,541 8,964 7,940 • Sewage Disposal System 6,815 5,019 4,514 3,412 3,749 • Other 6,377 6,553 3,837 2,681 1,709 • Waterworks System 1,335 3,115 1,080 1,635 1,601 • General Revenue 718 347 5,072 3,900 4,645 • Aqueduct Rehabilitation 416 1,120 3,458 8,242 5,659 • Transit Bus Replacement - 5,499 9,237 4,865 3,686 • General Purpose - 1,192 4,170 - - • Environmental Projects - 950 1,187 935 453 • Frontage levies - - - 10,000 - • Equipment and Material Services - - - 301 6,727
44,123 46,366 54,494 63,009 53,126 $ 138,749 96,920 109,890 94,502 82,567
16. Net financial assets (liabilities) $ 14,864 8,745 (46,874) (98,690) (576,326)
17. Reserves and Surplus • Reserves $ 293,684 316,468 297,901 293,671 305,755 • Surplus $ 681,041 613,599 596,284 550,088 270,076
18. Area in acres at the end of the year 116,000 116,000 116,000 116,000 116,000
19. Construction • Permits issued 8,931 8,977 8,344 8,719 7,938 • Value $ 656,350 674,619 649,071 427,028 372,969 Housing starts 2,177 2,335 2,208 1,451 1,290
As at December 31
CONSOLIDATED EXPENSES BY FUNCTION (1)
Civic Corporations
Public Utilities
Municipal Operations
(DECLINE) GROWTH IN RESERVES
FOR THE YEAR
CONSOLIDATED EXPENSES BY OBJECT (1)
Grants and Other Expenses
Debt Interest and Repayment
Goods and Services
Salaries and Benefits
CONSOLIDATED REVENUES BY SOURCE (1 and 2)
Interest and Other Revenue
Government Transfers
User Charges
Taxation
(1) Figure for 2001 exclude CentreVenture Development Corporation and include Winnipeg Hydro.
(2) Excludes the gain on sale of Winnipeg Hydro in 2002.
As at December 31
NET FINANCIAL ASSETS (LIABILITIES)
PRINCIPAL CORPORATE TAXPAYERS
RESERVES BY CATEGORY (1)
Other
Stabilization
Special
Capital

510 MAIN STREET | WINNIPEG | MANITOBA | CANADA | R3B 1B9 | www.winnipeg.ca