Embed Size (px)
Citation preview

2003 Financial and Statistical Report

Contents
1 PG&E Corporation
Financial Data and Ratios
Selected Financial Data
Consolidated Statements ofOperations
Consolidated Balance Sheets
Consolidated Statements of Cash Flows
Consolidated Statements of Common Shareholders’ Equity
Results of Operations
Earnings (Loss) Per Share
Quarterly Consolidated Financial Data (Unaudited)
11 Pacific Gas and Electric Company
Consolidated Statements ofOperations
Consolidated Balance Sheets
Consolidated Statements of Cash Flows
Consolidated Statements of Shareholders’ Equity
Capitalization Data
Electric Operating Statistics
Electric Revenues, Sales andCustomers
Gas Revenues, Sales,Customers and OperatingStatistics
21 Shareholder Information
PG&E Corporation, headquartered in San Francisco, California, is an energy-basedholding company with approximately $10.4 billion in revenues in 2003 and approxi-mately $30.2 billion in assets at the end of 2003.
PG&E Corporation, incorporated in California in 1995, conducts its business principally through Pacific Gas and Electric Company, or the Utility, a public utilityoperating in northern and central California. The Utility engages primarily in the businesses of electric and natural gas distribution, electric generation, electrictransmission, and natural gas transportation and storage. PG&E Corporationbecame the holding company of the Utility and its subsidiaries on January 1, 1997.The Utility, incorporated in California in 1905, is the predecessor of PG&ECorporation. PG&E Corporation also currently owns National Energy & GasTransmission, Inc., or NEGT, formerly known as PG&E National Energy Group, whoseresults of operations are classified as discontinued operations. NEGT engages inelectric generation and natural gas transportation in the United States.
Pacific Gas and Electric CompanyPacific Gas and Electric Company served approximately 4.9 million electric distri-bution customers and approximately 3.9 million natural gas distribution customers at December 31, 2003. The Utility had approximately $29.1 billion in assets atDecember 31, 2003 and generated revenues of approximately $10.4 billion in 2003.Its revenues are generated mainly through the sale and delivery of electricity andnatural gas. The Utility is regulated primarily by the California Public Utilities Commis-sion, or the CPUC, and the Federal Energy Regulatory Commission, or the FERC.
On December 19, 2003, the CPUC, PG&E Corporation and the Utility entered intoa Settlement Agreement, that would permit the Utility to pay allowed creditor claimsin full, plus applicable interest, and emerge from Chapter 11 as an investmentgrade entity. On December 22, 2003, the bankruptcy court confirmed a Plan ofReorganization that fully incorporates the Settlement Agreement. Implementation ofthe Plan of Reorganization is subject to various conditions, including the consum-mation of the public offering of long-term debt, and the receipt of investment gradecredit ratings. The Settlement Agreement is discussed further in the MD&A and inNote 2 of the Notes to the Consolidated Financial Statements in the Annual Report.
NEGTOn July 8, 2003, NEGT filed a voluntary petition for relief under the provisions ofChapter 11 in the U.S. Bankruptcy Court for the District of Maryland, GreenbeltDivision. NEGT also filed a plan of reorganization with the bankruptcy court that,when implemented, would eliminate PG&E Corporation’s equity interest in NEGT.
Also effective July 8, 2003, NEGT’s results are no longer consolidated with those ofPG&E Corporation. NEGT’s results of operations through July 7, 2003, and for prioryears have been reclassified as discontinued operations, and PG&E Corporationnow accounts for its investment in NEGT using the cost method of accounting.PG&E Corporation’s net investment in NEGT at December 31, 2003 was a negative$1.2 billion.
If NEGT’s proposed plan of reorganization or another plan that eliminates PG&ECorporation’s equity in NEGT is implemented, PG&E Corporation will reverse itsinvestment in NEGT and related amounts included in deferred income taxes andaccumulated other comprehensive income and, as a result, recognize a materialone-time net non-cash gain to earnings from discontinued operations. NEGT isfurther discussed in the MD&A and in Note 5 of the Notes to the ConsolidatedFinancial Statements in the Annual Report.
This report has been prepared primarily for institutional investors and security analysts in the hope that it will provide a convenientand useful reference source. It is not a representation or prospectus in regards to the company’s securities and is not furnished inconnection with any proposed sale or offer to sell or buy any stock or securities.
Complete financial statements are included in the company’s 2003 Annual Report to Shareholders. See Management’s Discussion andAnalysis of Financial Condition and Results of Operations and Notes to the Consolidated Financial Statements for discussion ofmatters relating to certain data.Those notes and discussion are an integral part of these statements. Prior years’ amounts have beenreclassified where necessary to conform to the 2003 presentation.
©2004 PG&E Corporation.All rights reserved. 3/04
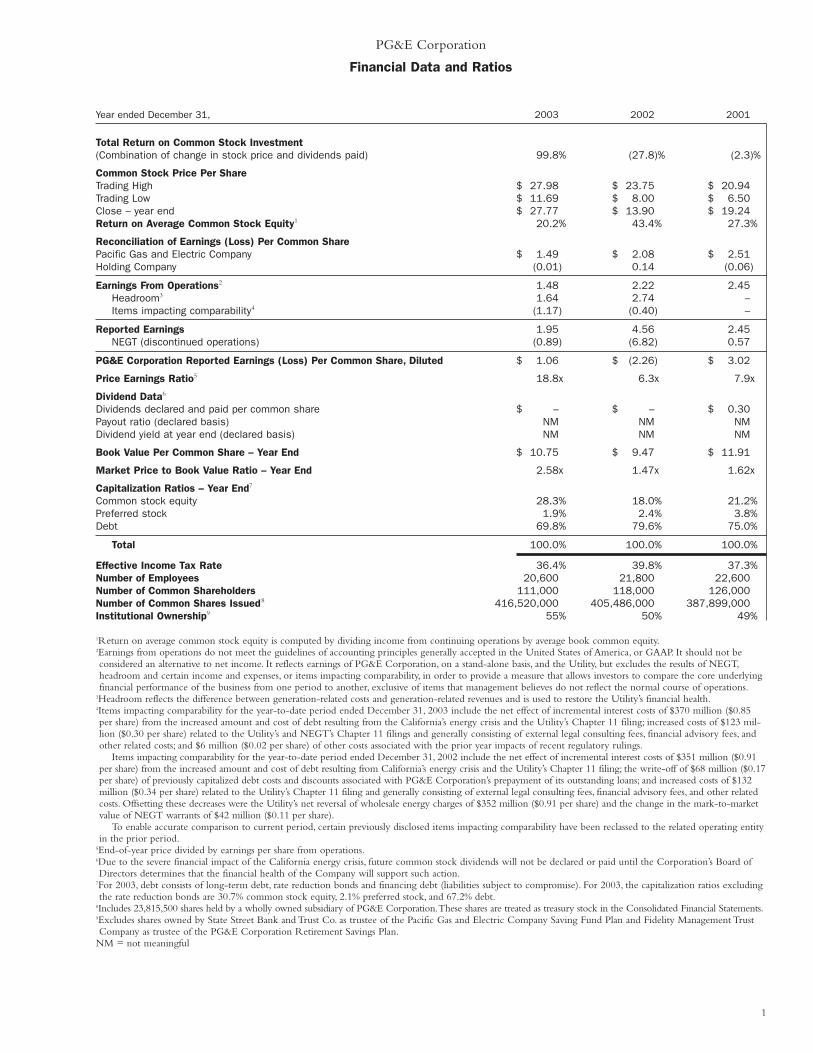
Year ended December 31, 2003 2002 2001
Total Return on Common Stock Investment(Combination of change in stock price and dividends paid) 99.8% (27.8)% (2.3)%
Common Stock Price Per ShareTrading High $ 27.98 $ 23.75 $ 20.94Trading Low $ 11.69 $ 8.00 $ 6.50Close – year end $ 27.77 $ 13.90 $ 19.24Return on Average Common Stock Equity1 20.2% 43.4% 27.3%
Reconciliation of Earnings (Loss) Per Common SharePacific Gas and Electric Company $ 1.49 $ 2.08 $ 2.51Holding Company (0.01) 0.14 (0.06)
Earnings From Operations2 1.48 2.22 2.45Headroom3 1.64 2.74 –Items impacting comparability4 (1.17) (0.40) –
Reported Earnings 1.95 4.56 2.45NEGT (discontinued operations) (0.89) (6.82) 0.57
PG&E Corporation Reported Earnings (Loss) Per Common Share, Diluted $ 1.06 $ (2.26) $ 3.02
Price Earnings Ratio5 18.8x 6.3x 7.9x
Dividend Data6
Dividends declared and paid per common share $ – $ – $ 0.30Payout ratio (declared basis) NM NM NMDividend yield at year end (declared basis) NM NM NM
Book Value Per Common Share – Year End $ 10.75 $ 9.47 $ 11.91
Market Price to Book Value Ratio – Year End 2.58x 1.47x 1.62x
Capitalization Ratios – Year End7
Common stock equity 28.3% 18.0% 21.2%Preferred stock 1.9% 2.4% 3.8%Debt 69.8% 79.6% 75.0%
Total 100.0% 100.0% 100.0%
Effective Income Tax Rate 36.4% 39.8% 37.3%Number of Employees 20,600 21,800 22,600Number of Common Shareholders 111,000 118,000 126,000Number of Common Shares Issued8 416,520,000 405,486,000 387,899,000Institutional Ownership9 55% 50% 49%
1Return on average common stock equity is computed by dividing income from continuing operations by average book common equity.2Earnings from operations do not meet the guidelines of accounting principles generally accepted in the United States of America, or GAAP. It should not beconsidered an alternative to net income. It reflects earnings of PG&E Corporation, on a stand-alone basis, and the Utility, but excludes the results of NEGT,headroom and certain income and expenses, or items impacting comparability, in order to provide a measure that allows investors to compare the core underlyingfinancial performance of the business from one period to another, exclusive of items that management believes do not reflect the normal course of operations.
3Headroom reflects the difference between generation-related costs and generation-related revenues and is used to restore the Utility’s financial health.4Items impacting comparability for the year-to-date period ended December 31, 2003 include the net effect of incremental interest costs of $370 million ($0.85per share) from the increased amount and cost of debt resulting from the California’s energy crisis and the Utility’s Chapter 11 filing; increased costs of $123 mil-lion ($0.30 per share) related to the Utility’s and NEGT’s Chapter 11 filings and generally consisting of external legal consulting fees, financial advisory fees, andother related costs; and $6 million ($0.02 per share) of other costs associated with the prior year impacts of recent regulatory rulings.
Items impacting comparability for the year-to-date period ended December 31, 2002 include the net effect of incremental interest costs of $351 million ($0.91per share) from the increased amount and cost of debt resulting from California’s energy crisis and the Utility’s Chapter 11 filing; the write-off of $68 million ($0.17per share) of previously capitalized debt costs and discounts associated with PG&E Corporation’s prepayment of its outstanding loans; and increased costs of $132million ($0.34 per share) related to the Utility’s Chapter 11 filing and generally consisting of external legal consulting fees, financial advisory fees, and other relatedcosts. Offsetting these decreases were the Utility’s net reversal of wholesale energy charges of $352 million ($0.91 per share) and the change in the mark-to-marketvalue of NEGT warrants of $42 million ($0.11 per share).
To enable accurate comparison to current period, certain previously disclosed items impacting comparability have been reclassed to the related operating entityin the prior period.
5End-of-year price divided by earnings per share from operations.6Due to the severe financial impact of the California energy crisis, future common stock dividends will not be declared or paid until the Corporation’s Board ofDirectors determines that the financial health of the Company will support such action.
7For 2003, debt consists of long-term debt, rate reduction bonds and financing debt (liabilities subject to compromise). For 2003, the capitalization ratios excludingthe rate reduction bonds are 30.7% common stock equity, 2.1% preferred stock, and 67.2% debt.
8Includes 23,815,500 shares held by a wholly owned subsidiary of PG&E Corporation.These shares are treated as treasury stock in the Consolidated Financial Statements.9Excludes shares owned by State Street Bank and Trust Co. as trustee of the Pacific Gas and Electric Company Saving Fund Plan and Fidelity Management TrustCompany as trustee of the PG&E Corporation Retirement Savings Plan.
NM = not meaningful
PG&E Corporation
Financial Data and Ratios
1

(in millions, except per share amounts) 2003 2002 2001 2000 1999
PG&E CORPORATION1
For the YearOperating revenues $10,435 $10,505 $10,450 $ 9,623 $ 9,084Operating income (loss) 2,343 3,954 2,613 (5,077) 1,950Income (loss) from continuing operations 791 1,723 1,021 (3,435) 713Earnings (loss) per common share from
continuing operations, basic 2.05 4.64 2.81 (9.49) 1.94Earnings (loss) per common share from
continuing operations, diluted 1.96 4.50 2.80 (9.49) 1.93Dividends declared per common share – – – 1.20 1.20
At Year-EndBook value per common share $ 10.75 $ 9.47 $ 11.91 $ 8.76 $ 19.13Common stock price per share 27.77 13.90 19.24 20.00 20.50Total assets 30,175 36,081 38,529 38,786 31,980Long-term debt (excluding current portion) 3,314 3,715 3,923 3,346 4,877Rate reduction bonds
(excluding current portion) 870 1,160 1,450 1,740 2,031Financial debt subject to compromise 5,603 5,605 5,651 – –Redeemable preferred stock and securities
of subsidiaries (excluding current portion) 286 286 586 586 586
PACIFIC GAS AND ELECTRIC COMPANY1
For the YearOperating revenues $10,438 $10,514 $10,462 $ 9,637 $ 9,228Operating income (loss) 2,339 3,913 2,478 (5,201) 1,993Income available for (loss allocated to)
common stock 901 1,794 990 (3,508) 763
At Year-EndTotal assets $29,066 $27,593 $28,105 $24,622 $23,862Long-term debt (excluding current portion) 2,431 2,739 3,019 3,342 4,877Rate reduction bonds
(excluding current portion) 870 1,160 1,450 1,740 2,031Financial debt subject to compromise 5,603 5,605 5,651 – –Redeemable preferred stock and securities
(excluding current portion) 286 286 586 586 586
1Operating income (loss) and income (loss) from continuing operations reflect the write-off of generation-related regulatory assets and under-collected electricitypurchase costs in 2000. See Management’s Discussion and Analysis of Financial Condition and Results of Operations and Notes to the Consolidated FinancialStatements of the 2003 Annual Report for discussion of matters relating to certain data.
PG&E Corporation
Selected Financial Data
2

Year ended December 31,
(in millions, except per share amounts) 2003 2002 2001
Operating RevenuesElectric $ 7,582 $ 8,178 $ 7,326Natural gas 2,853 2,327 3,124
Total Operating Revenues 10,435 10,505 10,450
Operating ExpensesCost of electricity 2,309 1,447 2,717Cost of natural gas 1,438 895 1,720Operating and maintenance 2,963 2,858 2,404Depreciation, amortization, and decommissioning 222 1,196 899Reorganization professional fees and expenses 160 155 97
Total Operating Expenses 8,092 6,551 7,837
Operating Income (Loss) 2,343 3,954 2,613Reorganization interest income 46 71 91Interest income 16 9 46Interest expense (1,147) (1,224) (1,078)Other income (expense), net (9) 50 (43)
Income Before Income Taxes 1,249 2,860 1,629Income tax provision 458 1,137 608
Income From Continuing Operations 791 1,723 1,021Discontinued OperationsEarnings (Loss) from operations of NEGT (net of income tax benefit of
$230 million in 2003, $1,558 million in 2002, and none in 2001) (365) (2,536) 69
Net Income (Loss) Before Cumulative Effect of Changes in Accounting Principles 426 (813) 1,090
Cumulative effect of changes in accounting principles of $(5) million in 2003, $(61) million in 2002, and $9 million in 2001 related to discontinued operations (net of income tax expense (benefit) of $(3) million in 2003, $(42) million in 2002, and $6 million in 2001). In 2003, $(1) million related to the Utility (net of income tax benefit of $1 million) (6) (61) 9
Net Income (Loss) $ 420 $ (874) $ 1,099
Weighted Average Common Shares Outstanding, Basic 385 371 363
Earnings Per Common Share from Continuing Operations, Basic $ 2.05 $ 4.64 $ 2.81
Earnings (Loss) Per Common Share, Basic $ 1.09 $ (2.36) $ 3.03
Earnings Per Common Share from Continuing Operations, Diluted $ 1.96 $ 4.50 $ 2.80
Earnings (Loss) Per Common Share, Diluted $ 1.06 $ (2.26) $ 3.02
PG&E Corporation
Consolidated Statements of Operations
3

Balance at December 31,
(in millions) 2003 2002
ASSETS
Current AssetsCash and cash equivalents $ 3,658 $ 3,532Restricted cash 403 527Accounts receivable:
Customers (net of allowance for doubtful accounts of $68 million in 2003 and $59 million in 2002) 2,424 1,921
Related parties 15 –Regulatory balancing accounts 248 98
Inventories:Gas stored underground 166 154Materials and supplies 126 121
Current assets of NEGT – 3,029Prepaid expenses and other 108 111
Total Current Assets 7,148 9,493
Property, Plant and EquipmentElectric 20,468 18,922Gas 8,355 8,123Construction work in progress 379 427Other 20 21
Total Property, Plant and Equipment 29,222 27,493Accumulated depreciation (11,115) (10,507)
Net Property, Plant and Equipment 18,107 16,986
Other Noncurrent AssetsRegulatory assets 2,001 2,011Nuclear decommissioning funds 1,478 1,335Long-term assets of NEGT – 4,883Other 1,441 1,373
Total Other Noncurrent Assets 4,920 9,602
TOTAL ASSETS $ 30,175 $ 36,081
PG&E Corporation
Consolidated Balance Sheets
4
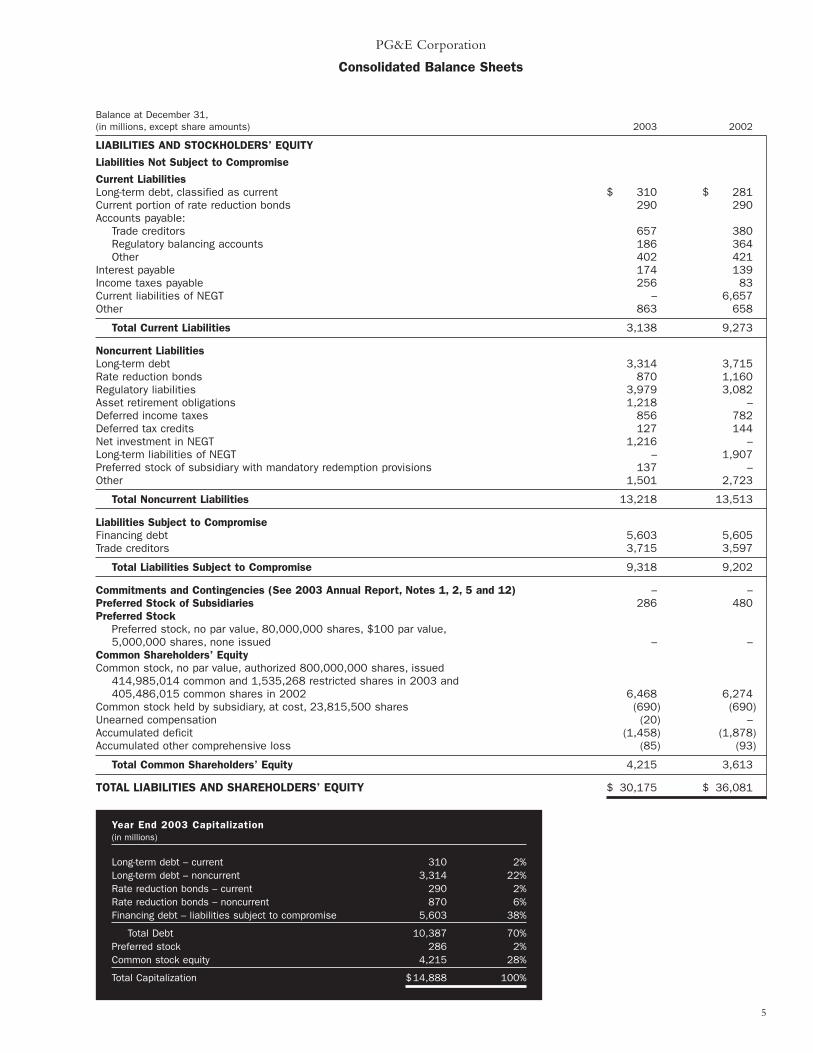
Balance at December 31,(in millions, except share amounts) 2003 2002
LIABILITIES AND STOCKHOLDERS’ EQUITY
Liabilities Not Subject to Compromise
Current LiabilitiesLong-term debt, classified as current $ 310 $ 281Current portion of rate reduction bonds 290 290Accounts payable:
Trade creditors 657 380Regulatory balancing accounts 186 364Other 402 421
Interest payable 174 139Income taxes payable 256 83Current liabilities of NEGT – 6,657Other 863 658
Total Current Liabilities 3,138 9,273
Noncurrent LiabilitiesLong-term debt 3,314 3,715Rate reduction bonds 870 1,160Regulatory liabilities 3,979 3,082Asset retirement obligations 1,218 –Deferred income taxes 856 782Deferred tax credits 127 144Net investment in NEGT 1,216 –Long-term liabilities of NEGT – 1,907Preferred stock of subsidiary with mandatory redemption provisions 137 –Other 1,501 2,723
Total Noncurrent Liabilities 13,218 13,513
Liabilities Subject to CompromiseFinancing debt 5,603 5,605Trade creditors 3,715 3,597
Total Liabilities Subject to Compromise 9,318 9,202
Commitments and Contingencies (See 2003 Annual Report, Notes 1, 2, 5 and 12) – –Preferred Stock of Subsidiaries 286 480Preferred Stock
Preferred stock, no par value, 80,000,000 shares, $100 par value,5,000,000 shares, none issued – –
Common Shareholders’ EquityCommon stock, no par value, authorized 800,000,000 shares, issued
414,985,014 common and 1,535,268 restricted shares in 2003 and 405,486,015 common shares in 2002 6,468 6,274
Common stock held by subsidiary, at cost, 23,815,500 shares (690) (690)Unearned compensation (20) –Accumulated deficit (1,458) (1,878)Accumulated other comprehensive loss (85) (93)
Total Common Shareholders’ Equity 4,215 3,613
TOTAL LIABILITIES AND SHAREHOLDERS’ EQUITY $ 30,175 $ 36,081
PG&E Corporation
Consolidated Balance Sheets
5
Year End 2003 Capitalization(in millions)
Long-term debt – current 310 2%Long-term debt – noncurrent 3,314 22%Rate reduction bonds – current 290 2%Rate reduction bonds – noncurrent 870 6%Financing debt – liabilities subject to compromise 5,603 38%
Total Debt 10,387 70%Preferred stock 286 2%Common stock equity 4,215 28%
Total Capitalization $14,888 100%

For the year ended December 31,
(in millions) 2003 2002 2001
Cash Flows from Operating ActivitiesNet income (Loss) $ 420 $ (874) $ 1,099Loss (income) from discontinued operations 365 2,536 (69)Cumulative effect of changes in accounting principles 6 61 (9)
Net income from continuing operations 791 1,723 1,021Adjustments to reconcile net income to
net cash provided by operating activities:Depreciation, amortization and decommissioning 1,222 1,196 899Deferred income taxes and tax credits, net 190 (281) (356)Reversal of ISO accrual – (970) –Other deferred charges and noncurrent liabilities 857 921 (857)Loss from retirement of long-term debt 89 153 –Gain on sale of assets (29) – –
Net effect of changes in operating assets and liabilities:Restricted cash (237) (473) (4)Accounts receivable (605) 212 105Inventories (17) 62 (57)Accounts payable 403 198 1,311Accrued taxes 173 (619) 1,715Regulatory balancing accounts, net (329) (23) 311Other working capital (90) 22 574
Payments authorized by the bankruptcy court on amountsclassified as liabilities subject to compromise (87) (1,442) (16)
Other, net 171 135 249
Net Cash Provided by Operating Activities 2,502 814 4,895
Cash Flows From Investing ActivitiesCapital expenditures (1,698) (1,547) (1,347)Net proceeds from sale of asset 49 11 –Other, net (112) 25 5
Net Cash Used by Investing Activities (1,761) (1,511) (1,342)
Cash Flows From Financing ActivitiesNet repayments under credit facilities – – (959)Long-term debt issued 581 847 907Long-term debt matured, redeemed, or repurchased (1,068) (1,241) (111)Rate reduction bonds matured (290) (290) (290)Common stock issued 166 217 15Common stock repurchased – – (1)Dividends paid – – (109)Other, net (4) – (1)
Net Cash Used by Financing Activities (615) (467) (549)
Net Change in Cash and Cash Equivalents 126 (1,164) 3,004Cash and Cash Equivalents at January 1 3,532 4,696 1,692
Cash and Cash Equivalents at December 31 $ 3,658 $ 3,532 $ 4,696
Supplemental Disclosures of Cash Flow InformationCash received for:
Reorganization interest income $ 39 $ 75 $ 87Cash paid for:
Interest (net of amounts capitalized) 866 1,414 579Income taxes paid (refunded), net (91) 971 (692)Reorganization professional fees and expenses 99 99 19
Supplemental Disclosures of Noncash Investing and Financing ActivitiesTransfer of liabilities and other payables subject to compromise
from operating assets and liabilities 181 419 11,400
PG&E Corporation
Consolidated Statements of Cash Flows
6

7
PG&E Corporation
Consolidated Statements of Common Shareholders’ Equity
Accu-mulated
Reinvested Other TotalCommon Earnings Compre- Common Compre-
Common Stock Unearned (Accu- hensive Share- hensiveStock Common Held by Compen- mulated Income holders’ Income
(in millions, except share amounts) Shares Stock Subsidiary sation Deficit) (Loss) Equity (Loss)
Balance at December 31, 2000 387,193,727 $5,971 $ (690) – $ (2,105) $ (4) $ 3,172
Net Income – – – 1,099 – 1,099 $ 1,099
Cumulative effect of adoption
of SFAS No. 133 and interpretations – – – – (243) (243) (243)
Mark-to-market adjustments for
hedging transactions in
accordance with SFAS No. 133 – – – – 237 237 237
Net reclassification to earnings – – – – 42 42 42
Foreign currency translation adjustment – – – – (1) (1) (1)
Other – – – – (1) (1) (1)
Comprehensive income – $ 1,133
Common stock issued 739,158 16 – – – – 16
Common stock repurchased (34,037) (1) – – – – (1)
Other – – – 2 – 2
Balance at December 31, 2001 387,898,848 5,986 (690) – (1,004) 30 4,322
Net loss – – – (874) – (874) $ (874)
Mark-to-market adjustments for
hedging transactions in
accordance with SFAS No. 133 – – – – (139) (139) (139)
Net reclassification to earnings – – – – 13 13 13
Foreign currency translation adjustment – – – – 2 2 2
Other – – – – 1 1 1
Comprehensive loss $ (997)
Common stock issued 17,582,636 217 – – – – 217
Common stock repurchased (6,580) – – – – – –
Warrants issued – 71 – – – – 71
Common stock warrants exercised 11,111 – – – – – –
Balance at December 31, 2002 405,486,015 $6,274 $ (690) – $ (1,878) $ (93) $ 3,613
Net income – – – – 420 – 420 $ 420
Mark-to-market adjustments for
hedging transactions in accordance
with SFAS No. 133 (net of
income tax benefit of $10 million) – – – – – (8) (8) (8)
Retirement plan remeasurement (net of
income tax benefit of $3 million) – – – – – (4) (4) (4)
Net reclassification to earnings (net of
income tax expense of $27 million) – – – – – 17 17 17
Foreign currency translation
adjustment (net of income
tax expense of $5 million) – – – – – 3 3 3
Comprehensive income – – – – – – – $ 428
Common stock issued 8,796,632 166 – – – – 166
Common stock warrants exercised 702,367 – – – – – –
Common restricted stock issued 1,590,010 28 – (28) – – –
Common restricted stock cancelled (54,742) (1) – 1 – – –
Common restricted stock amortization – – – 7 – – 7
Other – 1 – – – – 1
Balance at December 31, 2003 416,520,282 $6,468 $ (690) $ (20) $ (1,458) $ (85) $ 4,215

(in millions) 2003 2002 2001
UtilityElectric operating revenue $ 7,582 $ 8,178 $ 7,326Natural gas operating revenue 2,856 2,336 3,136Cost of electricity 2,319 1,482 2,774Cost of natural gas 1,467 954 1,832Operating and maintenance 2,935 2,817 2,385Depreciation, amortization and decommissioning 1,218 1,193 896Reorganization professional fees and expenses 160 155 97
Operating income 2,339 3,913 2,478Interest income 53 74 123Interest expense (953) (988) (974)Other expense, net1 (9) (27) (41)
Income before income taxes 1,430 2,972 1,586Income tax provision 528 1,178 596
Income before cumulative effect of a change in accounting principle 902 1,794 990Cumulative effect of a change in accounting principle (1) – –
Income available for common stock $ 901 $ 1,794 $ 990
PG&E Corporation, Eliminations and Other 2,3
Operating revenues $ (3) $ (9) $ (12)Operating expenses (7) (50) (147)
Operating income 4 41 135Interest income 9 6 14Interest expense (194) (236) (104)Other income (expense), net1 – 77 (2)
Income (loss) before income taxes (181) (112) 43Income tax provision (benefit) (70) (41) 12
Income (loss) from continuing operations (111) (71) 31Discontinued operations (365) (2,536) 69Cumulative effect of changes in accounting principles (5) (61) 9
Net income (loss) $ (481) $ (2,668) $ 109
Consolidated Total 3
Operating revenues $10,435 $10,505 $10,450Operating expenses 8,092 6,551 7,837
Operating income 2,343 3,954 2,613Interest income 62 80 137Interest expense (1,147) (1,224) (1,078)Other income (expenses), net1 (9) 50 (43)
Income before income taxes 1,249 2,860 1,629Income tax provision 458 1,137 608
Income from continuing operations 791 1,723 1,021Discontinued operations (365) (2,536) 69Cumulative effect of changes in accounting principles (6) (61) 9
Net income (loss) $ 420 $ (874) $ 1,099
1Includes preferred dividend requirement as other expense.2PG&E Corporation eliminates all intersegment transactions in consolidation.3Operating results of NEGT have been reclassified as discontinued operations. See 2003 Annual Report, Note 5 of the Notes to the Consolidated Financial Statements.
PG&E Corporation
Results of Operations
8

For the year ended December 31,
(in millions, except per share amounts) 2003 2002 2001
Income from continuing operations $ 791 $ 1,723 $1,021Discontinued operations (365) (2,536) 69
Net income (loss) before cumulative effect of changes in accounting principles 426 (813) 1,090
Cumulative effect of changes in accounting principles (6) (61) 9
Net Income (Loss) 420 (874) 1,099Add income impact of assumed conversions:
Interest expense on 9.5% Convertible Subordinated Notes, net of tax 17 8 –
Net Income (Loss) for Diluted Calculations $ 437 $ (866) $1,099
Weighted Average Common Shares Outstanding, Basic 385 371 363Add incremental shares from assumed conversions:
Employee Stock Options, Restricted Stocks and PG&E Corporation shares held by grantor trusts 4 2 1
PG&E Corporation Warrants 5 2 –9.5% Convertible Subordinated Notes 19 9 –
Shares Outstanding for Diluted Calculations 413 384 364
Earnings (Loss) Per Common Share, BasicIncome from continuing operations $ 2.05 $ 4.64 $ 2.81Discontinued operations (0.94) (6.84) 0.19Cumulative effect of changes in accounting principles (0.02) (0.16) 0.02Rounding – – 0.01
Net Earnings (Loss) $ 1.09 $ (2.36) $ 3.03
Earnings (Loss) Per Common Share, DilutedIncome from continuing operations $ 1.96 $ 4.50 $ 2.80Discontinued operations (0.88) (6.60) 0.19Cumulative effect of changes in accounting principles (0.02) (0.16) 0.02Rounding – – 0.01
Net Earnings (Loss) $ 1.06 $ (2.26) $ 3.02
1The following is a reconciliation of PG&E Corporation’s net income (loss) and weighted average common shares outstanding for calculating basic and diluted netincome (loss) per share. Basic earnings (loss) per share is calculated by dividing net income (loss) by the weighted average number of common shares outstandingduring the period. Diluted earnings (loss) per share is computed by dividing net income (loss), adjusted for the net interest and amortization associated withPG&E Corporation’s Convertible Subordinated Notes, by the sum of the weighted average number of common shares outstanding and the assumed issuance ofcommon shares for all dilutive securities.
PG&E Corporation
Earnings (Loss) Per Share1
9
10
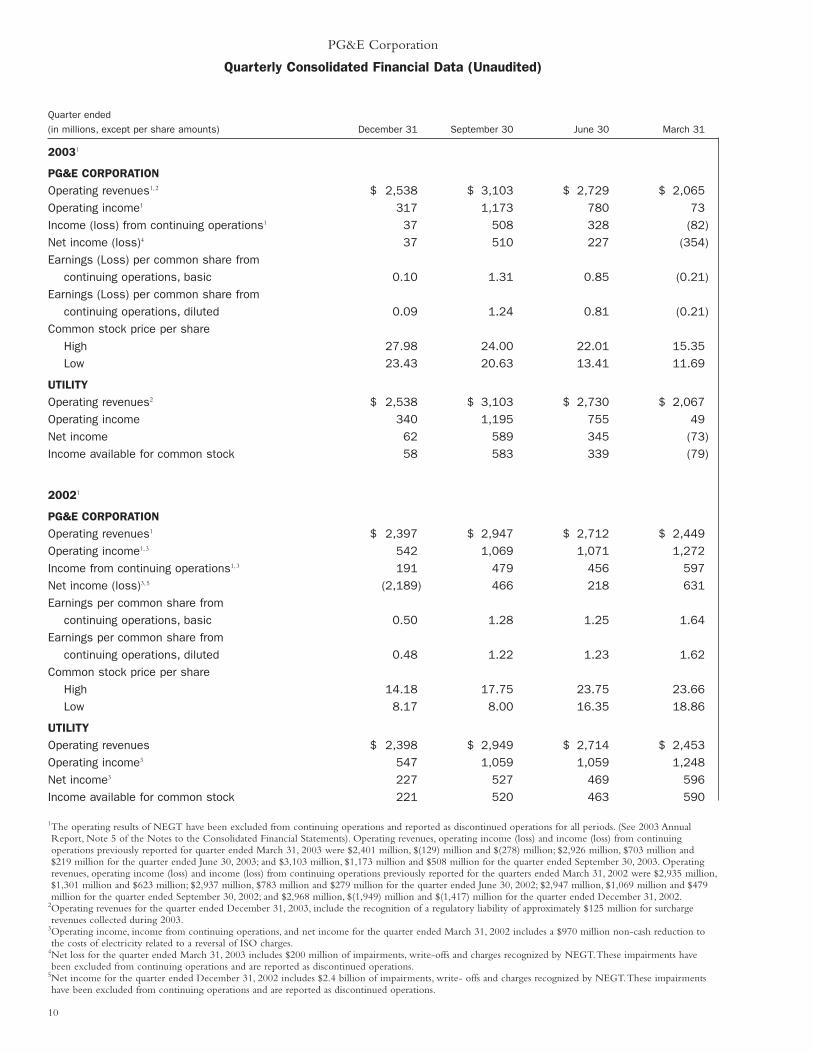
Quarter ended
(in millions, except per share amounts) December 31 September 30 June 30 March 31
20031
PG&E CORPORATION
Operating revenues1,2 $ 2,538 $ 3,103 $ 2,729 $ 2,065Operating income1 317 1,173 780 73Income (loss) from continuing operations1 37 508 328 (82)Net income (loss)4 37 510 227 (354)Earnings (Loss) per common share from
continuing operations, basic 0.10 1.31 0.85 (0.21)Earnings (Loss) per common share from
continuing operations, diluted 0.09 1.24 0.81 (0.21)Common stock price per share
High 27.98 24.00 22.01 15.35Low 23.43 20.63 13.41 11.69
UTILITY
Operating revenues2 $ 2,538 $ 3,103 $ 2,730 $ 2,067Operating income 340 1,195 755 49Net income 62 589 345 (73)Income available for common stock 58 583 339 (79)
20021
PG&E CORPORATION
Operating revenues1 $ 2,397 $ 2,947 $ 2,712 $ 2,449Operating income1,3 542 1,069 1,071 1,272Income from continuing operations1,3 191 479 456 597Net income (loss)3,5 (2,189) 466 218 631Earnings per common share from
continuing operations, basic 0.50 1.28 1.25 1.64Earnings per common share from
continuing operations, diluted 0.48 1.22 1.23 1.62Common stock price per share
High 14.18 17.75 23.75 23.66Low 8.17 8.00 16.35 18.86
UTILITYOperating revenues $ 2,398 $ 2,949 $ 2,714 $ 2,453Operating income3 547 1,059 1,059 1,248Net income3 227 527 469 596Income available for common stock 221 520 463 590
1The operating results of NEGT have been excluded from continuing operations and reported as discontinued operations for all periods. (See 2003 AnnualReport, Note 5 of the Notes to the Consolidated Financial Statements). Operating revenues, operating income (loss) and income (loss) from continuing operations previously reported for quarter ended March 31, 2003 were $2,401 million, $(129) million and $(278) million; $2,926 million, $703 million and $219 million for the quarter ended June 30, 2003; and $3,103 million, $1,173 million and $508 million for the quarter ended September 30, 2003. Operatingrevenues, operating income (loss) and income (loss) from continuing operations previously reported for the quarters ended March 31, 2002 were $2,935 million,$1,301 million and $623 million; $2,937 million, $783 million and $279 million for the quarter ended June 30, 2002; $2,947 million, $1,069 million and $479million for the quarter ended September 30, 2002; and $2,968 million, $(1,949) million and $(1,417) million for the quarter ended December 31, 2002.
2Operating revenues for the quarter ended December 31, 2003, include the recognition of a regulatory liability of approximately $125 million for surcharge revenues collected during 2003.
3Operating income, income from continuing operations, and net income for the quarter ended March 31, 2002 includes a $970 million non-cash reduction tothe costs of electricity related to a reversal of ISO charges.
4Net loss for the quarter ended March 31, 2003 includes $200 million of impairments, write-offs and charges recognized by NEGT.These impairments havebeen excluded from continuing operations and are reported as discontinued operations.
5Net income for the quarter ended December 31, 2002 includes $2.4 billion of impairments, write- offs and charges recognized by NEGT.These impairmentshave been excluded from continuing operations and are reported as discontinued operations.
PG&E Corporation
Quarterly Consolidated Financial Data (Unaudited)

11
Year ended December 31,
(in millions) 2003 2002 2001
Operating RevenuesElectric $ 7,582 $ 8,178 $ 7,326Natural gas 2,856 2,336 3,136
Total Operating Revenues 10,438 10,514 10,462
Operating ExpensesCost of electricity 2,319 1,482 2,774Cost of natural gas 1,467 954 1,832Operating and maintenance 2,935 2,817 2,385Depreciation, amortization and decommissioning 1,218 1,193 896Reorganization professional fees and expenses 160 155 97
Total Operating Expenses 8,099 6,601 7,984
Operating Income 2,339 3,913 2,478Reorganization interest income 46 71 91Interest income 7 3 32Interest expense (non-contractual interest expense of $131 million
in 2003, $149 million in 2002, and $164 million in 2001) (953) (988) (974)Other income (expense), net 13 (2) (16)
Income Before Income Taxes 1,452 2,997 1,611Income tax provision 528 1,178 596
Net Income Before Cumulative Effect of a Change in Accounting Principle 924 1,819 1,015Cumulative effect of a change in accounting principle (net of income
tax benefit of $1 million for the year ended December 31, 2003) (1) – –
Net Income 923 1,819 1,015Preferred dividend requirement 22 25 25
Income Available for Common Stock $ 901 $ 1,794 $ 990
Pacific Gas and Electric Company, a Debtor-in-Possession
Consolidated Statements of Operations

12
Balance at December 31,
(in millions) 2003 2002
ASSETS
Current AssetsCash and cash equivalents $ 2,979 $ 3,343Restricted cash 403 150Accounts receivable:
Customers (net of allowance for doubtful accounts of $68 million in 2003 and $59 million in 2002) 2,424 1,921
Related parties 17 17Regulatory balancing accounts 248 98
Inventories:Gas stored underground 166 154Materials and supplies 126 121
Prepaid expenses and other 100 165
Total Current Assets 6,463 5,969
Property, Plant and EquipmentElectric 20,468 18,922Gas 8,355 8,123Construction work in progress 379 427
Total Property, Plant and Equipment 29,202 27,472Accumulated depreciation (11,100) (10,494)
Net Property, Plant and Equipment 18,102 16,978
Other Noncurrent AssetsRegulatory assets 2,001 2,011Nuclear decommissioning funds 1,478 1,335Other 1,022 1,300
Total Other Noncurrent Assets 4,501 4,646
TOTAL ASSETS $ 29,066 $ 27,593
Pacific Gas and Electric Company, a Debtor-in-Possession
Consolidated Balance Sheets
2003 Weighted Average Rate Base($ millions)
Electric Generation $ 1,620 11.2%Gas Transmission 1,485 10.3Electric Transmission 1,609 11.1Gas and Electric Distribution 9,756 67.4
Total $ 14,470 100.0%
13
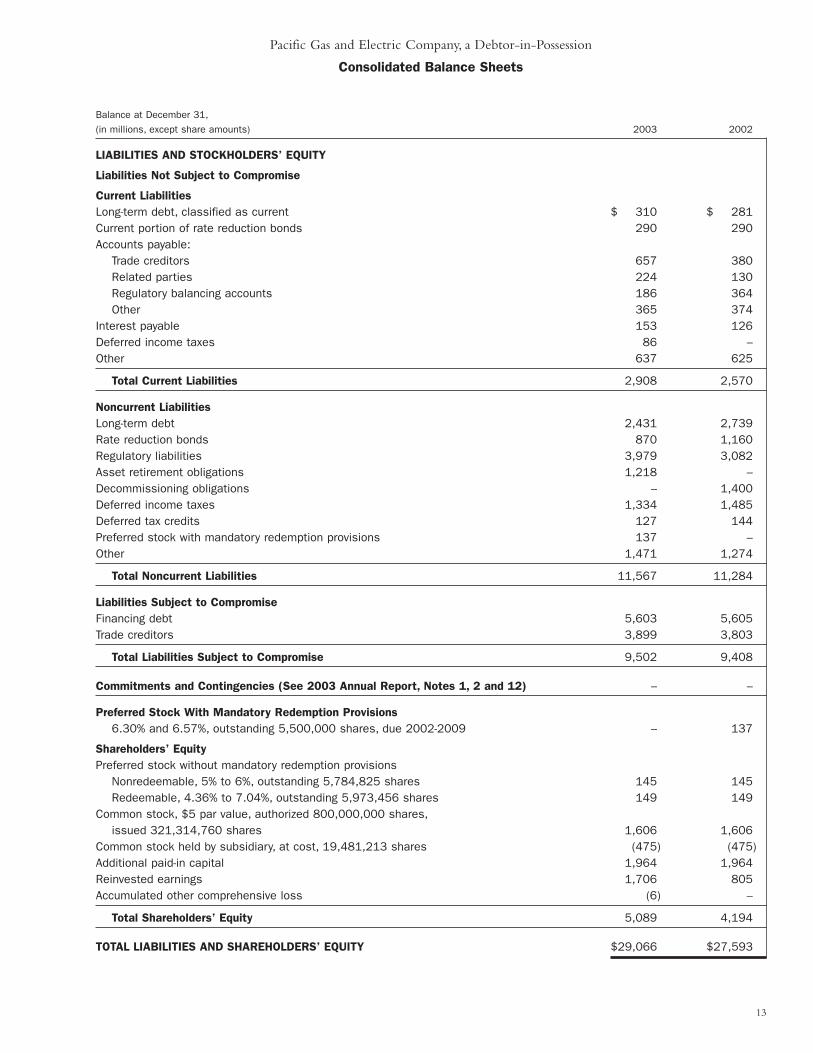
Balance at December 31,
(in millions, except share amounts) 2003 2002
LIABILITIES AND STOCKHOLDERS’ EQUITY
Liabilities Not Subject to Compromise
Current LiabilitiesLong-term debt, classified as current $ 310 $ 281Current portion of rate reduction bonds 290 290Accounts payable:
Trade creditors 657 380Related parties 224 130Regulatory balancing accounts 186 364Other 365 374
Interest payable 153 126Deferred income taxes 86 –Other 637 625
Total Current Liabilities 2,908 2,570
Noncurrent Liabilities Long-term debt 2,431 2,739Rate reduction bonds 870 1,160Regulatory liabilities 3,979 3,082Asset retirement obligations 1,218 –Decommissioning obligations – 1,400Deferred income taxes 1,334 1,485Deferred tax credits 127 144Preferred stock with mandatory redemption provisions 137 –Other 1,471 1,274
Total Noncurrent Liabilities 11,567 11,284
Liabilities Subject to CompromiseFinancing debt 5,603 5,605Trade creditors 3,899 3,803
Total Liabilities Subject to Compromise 9,502 9,408
Commitments and Contingencies (See 2003 Annual Report, Notes 1, 2 and 12) – –
Preferred Stock With Mandatory Redemption Provisions6.30% and 6.57%, outstanding 5,500,000 shares, due 2002-2009 – 137
Shareholders’ EquityPreferred stock without mandatory redemption provisions
Nonredeemable, 5% to 6%, outstanding 5,784,825 shares 145 145Redeemable, 4.36% to 7.04%, outstanding 5,973,456 shares 149 149
Common stock, $5 par value, authorized 800,000,000 shares,issued 321,314,760 shares 1,606 1,606
Common stock held by subsidiary, at cost, 19,481,213 shares (475) (475)Additional paid-in capital 1,964 1,964Reinvested earnings 1,706 805Accumulated other comprehensive loss (6) –
Total Shareholders’ Equity 5,089 4,194
TOTAL LIABILITIES AND SHAREHOLDERS’ EQUITY $29,066 $27,593
Pacific Gas and Electric Company, a Debtor-in-Possession
Consolidated Balance Sheets
14
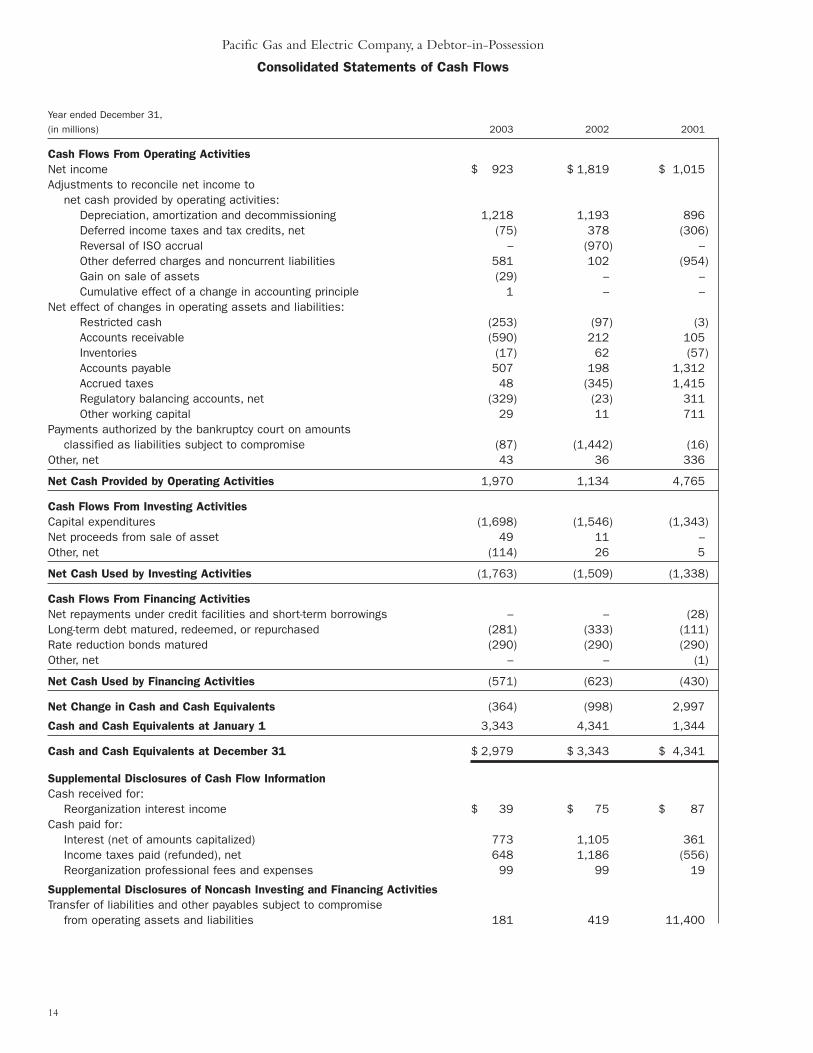
Year ended December 31,
(in millions) 2003 2002 2001
Cash Flows From Operating ActivitiesNet income $ 923 $ 1,819 $ 1,015Adjustments to reconcile net income to
net cash provided by operating activities:Depreciation, amortization and decommissioning 1,218 1,193 896Deferred income taxes and tax credits, net (75) 378 (306)Reversal of ISO accrual – (970) –Other deferred charges and noncurrent liabilities 581 102 (954)Gain on sale of assets (29) – –Cumulative effect of a change in accounting principle 1 – –
Net effect of changes in operating assets and liabilities:Restricted cash (253) (97) (3)Accounts receivable (590) 212 105Inventories (17) 62 (57)Accounts payable 507 198 1,312Accrued taxes 48 (345) 1,415Regulatory balancing accounts, net (329) (23) 311Other working capital 29 11 711
Payments authorized by the bankruptcy court on amountsclassified as liabilities subject to compromise (87) (1,442) (16)
Other, net 43 36 336
Net Cash Provided by Operating Activities 1,970 1,134 4,765
Cash Flows From Investing ActivitiesCapital expenditures (1,698) (1,546) (1,343)Net proceeds from sale of asset 49 11 –Other, net (114) 26 5
Net Cash Used by Investing Activities (1,763) (1,509) (1,338)
Cash Flows From Financing ActivitiesNet repayments under credit facilities and short-term borrowings – – (28)Long-term debt matured, redeemed, or repurchased (281) (333) (111)Rate reduction bonds matured (290) (290) (290)Other, net – – (1)
Net Cash Used by Financing Activities (571) (623) (430)
Net Change in Cash and Cash Equivalents (364) (998) 2,997
Cash and Cash Equivalents at January 1 3,343 4,341 1,344
Cash and Cash Equivalents at December 31 $ 2,979 $ 3,343 $ 4,341
Supplemental Disclosures of Cash Flow InformationCash received for:
Reorganization interest income $ 39 $ 75 $ 87Cash paid for:
Interest (net of amounts capitalized) 773 1,105 361Income taxes paid (refunded), net 648 1,186 (556)Reorganization professional fees and expenses 99 99 19
Supplemental Disclosures of Noncash Investing and Financing ActivitiesTransfer of liabilities and other payables subject to compromise
from operating assets and liabilities 181 419 11,400
Pacific Gas and Electric Company, a Debtor-in-Possession
Consolidated Statements of Cash Flows
15
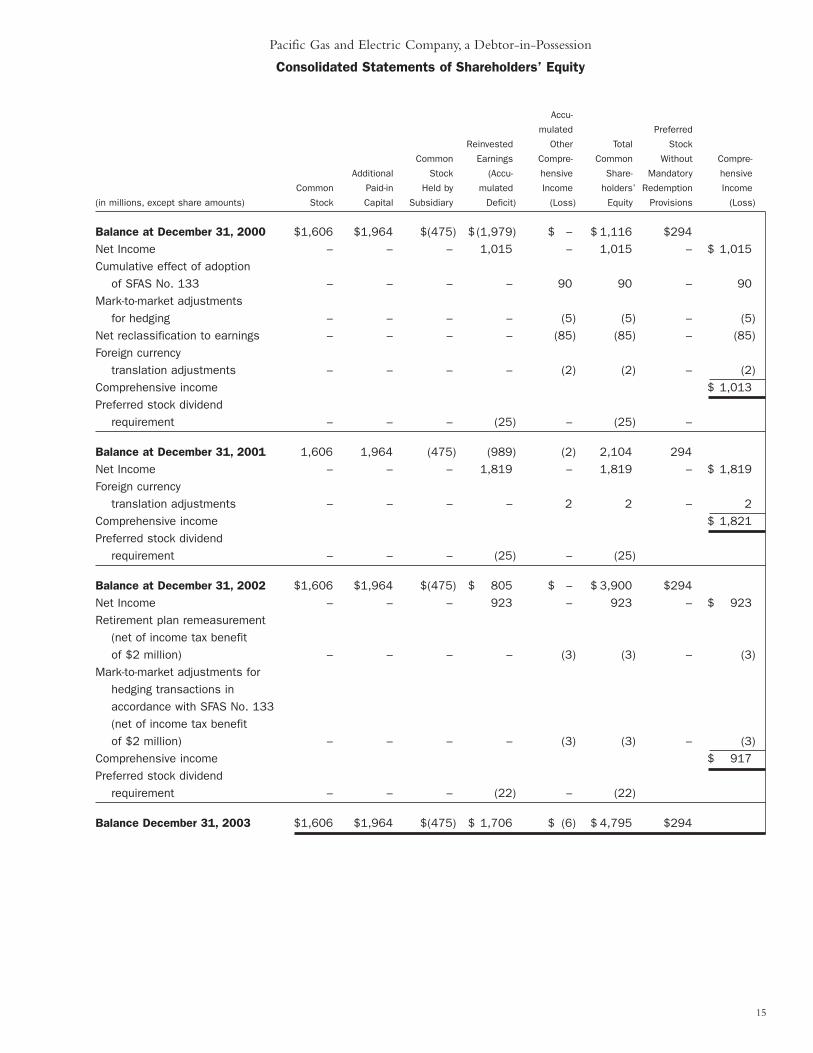
Accu-
mulated Preferred
Reinvested Other Total Stock
Common Earnings Compre- Common Without Compre-
Additional Stock (Accu- hensive Share- Mandatory hensive
Common Paid-in Held by mulated Income holders’ Redemption Income
(in millions, except share amounts) Stock Capital Subsidiary Deficit) (Loss) Equity Provisions (Loss)
Balance at December 31, 2000 $1,606 $1,964 $(475) $ (1,979) $ – $ 1,116 $294Net Income – – – 1,015 – 1,015 – $ 1,015Cumulative effect of adoption
of SFAS No. 133 – – – – 90 90 – 90Mark-to-market adjustments
for hedging – – – – (5) (5) – (5)Net reclassification to earnings – – – – (85) (85) – (85)Foreign currency
translation adjustments – – – – (2) (2) – (2)Comprehensive income $ 1,013Preferred stock dividend
requirement – – – (25) – (25) –
Balance at December 31, 2001 1,606 1,964 (475) (989) (2) 2,104 294Net Income – – – 1,819 – 1,819 – $ 1,819Foreign currency
translation adjustments – – – – 2 2 – 2Comprehensive income $ 1,821Preferred stock dividend
requirement – – – (25) – (25)
Balance at December 31, 2002 $1,606 $1,964 $(475) $ 805 $ – $ 3,900 $294Net Income – – – 923 – 923 – $ 923Retirement plan remeasurement
(net of income tax benefitof $2 million) – – – – (3) (3) – (3)
Mark-to-market adjustments forhedging transactions inaccordance with SFAS No. 133 (net of income tax benefitof $2 million) – – – – (3) (3) – (3)
Comprehensive income $ 917Preferred stock dividend
requirement – – – (22) – (22)
Balance December 31, 2003 $1,606 $1,964 $(475) $ 1,706 $ (6) $ 4,795 $294
Pacific Gas and Electric Company, a Debtor-in-Possession
Consolidated Statements of Shareholders’ Equity
16
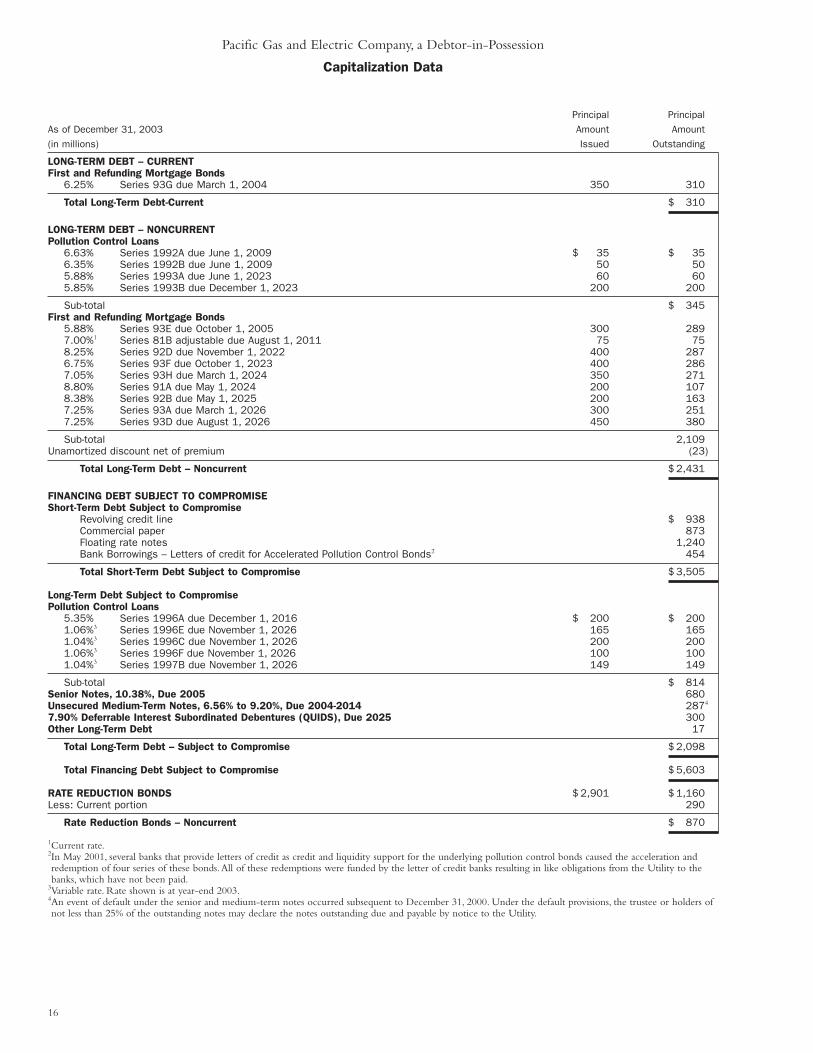
Principal Principal
As of December 31, 2003 Amount Amount
(in millions) Issued Outstanding
LONG-TERM DEBT – CURRENTFirst and Refunding Mortgage Bonds
6.25% Series 93G due March 1, 2004 350 310
Total Long-Term Debt-Current $ 310
LONG-TERM DEBT – NONCURRENTPollution Control Loans
6.63% Series 1992A due June 1, 2009 $ 35 $ 356.35% Series 1992B due June 1, 2009 50 505.88% Series 1993A due June 1, 2023 60 605.85% Series 1993B due December 1, 2023 200 200
Sub-total $ 345First and Refunding Mortgage Bonds
5.88% Series 93E due October 1, 2005 300 2897.00%1 Series 81B adjustable due August 1, 2011 75 758.25% Series 92D due November 1, 2022 400 2876.75% Series 93F due October 1, 2023 400 2867.05% Series 93H due March 1, 2024 350 2718.80% Series 91A due May 1, 2024 200 1078.38% Series 92B due May 1, 2025 200 1637.25% Series 93A due March 1, 2026 300 2517.25% Series 93D due August 1, 2026 450 380
Sub-total 2,109Unamortized discount net of premium (23)
Total Long-Term Debt – Noncurrent $ 2,431
FINANCING DEBT SUBJECT TO COMPROMISEShort-Term Debt Subject to Compromise
Revolving credit line $ 938Commercial paper 873Floating rate notes 1,240Bank Borrowings – Letters of credit for Accelerated Pollution Control Bonds2 454
Total Short-Term Debt Subject to Compromise $ 3,505
Long-Term Debt Subject to CompromisePollution Control Loans
5.35% Series 1996A due December 1, 2016 $ 200 $ 2001.06%3 Series 1996E due November 1, 2026 165 1651.04%3 Series 1996C due November 1, 2026 200 2001.06%3 Series 1996F due November 1, 2026 100 1001.04%3 Series 1997B due November 1, 2026 149 149
Sub-total $ 814Senior Notes, 10.38%, Due 2005 680Unsecured Medium-Term Notes, 6.56% to 9.20%, Due 2004-2014 2874
7.90% Deferrable Interest Subordinated Debentures (QUIDS), Due 2025 300Other Long-Term Debt 17
Total Long-Term Debt – Subject to Compromise $ 2,098
Total Financing Debt Subject to Compromise $ 5,603
RATE REDUCTION BONDS $ 2,901 $ 1,160Less: Current portion 290
Rate Reduction Bonds – Noncurrent $ 870
1Current rate.2In May 2001, several banks that provide letters of credit as credit and liquidity support for the underlying pollution control bonds caused the acceleration andredemption of four series of these bonds.All of these redemptions were funded by the letter of credit banks resulting in like obligations from the Utility to thebanks, which have not been paid.
3Variable rate. Rate shown is at year-end 2003.4An event of default under the senior and medium-term notes occurred subsequent to December 31, 2000. Under the default provisions, the trustee or holders ofnot less than 25% of the outstanding notes may declare the notes outstanding due and payable by notice to the Utility.
Pacific Gas and Electric Company, a Debtor-in-Possession
Capitalization Data

17
As of December 31, 2003
PREFERRED STOCKCurrent Optional
Redemption Price Shares AmountNewspaper Not Redeemable Per Share Excluding Shares Authorized Outstanding Outstanding
Coupon Rate Symbol1 Prior to Accrued Dividends (in thousands) (in thousands) (in millions)
Preferred Stock Without Mandatory Redemption ProvisionsRedeemable – Par value $25 per share
4.36% Series I PacGE pfI $25.75 418 418 $ 114.50% Series H PacGE pfH $26.00 611 611 154.80% Series G PacGE pfG $27.25 793 793 205.00% Series E PacGE pfE $26.75 934 934 235.00% Series D PacGE pfD $26.75 1,778 1,778 447.04% Series U PacGE pfU $25.88 3,000 1,439 36
Total Redeemable 7,534 5,973 149
Nonredeemable – Par value $25 per share5.00% Series C PacGE pfC 400 400 105.50% Series B PacGE pfB 1,173 1,173 306.00% Series A PacGE pfA 4,212 4,212 105
Total Nonredeemable 5,785 5,785 145
Total Without Mandatory Redemption Provisions 13,319 11,758 294
Preferred Stock With Mandatory Redemption ProvisionsPar value $25 per share
6.30% PacGE pfZ 1/31/04 $25.00 2,500 2,500 626.57% PacGE pfY 7/31/02 $25.00 3,000 3,000 75
Total With Mandatory Redemption Provisions 5,500 5,500 137
Undesignated in ClassNo par value 80,000 – –Par value $100 per share 5,000 – –
Total Undesignated in Class 85,000 – –Discount and other (9)
Total Preferred Stock 103,819 17,258 $ 422
1Newspaper symbols may vary.
Pacific Gas and Electric Company, a Debtor-in-Possession
Capitalization Data
Credit Ratings(As of December 31, 2003)
Standard and Poor’s Moody’s Investors Service
PG&E Corporation9.50% Convertible Subordinated Notes Not Rated Not Rated6.875% Sr. Secured Notes Not Rated Not Rated
Pacific Gas and Electric CompanyMortgage Bonds CCC Ba1Pollution Control Bonds – Bond Insurance AAA AaaPollution Control Bonds – Letters of Credit1 AA to AA-/A-1+ Not RatedMedium-Term Notes D Ba2San Joaquin Valley Power Authority Bonds Not Rated Rating WithdrawnCalifornia Department of Water Resources (DWR) Loan Not Rated Not RatedSenior 5-year Note D Ba2Revolving Credit Line Not Rated Not RatedFloating Rate Notes Not Rated Ba2Matured Commercial Paper D Not PrimeRedeemed Pollution Control Bonds – Bank Loans Not Rated Not Rated7.90% Deferrable Interest Subordinated Debentures D Ba3Preferred Stock D B1
1Long-term/Short-term
18
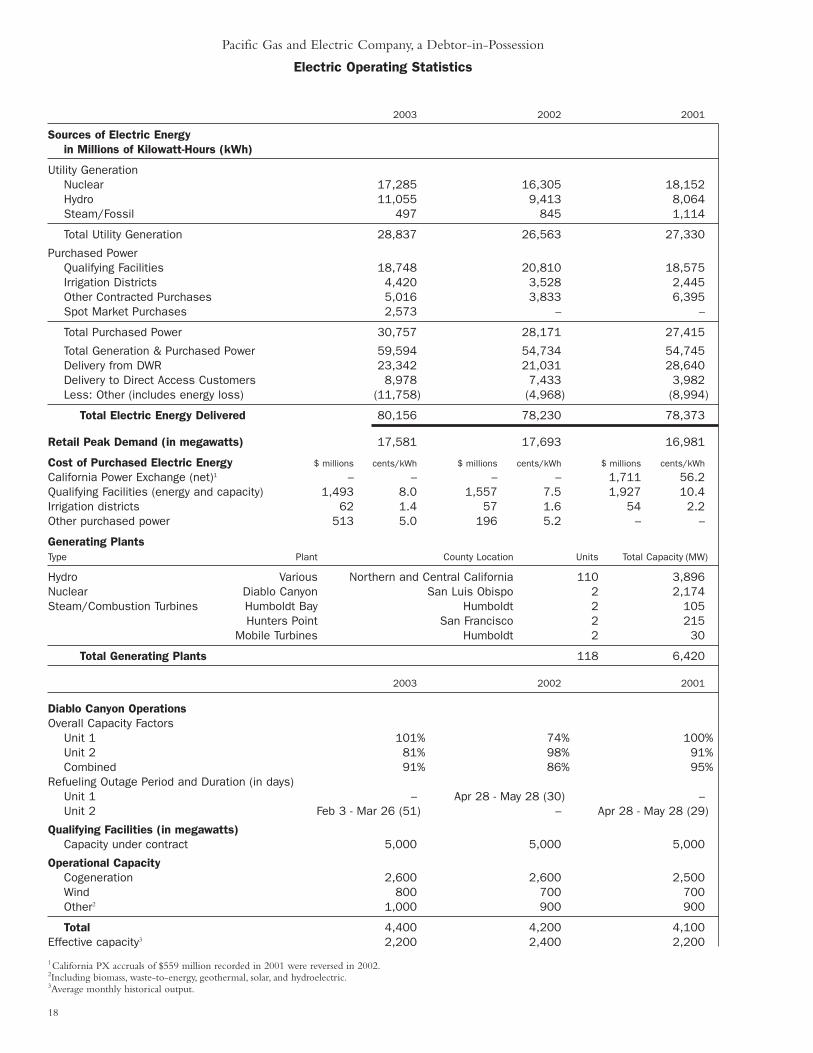
2003 2002 2001
Sources of Electric Energy in Millions of Kilowatt-Hours (kWh)
Utility GenerationNuclear 17,285 16,305 18,152Hydro 11,055 9,413 8,064Steam/Fossil 497 845 1,114
Total Utility Generation 28,837 26,563 27,330
Purchased PowerQualifying Facilities 18,748 20,810 18,575Irrigation Districts 4,420 3,528 2,445Other Contracted Purchases 5,016 3,833 6,395Spot Market Purchases 2,573 – –
Total Purchased Power 30,757 28,171 27,415
Total Generation & Purchased Power 59,594 54,734 54,745Delivery from DWR 23,342 21,031 28,640Delivery to Direct Access Customers 8,978 7,433 3,982Less: Other (includes energy loss) (11,758) (4,968) (8,994)
Total Electric Energy Delivered 80,156 78,230 78,373
Retail Peak Demand (in megawatts) 17,581 17,693 16,981
Cost of Purchased Electric Energy $ millions cents/kWh $ millions cents/kWh $ millions cents/kWh
California Power Exchange (net)1 – – – – 1,711 56.2Qualifying Facilities (energy and capacity) 1,493 8.0 1,557 7.5 1,927 10.4Irrigation districts 62 1.4 57 1.6 54 2.2Other purchased power 513 5.0 196 5.2 – –
Generating PlantsType Plant County Location Units Total Capacity (MW)
Hydro Various Northern and Central California 110 3,896Nuclear Diablo Canyon San Luis Obispo 2 2,174Steam/Combustion Turbines Humboldt Bay Humboldt 2 105
Hunters Point San Francisco 2 215Mobile Turbines Humboldt 2 30
Total Generating Plants 118 6,420
2003 2002 2001
Diablo Canyon OperationsOverall Capacity Factors
Unit 1 101% 74% 100%Unit 2 81% 98% 91%Combined 91% 86% 95%
Refueling Outage Period and Duration (in days)Unit 1 – Apr 28 - May 28 (30) –Unit 2 Feb 3 - Mar 26 (51) – Apr 28 - May 28 (29)
Qualifying Facilities (in megawatts)Capacity under contract 5,000 5,000 5,000
Operational CapacityCogeneration 2,600 2,600 2,500Wind 800 700 700Other2 1,000 900 900
Total 4,400 4,200 4,100Effective capacity3 2,200 2,400 2,200
1California PX accruals of $559 million recorded in 2001 were reversed in 2002.2Including biomass, waste-to-energy, geothermal, solar, and hydroelectric.3Average monthly historical output.
Pacific Gas and Electric Company, a Debtor-in-Possession
Electric Operating Statistics
19
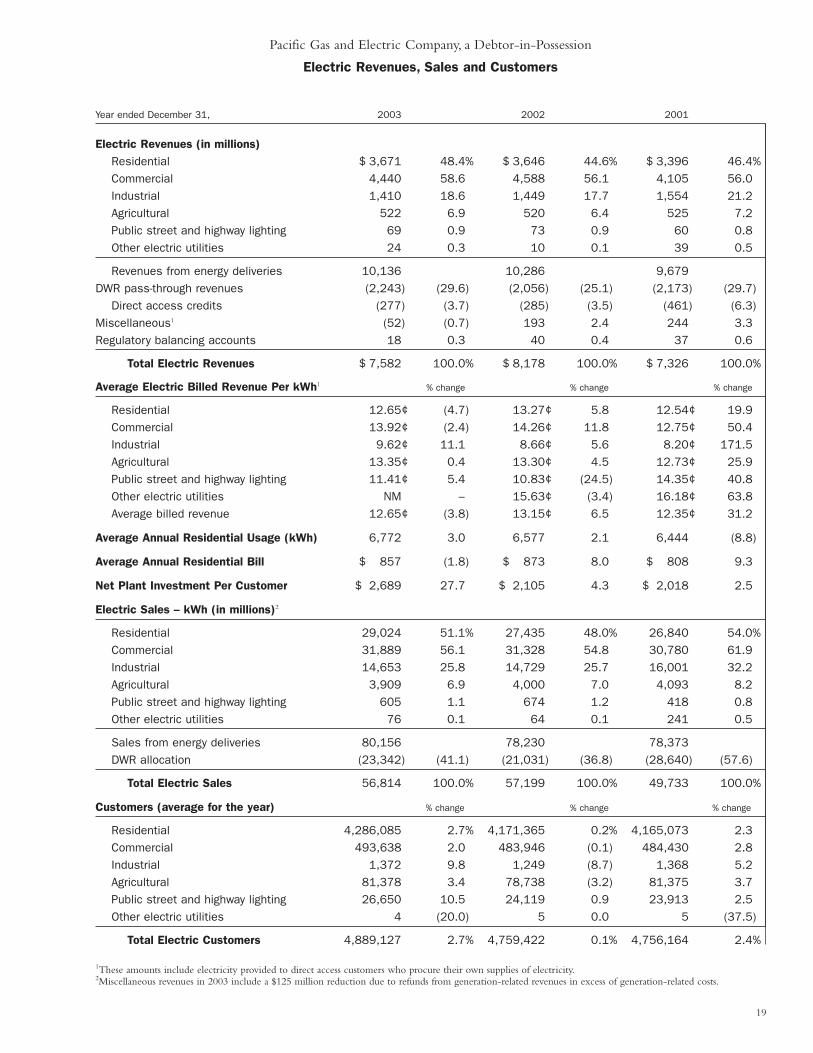
Pacific Gas and Electric Company, a Debtor-in-Possession
Electric Revenues, Sales and Customers
Year ended December 31, 2003 2002 2001
Electric Revenues (in millions)Residential $ 3,671 48.4% $ 3,646 44.6% $ 3,396 46.4%Commercial 4,440 58.6 4,588 56.1 4,105 56.0Industrial 1,410 18.6 1,449 17.7 1,554 21.2Agricultural 522 6.9 520 6.4 525 7.2Public street and highway lighting 69 0.9 73 0.9 60 0.8Other electric utilities 24 0.3 10 0.1 39 0.5
Revenues from energy deliveries 10,136 10,286 9,679DWR pass-through revenues (2,243) (29.6) (2,056) (25.1) (2,173) (29.7)
Direct access credits (277) (3.7) (285) (3.5) (461) (6.3)Miscellaneous1 (52) (0.7) 193 2.4 244 3.3Regulatory balancing accounts 18 0.3 40 0.4 37 0.6
Total Electric Revenues $ 7,582 100.0% $ 8,178 100.0% $ 7,326 100.0%
Average Electric Billed Revenue Per kWh1 % change % change % change
Residential 12.65¢ (4.7) 13.27¢ 5.8 12.54¢ 19.9Commercial 13.92¢ (2.4) 14.26¢ 11.8 12.75¢ 50.4Industrial 9.62¢ 11.1 8.66¢ 5.6 8.20¢ 171.5Agricultural 13.35¢ 0.4 13.30¢ 4.5 12.73¢ 25.9Public street and highway lighting 11.41¢ 5.4 10.83¢ (24.5) 14.35¢ 40.8Other electric utilities NM – 15.63¢ (3.4) 16.18¢ 63.8Average billed revenue 12.65¢ (3.8) 13.15¢ 6.5 12.35¢ 31.2
Average Annual Residential Usage (kWh) 6,772 3.0 6,577 2.1 6,444 (8.8)
Average Annual Residential Bill $ 857 (1.8) $ 873 8.0 $ 808 9.3
Net Plant Investment Per Customer $ 2,689 27.7 $ 2,105 4.3 $ 2,018 2.5
Electric Sales – kWh (in millions)2
Residential 29,024 51.1% 27,435 48.0% 26,840 54.0%Commercial 31,889 56.1 31,328 54.8 30,780 61.9Industrial 14,653 25.8 14,729 25.7 16,001 32.2Agricultural 3,909 6.9 4,000 7.0 4,093 8.2Public street and highway lighting 605 1.1 674 1.2 418 0.8Other electric utilities 76 0.1 64 0.1 241 0.5
Sales from energy deliveries 80,156 78,230 78,373DWR allocation (23,342) (41.1) (21,031) (36.8) (28,640) (57.6)
Total Electric Sales 56,814 100.0% 57,199 100.0% 49,733 100.0%
Customers (average for the year) % change % change % change
Residential 4,286,085 2.7% 4,171,365 0.2% 4,165,073 2.3Commercial 493,638 2.0 483,946 (0.1) 484,430 2.8Industrial 1,372 9.8 1,249 (8.7) 1,368 5.2Agricultural 81,378 3.4 78,738 (3.2) 81,375 3.7Public street and highway lighting 26,650 10.5 24,119 0.9 23,913 2.5Other electric utilities 4 (20.0) 5 0.0 5 (37.5)
Total Electric Customers 4,889,127 2.7% 4,759,422 0.1% 4,756,164 2.4%
1These amounts include electricity provided to direct access customers who procure their own supplies of electricity.2Miscellaneous revenues in 2003 include a $125 million reduction due to refunds from generation-related revenues in excess of generation-related costs.

20
Year ended December 31, 2003 2002 2001
Gas Revenues (in millions)Bundled Gas Sales and Transportation Service
Residential 1,836 64.3 $ 1,379 59.0% $ 2,308 73.6%Commercial 697 24.4 499 21.4 783 25.0Industrial 1 – 3 0.1 16 0.5Other gas utilities 1 – 1 – – –
Total Bundled Gas Sales and Transportation Service $ 2,535 88.7 $ 1,882 80.5 $ 3,107 99.1Transportation Service Only 284 9.9 316 13.6 375 12.0Miscellaneous (31) (1.1) 127 5.4 (93) (3.0)Regulatory Balancing Accounts 68 2.5 11 0.5 (253) (8.1)
Total Gas Revenues $ 2,856 100.0% $ 2,336 100.0% $ 3,136 100.0%
Average Billed Bundled Gas Sales Revenues per Thousand Cubic Feet (Mcf) % change % change % change
Residential $ 9.25 35.6 $ 6.82 (41.7) $ 11.70 46.6Commercial 8.73 37.9 $ 6.33 (41.4) $ 10.80 39.9Industrial 2.48 (43.0) $ 4.35 (77.3) $ 19.15 124.5
Average Billed Transportation ServiceOnly Revenues Per Mcf: 0.54 (12.9) $ 0.62 6.9 $ 0.58 3.6
Average Annual Residential Bill 490 32.8 $ 369 (40.8) $ 623 35.1Average Annual Residential Usage – Mcf 53 (1.9) 54 1.9 53 (10.2)Heating Temperature – % of Normal1 92.4 (12.2) 104.6 (0.5) 105.1 3.9Net Plant Investment Per Customer $ 1,261 25.3 $ 1,006 3.7 $ 970 (3.3)
Gas Sales (in millions of Mcf)Bundled Gas Sales and Transportation Service
Residential 199 71.3% 202 71.6% 197 72.7%Commercial 80 28.7 79 28.0 73 26.9Industrial – – 1 0.4 1 0.4
Total Bundled Gas Sales and Transportation Service 279 100.0% 282 100.0% 271 100.0%Total Transportation Service Only 525 508 646
Gas Customers (average for the year) % change % change % change
Residential 3,744,011 0.1 3,738,524 0.9 3,705,141 1.7Commercial 208,857 0.9 206,953 0.6 205,681 1.1Industrial 1,988 9.3 1,819 3.1 1,764 2.6Other gas utilities 6 20.0 5 (16.7) 6 0.0
Total Gas Customers 3,954,862 0.2 3,947,301 0.9 3,912,592 1.7
Sources of Gas Purchased (in millions Mcf)Natural Gas Purchased
From Canada 196 211 210From California (7) 19 20From other states
(substantially all U.S. Southwest) 103 68 77
Total Natural Gas Purchased 292 298 307
Average Cost of Gas Purchased per McfFrom Canada $ 4.73 $ 2.42 $ 4.43From California $ 3.39 $ 2.88 $ 11.55From other states
(substantially all U.S. Southwest) $ 4.63 $ 3.04 $ 10.41Average – All Purchases $ 4.73 $ 2.59 $ 6.40
Miles of Gas SystemTransmission 6,350 6,300 6,254Distribution 39,510 38,944 38,410
Total Miles of Gas System 45,860 45,244 44,664
Peak Day Sendout – Mcf (in millions) 3.5 4.1 3.8
1Over 100% indicates colder than normal.
Pacific Gas and Electric Company, a Debtor-in-Possession
Gas Revenues, Sales, Customers and Operating Statistics

21
Whom To Contact
PG&E Corporation
One Market, Spear TowerSuite 2400San Francisco, CA 94105-1126Website: www.pgecorp.com
General Information 415-267-7000
Vice President, Investor Relations
Security analysts, portfolio managers, or other representatives of the investment community should write or call the InvestorRelations Office:
Gabriel B.TogneriPG&E CorporationOne Market, Spear TowerSuite 2400San Francisco, CA 94105-1126415-267-7080Fax 415-267-7265
Stock Exchange Listings
PG&E Corporation’s common stock is traded on the New York,Pacific, and Swiss stock exchanges.The official New York StockExchange symbol is “PCG” but PG&E Corporation commonstock is listed in daily newspapers under “PG&E” or “PG&E Cp.”Local newspaper symbols may vary.
Pacific Gas and Electric Company has 11 issues of preferred stock,all of which are listed on the American and Pacific stock exchanges.
Corporate Secretary
Individual shareholders with general questions about PG&ECorporation or Pacific Gas and Electric Company should write orcall the Corporate Secretary’s office:
Linda Y. H. ChengPG&E CorporationOne Market, Spear TowerSuite 2400San Francisco, CA 94105-1126415-267-7070 Fax 415-267-7268
Shareholder Services
Individual shareholders with questions about PG&E Corporationcommon stock or Pacific Gas and Electric Company preferredstock should contact Mellon Investor Services:
Mellon Investor Services P.O. Box 3310 (Securities Transfer)P.O. Box 3315 (General Correspondence)P.O. Box 3316 (Change of Address)P.O. Box 3317 (Lost Certificate Replacement)P.O. Box 3338 (Dividend Reinvestment)South Hackensack, NJ 07606
Toll-free Telephone Services: 1-800-719-9056Website: www.melloninvestor.com
Individual bondholders with questions about Pacific Gas and ElectricCompany First and Refunding Mortgage Bonds should contactThe Bank of New York:
The Bank of New York Attn: Fiscal Agencies (101B-7E)P.O. Box 11265 Church Street StationNew York, NY 10286
Toll-free Telephone Services: 1-800-438-5473
Shareholder Information