Embed Size (px)
Citation preview
Transport
Statistical Yearbook 2002 Transport 1
Transport
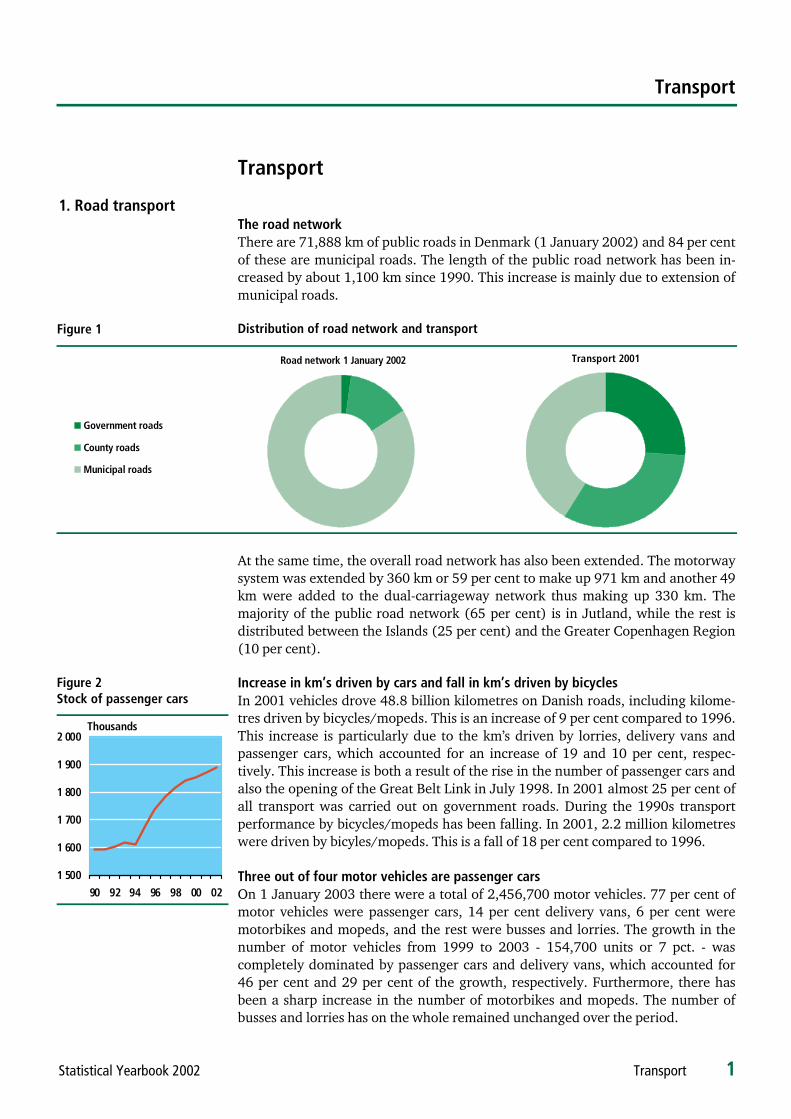
1. Road transport The road network There are 71,888 km of public roads in Denmark (1 January 2002) and 84 per cent of these are municipal roads. The length of the public road network has been in-creased by about 1,100 km since 1990. This increase is mainly due to extension of municipal roads. Distribution of road network and transport
Government roads
County roads
Municipal roads
Road network 1 January 2002
Transport 2001
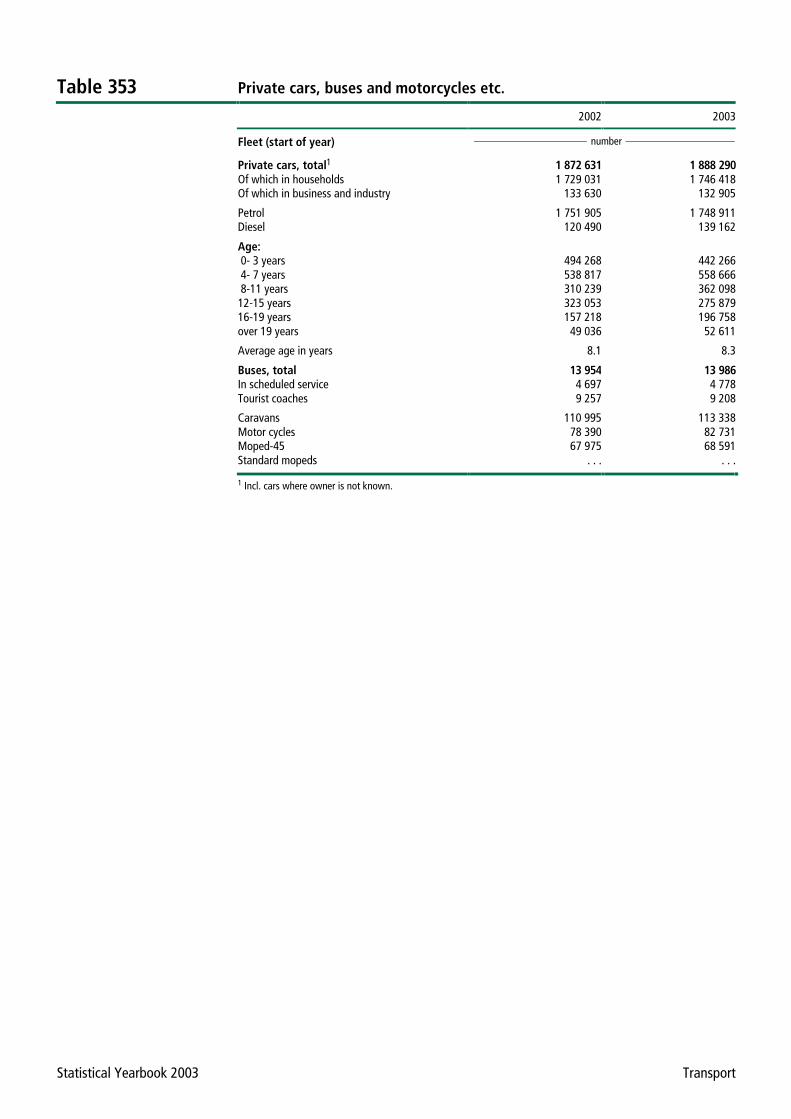
At the same time, the overall road network has also been extended. The motorway system was extended by 360 km or 59 per cent to make up 971 km and another 49 km were added to the dual-carriageway network thus making up 330 km. The majority of the public road network (65 per cent) is in Jutland, while the rest is distributed between the Islands (25 per cent) and the Greater Copenhagen Region (10 per cent). Increase in km’s driven by cars and fall in km’s driven by bicycles In 2001 vehicles drove 48.8 billion kilometres on Danish roads, including kilome-tres driven by bicycles/mopeds. This is an increase of 9 per cent compared to 1996. This increase is particularly due to the km’s driven by lorries, delivery vans and passenger cars, which accounted for an increase of 19 and 10 per cent, respec-tively. This increase is both a result of the rise in the number of passenger cars and also the opening of the Great Belt Link in July 1998. In 2001 almost 25 per cent of all transport was carried out on government roads. During the 1990s transport performance by bicycles/mopeds has been falling. In 2001, 2.2 million kilometres were driven by bicyles/mopeds. This is a fall of 18 per cent compared to 1996. Three out of four motor vehicles are passenger cars On 1 January 2003 there were a total of 2,456,700 motor vehicles. 77 per cent of motor vehicles were passenger cars, 14 per cent delivery vans, 6 per cent were motorbikes and mopeds, and the rest were busses and lorries. The growth in the number of motor vehicles from 1999 to 2003 - 154,700 units or 7 pct. - was completely dominated by passenger cars and delivery vans, which accounted for 46 per cent and 29 per cent of the growth, respectively. Furthermore, there has been a sharp increase in the number of motorbikes and mopeds. The number of busses and lorries has on the whole remained unchanged over the period.
Figure 1
Figure 2 Stock of passenger cars
1 500
1 600
1 700
1 800
1 900
2 000
90 92 94 96 98 00 02
Thousands
Transport
2 Transport Statistical Yearbook 2003
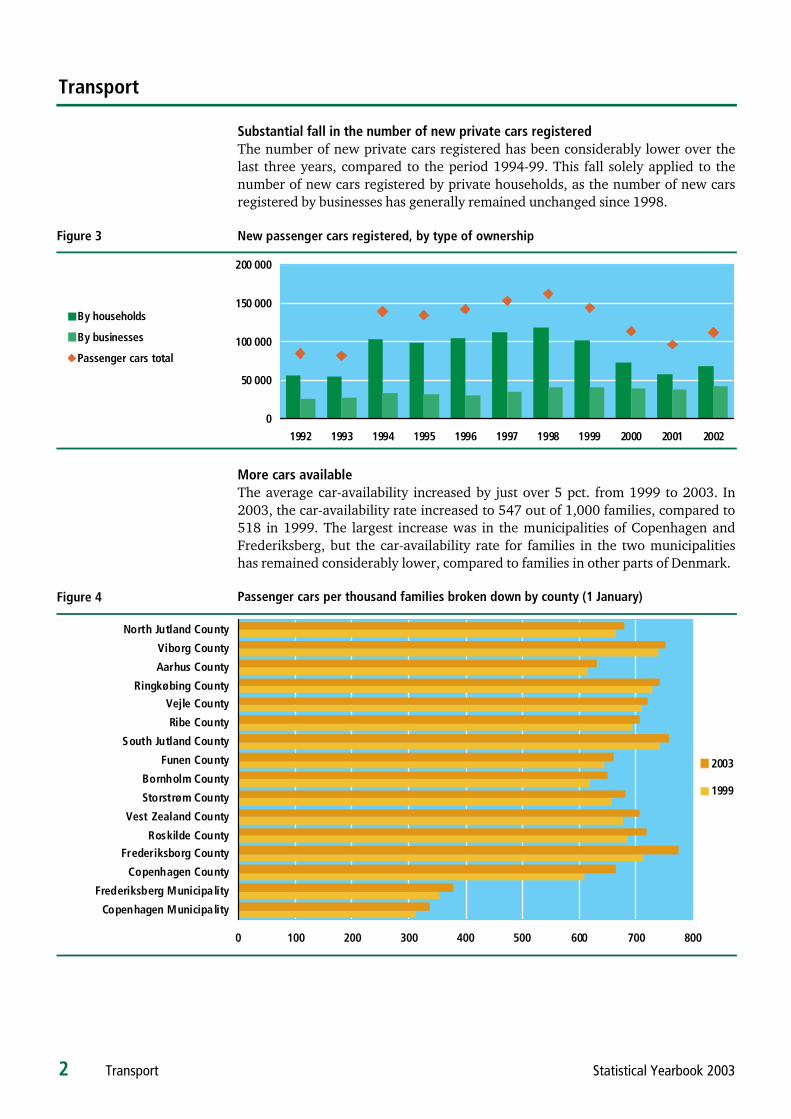
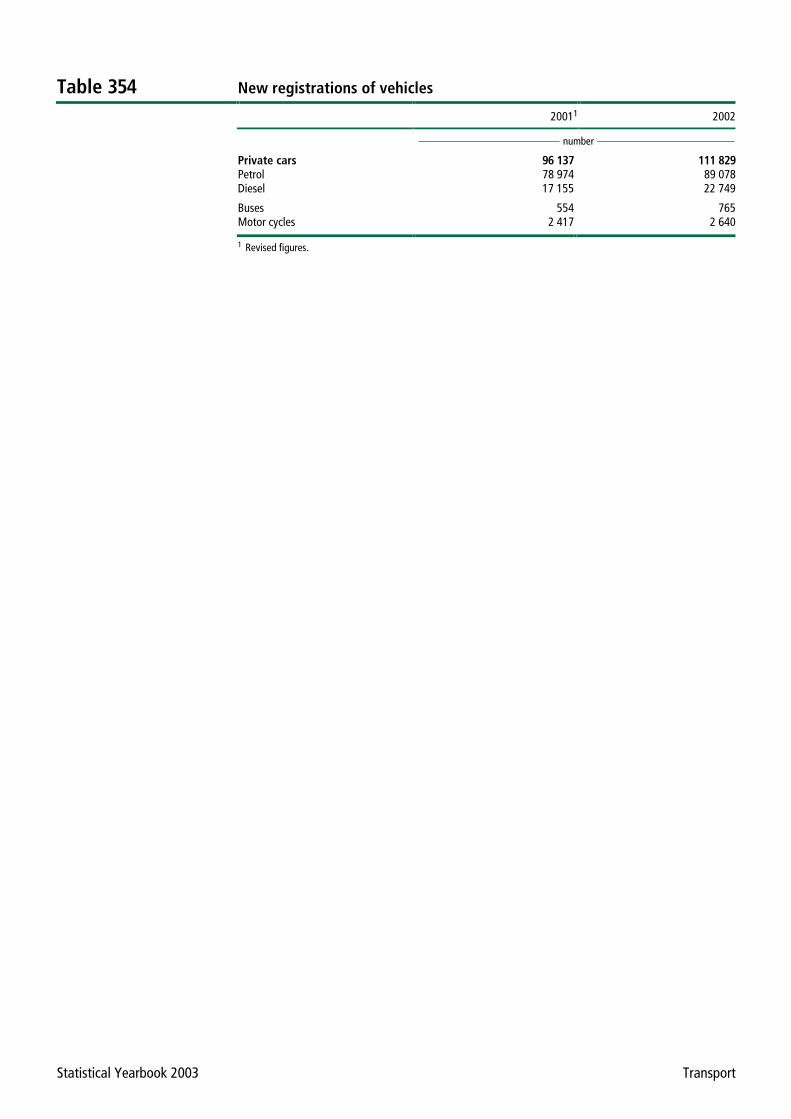
Substantial fall in the number of new private cars registered The number of new private cars registered has been considerably lower over the last three years, compared to the period 1994-99. This fall solely applied to the number of new cars registered by private households, as the number of new cars registered by businesses has generally remained unchanged since 1998. New passenger cars registered, by type of ownership
0
50 000
100 000
150 000
200 000
1992 1993 1994 1995 1996 1997 1998 1999 2000 2001 2002
By households
By businesses
Passenger cars total
More cars available The average car-availability increased by just over 5 pct. from 1999 to 2003. In 2003, the car-availability rate increased to 547 out of 1,000 families, compared to 518 in 1999. The largest increase was in the municipalities of Copenhagen and Frederiksberg, but the car-availability rate for families in the two municipalities has remained considerably lower, compared to families in other parts of Denmark. Passenger cars per thousand families broken down by county (1 January)
0 100 200 300 400 500 600 700 800
Copenhagen Municipa lity
Frederiksberg Municipa lity
Copenhagen County
Frederiksborg County
Roskilde County
Vest Zealand County
Storstrøm County
Bornholm County
Funen County
South Jutland County
Ribe County
Vejle County
Ringkøbing County
Aarhus County
Viborg County
North Jutland County
2003
1999
Figure 3
Figure 4
Transport
Statistical Yearbook 2002 Transport 3
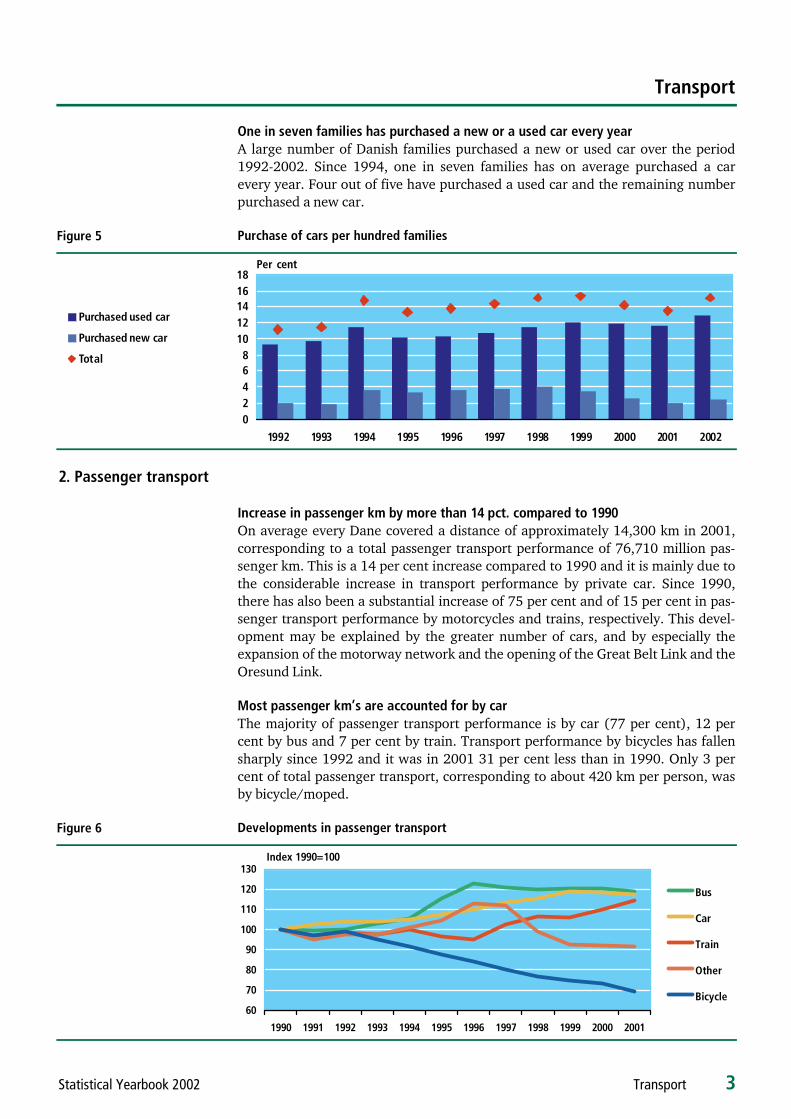
One in seven families has purchased a new or a used car every year A large number of Danish families purchased a new or used car over the period 1992-2002. Since 1994, one in seven families has on average purchased a car every year. Four out of five have purchased a used car and the remaining number purchased a new car. Purchase of cars per hundred families
02468
1012141618
1992 1993 1994 1995 1996 1997 1998 1999 2000 2001 2002
Purchased used car
Purchased new car
Total
Per cent
2. Passenger transport Increase in passenger km by more than 14 pct. compared to 1990 On average every Dane covered a distance of approximately 14,300 km in 2001, corresponding to a total passenger transport performance of 76,710 million pas-senger km. This is a 14 per cent increase compared to 1990 and it is mainly due to the considerable increase in transport performance by private car. Since 1990, there has also been a substantial increase of 75 per cent and of 15 per cent in pas-senger transport performance by motorcycles and trains, respectively. This devel-opment may be explained by the greater number of cars, and by especially the expansion of the motorway network and the opening of the Great Belt Link and the Oresund Link. Most passenger km’s are accounted for by car The majority of passenger transport performance is by car (77 per cent), 12 per cent by bus and 7 per cent by train. Transport performance by bicycles has fallen sharply since 1992 and it was in 2001 31 per cent less than in 1990. Only 3 per cent of total passenger transport, corresponding to about 420 km per person, was by bicycle/moped. Developments in passenger transport
60
70
80
90
100
110
120
130
1990 1991 1992 1993 1994 1995 1996 1997 1998 1999 2000 2001
Bus
Car
Train
Other
Bicycle
Index 1990=100
Figure 5
Figure 6

Transport
4 Transport Statistical Yearbook 2003
The purpose of passenger transport In 2001, 33 per cent of passenger transport performance is transport to and from the home and the workplace. 39 per cent was to and from home and recreational activities. However, the two different types of transport take place at very different times during the week. While transport to and from the home and the workplace makes up 44 per cent of all transport from Monday to Friday, this type of transport only makes up 8 per cent of transport at the weekend. In contrast, transport between the home and recreational activities only makes up 27 per cent of transport on weekdays, but as much as 70 per cent of all transport at the weekend. As opposed to this, transport to and from the home and shops makes up 16 per cent of all transport on weekdays and 14 per cent at the weekend. Private passenger transport of 10-84 year olds, by purpose. 2001
Home / work
Home / shopping
Home / recreation
Other
3. Traffic accidents
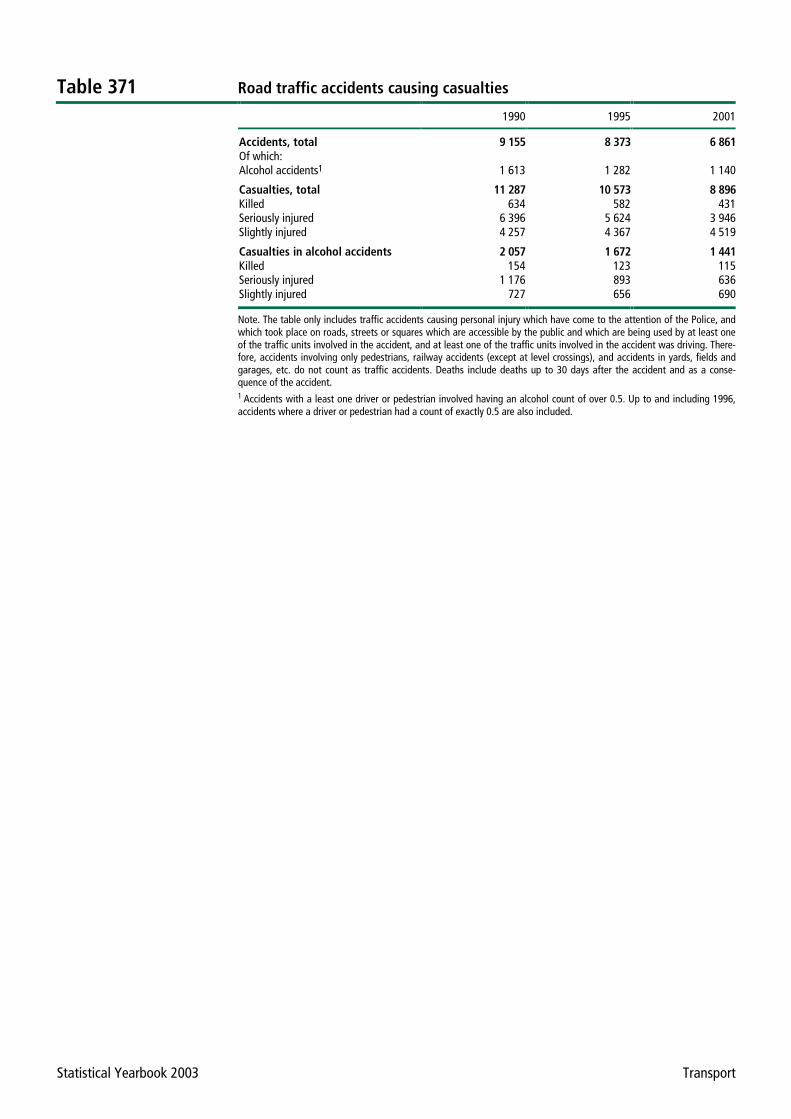
Fall in number of personal injuries in traffic registered by the police from 1990 to 2001 In 2000 the number of traffic accidents leading to personal injury and which have been recorded by the police was 25 per cent lower than it was in 1990. The num-ber of traffic accidents fell from 9,155 in 1990 to 6,861 in 2001. The number of people killed in traffic accidents fell 32 per cent from 634 in 1990 to 431 in 2001. In the same period the number of serious and minor injuries fell from 10,653 in-jured persons to 8,465, corresponding to a 21 per cent drop. Alcohol accidents accounted for 17 per cent of all traffic accidents and for 27 per cent of all people killed in traffic accidents. Alcohol accidents involve at least one driver or pedestrian having an alcohol count of over 0.5. Significant underreported figures in the statistics on road traffic accidents It is generally known that the official statistics on road traffic accidents based on data reported by the policy, only cover a limited proportion of the total number of personal injuries in traffic. Since 1996, the annual surveys conducted by Statistics Denmark have therefore included nationwide information on persons treated by casualty wards as the result of a traffic accident in order to analyse the socalled underreported figures. The surveys have shown that the total number of personal injuries in traffic is almost 5 times higher than the number registered by the police. However, the statistical coverage with respect to the number of persons killed in traffic is almost 100 per cent. The greatest underreported figures for casualties appear among one-man accidents, cyclists and childen and young people under 15 years. For these groups, only about 10 per cent of the personal injuries are re-
Figur 7
Transport
Statistical Yearbook 2003 Transport 5
corded by the police. The survey results are published annually in the publication Færdselsuheld (Road traffic accidents). Personal injuries registered by the police
0
2 000
4 000
6 000
8 000
10 000
12 000
1990 1991 1992 1993 1994 1995 1996 1997 1998 1999 2000 2001
Serious injury
Minor injury
Personal injury, total
Note: There is a break in the relative distribution of minor and serious injuries from 1997 due to a new definition of type of injury.
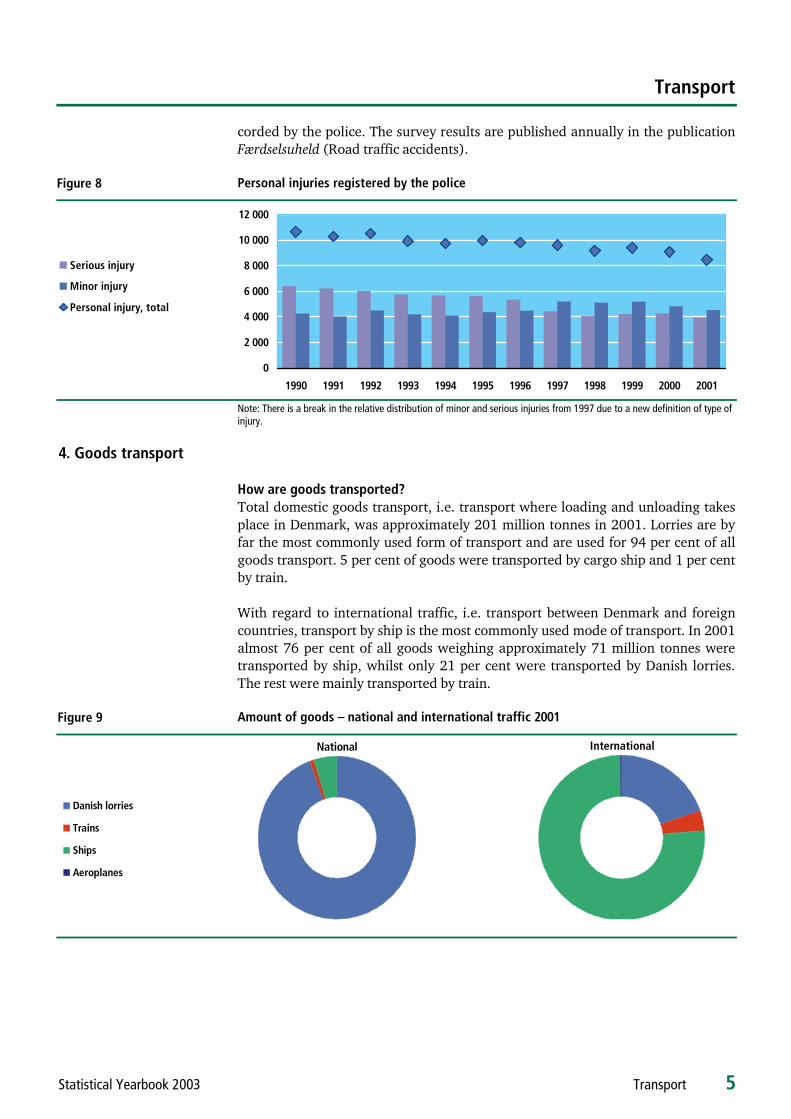
4. Goods transport How are goods transported? Total domestic goods transport, i.e. transport where loading and unloading takes place in Denmark, was approximately 201 million tonnes in 2001. Lorries are by far the most commonly used form of transport and are used for 94 per cent of all goods transport. 5 per cent of goods were transported by cargo ship and 1 per cent by train. With regard to international traffic, i.e. transport between Denmark and foreign countries, transport by ship is the most commonly used mode of transport. In 2001 almost 76 per cent of all goods weighing approximately 71 million tonnes were transported by ship, whilst only 21 per cent were transported by Danish lorries. The rest were mainly transported by train. Amount of goods – national and international traffic 2001
Danish lorries
Trains
Ships
Aeroplanes
National
International
Figure 8
Figure 9

Transport
6 Transport Statistical Yearbook 2003
National goods transport by lorries The total amount of goods transported within Denmark has been going up since 1994. The stagnation in the early 1990s was caused by the general economic re-cession in Denmark at this time. However, due to increased activity in construction in the second half of the 1990s, the total amount of goods transported has gone up again. In particular this increasing activity can be seen in the transport carried out by haulage contractors, while businesses’ own transport of goods (i.e. transport paid by the hour on the businesses' own account) has fallen slightly throughout the 1990s. This should be seen as an indication of a growing tendency to outsource service activities, including transport services. Goods transported by Danish companies and transport of goods within Denmark, ana-lysed by group of goods
0
2
4
6
8
10
12
90 91 92 93 94 95 96 97 98 99 00 01
General cargo
Chemical products
Foodstuffs
Agriculturals products
Aggregates, etc.
Billion tonne-km
Domestic transport of goods by lorry includes in particular gravel, sand, cement, stone, etc. (37 per cent), foodstuffs (13 per cent), animal feed (13 per cent) and general cargo (10 per cent). In 2001, hazardous goods accounted for 4 per cent of the total amount of goods transported. The hazardous goods comprised especially inflammable, fluid substances, e.g. petrol. The total transport has also increased since the mid-1990s. In 2001 total transport was calculated at 10.9 billion tonne-km and of these 80 per cent was transport carried out by haulage contractors. Especially transport of general cargo and gravel, etc. has increased heavily and accounts for 25 per cent and 23 per cent, respectively. There is no clear connection in the changes in the amount of goods transported and the number of kilometres driven. This is because, for example, the distances that aggregates for construction are transported are typically relatively short, whilst increased specialisation of production of goods has led to longer distribu-tion distances for, for example, general cargo. Goods are mainly transported within the same region A majority of all goods is transported within the same county, and is predomi-nantly transported across the county border to a neighbouring county. Only a small amount of goods was transported between the different regions. Thus, 94 per cent of all goods loaded in Jutland were also unloaded in Jutland in 2000. For Zealand, etc. the proportion of goods was also 95 per cent, while for Funen the proportion reached 71 per cent. 2.5 per cent of goods crossed the Great Belt or
Figure 10
Figure 11 International transport by Danish lorries 1990-2001
0
2 000
4 000
6 000
8 000
10 000
12 000
14 000
90 92 94 96 98 00
Exports
Imports
Million tonne-km
Transport
Statistical Yearbook 2003 Transport 7
Kattegat in 2001, and of these 54 per cent was transported from western Denmark to eastern Denmark. International goods transport by Danish lorries International road transport of goods by Danish lorries rose steadily until 1995, however in 1996 this development turned. 1999 saw again a heavy increase in transport of goods; this increase continued to a smaller extent in 2000, but fell again in 2001. Total international goods transport by Danish lorries was calculated at 11.3 billion tonne-km in 2001, of which transport by haulage contractors makes up almost 100 per cent. 49 per cent of all goods transport was carried out from Denmark to foreign countries and 43 per cent from foreign countries to Denmark. 7 per cent was carried out between foreign places of loading and unloading. Goods transport to and from Denmark and foreign countries consisted of general cargo, processed goods, semi-finished products, etc., and loading and unloading primarily took place in Germany.
5. Carriage by sea
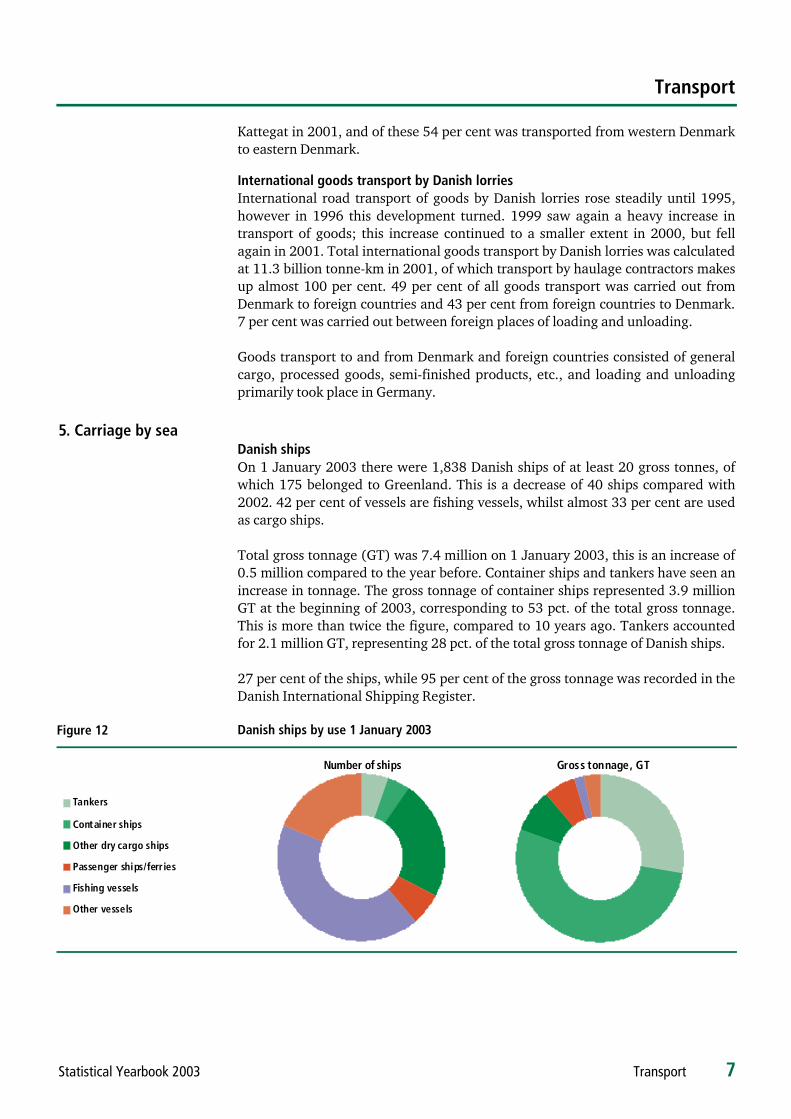
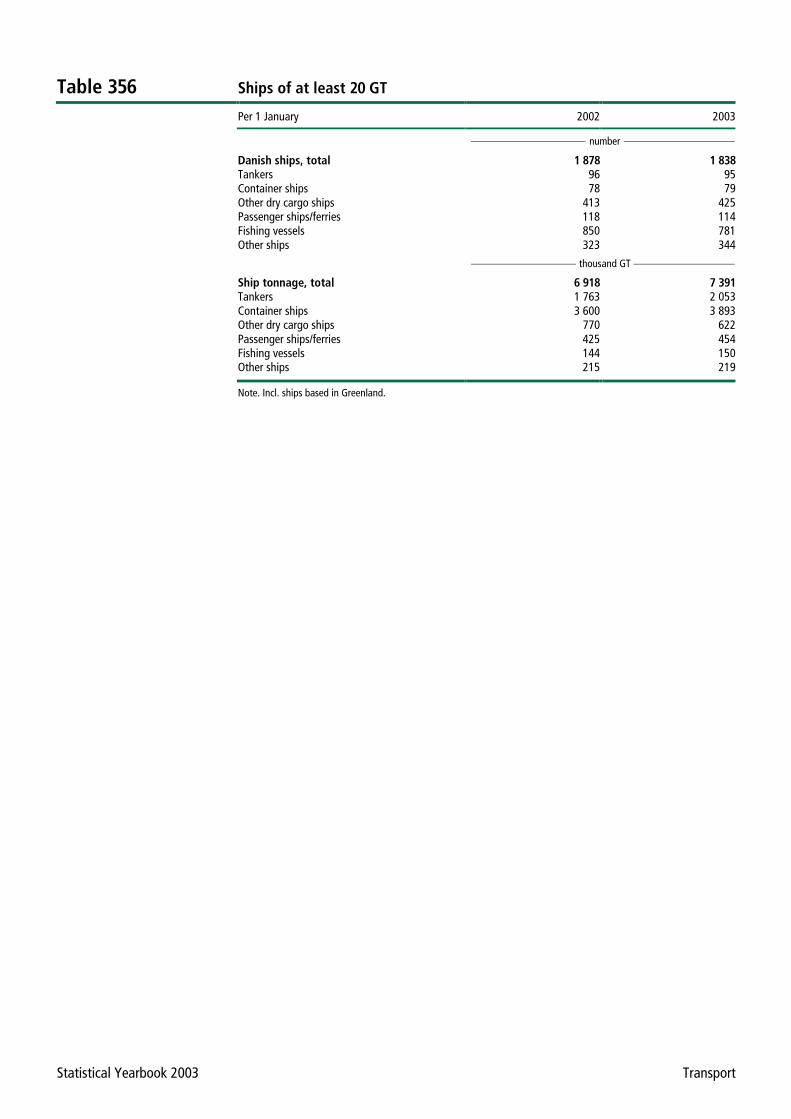
Danish ships On 1 January 2003 there were 1,838 Danish ships of at least 20 gross tonnes, of which 175 belonged to Greenland. This is a decrease of 40 ships compared with 2002. 42 per cent of vessels are fishing vessels, whilst almost 33 per cent are used as cargo ships. Total gross tonnage (GT) was 7.4 million on 1 January 2003, this is an increase of 0.5 million compared to the year before. Container ships and tankers have seen an increase in tonnage. The gross tonnage of container ships represented 3.9 million GT at the beginning of 2003, corresponding to 53 pct. of the total gross tonnage. This is more than twice the figure, compared to 10 years ago. Tankers accounted for 2.1 million GT, representing 28 pct. of the total gross tonnage of Danish ships. 27 per cent of the ships, while 95 per cent of the gross tonnage was recorded in the Danish International Shipping Register. Danish ships by use 1 January 2003
Tankers
Container ships
Other dry cargo ships
Passenger ships/ferries
Fishing vessels
Other vessels
Number of ships Gross tonnage, GT
Figure 12
Statistical Yearbook 2003 Transport
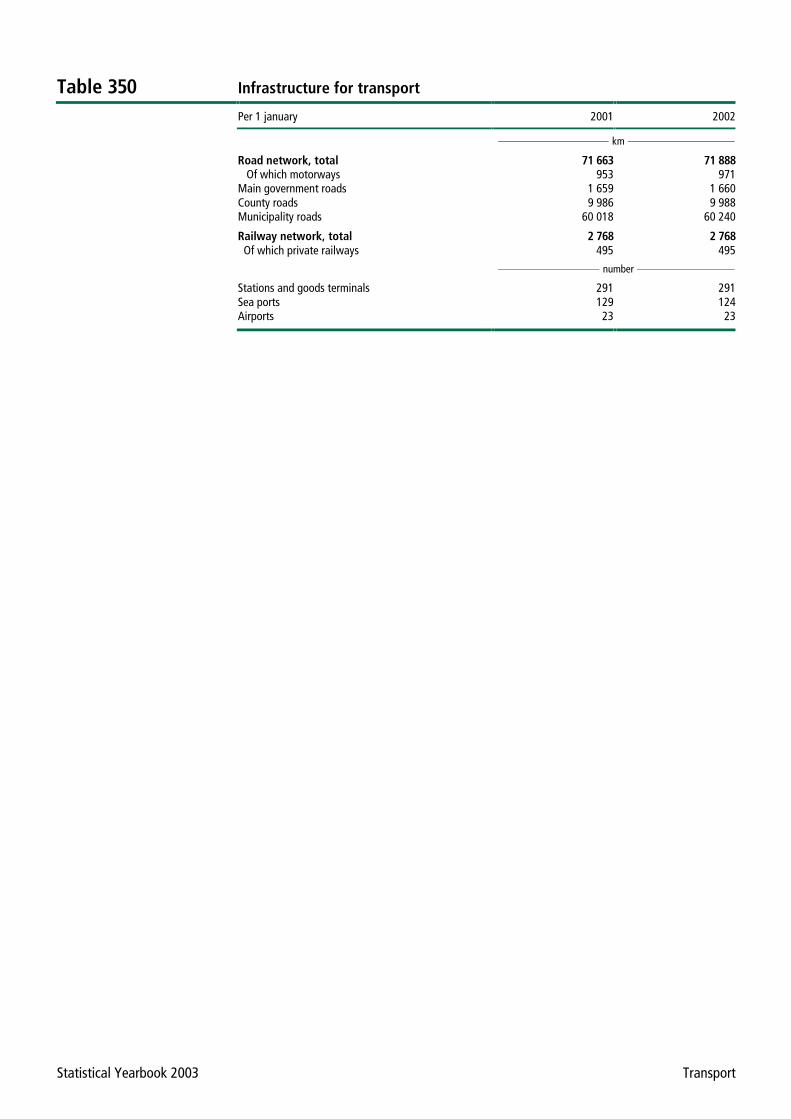
Table 350 Infrastructure for transport
Per 1 january 2001 2002
km
Road network, total 71 663 71 888 Of which motorways 953 971 Main government roads 1 659 1 660 County roads 9 986 9 988 Municipality roads 60 018 60 240
Railway network, total 2 768 2 768 Of which private railways 495 495
number
Stations and goods terminals 291 291 Sea ports 129 124 Airports 23 23
Statistical Yearbook 2003 Transport
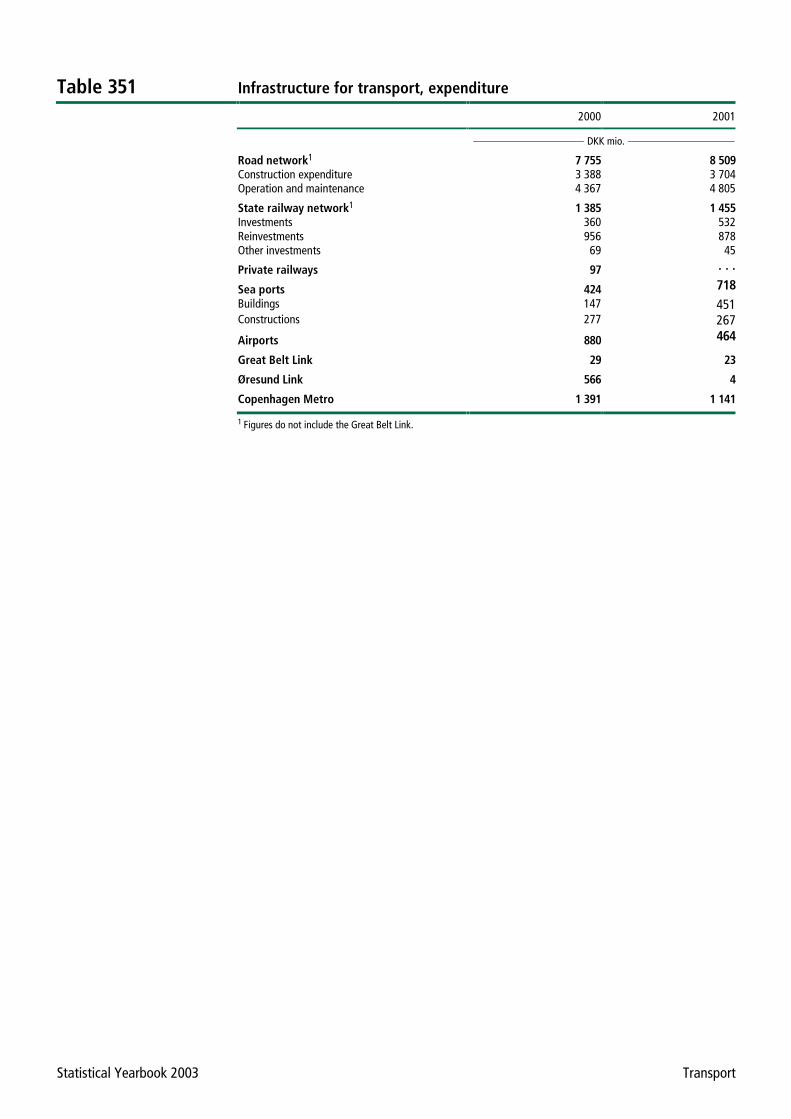
Table 351 Infrastructure for transport, expenditure
2000 2001
DKK mio.
Road network1 7 755 8 509 Construction expenditure 3 388 3 704 Operation and maintenance 4 367 4 805
State railway network1 1 385 1 455 Investments 360 532 Reinvestments 956 878 Other investments 69 45
Private railways 97 . . .
Sea ports 424 718 Buildings 147 451 Constructions 277 267
Airports 880 464
Great Belt Link 29 23
Øresund Link 566 4 Copenhagen Metro 1 391 1 141
1 Figures do not include the Great Belt Link.
Statistical Yearbook 2003 Transport
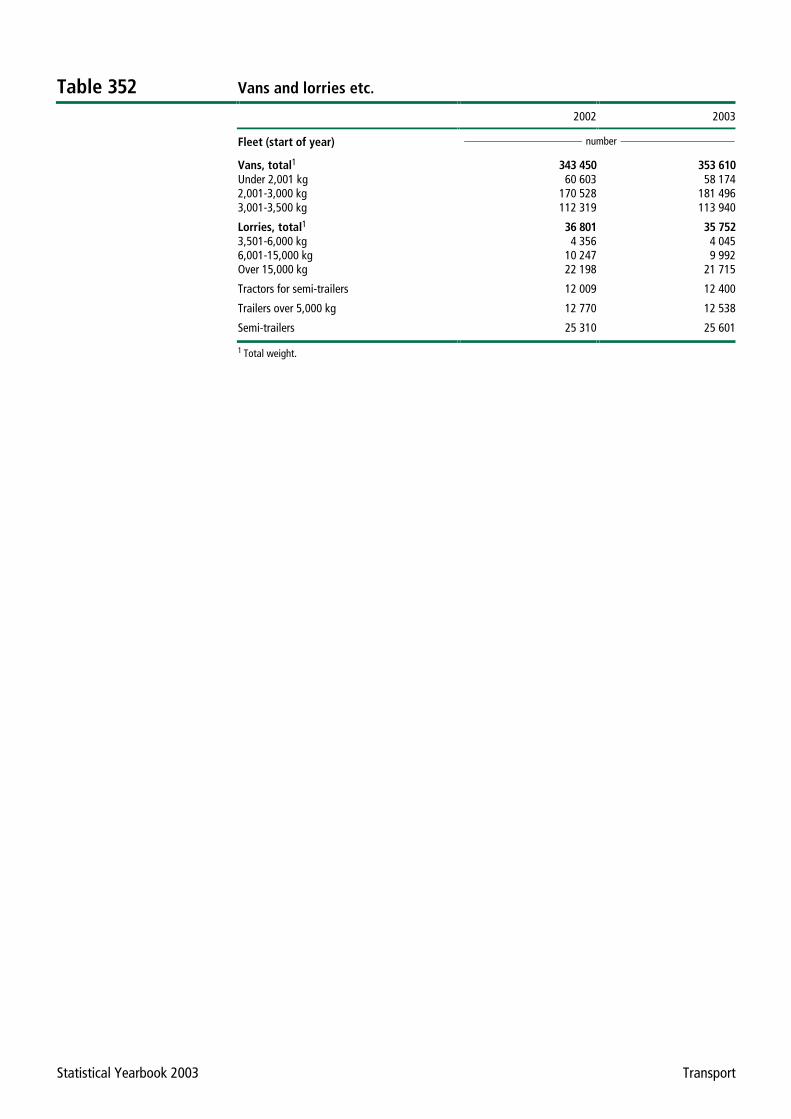
Table 352 Vans and lorries etc.
2002 2003
Fleet (start of year) number
Vans, total1 343 450 353 610 Under 2,001 kg 60 603 58 174 2,001-3,000 kg 170 528 181 496 3,001-3,500 kg 112 319 113 940
Lorries, total1 36 801 35 752 3,501-6,000 kg 4 356 4 045 6,001-15,000 kg 10 247 9 992 Over 15,000 kg 22 198 21 715
Tractors for semi-trailers 12 009 12 400
Trailers over 5,000 kg 12 770 12 538
Semi-trailers 25 310 25 601
1 Total weight.
Statistical Yearbook 2003 Transport
Table 353 Private cars, buses and motorcycles etc.
2002 2003
Fleet (start of year) number
Private cars, total1 1 872 631 1 888 290 Of which in households 1 729 031 1 746 418 Of which in business and industry 133 630 132 905
Petrol 1 751 905 1 748 911 Diesel 120 490 139 162
Age: 0- 3 years 494 268 442 266 4- 7 years 538 817 558 666 8-11 years 310 239 362 098 12-15 years 323 053 275 879 16-19 years 157 218 196 758 over 19 years 49 036 52 611
Average age in years 8.1 8.3
Buses, total 13 954 13 986 In scheduled service 4 697 4 778 Tourist coaches 9 257 9 208
Caravans 110 995 113 338 Motor cycles 78 390 82 731 Moped-45 67 975 68 591 Standard mopeds . . . . . .
1 Incl. cars where owner is not known.
Statistical Yearbook 2003 Transport
Table 354 New registrations of vehicles
20011 2002
number
Private cars 96 137 111 829Petrol 78 974 89 078Diesel 17 155 22 749
Buses 554 765Motor cycles 2 417 2 640
1 Revised figures.
Statistical Yearbook 2003 Transport
Table 355 New registrations of vans and lorries etc.
20011 2002
number
Vans2 Under 2,001 kg 490 2312,001-3000 kg 21 507 23 9523,001-3,500 kg 8 973 7 207
Lorries1 3,501-6,000 kg 212 178over 6,000 kg 2 241 1 958Tractors for semi-trailers 2 198 2 021
1 Revised figures. 2 Total weight.
Statistical Yearbook 2003 Transport
Table 356 Ships of at least 20 GT
Per 1 January 2002 2003
number
Danish ships, total 1 878 1 838 Tankers 96 95 Container ships 78 79 Other dry cargo ships 413 425 Passenger ships/ferries 118 114 Fishing vessels 850 781 Other ships 323 344
thousand GT
Ship tonnage, total 6 918 7 391 Tankers 1 763 2 053 Container ships 3 600 3 893 Other dry cargo ships 770 622 Passenger ships/ferries 425 454 Fishing vessels 144 150 Other ships 215 219
Note. Incl. ships based in Greenland.
Statistical Yearbook 2003 Transport
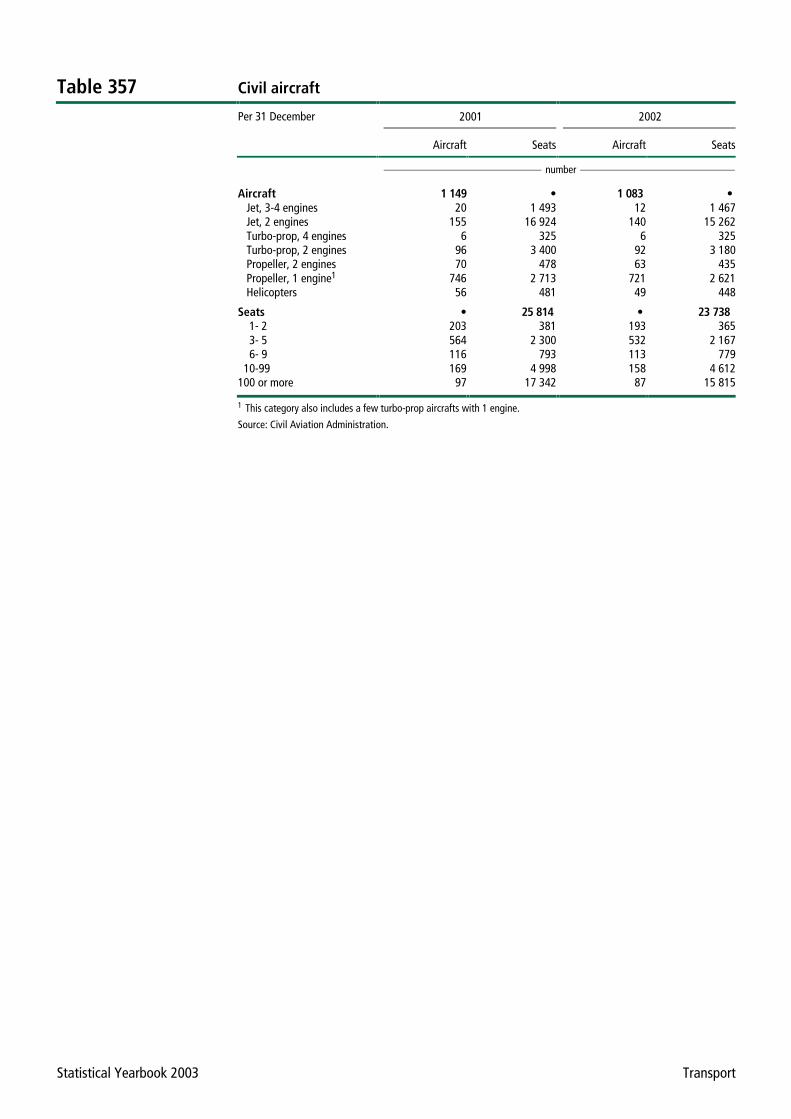
Table 357 Civil aircraft
Per 31 December 2001 2002
Aircraft Seats Aircraft Seats
number
Aircraft 1 149 • 1 083 • Jet, 3-4 engines 20 1 493 12 1 467 Jet, 2 engines 155 16 924 140 15 262 Turbo-prop, 4 engines 6 325 6 325 Turbo-prop, 2 engines 96 3 400 92 3 180 Propeller, 2 engines 70 478 63 435 Propeller, 1 engine1 746 2 713 721 2 621 Helicopters 56 481 49 448
Seats • 25 814 • 23 738 1- 2 203 381 193 365 3- 5 564 2 300 532 2 167 6- 9 116 793 113 779 10-99 169 4 998 158 4 612 100 or more 97 17 342 87 15 815
1 This category also includes a few turbo-prop aircrafts with 1 engine.
Source: Civil Aviation Administration.
Statistical Yearbook 2003 Transport
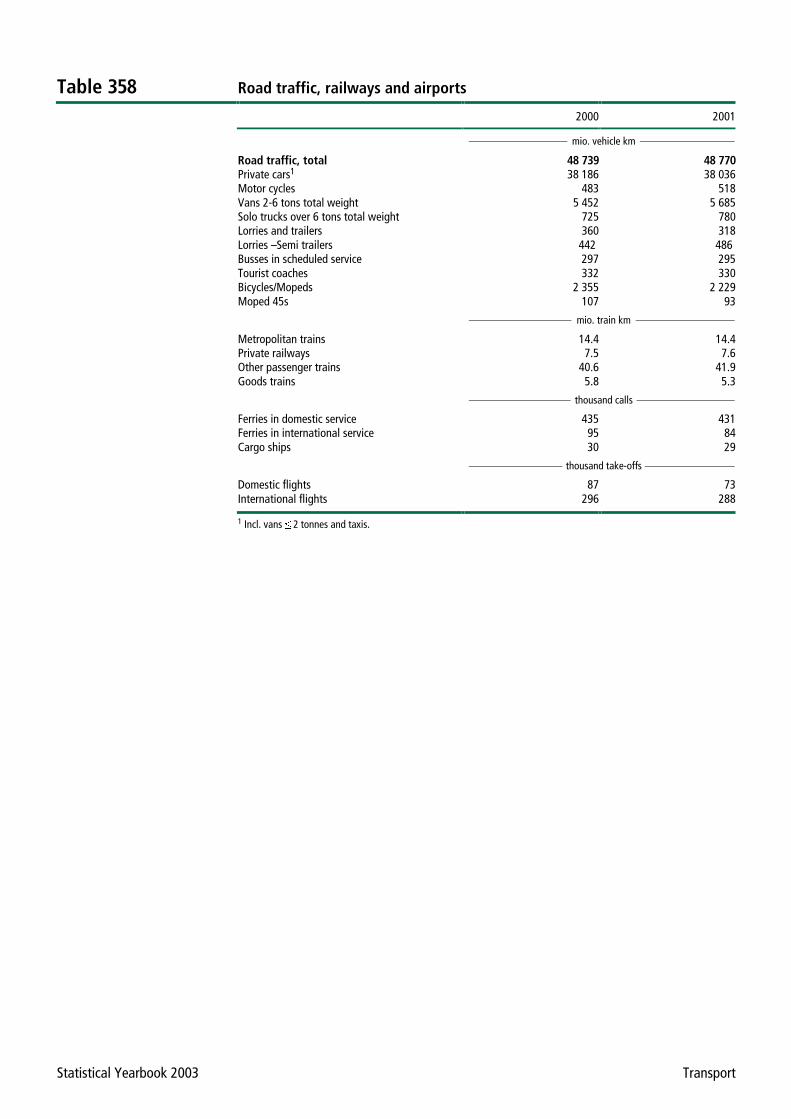
Table 358 Road traffic, railways and airports
2000 2001
mio. vehicle km
Road traffic, total 48 739 48 770 Private cars1 38 186 38 036 Motor cycles 483 518 Vans 2-6 tons total weight 5 452 5 685 Solo trucks over 6 tons total weight 725 780 Lorries and trailers 360 318 Lorries – Semi trailers 442 486 Busses in scheduled service 297 295 Tourist coaches 332 330 Bicycles/Mopeds 2 355 2 229 Moped 45s 107 93
mio. train km
Metropolitan trains 14.4 14.4 Private railways 7.5 7.6 Other passenger trains 40.6 41.9 Goods trains 5.8 5.3
thousand calls
Ferries in domestic service 435 431 Ferries in international service 95 84 Cargo ships 30 29
thousand take-offs
Domestic flights 87 73 International flights 296 288
1 Incl. vans � 2 tonnes and taxis.
Statistical Yearbook 2003 Transport
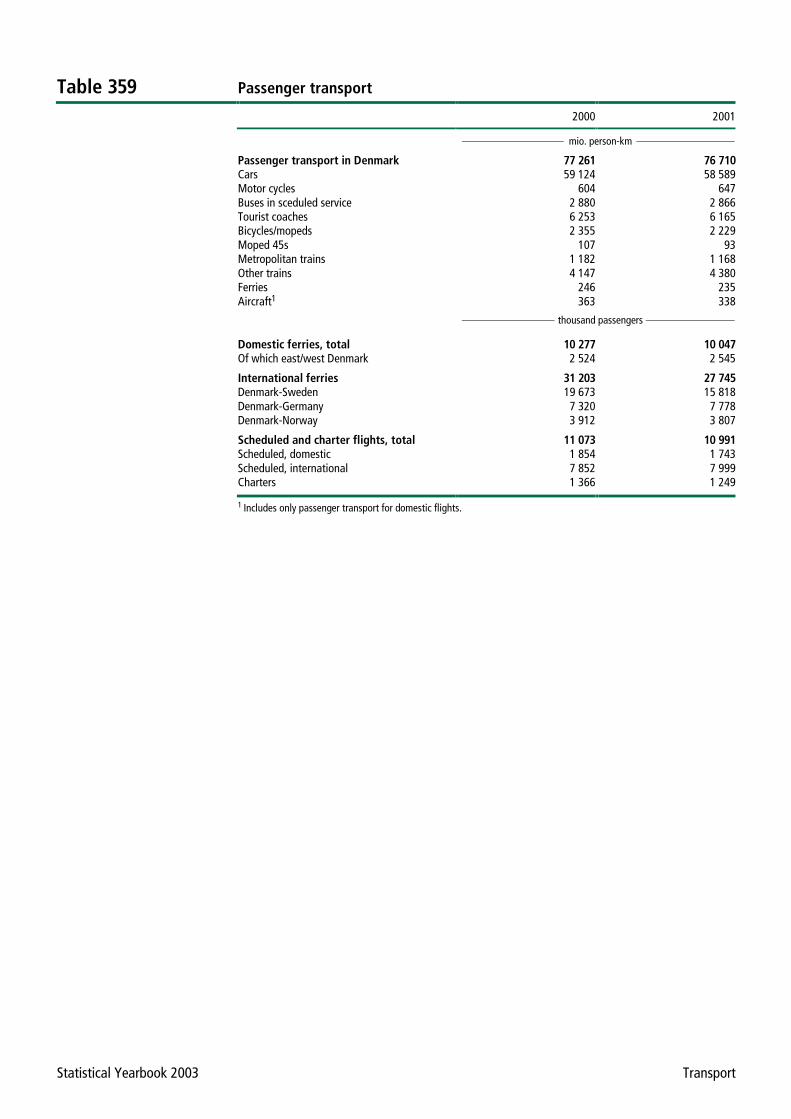
Table 359 Passenger transport
2000 2001
mio. person-km
Passenger transport in Denmark 77 261 76 710 Cars 59 124 58 589 Motor cycles 604 647 Buses in sceduled service 2 880 2 866 Tourist coaches 6 253 6 165 Bicycles/mopeds 2 355 2 229 Moped 45s 107 93 Metropolitan trains 1 182 1 168 Other trains 4 147 4 380 Ferries 246 235 Aircraft1 363 338
thousand passengers
Domestic ferries, total 10 277 10 047 Of which east/west Denmark 2 524 2 545
International ferries 31 203 27 745 Denmark-Sweden 19 673 15 818 Denmark-Germany 7 320 7 778 Denmark-Norway 3 912 3 807
Scheduled and charter flights, total 11 073 10 991 Scheduled, domestic 1 854 1 743 Scheduled, international 7 852 7 999 Charters 1 366 1 249
1 Includes only passenger transport for domestic flights.
Statistical Yearbook 2003 Transport
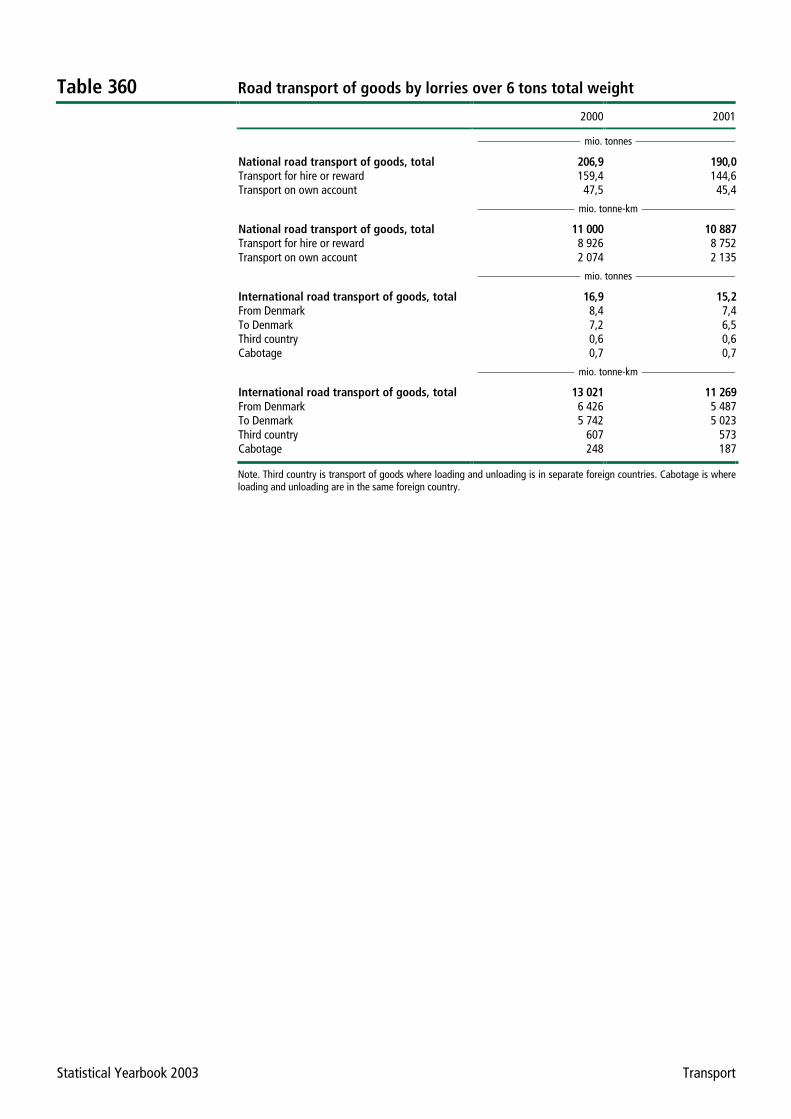
Table 360 Road transport of goods by lorries over 6 tons total weight
2000 2001
mio. tonnes
National road transport of goods, total 206,9 190,0 Transport for hire or reward 159,4 144,6 Transport on own account 47,5 45,4
mio. tonne-km
National road transport of goods, total 11 000 10 887 Transport for hire or reward 8 926 8 752 Transport on own account 2 074 2 135
mio. tonnes
International road transport of goods, total 16,9 15,2 From Denmark 8,4 7,4 To Denmark 7,2 6,5 Third country 0,6 0,6 Cabotage 0,7 0,7
mio. tonne-km
International road transport of goods, total 13 021 11 269 From Denmark 6 426 5 487 To Denmark 5 742 5 023 Third country 607 573 Cabotage 248 187
Note. Third country is transport of goods where loading and unloading is in separate foreign countries. Cabotage is where loading and unloading are in the same foreign country.
Statistical Yearbook 2003 Transport
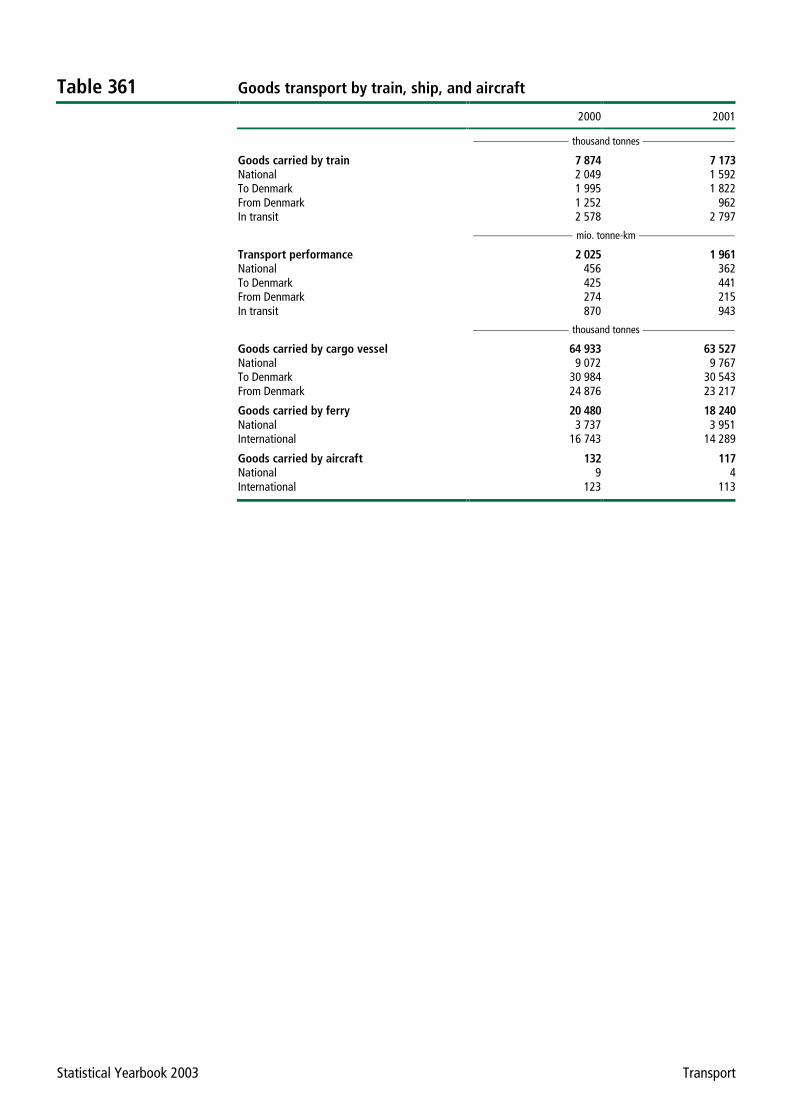
Table 361 Goods transport by train, ship, and aircraft
2000 2001
thousand tonnes
Goods carried by train 7 874 7 173 National 2 049 1 592 To Denmark 1 995 1 822 From Denmark 1 252 962 In transit 2 578 2 797
mio. tonne-km
Transport performance 2 025 1 961 National 456 362 To Denmark 425 441 From Denmark 274 215 In transit 870 943
thousand tonnes
Goods carried by cargo vessel 64 933 63 527 National 9 072 9 767 To Denmark 30 984 30 543 From Denmark 24 876 23 217
Goods carried by ferry 20 480 18 240 National 3 737 3 951 International 16 743 14 289
Goods carried by aircraft 132 117 National 9 4 International 123 113
Statistical Yearbook 2003 Transport
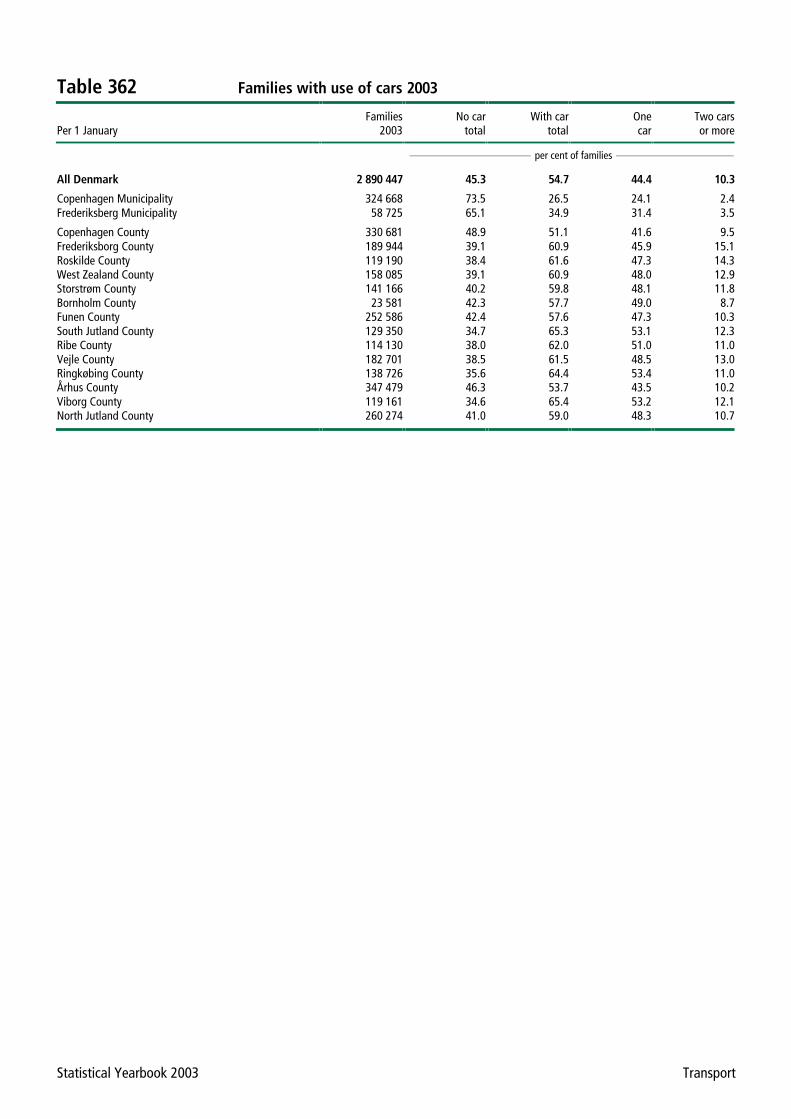
Table 362 Families with use of cars 2003
Families No car With car One Two carsPer 1 January 2003 total total car or more
per cent of families
All Denmark 2 890 447 45.3 54.7 44.4 10.3
Copenhagen Municipality 324 668 73.5 26.5 24.1 2.4Frederiksberg Municipality 58 725 65.1 34.9 31.4 3.5
Copenhagen County 330 681 48.9 51.1 41.6 9.5Frederiksborg County 189 944 39.1 60.9 45.9 15.1Roskilde County 119 190 38.4 61.6 47.3 14.3West Zealand County 158 085 39.1 60.9 48.0 12.9Storstrøm County 141 166 40.2 59.8 48.1 11.8Bornholm County 23 581 42.3 57.7 49.0 8.7Funen County 252 586 42.4 57.6 47.3 10.3South Jutland County 129 350 34.7 65.3 53.1 12.3Ribe County 114 130 38.0 62.0 51.0 11.0Vejle County 182 701 38.5 61.5 48.5 13.0Ringkøbing County 138 726 35.6 64.4 53.4 11.0Århus County 347 479 46.3 53.7 43.5 10.2Viborg County 119 161 34.6 65.4 53.2 12.1North Jutland County 260 274 41.0 59.0 48.3 10.7
Statistical Yearbook 2003 Transport
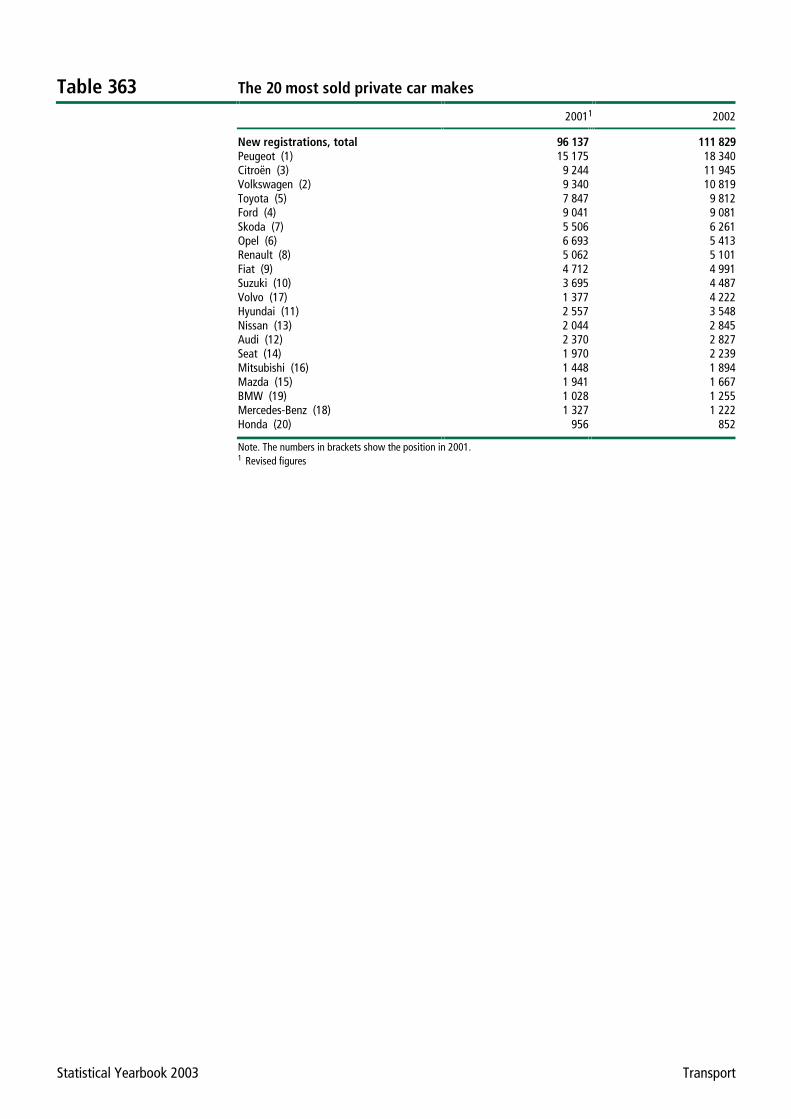
Table 363 The 20 most sold private car makes
20011 2002
New registrations, total 96 137 111 829 Peugeot (1) 15 175 18 340 Citroën (3) 9 244 11 945 Volkswagen (2) 9 340 10 819 Toyota (5) 7 847 9 812 Ford (4) 9 041 9 081 Skoda (7) 5 506 6 261 Opel (6) 6 693 5 413 Renault (8) 5 062 5 101 Fiat (9) 4 712 4 991 Suzuki (10) 3 695 4 487 Volvo (17) 1 377 4 222 Hyundai (11) 2 557 3 548 Nissan (13) 2 044 2 845 Audi (12) 2 370 2 827 Seat (14) 1 970 2 239 Mitsubishi (16) 1 448 1 894 Mazda (15) 1 941 1 667 BMW (19) 1 028 1 255 Mercedes-Benz (18) 1 327 1 222 Honda (20) 956 852
Note. The numbers in brackets show the position in 2001. 1 Revised figures
Statistical Yearbook 2003 Transport
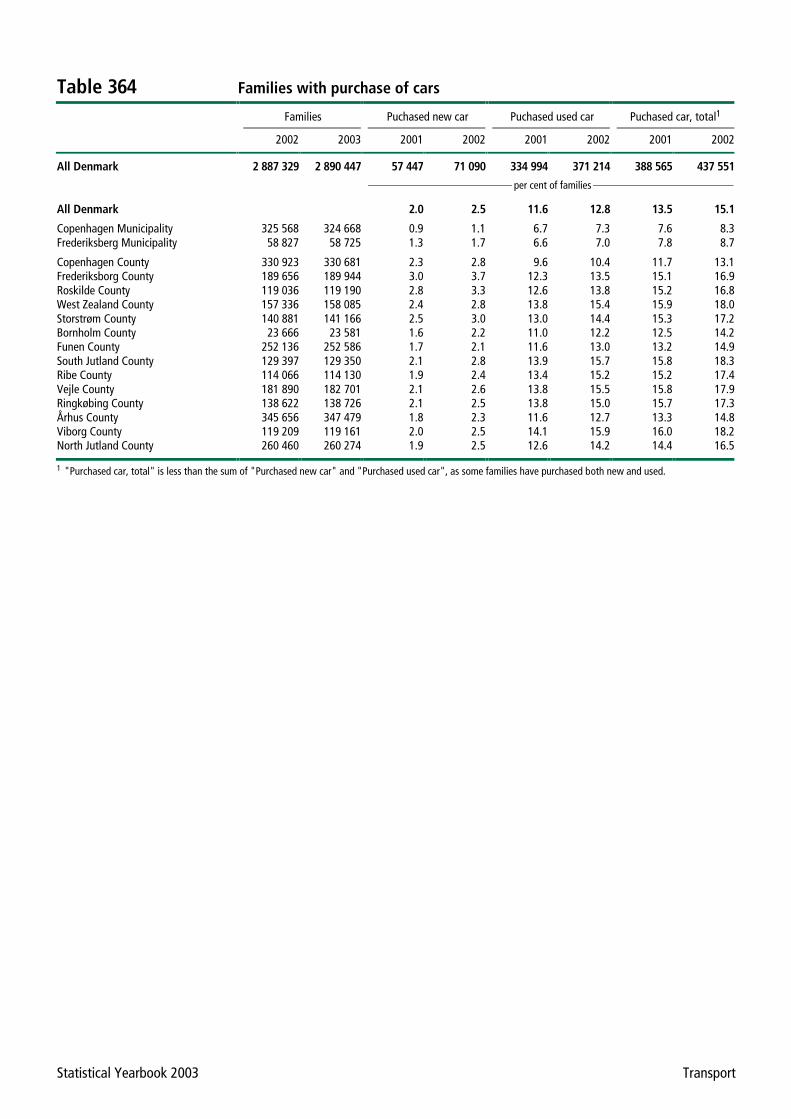
Table 364 Families with purchase of cars
Families Puchased new car Puchased used car Puchased car, total1
2002 2003 2001 2002 2001 2002 2001 2002
All Denmark 2 887 329 2 890 447 57 447 71 090 334 994 371 214 388 565 437 551 per cent of families
All Denmark 2.0 2.5 11.6 12.8 13.5 15.1
Copenhagen Municipality 325 568 324 668 0.9 1.1 6.7 7.3 7.6 8.3Frederiksberg Municipality 58 827 58 725 1.3 1.7 6.6 7.0 7.8 8.7
Copenhagen County 330 923 330 681 2.3 2.8 9.6 10.4 11.7 13.1Frederiksborg County 189 656 189 944 3.0 3.7 12.3 13.5 15.1 16.9Roskilde County 119 036 119 190 2.8 3.3 12.6 13.8 15.2 16.8West Zealand County 157 336 158 085 2.4 2.8 13.8 15.4 15.9 18.0Storstrøm County 140 881 141 166 2.5 3.0 13.0 14.4 15.3 17.2Bornholm County 23 666 23 581 1.6 2.2 11.0 12.2 12.5 14.2Funen County 252 136 252 586 1.7 2.1 11.6 13.0 13.2 14.9South Jutland County 129 397 129 350 2.1 2.8 13.9 15.7 15.8 18.3Ribe County 114 066 114 130 1.9 2.4 13.4 15.2 15.2 17.4Vejle County 181 890 182 701 2.1 2.6 13.8 15.5 15.8 17.9Ringkøbing County 138 622 138 726 2.1 2.5 13.8 15.0 15.7 17.3Århus County 345 656 347 479 1.8 2.3 11.6 12.7 13.3 14.8Viborg County 119 209 119 161 2.0 2.5 14.1 15.9 16.0 18.2North Jutland County 260 460 260 274 1.9 2.5 12.6 14.2 14.4 16.5
1 "Purchased car, total" is less than the sum of "Purchased new car" and "Purchased used car", as some families have purchased both new and used.
Statistical Yearbook 2003 Transport
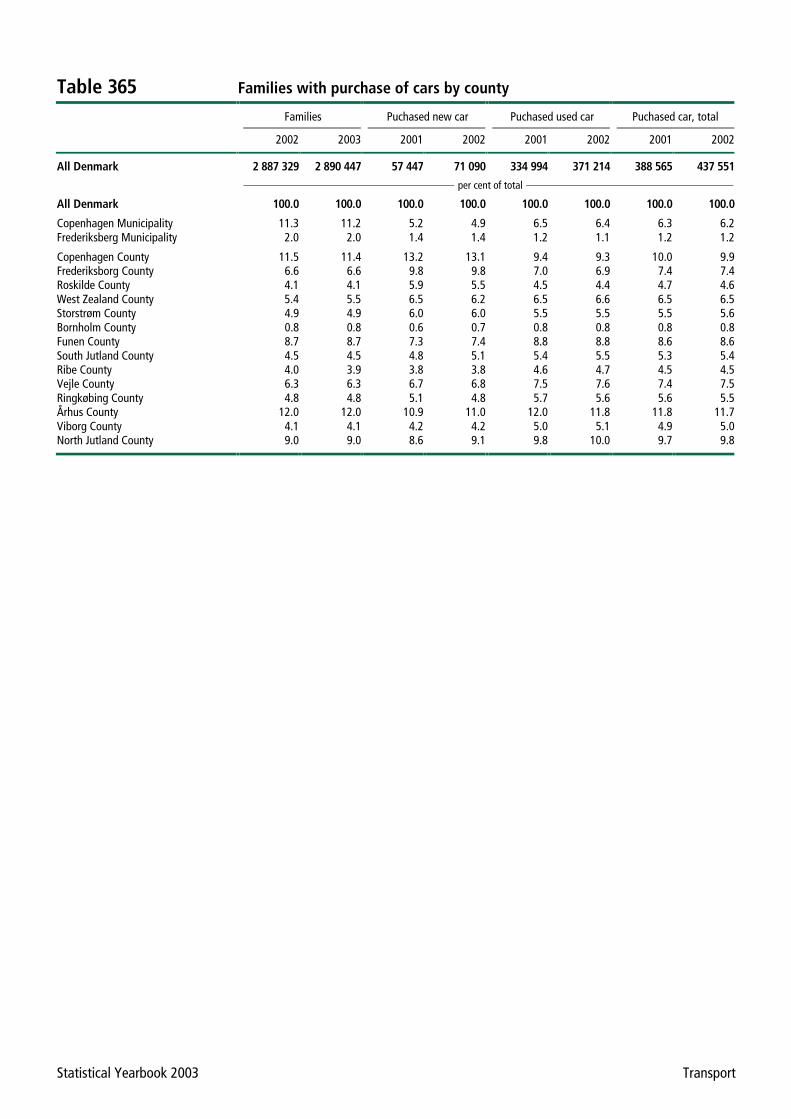
Table 365 Families with purchase of cars by county
Families Puchased new car Puchased used car Puchased car, total
2002 2003 2001 2002 2001 2002 2001 2002
All Denmark 2 887 329 2 890 447 57 447 71 090 334 994 371 214 388 565 437 551 per cent of total
All Denmark 100.0 100.0 100.0 100.0 100.0 100.0 100.0 100.0
Copenhagen Municipality 11.3 11.2 5.2 4.9 6.5 6.4 6.3 6.2Frederiksberg Municipality 2.0 2.0 1.4 1.4 1.2 1.1 1.2 1.2
Copenhagen County 11.5 11.4 13.2 13.1 9.4 9.3 10.0 9.9Frederiksborg County 6.6 6.6 9.8 9.8 7.0 6.9 7.4 7.4Roskilde County 4.1 4.1 5.9 5.5 4.5 4.4 4.7 4.6West Zealand County 5.4 5.5 6.5 6.2 6.5 6.6 6.5 6.5Storstrøm County 4.9 4.9 6.0 6.0 5.5 5.5 5.5 5.6Bornholm County 0.8 0.8 0.6 0.7 0.8 0.8 0.8 0.8Funen County 8.7 8.7 7.3 7.4 8.8 8.8 8.6 8.6South Jutland County 4.5 4.5 4.8 5.1 5.4 5.5 5.3 5.4Ribe County 4.0 3.9 3.8 3.8 4.6 4.7 4.5 4.5Vejle County 6.3 6.3 6.7 6.8 7.5 7.6 7.4 7.5Ringkøbing County 4.8 4.8 5.1 4.8 5.7 5.6 5.6 5.5Århus County 12.0 12.0 10.9 11.0 12.0 11.8 11.8 11.7Viborg County 4.1 4.1 4.2 4.2 5.0 5.1 4.9 5.0North Jutland County 9.0 9.0 8.6 9.1 9.8 10.0 9.7 9.8
Statistical Yearbook 2003 Transport
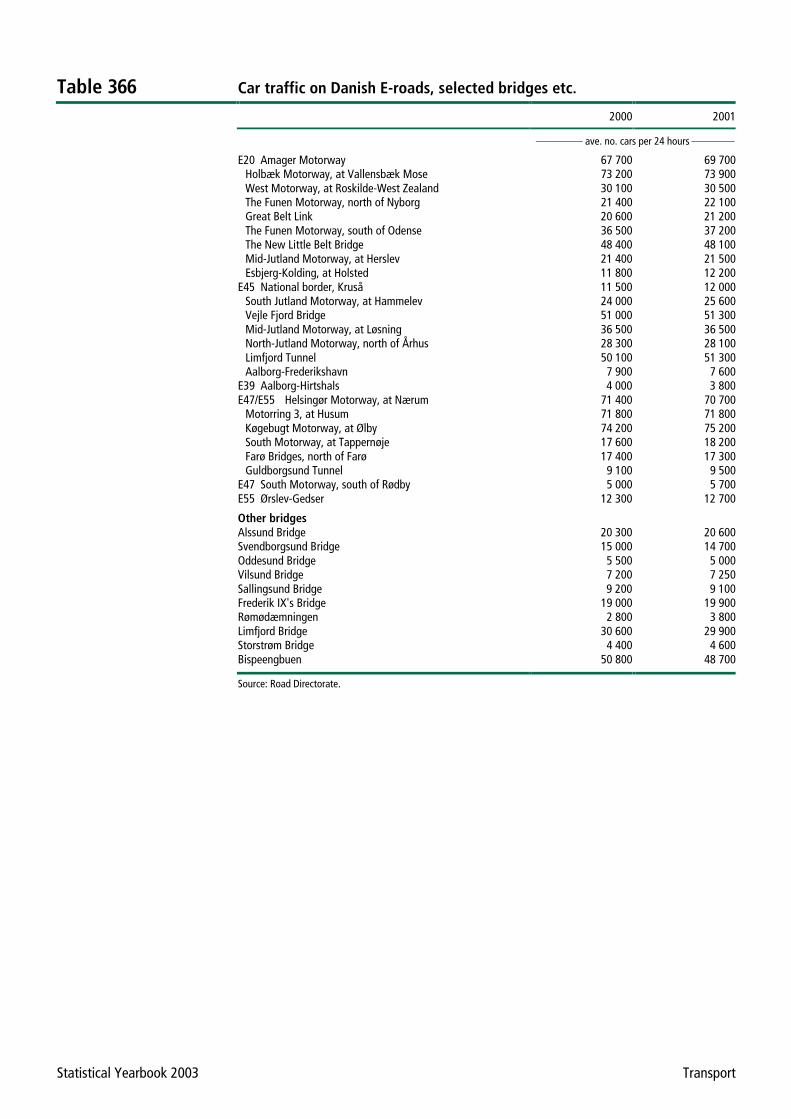
Table 366 Car traffic on Danish E-roads, selected bridges etc.
2000 2001
ave. no. cars per 24 hours
E20 Amager Motorway 67 700 69 700 Holbæk Motorway, at Vallensbæk Mose 73 200 73 900 West Motorway, at Roskilde-West Zealand 30 100 30 500 The Funen Motorway, north of Nyborg 21 400 22 100 Great Belt Link 20 600 21 200 The Funen Motorway, south of Odense 36 500 37 200 The New Little Belt Bridge 48 400 48 100 Mid-Jutland Motorway, at Herslev 21 400 21 500 Esbjerg-Kolding, at Holsted 11 800 12 200 E45 National border, Kruså 11 500 12 000 South Jutland Motorway, at Hammelev 24 000 25 600 Vejle Fjord Bridge 51 000 51 300 Mid-Jutland Motorway, at Løsning 36 500 36 500 North-Jutland Motorway, north of Århus 28 300 28 100 Limfjord Tunnel 50 100 51 300 Aalborg-Frederikshavn 7 900 7 600 E39 Aalborg-Hirtshals 4 000 3 800 E47/E55 Helsingør Motorway, at Nærum 71 400 70 700 Motorring 3, at Husum 71 800 71 800 Køgebugt Motorway, at Ølby 74 200 75 200 South Motorway, at Tappernøje 17 600 18 200 Farø Bridges, north of Farø 17 400 17 300 Guldborgsund Tunnel 9 100 9 500 E47 South Motorway, south of Rødby 5 000 5 700 E55 Ørslev-Gedser 12 300 12 700
Other bridges Alssund Bridge 20 300 20 600 Svendborgsund Bridge 15 000 14 700 Oddesund Bridge 5 500 5 000 Vilsund Bridge 7 200 7 250 Sallingsund Bridge 9 200 9 100 Frederik IX's Bridge 19 000 19 900 Rømødæmningen 2 800 3 800 Limfjord Bridge 30 600 29 900 Storstrøm Bridge 4 400 4 600 Bispeengbuen 50 800 48 700
Source: Road Directorate.

Statistical Yearbook 2003 Transport
Table 367 Ships observed passing through the Sound and Belts
2001 2002
observations
Øresund Northern observation point Going north 18 412 17 704 Going south 19 151 19 162 Southern observation point Going north 18 459 18 055 Going south 19 334 19 542
The Great Belt Going north 9 232 9 518 Going south 7 797 7 720
The Little Belt Going north 1 270 1 412 Going south 1 522 1 433
Source: Admiral Danish Fleet.
Statistical Yearbook 2003 Transport
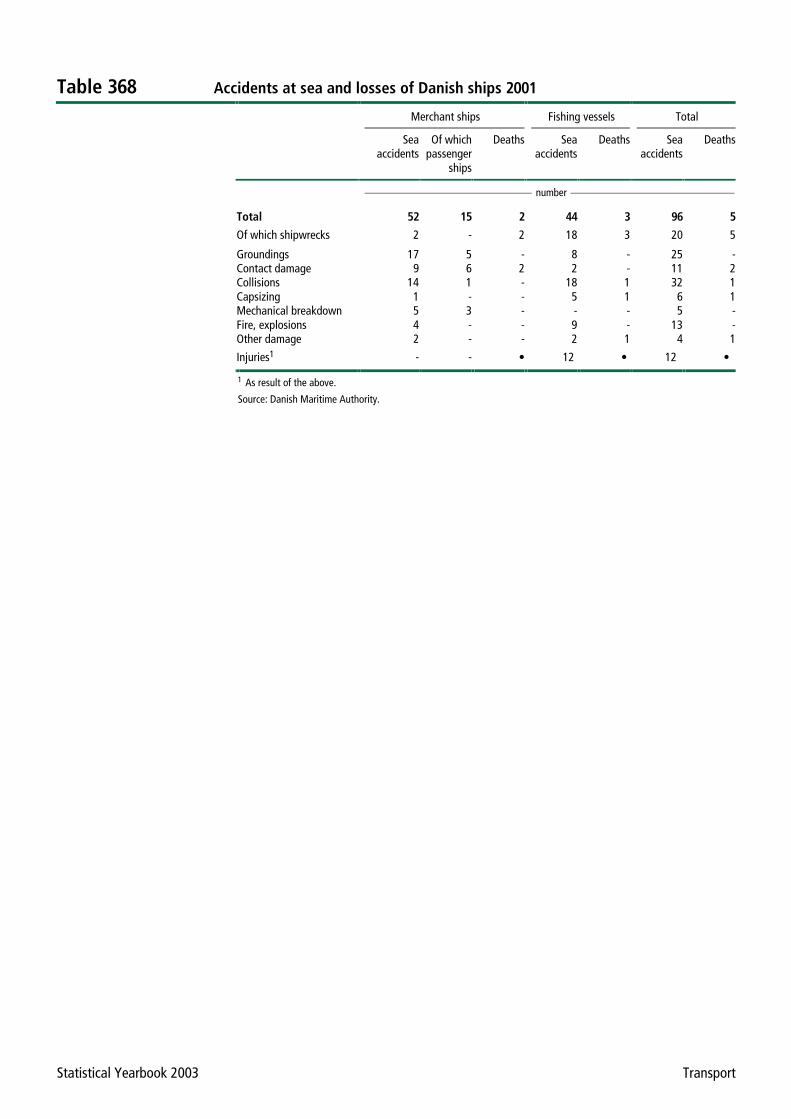
Table 368 Accidents at sea and losses of Danish ships 2001
Merchant ships Fishing vessels Total
Sea accidents
Of which passenger
ships
Deaths Sea accidents
Deaths Sea accidents
Deaths
number
Total 52 15 2 44 3 96 5
Of which shipwrecks 2 - 2 18 3 20 5
Groundings 17 5 - 8 - 25 - Contact damage 9 6 2 2 - 11 2 Collisions 14 1 - 18 1 32 1 Capsizing 1 - - 5 1 6 1 Mechanical breakdown 5 3 - - - 5 - Fire, explosions 4 - - 9 - 13 - Other damage 2 - - 2 1 4 1
Injuries1 - - • 12 • 12 •
1 As result of the above.
Source: Danish Maritime Authority.
Statistical Yearbook 2003 Transport
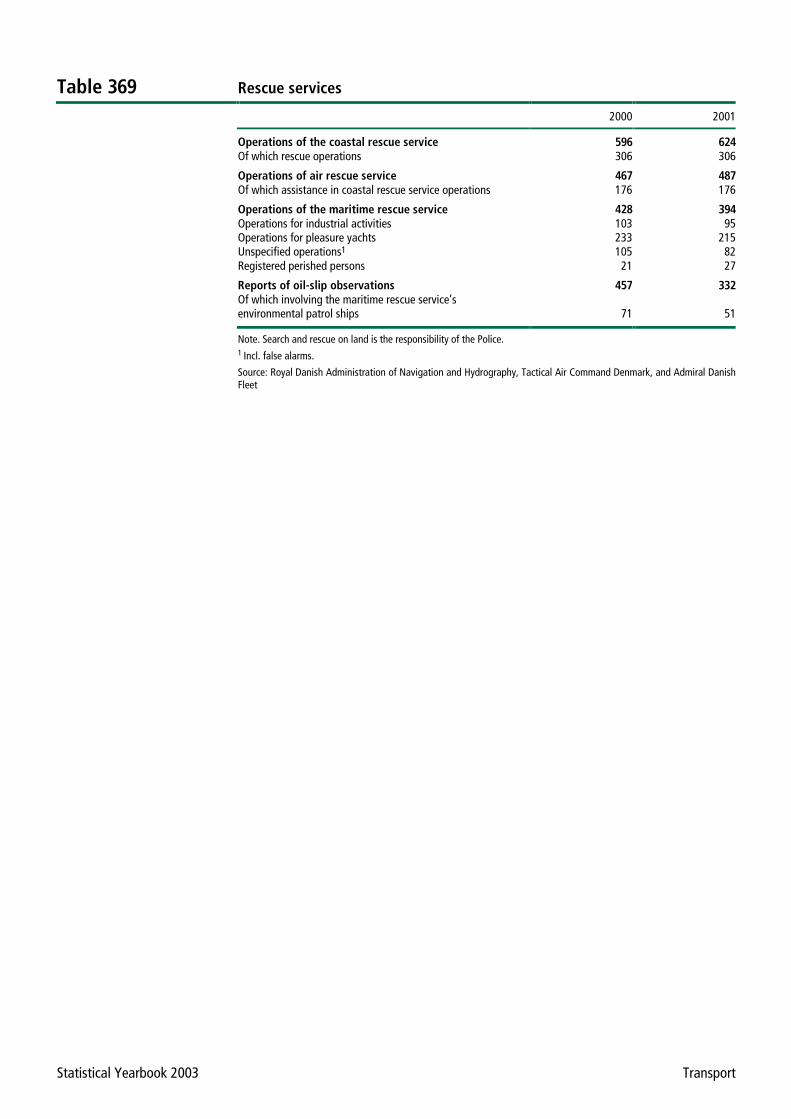
Table 369 Rescue services
2000 2001
Operations of the coastal rescue service 596 624 Of which rescue operations 306 306
Operations of air rescue service 467 487 Of which assistance in coastal rescue service operations 176 176
Operations of the maritime rescue service 428 394 Operations for industrial activities 103 95 Operations for pleasure yachts 233 215 Unspecified operations1 105 82 Registered perished persons 21 27
Reports of oil-slip observations 457 332 Of which involving the maritime rescue service’s
environmental patrol ships 71 51
Note. Search and rescue on land is the responsibility of the Police. 1 Incl. false alarms.
Source: Royal Danish Administration of Navigation and Hydrography, Tactical Air Command Denmark, and Admiral Danish Fleet
Statistical Yearbook 2003 Transport
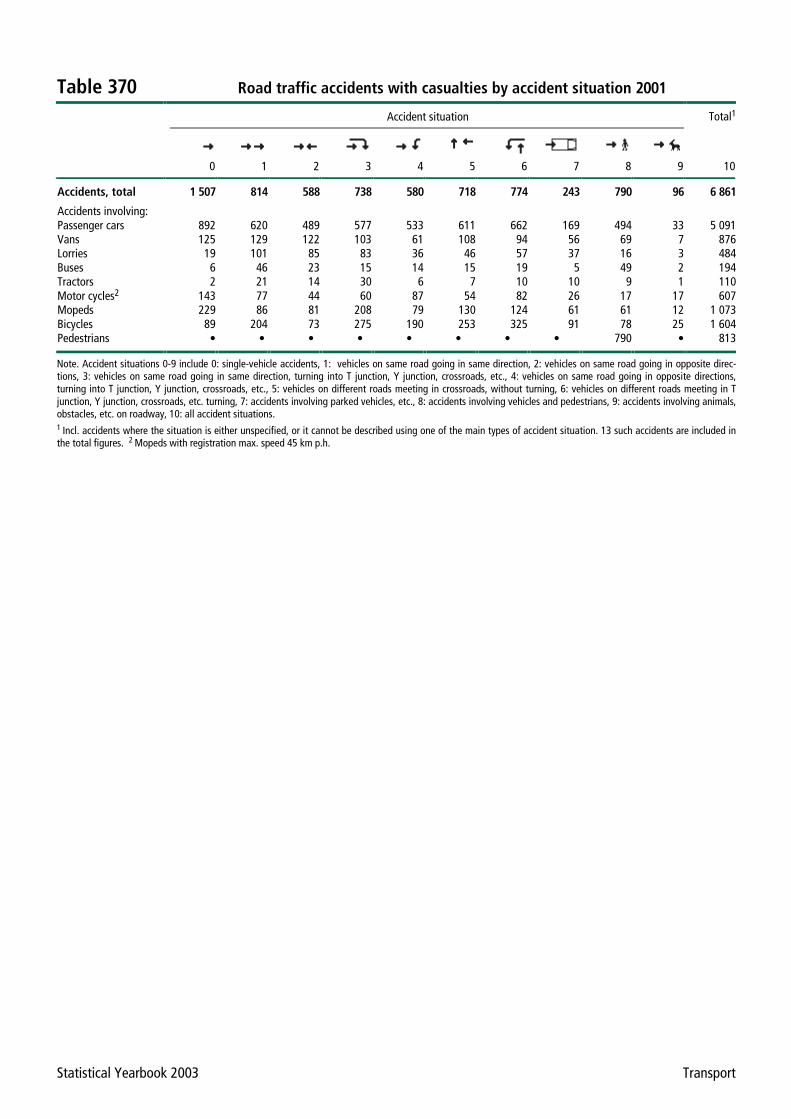
Table 370 Road traffic accidents with casualties by accident situation 2001
Accident situation Total1
0 1 2 3 4 5 6 7 8 9 10
Accidents, total 1 507 814 588 738 580 718 774 243 790 96 6 861
Accidents involving: Passenger cars 892 620 489 577 533 611 662 169 494 33 5 091Vans 125 129 122 103 61 108 94 56 69 7 876Lorries 19 101 85 83 36 46 57 37 16 3 484Buses 6 46 23 15 14 15 19 5 49 2 194Tractors 2 21 14 30 6 7 10 10 9 1 110Motor cycles2 143 77 44 60 87 54 82 26 17 17 607Mopeds 229 86 81 208 79 130 124 61 61 12 1 073Bicycles 89 204 73 275 190 253 325 91 78 25 1 604Pedestrians • • • • • • • • 790 • 813
Note. Accident situations 0-9 include 0: single-vehicle accidents, 1: vehicles on same road going in same direction, 2: vehicles on same road going in opposite direc-tions, 3: vehicles on same road going in same direction, turning into T junction, Y junction, crossroads, etc., 4: vehicles on same road going in opposite directions, turning into T junction, Y junction, crossroads, etc., 5: vehicles on different roads meeting in crossroads, without turning, 6: vehicles on different roads meeting in T junction, Y junction, crossroads, etc. turning, 7: accidents involving parked vehicles, etc., 8: accidents involving vehicles and pedestrians, 9: accidents involving animals, obstacles, etc. on roadway, 10: all accident situations. 1 Incl. accidents where the situation is either unspecified, or it cannot be described using one of the main types of accident situation. 13 such accidents are included in the total figures. 2 Mopeds with registration max. speed 45 km p.h.
Statistical Yearbook 2003 Transport
Table 371 Road traffic accidents causing casualties
1990 1995 2001
Accidents, total 9 155 8 373 6 861 Of which: Alcohol accidents1 1 613 1 282 1 140
Casualties, total 11 287 10 573 8 896 Killed 634 582 431 Seriously injured 6 396 5 624 3 946 Slightly injured 4 257 4 367 4 519
Casualties in alcohol accidents 2 057 1 672 1 441 Killed 154 123 115 Seriously injured 1 176 893 636 Slightly injured 727 656 690
Note. The table only includes traffic accidents causing personal injury which have come to the attention of the Police, and which took place on roads, streets or squares which are accessible by the public and which are being used by at least one of the traffic units involved in the accident, and at least one of the traffic units involved in the accident was driving. There-fore, accidents involving only pedestrians, railway accidents (except at level crossings), and accidents in yards, fields and garages, etc. do not count as traffic accidents. Deaths include deaths up to 30 days after the accident and as a conse-quence of the accident. 1 Accidents with a least one driver or pedestrian involved having an alcohol count of over 0.5. Up to and including 1996, accidents where a driver or pedestrian had a count of exactly 0.5 are also included.
Statistical Yearbook 2003 Transport
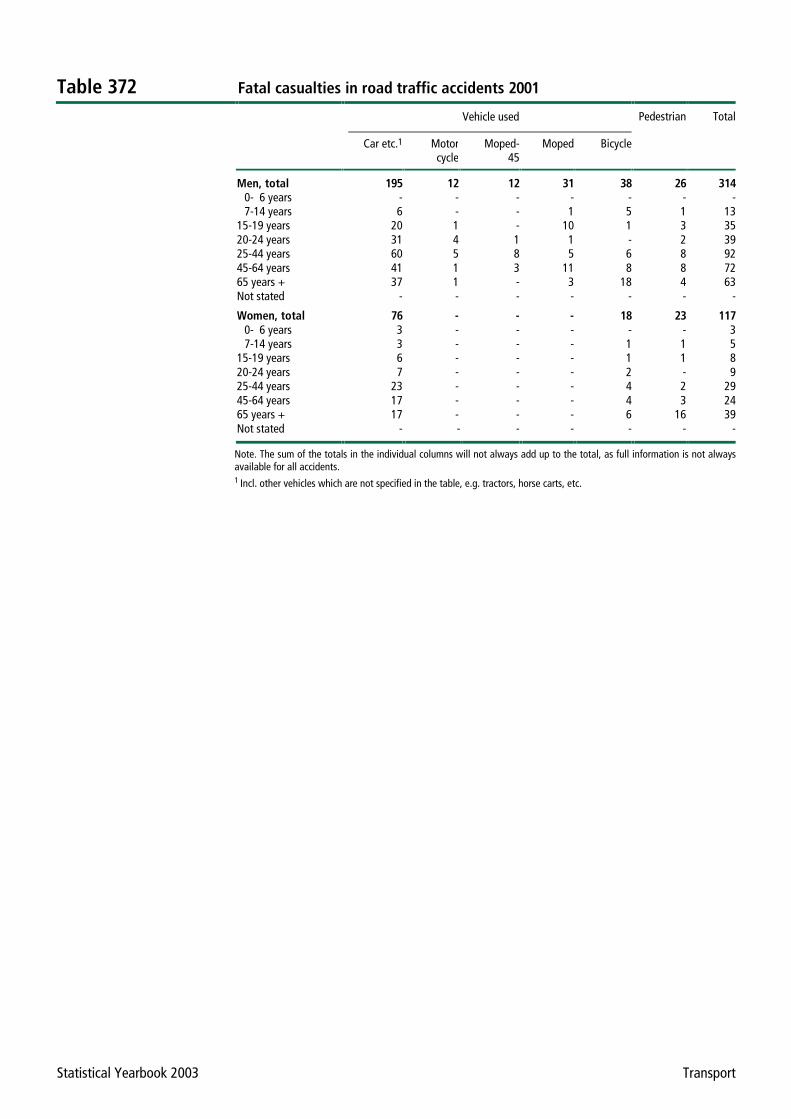
Table 372 Fatal casualties in road traffic accidents 2001
Vehicle used Pedestrian Total
Car etc.1 Motorcycle
Moped-45
Moped Bicycle
Men, total 195 12 12 31 38 26 314 0- 6 years - - - - - - - 7-14 years 6 - - 1 5 1 13 15-19 years 20 1 - 10 1 3 35 20-24 years 31 4 1 1 - 2 39 25-44 years 60 5 8 5 6 8 92 45-64 years 41 1 3 11 8 8 72 65 years + 37 1 - 3 18 4 63 Not stated - - - - - - -
Women, total 76 - - - 18 23 117 0- 6 years 3 - - - - - 3 7-14 years 3 - - - 1 1 5 15-19 years 6 - - - 1 1 8 20-24 years 7 - - - 2 - 9 25-44 years 23 - - - 4 2 29 45-64 years 17 - - - 4 3 24 65 years + 17 - - - 6 16 39 Not stated - - - - - - -
Note. The sum of the totals in the individual columns will not always add up to the total, as full information is not always available for all accidents. 1 Incl. other vehicles which are not specified in the table, e.g. tractors, horse carts, etc.
Statistical Yearbook 2003 Transport
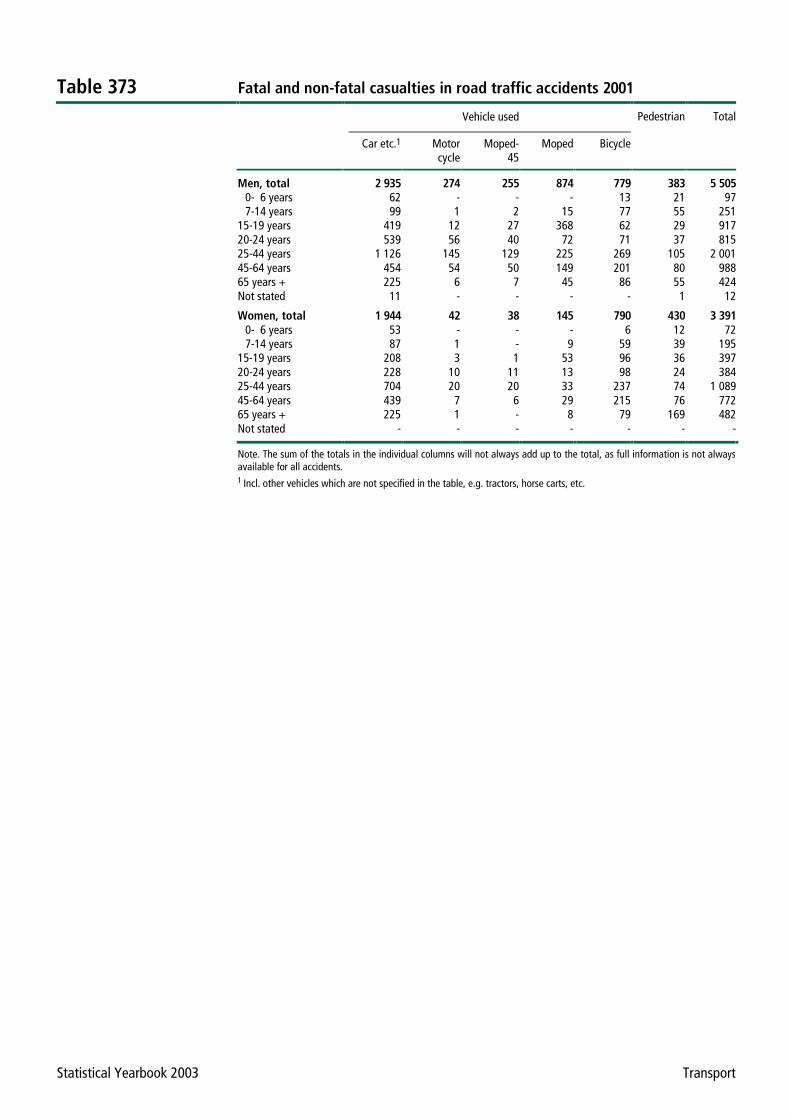
Table 373 Fatal and non-fatal casualties in road traffic accidents 2001
Vehicle used Pedestrian Total
Car etc.1 Motor cycle
Moped- 45
Moped Bicycle
Men, total 2 935 274 255 874 779 383 5 505 0- 6 years 62 - - - 13 21 97 7-14 years 99 1 2 15 77 55 251 15-19 years 419 12 27 368 62 29 917 20-24 years 539 56 40 72 71 37 815 25-44 years 1 126 145 129 225 269 105 2 001 45-64 years 454 54 50 149 201 80 988 65 years + 225 6 7 45 86 55 424 Not stated 11 - - - - 1 12
Women, total 1 944 42 38 145 790 430 3 391 0- 6 years 53 - - - 6 12 72 7-14 years 87 1 - 9 59 39 195 15-19 years 208 3 1 53 96 36 397 20-24 years 228 10 11 13 98 24 384 25-44 years 704 20 20 33 237 74 1 089 45-64 years 439 7 6 29 215 76 772 65 years + 225 1 - 8 79 169 482 Not stated - - - - - - -
Note. The sum of the totals in the individual columns will not always add up to the total, as full information is not always available for all accidents. 1 Incl. other vehicles which are not specified in the table, e.g. tractors, horse carts, etc.