Embed Size (px)
Citation preview
Nutrition: School-Based Programs Promoting Nutrition and Physical Activity (2003 Archived Review)
Table of Contents Review Summary .................................................................................................................................................................... 2
Intervention Definition ....................................................................................................................................................... 2
Summary of Task Force Finding .......................................................................................................................................... 2
About the Systematic Review ............................................................................................................................................. 2
Summary of Results ............................................................................................................................................................ 2
Task Force Finding ................................................................................................................................................................... 3
Intervention Definition ....................................................................................................................................................... 3
Task Force Finding ............................................................................................................................................................... 3
Supporting Materials .............................................................................................................................................................. 4
Summary Evidence Tables .................................................................................................................................................. 4
Included Studies ................................................................................................................................................................ 36
Search Strategies ............................................................................................................................................................... 39
Disclaimer .......................................................................................................................................................................... 41
Archived Review Summary
Nutrition: School-Based Programs Promoting Nutrition and Physical Activity (2003 Archived Review) 2
Review Summary
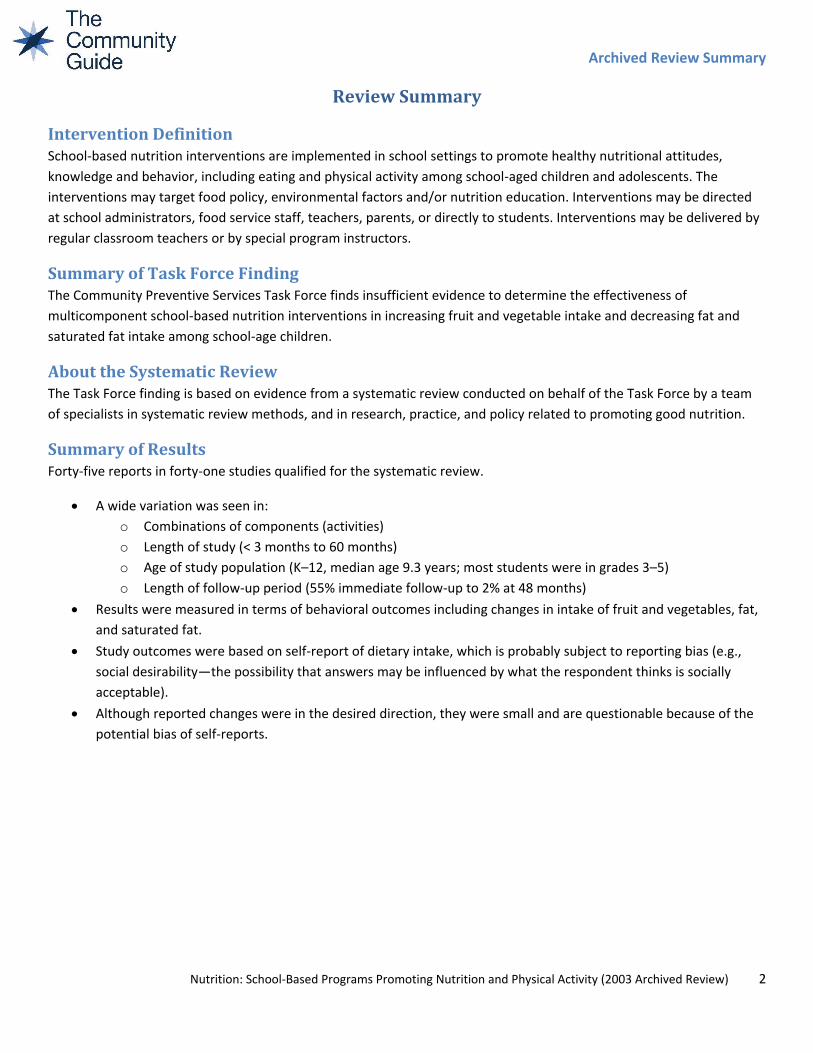
Intervention Definition School-based nutrition interventions are implemented in school settings to promote healthy nutritional attitudes,
knowledge and behavior, including eating and physical activity among school-aged children and adolescents. The
interventions may target food policy, environmental factors and/or nutrition education. Interventions may be directed
at school administrators, food service staff, teachers, parents, or directly to students. Interventions may be delivered by
regular classroom teachers or by special program instructors.
Summary of Task Force Finding
The Community Preventive Services Task Force finds insufficient evidence to determine the effectiveness of
multicomponent school-based nutrition interventions in increasing fruit and vegetable intake and decreasing fat and
saturated fat intake among school-age children.
About the Systematic Review
The Task Force finding is based on evidence from a systematic review conducted on behalf of the Task Force by a team
of specialists in systematic review methods, and in research, practice, and policy related to promoting good nutrition.
Summary of Results
Forty-five reports in forty-one studies qualified for the systematic review.
A wide variation was seen in:
o Combinations of components (activities)
o Length of study (< 3 months to 60 months)
o Age of study population (K–12, median age 9.3 years; most students were in grades 3–5)
o Length of follow-up period (55% immediate follow-up to 2% at 48 months)
Results were measured in terms of behavioral outcomes including changes in intake of fruit and vegetables, fat,
and saturated fat.
Study outcomes were based on self-report of dietary intake, which is probably subject to reporting bias (e.g.,
social desirability—the possibility that answers may be influenced by what the respondent thinks is socially
acceptable).
Although reported changes were in the desired direction, they were small and are questionable because of the
potential bias of self-reports.
Archived Task Force Finding
Nutrition: School-Based Programs Promoting Nutrition and Physical Activity (2003 Archived Review) 3
Task Force Finding
Intervention Definition School-based nutrition interventions are implemented in school settings to promote healthy nutritional attitudes,
knowledge and behavior, including eating and physical activity among school-aged children and adolescents. The
interventions may target food policy, environmental factors and/or nutrition education. Interventions may be directed
at school administrators, food service staff, teachers, parents, or directly to students. Interventions may be delivered by
regular classroom teachers or by special program instructors.
Task Force Finding (June 2003)*
The Community Preventive Services Task Force finds insufficient evidence to determine the effectiveness of
multicomponent school-based nutrition interventions in increasing fruit and vegetable intake and decreasing fat and
saturated fat intake among school-age children.
Archived Supporting Materials
Nutrition: School-Based Programs Promoting Nutrition and Physical Activity (2003 Archived Review) 4
Supporting Materials
Summary Evidence Tables
Study Population and
Setting Intervention and Comparison Summary Effect Measures
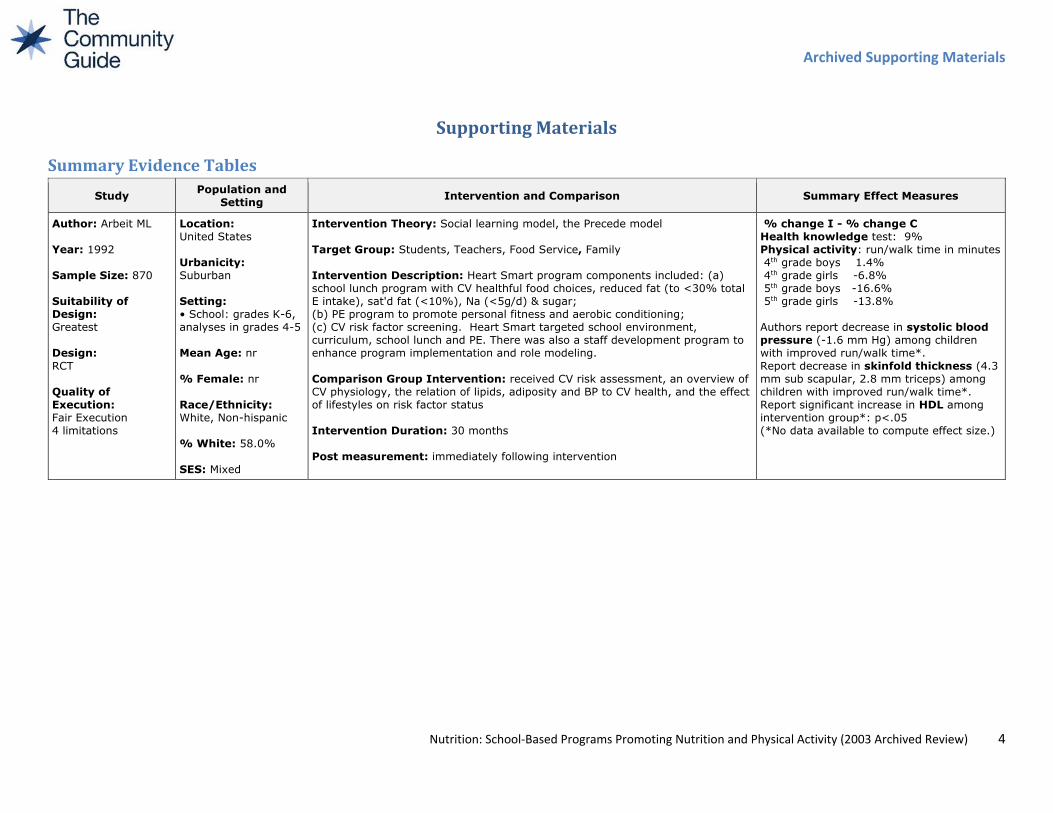
Author: Arbeit ML
Year: 1992
Sample Size: 870
Suitability of
Design:
Greatest
Design:
RCT
Quality of
Execution:
Fair Execution
4 limitations
Location:
United States
Urbanicity:
Suburban
Setting:
• School: grades K-6,
analyses in grades 4-5
Mean Age: nr
% Female: nr
Race/Ethnicity:
White, Non-hispanic
% White: 58.0%
SES: Mixed
Intervention Theory: Social learning model, the Precede model
Target Group: Students, Teachers, Food Service, Family
Intervention Description: Heart Smart program components included: (a)
school lunch program with CV healthful food choices, reduced fat (to <30% total
E intake), sat'd fat (<10%), Na (<5g/d) & sugar;
(b) PE program to promote personal fitness and aerobic conditioning;
(c) CV risk factor screening. Heart Smart targeted school environment,
curriculum, school lunch and PE. There was also a staff development program to
enhance program implementation and role modeling.
Comparison Group Intervention: received CV risk assessment, an overview of
CV physiology, the relation of lipids, adiposity and BP to CV health, and the effect
of lifestyles on risk factor status
Intervention Duration: 30 months
Post measurement: immediately following intervention
% change I - % change C
Health knowledge test: 9%
Physical activity: run/walk time in minutes
4th grade boys 1.4%
4th grade girls -6.8%
5th grade boys -16.6%
5th grade girls -13.8%
Authors report decrease in systolic blood
pressure (-1.6 mm Hg) among children
with improved run/walk time*.
Report decrease in skinfold thickness (4.3
mm sub scapular, 2.8 mm triceps) among
children with improved run/walk time*.
Report significant increase in HDL among
intervention group*: p<.05
(*No data available to compute effect size.)
Archived Supporting Materials
Nutrition: School-Based Programs Promoting Nutrition and Physical Activity (2003 Archived Review) 5
Study Population and
Setting Intervention and Comparison Summary Effect Measures
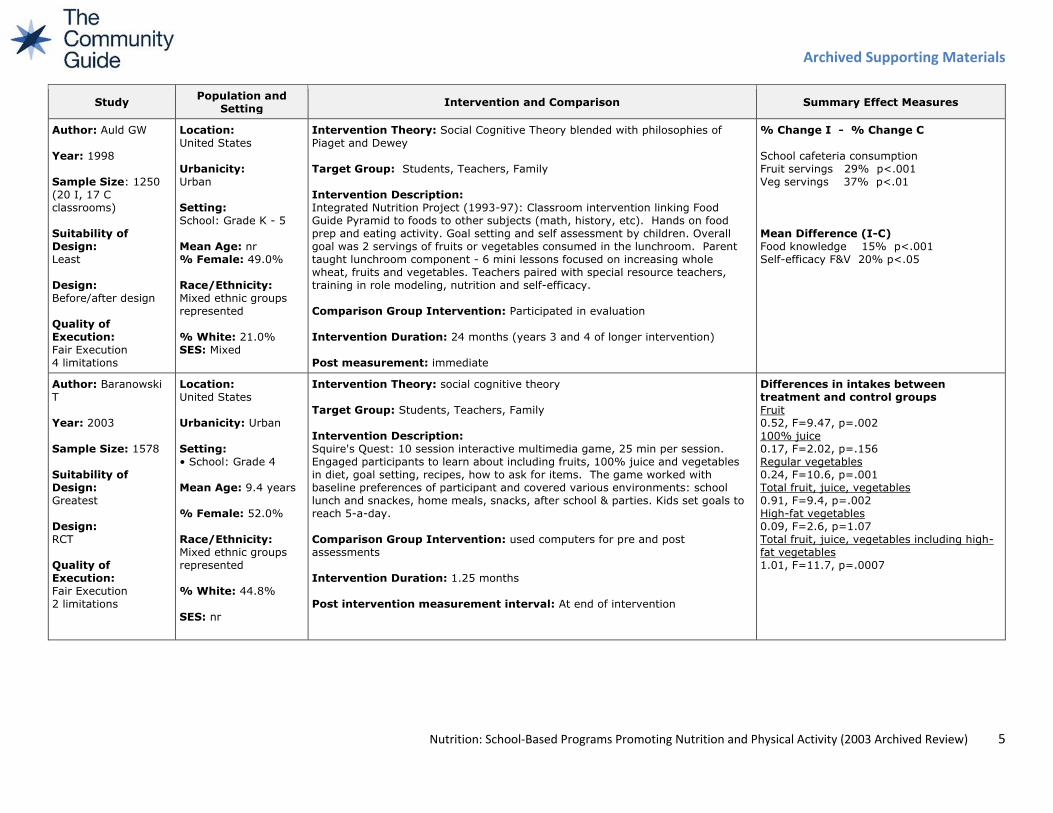
Author: Auld GW
Year: 1998
Sample Size: 1250
(20 I, 17 C
classrooms)
Suitability of
Design:
Least
Design:
Before/after design
Quality of
Execution:
Fair Execution
4 limitations
Location:
United States
Urbanicity:
Urban
Setting:
School: Grade K - 5
Mean Age: nr
% Female: 49.0%
Race/Ethnicity:
Mixed ethnic groups
represented
% White: 21.0%
SES: Mixed
Intervention Theory: Social Cognitive Theory blended with philosophies of
Piaget and Dewey
Target Group: Students, Teachers, Family
Intervention Description:
Integrated Nutrition Project (1993-97): Classroom intervention linking Food
Guide Pyramid to foods to other subjects (math, history, etc). Hands on food
prep and eating activity. Goal setting and self assessment by children. Overall
goal was 2 servings of fruits or vegetables consumed in the lunchroom. Parent
taught lunchroom component - 6 mini lessons focused on increasing whole
wheat, fruits and vegetables. Teachers paired with special resource teachers,
training in role modeling, nutrition and self-efficacy.
Comparison Group Intervention: Participated in evaluation
Intervention Duration: 24 months (years 3 and 4 of longer intervention)
Post measurement: immediate
% Change I - % Change C
School cafeteria consumption
Fruit servings 29% p<.001
Veg servings 37% p<.01
Mean Difference (I-C)
Food knowledge 15% p<.001
Self-efficacy F&V 20% p<.05
Author: Baranowski
T
Year: 2003
Sample Size: 1578
Suitability of
Design:
Greatest
Design:
RCT
Quality of
Execution:
Fair Execution
2 limitations
Location:
United States
Urbanicity: Urban
Setting:
• School: Grade 4
Mean Age: 9.4 years
% Female: 52.0%
Race/Ethnicity:
Mixed ethnic groups
represented
% White: 44.8%
SES: nr
Intervention Theory: social cognitive theory
Target Group: Students, Teachers, Family
Intervention Description:
Squire's Quest: 10 session interactive multimedia game, 25 min per session.
Engaged participants to learn about including fruits, 100% juice and vegetables
in diet, goal setting, recipes, how to ask for items. The game worked with
baseline preferences of participant and covered various environments: school
lunch and snackes, home meals, snacks, after school & parties. Kids set goals to
reach 5-a-day.
Comparison Group Intervention: used computers for pre and post
assessments
Intervention Duration: 1.25 months
Post intervention measurement interval: At end of intervention
Differences in intakes between
treatment and control groups
Fruit
0.52, F=9.47, p=.002
100% juice
0.17, F=2.02, p=.156
Regular vegetables
0.24, F=10.6, p=.001
Total fruit, juice, vegetables
0.91, F=9.4, p=.002
High-fat vegetables
0.09, F=2.6, p=1.07
Total fruit, juice, vegetables including high-
fat vegetables
1.01, F=11.7, p=.0007
Archived Supporting Materials
Nutrition: School-Based Programs Promoting Nutrition and Physical Activity (2003 Archived Review) 6
Study Population and
Setting Intervention and Comparison Summary Effect Measures
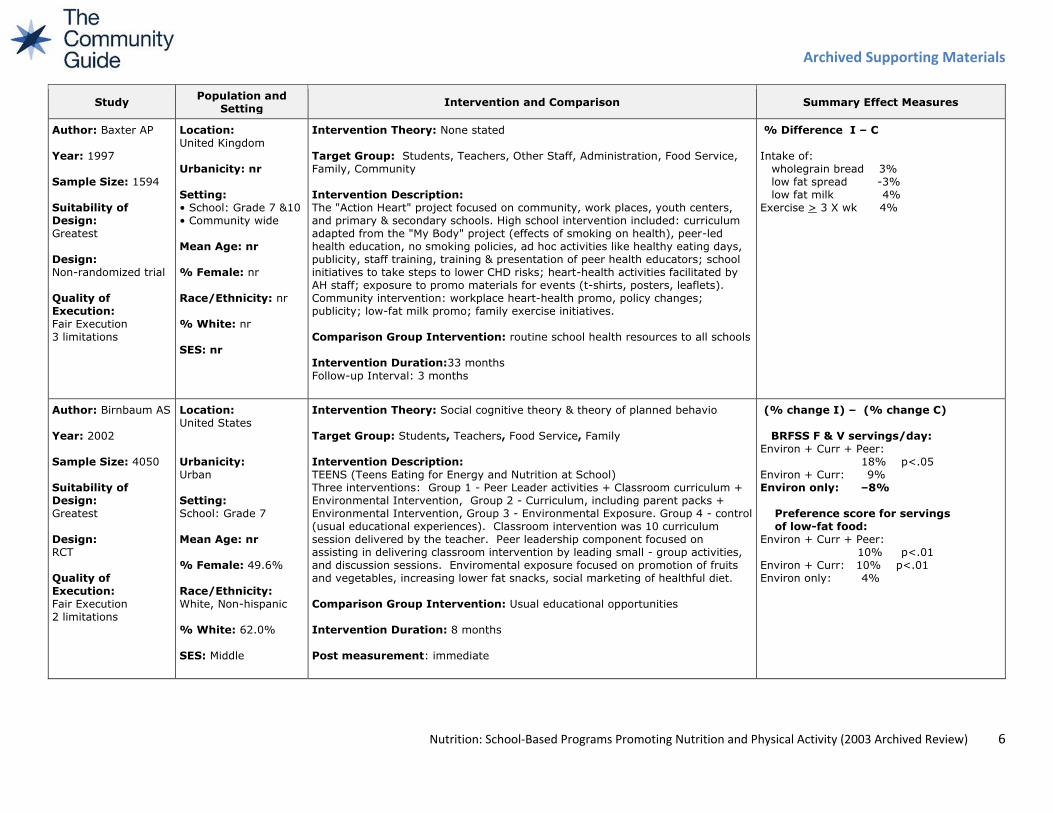
Author: Baxter AP
Year: 1997
Sample Size: 1594
Suitability of
Design:
Greatest
Design:
Non-randomized trial
Quality of
Execution:
Fair Execution
3 limitations
Location:
United Kingdom
Urbanicity: nr
Setting:
• School: Grade 7 &10
• Community wide
Mean Age: nr
% Female: nr
Race/Ethnicity: nr
% White: nr
SES: nr
Intervention Theory: None stated
Target Group: Students, Teachers, Other Staff, Administration, Food Service,
Family, Community
Intervention Description:
The "Action Heart" project focused on community, work places, youth centers,
and primary & secondary schools. High school intervention included: curriculum
adapted from the "My Body" project (effects of smoking on health), peer-led
health education, no smoking policies, ad hoc activities like healthy eating days,
publicity, staff training, training & presentation of peer health educators; school
initiatives to take steps to lower CHD risks; heart-health activities facilitated by
AH staff; exposure to promo materials for events (t-shirts, posters, leaflets).
Community intervention: workplace heart-health promo, policy changes;
publicity; low-fat milk promo; family exercise initiatives.
Comparison Group Intervention: routine school health resources to all schools
Intervention Duration:33 months
Follow-up Interval: 3 months
% Difference I – C
Intake of:
wholegrain bread 3%
low fat spread -3%
low fat milk 4%
Exercise > 3 X wk 4%
Author: Birnbaum AS
Year: 2002
Sample Size: 4050
Suitability of
Design:
Greatest
Design:
RCT
Quality of
Execution:
Fair Execution
2 limitations
Location:
United States
Urbanicity:
Urban
Setting:
School: Grade 7
Mean Age: nr
% Female: 49.6%
Race/Ethnicity:
White, Non-hispanic
% White: 62.0%
SES: Middle
Intervention Theory: Social cognitive theory & theory of planned behavio
Target Group: Students, Teachers, Food Service, Family
Intervention Description:
TEENS (Teens Eating for Energy and Nutrition at School)
Three interventions: Group 1 - Peer Leader activities + Classroom curriculum +
Environmental Intervention, Group 2 - Curriculum, including parent packs +
Environmental Intervention, Group 3 - Environmental Exposure. Group 4 - control
(usual educational experiences). Classroom intervention was 10 curriculum
session delivered by the teacher. Peer leadership component focused on
assisting in delivering classroom intervention by leading small - group activities,
and discussion sessions. Enviromental exposure focused on promotion of fruits
and vegetables, increasing lower fat snacks, social marketing of healthful diet.
Comparison Group Intervention: Usual educational opportunities
Intervention Duration: 8 months
Post measurement: immediate
(% change I) – (% change C)
BRFSS F & V servings/day:
Environ + Curr + Peer:
18% p<.05
Environ + Curr: 9%
Environ only: –8%
Preference score for servings
of low-fat food:
Environ + Curr + Peer:
10% p<.01
Environ + Curr: 10% p<.01
Environ only: 4%
Archived Supporting Materials
Nutrition: School-Based Programs Promoting Nutrition and Physical Activity (2003 Archived Review) 7
Study Population and
Setting Intervention and Comparison Summary Effect Measures
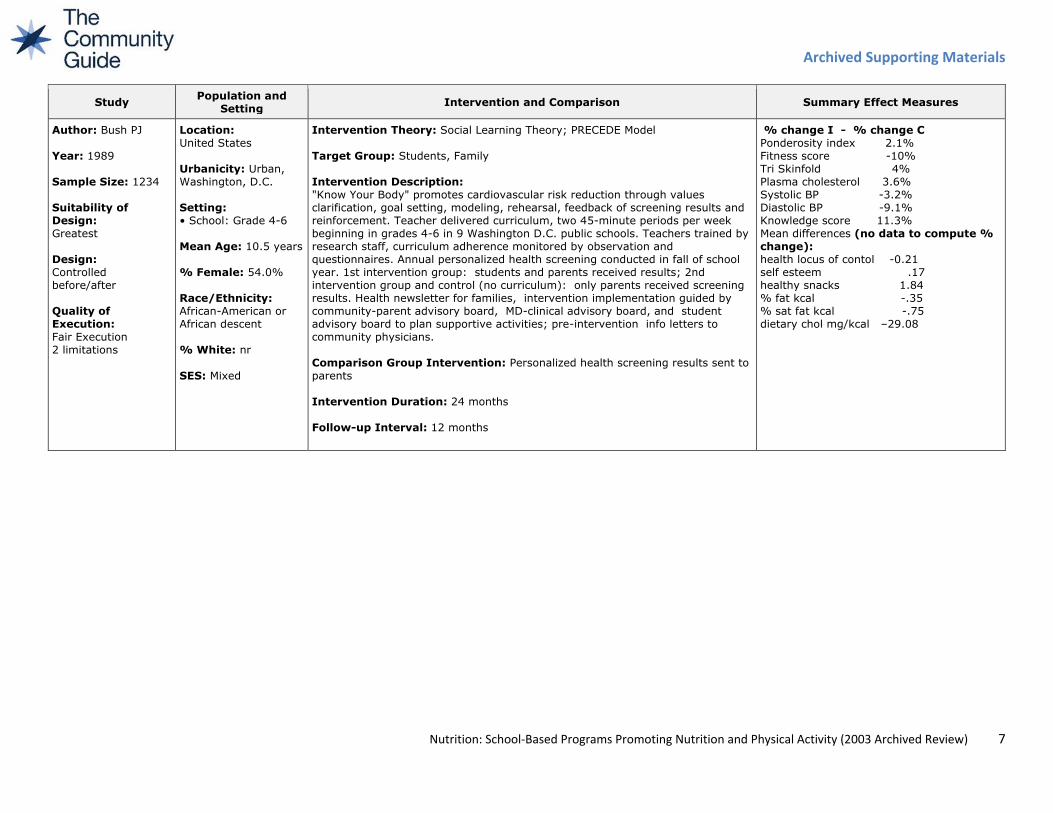
Author: Bush PJ
Year: 1989
Sample Size: 1234
Suitability of
Design:
Greatest
Design:
Controlled
before/after
Quality of
Execution:
Fair Execution
2 limitations
Location:
United States
Urbanicity: Urban,
Washington, D.C.
Setting:
• School: Grade 4-6
Mean Age: 10.5 years
% Female: 54.0%
Race/Ethnicity:
African-American or
African descent
% White: nr
SES: Mixed
Intervention Theory: Social Learning Theory; PRECEDE Model
Target Group: Students, Family
Intervention Description:
"Know Your Body" promotes cardiovascular risk reduction through values
clarification, goal setting, modeling, rehearsal, feedback of screening results and
reinforcement. Teacher delivered curriculum, two 45-minute periods per week
beginning in grades 4-6 in 9 Washington D.C. public schools. Teachers trained by
research staff, curriculum adherence monitored by observation and
questionnaires. Annual personalized health screening conducted in fall of school
year. 1st intervention group: students and parents received results; 2nd
intervention group and control (no curriculum): only parents received screening
results. Health newsletter for families, intervention implementation guided by
community-parent advisory board, MD-clinical advisory board, and student
advisory board to plan supportive activities; pre-intervention info letters to
community physicians.
Comparison Group Intervention: Personalized health screening results sent to
parents
Intervention Duration: 24 months
Follow-up Interval: 12 months
% change I - % change C
Ponderosity index 2.1%
Fitness score -10%
Tri Skinfold 4%
Plasma cholesterol 3.6%
Systolic BP -3.2%
Diastolic BP -9.1%
Knowledge score 11.3%
Mean differences (no data to compute %
change):
health locus of contol -0.21
self esteem .17
healthy snacks 1.84
% fat kcal -.35
% sat fat kcal -.75
dietary chol mg/kcal –29.08
Archived Supporting Materials
Nutrition: School-Based Programs Promoting Nutrition and Physical Activity (2003 Archived Review) 8
Study Population and
Setting Intervention and Comparison Summary Effect Measures
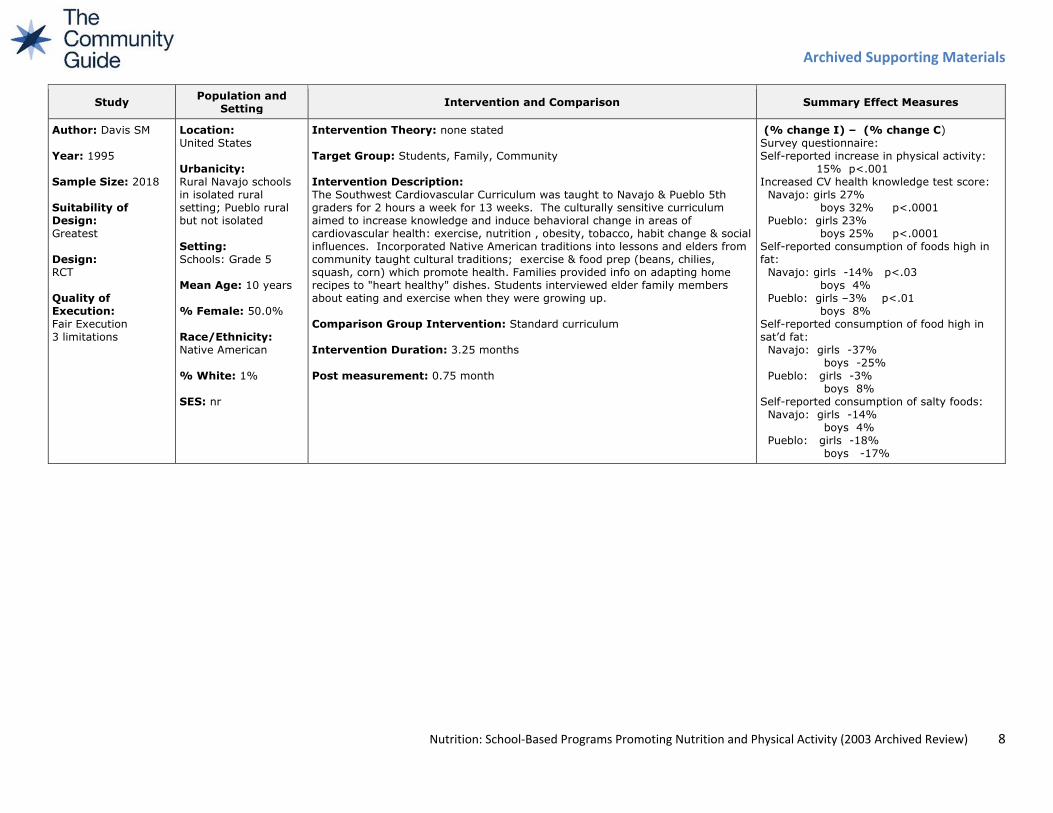
Author: Davis SM
Year: 1995
Sample Size: 2018
Suitability of
Design:
Greatest
Design:
RCT
Quality of
Execution:
Fair Execution
3 limitations
Location:
United States
Urbanicity:
Rural Navajo schools
in isolated rural
setting; Pueblo rural
but not isolated
Setting:
Schools: Grade 5
Mean Age: 10 years
% Female: 50.0%
Race/Ethnicity:
Native American
% White: 1%
SES: nr
Intervention Theory: none stated
Target Group: Students, Family, Community
Intervention Description:
The Southwest Cardiovascular Curriculum was taught to Navajo & Pueblo 5th
graders for 2 hours a week for 13 weeks. The culturally sensitive curriculum
aimed to increase knowledge and induce behavioral change in areas of
cardiovascular health: exercise, nutrition , obesity, tobacco, habit change & social
influences. Incorporated Native American traditions into lessons and elders from
community taught cultural traditions; exercise & food prep (beans, chilies,
squash, corn) which promote health. Families provided info on adapting home
recipes to "heart healthy" dishes. Students interviewed elder family members
about eating and exercise when they were growing up.
Comparison Group Intervention: Standard curriculum
Intervention Duration: 3.25 months
Post measurement: 0.75 month
(% change I) – (% change C)
Survey questionnaire:
Self-reported increase in physical activity:
15% p<.001
Increased CV health knowledge test score:
Navajo: girls 27%
boys 32% p<.0001
Pueblo: girls 23%
boys 25% p<.0001
Self-reported consumption of foods high in
fat:
Navajo: girls -14% p<.03
boys 4%
Pueblo: girls –3% p<.01
boys 8%
Self-reported consumption of food high in
sat’d fat:
Navajo: girls -37%
boys -25%
Pueblo: girls -3%
boys 8%
Self-reported consumption of salty foods:
Navajo: girls -14%
boys 4%
Pueblo: girls -18%
boys -17%
Archived Supporting Materials
Nutrition: School-Based Programs Promoting Nutrition and Physical Activity (2003 Archived Review) 9
Study Population and
Setting Intervention and Comparison Summary Effect Measures
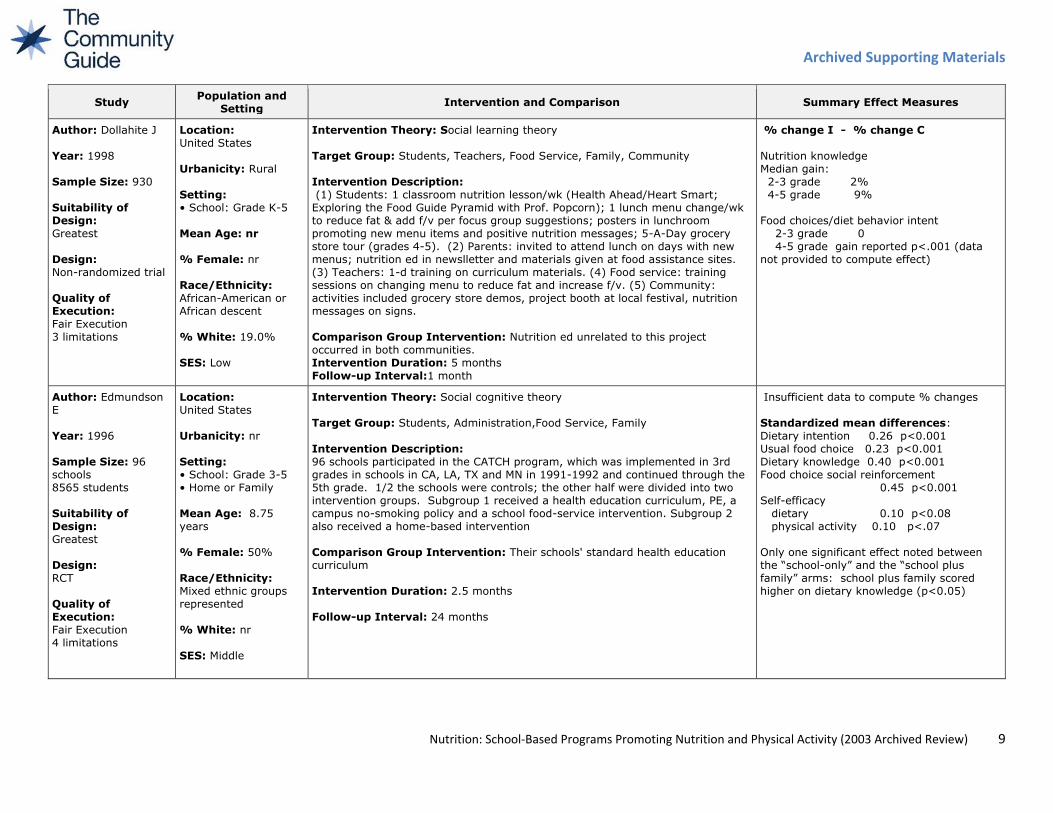
Author: Dollahite J
Year: 1998
Sample Size: 930
Suitability of
Design:
Greatest
Design:
Non-randomized trial
Quality of
Execution:
Fair Execution
3 limitations
Location:
United States
Urbanicity: Rural
Setting:
• School: Grade K-5
Mean Age: nr
% Female: nr
Race/Ethnicity:
African-American or
African descent
% White: 19.0%
SES: Low
Intervention Theory: Social learning theory
Target Group: Students, Teachers, Food Service, Family, Community
Intervention Description:
(1) Students: 1 classroom nutrition lesson/wk (Health Ahead/Heart Smart;
Exploring the Food Guide Pyramid with Prof. Popcorn); 1 lunch menu change/wk
to reduce fat & add f/v per focus group suggestions; posters in lunchroom
promoting new menu items and positive nutrition messages; 5-A-Day grocery
store tour (grades 4-5). (2) Parents: invited to attend lunch on days with new
menus; nutrition ed in newslletter and materials given at food assistance sites.
(3) Teachers: 1-d training on curriculum materials. (4) Food service: training
sessions on changing menu to reduce fat and increase f/v. (5) Community:
activities included grocery store demos, project booth at local festival, nutrition
messages on signs.
Comparison Group Intervention: Nutrition ed unrelated to this project
occurred in both communities.
Intervention Duration: 5 months
Follow-up Interval:1 month
% change I - % change C
Nutrition knowledge
Median gain:
2-3 grade 2%
4-5 grade 9%
Food choices/diet behavior intent
2-3 grade 0
4-5 grade gain reported p<.001 (data
not provided to compute effect)
Author: Edmundson
E
Year: 1996
Sample Size: 96
schools
8565 students
Suitability of
Design:
Greatest
Design:
RCT
Quality of
Execution:
Fair Execution
4 limitations
Location:
United States
Urbanicity: nr
Setting:
• School: Grade 3-5
• Home or Family
Mean Age: 8.75
years
% Female: 50%
Race/Ethnicity:
Mixed ethnic groups
represented
% White: nr
SES: Middle
Intervention Theory: Social cognitive theory
Target Group: Students, Administration,Food Service, Family
Intervention Description:
96 schools participated in the CATCH program, which was implemented in 3rd
grades in schools in CA, LA, TX and MN in 1991-1992 and continued through the
5th grade. 1/2 the schools were controls; the other half were divided into two
intervention groups. Subgroup 1 received a health education curriculum, PE, a
campus no-smoking policy and a school food-service intervention. Subgroup 2
also received a home-based intervention
Comparison Group Intervention: Their schools' standard health education
curriculum
Intervention Duration: 2.5 months
Follow-up Interval: 24 months
Insufficient data to compute % changes
Standardized mean differences:
Dietary intention 0.26 p<0.001
Usual food choice 0.23 p<0.001
Dietary knowledge 0.40 p<0.001
Food choice social reinforcement
0.45 p<0.001
Self-efficacy
dietary 0.10 p<0.08
physical activity 0.10 p<.07
Only one significant effect noted between
the “school-only” and the “school plus
family” arms: school plus family scored
higher on dietary knowledge (p<0.05)
Archived Supporting Materials
Nutrition: School-Based Programs Promoting Nutrition and Physical Activity (2003 Archived Review) 10
Study Population and
Setting Intervention and Comparison Summary Effect Measures
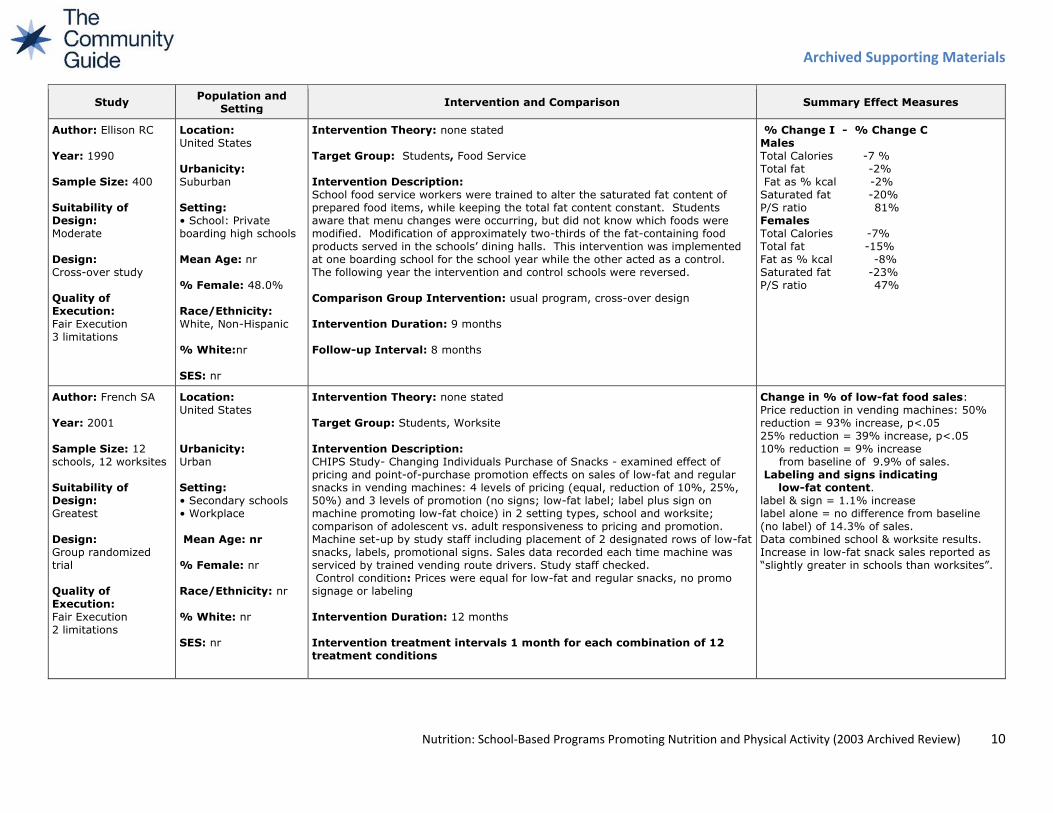
Author: Ellison RC
Year: 1990
Sample Size: 400
Suitability of
Design:
Moderate
Design:
Cross-over study
Quality of
Execution:
Fair Execution
3 limitations
Location:
United States
Urbanicity:
Suburban
Setting:
• School: Private
boarding high schools
Mean Age: nr
% Female: 48.0%
Race/Ethnicity:
White, Non-Hispanic
% White:nr
SES: nr
Intervention Theory: none stated
Target Group: Students, Food Service
Intervention Description:
School food service workers were trained to alter the saturated fat content of
prepared food items, while keeping the total fat content constant. Students
aware that menu changes were occurring, but did not know which foods were
modified. Modification of approximately two-thirds of the fat-containing food
products served in the schools’ dining halls. This intervention was implemented
at one boarding school for the school year while the other acted as a control.
The following year the intervention and control schools were reversed.
Comparison Group Intervention: usual program, cross-over design
Intervention Duration: 9 months
Follow-up Interval: 8 months
% Change I - % Change C
Males
Total Calories -7 %
Total fat -2%
Fat as % kcal -2%
Saturated fat -20%
P/S ratio 81%
Females
Total Calories -7%
Total fat -15%
Fat as % kcal -8%
Saturated fat -23%
P/S ratio 47%
Author: French SA
Year: 2001
Sample Size: 12
schools, 12 worksites
Suitability of
Design:
Greatest
Design:
Group randomized
trial
Quality of
Execution:
Fair Execution
2 limitations
Location:
United States
Urbanicity:
Urban
Setting:
• Secondary schools
• Workplace
Mean Age: nr
% Female: nr
Race/Ethnicity: nr
% White: nr
SES: nr
Intervention Theory: none stated
Target Group: Students, Worksite
Intervention Description:
CHIPS Study- Changing Individuals Purchase of Snacks - examined effect of
pricing and point-of-purchase promotion effects on sales of low-fat and regular
snacks in vending machines: 4 levels of pricing (equal, reduction of 10%, 25%,
50%) and 3 levels of promotion (no signs; low-fat label; label plus sign on
machine promoting low-fat choice) in 2 setting types, school and worksite;
comparison of adolescent vs. adult responsiveness to pricing and promotion.
Machine set-up by study staff including placement of 2 designated rows of low-fat
snacks, labels, promotional signs. Sales data recorded each time machine was
serviced by trained vending route drivers. Study staff checked.
Control condition: Prices were equal for low-fat and regular snacks, no promo
signage or labeling
Intervention Duration: 12 months
Intervention treatment intervals 1 month for each combination of 12
treatment conditions
Change in % of low-fat food sales:
Price reduction in vending machines: 50%
reduction = 93% increase, p<.05
25% reduction = 39% increase, p<.05
10% reduction = 9% increase
from baseline of 9.9% of sales.
Labeling and signs indicating
low-fat content.
label & sign = 1.1% increase
label alone = no difference from baseline
(no label) of 14.3% of sales.
Data combined school & worksite results.
Increase in low-fat snack sales reported as
“slightly greater in schools than worksites”.
Archived Supporting Materials
Nutrition: School-Based Programs Promoting Nutrition and Physical Activity (2003 Archived Review) 11
Study Population and
Setting Intervention and Comparison Summary Effect Measures
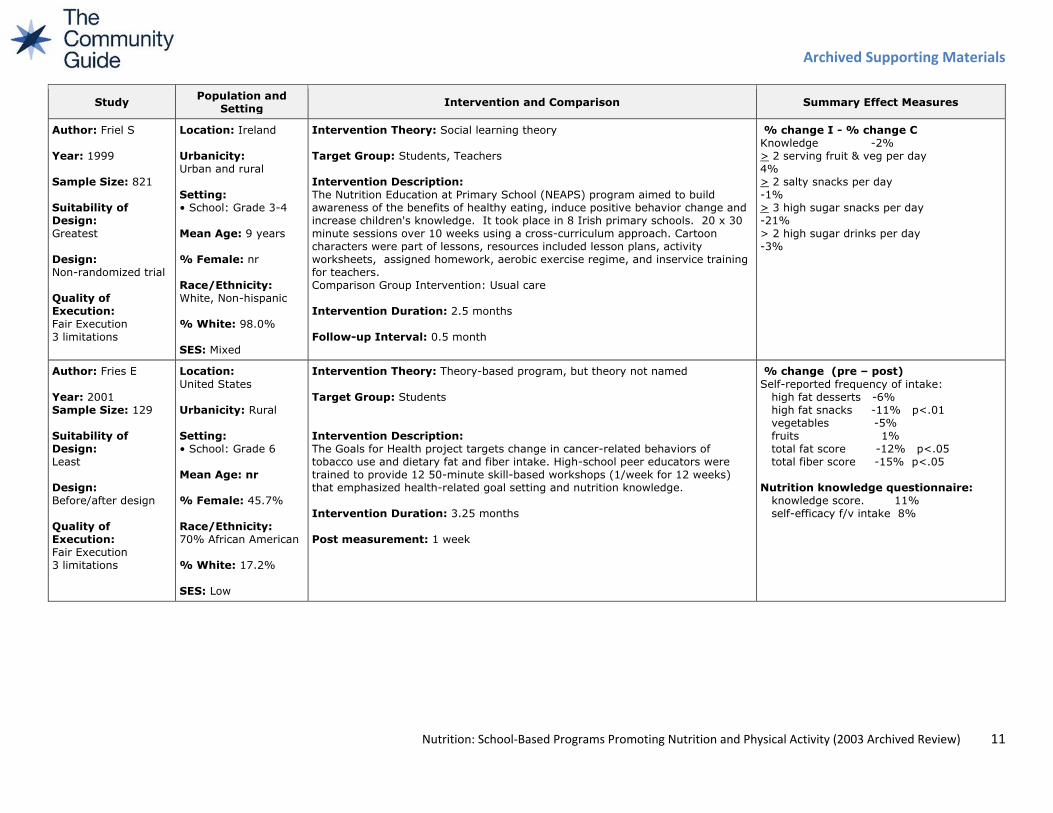
Author: Friel S
Year: 1999
Sample Size: 821
Suitability of
Design:
Greatest
Design:
Non-randomized trial
Quality of
Execution:
Fair Execution
3 limitations
Location: Ireland
Urbanicity:
Urban and rural
Setting:
• School: Grade 3-4
Mean Age: 9 years
% Female: nr
Race/Ethnicity:
White, Non-hispanic
% White: 98.0%
SES: Mixed
Intervention Theory: Social learning theory
Target Group: Students, Teachers
Intervention Description:
The Nutrition Education at Primary School (NEAPS) program aimed to build
awareness of the benefits of healthy eating, induce positive behavior change and
increase children's knowledge. It took place in 8 Irish primary schools. 20 x 30
minute sessions over 10 weeks using a cross-curriculum approach. Cartoon
characters were part of lessons, resources included lesson plans, activity
worksheets, assigned homework, aerobic exercise regime, and inservice training
for teachers.
Comparison Group Intervention: Usual care
Intervention Duration: 2.5 months
Follow-up Interval: 0.5 month
% change I - % change C
Knowledge -2%
> 2 serving fruit & veg per day
4%
> 2 salty snacks per day
-1%
> 3 high sugar snacks per day
-21%
> 2 high sugar drinks per day
-3%
Author: Fries E
Year: 2001
Sample Size: 129
Suitability of
Design:
Least
Design:
Before/after design
Quality of
Execution:
Fair Execution
3 limitations
Location:
United States
Urbanicity: Rural
Setting:
• School: Grade 6
Mean Age: nr
% Female: 45.7%
Race/Ethnicity:
70% African American
% White: 17.2%
SES: Low
Intervention Theory: Theory-based program, but theory not named
Target Group: Students
Intervention Description:
The Goals for Health project targets change in cancer-related behaviors of
tobacco use and dietary fat and fiber intake. High-school peer educators were
trained to provide 12 50-minute skill-based workshops (1/week for 12 weeks)
that emphasized health-related goal setting and nutrition knowledge.
Intervention Duration: 3.25 months
Post measurement: 1 week
% change (pre – post)
Self-reported frequency of intake:
high fat desserts -6%
high fat snacks -11% p<.01
vegetables -5%
fruits 1%
total fat score -12% p<.05
total fiber score -15% p<.05
Nutrition knowledge questionnaire:
knowledge score. 11%
self-efficacy f/v intake 8%
Archived Supporting Materials
Nutrition: School-Based Programs Promoting Nutrition and Physical Activity (2003 Archived Review) 12
Study Population and
Setting Intervention and Comparison Summary Effect Measures
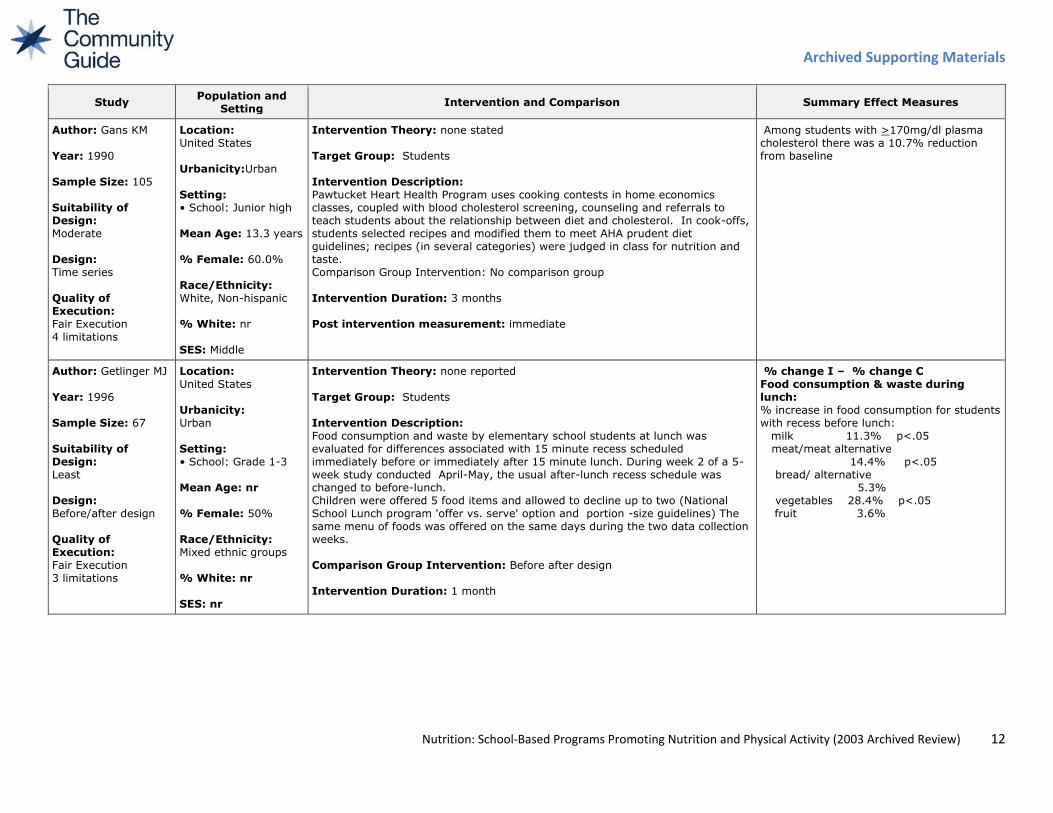
Author: Gans KM
Year: 1990
Sample Size: 105
Suitability of
Design:
Moderate
Design:
Time series
Quality of
Execution:
Fair Execution
4 limitations
Location:
United States
Urbanicity:Urban
Setting:
• School: Junior high
Mean Age: 13.3 years
% Female: 60.0%
Race/Ethnicity:
White, Non-hispanic
% White: nr
SES: Middle
Intervention Theory: none stated
Target Group: Students
Intervention Description:
Pawtucket Heart Health Program uses cooking contests in home economics
classes, coupled with blood cholesterol screening, counseling and referrals to
teach students about the relationship between diet and cholesterol. In cook-offs,
students selected recipes and modified them to meet AHA prudent diet
guidelines; recipes (in several categories) were judged in class for nutrition and
taste.
Comparison Group Intervention: No comparison group
Intervention Duration: 3 months
Post intervention measurement: immediate
Among students with >170mg/dl plasma
cholesterol there was a 10.7% reduction
from baseline
Author: Getlinger MJ
Year: 1996
Sample Size: 67
Suitability of
Design:
Least
Design:
Before/after design
Quality of
Execution:
Fair Execution
3 limitations
Location:
United States
Urbanicity:
Urban
Setting:
• School: Grade 1-3
Mean Age: nr
% Female: 50%
Race/Ethnicity:
Mixed ethnic groups
% White: nr
SES: nr
Intervention Theory: none reported
Target Group: Students
Intervention Description:
Food consumption and waste by elementary school students at lunch was
evaluated for differences associated with 15 minute recess scheduled
immediately before or immediately after 15 minute lunch. During week 2 of a 5-
week study conducted April-May, the usual after-lunch recess schedule was
changed to before-lunch.
Children were offered 5 food items and allowed to decline up to two (National
School Lunch program 'offer vs. serve' option and portion -size guidelines) The
same menu of foods was offered on the same days during the two data collection
weeks.
Comparison Group Intervention: Before after design
Intervention Duration: 1 month
% change I – % change C
Food consumption & waste during
lunch:
% increase in food consumption for students
with recess before lunch:
milk 11.3% p<.05
meat/meat alternative
14.4% p<.05
bread/ alternative
5.3%
vegetables 28.4% p<.05
fruit 3.6%
Archived Supporting Materials
Nutrition: School-Based Programs Promoting Nutrition and Physical Activity (2003 Archived Review) 13
Study Population and
Setting Intervention and Comparison Summary Effect Measures
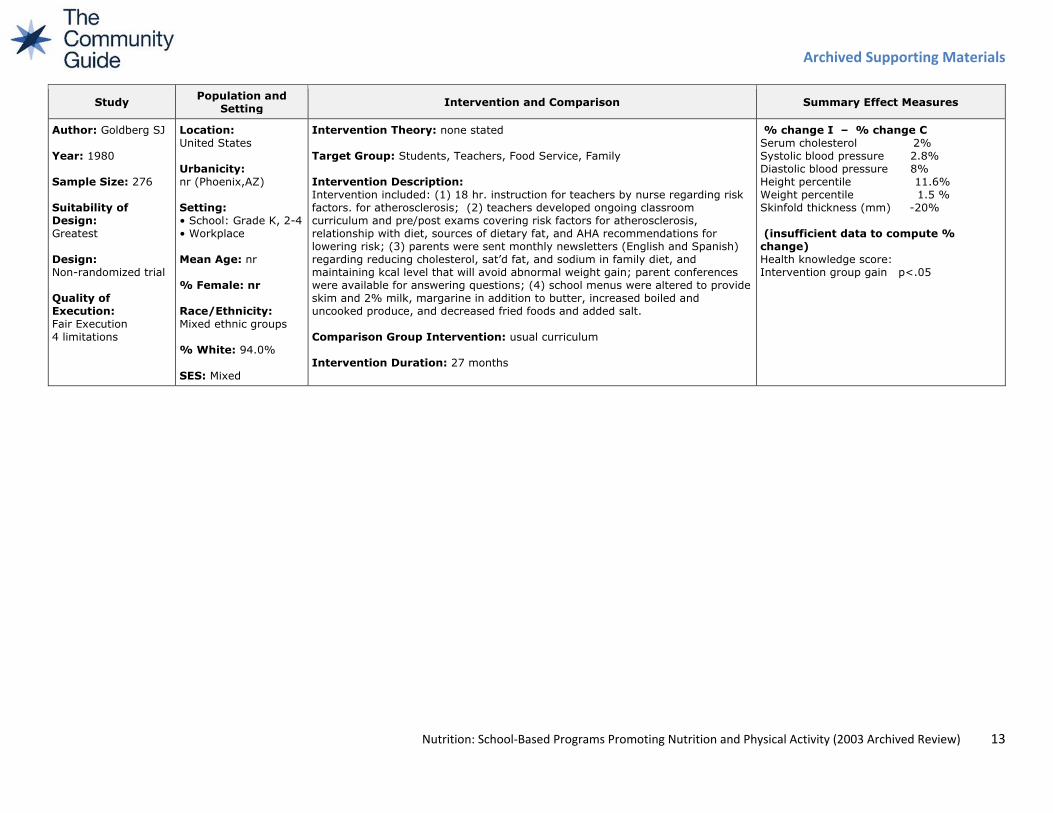
Author: Goldberg SJ
Year: 1980
Sample Size: 276
Suitability of
Design:
Greatest
Design:
Non-randomized trial
Quality of
Execution:
Fair Execution
4 limitations
Location:
United States
Urbanicity:
nr (Phoenix,AZ)
Setting:
• School: Grade K, 2-4
• Workplace
Mean Age: nr
% Female: nr
Race/Ethnicity:
Mixed ethnic groups
% White: 94.0%
SES: Mixed
Intervention Theory: none stated
Target Group: Students, Teachers, Food Service, Family
Intervention Description:
Intervention included: (1) 18 hr. instruction for teachers by nurse regarding risk
factors. for atherosclerosis; (2) teachers developed ongoing classroom
curriculum and pre/post exams covering risk factors for atherosclerosis,
relationship with diet, sources of dietary fat, and AHA recommendations for
lowering risk; (3) parents were sent monthly newsletters (English and Spanish)
regarding reducing cholesterol, sat’d fat, and sodium in family diet, and
maintaining kcal level that will avoid abnormal weight gain; parent conferences
were available for answering questions; (4) school menus were altered to provide
skim and 2% milk, margarine in addition to butter, increased boiled and
uncooked produce, and decreased fried foods and added salt.
Comparison Group Intervention: usual curriculum
Intervention Duration: 27 months
% change I – % change C
Serum cholesterol 2%
Systolic blood pressure 2.8%
Diastolic blood pressure 8%
Height percentile 11.6%
Weight percentile 1.5 %
Skinfold thickness (mm) -20%
(insufficient data to compute %
change)
Health knowledge score:
Intervention group gain p<.05
Archived Supporting Materials
Nutrition: School-Based Programs Promoting Nutrition and Physical Activity (2003 Archived Review) 14
Study Population and
Setting Intervention and Comparison Summary Effect Measures
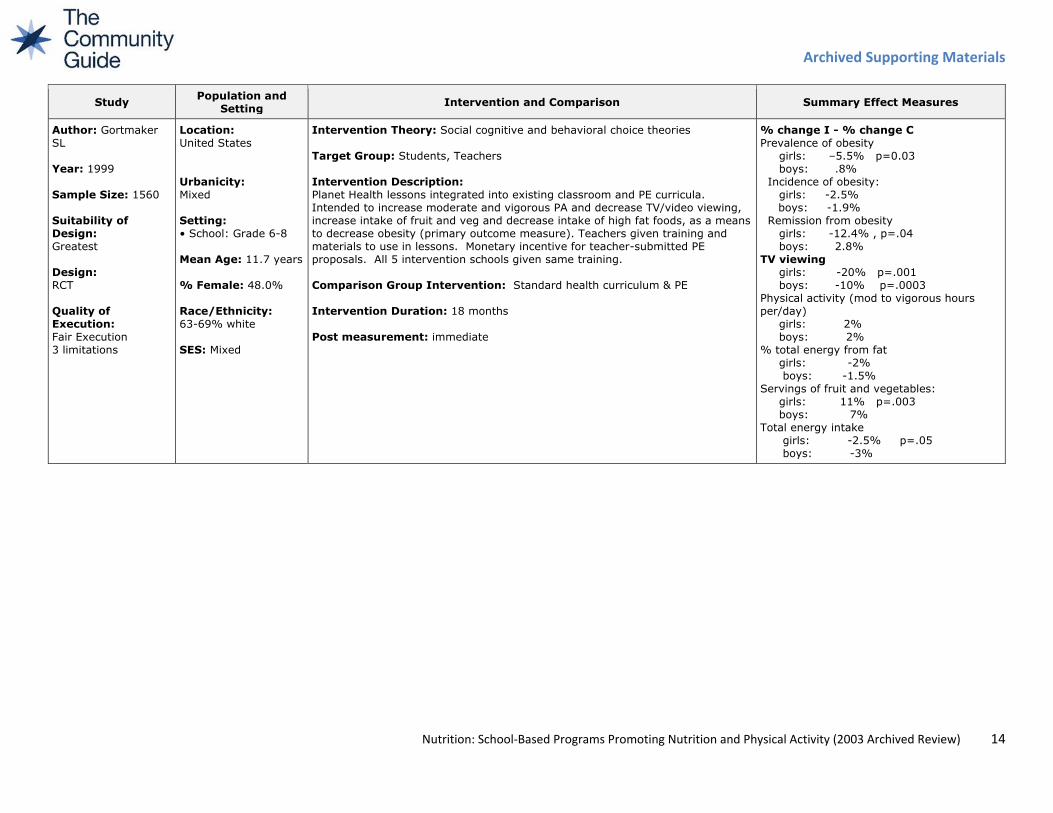
Author: Gortmaker
SL
Year: 1999
Sample Size: 1560
Suitability of
Design:
Greatest
Design:
RCT
Quality of
Execution:
Fair Execution
3 limitations
Location:
United States
Urbanicity:
Mixed
Setting:
• School: Grade 6-8
Mean Age: 11.7 years
% Female: 48.0%
Race/Ethnicity:
63-69% white
SES: Mixed
Intervention Theory: Social cognitive and behavioral choice theories
Target Group: Students, Teachers
Intervention Description:
Planet Health lessons integrated into existing classroom and PE curricula.
Intended to increase moderate and vigorous PA and decrease TV/video viewing,
increase intake of fruit and veg and decrease intake of high fat foods, as a means
to decrease obesity (primary outcome measure). Teachers given training and
materials to use in lessons. Monetary incentive for teacher-submitted PE
proposals. All 5 intervention schools given same training.
Comparison Group Intervention: Standard health curriculum & PE
Intervention Duration: 18 months
Post measurement: immediate
% change I - % change C
Prevalence of obesity
girls: –5.5% p=0.03
boys: .8%
Incidence of obesity:
girls: -2.5%
boys: -1.9%
Remission from obesity
girls: -12.4% , p=.04
boys: 2.8%
TV viewing
girls: -20% p=.001
boys: -10% p=.0003
Physical activity (mod to vigorous hours
per/day)
girls: 2%
boys: 2%
% total energy from fat
girls: -2%
boys: -1.5%
Servings of fruit and vegetables:
girls: 11% p=.003
boys: 7%
Total energy intake
girls: -2.5% p=.05
boys: -3%
Archived Supporting Materials
Nutrition: School-Based Programs Promoting Nutrition and Physical Activity (2003 Archived Review) 15
Study Population and
Setting Intervention and Comparison Summary Effect Measures
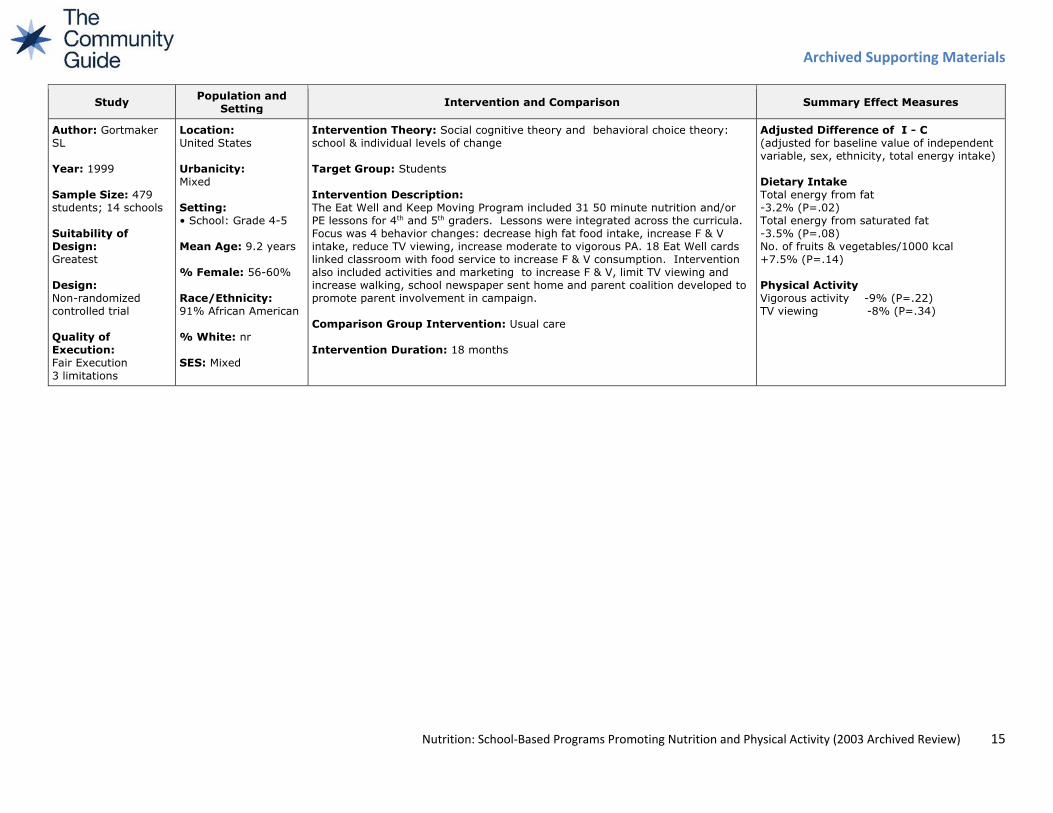
Author: Gortmaker
SL
Year: 1999
Sample Size: 479
students; 14 schools
Suitability of
Design:
Greatest
Design:
Non-randomized
controlled trial
Quality of
Execution:
Fair Execution
3 limitations
Location:
United States
Urbanicity:
Mixed
Setting:
• School: Grade 4-5
Mean Age: 9.2 years
% Female: 56-60%
Race/Ethnicity:
91% African American
% White: nr
SES: Mixed
Intervention Theory: Social cognitive theory and behavioral choice theory:
school & individual levels of change
Target Group: Students
Intervention Description:
The Eat Well and Keep Moving Program included 31 50 minute nutrition and/or
PE lessons for 4th and 5th graders. Lessons were integrated across the curricula.
Focus was 4 behavior changes: decrease high fat food intake, increase F & V
intake, reduce TV viewing, increase moderate to vigorous PA. 18 Eat Well cards
linked classroom with food service to increase F & V consumption. Intervention
also included activities and marketing to increase F & V, limit TV viewing and
increase walking, school newspaper sent home and parent coalition developed to
promote parent involvement in campaign.
Comparison Group Intervention: Usual care
Intervention Duration: 18 months
Adjusted Difference of I - C
(adjusted for baseline value of independent
variable, sex, ethnicity, total energy intake)
Dietary Intake
Total energy from fat
-3.2% (P=.02)
Total energy from saturated fat
-3.5% (P=.08)
No. of fruits & vegetables/1000 kcal
+7.5% (P=.14)
Physical Activity
Vigorous activity -9% (P=.22)
TV viewing -8% (P=.34)
Archived Supporting Materials
Nutrition: School-Based Programs Promoting Nutrition and Physical Activity (2003 Archived Review) 16
Study Population and
Setting Intervention and Comparison Summary Effect Measures
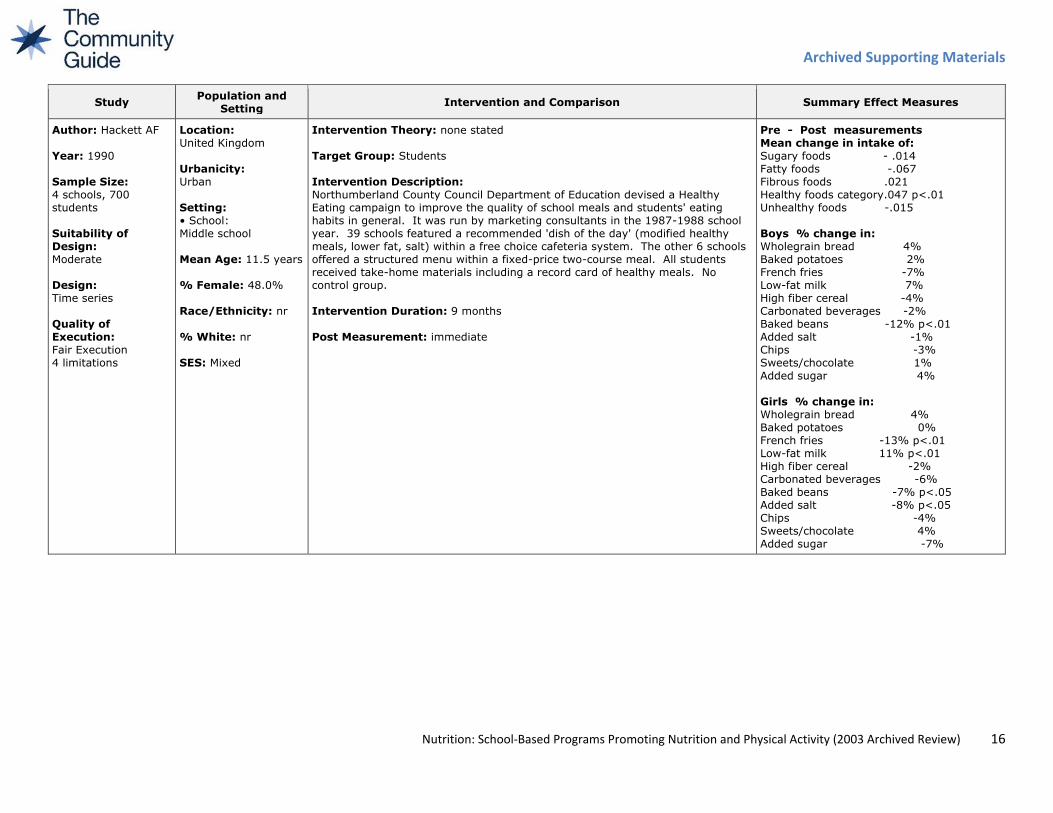
Author: Hackett AF
Year: 1990
Sample Size:
4 schools, 700
students
Suitability of
Design:
Moderate
Design:
Time series
Quality of
Execution:
Fair Execution
4 limitations
Location:
United Kingdom
Urbanicity:
Urban
Setting:
• School:
Middle school
Mean Age: 11.5 years
% Female: 48.0%
Race/Ethnicity: nr
% White: nr
SES: Mixed
Intervention Theory: none stated
Target Group: Students
Intervention Description:
Northumberland County Council Department of Education devised a Healthy
Eating campaign to improve the quality of school meals and students' eating
habits in general. It was run by marketing consultants in the 1987-1988 school
year. 39 schools featured a recommended 'dish of the day' (modified healthy
meals, lower fat, salt) within a free choice cafeteria system. The other 6 schools
offered a structured menu within a fixed-price two-course meal. All students
received take-home materials including a record card of healthy meals. No
control group.
Intervention Duration: 9 months
Post Measurement: immediate
Pre - Post measurements
Mean change in intake of:
Sugary foods - .014
Fatty foods -.067
Fibrous foods .021
Healthy foods category.047 p<.01
Unhealthy foods -.015
Boys % change in:
Wholegrain bread 4%
Baked potatoes 2%
French fries -7%
Low-fat milk 7%
High fiber cereal -4%
Carbonated beverages -2%
Baked beans -12% p<.01
Added salt -1%
Chips -3%
Sweets/chocolate 1%
Added sugar 4%
Girls % change in:
Wholegrain bread 4%
Baked potatoes 0%
French fries -13% p<.01
Low-fat milk 11% p<.01
High fiber cereal -2%
Carbonated beverages -6%
Baked beans -7% p<.05
Added salt -8% p<.05
Chips -4%
Sweets/chocolate 4%
Added sugar -7%
Archived Supporting Materials
Nutrition: School-Based Programs Promoting Nutrition and Physical Activity (2003 Archived Review) 17
Study Population and
Setting Intervention and Comparison Summary Effect Measures
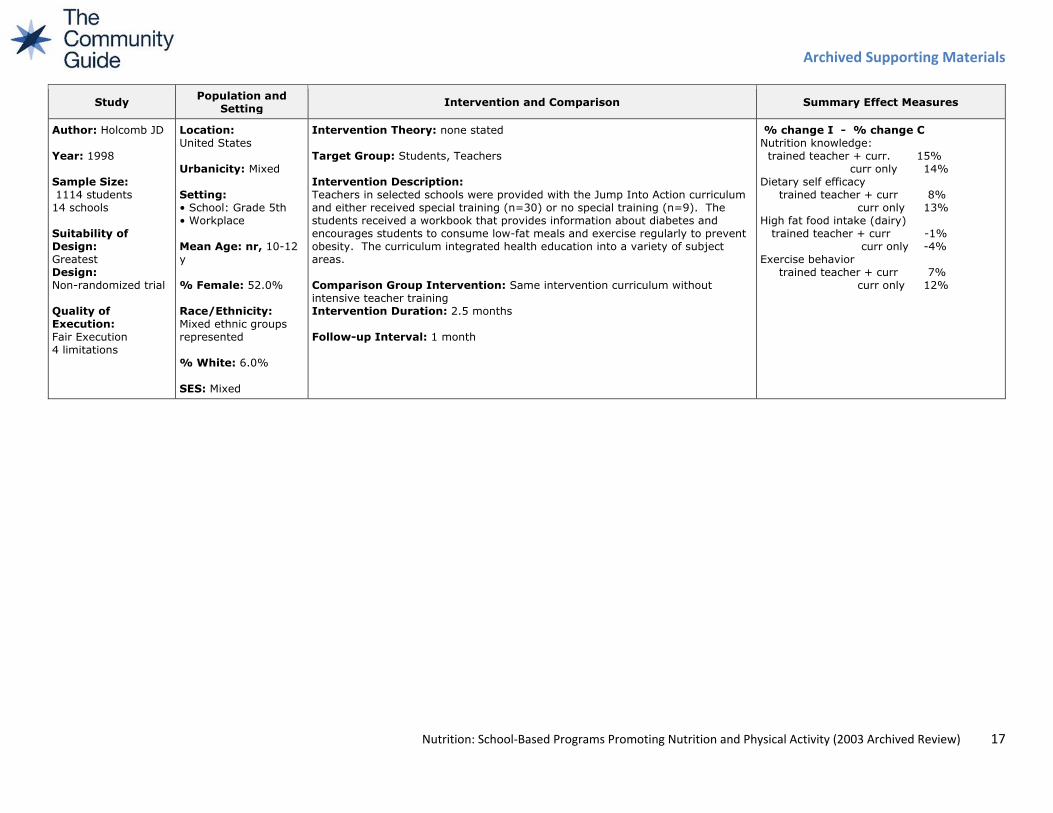
Author: Holcomb JD
Year: 1998
Sample Size:
1114 students
14 schools
Suitability of
Design:
Greatest
Design:
Non-randomized trial
Quality of
Execution:
Fair Execution
4 limitations
Location:
United States
Urbanicity: Mixed
Setting:
• School: Grade 5th
• Workplace
Mean Age: nr, 10-12
y
% Female: 52.0%
Race/Ethnicity:
Mixed ethnic groups
represented
% White: 6.0%
SES: Mixed
Intervention Theory: none stated
Target Group: Students, Teachers
Intervention Description:
Teachers in selected schools were provided with the Jump Into Action curriculum
and either received special training (n=30) or no special training (n=9). The
students received a workbook that provides information about diabetes and
encourages students to consume low-fat meals and exercise regularly to prevent
obesity. The curriculum integrated health education into a variety of subject
areas.
Comparison Group Intervention: Same intervention curriculum without
intensive teacher training
Intervention Duration: 2.5 months
Follow-up Interval: 1 month
% change I - % change C
Nutrition knowledge:
trained teacher + curr. 15%
curr only 14%
Dietary self efficacy
trained teacher + curr 8%
curr only 13%
High fat food intake (dairy)
trained teacher + curr -1%
curr only -4%
Exercise behavior
trained teacher + curr 7%
curr only 12%
Archived Supporting Materials
Nutrition: School-Based Programs Promoting Nutrition and Physical Activity (2003 Archived Review) 18
Study Population and
Setting Intervention and Comparison Summary Effect Measures
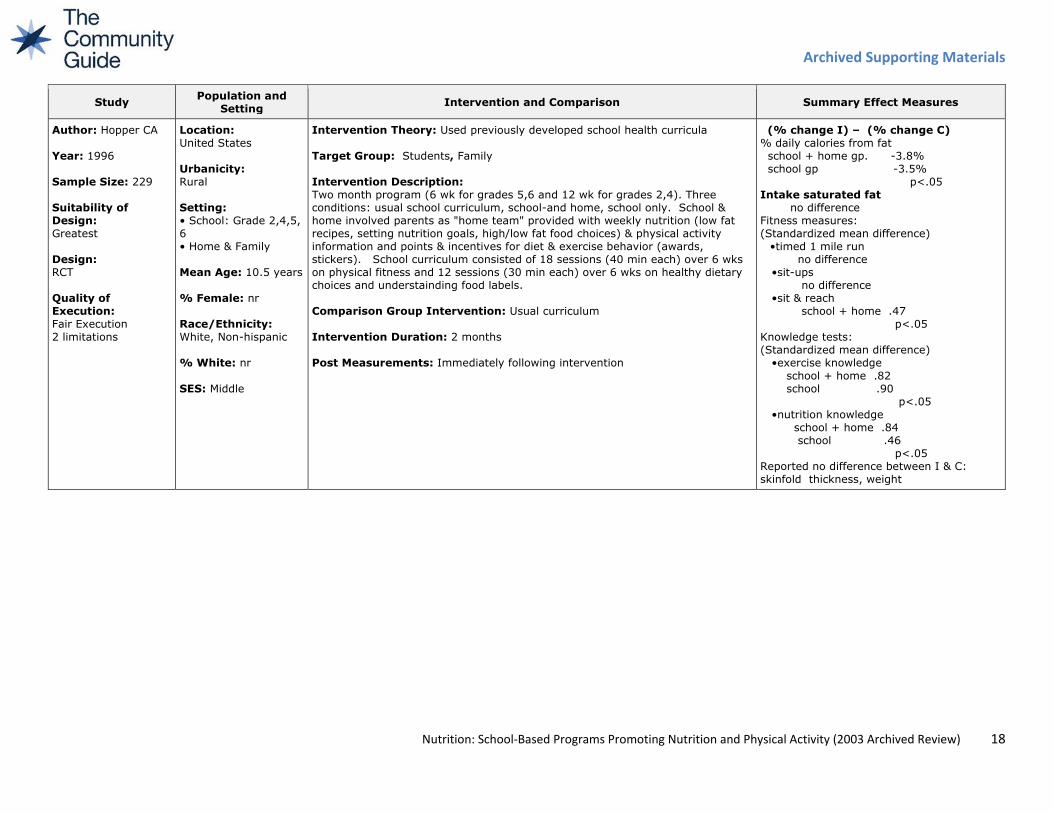
Author: Hopper CA
Year: 1996
Sample Size: 229
Suitability of
Design:
Greatest
Design:
RCT
Quality of
Execution:
Fair Execution
2 limitations
Location:
United States
Urbanicity:
Rural
Setting:
• School: Grade 2,4,5,
6
• Home & Family
Mean Age: 10.5 years
% Female: nr
Race/Ethnicity:
White, Non-hispanic
% White: nr
SES: Middle
Intervention Theory: Used previously developed school health curricula
Target Group: Students, Family
Intervention Description:
Two month program (6 wk for grades 5,6 and 12 wk for grades 2,4). Three
conditions: usual school curriculum, school-and home, school only. School &
home involved parents as "home team" provided with weekly nutrition (low fat
recipes, setting nutrition goals, high/low fat food choices) & physical activity
information and points & incentives for diet & exercise behavior (awards,
stickers). School curriculum consisted of 18 sessions (40 min each) over 6 wks
on physical fitness and 12 sessions (30 min each) over 6 wks on healthy dietary
choices and understainding food labels.
Comparison Group Intervention: Usual curriculum
Intervention Duration: 2 months
Post Measurements: Immediately following intervention
(% change I) – (% change C)
% daily calories from fat
school + home gp. -3.8%
school gp -3.5%
p<.05
Intake saturated fat
no difference
Fitness measures:
(Standardized mean difference)
•timed 1 mile run
no difference
•sit-ups
no difference
•sit & reach
school + home .47
p<.05
Knowledge tests:
(Standardized mean difference)
•exercise knowledge
school + home .82
school .90
p<.05
•nutrition knowledge
school + home .84
school .46
p<.05
Reported no difference between I & C:
skinfold thickness, weight
Archived Supporting Materials
Nutrition: School-Based Programs Promoting Nutrition and Physical Activity (2003 Archived Review) 19
Study Population and
Setting Intervention and Comparison Summary Effect Measures
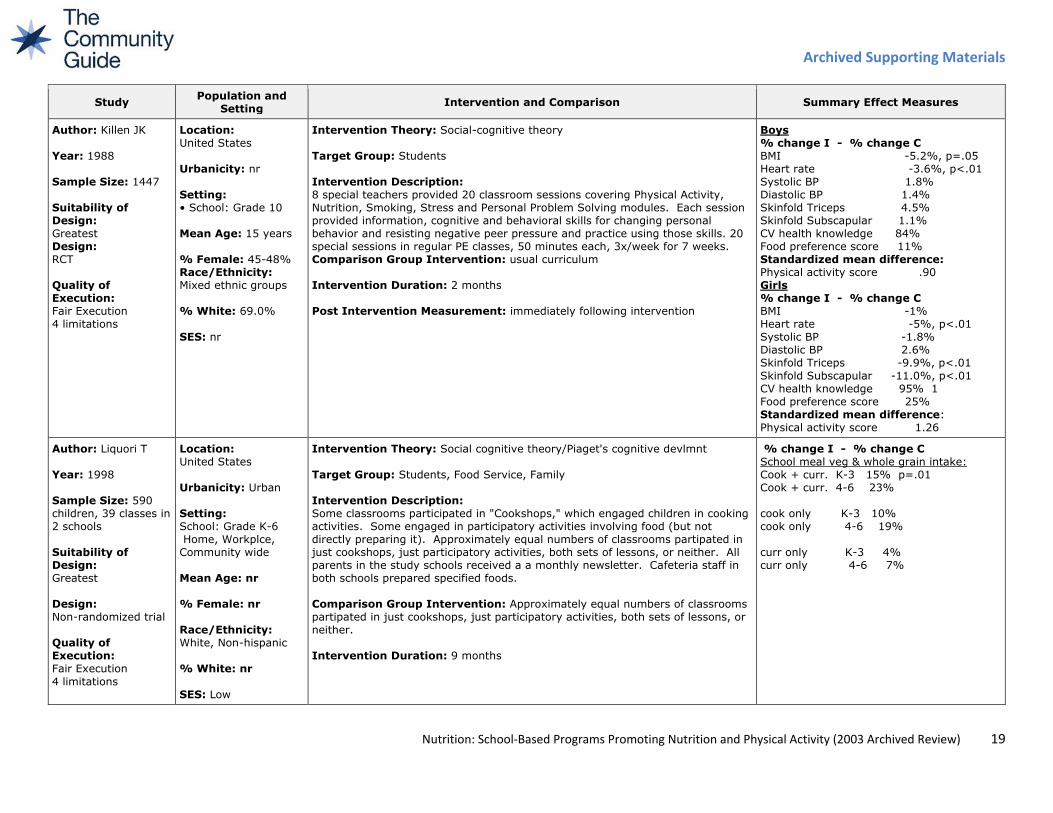
Author: Killen JK
Year: 1988
Sample Size: 1447
Suitability of
Design:
Greatest
Design:
RCT
Quality of
Execution:
Fair Execution
4 limitations
Location:
United States
Urbanicity: nr
Setting:
• School: Grade 10
Mean Age: 15 years
% Female: 45-48%
Race/Ethnicity:
Mixed ethnic groups
% White: 69.0%
SES: nr
Intervention Theory: Social-cognitive theory
Target Group: Students
Intervention Description:
8 special teachers provided 20 classroom sessions covering Physical Activity,
Nutrition, Smoking, Stress and Personal Problem Solving modules. Each session
provided information, cognitive and behavioral skills for changing personal
behavior and resisting negative peer pressure and practice using those skills. 20
special sessions in regular PE classes, 50 minutes each, 3x/week for 7 weeks.
Comparison Group Intervention: usual curriculum
Intervention Duration: 2 months
Post Intervention Measurement: immediately following intervention
Boys
% change I - % change C
BMI -5.2%, p=.05
Heart rate -3.6%, p<.01
Systolic BP 1.8%
Diastolic BP 1.4%
Skinfold Triceps 4.5%
Skinfold Subscapular 1.1%
CV health knowledge 84%
Food preference score 11%
Standardized mean difference:
Physical activity score .90
Girls
% change I - % change C
BMI -1%
Heart rate -5%, p<.01
Systolic BP -1.8%
Diastolic BP 2.6%
Skinfold Triceps -9.9%, p<.01
Skinfold Subscapular -11.0%, p<.01
CV health knowledge 95% 1
Food preference score 25%
Standardized mean difference:
Physical activity score 1.26
Author: Liquori T
Year: 1998
Sample Size: 590
children, 39 classes in
2 schools
Suitability of
Design:
Greatest
Design:
Non-randomized trial
Quality of
Execution:
Fair Execution
4 limitations
Location:
United States
Urbanicity: Urban
Setting:
School: Grade K-6
Home, Workplce,
Community wide
Mean Age: nr
% Female: nr
Race/Ethnicity:
White, Non-hispanic
% White: nr
SES: Low
Intervention Theory: Social cognitive theory/Piaget's cognitive devlmnt
Target Group: Students, Food Service, Family
Intervention Description:
Some classrooms participated in "Cookshops," which engaged children in cooking
activities. Some engaged in participatory activities involving food (but not
directly preparing it). Approximately equal numbers of classrooms partipated in
just cookshops, just participatory activities, both sets of lessons, or neither. All
parents in the study schools received a a monthly newsletter. Cafeteria staff in
both schools prepared specified foods.
Comparison Group Intervention: Approximately equal numbers of classrooms
partipated in just cookshops, just participatory activities, both sets of lessons, or
neither.
Intervention Duration: 9 months
% change I - % change C
School meal veg & whole grain intake:
Cook + curr. K-3 15% p=.01
Cook + curr. 4-6 23%
cook only K-3 10%
cook only 4-6 19%
curr only K-3 4%
curr only 4-6 7%
Archived Supporting Materials
Nutrition: School-Based Programs Promoting Nutrition and Physical Activity (2003 Archived Review) 20
Study Population and
Setting Intervention and Comparison Summary Effect Measures
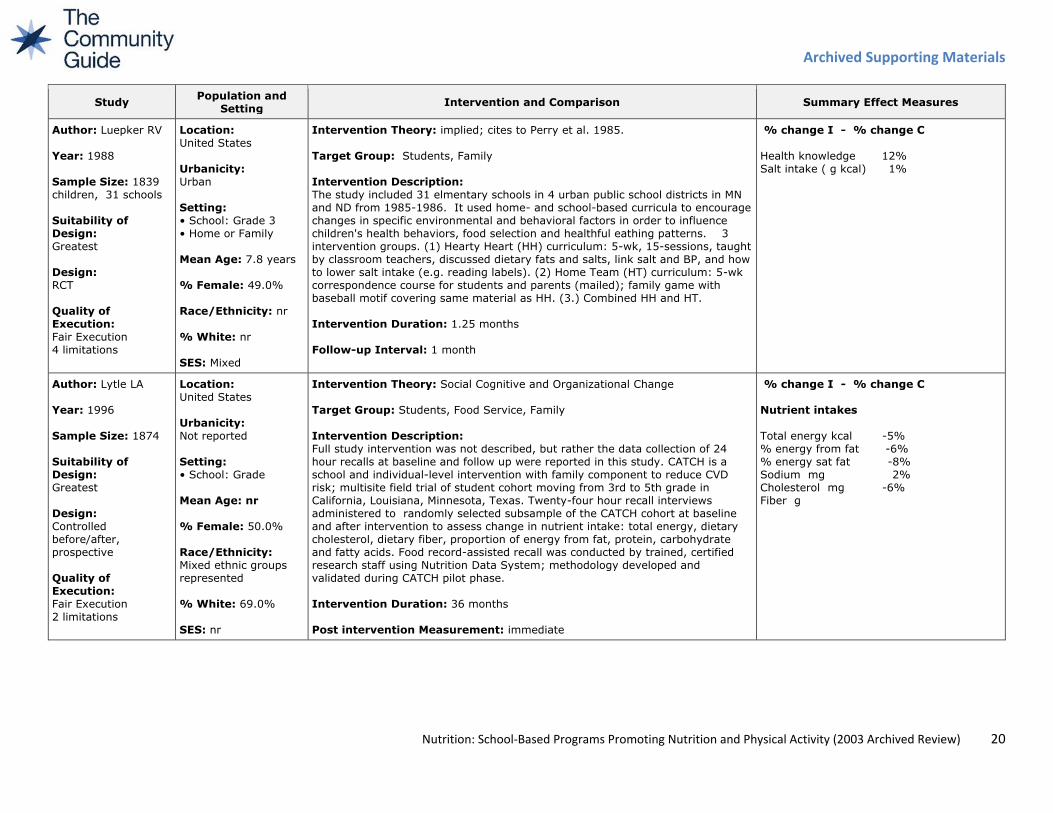
Author: Luepker RV
Year: 1988
Sample Size: 1839
children, 31 schools
Suitability of
Design:
Greatest
Design:
RCT
Quality of
Execution:
Fair Execution
4 limitations
Location:
United States
Urbanicity:
Urban
Setting:
• School: Grade 3
• Home or Family
Mean Age: 7.8 years
% Female: 49.0%
Race/Ethnicity: nr
% White: nr
SES: Mixed
Intervention Theory: implied; cites to Perry et al. 1985.
Target Group: Students, Family
Intervention Description:
The study included 31 elmentary schools in 4 urban public school districts in MN
and ND from 1985-1986. It used home- and school-based curricula to encourage
changes in specific environmental and behavioral factors in order to influence
children's health behaviors, food selection and healthful eathing patterns. 3
intervention groups. (1) Hearty Heart (HH) curriculum: 5-wk, 15-sessions, taught
by classroom teachers, discussed dietary fats and salts, link salt and BP, and how
to lower salt intake (e.g. reading labels). (2) Home Team (HT) curriculum: 5-wk
correspondence course for students and parents (mailed); family game with
baseball motif covering same material as HH. (3.) Combined HH and HT.
Intervention Duration: 1.25 months
Follow-up Interval: 1 month
% change I - % change C
Health knowledge 12%
Salt intake ( g kcal) 1%
Author: Lytle LA
Year: 1996
Sample Size: 1874
Suitability of
Design:
Greatest
Design:
Controlled
before/after,
prospective
Quality of
Execution:
Fair Execution
2 limitations
Location:
United States
Urbanicity:
Not reported
Setting:
• School: Grade
Mean Age: nr
% Female: 50.0%
Race/Ethnicity:
Mixed ethnic groups
represented
% White: 69.0%
SES: nr
Intervention Theory: Social Cognitive and Organizational Change
Target Group: Students, Food Service, Family
Intervention Description:
Full study intervention was not described, but rather the data collection of 24
hour recalls at baseline and follow up were reported in this study. CATCH is a
school and individual-level intervention with family component to reduce CVD
risk; multisite field trial of student cohort moving from 3rd to 5th grade in
California, Louisiana, Minnesota, Texas. Twenty-four hour recall interviews
administered to randomly selected subsample of the CATCH cohort at baseline
and after intervention to assess change in nutrient intake: total energy, dietary
cholesterol, dietary fiber, proportion of energy from fat, protein, carbohydrate
and fatty acids. Food record-assisted recall was conducted by trained, certified
research staff using Nutrition Data System; methodology developed and
validated during CATCH pilot phase.
Intervention Duration: 36 months
Post intervention Measurement: immediate
% change I - % change C
Nutrient intakes
Total energy kcal -5%
% energy from fat -6%
% energy sat fat -8%
Sodium mg 2%
Cholesterol mg -6%
Fiber g
Archived Supporting Materials
Nutrition: School-Based Programs Promoting Nutrition and Physical Activity (2003 Archived Review) 21
Study Population and
Setting Intervention and Comparison Summary Effect Measures
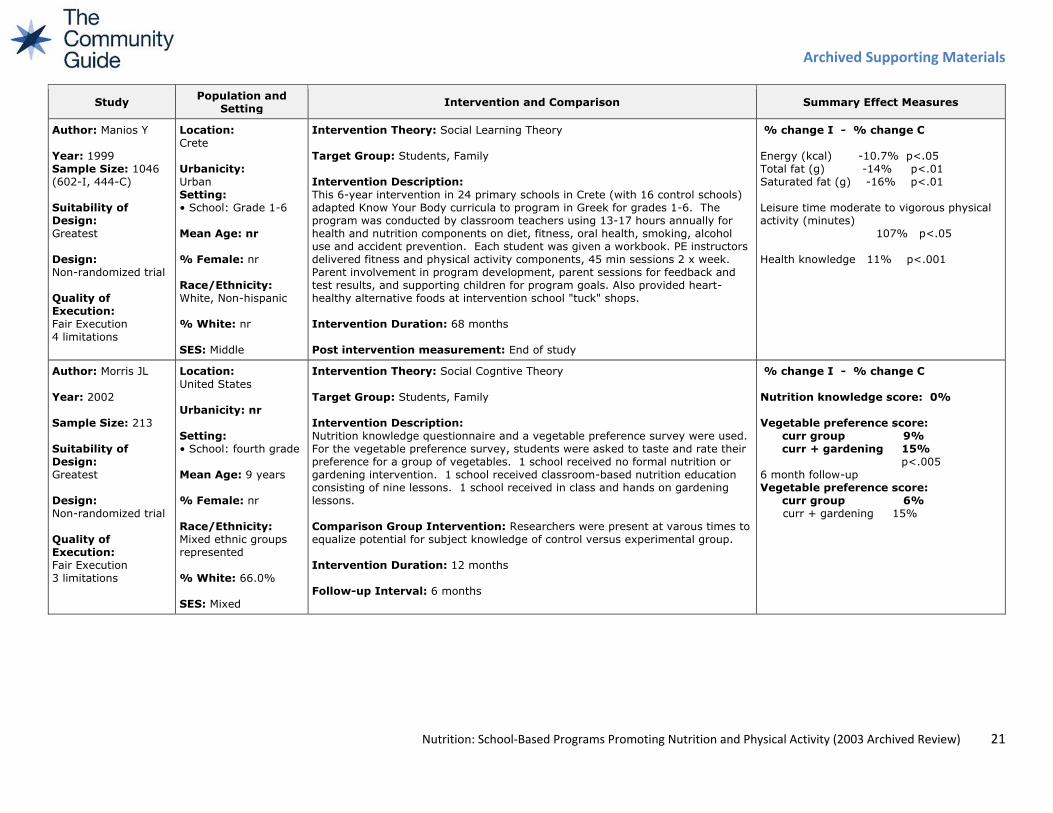
Author: Manios Y
Year: 1999
Sample Size: 1046
(602-I, 444-C)
Suitability of
Design:
Greatest
Design:
Non-randomized trial
Quality of
Execution:
Fair Execution
4 limitations
Location:
Crete
Urbanicity:
Urban
Setting:
• School: Grade 1-6
Mean Age: nr
% Female: nr
Race/Ethnicity:
White, Non-hispanic
% White: nr
SES: Middle
Intervention Theory: Social Learning Theory
Target Group: Students, Family
Intervention Description:
This 6-year intervention in 24 primary schools in Crete (with 16 control schools)
adapted Know Your Body curricula to program in Greek for grades 1-6. The
program was conducted by classroom teachers using 13-17 hours annually for
health and nutrition components on diet, fitness, oral health, smoking, alcohol
use and accident prevention. Each student was given a workbook. PE instructors
delivered fitness and physical activity components, 45 min sessions 2 x week.
Parent involvement in program development, parent sessions for feedback and
test results, and supporting children for program goals. Also provided heart-
healthy alternative foods at intervention school "tuck" shops.
Intervention Duration: 68 months
Post intervention measurement: End of study
% change I - % change C
Energy (kcal) -10.7% p<.05
Total fat (g) -14% p<.01
Saturated fat (g) -16% p<.01
Leisure time moderate to vigorous physical
activity (minutes)
107% p<.05
Health knowledge 11% p<.001
Author: Morris JL
Year: 2002
Sample Size: 213
Suitability of
Design:
Greatest
Design:
Non-randomized trial
Quality of
Execution:
Fair Execution
3 limitations
Location:
United States
Urbanicity: nr
Setting:
• School: fourth grade
Mean Age: 9 years
% Female: nr
Race/Ethnicity:
Mixed ethnic groups
represented
% White: 66.0%
SES: Mixed
Intervention Theory: Social Cogntive Theory
Target Group: Students, Family
Intervention Description:
Nutrition knowledge questionnaire and a vegetable preference survey were used.
For the vegetable preference survey, students were asked to taste and rate their
preference for a group of vegetables. 1 school received no formal nutrition or
gardening intervention. 1 school received classroom-based nutrition education
consisting of nine lessons. 1 school received in class and hands on gardening
lessons.
Comparison Group Intervention: Researchers were present at varous times to
equalize potential for subject knowledge of control versus experimental group.
Intervention Duration: 12 months
Follow-up Interval: 6 months
% change I - % change C
Nutrition knowledge score: 0%
Vegetable preference score:
curr group 9%
curr + gardening 15%
p<.005
6 month follow-up
Vegetable preference score:
curr group 6%
curr + gardening 15%
Archived Supporting Materials
Nutrition: School-Based Programs Promoting Nutrition and Physical Activity (2003 Archived Review) 22
Study Population and
Setting Intervention and Comparison Summary Effect Measures
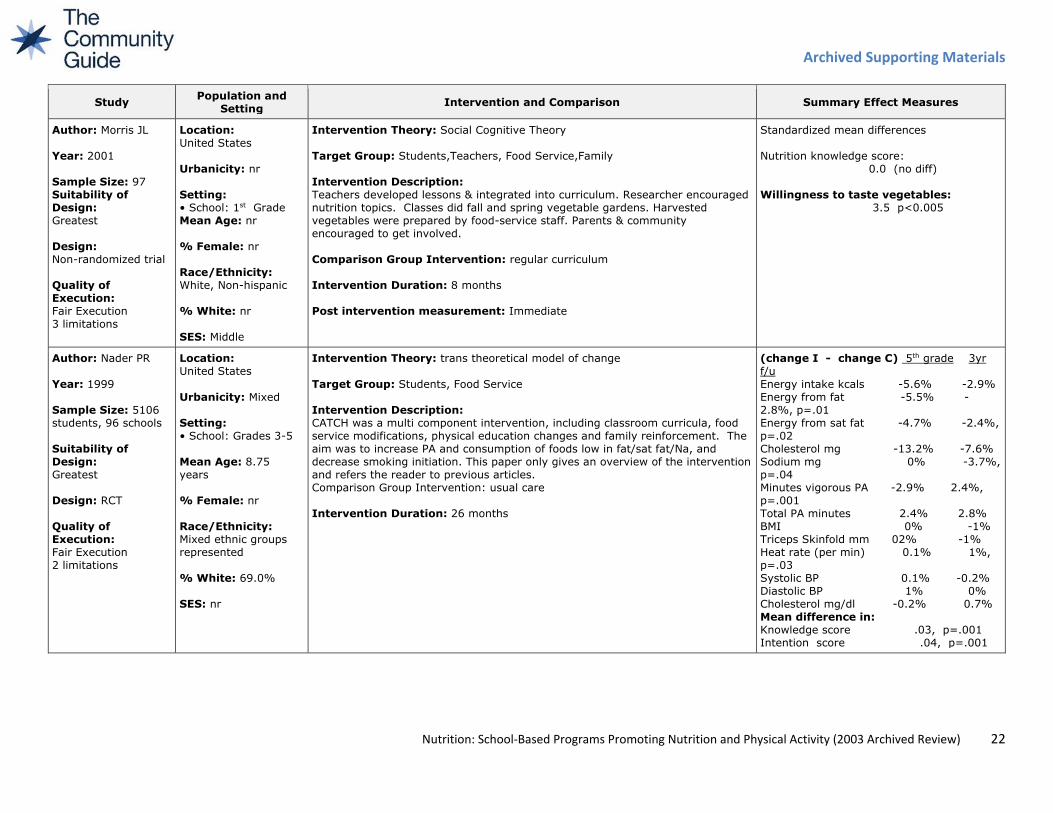
Author: Morris JL
Year: 2001
Sample Size: 97
Suitability of
Design:
Greatest
Design:
Non-randomized trial
Quality of
Execution:
Fair Execution
3 limitations
Location:
United States
Urbanicity: nr
Setting:
• School: 1st Grade
Mean Age: nr
% Female: nr
Race/Ethnicity:
White, Non-hispanic
% White: nr
SES: Middle
Intervention Theory: Social Cognitive Theory
Target Group: Students,Teachers, Food Service,Family
Intervention Description:
Teachers developed lessons & integrated into curriculum. Researcher encouraged
nutrition topics. Classes did fall and spring vegetable gardens. Harvested
vegetables were prepared by food-service staff. Parents & community
encouraged to get involved.
Comparison Group Intervention: regular curriculum
Intervention Duration: 8 months
Post intervention measurement: Immediate
Standardized mean differences
Nutrition knowledge score:
0.0 (no diff)
Willingness to taste vegetables:
3.5 p<0.005
Author: Nader PR
Year: 1999
Sample Size: 5106
students, 96 schools
Suitability of
Design:
Greatest
Design: RCT
Quality of
Execution:
Fair Execution
2 limitations
Location:
United States
Urbanicity: Mixed
Setting:
• School: Grades 3-5
Mean Age: 8.75
years
% Female: nr
Race/Ethnicity:
Mixed ethnic groups
represented
% White: 69.0%
SES: nr
Intervention Theory: trans theoretical model of change
Target Group: Students, Food Service
Intervention Description:
CATCH was a multi component intervention, including classroom curricula, food
service modifications, physical education changes and family reinforcement. The
aim was to increase PA and consumption of foods low in fat/sat fat/Na, and
decrease smoking initiation. This paper only gives an overview of the intervention
and refers the reader to previous articles.
Comparison Group Intervention: usual care
Intervention Duration: 26 months
(change I - change C) 5th grade 3yr
f/u
Energy intake kcals -5.6% -2.9%
Energy from fat -5.5% -
2.8%, p=.01
Energy from sat fat -4.7% -2.4%,
p=.02
Cholesterol mg -13.2% -7.6%
Sodium mg 0% -3.7%,
p=.04
Minutes vigorous PA -2.9% 2.4%,
p=.001
Total PA minutes 2.4% 2.8%
BMI 0% -1%
Triceps Skinfold mm 02% -1%
Heat rate (per min) 0.1% 1%,
p=.03
Systolic BP 0.1% -0.2%
Diastolic BP 1% 0%
Cholesterol mg/dl -0.2% 0.7%
Mean difference in:
Knowledge score .03, p=.001
Intention score .04, p=.001
Archived Supporting Materials
Nutrition: School-Based Programs Promoting Nutrition and Physical Activity (2003 Archived Review) 23
Study Population and
Setting Intervention and Comparison Summary Effect Measures
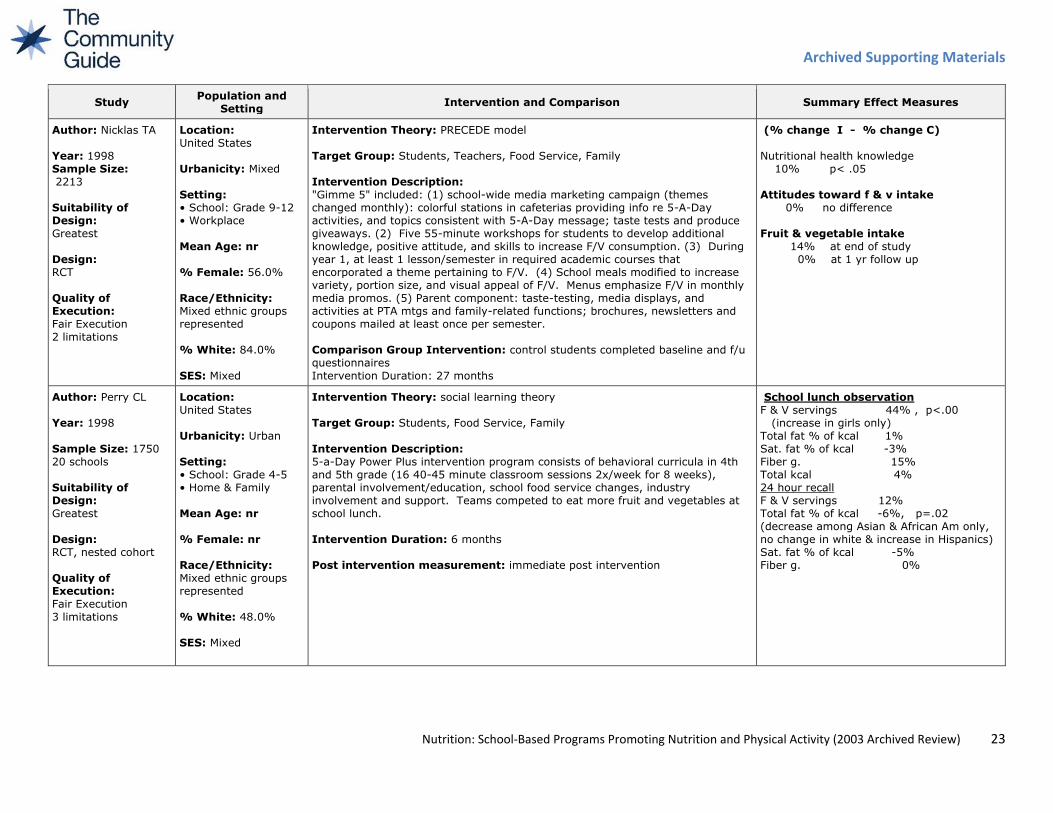
Author: Nicklas TA
Year: 1998
Sample Size:
2213
Suitability of
Design:
Greatest
Design:
RCT
Quality of
Execution:
Fair Execution
2 limitations
Location:
United States
Urbanicity: Mixed
Setting:
• School: Grade 9-12
• Workplace
Mean Age: nr
% Female: 56.0%
Race/Ethnicity:
Mixed ethnic groups
represented
% White: 84.0%
SES: Mixed
Intervention Theory: PRECEDE model
Target Group: Students, Teachers, Food Service, Family
Intervention Description:
"Gimme 5" included: (1) school-wide media marketing campaign (themes
changed monthly): colorful stations in cafeterias providing info re 5-A-Day
activities, and topics consistent with 5-A-Day message; taste tests and produce
giveaways. (2) Five 55-minute workshops for students to develop additional
knowledge, positive attitude, and skills to increase F/V consumption. (3) During
year 1, at least 1 lesson/semester in required academic courses that
encorporated a theme pertaining to F/V. (4) School meals modified to increase
variety, portion size, and visual appeal of F/V. Menus emphasize F/V in monthly
media promos. (5) Parent component: taste-testing, media displays, and
activities at PTA mtgs and family-related functions; brochures, newsletters and
coupons mailed at least once per semester.
Comparison Group Intervention: control students completed baseline and f/u
questionnaires
Intervention Duration: 27 months
(% change I - % change C)
Nutritional health knowledge
10% p< .05
Attitudes toward f & v intake
0% no difference
Fruit & vegetable intake
14% at end of study
0% at 1 yr follow up
Author: Perry CL
Year: 1998
Sample Size: 1750
20 schools
Suitability of
Design:
Greatest
Design:
RCT, nested cohort
Quality of
Execution:
Fair Execution
3 limitations
Location:
United States
Urbanicity: Urban
Setting:
• School: Grade 4-5
• Home & Family
Mean Age: nr
% Female: nr
Race/Ethnicity:
Mixed ethnic groups
represented
% White: 48.0%
SES: Mixed
Intervention Theory: social learning theory
Target Group: Students, Food Service, Family
Intervention Description:
5-a-Day Power Plus intervention program consists of behavioral curricula in 4th
and 5th grade (16 40-45 minute classroom sessions 2x/week for 8 weeks),
parental involvement/education, school food service changes, industry
involvement and support. Teams competed to eat more fruit and vegetables at
school lunch.
Intervention Duration: 6 months
Post intervention measurement: immediate post intervention
School lunch observation
F & V servings 44% , p<.00
(increase in girls only)
Total fat % of kcal 1%
Sat. fat % of kcal -3%
Fiber g. 15%
Total kcal 4%
24 hour recall
F & V servings 12%
Total fat % of kcal -6%, p=.02
(decrease among Asian & African Am only,
no change in white & increase in Hispanics)
Sat. fat % of kcal -5%
Fiber g. 0%
Archived Supporting Materials
Nutrition: School-Based Programs Promoting Nutrition and Physical Activity (2003 Archived Review) 24
Study Population and
Setting Intervention and Comparison Summary Effect Measures
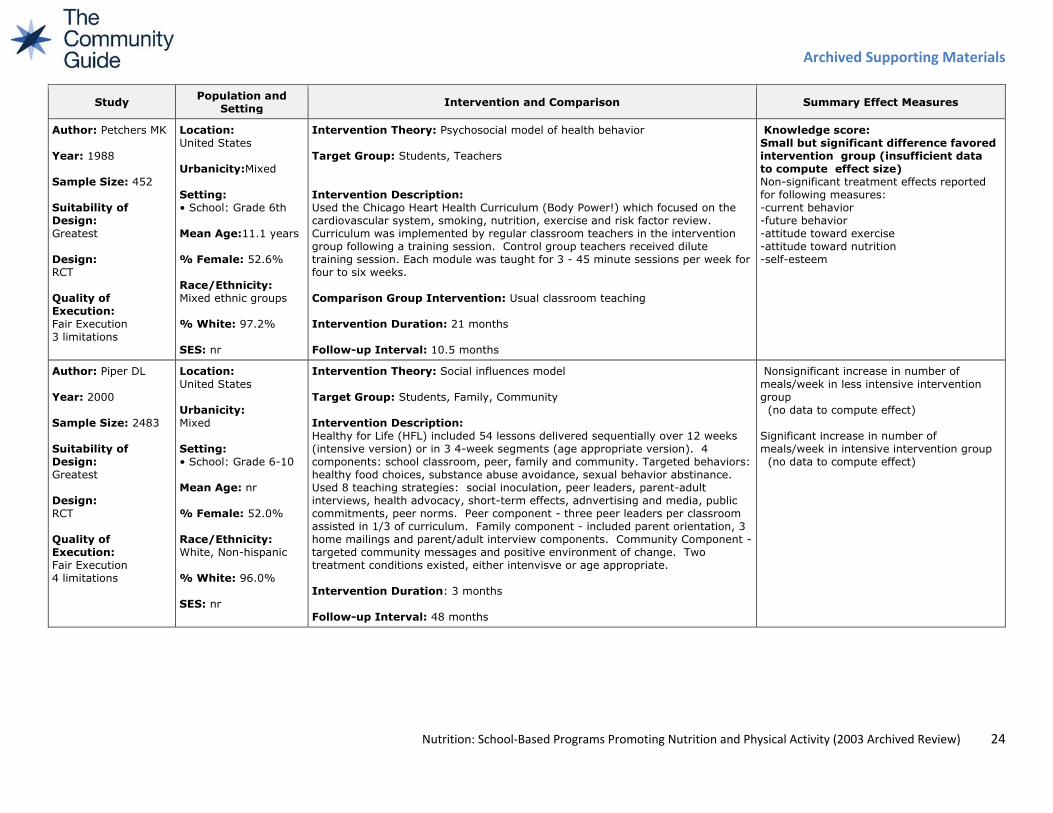
Author: Petchers MK
Year: 1988
Sample Size: 452
Suitability of
Design:
Greatest
Design:
RCT
Quality of
Execution:
Fair Execution
3 limitations
Location:
United States
Urbanicity:Mixed
Setting:
• School: Grade 6th
Mean Age:11.1 years
% Female: 52.6%
Race/Ethnicity:
Mixed ethnic groups
% White: 97.2%
SES: nr
Intervention Theory: Psychosocial model of health behavior
Target Group: Students, Teachers
Intervention Description:
Used the Chicago Heart Health Curriculum (Body Power!) which focused on the
cardiovascular system, smoking, nutrition, exercise and risk factor review.
Curriculum was implemented by regular classroom teachers in the intervention
group following a training session. Control group teachers received dilute
training session. Each module was taught for 3 - 45 minute sessions per week for
four to six weeks.
Comparison Group Intervention: Usual classroom teaching
Intervention Duration: 21 months
Follow-up Interval: 10.5 months
Knowledge score:
Small but significant difference favored
intervention group (insufficient data
to compute effect size)
Non-significant treatment effects reported
for following measures:
-current behavior
-future behavior
-attitude toward exercise
-attitude toward nutrition
-self-esteem
Author: Piper DL
Year: 2000
Sample Size: 2483
Suitability of
Design:
Greatest
Design:
RCT
Quality of
Execution:
Fair Execution
4 limitations
Location:
United States
Urbanicity:
Mixed
Setting:
• School: Grade 6-10
Mean Age: nr
% Female: 52.0%
Race/Ethnicity:
White, Non-hispanic
% White: 96.0%
SES: nr
Intervention Theory: Social influences model
Target Group: Students, Family, Community
Intervention Description:
Healthy for Life (HFL) included 54 lessons delivered sequentially over 12 weeks
(intensive version) or in 3 4-week segments (age appropriate version). 4
components: school classroom, peer, family and community. Targeted behaviors:
healthy food choices, substance abuse avoidance, sexual behavior abstinance.
Used 8 teaching strategies: social inoculation, peer leaders, parent-adult
interviews, health advocacy, short-term effects, adnvertising and media, public
commitments, peer norms. Peer component - three peer leaders per classroom
assisted in 1/3 of curriculum. Family component - included parent orientation, 3
home mailings and parent/adult interview components. Community Component -
targeted community messages and positive environment of change. Two
treatment conditions existed, either intenvisve or age appropriate.
Intervention Duration: 3 months
Follow-up Interval: 48 months
Nonsignificant increase in number of
meals/week in less intensive intervention
group
(no data to compute effect)
Significant increase in number of
meals/week in intensive intervention group
(no data to compute effect)
Archived Supporting Materials
Nutrition: School-Based Programs Promoting Nutrition and Physical Activity (2003 Archived Review) 25
Study Population and
Setting Intervention and Comparison Summary Effect Measures
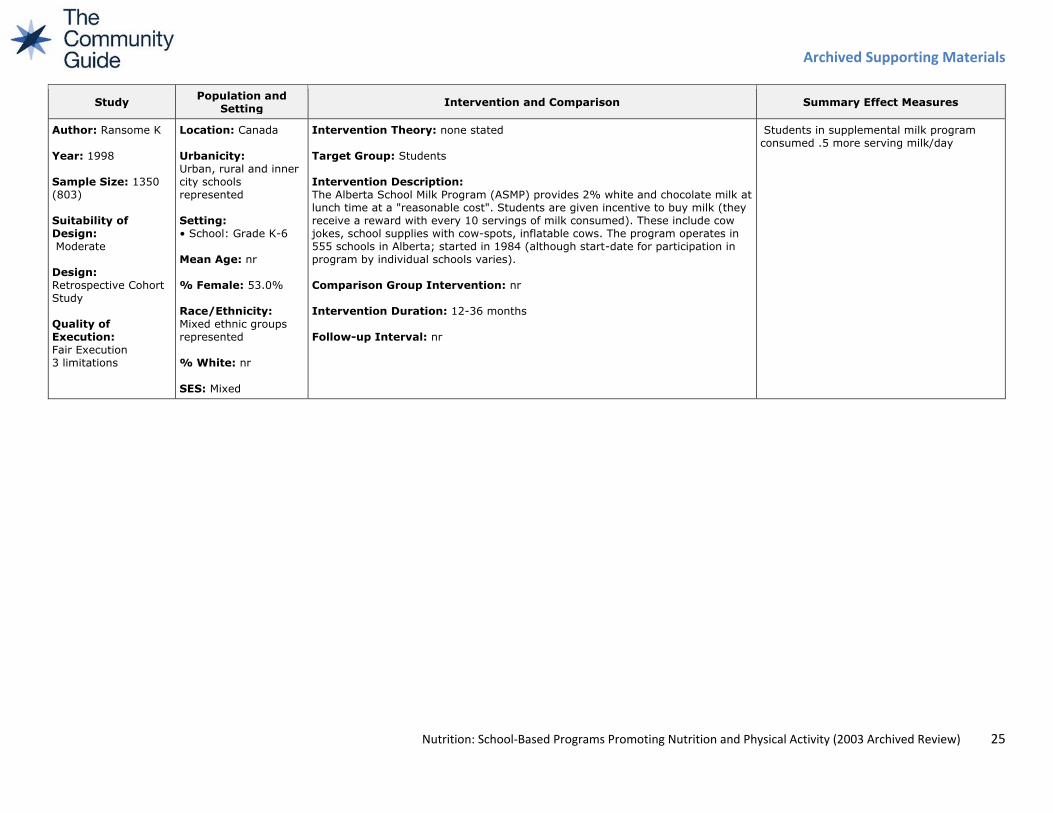
Author: Ransome K
Year: 1998
Sample Size: 1350
(803)
Suitability of
Design:
Moderate
Design:
Retrospective Cohort
Study
Quality of
Execution:
Fair Execution
3 limitations
Location: Canada
Urbanicity:
Urban, rural and inner
city schools
represented
Setting:
• School: Grade K-6
Mean Age: nr
% Female: 53.0%
Race/Ethnicity:
Mixed ethnic groups
represented
% White: nr
SES: Mixed
Intervention Theory: none stated
Target Group: Students
Intervention Description:
The Alberta School Milk Program (ASMP) provides 2% white and chocolate milk at
lunch time at a "reasonable cost". Students are given incentive to buy milk (they
receive a reward with every 10 servings of milk consumed). These include cow
jokes, school supplies with cow-spots, inflatable cows. The program operates in
555 schools in Alberta; started in 1984 (although start-date for participation in
program by individual schools varies).
Comparison Group Intervention: nr
Intervention Duration: 12-36 months
Follow-up Interval: nr
Students in supplemental milk program
consumed .5 more serving milk/day
Archived Supporting Materials
Nutrition: School-Based Programs Promoting Nutrition and Physical Activity (2003 Archived Review) 26
Study Population and
Setting Intervention and Comparison Summary Effect Measures
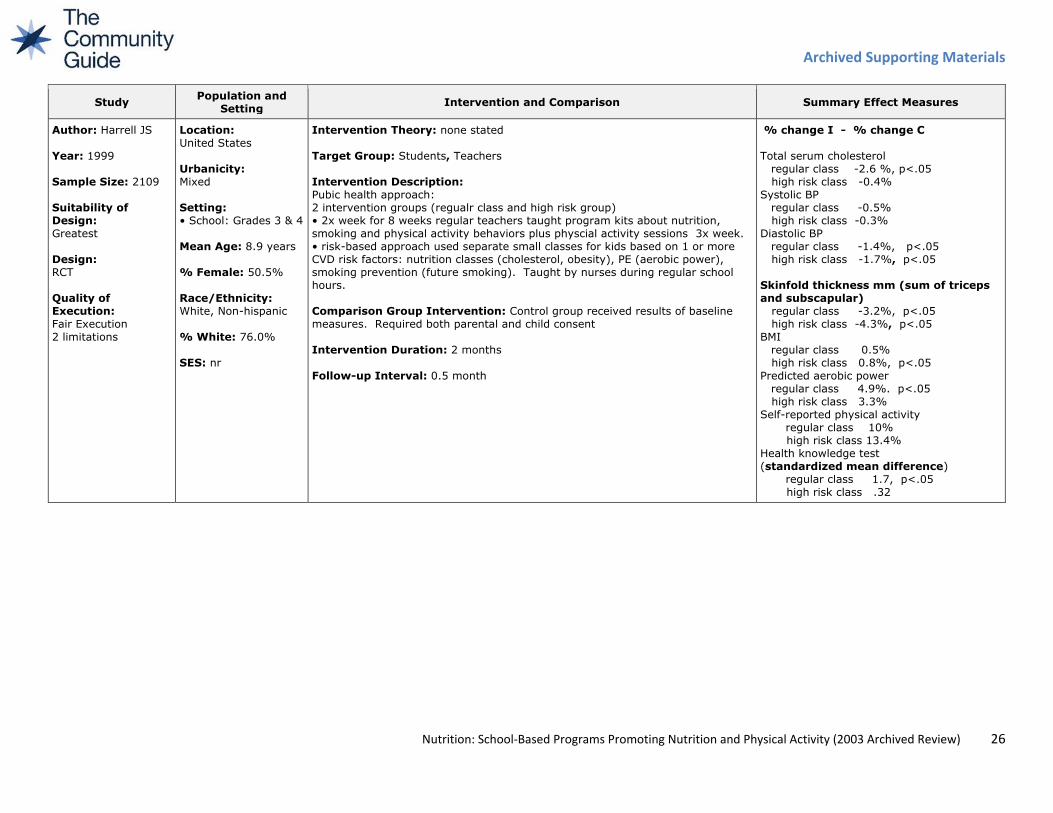
Author: Harrell JS
Year: 1999
Sample Size: 2109
Suitability of
Design:
Greatest
Design:
RCT
Quality of
Execution:
Fair Execution
2 limitations
Location:
United States
Urbanicity:
Mixed
Setting:
• School: Grades 3 & 4
Mean Age: 8.9 years
% Female: 50.5%
Race/Ethnicity:
White, Non-hispanic
% White: 76.0%
SES: nr
Intervention Theory: none stated
Target Group: Students, Teachers
Intervention Description:
Pubic health approach:
2 intervention groups (regualr class and high risk group)
• 2x week for 8 weeks regular teachers taught program kits about nutrition,
smoking and physical activity behaviors plus physcial activity sessions 3x week.
• risk-based approach used separate small classes for kids based on 1 or more
CVD risk factors: nutrition classes (cholesterol, obesity), PE (aerobic power),
smoking prevention (future smoking). Taught by nurses during regular school
hours.
Comparison Group Intervention: Control group received results of baseline
measures. Required both parental and child consent
Intervention Duration: 2 months
Follow-up Interval: 0.5 month
% change I - % change C
Total serum cholesterol
regular class -2.6 %, p<.05
high risk class -0.4%
Systolic BP
regular class -0.5%
high risk class -0.3%
Diastolic BP
regular class -1.4%, p<.05
high risk class -1.7%, p<.05
Skinfold thickness mm (sum of triceps
and subscapular)
regular class -3.2%, p<.05
high risk class -4.3%, p<.05
BMI
regular class 0.5%
high risk class 0.8%, p<.05
Predicted aerobic power
regular class 4.9%. p<.05
high risk class 3.3%
Self-reported physical activity
regular class 10%
high risk class 13.4%
Health knowledge test
(standardized mean difference)
regular class 1.7, p<.05
high risk class .32
Archived Supporting Materials
Nutrition: School-Based Programs Promoting Nutrition and Physical Activity (2003 Archived Review) 27
Study Population and
Setting Intervention and Comparison Summary Effect Measures
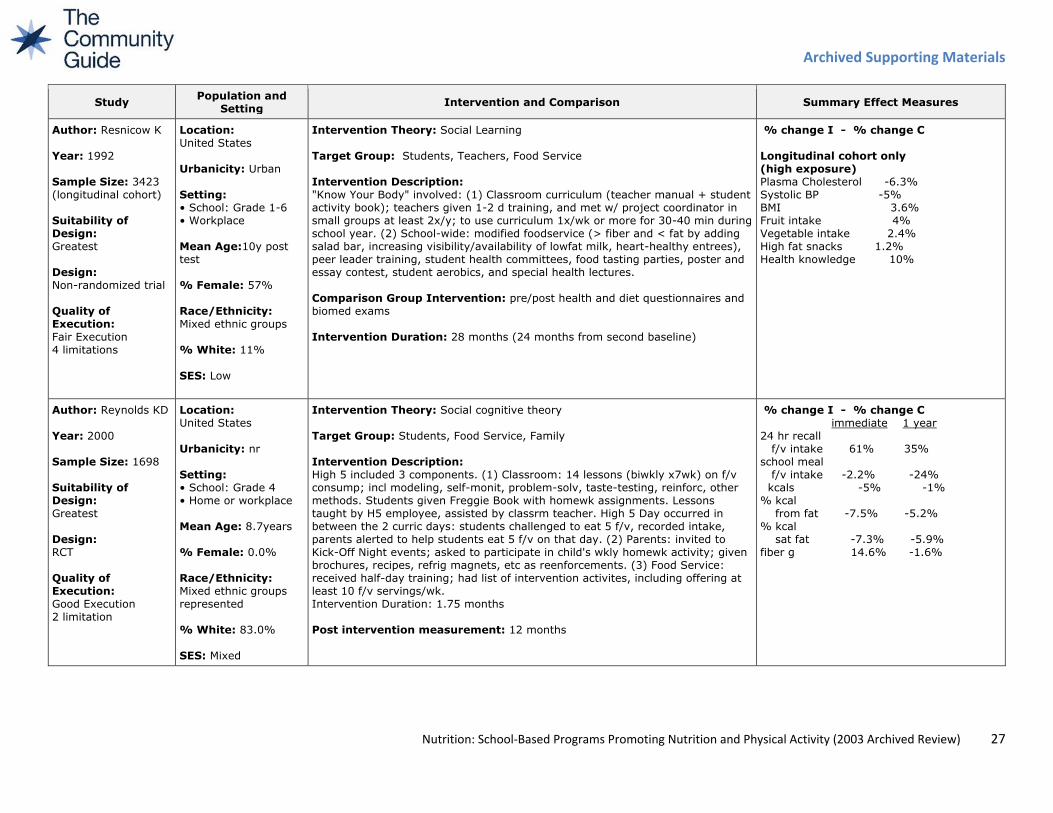
Author: Resnicow K
Year: 1992
Sample Size: 3423
(longitudinal cohort)
Suitability of
Design:
Greatest
Design:
Non-randomized trial
Quality of
Execution:
Fair Execution
4 limitations
Location:
United States
Urbanicity: Urban
Setting:
• School: Grade 1-6
• Workplace
Mean Age:10y post
test
% Female: 57%
Race/Ethnicity:
Mixed ethnic groups
% White: 11%
SES: Low
Intervention Theory: Social Learning
Target Group: Students, Teachers, Food Service
Intervention Description:
"Know Your Body" involved: (1) Classroom curriculum (teacher manual + student
activity book); teachers given 1-2 d training, and met w/ project coordinator in
small groups at least 2x/y; to use curriculum 1x/wk or more for 30-40 min during
school year. (2) School-wide: modified foodservice (> fiber and < fat by adding
salad bar, increasing visibility/availability of lowfat milk, heart-healthy entrees),
peer leader training, student health committees, food tasting parties, poster and
essay contest, student aerobics, and special health lectures.
Comparison Group Intervention: pre/post health and diet questionnaires and
biomed exams
Intervention Duration: 28 months (24 months from second baseline)
% change I - % change C
Longitudinal cohort only
(high exposure)
Plasma Cholesterol -6.3%
Systolic BP -5%
BMI 3.6%
Fruit intake 4%
Vegetable intake 2.4%
High fat snacks 1.2%
Health knowledge 10%
Author: Reynolds KD
Year: 2000
Sample Size: 1698
Suitability of
Design:
Greatest
Design:
RCT
Quality of
Execution:
Good Execution
2 limitation
Location:
United States
Urbanicity: nr
Setting:
• School: Grade 4
• Home or workplace
Mean Age: 8.7years
% Female: 0.0%
Race/Ethnicity:
Mixed ethnic groups
represented
% White: 83.0%
SES: Mixed
Intervention Theory: Social cognitive theory
Target Group: Students, Food Service, Family
Intervention Description:
High 5 included 3 components. (1) Classroom: 14 lessons (biwkly x7wk) on f/v
consump; incl modeling, self-monit, problem-solv, taste-testing, reinforc, other
methods. Students given Freggie Book with homewk assignments. Lessons
taught by H5 employee, assisted by classrm teacher. High 5 Day occurred in
between the 2 curric days: students challenged to eat 5 f/v, recorded intake,
parents alerted to help students eat 5 f/v on that day. (2) Parents: invited to
Kick-Off Night events; asked to participate in child's wkly homewk activity; given
brochures, recipes, refrig magnets, etc as reenforcements. (3) Food Service:
received half-day training; had list of intervention activites, including offering at
least 10 f/v servings/wk.
Intervention Duration: 1.75 months
Post intervention measurement: 12 months
% change I - % change C
immediate 1 year
24 hr recall
f/v intake 61% 35%
school meal
f/v intake -2.2% -24%
kcals -5% -1%
% kcal
from fat -7.5% -5.2%
% kcal
sat fat -7.3% -5.9%
fiber g 14.6% -1.6%
Archived Supporting Materials
Nutrition: School-Based Programs Promoting Nutrition and Physical Activity (2003 Archived Review) 28
Study Population and
Setting Intervention and Comparison Summary Effect Measures
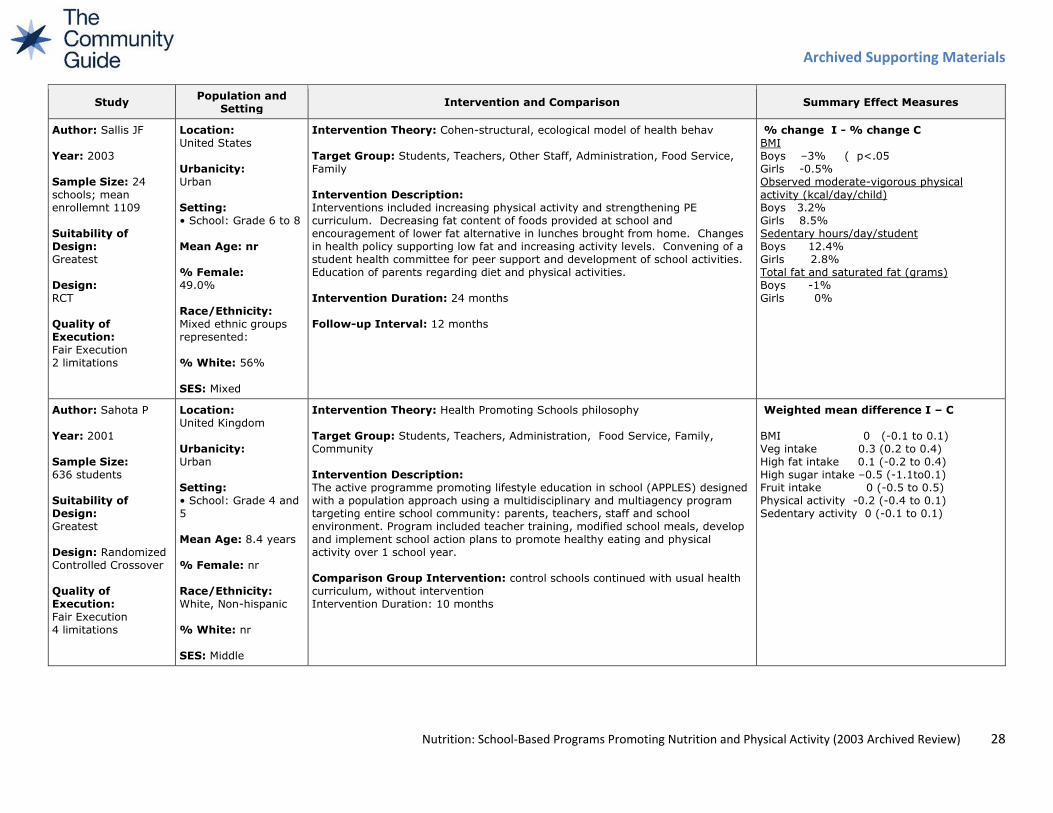
Author: Sallis JF
Year: 2003
Sample Size: 24
schools; mean
enrollemnt 1109
Suitability of
Design:
Greatest
Design:
RCT
Quality of
Execution:
Fair Execution
2 limitations
Location:
United States
Urbanicity:
Urban
Setting:
• School: Grade 6 to 8
Mean Age: nr
% Female:
49.0%
Race/Ethnicity:
Mixed ethnic groups
represented:
% White: 56%
SES: Mixed
Intervention Theory: Cohen-structural, ecological model of health behav
Target Group: Students, Teachers, Other Staff, Administration, Food Service,
Family
Intervention Description:
Interventions included increasing physical activity and strengthening PE
curriculum. Decreasing fat content of foods provided at school and
encouragement of lower fat alternative in lunches brought from home. Changes
in health policy supporting low fat and increasing activity levels. Convening of a
student health committee for peer support and development of school activities.
Education of parents regarding diet and physical activities.
Intervention Duration: 24 months
Follow-up Interval: 12 months
% change I - % change C
BMI
Boys –3% ( p<.05
Girls -0.5%
Observed moderate-vigorous physical
activity (kcal/day/child)
Boys 3.2%
Girls 8.5%
Sedentary hours/day/student
Boys 12.4%
Girls 2.8%
Total fat and saturated fat (grams)
Boys -1%
Girls 0%
Author: Sahota P
Year: 2001
Sample Size:
636 students
Suitability of
Design:
Greatest
Design: Randomized
Controlled Crossover
Quality of
Execution:
Fair Execution
4 limitations
Location:
United Kingdom
Urbanicity:
Urban
Setting:
• School: Grade 4 and
5
Mean Age: 8.4 years
% Female: nr
Race/Ethnicity:
White, Non-hispanic
% White: nr
SES: Middle
Intervention Theory: Health Promoting Schools philosophy
Target Group: Students, Teachers, Administration, Food Service, Family,
Community
Intervention Description:
The active programme promoting lifestyle education in school (APPLES) designed
with a population approach using a multidisciplinary and multiagency program
targeting entire school community: parents, teachers, staff and school
environment. Program included teacher training, modified school meals, develop
and implement school action plans to promote healthy eating and physical
activity over 1 school year.
Comparison Group Intervention: control schools continued with usual health
curriculum, without intervention
Intervention Duration: 10 months
Weighted mean difference I – C
BMI 0 (-0.1 to 0.1)
Veg intake 0.3 (0.2 to 0.4)
High fat intake 0.1 (-0.2 to 0.4)
High sugar intake –0.5 (-1.1to0.1)
Fruit intake 0 (-0.5 to 0.5)
Physical activity -0.2 (-0.4 to 0.1)
Sedentary activity 0 (-0.1 to 0.1)
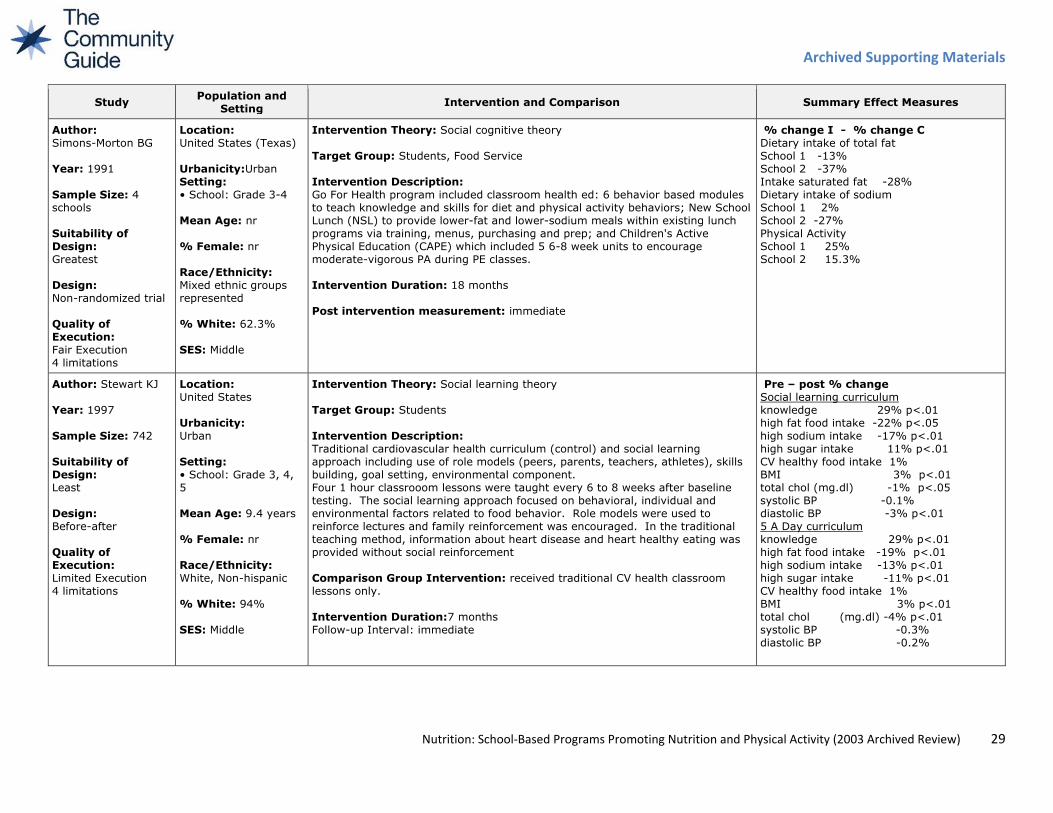
Archived Supporting Materials
Nutrition: School-Based Programs Promoting Nutrition and Physical Activity (2003 Archived Review) 29
Study Population and
Setting Intervention and Comparison Summary Effect Measures
Author:
Simons-Morton BG
Year: 1991
Sample Size: 4
schools
Suitability of
Design:
Greatest
Design:
Non-randomized trial
Quality of
Execution:
Fair Execution
4 limitations
Location:
United States (Texas)
Urbanicity:Urban
Setting:
• School: Grade 3-4
Mean Age: nr
% Female: nr
Race/Ethnicity:
Mixed ethnic groups
represented
% White: 62.3%
SES: Middle
Intervention Theory: Social cognitive theory
Target Group: Students, Food Service
Intervention Description:
Go For Health program included classroom health ed: 6 behavior based modules
to teach knowledge and skills for diet and physical activity behaviors; New School
Lunch (NSL) to provide lower-fat and lower-sodium meals within existing lunch
programs via training, menus, purchasing and prep; and Children's Active
Physical Education (CAPE) which included 5 6-8 week units to encourage
moderate-vigorous PA during PE classes.
Intervention Duration: 18 months
Post intervention measurement: immediate
% change I - % change C
Dietary intake of total fat
School 1 -13%
School 2 -37%
Intake saturated fat -28%
Dietary intake of sodium
School 1 2%
School 2 -27%
Physical Activity
School 1 25%
School 2 15.3%
Author: Stewart KJ
Year: 1997
Sample Size: 742
Suitability of
Design:
Least
Design:
Before-after
Quality of
Execution:
Limited Execution
4 limitations
Location:
United States
Urbanicity:
Urban
Setting:
• School: Grade 3, 4,
5
Mean Age: 9.4 years
% Female: nr
Race/Ethnicity:
White, Non-hispanic
% White: 94%
SES: Middle
Intervention Theory: Social learning theory
Target Group: Students
Intervention Description:
Traditional cardiovascular health curriculum (control) and social learning
approach including use of role models (peers, parents, teachers, athletes), skills
building, goal setting, environmental component.
Four 1 hour classrooom lessons were taught every 6 to 8 weeks after baseline
testing. The social learning approach focused on behavioral, individual and
environmental factors related to food behavior. Role models were used to
reinforce lectures and family reinforcement was encouraged. In the traditional
teaching method, information about heart disease and heart healthy eating was
provided without social reinforcement
Comparison Group Intervention: received traditional CV health classroom
lessons only.
Intervention Duration:7 months
Follow-up Interval: immediate
Pre – post % change
Social learning curriculum
knowledge 29% p<.01
high fat food intake -22% p<.05
high sodium intake -17% p<.01
high sugar intake 11% p<.01
CV healthy food intake 1%
BMI 3% p<.01
total chol (mg.dl) -1% p<.05
systolic BP -0.1%
diastolic BP -3% p<.01
5 A Day curriculum
knowledge 29% p<.01
high fat food intake -19% p<.01
high sodium intake -13% p<.01
high sugar intake -11% p<.01
CV healthy food intake 1%
BMI 3% p<.01
total chol (mg.dl) -4% p<.01
systolic BP -0.3%
diastolic BP -0.2%
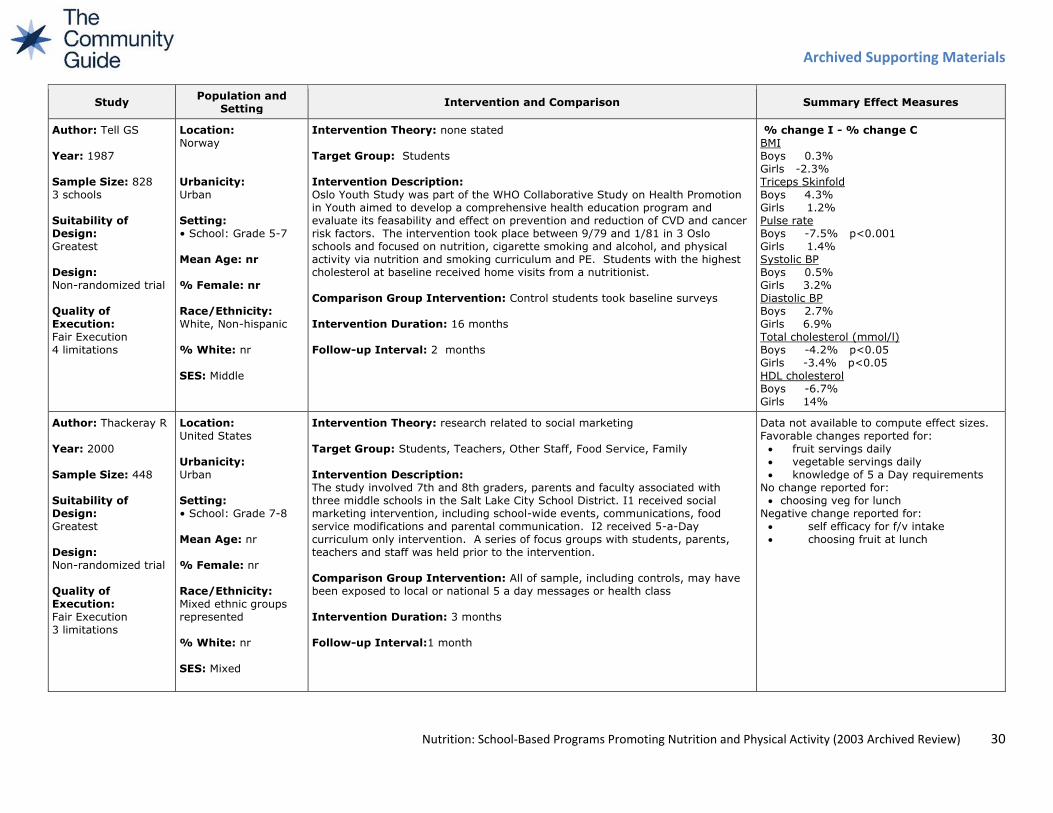
Archived Supporting Materials
Nutrition: School-Based Programs Promoting Nutrition and Physical Activity (2003 Archived Review) 30
Study Population and
Setting Intervention and Comparison Summary Effect Measures
Author: Tell GS
Year: 1987
Sample Size: 828
3 schools
Suitability of
Design:
Greatest
Design:
Non-randomized trial
Quality of
Execution:
Fair Execution
4 limitations
Location:
Norway
Urbanicity:
Urban
Setting:
• School: Grade 5-7
Mean Age: nr
% Female: nr
Race/Ethnicity:
White, Non-hispanic
% White: nr
SES: Middle
Intervention Theory: none stated
Target Group: Students
Intervention Description:
Oslo Youth Study was part of the WHO Collaborative Study on Health Promotion
in Youth aimed to develop a comprehensive health education program and
evaluate its feasability and effect on prevention and reduction of CVD and cancer
risk factors. The intervention took place between 9/79 and 1/81 in 3 Oslo
schools and focused on nutrition, cigarette smoking and alcohol, and physical
activity via nutrition and smoking curriculum and PE. Students with the highest
cholesterol at baseline received home visits from a nutritionist.
Comparison Group Intervention: Control students took baseline surveys
Intervention Duration: 16 months
Follow-up Interval: 2 months
% change I - % change C
BMI
Boys 0.3%
Girls -2.3%
Triceps Skinfold
Boys 4.3%
Girls 1.2%
Pulse rate
Boys -7.5% p<0.001
Girls 1.4%
Systolic BP
Boys 0.5%
Girls 3.2%
Diastolic BP
Boys 2.7%
Girls 6.9%
Total cholesterol (mmol/l)
Boys -4.2% p<0.05
Girls -3.4% p<0.05
HDL cholesterol
Boys -6.7%
Girls 14%
Author: Thackeray R
Year: 2000
Sample Size: 448
Suitability of
Design:
Greatest
Design:
Non-randomized trial
Quality of
Execution:
Fair Execution
3 limitations
Location:
United States
Urbanicity:
Urban
Setting:
• School: Grade 7-8
Mean Age: nr
% Female: nr
Race/Ethnicity:
Mixed ethnic groups
represented
% White: nr
SES: Mixed
Intervention Theory: research related to social marketing
Target Group: Students, Teachers, Other Staff, Food Service, Family
Intervention Description:
The study involved 7th and 8th graders, parents and faculty associated with
three middle schools in the Salt Lake City School District. I1 received social
marketing intervention, including school-wide events, communications, food
service modifications and parental communication. I2 received 5-a-Day
curriculum only intervention. A series of focus groups with students, parents,
teachers and staff was held prior to the intervention.
Comparison Group Intervention: All of sample, including controls, may have
been exposed to local or national 5 a day messages or health class
Intervention Duration: 3 months
Follow-up Interval:1 month
Data not available to compute effect sizes.
Favorable changes reported for:
fruit servings daily
vegetable servings daily
knowledge of 5 a Day requirements
No change reported for:
choosing veg for lunch
Negative change reported for:
self efficacy for f/v intake
choosing fruit at lunch
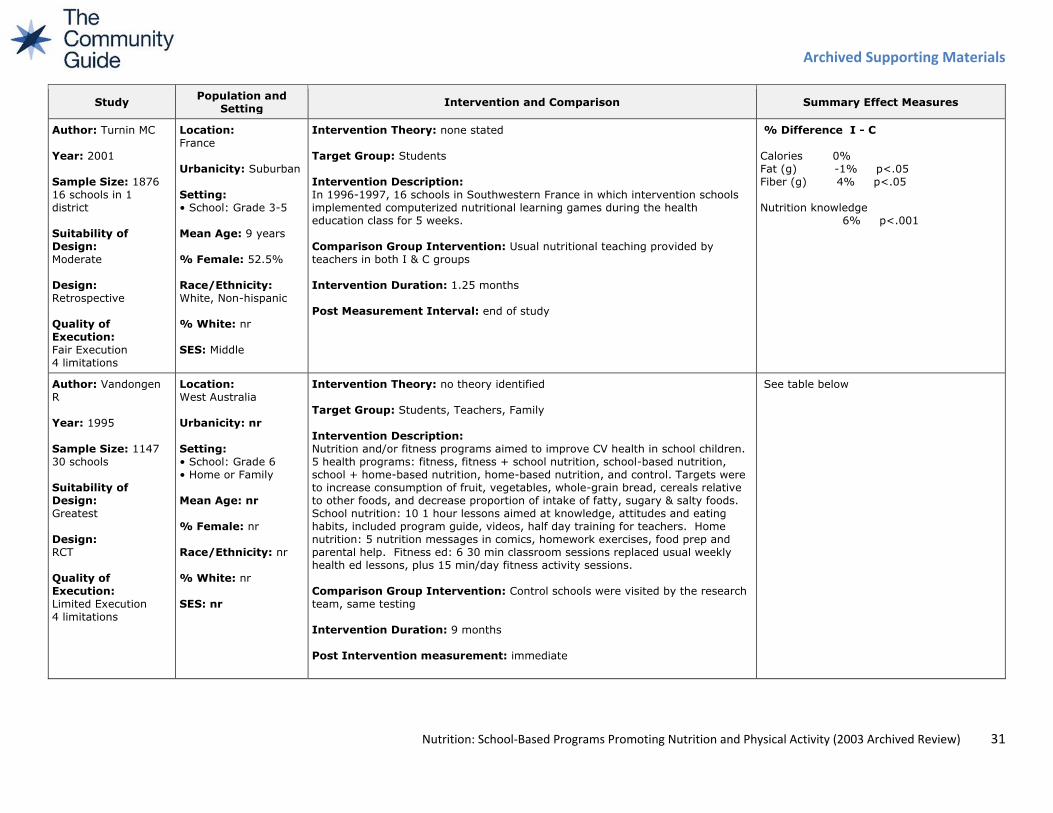
Archived Supporting Materials
Nutrition: School-Based Programs Promoting Nutrition and Physical Activity (2003 Archived Review) 31
Study Population and
Setting Intervention and Comparison Summary Effect Measures
Author: Turnin MC
Year: 2001
Sample Size: 1876
16 schools in 1
district
Suitability of
Design:
Moderate
Design:
Retrospective
Quality of
Execution:
Fair Execution
4 limitations
Location:
France
Urbanicity: Suburban
Setting:
• School: Grade 3-5
Mean Age: 9 years
% Female: 52.5%
Race/Ethnicity:
White, Non-hispanic
% White: nr
SES: Middle
Intervention Theory: none stated
Target Group: Students
Intervention Description:
In 1996-1997, 16 schools in Southwestern France in which intervention schools
implemented computerized nutritional learning games during the health
education class for 5 weeks.
Comparison Group Intervention: Usual nutritional teaching provided by
teachers in both I & C groups
Intervention Duration: 1.25 months
Post Measurement Interval: end of study
% Difference I - C
Calories 0%
Fat (g) -1% p<.05
Fiber (g) 4% p<.05
Nutrition knowledge
6% p<.001
Author: Vandongen
R
Year: 1995
Sample Size: 1147
30 schools
Suitability of
Design:
Greatest
Design:
RCT
Quality of
Execution:
Limited Execution
4 limitations
Location:
West Australia
Urbanicity: nr
Setting:
• School: Grade 6
• Home or Family
Mean Age: nr
% Female: nr
Race/Ethnicity: nr
% White: nr
SES: nr
Intervention Theory: no theory identified
Target Group: Students, Teachers, Family
Intervention Description:
Nutrition and/or fitness programs aimed to improve CV health in school children.
5 health programs: fitness, fitness + school nutrition, school-based nutrition,
school + home-based nutrition, home-based nutrition, and control. Targets were
to increase consumption of fruit, vegetables, whole-grain bread, cereals relative
to other foods, and decrease proportion of intake of fatty, sugary & salty foods.
School nutrition: 10 1 hour lessons aimed at knowledge, attitudes and eating
habits, included program guide, videos, half day training for teachers. Home
nutrition: 5 nutrition messages in comics, homework exercises, food prep and
parental help. Fitness ed: 6 30 min classroom sessions replaced usual weekly
health ed lessons, plus 15 min/day fitness activity sessions.
Comparison Group Intervention: Control schools were visited by the research
team, same testing
Intervention Duration: 9 months
Post Intervention measurement: immediate
See table below
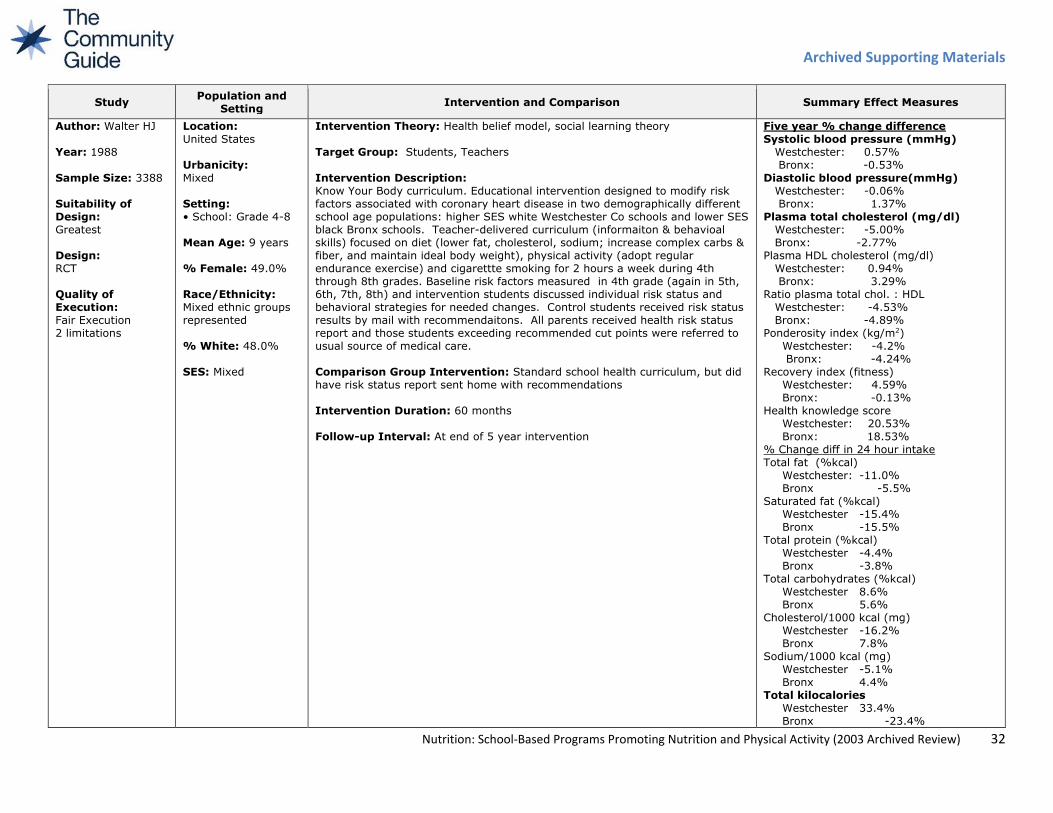
Archived Supporting Materials
Nutrition: School-Based Programs Promoting Nutrition and Physical Activity (2003 Archived Review) 32
Study Population and
Setting Intervention and Comparison Summary Effect Measures
Author: Walter HJ
Year: 1988
Sample Size: 3388
Suitability of
Design:
Greatest
Design:
RCT
Quality of
Execution:
Fair Execution
2 limitations
Location:
United States
Urbanicity:
Mixed
Setting:
• School: Grade 4-8
Mean Age: 9 years
% Female: 49.0%
Race/Ethnicity:
Mixed ethnic groups
represented
% White: 48.0%
SES: Mixed
Intervention Theory: Health belief model, social learning theory
Target Group: Students, Teachers
Intervention Description:
Know Your Body curriculum. Educational intervention designed to modify risk
factors associated with coronary heart disease in two demographically different
school age populations: higher SES white Westchester Co schools and lower SES
black Bronx schools. Teacher-delivered curriculum (informaiton & behavioal
skills) focused on diet (lower fat, cholesterol, sodium; increase complex carbs &
fiber, and maintain ideal body weight), physical activity (adopt regular
endurance exercise) and cigarettte smoking for 2 hours a week during 4th
through 8th grades. Baseline risk factors measured in 4th grade (again in 5th,
6th, 7th, 8th) and intervention students discussed individual risk status and
behavioral strategies for needed changes. Control students received risk status
results by mail with recommendaitons. All parents received health risk status
report and those students exceeding recommended cut points were referred to
usual source of medical care.
Comparison Group Intervention: Standard school health curriculum, but did
have risk status report sent home with recommendations
Intervention Duration: 60 months
Follow-up Interval: At end of 5 year intervention
Five year % change difference
Systolic blood pressure (mmHg)
Westchester: 0.57%
Bronx: -0.53%
Diastolic blood pressure(mmHg)
Westchester: -0.06%
Bronx: 1.37%
Plasma total cholesterol (mg/dl)
Westchester: -5.00%
Bronx: -2.77%
Plasma HDL cholesterol (mg/dl)
Westchester: 0.94%
Bronx: 3.29%
Ratio plasma total chol. : HDL
Westchester: -4.53%
Bronx: -4.89%
Ponderosity index (kg/m2)
Westchester: -4.2%
Bronx: -4.24%
Recovery index (fitness)
Westchester: 4.59%
Bronx: -0.13%
Health knowledge score
Westchester: 20.53%
Bronx: 18.53%
% Change diff in 24 hour intake
Total fat (%kcal)
Westchester: -11.0%
Bronx -5.5%
Saturated fat (%kcal)
Westchester -15.4%
Bronx -15.5%
Total protein (%kcal)
Westchester -4.4%
Bronx -3.8%
Total carbohydrates (%kcal)
Westchester 8.6%
Bronx 5.6%
Cholesterol/1000 kcal (mg)
Westchester -16.2%
Bronx 7.8%
Sodium/1000 kcal (mg)
Westchester -5.1%
Bronx 4.4%
Total kilocalories
Westchester 33.4%
Bronx -23.4%
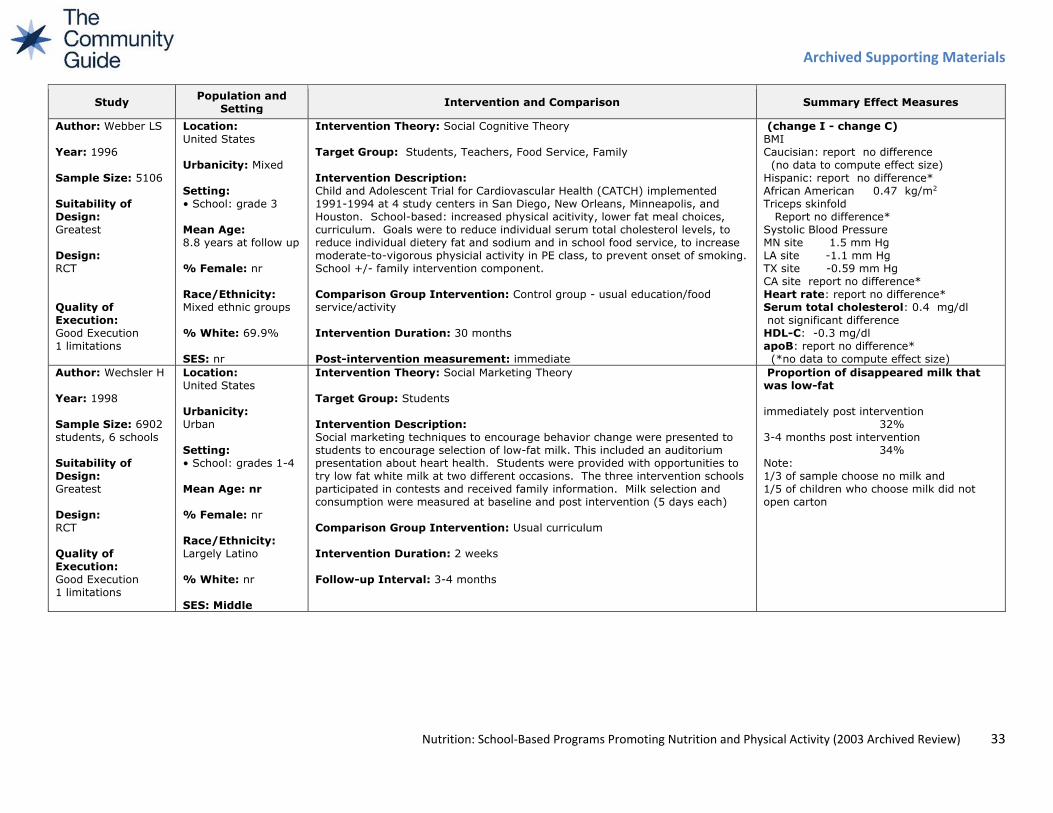
Archived Supporting Materials
Nutrition: School-Based Programs Promoting Nutrition and Physical Activity (2003 Archived Review) 33
Study Population and
Setting Intervention and Comparison Summary Effect Measures
Author: Webber LS
Year: 1996
Sample Size: 5106
Suitability of
Design:
Greatest
Design:
RCT
Quality of
Execution:
Good Execution
1 limitations
Location:
United States
Urbanicity: Mixed
Setting:
• School: grade 3
Mean Age:
8.8 years at follow up
% Female: nr
Race/Ethnicity:
Mixed ethnic groups
% White: 69.9%
SES: nr
Intervention Theory: Social Cognitive Theory
Target Group: Students, Teachers, Food Service, Family
Intervention Description:
Child and Adolescent Trial for Cardiovascular Health (CATCH) implemented
1991-1994 at 4 study centers in San Diego, New Orleans, Minneapolis, and
Houston. School-based: increased physical acitivity, lower fat meal choices,
curriculum. Goals were to reduce individual serum total cholesterol levels, to
reduce individual dietery fat and sodium and in school food service, to increase
moderate-to-vigorous physicial activity in PE class, to prevent onset of smoking.
School +/- family intervention component.
Comparison Group Intervention: Control group - usual education/food
service/activity
Intervention Duration: 30 months
Post-intervention measurement: immediate
(change I - change C)
BMI
Caucisian: report no difference
(no data to compute effect size)
Hispanic: report no difference*
African American 0.47 kg/m2
Triceps skinfold
Report no difference*
Systolic Blood Pressure
MN site 1.5 mm Hg
LA site -1.1 mm Hg
TX site -0.59 mm Hg
CA site report no difference*
Heart rate: report no difference*
Serum total cholesterol: 0.4 mg/dl
not significant difference
HDL-C: -0.3 mg/dl
apoB: report no difference*
(*no data to compute effect size)
Author: Wechsler H
Year: 1998
Sample Size: 6902
students, 6 schools
Suitability of
Design:
Greatest
Design:
RCT
Quality of
Execution:
Good Execution
1 limitations
Location:
United States
Urbanicity:
Urban
Setting:
• School: grades 1-4
Mean Age: nr
% Female: nr
Race/Ethnicity:
Largely Latino
% White: nr
SES: Middle
Intervention Theory: Social Marketing Theory
Target Group: Students
Intervention Description:
Social marketing techniques to encourage behavior change were presented to
students to encourage selection of low-fat milk. This included an auditorium
presentation about heart health. Students were provided with opportunities to
try low fat white milk at two different occasions. The three intervention schools
participated in contests and received family information. Milk selection and
consumption were measured at baseline and post intervention (5 days each)
Comparison Group Intervention: Usual curriculum
Intervention Duration: 2 weeks
Follow-up Interval: 3-4 months
Proportion of disappeared milk that
was low-fat
immediately post intervention
32%
3-4 months post intervention
34%
Note:
1/3 of sample choose no milk and
1/5 of children who choose milk did not
open carton
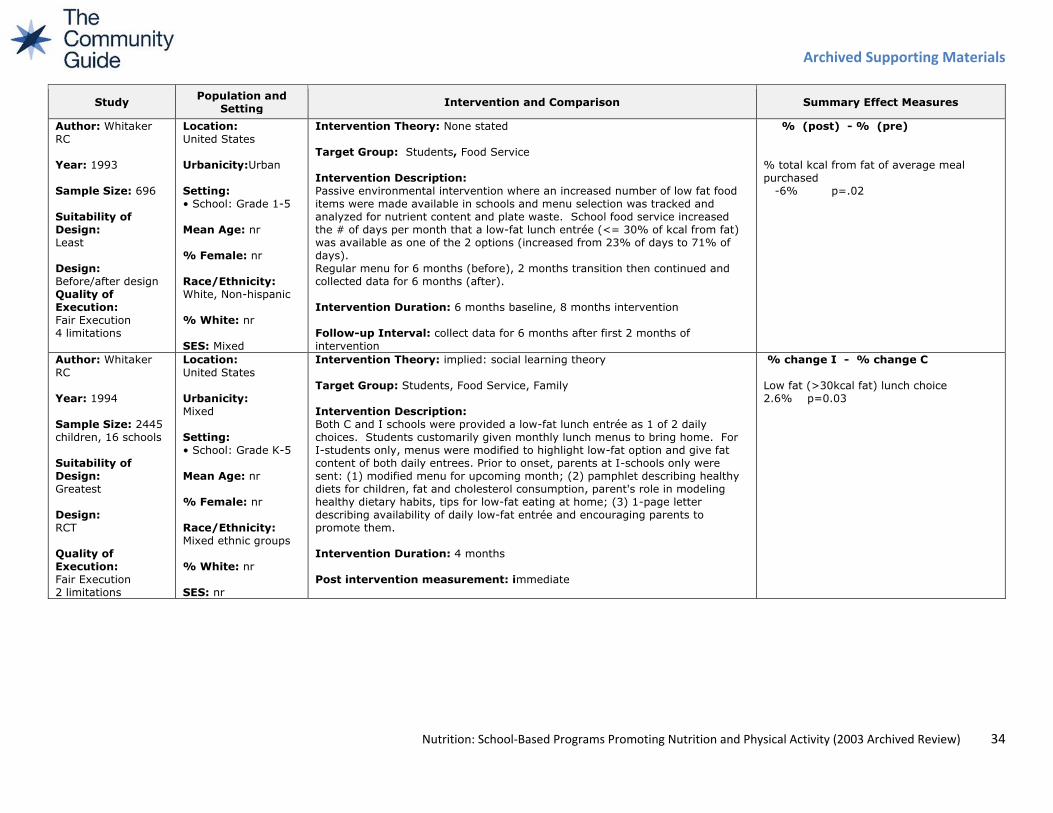
Archived Supporting Materials
Nutrition: School-Based Programs Promoting Nutrition and Physical Activity (2003 Archived Review) 34
Study Population and
Setting Intervention and Comparison Summary Effect Measures
Author: Whitaker
RC
Year: 1993
Sample Size: 696
Suitability of
Design:
Least
Design:
Before/after design
Quality of
Execution:
Fair Execution
4 limitations
Location:
United States
Urbanicity:Urban
Setting:
• School: Grade 1-5
Mean Age: nr
% Female: nr
Race/Ethnicity:
White, Non-hispanic
% White: nr
SES: Mixed
Intervention Theory: None stated
Target Group: Students, Food Service
Intervention Description:
Passive environmental intervention where an increased number of low fat food
items were made available in schools and menu selection was tracked and
analyzed for nutrient content and plate waste. School food service increased
the # of days per month that a low-fat lunch entrée (<= 30% of kcal from fat)
was available as one of the 2 options (increased from 23% of days to 71% of
days).
Regular menu for 6 months (before), 2 months transition then continued and
collected data for 6 months (after).
Intervention Duration: 6 months baseline, 8 months intervention
Follow-up Interval: collect data for 6 months after first 2 months of
intervention
% (post) - % (pre)
% total kcal from fat of average meal
purchased
-6% p=.02
Author: Whitaker
RC
Year: 1994
Sample Size: 2445
children, 16 schools
Suitability of
Design:
Greatest
Design:
RCT
Quality of
Execution:
Fair Execution
2 limitations
Location:
United States
Urbanicity:
Mixed
Setting:
• School: Grade K-5
Mean Age: nr
% Female: nr
Race/Ethnicity:
Mixed ethnic groups
% White: nr
SES: nr
Intervention Theory: implied: social learning theory
Target Group: Students, Food Service, Family
Intervention Description:
Both C and I schools were provided a low-fat lunch entrée as 1 of 2 daily
choices. Students customarily given monthly lunch menus to bring home. For
I-students only, menus were modified to highlight low-fat option and give fat
content of both daily entrees. Prior to onset, parents at I-schools only were
sent: (1) modified menu for upcoming month; (2) pamphlet describing healthy
diets for children, fat and cholesterol consumption, parent's role in modeling
healthy dietary habits, tips for low-fat eating at home; (3) 1-page letter
describing availability of daily low-fat entrée and encouraging parents to
promote them.
Intervention Duration: 4 months
Post intervention measurement: immediate
% change I - % change C
Low fat (>30kcal fat) lunch choice
2.6% p=0.03
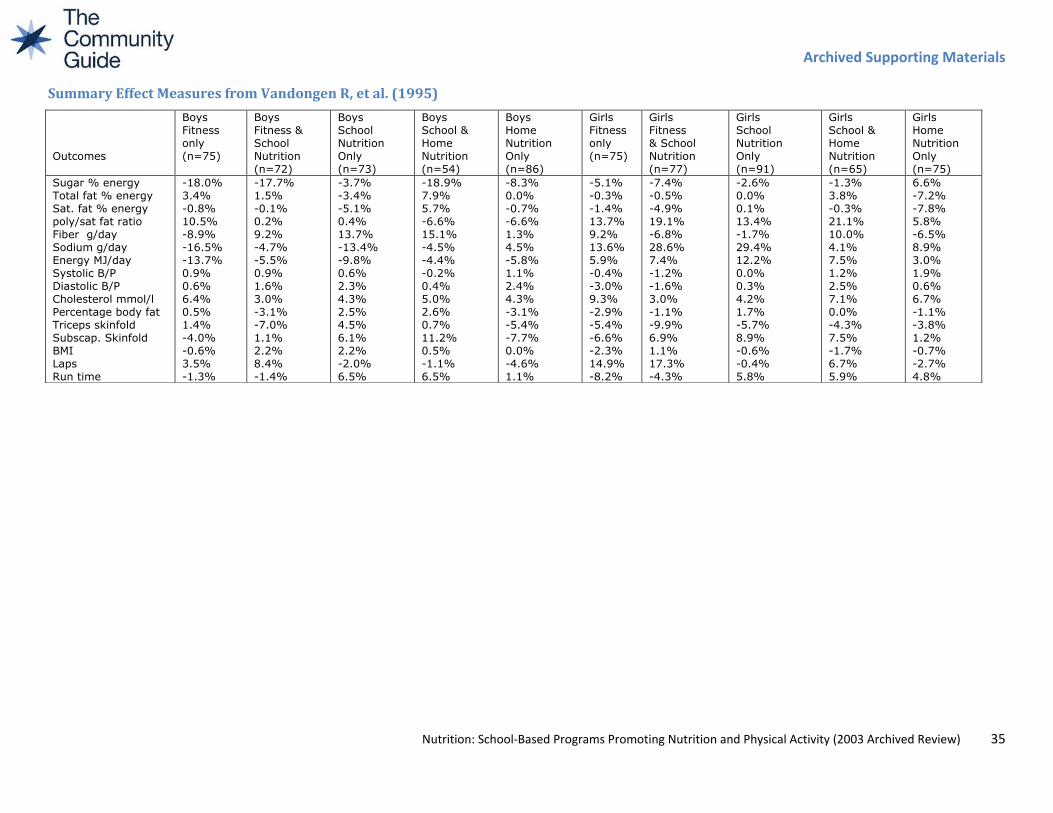
Archived Supporting Materials
Nutrition: School-Based Programs Promoting Nutrition and Physical Activity (2003 Archived Review) 35
Summary Effect Measures from Vandongen R, et al. (1995)
Outcomes
Boys
Fitness
only
(n=75)
Boys
Fitness &
School
Nutrition
(n=72)
Boys
School
Nutrition
Only
(n=73)
Boys
School &
Home
Nutrition
(n=54)
Boys
Home
Nutrition
Only
(n=86)
Girls
Fitness
only
(n=75)
Girls
Fitness
& School
Nutrition
(n=77)
Girls
School
Nutrition
Only
(n=91)
Girls
School &
Home
Nutrition
(n=65)
Girls
Home
Nutrition
Only
(n=75)
Sugar % energy
Total fat % energy
Sat. fat % energy
poly/sat fat ratio
Fiber g/day
Sodium g/day
Energy MJ/day
Systolic B/P
Diastolic B/P
Cholesterol mmol/l
Percentage body fat
Triceps skinfold
Subscap. Skinfold
BMI
Laps
Run time
-18.0%
3.4%
-0.8%
10.5%
-8.9%
-16.5%
-13.7%
0.9%
0.6%
6.4%
0.5%
1.4%
-4.0%
-0.6%
3.5%
-1.3%
-17.7%
1.5%
-0.1%
0.2%
9.2%
-4.7%
-5.5%
0.9%
1.6%
3.0%
-3.1%
-7.0%
1.1%
2.2%
8.4%
-1.4%
-3.7%
-3.4%
-5.1%
0.4%
13.7%
-13.4%
-9.8%
0.6%
2.3%
4.3%
2.5%
4.5%
6.1%
2.2%
-2.0%
6.5%
-18.9%
7.9%
5.7%
-6.6%
15.1%
-4.5%
-4.4%
-0.2%
0.4%
5.0%
2.6%
0.7%
11.2%
0.5%
-1.1%
6.5%
-8.3%
0.0%
-0.7%
-6.6%
1.3%
4.5%
-5.8%
1.1%
2.4%
4.3%
-3.1%
-5.4%
-7.7%
0.0%
-4.6%
1.1%
-5.1%
-0.3%
-1.4%
13.7%
9.2%
13.6%
5.9%
-0.4%
-3.0%
9.3%
-2.9%
-5.4%
-6.6%
-2.3%
14.9%
-8.2%
-7.4%
-0.5%
-4.9%
19.1%
-6.8%
28.6%
7.4%
-1.2%
-1.6%
3.0%
-1.1%
-9.9%
6.9%
1.1%
17.3%
-4.3%
-2.6%
0.0%
0.1%
13.4%
-1.7%
29.4%
12.2%
0.0%
0.3%
4.2%
1.7%
-5.7%
8.9%
-0.6%
-0.4%
5.8%
-1.3%
3.8%
-0.3%
21.1%
10.0%
4.1%
7.5%
1.2%
2.5%
7.1%
0.0%
-4.3%
7.5%
-1.7%
6.7%
5.9%
6.6%
-7.2%
-7.8%
5.8%
-6.5%
8.9%
3.0%
1.9%
0.6%
6.7%
-1.1%
-3.8%
1.2%
-0.7%
-2.7%
4.8%
Archived Supporting Materials
Nutrition: School-Based Programs Promoting Nutrition and Physical Activity (2003 Archived Review) 36
Included Studies The number of studies and publications do not always correspond (e.g., a publication may include several studies or one
study may be explained in several publications).
Arbeit ML, Johnson CC, Mott DS, Harsha DW, Nicklas TA, et al. The Heart Smart Cardiovascular School Health Promotion:
behavioral correlates of risk factor change. Preventive Medicine 1992;21:18-32.
Auld GW, Romaniello C, Heimendinger J, Hambridge C, Hambridge M. Outcomes from a school-based nutrition
education program using resource teachers and cross-disciplinary models. J Nutr Ed 1998;30:268-80.
Baranowski T, Baranowski J, Cullen KW, et al. Squire's Quest! Dietary outcome evaluation of a multimedia game. Amer J
Preventive Medicine 2003;24(1):52-61.
Baxter AP, Milner PC, Hawkins S, Leaf M, Simpson C, et al. The impact of heart health promotion on coronary heart
disease lifestyle risk factors in schoolchildren: lessons learnt from a community-based project. Public Health
1997;111:231-7.
Birnbaum AS, Lytle LA, Story M, Perry CL, Murray DM. Are differences in exposure to a multicomponent school-based
intervention associated with varying dietary outcomes in adolescents? Health Ed Behavior 2002;29:427-43.
Bush PJ, Zuckerman AE, Theiss PK, Taggart VS, Horowitz C, et al. Cardiovascular risk factor prevention in black
schoolchildren: two-year results of the "Know Your Body" program. Amer J Epidemiol 1989;129:466-82.
Davis SM, Lambert LC, Gomez Y, Skipper B. Southwest Cardiovascular Curriculum Project: study findings for American
Indian elementary students. J Health Ed 1995;26:S72-81.
Dollahite J, Hosig KW, White KA, Rodibaugh R, Holmes TM. Impact of a school-based community intervention program
on nutrition knowledge and food choices in elementary school children in rural Arkansas Delta. J Nutr Ed 1998;30:289-
301.
Edmundson E, Parcel GS, Feldman HA, Elder JP, Perry CL, et al. The effects of the Child and Adolescent Trial for
Cardiovascular Health upon psychosocial determinants of diet and physical activity behavior. Preventive Medicine
1996;25:442-54.
Ellison RC, Goldberg RJ, Witschi JC, Capper AL, Puleo EM, et al. Use of fat-modified food products to change dietary fat
intake of young people. Am J Public Health 1990;80:1374-6.
French SA, Jeffrey RW, Story M, Breitlow KK, Baxter JS, et al. Pricing and promotion effects on low-fat vending snack
purchases: the CHIPS study. Am J Public Health 2001;112-7.
Friel S, Kelleher C, Campbell P, Nolan G. Evaluation of the Nutrition Education at Primary School (NEAPS) programme.
Public Health Nutr 1999;2:549-55.
Fries E, Meyer A, Danish S, Stanton C, Figueiredo M, et al. Cancer prevention in rural youth: Teaching Goals for Health:
the pilot. J Cancer Educ 2001;16:99-104.
Archived Supporting Materials
Nutrition: School-Based Programs Promoting Nutrition and Physical Activity (2003 Archived Review) 37
Gans KM, Levin S, Lasater TM, Sennett L, Maroni A, et al. Heart healthy cook-offs in home economics classes: an
evaluation with junior high school students. J School Health 1990;60:99-102.
Getlinger MJ, Laughlin CVT, Bell E, Akre C, Arjmandi BH. Food waste is reduced when elementary-school children have
recess before lunch. J Amer Diet Assoc 1996;96:906-8.
Goldberg SJ, Allen HD, Friedman G, Meredith K, Tymrack M, et al. Use of health education and attempted dietary change
to modify atherosclerotic risk factors: a controlled trial. Am J Clin Nutr 1980;33:1272-8.
Gortmaker SL, Peterson K, Wiecha J, Sobol AM, Dixit S, et al. Reducing obesity via a school-based interdisciplinary
intervention among youth: Planet Health. Arch Pediatr Adolesc Med 1999;153:409-18.
Gortmaker SL, Cheung LWY, Peterson KE, Chomitz G, Cradle JH, et al. Impact of a school-based interdisciplinary
intervention on diet and physical activity among urban primary school children. Arch Pediatr Adolesc Med 1999;153:975-
83.
Hackett AF, Jarvis SN, Matthews JNS. A study of the eating habits of 11- and 12-year-old children before and one year
after the start of a healthy eating campaign in Northumberland . J Human Nutr Diet 1990;3:323-32.
Holcomb JD, Lira J, Kingery PM, Smith DM, Land D, et al. Evaluation of Jump Into Action: A program to reduce the risk of
non-insulin dependent diabetes mellitus in school children on the Texas-Mexico border. J School Health 1998;68:282-8.
Hopper CA, Gruber MB, Munoz KD, MacConnie S. School-based cardiovascular exercise and nutrition programs with
parent participation. J Health Ed 1996;27:S32-9.
Killen JD, Telch MJ, Robinson TN, Maccoby N, Taylor B, et al. Cardiovascular disease risk reduction for tenth graders.
JAMA 1988;260(12):1728-33.
Liquori T, Koch PD, Contento IR, Castle J. The Cookshop Program: outcome evaluation of a nutrition education program
linking lunchroom food experiences with classroom cooking experiences. J Nutr Ed 1998;30:302-13.
Luepker RV, Perry CL, Murray DM, Mullis R. Hypertension prevention through nutrition education in youth: a school-
based program involving parents. Health Psychology 1988;7:S233-45.
Lytle LA, Stone EJ, Nichaman MZ, Perry CL, Montgomery DH, et al. Changes in nutrient intakes of elementary school
children following a school-based interventions: results of the CATCH Study. Preventive Medicine 1996;25:465-77.
Manios Y, Kafatos A. Health and nutrition education in elementary schools: changes in health knowledge, nutrient
intakes and physical activity over a six year period. Public Health Nutr 1999;2:445-8.
Morris JL, Zidenberg-Cherr S. Garden-enhanced nutrition curriculum improves fourth-grade school children's knowledge
of nutrition and preferences for some vegetables. J Amer Diet Assoc 2002;102:91-3.
Morris JL, Neustadter A, Zidenberg-Cherr S. First-grade gardeners more likely to taste vegetables. California Agriculture
2001;55:43-6.
Nader PR, Stone EJ, Lytle L, Perry CL, Osganian SK, et al. Three-year maintenance of improved diet and physical activity:
the CATCH cohort. Arch Pediatr Adolesc Med 1999;153:695-704.
Archived Supporting Materials
Nutrition: School-Based Programs Promoting Nutrition and Physical Activity (2003 Archived Review) 38
Nicklas TA, Johnson CC, Myers L, Farris RP, Cunningham A. Outcomes of a high school program to increase fruit and
vegetable consumption: Gimme 5--a fresh nutrition concept for students. J School Health 1998;68:248-53.
Perry CL, Bishop DB, Taylor G, Murray DM, Mays RW, et al. Changing fruit and vegetable consumption among children:
The 5-a Day Power Plus Program in St. Paul, Minnesota. Am J Public Health 1998;88:603-9.
Petchers MK, Hirsch EZ, Bloch BA. A longitudinal study of the impact of a school heart health curriculum. J Community
Health 1988;13:85-94.
Piper DL, Moberg DP, King MJ. The Healthy for Life Project: behavioral outcomes. J Primary Prevention 2000;21:47-73.
Ransome K, Rusk J, Field C. A school milk promotion program increases milk consumption and improves the calcium and
vitamin D intakes of elementary school students. Revue Canadienne Prat Rech Dietet 1998;59:190-8.
Harrell JS, McMurray RG, Gansky SA, Bangdiwala SI, Bradley CB. A public health vs. a risk-based intervention to improve
cardiovascular health in elementary school children: the Cardiovascular Health in Children study. Am J Public Health
1999;89:1529-35.
Resnicow K, Cohn L, Reinhardt J, Cross D, Futterman R, et al. A three-year evaluation of the Know Your Body Program in
inner-city schoolchildren. Health Ed Qtrly 1992;19:463-80.
Reynolds KD, Franklin FA, Binkley D, Raczynski JM, Harrington KF, et al. Increasing the fruit and vegetable consumption
of fourth-graders: results from the High 5 Project. Preventive Medicine 2000;30:309-19.
Sahota P, Rudolf MCJ, Dixey R, Hill AJ, Barth JH, Cade J. Randomised controlled trial of primary school based intervention
to reduce risk factors for obesity. BMJ 2001;323:1029.
Sahota P, Rudolf MCJ, Dixey R, Hill AJ, Barth JH, et al. Evaluation of implementation and effect of primary school based
intervention to reduce risk factors for obesity. BMJ 2001;323:1027.
Sallis JF, McKenzie TL, Conway TL, Elder JP, Prochaska JJ, et al. Environmental interventions for eating and physical
activity: a randomized controlled trial in middle schools. Am J Prev Med 2003;24:209-17.
Simons-Morton BG, Parcel GS, Baranowski T, Forthofer R, O'Hara NM. Promoting physical activity and a healthful diet
among children: results of a school-based intervention study. Am J Public Health 1991;81:986-91.
Stewart KJ, Seemans CM, McFarland LD, Weinhofer JJ. Social learning versus traditional teaching in an elementary school
cardiovascular health promotion program. Am J Health Promotion 1997;11:194-7.
Tell GS, Vellar OD. Noncommunicable disease risk factor intervention in Norwegian adolescents: the Oslo Youth Study.
In: BS Hetzel and GS Berenson, ed. Cardiovascular Risk Factors in Childhood: epidemiology and prevention. Elsevier
Science Publishers B.V. 1987:203-17.
Thackeray R. The impact of a social marketing campaign on increasing fruit and vegetable consumption among middle
school adolescents. 2000. Doctoral Dissertation, University of Utah: 1-228.
Turnin MC, Tauber MT, Couvaras O, Jouret B, Bolonella C, et al. Evaluation of microcomputer nutritional teaching games
in 1,876 children at school. Diabetes Metab (Paris) 2001;27:459-64.
Archived Supporting Materials
Nutrition: School-Based Programs Promoting Nutrition and Physical Activity (2003 Archived Review) 39
Vandongen R, Jenner DA, Thompson C, Taggart AC, Spickett EE, et al. A controlled evaluation of a fitness and nutrition
intervention program on cardiovascular health in 10- to 12-year-old children. Preventive Medicine 1995;24:9-22.
Walter HJ, Hofman A, Vaughn RD, Wynder EL. Modification of risk factors for coronary heart disease. N Engl J Med
1988;318:1093-100.
Webber LS, Osganian SK, Feldman HA, Wu M, McKenzie TL, et al. Cardiovascular risk factors among children after a 2
1/2-year intervention--the CATCH study. Preventive Medicine 1996;25:432-41.
Wechsler H, Basch CE, Zybert P, Shea S. Promoting the selection of low-fat milk in elementary school cafeterias in an
inner-city Latino community: evaluation of an intervention. Am J Public Health 1998;88:427-33.
Whitaker RC, Wright JA, Koepsell TD, Finch AJ, Psaty BM. Randomized intervention to increase children's selection of
low-fat foods in school lunches. J Pediatr 1994;125(4):535–40.
Whitaker RC, Wright JA, Finch AJ, Psaty BM. An environmental intervention to reduce dietary fat in school lunches.
Pediatrics 1993;91:1107-11.
Search Strategies Electronic searches of the literature were conducted by a public health librarian in the databases listed below. The team
also reviewed the references listed in all retrieved articles, review articles, and systematic reviews, and consulted with
experts on the systematic review development team and elsewhere to identify additional articles. Articles were
excluded if they were not available in English. The initial literature search on the topic was conducted in 2002.
Total from 4 searches: 326 + 475 + 377 + 724 = 1902 (includes some overlap in results)
Database: MEDLINE, 326 Results
Timeframe: 1966 to October 5, 2002
Search for: 9 or 10 or 11 or 12
1. school based nutrition.tw. (28)
2. (nutrition: or diet or dietary or fruit or vegetable: or food habits or eating).tw,hw. (357251)
3. school:.tw,hw,jw. (112117)
4. 2 and 3 (5894)
5. 1 or 4 (5894)
6. 5 and ((education: or intervention: or program:).tw,hw. or ed.fs.) (2644)
7. limit 6 to english language (2253)
8. limit 7 to yr=1980-2003 (1974)
Database: MEDLINE, 475 Results
Timeframe: 1966 to March 3, 2003
1. schools/ (8051)
2. (nutrition$ or menu$ or meal$ or food$ or vending machine$ or lunch$ or breakfast$ or snack$).mp. (275580)
3. 2 not (foodborne.mp. or food poisoning/) (270459)
4. (physical activit$ or fitness).mp. or exercise/ or physical fitness/(49212)
Archived Supporting Materials
Nutrition: School-Based Programs Promoting Nutrition and Physical Activity (2003 Archived Review) 40
5. consumer education.mp. or health education/ (34203)
6. media literacy.mp. (11)
7. exp marketing/ (17657)
8. (fund raising$ or fundraising$).mp. (2676)
9. 4 or 5 or 6 or 7 or 8 (102272)
10. 9 and 3 (7827)
11. exp diabetes mellitus/pc or exp obesity/pc or exp cardiovascular diseases/pc (78994)
12. 3 or 10 or 11 (345623)
13. 1 and 12 (738)
14. limit 13 to (human and english language and yr=1980-2003)
Database: Health Promotion and Education Database, 377 Results
Major Descriptor = (nutrition* or diet or food* or eating*) and (school* or high school* or elementary school* or junior
high school*) and (intervention strategies or risk factor intervention or program*)
Form = not program
Year = 1980 - 2002
Databases searched: SYSTEM:OS - DIALOG OneSearch (724 Results)
File 5:Biosis Previews(R) 1969-2003/Feb W4 (c) 2003 BIOSISALERT.
File 10:AGRICOLA 70-2003/Feb (c) format only 2003 The Dialog Corporation
34:SciSearch(R) Cited Ref Sci 1990-2003/Feb W4 (c) 2003 Inst for Sci Info *
File 35:Dissertation Abs Online 1861-2003/Feb (c) 2003 ProQuest Info7&Learning
File 48:SPORTDiscus 1962-2003/Feb (c) 2003 Sport Information Resource Centre
50:CAB Abstracts 1972-2003/Jan (c) 2003 CAB International *
File 51:Food Sci.&Tech.Abs 1969-2003/Feb W4 (c) 2003 FSTA IFIS Publishing
File 53:FOODLINE(R): Food Science & Technology 1972-2003/Mar 03 (c) 2003 LFRA
File 65:Inside Conferences 1993-2003/Mar W1 (c) 2003 BLDSC all rts. reserv.
File 68:Env.Bib. 1972-2002/Jun (c) 2002 Internl Academy at Santa Barbara
File 71:ELSEVIER BIOBASE 1994-2003/Mar W1 (c) 2003 Elsevier Science B.V.
73:EMBASE 1974-2003/Feb W4 (c) 2003 Elsevier Science B.V. *
File 79:Foods Adlibra(TM) 1974-2002/Apr (c) 2002 General Mills *
91:MANTIS(TM) 1880-2002/Oct 2002 (c) Action Potential
94:JICST-EPlus 1985-2003/Mar W1 (c)2003 Japan Science and Tech Corp(JST) *
File 98:General Sci Abs/Full-Text 1984-2003/Jan (c) 2003 The HW Wilson Co.
135:NewsRx Weekly Reports 1995-2003/Feb W2 (c) 2003 NewsRx *File 135
143:Biol. & Agric. Index 1983-2003/Jan (c) 2003 The HW Wilson Co
144:Pascal 1973-2003/Feb W4 (c) 2003 INIST/CNRS
149:TGG Health&Wellness DB(SM) 1976-2003/Feb W3 (c) 2003 The Gale Group
155:MEDLINE(R) 1966-2003/Feb W4 (c) format only 2003 The Dialog Corp.
156:ToxFile 1965-2002/Dec W4 (c) format only 2003 The Dialog Corporation *.
File 162:CAB Health 1983-2003/Jan (c) 2003 CAB International *
Archived Supporting Materials
Nutrition: School-Based Programs Promoting Nutrition and Physical Activity (2003 Archived Review) 41
File 164:Allied & Complementary Medicine 1984-2003/Feb (c) 2003 BLHCIS
File 172:EMBASE Alert 2003/Mar W1 (c) 2003 Elsevier Science B.V.
File 203:AGRIS 1974-2003/Jan Dist by NAL, Intl Copr. All rights reserved
File 266:FEDRIP 2003/Jan Comp & dist by NTIS, Intl Copyright All Rights Res
File357:Derwent Biotech Res. _1982-2003/Mar W2 (c) 2003 Thomson Derwent & ISI *
File 434:SciSearch(R) Cited Ref Sci 1974-1989/Dec (c) 1998 Inst for Sci Info
File 442:AMA Journals 1982-2003/Jun B1 (c)2003 Amer Med Assn -FARS/DARS apply
File 444:New England Journal of Med. 1985-2003/Mar W1 (c) 2003 Mass. Med. Soc.
File 467:ExtraMED(tm) 2000/Dec (c) 2001 Informania Ltd.
File 482:Newsweek 2000-2003/Feb 28 (c) 2003 Newsweek, Inc.
Set Items Description
S1 921069 SCHOOL OR SCHOOLS OR K12 OR K(1)12 OR KINDERGARTEN OR GRADE()SCHOOL? ?
S2 8375141 OBESITY OR NUTRITION OR EXERCISE OR PHYSICAL()ACTIVITY OR - FOOD? OR BREAKFAST? ? OR LUNCH? OR
DINNER? OR SNACK? OR VENDI- NG()MACHINE? ? OR MENU OR MENUS OR DIABETES OR CARDIOVASCULAR OR FITNESS
OR MEDIA()LITERACY OR CONSUMER()EDUCATION
S3 519892 MEALS OR ADVERTISING OR MARKETING
S4 146144 S1 AND (S2 OR S3)/1980:2003
S5 42 S/TI AND (S2/TI AND S3/TI) AND S4
S6 29 RD S5 (unique items)
S7 1406 S1/DE AND (S2/DE AND S3/DE) AND S4
S8 1100 RD S7 (unique items)
8/5/1 (Item 1 from file: 5)
DIALOG®File 5:Biosis Previews®
© 2003 BIOSIS. All rts. reserv.
Disclaimer The findings and conclusions on this page are those of the Community Preventive Services Task Force and do not necessarily
represent those of CDC. Task Force evidence-based recommendations are not mandates for compliance or spending. Instead, they
provide information and options for decision makers and stakeholders to consider when determining which programs, services, and
policies best meet the needs, preferences, available resources, and constraints of their constituents.
Document last updated February 10, 2017