Embed Size (px)
Citation preview
2 0 0 1 A N N U A L R E P O R T
S I M P S O N M A N U F A C T U R I N G C O . , I N C .
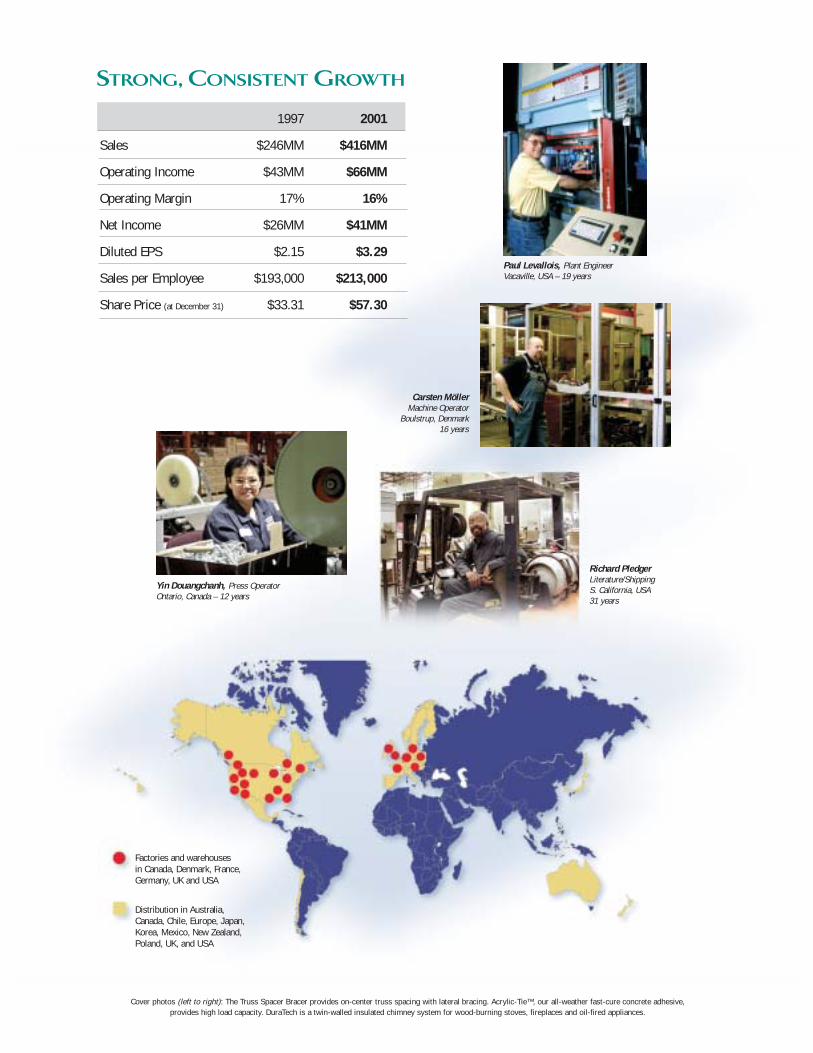
Cover photos (left to right): The Truss Spacer Bracer provides on-center truss spacing with lateral bracing. Acrylic-Tie™, our all-weather fast-cure concrete adhesive, provides high load capacity. DuraTech is a twin-walled insulated chimney system for wood-burning stoves, fireplaces and oil-fired appliances.
1997 2001
Sales $246MM $416MM
Operating Income $43MM $66MM
Operating Margin 17% 16%
Net Income $26MM $41MM
Diluted EPS $2.15 $3.29
Sales per Employee $193,000 $213,000
Share Price (at December 31) $33.31 $57.30
STRONG, CONSISTENT GROWTH
Factories and warehousesin Canada, Denmark, France,Germany, UK and USA
Distribution in Australia,Canada, Chile, Europe, Japan,Korea, Mexico, New Zealand,Poland, UK, and USA
Richard PledgerLiterature/ShippingS. California, USA31 years
Paul Levallois, Plant EngineerVacaville, USA – 19 years
Carsten MöllerMachine Operator
Boulstrup, Denmark 16 years
Yin Douangchanh, Press OperatorOntario, Canada – 12 years
1
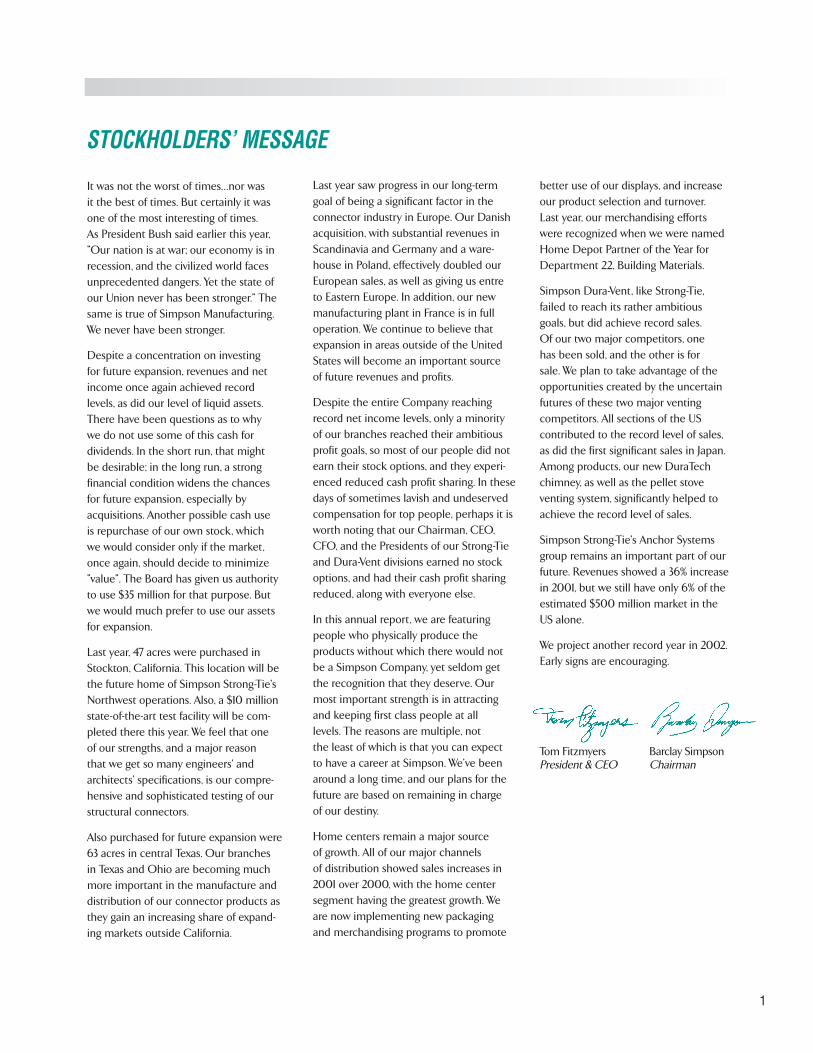
STOCKHOLDERS’ MESSAGE
It was not the worst of times…nor was
it the best of times. But certainly it was
one of the most interesting of times.
As President Bush said earlier this year,
"Our nation is at war; our economy is in
recession, and the civilized world faces
unprecedented dangers. Yet the state of
our Union never has been stronger." The
same is true of Simpson Manufacturing.
We never have been stronger.
Despite a concentration on investing
for future expansion, revenues and net
income once again achieved record
levels, as did our level of liquid assets.
There have been questions as to why
we do not use some of this cash for
dividends. In the short run, that might
be desirable; in the long run, a strong
financial condition widens the chances
for future expansion, especially by
acquisitions. Another possible cash use
is repurchase of our own stock, which
we would consider only if the market,
once again, should decide to minimize
"value". The Board has given us authority
to use $35 million for that purpose. But
we would much prefer to use our assets
for expansion.
Last year, 47 acres were purchased in
Stockton, California. This location will be
the future home of Simpson Strong-Tie's
Northwest operations. Also, a $10 million
state-of-the-art test facility will be com-
pleted there this year. We feel that one
of our strengths, and a major reason
that we get so many engineers' and
architects' specifications, is our compre-
hensive and sophisticated testing of our
structural connectors.
Also purchased for future expansion were
63 acres in central Texas. Our branches
in Texas and Ohio are becoming much
more important in the manufacture and
distribution of our connector products as
they gain an increasing share of expand-
ing markets outside California.
Last year saw progress in our long-term
goal of being a significant factor in the
connector industry in Europe. Our Danish
acquisition, with substantial revenues in
Scandinavia and Germany and a ware-
house in Poland, effectively doubled our
European sales, as well as giving us entre
to Eastern Europe. In addition, our new
manufacturing plant in France is in full
operation. We continue to believe that
expansion in areas outside of the United
States will become an important source
of future revenues and profits.
Despite the entire Company reaching
record net income levels, only a minority
of our branches reached their ambitious
profit goals, so most of our people did not
earn their stock options, and they experi-
enced reduced cash profit sharing. In these
days of sometimes lavish and undeserved
compensation for top people, perhaps it is
worth noting that our Chairman, CEO,
CFO, and the Presidents of our Strong-Tie
and Dura-Vent divisions earned no stock
options, and had their cash profit sharing
reduced, along with everyone else.
In this annual report, we are featuring
people who physically produce the
products without which there would not
be a Simpson Company, yet seldom get
the recognition that they deserve. Our
most important strength is in attracting
and keeping first class people at all
levels. The reasons are multiple, not
the least of which is that you can expect
to have a career at Simpson. We've been
around a long time, and our plans for the
future are based on remaining in charge
of our destiny.
Home centers remain a major source
of growth. All of our major channels
of distribution showed sales increases in
2001 over 2000, with the home center
segment having the greatest growth. We
are now implementing new packaging
and merchandising programs to promote
better use of our displays, and increase
our product selection and turnover.
Last year, our merchandising efforts
were recognized when we were named
Home Depot Partner of the Year for
Department 22, Building Materials.
Simpson Dura-Vent, like Strong-Tie,
failed to reach its rather ambitious
goals, but did achieve record sales.
Of our two major competitors, one
has been sold, and the other is for
sale. We plan to take advantage of the
opportunities created by the uncertain
futures of these two major venting
competitors. All sections of the US
contributed to the record level of sales,
as did the first significant sales in Japan.
Among products, our new DuraTech
chimney, as well as the pellet stove
venting system, significantly helped to
achieve the record level of sales.
Simpson Strong-Tie's Anchor Systems
group remains an important part of our
future. Revenues showed a 36% increase
in 2001, but we still have only 6% of the
estimated $500 million market in the
US alone.
We project another record year in 2002.
Early signs are encouraging.
Tom FitzmyersPresident & CEO
Barclay SimpsonChairman
2
10,000
20,000
30,000
40,000
50,000
60,000
70,000
80,000
90,000
100,000
110,000
120,000
130,000
140,000
150,000
160,000
170,000
180,000
190,000
200,000
210,000
220,000
230,000
240,000
250,000
260,000
97 98 99 00 01
270,000
280,000
290,000
Percent2001 2000 Change
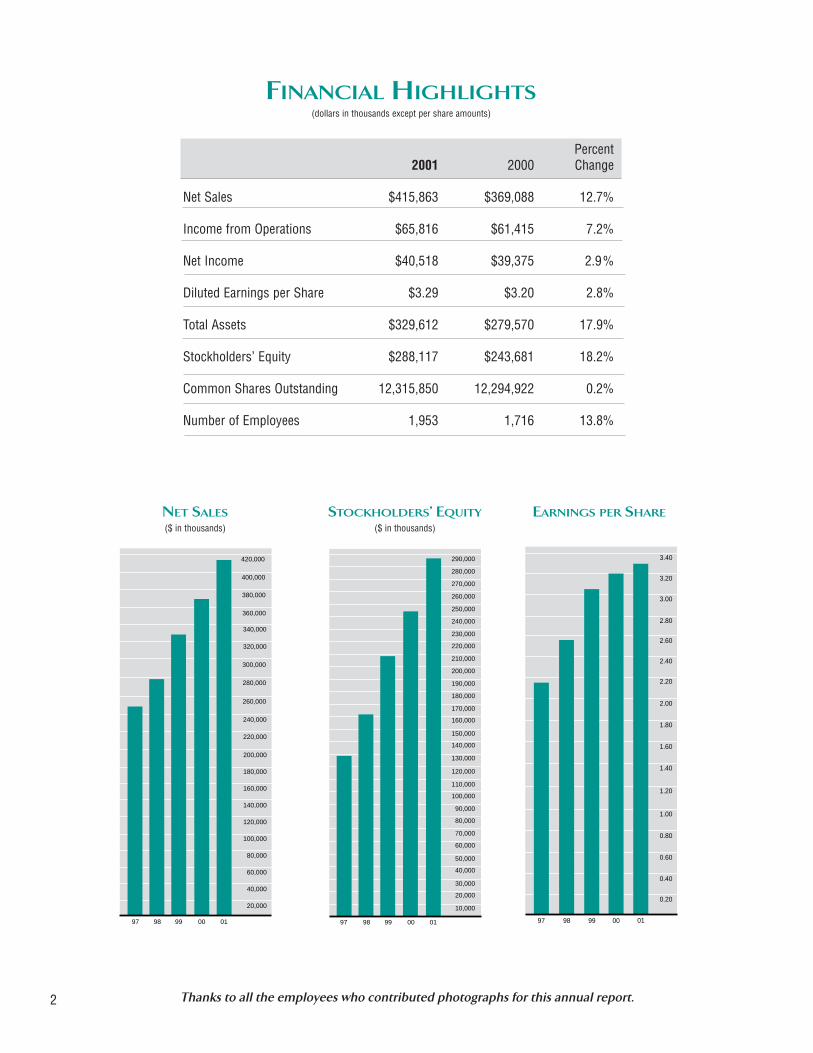
Net Sales $415,863 $369,088 12.7%
Income from Operations $65,816 $61,415 7.2%
Net Income $40,518 $39,375 2.9%
Diluted Earnings per Share $3.29 $3.20 2.8%
Total Assets $329,612 $279,570 17.9%
Stockholders’ Equity $288,117 $243,681 18.2%
Common Shares Outstanding 12,315,850 12,294,922 0.2%
Number of Employees 1,953 1,716 13.8%
FINANCIAL HIGHLIGHTS(dollars in thousands except per share amounts)
0.20
0.40
0.60
0.80
1.00
1.20
1.40
1.60
1.80
2.00
2.20
2.40
2.60
2.80
3.00
3.20
97 98 99 00 01
3.40
($ in thousands)
340,000
360,000
97 98 99 00 01
240,000
260,000
380,000
200,000
180,000
160,000
140,000
120,000
100,000
80,000
60,000
40,000
20,000
220,000
280,000
320,000
300,000
400,000
420,000
NET SALES($ in thousands)
STOCKHOLDERS’ EQUITY EARNINGS PER SHARE
Thanks to all the employees who contributed photographs for this annual report.
AN OVERVIEW
Simpson Manufacturing Co., Inc. entered the connector business
in 1956. Today, it is a growing international company focused on
manufacturing and marketing building products. Through our
largest subsidiary, Simpson Strong-Tie Company Inc., we design,
engineer and manufacture structural connectors, shearwalls,
anchors, adhesives and other products for new construction,
remodeling and do-it-yourself markets. Our other subsidiary,
Simpson Dura-Vent Company, Inc., designs and manufactures
venting systems for gas and wood-burning appliances.
PERSONAL COMMITMENT
Despite the challenges presented during the past year, our
company's strength continues to be our employees’ personal
commitment to No-Equal performance at all levels of our
operation. This year, we are pleased to recognize some of the
many dedicated men and women who manufacture and distrib-
ute our products to our customers. We salute the people who
have contributed many years to the success of our company;
including some veterans with more than 25 years employment.
The company's ability to develop and retain a cohesive, experi-
enced management team is a key factor in our success. For
example, over the past five years several major competitors in
the venting industry have been sold, resulting in high turnover
of key employees. In contrast, key management and middle
management employees at Simpson Dura-Vent have an average
of 16 years of service.
The result is consistent
quality, service, and the
experience to both
recognize and quickly
implement strategic
opportunities.
3
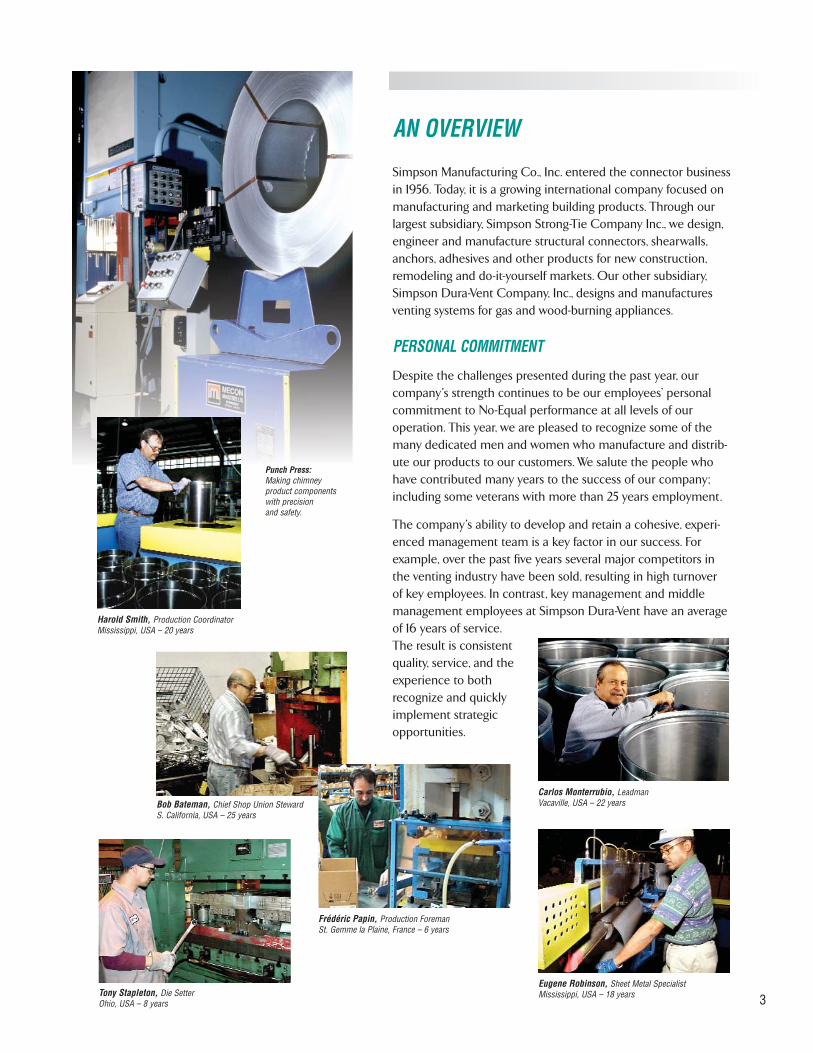
Punch Press:Making chimney product components with precision and safety.
Eugene Robinson, Sheet Metal SpecialistMississippi, USA – 18 years
Carlos Monterrubio, LeadmanVacaville, USA – 22 years
Harold Smith, Production CoordinatorMississippi, USA – 20 years
Tony Stapleton, Die SetterOhio, USA – 8 years
Frédéric Papin, Production ForemanSt. Gemme la Plaine, France – 6 years
Bob Bateman, Chief Shop Union StewardS. California, USA – 25 years
4
FOCUS ON THE CUSTOMER
At the close of our 45th year of
operations, Simpson remains the
leader in our industry by continuing
to focus on the needs and demands
of our customers. Every day, we
strive to earn the trust and loyalty of
our customers by putting them first
when we consider new products,
expanded facilities, and improved
service capabilities.
DESERVE THE SPECIFICATION
We are the brand most frequently
specified by professional engineers
and architects. However, selection of
our products could also come from a
contractor, a home builder, a distribu-
tor, a related manufacturer or an end-
user. Any of these may play a critical
role in the decision to specify
Simpson.
No one else in our industry does more
to develop new products, enhance
product quality, offer a broad product
line, or provide such extensive sales
and engineering support, including
state-of-the-art testing facilities. We
have the largest inventory commit-
ment in our field and the greatest
capability for production of customer-
specified products. No one offers
more professional-level seminars,
informative and accurate literature,
or a greater range of specifications
from which to choose. These are the
reasons people prefer our brand.
Eva Bisgaard Rasmussen, Machine OperatorBoulstrup, Denmark – 6 years
Butch Phillips, Supervisor - Fittings Dept.Mississippi, USA – 18 years
Dale Webb, Press OperatorOhio, USA – 8 years
Johnny Flagg, Supervisorand Janice Prescott, OperatorMississippi, USA – 31 years combined
Dennis Held, Lab QCIllinois, USA – 7 years
David McDonald, Plant SuperintendentN. California, USA – 18 years
Gary Mitchell, Specials Tech Support for UtilityTexas, USA – 13 years
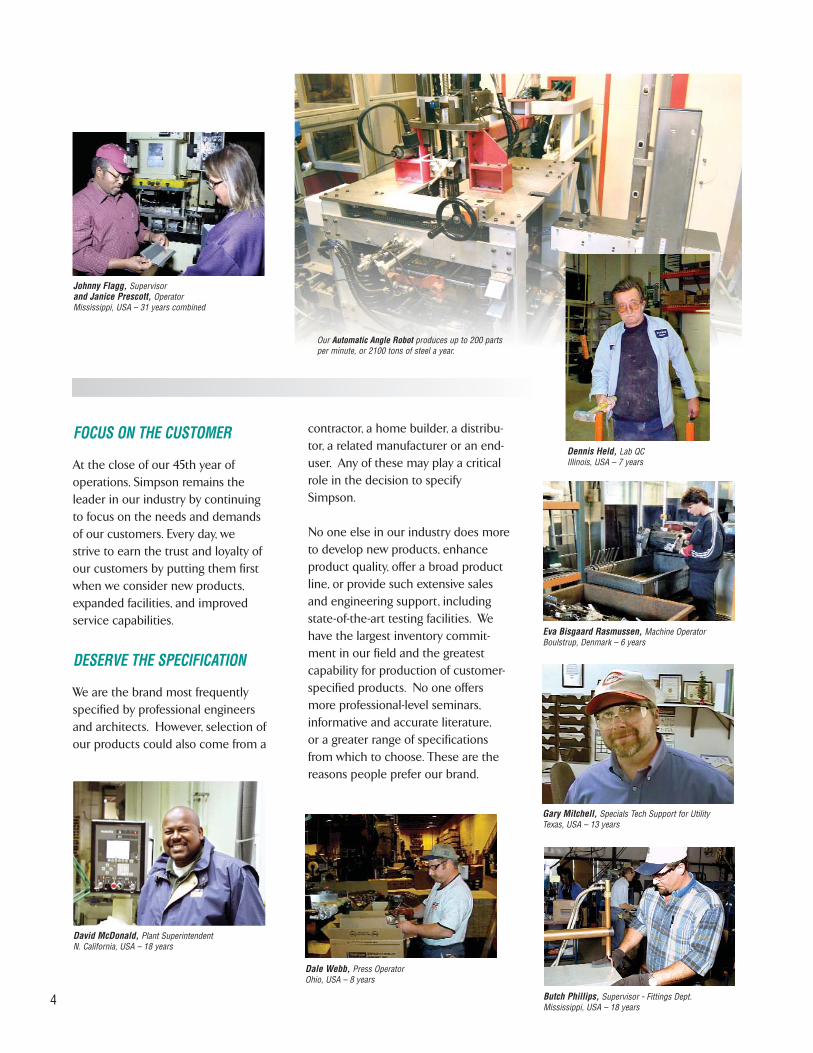
Our Automatic Angle Robot produces up to 200 parts per minute, or 2100 tons of steel a year.
5
CODE SUPPORT
With the introduction of the new International Building Code/2000
(IBC) and the International Residential Code/2000 (IRC), Simpson
finds the building industry acknowledging load path requirements
that we have used in our design practices for more than 20 years.
Since 1999, we have under-
taken to inform and educate
the general public on these
requirements through our
Well-Connected House™
campaign.
The IBC (Section 1604.4
Analysis) specifically states
that "Any system or method
of construction to be used
shall be based on a rational
analysis in accordance with the well-established principles of
mechanics. Such analysis shall result in a system that provides a
complete load path capable of transferring loads from their point of
origin to the load-resisting elements to the foundation."
Similarly, the IRC states "The construction of buildings and structures
shall result in a system that provides a complete load path capable
of transferring all loads from their point of origin through the load-
resisting elements to the foundation."
With over 5,000 different products devoted to building safer, stronger
structures, Simpson welcomes the continued attention of the
code agencies on better building
practices, more efficient designs,
and safer structures.
Celia Hallman, Quality Control Dept.Vacaville, USA – 12 years
Max Strawn, Tool and DieTexas, USA – 13 years
Gary Raines, Press OperatorS. California, USA – 29 years
Bruno Garnier, Production ForemanSt. Gemme la Plaine, France – 12 years
Lloyd Cunningham, Assistant ForemanOntario, Canada – 23 years
Ronald Chavez, Head LeadpersonN. California, USA – 23 years
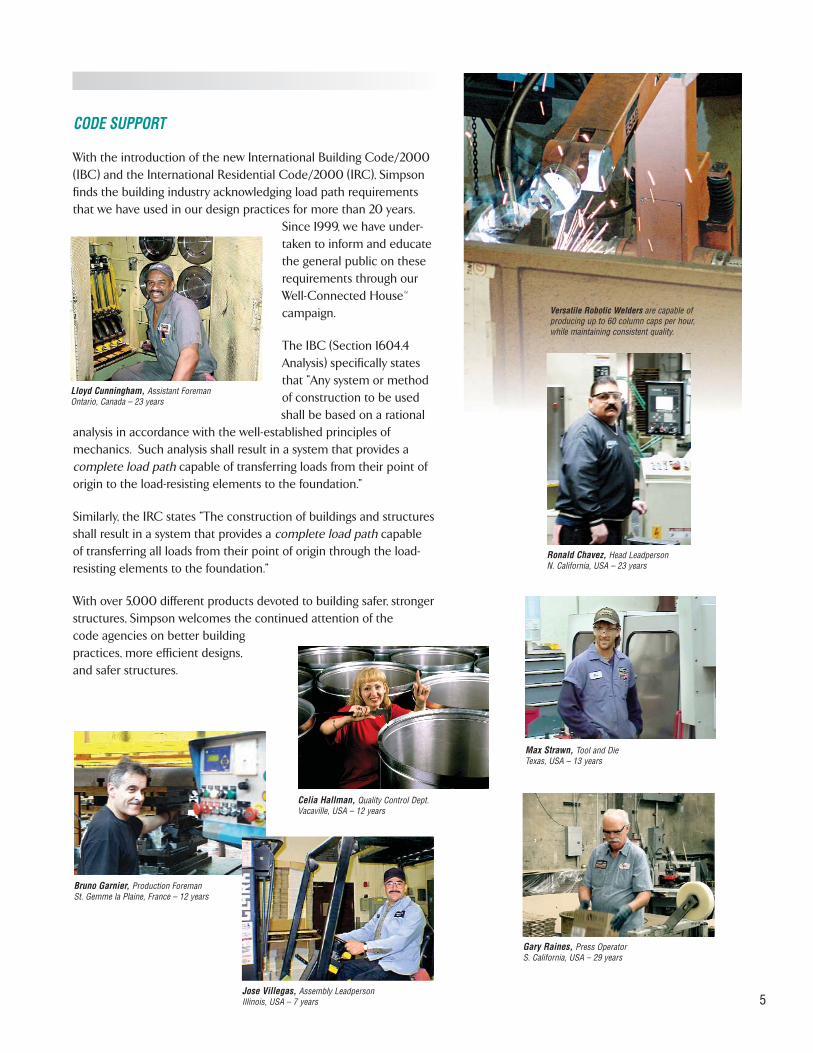
Versatile Robotic Welders are capable of producing up to 60 column caps per hour, while maintaining consistent quality.
Jose Villegas, Assembly LeadpersonIllinois, USA – 7 years
6
INNOVATIONS IN BUILDING PRODUCTS
Among the new products introduced
this year, three have generated particu-
lar interest in the building trades, and
represent Simpson’s leadership in
bringing innovative products to market.
The insulated concrete form (ICF)
ledger connector system solves the
challenges of mounting steel or wood
ledgers on ICF walls in residential or
commercial structures.
The TSB truss spacer/bracer provides
permanent lateral bracing or tempo-
rary erection bracing for wood truss
installation.
Simpson now has eight sizes of Strong-
Drive® screws. They are a significant
improvement over lag screws in speed,
ease of installation and performance.
SOFTWARE SUPPORT
Simpson's exclusive Connector Selector
program simplifies the architect’s or
structural engineer's task in preparing
plan drawings, using a dynamically
linked library for product selection by
load rating and application.
The program takes input such as
lumber dimensions and load require-
ments for floor and roof systems
and returns a list of connectors. It
considers an impressive variety of
constraints before presenting safe
and accurate choices for the
designer to review.
Connector Selector is designed to
be integrated with software used by
our colleagues in the plated truss
and composite wood industries.
It is also available as a stand-alone
version that can be loaded on any
desktop PC computer.
MANUFACTURING PRODUCTIVITY
Lean manufacturing, continuous
incremental improvement, and con-
tinuous flow are more than buzz-
words at our company. For example,
Simpson Dura-Vent practices the
"Kaizen" system, developed by Toyota
Motor Company, which makes fast-
paced teams of workers and man-
agers responsible for eliminating
"muda," which means “waste” in
Japanese. Our results have been
significant increases in productivity.
Diane Crowley, Production OperatorTamworth, UK – 4 years
Lynn Morley, Press SupervisorOntario, Canada – 15 years
Esequiel Villarreal, FormulatorIllinois, USA – 6 years
Paul Childress, Utility LeadTexas, USA – 13 years
Tony Cervantez, Plant SuperintendentN. California, USA – 13 years
William Echevarria, Specials TechnicianN. California, USA – 14 years
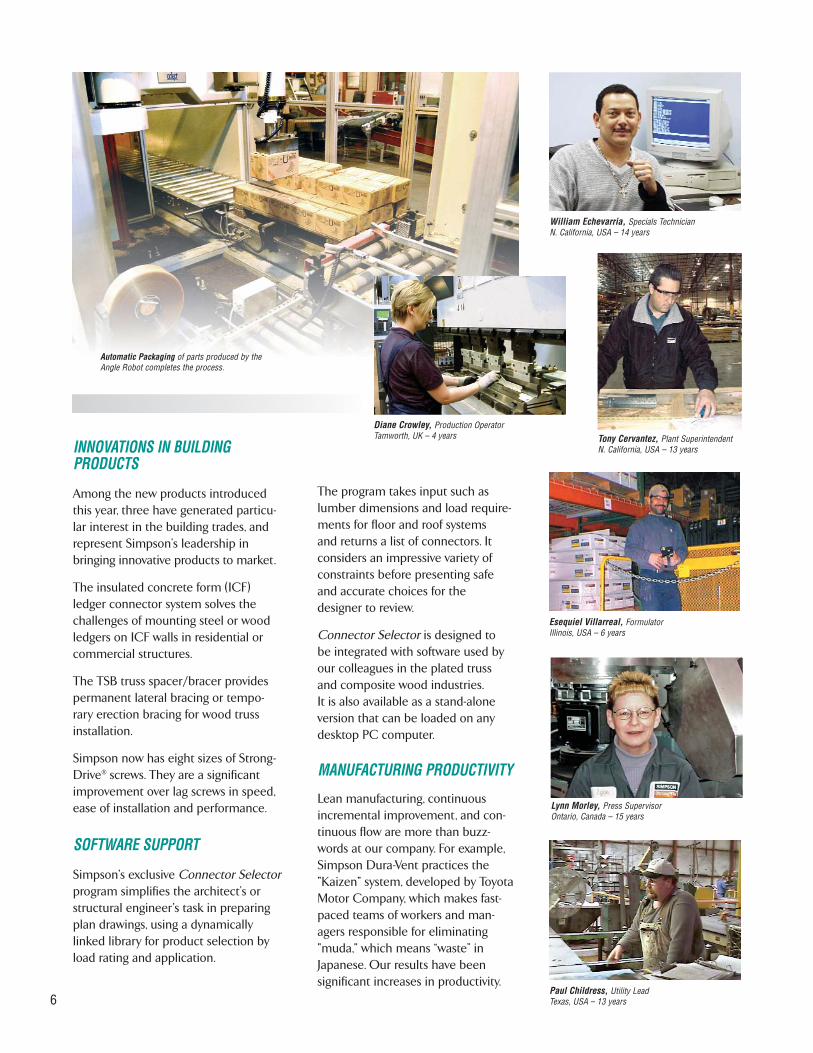
Automatic Packaging of parts produced by the Angle Robot completes the process.
Tom Houser, Epoxy LeadpersonIllinois, USA – 7 years
7
DOMESTIC DEVELOPMENTS
To meet the growing demands of our customers, as well as increased requirements
for research and development lab space, Simpson is constructing a new R&D lab
and manufacturing and distribution facility in Stockton, California. Not only will
this enable greater service levels in the Western US, but it will also provide space
for additional research and testing of our successful line of Strong-Wall® shearwalls
and whole-house systems.
We continue to grow our business in
markets throughout North America. Our
presence in Anchor markets has increased;
this opens up new opportunities to us, as
this product line’s channel of distribution
is different to our traditional building
supply distribution.
In venting products, the wood stove
chimney market continues to be
segmented into triple-wall chimney
versus twin-wall chimney. Simpson
Dura-Vent continues to find success in promoting DuraTech, a twin-wall insulated
chimney system, and has been able to convert a number of our competitor's
distributors to Simpson Dura-Vent in 2001. The DuraTech line includes the
auxiliary products, Dura Black and DVL stove pipe.
INTERNATIONAL PROGRESS
The year saw continued progress in the integration
of several European facilities into the Simpson fami-
ly. All production in France is now flowing through
our new plant, which opened in the spring of 2001.
BMF Bygningsbeslag A/S, last year’s major Danish
acquisition, is providing substantially increased
sales as well as enhancing our manufacturing and
marketing capabilities. It has strengthened our
reputation for quality in Europe.
We continue to maintain our market presence in
the Caribbean, Chile, Japan, Korea, Australia, and
New Zealand.
Lise Lotte Madsen, Machine OperatorBoulstrup, Denmark – 4 years
Pedro Mendez, Tool and DieTexas, USA – 14 years
Tony Hooker, Backup Lead, Shipping Dept.Ohio, USA – 9 years
Marc Maupetit, Tool and DieSt. Gemme la Plaine, France – 13 years
Egisto Deluca, ForemanOntario, Canada – 34 years
Rick Beeman, Automatic Press OperatorS. California, USA – 25 years
Clifford Grant, Plant SupervisorWashington, USA – 18 years
BOARD OF DIRECTORS
OFFICERSOFFICES
Street Address:
4120 Dublin Blvd.
Suite 400
Dublin, CA 94568
USA
(925) 560-9000
Mailing Address:
P.O. Box 2969Dublin, CA 94568
USA
Barclay Simpson
Chairman
Thomas J Fitzmyers
President and Chief Executive Officer
Michael J. Herbert
Chief Financial Officer, Treasurer and Secretary
Stephen B. Lamson
President and Chief Operating Officer,
Simpson Strong-Tie Company Inc.
Donald M. Townsend
President and Chief Executive Officer,
Simpson Dura-Vent Company, Inc.
Barclay Simpson {1}{4}
Chairman
Thomas J Fitzmyers
President and Chief Executive Officer
Stephen B. Lamson
President and Chief Operating Officer,
Simpson Strong-Tie Company Inc.
Earl F. Cheit {2}{4}
Dean Emeritus of the Haas School of Business
University of California, Berkeley
Peter N. Louras, Jr. {1}{3}{4}
Group Vice President (retired),
The Clorox Company
Sunne Wright McPeak {2}{4}
Chief Executive Officer of the
Bay Area Council
Barry Lawson Williams {1}{2}{3}{4}
Investment and business consultant and
member of the California State Bar
{1} Member of Compensation Committee{2} Member of Audit Committee{3} Member of Stock Option Committee{4} Member of Growth Committee
8
9
UNITED STATES
SECURITIES AND EXCHANGE COMMISSION Washington, D.C. 20549
FORM 10-K (Mark One) [ X ] Annual Report Pursuant to Section 13 or 15(d) of the Securities Exchange Act of 1934 for the fiscal year ended December 31, 2001 OR [ ] Transition Report Pursuant to Section 13 or 15(d) of the Securities Exchange Act of 1934 for the transition period from __________ to __________. Commission file number: 0-23804 Simpson Manufacturing Co., Inc. (Exact name of registrant as specified in its charter) Delaware 94-3196943 (State or other jurisdiction of (I.R.S. Employer incorporation or organization) Identification No.) 4120 Dublin Boulevard, Suite 400, Dublin, CA 94568 (Address of principal executive offices) Registrant’s telephone number, including area code: (925) 560-9000 Securities registered pursuant to Section 12(b) of the Act: Common Stock, par value $0.01 New York Stock Exchange, Inc. (Title of each class) (Name of each exchange on which registered) Securities registered pursuant to Section 12(g) of the Act: None (Title of class) Indicate by check mark whether the registrant (1) has filed all reports required to be filed by Section 13 or 15(d) of the Securities Exchange Act of 1934 during the preceding 12 months (or for such shorter period that the registrant was required to file such reports), and (2) has been subject to such filing requirements for the past 90 days. Yes X No Indicate by check mark if disclosure of delinquent filers pursuant to Item 405 of Regulation S-K is not contained herein, and will not be contained, to the best of registrant’s knowledge, in definitive proxy or information statements incorporated by reference in Part III of this Form 10-K or any amendment to this Form 10-K. [X] As of March 21, 2002, there were outstanding 12,188,218 shares of the registrant’s common stock, par value $0.01, which is the only outstanding class of common or voting stock of the registrant. The aggregate market value of the shares of common stock held by nonaffiliates of the registrant (based on the closing price for the common stock on the New York Stock Exchange on March 21, 2002) was approximately $493,716,779. Documents Incorporated by Reference The information called for by Part III is incorporated by reference to the definitive Proxy Statement for the Annual Meeting of Stockholders of the Company to be held May 13, 2002, which will be filed with the Securities and Exchange Commission not later than 120 days after December 31, 2001.
10
This document contains forward-looking statements, based on numerous assumptions and subject to risks and uncertainties. Although the Company believes that the forward-looking statements are reasonable, it does not and cannot give any assurance that its beliefs and expectations will prove to be correct. Many factors could significantly affect the Company’s operations and cause the Company’s actual results to be substantially different from the Company’s expectations. Those factors include, but are not limited to: (i) general economic and construction business conditions; (ii) customer acceptance of the Company’s products; (iii) materials and manufacturing costs; (iv) the financial condition of customers, competitors and suppliers; (v) technological developments; (vi) increased competition; (vii) changes in capital market conditions; (viii) governmental and business conditions in countries where the Company’s products are manufactured and sold; (ix) changes in trade regulations; (x) the effect of acquisition activity; (xi) changes in the Company’s plans, strategies, objectives, expectations or intentions; and (xii) other risks and uncertainties indicated from time to time in the Company’s filings with the Securities and Exchange Commission. Actual results might differ materially from results suggested by any forward-looking statements in this report. The Company does not have an obligation to publicly update any forward-looking statements, whether as a result of the receipt of new information, the occurrence of future events or otherwise.
PART I Item 1. Business. Background Simpson Manufacturing Co., Inc. (the “Company”), through its subsidiary, Simpson Strong-Tie Company Inc. (“Simpson Strong-Tie” or “SST”), designs, engineers and is a leading manufacturer of wood-to-wood, wood-to-concrete and wood-to-masonry connectors and shearwalls. SST also offers a full line of adhesives, mechanical anchors and powder actuated tools for concrete, masonry and steel. The Company’s subsidiary, Simpson Dura-Vent Company, Inc. (“Simpson Dura-Vent” or “SDV”), designs, engineers and manufactures venting systems for gas and wood burning appliances. The Company markets its products to the residential construction, light industrial and commercial construction, remodeling and do-it-yourself (“DIY”) markets. The Company believes that SST benefits from strong brand name recognition among architects and engineers who frequently specify in building plans the use of SST products, and that SDV benefits from strong brand name recognition among contractors, dealers, distributors and original equipment manufacturers (“OEMs”) to which SDV markets its products. The Company has continuously manufactured structural connectors since 1956. See Note 14 to the Company’s consolidated financial statements for information regarding the net sales, income from operations, depreciation and amortization, capital expenditures and acquisitions and total assets for the Company’s two primary segments. Connectors produced by Simpson Strong-Tie typically are steel devices that are used to strengthen, support and connect joints in residential and commercial construction and DIY projects. SST’s Anchor Systems product line is included in the connector product segment. These products enhance the safety and durability of the structures in which they are installed and can save time and labor costs for the contractor. SST’s connector products increase structural integrity and improve structural resistance to seismic, wind and other forces. Applications range from commercial and residential building, to deck construction, to DIY projects. SST produces and markets over 5,000 standard and custom products. Simpson Dura-Vent’s venting systems are used to vent gas furnaces and water heaters, gas fireplaces and stoves, wood burning stoves and pellet stoves. SDV’s metal vents, chimneys and chimney liner systems exhaust the products of combustion to the exterior of the building, and some products also introduce outside air into the appliance for more efficient combustion. SDV designs its products for ease of assembly and safe operation and to achieve a high level of performance. SDV produces and markets approximately 2,400 different venting products. The Company emphasizes continuous new product development and often obtains patent protection for its new products. The Company’s products are marketed in all 50 states of the United States and in Europe, Canada, Japan, Australia, New Zealand and several countries in Central and South America. Both Simpson Strong-Tie and Simpson Dura-Vent products are distributed through a contractor and dealer distributor network, home centers and OEMs. The Company has developed and uses automated manufacturing processes. Its innovative manufacturing systems and techniques have allowed it to control manufacturing costs, even while developing both new products and products that meet customized requirements and specifications. The Company’s development of specialized manufacturing processes has also permitted increased operating flexibility and enhanced product design innovation. The Company has developed a quality management system that employs numerous quality-control procedures. Since 1996, SST’s quality management system has been registered under ISO 9001. The Company has 14 manufacturing locations in the United States, Canada, France, Denmark and England.
11
The Company is a Delaware corporation organized and merged with its predecessor company in 1999. The Company serves as a holding company for Simpson Strong-Tie, and its subsidiaries, and for Simpson Dura-Vent. Industry and Market Trends Based on trade periodicals, participation in trade and professional associations and communications with governmental and quasi-governmental organizations and with customers and suppliers, the Company believes that a variety of events and trends have resulted in significant developments in the markets that the Company serves. The Company’s products are designed to respond to increasing demand resulting from these trends. Some of these events and trends are discussed below. Natural disasters throughout the world have focused attention on safety concerns relating to the structural integrity of homes and other buildings. The 1995 earthquake in Kobe, Japan, the 1994 earthquake in Northridge, California, the 1989 Loma Prieta earthquake in Northern California, Hurricanes Hugo in 1989 and Andrew in 1992 in the Southeast, and other less cataclysmic natural disasters damaged and destroyed innumerable homes and other buildings, resulting in heightened consciousness of the fragility of some of those structures. In recent years, architects, engineers, model code agencies, contractors, building inspectors and legislators have continued efforts to improve structural integrity and safety of homes and other buildings in the face of disasters of various types, including seismic events, storms and fires. Based on ongoing participation in trade and professional associations and communications with governmental and quasi-governmental regulatory agencies, the Company believes that building codes, such as the International Building Code (“IBC”), are being more uniformly applied around the country and their enforcement is becoming more rigorous. Recently, there has been consolidation among several of the Company’s customer groups. The industry is also experiencing increased complexity in home design and builders are more aggressively trying to reduce their costs. The Company is responding to these trends by marketing its products as systems solutions rather than as individual parts. In some cases, systems marketing is facilitated by the use of sophisticated design and specification software. The requirements of the Endangered Species Act, the Federal Lands Policy Management Act and the National Forest Management Act have reduced the amount of timber available for harvest from public lands. Over the past several years, this and other factors have led to the increased use of engineered wood products. Engineered wood products, which substitute for strong, clear-grained lumber historically obtained from logging older, large-diameter trees, have been developed to conserve lumber. Engineered wood products frequently require specialized connectors. Sales of Simpson Strong-Tie’s engineered wood connector products increased significantly over the past several years. Concerns about energy conservation and air quality have led to increasing recognition of the advantages of natural gas as a heating fuel, including its clean burning characteristics. Use of natural gas for home heating has been increasing in the United States over a number of years, although increases in prices have made alternative energy sources more attractive. In 2000 and the first half of 2001, the high cost of home heating oil, natural gas, and electricity resulted in increased demand for wood burning appliances and pellet stoves, although this trend appears to have slowed more recently as energy prices have decreased. The Company continues to develop its distribution through home centers throughout the United States. The Company’s sales to home centers increased significantly in 2000 and 2001. See “Item 7 – Management’s Discussion and Analysis of Financial Condition and Results of Operations.” Business Strategy The Company designs, manufactures and sells products that are of high quality and performance, easy to use and cost-effective for customers. The Company provides rapid delivery of its products and prompt engineering and sales support. Based on its communications with customers, engineers, architects, contractors and other industry participants, the Company believes that its products have strong brand name recognition, and the Company seeks to continue to develop the value of its brand names through a variety of customer-driven strategies. Information provided by customers has led to the development of many of the Company’s products, and the Company expects that customer needs will continue to shape the Company’s product development, marketing and services. Specification in architects’ and engineers’ plans and drawings influences which products will be used for particular purposes and therefore is key to the use of the Company’s products in construction projects. The Company
12
encourages architects and engineers to specify the installation of the Company’s products in projects they design and supervise, and encourages acceptance of the Company’s products by construction contractors. The Company maintains frequent contacts with architects, engineers and contractors, as well as private organizations that provide information to building code officials, both to inform them regarding the quality, proper installation, capabilities and value of the Company’s products and to update them about product modifications and new products that may be useful or needed. The Company sponsors seminars to inform architects, engineers, contractors and building officials on appropriate use and proper installation of the Company’s products. The Company seeks to expand its product and distribution coverage through several channels: Distributors. The Company regularly evaluates its distribution coverage and service levels provided by its distributors and from time to time modifies its distribution strategy and implements changes to address weaknesses and opportunities. The Company has various programs to evaluate distributor product mix and conducts promotions to encourage distributors to add Company products that complement their mix of product offerings in their markets. Through its efforts to increase specifications by architects and engineers, and through increasing the number of products sold to particular contractors, the Company seeks to increase sales to channels that serve building contractors. The Company continuously seeks to expand the number of contractors served by each distributor through such sales efforts as demonstrations of product cost-effectiveness and information programs. Home Centers. The Company intends to continue to increase penetration of the DIY markets by solicitation of home centers. The Company’s Sales Representatives and Retail Specialists maintain on-going contact with home centers to provide timely product availability and product knowledge training. To satisfy specialized requirements of the home center market, the Company has developed extensive bar coding and merchandising aids and has concentrated a portion of its research efforts on the development of DIY products. OEM Relationships. The Company works closely with manufacturers of engineered wood products and OEMs in developing and expanding the application and sales of Simpson Strong-Tie’s engineered wood connector products and Simpson Dura-Vent’s gas, wood and pellet stove venting products. SST has relationships with several of the largest manufacturers of engineered wood products, and SDV has OEM relationships with several major gas fireplace and gas stove manufacturers. The Company is expanding its established facilities outside California to increase its presence and sales in markets east of the Rocky Mountains. During the last five years, the Company has expanded or has plans to expand many of its manufacturing and warehouse facilities. As a result of the high sales growth in California in 2000, sales in the 37 states east of the Rocky Mountains, while continuing to grow, have declined as a percentage of domestic sales from approximately 47% in 1999 to approximately 44% in 2001. Since 1993, the Company has established operations in the United Kingdom, opened warehouse and distribution facilities in Western Canada, the Northeastern United States, purchased anchor products manufacturers in Illinois and Eastern Canada, connector product manufacturers in France and Denmark, and acquired the shares of the German company that it did not already own. The Company has also established distribution in Chile, Japan, Australia and New Zealand. The European investments are intended to establish a presence in the European Community through companies with existing customer bases and through servicing U.S.-based customers operating there. The Company intends to continue to pursue and expand operations both inside and outside of the United States (see Note 14 to the Company’s consolidated financial statements). A Company goal is to manufacture and warehouse its products in geographic proximity to its markets to provide availability and rapid delivery of products to customers and prompt response to customer requests for specially designed products and services. With respect to the DIY and dealer markets, the Company’s strategy is to keep the customer’s retail stores continuously stocked with adequate supplies of the full line of the Company’s products that those stores carry. The Company manages its inventory to help assure continuous product availability. Most customer orders are filled within a few days. High levels of manufacturing automation and flexibility allow the Company to maintain its quality standards while continuing to provide prompt delivery. The Company’s product research and development is based largely on needs that customers communicate to the Company. The Company typically has developed 10 to 20 new products annually (some of which may be produced in a range of sizes). The Company’s strategy is to develop new products on a proprietary basis, patent them where possible, and to seek trade secret protection for others.
13
The Company’s long-term strategy is to develop, acquire or invest in product lines or businesses that (a) complement the Company’s existing product lines, (b) can be marketed through its existing distribution channels, (c) might benefit from use of the Simpson Strong-Tie and Simpson Dura-Vent brand names, (d) are responsive to needs of the Company’s customers and (e) expand its markets geographically. Simpson Strong-Tie Overview Connectors produced by Simpson Strong-Tie typically are steel devices that are used to strengthen, support and connect joints in residential and commercial construction and DIY projects. These products enhance the safety and durability of the structures in which they are installed and can save time and labor costs for the contractor. SST’s connector products increase structural integrity and improve structural resistance to seismic, wind and other forces. Applications range from building framing to deck construction to DIY projects. SST produces and markets over 5,000 standard and custom products. In the United States, connector usage developed faster in the West than elsewhere due to the low cost and abundance of timber and to local construction practices. Increasingly, the market has been influenced both by a growing awareness that the devastation caused by seismic, wind and other disasters can be reduced through improved building codes and construction practices and by environmental concerns that contribute to the increasing cost and reduced availability of wood. Most Simpson Strong-Tie products are listed by recognized building standards agencies as complying with model building codes and are specified by architects and engineers for use in projects they are designing or supervising. The engineered wood products industry is developing in response to concerns about the availability of wood, and the Company believes that SST is the leading supplier of connectors for use with engineered wood products. Products Simpson Strong-Tie is a recognized brand name in the markets it serves. SST manufactures and markets products that strengthen the three types of connections found in residential and commercial construction: wood-to-wood, wood-to-concrete and wood-to-masonry. The Company’s products are installed on the continuous load path from the foundation to the roof system. SST also markets specialty screws and nails for proper installation of certain of its connector products. These products have seismic, retrofit and remodeling applications for both new construction and DIY markets. SST also offers a full line of adhesives, mechanical anchors and powder actuated tools for numerous anchoring applications in concrete, masonry and steel. Almost all of Simpson Strong-Tie’s products are listed by recognized model building code agencies. To achieve such listings, SST conducts extensive product testing, which is witnessed and certified by independent testing engineers. The tests also provide the basis for publication of load ratings for SST structural connectors, and this information is used by architects, engineers, contractors and homeowners. The information is useful across the range of applications of SST’s products, from the deck constructed by a homeowner to a multi-story structure designed by an architect or engineer in an earthquake zone. Simpson Strong-Tie also manufactures connector products specifically designed for use with engineered wood products, such as wood I-joists. With increased timber costs and reduced availability of trees suitable for making traditional solid sawn lumber, construction with engineered wood products has increased substantially in the last several years. Over the same period, SST’s net sales of engineered wood connectors through dealer and contractor distributors and engineered wood product manufacturers have also increased significantly. New Product Development Simpson Strong-Tie commits substantial resources to engineering and new product development and the majority of its products have been developed through SST’s internal research and development program. SST typically has developed 10 to 20 new products each year. SST’s research and development expense for the three years ended December 31, 2001, 2000 and 1999, was $2,309,000, $1,771,000 and $1,376,000, respectively. In 2002, SST expects to complete construction of its state-of-the-art testing facility in Stockton, California. As part of the new product development process, SST engineers, in cooperation with sales and marketing staff, meet regularly with architects, engineers, building inspectors, code officials and customers. Several new products derived from existing product lines are developed annually. SST developed and introduced a pre-fabricated shear-wall product for the new
14
construction market and has expanded its line of chemical and mechanical Anchor products. The Company believes that existing distribution channels are receptive to product line extensions, thereby enhancing SST’s ability to enter new markets. Sales and Marketing Simpson Strong-Tie’s sales and marketing programs are implemented through SST’s branch system. SST currently maintains branches in Northern and Southern California, Texas, Ohio, Canada, England, France and Denmark. Each branch is served by its own sales force, as well as manufacturing, warehouse and office facilities. Each branch is responsible for a broad geographic area. Branch managers have significant autonomy in managing their operations. Each is responsible for setting and executing sales and marketing strategies that are consistent with the markets that the branch serves and the goals of the Company. Each domestic branch is an independent profit center with a cash profit sharing bonus program based on its own performance. At the same time, the domestic branches closely integrate their manufacturing activities to enhance product availability. Branch sales forces in the U.S. are supported by marketing managers in the home office in Dublin, California. The sales force maintains close working relationships with customers, develops new business, calls on architects, engineers and building officials and participates in a range of educational seminars. Simpson Strong-Tie sells its products through an extensive distribution system comprising dealer distributors supplying thousands of retail locations nationwide, contractor distributors, home centers, manufacturers of engineered wood products, and specialized contractors such as roof framers. In recent years, sales to home centers have been one of the Company’s fastest growing distribution channels. A large part of that growth was sales to The Home Depot which exceeded 10% of the Company’s consolidated net sales in each of the last three years (see Note 14 to the Company’s consolidated financial statements and “Item 7 – Management’s Discussion and Analysis of Financial Condition and Results of Operations.”). SST’s DIY and dealer products are used to build projects such as decks, patio covers and shelf and bench systems. The Company believes that SST’s increasing diversification into new and growing markets has reduced its vulnerability to construction industry cycles. Simpson Strong-Tie dedicates substantial resources to customer service. SST produces numerous publications and point-of-sale marketing aids to serve specifiers, distributors, retailers and users for the various markets that it serves. These publications include general catalogs, as well as various specific catalogs, such as those for its Anchor System products and the engineered wood and plated truss industries. The catalogs and publications describe the products and provide load and installation information. SST also maintains several linked websites centered on www.strongtie.com, which include catalogs, product and technical information, code reports and other general information related to SST’s product lines and promotional programs. Simpson Strong-Tie’s engineers not only design and test products, but also provide engineering support for customers. This support might range from the discussion of a load value in a catalog to testing a unique application for an existing product. SST’s sales force communicates with customers in each of its marketing channels, through its publications, seminars and frequent calls. Based on its communications with customers, Simpson Strong-Tie believes that its products are essential to its customers’ businesses, and it is SST’s policy to ship products within a few days of receiving the order. Many of SST’s customers serve contractors that require rapid delivery of needed products. Home centers and dealers also require superior service, because of fluctuating demand. To satisfy these requirements, SST maintains high inventory levels, has redundant manufacturing capability and some multiple dies to produce the same parts. SST also maintains information systems that provide sales and inventory control and forecasting capabilities throughout its network of factories and warehouses. SST also has special programs for contractors intended to ensure the prompt and reliable manufacture and delivery of custom products. Simpson Strong-Tie believes that dealer and home center sales of SST products are significantly greater when the bins and racks at large dealer and home center locations are adequately stocked with appropriate products. Various retailers carry varying numbers of SST products, and SST’s Retail Specialists are engaged in ongoing efforts to inform retailers about other SST products that can be used in their specific markets and to encourage them to add these products to better meet their customers’ needs. Achieving these objectives requires teamwork and significant inventory commitments between SST and the distributors and retailers. Retail Specialists play a significant role in keeping the racks full and extending the product lines at the large dealer and home center level. They help retailers order product, set up merchandising systems, stock shelves, hold product seminars and provide SST with daily information that is used to improve service and product mix.
15
Simpson Dura-Vent Overview Simpson Dura-Vent’s venting systems are used to vent gas furnaces and water heaters, gas fireplaces and stoves, wood burning stoves and pellet stoves. SDV’s metal vents, chimneys and chimney liner systems exhaust the products of combustion to the exterior of the building and have been designed for ease of assembly and safe operation and to achieve a high level of performance. SDV produces and markets nearly 2,400 different venting products. The clean burning characteristics of natural gas have gained public recognition, resulting in increased market share for gas appliances in the new construction and the appliance replacement markets. As a result, Simpson Dura-Vent has developed venting systems, such as Direct-Vent, to address changes in appliance technology. Increases in the cost of natural gas during 2000 and the first half of 2001, however, reduced the demand for gas appliances and increased demand for alternative energy sources. Historically, sales of wood burning stoves, considered an alternative energy source, have increased during these periods of high oil and natural gas prices and energy shortages. SDV manufactures venting systems for use with wood burning stoves as well as other types of appliances. With lower natural gas prices in the later half of 2001, demand for gas appliances appears to be increasing again. Simpson Dura-Vent’s objective is to expand market share in all of its distribution channels, by entering expanding markets that address energy and environmental concerns. SDV’s strategy is to capitalize on its strengths in new product development and its established distribution network and to continue its commitment to high quality and service. SDV operates manufacturing and warehouse facilities in California and Mississippi. Products Simpson Dura-Vent is a leading supplier of double-wall Type B Gas Vent systems, used for venting gas furnaces, water heaters, boilers and decorative gas fireplaces. SDV’s Type B Gas Vent product line features heavy-duty quality construction and a twist-lock design that provides for fast and easy job-site assembly compared to conventional snap together designs. The twist-lock design has broader applications and has been incorporated into SDV’s gas, pellet and direct vent product lines. SDV also markets a patented flexible vent connector, Dura/Connect, for use between the gas appliance flue outlet and the connection to the Type B Gas Vent installed in the ceiling. Dura/Connect offers a simple twist, bend and connect installation for water heaters and gas furnaces. Increases in the price of natural gas, home heating oil, and electricity have generally resulted in increases in sales of wood burning appliances. Simpson Dura-Vent’s DuraTech and Dura/Plus chimney systems are intended to capitalize on these recent energy trends. In addition to wood burning appliances, demand for pellet stoves may also be affected by higher energy costs. In 2001, SDV saw a substantial increase in sales of its pellet venting products. The growing gas fireplace market has evolved into two basic types of fireplace: top-vent fireplaces that are vented with the standard Type B Gas Vent and direct-vent fireplaces that use a special double-wall venting system. SDV’s direct-vent system is designed not only to exhaust the flue products, but also to draw in outside air for combustion, an important feature in modern energy-efficient home construction. The direct-vent gas fireplace systems provide ease of installation, permitting horizontal through-the-wall venting or standard vertical through-the-roof venting. SDV has established relationships with several large manufacturers of gas stoves and gas fireplaces to supply direct-vent venting products. In 1996, SDV expanded its direct-vent product line to include both co-axial and co-linear direct vent systems for venting gas stoves and gas inserts into existing masonry chimneys or existing factory-built metal chimneys. New Product Development Simpson Dura-Vent has gained industry recognition by offering innovative new products that meet changing needs of customers. SDV representatives serve on industry committees concerned with issues such as new appliance standards and government regulations. SDV’s research and development expense for the three years ended December 31, 2001, 2000 and 1999, was $438,000, $455,000 and $433,000, respectively. SDV also maintains working relationships with research and development departments of major appliance manufacturers, providing prototypes for field testing and conducting tests in SDV’s testing laboratory. SDV believes that such relationships provide competitive advantages. For example, SDV introduced the first direct vent system for direct vent gas
16
appliances. In 1999, SDV introduced DuraTech, a twin-walled insulated chimney system for use on wood burning stoves, fireplaces and oil fired appliances. This product line has been designed and manufactured to a new standard of excellence. It is constructed from stainless steel and incorporates blanket insulation for enhanced safety and efficiency. Sales and Marketing Simpson Dura-Vent’s sales organization consists of a director of sales and marketing, a marketing communications manager, regional sales managers, and independent representative agencies. SDV markets venting systems for both gas and wood burning appliances through wholesale distributors in the United States, Canada and Australia to the HVAC (heating, ventilating and air conditioning) and PHC (plumbing, heating and cooling) contractor markets, and to fireplace specialty shop distributors. These customers sell to contractor and DIY markets. SDV also markets venting products to home center and hardware store chains. SDV has established OEM relationships with several major gas fireplace and gas stove manufacturers, which SDV believes are leaders in the direct-vent gas appliance market. Simpson Dura-Vent responds to technological changes occurring in the industry through new product development and has developed a reputation for quality and service to its customers. To reinforce the image of quality, SDV produces extensive sales support literature and advertising materials. Recognizing the difficulty that customers and users may have in understanding new, complex venting requirements, SDV publishes a venting handbook to assist contractors, building officials and retail outlets with the science of proper venting. Advertising and promotional literature has been designed to be used by distributors and their customers, as well as home centers and hardware chains. To enhance its marketing effort, SDV has developed a website (www.duravent.com) that includes product descriptions, catalogs and installation instructions, as well as a direct link to SDV’s customer service and engineering departments. Manufacturing Process The Company has concentrated on making its manufacturing processes as efficient as possible without compromising quality or flexibility necessary to serve the needs of its customers. The Company has developed and uses automated manufacturing processes. The Company’s innovative manufacturing systems and techniques have allowed it to control manufacturing costs, even while developing both new products and products that meet customized requirements and specifications. The Company’s development of specialized manufacturing processes also has permitted increased operating flexibility and enhanced product design innovation. The Company is committed to helping people build safer structures economically through the design, engineering and manufacturing of structural connectors and related products. To this end, the Company has developed a quality management system that employs numerous quality-control procedures, such as computer-generated work orders, constant review of parts as they are produced and frequent quality testing. Since 1996, Simpson Strong-Tie’s quality management system has been registered under ISO 9001, an internationally recognized set of quality-assurance standards. SST is currently working toward registration under the new ISO 9001-2000 standard. The Company believes that ISO registration is becoming increasingly important to U.S. companies. Simpson Strong-Tie operates manufacturing and warehouse facilities in California, Texas, Ohio, Florida, Connecticut, Illinois, Washington, British Columbia, Ontario, England, France, Denmark and Poland. SST also stocks its products in Scotland and Chile. Most of SST’s products are produced with a high level of automation, using progressive dies run in automatic presses making parts from coiled sheet steel at rates that often exceed 100 strokes per minute. SST produces over 500 million product pieces per year. Most of SST’s products (SKUs) are bar coded with UPC numbers for easy identification, and nearly all of the products sold to home centers are labeled with bar codes. SST has significant press capacity and has multiple dies for some of its high volume products because of the need to produce these products close to the customer and to provide backup capacity. The balance of production is accomplished through a combination of manual, blanking and numerically controlled (NC) processes which include robotic welders, lasers and turret punches. This capability allows SST to produce products with little redesign or set-up time, facilitating rapid turnaround for customers. New tooling is also highly automated. Dies are designed and produced using computer aided design (CAD) and computer aided machining (CAM) systems. CAD/CAM capability enables SST to create multiple dies rapidly and design them to high standards. The Company is constantly reviewing its product line to reduce manufacturing costs, increase automation, and take advantage of

17
new types of materials. For example, over the past two years SST has introduced three new products made from an engineered composite plastic, the AnchorMate, the StrapMate and the Anchor Bolt Stabilizer.
18
Simpson Dura-Vent operates manufacturing and warehouse facilities in California and Mississippi. SDV produces component parts for venting systems using NC-controlled punch presses equipped with high-speed progressive and compound tooling. SDV’s vent pipe and elbow assembly lines are automated, to produce finished products efficiently from large coils of steel and aluminum. UPC bar coding and computer tracking systems provide SDV’s industrial engineers and production supervisors with real-time productivity tools to measure and evaluate current production rates, methods and equipment. Most of the Company’s current and planned manufacturing facilities are located in geographic regions that have experienced major natural disasters, such as earthquakes, floods and hurricanes. For example, the 1989 Loma Prieta earthquake in Northern California destroyed a freeway and caused other major damage within a few miles of the Company’s facilities in San Leandro, California, and the earthquakes in Northridge, California, in January 1994, destroyed several freeways and numerous buildings in the region in which the Company’s facilities in Brea are located. The Company has developed a disaster recovery plan, but it does not carry earthquake insurance. Other insurance that it carries is limited and not likely to be adequate to cover all of the Company’s resulting costs, business interruption and lost profits in the event of a major natural disaster in the future. If a natural disaster were to render one or more of the Company’s manufacturing facilities totally or partially unusable, whether or not covered by insurance, the Company’s business and financial condition could be materially and adversely affected. Regulation The design, capacity and quality of most of the Company’s products and manufacturing processes are subject to numerous and extensive regulations and standards promulgated by governmental, quasi-governmental and industry organizations. Such regulations and standards are highly technical and complex and are subject to frequent revision. The failure of the Company’s products or manufacturing processes to comply with any of such regulations and standards could impair the Company’s ability to manufacture and market its products profitably and could materially and adversely affect the Company’s business and financial condition. Simpson Strong-Tie’s product lines are subject to Federal, state, county, municipal and other governmental and quasi-governmental regulations that affect product design, development, testing, applications, marketing, sales, installation and use. Most SST products are recognized by building code and standards agencies. Agencies that recognize Company products include the International Conference of Building Officials (“ICBO”), Building Officials and Code Administrators International (“BOCA”), Southern Building Code Congress International (“SBCCI”), The National Evaluation Service, the City of Los Angeles, Dade County, Florida, and the California Division of Architecture. These and other code agencies adopt various testing and design standards and incorporate them into their related building codes. With the adoption of the International Residential Code 2000 section of the IBC, these standards have become more uniformly applied and are recognized throughout the country, rather than by the jurisdiction covered by the various agencies. SST considers this recognition to be a significant marketing tool and devotes considerable effort to obtaining and maintaining appropriate approvals for its products. SST believes that architects, engineers, contractors and other customers are less likely to purchase structural products that lack the appropriate code acceptance if code-accepted competitive products are available. SST’s management actively participates in industry related professional associations to keep abreast of regulatory changes and to provide information to regulatory agencies. Simpson Dura-Vent operates under a complex regulatory environment that includes appliance and venting performance standards related to safety, energy efficiency and air quality. Gas venting regulations are contained in the National Fuel Gas Code (“NFGC”), while safety and performance regulations for wood burning appliances and chimney systems are contained in a National Fire Protection Association standard (“NFPA 211”). Standards for testing gas vents and chimneys are developed by testing laboratories such as Underwriter’s Laboratories (“UL”) in compliance with the American National Standards Institute. Clean air standards for both gas and wood burning appliances are regulated by the Environmental Protection Agency (“EPA”). Energy efficiency standards are regulated by the Department of Energy (“DOE”) under the authority of the National Appliance Energy Conservation Act. Under this act, the DOE periodically reviews the necessity for increased efficiency standards with respect to gas furnaces and gas water heaters. A substantial percentage of SDV’s Type B Gas Vent sales are for gas furnaces and gas water heaters. Minimum appliance efficiency standards might be adopted that could negatively affect sales of Type B Gas Vents, which could materially and adversely affect the Company’s operating results and financial condition. The standards and regulations contained in the NFGC and NFPA 211 are ultimately adopted by national building code organizations such as ICBO, BOCA and SBCCI. In turn, the various building codes are adopted by local municipalities, resulting in enforcement through the building permit process. Safety, air quality and
19
energy efficiency requirements are enforced by local air quality districts and municipalities by requiring proper UL, EPA and DOE labels on appliances and venting systems. Competition The Company faces a variety of competition in all of the markets in which it participates. This competition ranges from subsidiaries of large national or international corporations to small regional manufacturers. While price is an important factor, the Company competes primarily on the basis of quality, breadth of product line, technical support, service, field support and product innovation. As a result of differences in structural design and building practices and codes, Simpson Strong-Tie’s markets tend to differ by region. Within these regions, SST competes with companies of varying size, several of which also distribute their products nationally. The venting industry is highly competitive. Many of Simpson Dura-Vent’s competitors have greater financial and other resources than SDV. SDV’s principal competitors include the Selkirk Metalbestos Division of U.S. Industries, Inc., Hart & Cooley, Inc. and American Metal Products, Inc. (both now owned by Tomkins PLC), Metal-Fab, Inc. and the Air Jet Division of General Products Co. The Company believes that Metal-Fab, Inc. and Air Jet tend to be more regional than SDV, and that they have smaller shares of the national market than SDV. Raw Materials The principal raw material used by the Company is steel, including stainless steel, and is generally ordered to specific American Society of Testing and Materials (“ASTM”) standards. Other raw materials include aluminum, aluminum alloys and ceramic and other insulation materials, which are used by Simpson Dura-Vent, and cartons, which are used by both SST and SDV. The Company purchases raw materials from a variety of commercial sources. The Company’s practice is to seek cost savings and enhanced quality by purchasing from a limited number of suppliers. The steel industry is highly cyclical and prices for the Company’s raw materials are influenced by numerous factors beyond the Company’s control, including general economic conditions, competition, labor costs, import duties and other trade restrictions. In March 2002, the United States imposed a tariff on several types of imported steel which in turn could increase the cost of steel to the Company. The Company might not be able to increase its product prices in amounts that correspond to increases in raw materials prices without materially and adversely affecting its sales and profits. See “Item 7 – Management’s Discussion and Analysis of Financial Condition and Results of Operations.” The Company historically has not attempted to hedge against changes in prices of steel or other raw materials. Patents and Proprietary Rights The Company’s subsidiaries have U.S. and foreign patents, the majority of which cover products that they currently manufacture and market. These patents, and applications for new patents, cover various design aspects of the subsidiaries’ products, as well as processes used in their manufacture. The Company’s subsidiaries are continuing to develop new potentially patentable products, product enhancements and product designs. Although the Company’s subsidiaries do not intend to apply for additional foreign patents covering existing products, the Company has developed an international patent program to protect new products that its subsidiaries may develop. The Company’s ability to compete effectively with other companies depends in part on its ability to maintain the proprietary nature of its technology. There can be no assurance, however, as to the degree of protection afforded by these patents or the likelihood that patents will issue pursuant to pending patent applications. Furthermore, there can be no assurance that others will not independently develop the same or similar technology, develop around the patented aspects of any of the Company’s products or proposed products, or otherwise obtain access to the Company’s proprietary technology. In addition to seeking patent protection, the Company also relies on unpatented proprietary technology to maintain its competitive position. Nevertheless, there can be no assurance that the Company will be able to protect its know-how or other proprietary information. In attempting to protect its proprietary information, the Company expects that it may sometimes be necessary to initiate lawsuits against competitors and others that the Company believes have infringed or are infringing the Company’s rights. In such an event, the defendant may assert counterclaims to complicate or delay the litigation or
20
for other reasons. If the Company were to be unable to maintain the proprietary nature of its significant products, the Company’s business and financial condition could be materially and adversely affected. Acquisitions and Expansion into New Markets The Company’s future growth, if any, may depend to some extent on its ability to penetrate new markets, both domestically and internationally. See “Industry and Market Trends” and “Business Strategy.” Therefore, the Company may in the future pursue acquisitions of product lines or businesses. Acquisitions involve numerous risks, including difficulties in the assimilation of the operations and products of the acquired companies, the diversion of management’s attention from other business concerns, risks of entering markets in which the Company has little or no direct prior experience, and the potential loss of key employees of the acquired company. In addition, future acquisitions by the Company may result in potentially dilutive issuances of equity securities, the incurring of additional debt, and impairment and amortization expenses related to goodwill and other intangible assets, all of which could adversely affect the Company’s profitability. If an acquisition occurs, no assurance can be given as to its effect on the Company’s business or operating results. See “Item 7 – Management’s Discussion and Analysis of Financial Condition and Results of Operations.” Construction customs, standards, techniques and methods in international markets differ from those in the United States. Laws and regulations applicable in new markets for the Company are unfamiliar to the Company and compliance may be substantially more costly than the Company anticipates. As a result, it may become necessary for the Company to redesign products or to invent or design new products in order to compete effectively and profitably outside the United States or in markets that are new to the Company in the United States. The Company expects that significant time will be required for it to generate substantial sales or profits in new markets. Other significant challenges to conducting business in foreign countries include, among other factors, local acceptance of the Company’s products, political instability, currency controls, changes in import and export regulations, changes in tariff and freight rates, and fluctuations in foreign exchange rates. There can be no assurance that the Company will be able to penetrate these markets or that any such market penetration can be achieved on a timely basis or profitably. If the Company is not successful in penetrating these markets within a reasonable time, it will be unable to recoup part or all of the significant investments it will have made in attempting to do so. See “Business Strategy” and “Industry and Market Trends.” In January 2001, Simpson Strong-Tie International, Inc. (“SSTI”), a subsidiary of the Company, acquired 100% of the shares of BMF Bygningsbeslag A/S (“BMF”) of Denmark for $13.6 million in cash. BMF manufactures and distributes connector products in northern and central Europe. In August 2001, the German subsidiary of BMF purchased the remaining 51% stake in Bulldog-Simpson GmbH for approximately $0.6 million in cash. In December 2000, SST purchased the assets of Masterset Fastening Systems, Inc. (“Masterset”) for approximately $2.3 million in cash plus an earnout of up to $0.3 million. Masterset sells a system of specially designed powder actuated fasteners and installation tools. In July 2000, Simpson Strong-Tie purchased the assets of Anchor Tiedown Systems, Inc. (“ATS”). ATS manufactures and distributes the MBR product line used to anchor multi-story buildings with a threaded rod hold down system. The purchase price was approximately $4.6 million in cash. In the third quarter of 1999, SSTI purchased the assets of Furfix Products Limited and Easy Arches Limited (together, “Furfix”), which manufacture a line of structural connectors for the wood and masonry construction markets in the United Kingdom and Europe. The purchase price was approximately $7.8 million in cash plus an earnout based on future operating performance. Included in the purchase price were costs associated with the closure of Furfix’s existing facility and integration into SSTI’s facility in Tamworth, England. See “Item 7 – Management’s Discussion and Analysis of Financial Condition and Results of Operations – Liquidity and Sources of Capital.” Seasonality and Cyclicality The Company’s sales are seasonal, with operating results varying from quarter to quarter. With some exceptions, the Company’s sales and income have historically been lower in the first and fourth quarters and higher in the second and third quarters of the year, as retailers and contractors purchase construction materials in the late spring and summer months for the construction season. In addition, demand for the Company’s products and the Company’s results of operations are significantly affected by weather conditions, such as unseasonably warm, cold or wet weather, which affect, and sometimes delay or accelerate, installation of certain of the Company’s products. Political and economic events can also affect the Company’s revenues. The Company has little control over the timing of customer purchases, and sales anticipated in one quarter may occur in another quarter, thereby affecting both quarters’ results. In addition, the Company incurs significant expenses as it develops, produces and markets its
21
products in anticipation of future orders. Products typically are shipped as orders are received, and accordingly the Company operates with little backlog. As a result, net sales in any quarter generally depend on orders booked and shipped in that quarter. A significant portion of the Company’s operating expenses are fixed, and planned expenditures are based primarily on sales forecasts. If sales fall below the Company’s expectations, operating results would be adversely affected for the relevant quarters, as expenses based on those expectations will already have been incurred. See “Item 7 – Management’s Discussion and Analysis of Financial Condition and Results of Operations.” The Company’s principal markets are in the building construction industry. That industry is subject to significant volatility as a result of fluctuations in interest rates, the availability of credit to builders and developers, inflation rates, weather and other factors and trends, none of which is within the Company’s control. Declines in commercial and residential construction may be expected to reduce the demand for the Company’s products. The Company cannot provide any assurance that its business will not be adversely affected by future negative economic or construction industry performance or that future declines in construction activity or the demand for the Company’s products will not have material adverse effects on the Company and its business and financial condition. See “Item 7 – Management’s Discussion and Analysis of Financial Condition and Results of Operations.” Product Liability The Company designs and manufactures most of its standard products and expects that it will continue to do so. The Company employs engineers and designers to design and test its products under development. In addition, the Company maintains a quality control system. The Company has on occasion found manufacturing flaws in its products. In addition, the Company purchases from third party suppliers raw materials, principally steel, and finished goods that are produced and processed by other manufacturers. The Company also has on occasion found flaws in raw materials and finished goods produced by others, some of which flaws have not been apparent until after the products were installed by customers. Many of the Company’s products are integral to the structural soundness or fire safety of the buildings in which they are used. As a result, if any flaws exist in the Company’s products (as a result of design, raw material or manufacturing flaws) and such flaws are not discovered and corrected before the Company’s products are incorporated into structures, the structures could suffer severe damage (such as collapse or fire) and personal injury could result. To the extent that such damage or injury is not covered by the Company’s product liability insurance, and if the Company were to be found to have been negligent or otherwise culpable, the Company and its business and financial condition could be materially and adversely affected by the necessity to correct such damage and to compensate persons who might have suffered injury. Furthermore, in the event that a flaw is discovered after installation but before any damage or injury occurs, it may be necessary for the Company to recall products, and the Company may be liable for any costs necessary to retrofit the affected structures. Any such recall or retrofit could entail substantial costs and adversely affect the Company’s reputation, sales and financial condition. The Company does not carry insurance against recall costs, and its product liability insurance may not cover retrofit costs. No assurance can be given that claims will not be made against the Company with regard to damage or destruction of structures incorporating Company products resulting from a natural disaster. Any such claims, if asserted, could materially and adversely affect the Company. Environmental, Health and Safety Matters The Company is subject to environmental laws and regulations governing emissions into the air, discharges into water, and generation, handling, storage, transportation, treatment and disposal of waste materials. The Company is also subject to other Federal and state laws and regulations regarding health and safety matters. The Company’s manufacturing operations involve the use of solvents, chemicals, oils and other materials that are regarded as hazardous or toxic and the use of complex and heavy machinery and equipment that can pose severe safety hazards (especially if not properly and carefully used). Some of the Company’s products also incorporate materials that are hazardous or toxic in some forms (such as zinc and lead, which are used in some steel galvanizing processes) or explosive (such as the powder used in its powder actuated tools). The Company believes that it has obtained all material licenses and permits required by environmental, health and safety laws and regulations in connection with the Company’s operations and that its policies and procedures comply in all material respects with existing environmental, health and safety laws and regulations. It is possible that additional licenses or permits may be required, that the Company’s policies and procedures might not comply in all respects with all such laws and regulations or, even if they do, that employees might fail or neglect to follow them in all respects, and that the
22
Company’s generation, handling, use, storage, transportation, treatment or disposal of hazardous or toxic materials, machinery and equipment might cause injury to persons or to the environment. In addition, properties occupied by the Company may be contaminated by hazardous or toxic substances and remedial action may be required at some time in the future. It is also possible that materials in certain of the Company’s products could cause injury or sickness. Relevant laws and regulations could also be changed or new ones could be adopted that require the Company to obtain additional licenses and permits and cause the Company to incur substantial expense. Any such event or contamination could have a material adverse effect on the Company and its liquidity, results of operations and financial condition. See “Regulation.” Employees and Labor Relations As of March 1, 2002 the Company had 1,895 full-time employees, of whom 1,257 were hourly employees and 638 were salaried employees. The Company believes that its overall compensation and benefits for the most part exceed industry averages and that its relations with its employees are good. The Company is dependent on certain key management and technical personnel, including Thomas J Fitzmyers, Michael J. Herbert, Stephen B. Lamson, Barclay Simpson and Donald M. Townsend. The loss of one or more key employees could have a material adverse effect on the Company. The Company’s success will also depend on its ability to attract and retain additional highly qualified technical, marketing and management personnel necessary for the maintenance and expansion of the Company’s activities. The Company faces strong competition for such personnel and there can be no assurance that the Company will be able to attract or retain such personnel. A significant number of the Company’s employees at two of the Company’s major manufacturing facilities are represented by labor unions and are covered by collective bargaining agreements. Two of the Company’s collective bargaining agreements cover the Company’s sheetmetal workers and its tool and die craftsmen in Brea. These two contracts expire in June 2004 and February 2005, respectively. Two other contracts, covering tool and die personnel and sheetmetal workers in San Leandro, expire in June 2003 and July 2003, respectively. Simpson Strong-Tie’s Manteca, California, facility was also recently unionized. The collective bargaining agreement there will expire in September 2007. A work stoppage or interruption by a significant number of the Company’s employees could have a material and adverse effect on the Company and its business and financial condition.
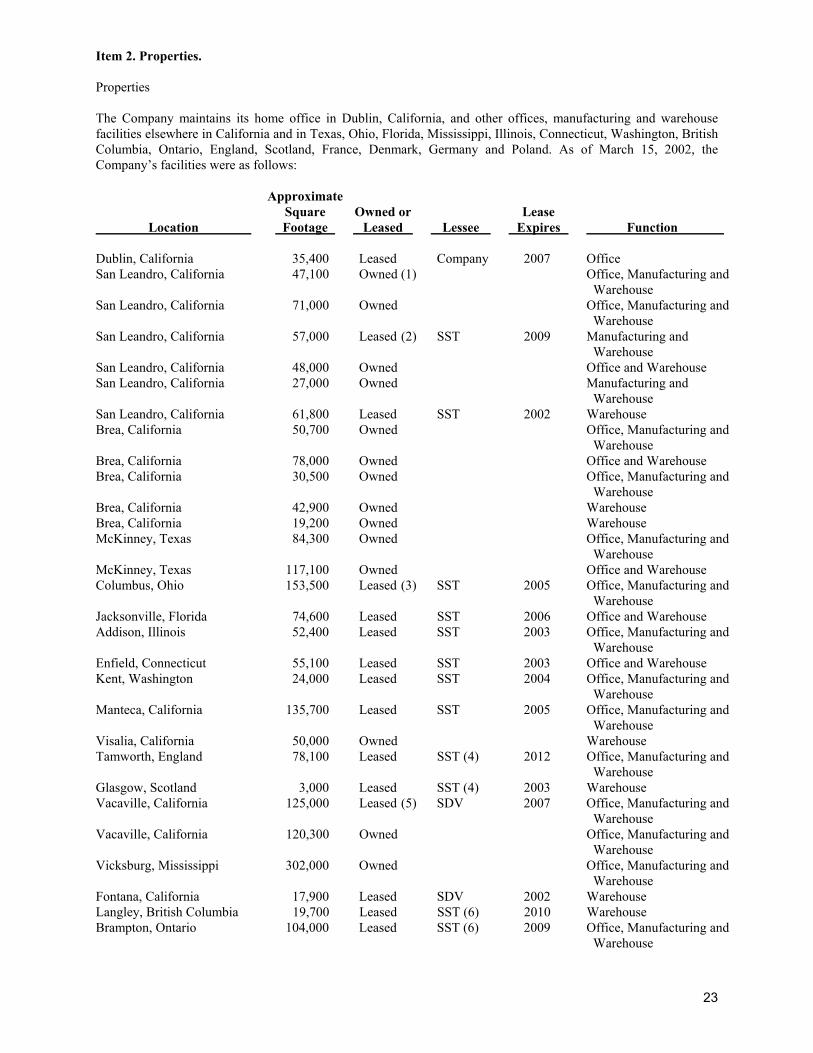
23
Item 2. Properties. Properties The Company maintains its home office in Dublin, California, and other offices, manufacturing and warehouse facilities elsewhere in California and in Texas, Ohio, Florida, Mississippi, Illinois, Connecticut, Washington, British Columbia, Ontario, England, Scotland, France, Denmark, Germany and Poland. As of March 15, 2002, the Company’s facilities were as follows: Approximate Square Owned or Lease Location Footage Leased Lessee Expires Function Dublin, California 35,400 Leased Company 2007 Office San Leandro, California 47,100 Owned (1) Office, Manufacturing and Warehouse San Leandro, California 71,000 Owned Office, Manufacturing and Warehouse San Leandro, California 57,000 Leased (2) SST 2009 Manufacturing and Warehouse San Leandro, California 48,000 Owned Office and Warehouse San Leandro, California 27,000 Owned Manufacturing and Warehouse San Leandro, California 61,800 Leased SST 2002 Warehouse Brea, California 50,700 Owned Office, Manufacturing and Warehouse Brea, California 78,000 Owned Office and Warehouse Brea, California 30,500 Owned Office, Manufacturing and Warehouse Brea, California 42,900 Owned Warehouse Brea, California 19,200 Owned Warehouse McKinney, Texas 84,300 Owned Office, Manufacturing and Warehouse McKinney, Texas 117,100 Owned Office and Warehouse Columbus, Ohio 153,500 Leased (3) SST 2005 Office, Manufacturing and Warehouse Jacksonville, Florida 74,600 Leased SST 2006 Office and Warehouse Addison, Illinois 52,400 Leased SST 2003 Office, Manufacturing and Warehouse Enfield, Connecticut 55,100 Leased SST 2003 Office and Warehouse Kent, Washington 24,000 Leased SST 2004 Office, Manufacturing and Warehouse Manteca, California 135,700 Leased SST 2005 Office, Manufacturing and Warehouse Visalia, California 50,000 Owned Warehouse Tamworth, England 78,100 Leased SST (4) 2012 Office, Manufacturing and Warehouse Glasgow, Scotland 3,000 Leased SST (4) 2003 Warehouse Vacaville, California 125,000 Leased (5) SDV 2007 Office, Manufacturing and Warehouse Vacaville, California 120,300 Owned Office, Manufacturing and Warehouse Vicksburg, Mississippi 302,000 Owned Office, Manufacturing and Warehouse Fontana, California 17,900 Leased SDV 2002 Warehouse Langley, British Columbia 19,700 Leased SST (6) 2010 Warehouse Brampton, Ontario 104,000 Leased SST (6) 2009 Office, Manufacturing and Warehouse
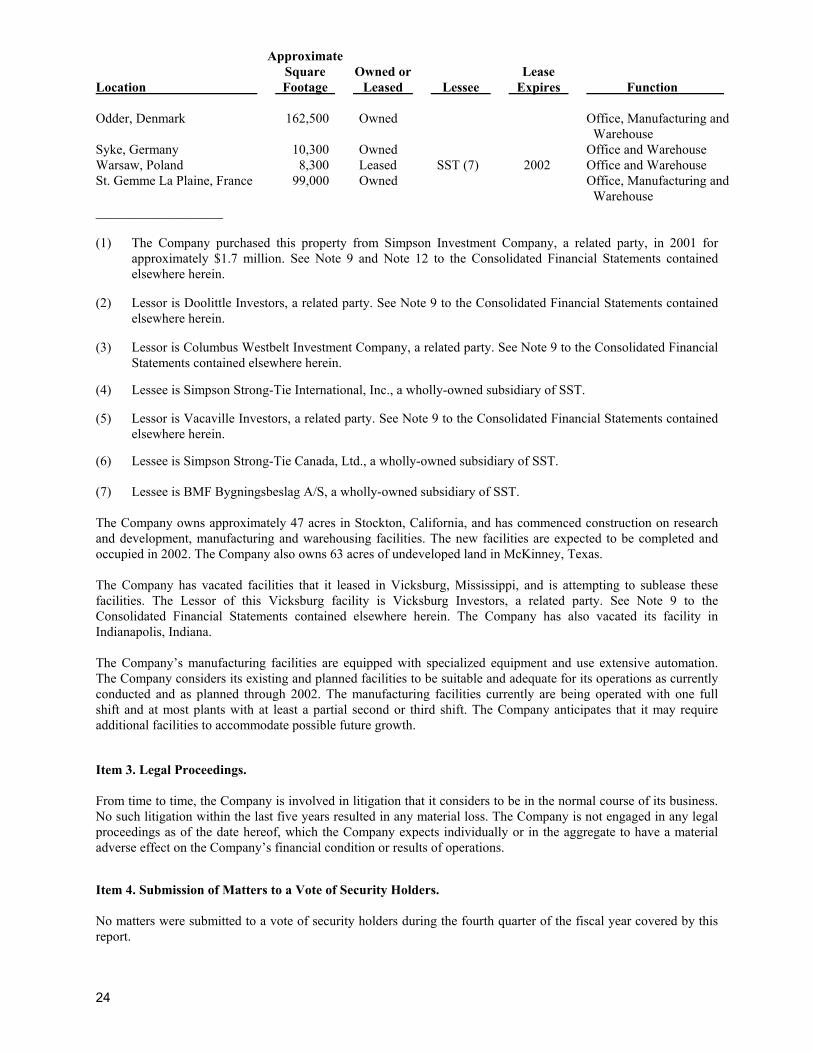
24
Approximate Square Owned or Lease Location Footage Leased Lessee Expires Function Odder, Denmark 162,500 Owned Office, Manufacturing and Warehouse Syke, Germany 10,300 Owned Office and Warehouse Warsaw, Poland 8,300 Leased SST (7) 2002 Office and Warehouse St. Gemme La Plaine, France 99,000 Owned Office, Manufacturing and Warehouse ___________________ (1) The Company purchased this property from Simpson Investment Company, a related party, in 2001 for
approximately $1.7 million. See Note 9 and Note 12 to the Consolidated Financial Statements contained elsewhere herein.
(2) Lessor is Doolittle Investors, a related party. See Note 9 to the Consolidated Financial Statements contained
elsewhere herein. (3) Lessor is Columbus Westbelt Investment Company, a related party. See Note 9 to the Consolidated Financial
Statements contained elsewhere herein. (4) Lessee is Simpson Strong-Tie International, Inc., a wholly-owned subsidiary of SST. (5) Lessor is Vacaville Investors, a related party. See Note 9 to the Consolidated Financial Statements contained
elsewhere herein. (6) Lessee is Simpson Strong-Tie Canada, Ltd., a wholly-owned subsidiary of SST. (7) Lessee is BMF Bygningsbeslag A/S, a wholly-owned subsidiary of SST. The Company owns approximately 47 acres in Stockton, California, and has commenced construction on research and development, manufacturing and warehousing facilities. The new facilities are expected to be completed and occupied in 2002. The Company also owns 63 acres of undeveloped land in McKinney, Texas. The Company has vacated facilities that it leased in Vicksburg, Mississippi, and is attempting to sublease these facilities. The Lessor of this Vicksburg facility is Vicksburg Investors, a related party. See Note 9 to the Consolidated Financial Statements contained elsewhere herein. The Company has also vacated its facility in Indianapolis, Indiana. The Company’s manufacturing facilities are equipped with specialized equipment and use extensive automation. The Company considers its existing and planned facilities to be suitable and adequate for its operations as currently conducted and as planned through 2002. The manufacturing facilities currently are being operated with one full shift and at most plants with at least a partial second or third shift. The Company anticipates that it may require additional facilities to accommodate possible future growth. Item 3. Legal Proceedings. From time to time, the Company is involved in litigation that it considers to be in the normal course of its business. No such litigation within the last five years resulted in any material loss. The Company is not engaged in any legal proceedings as of the date hereof, which the Company expects individually or in the aggregate to have a material adverse effect on the Company’s financial condition or results of operations. Item 4. Submission of Matters to a Vote of Security Holders. No matters were submitted to a vote of security holders during the fourth quarter of the fiscal year covered by this report.
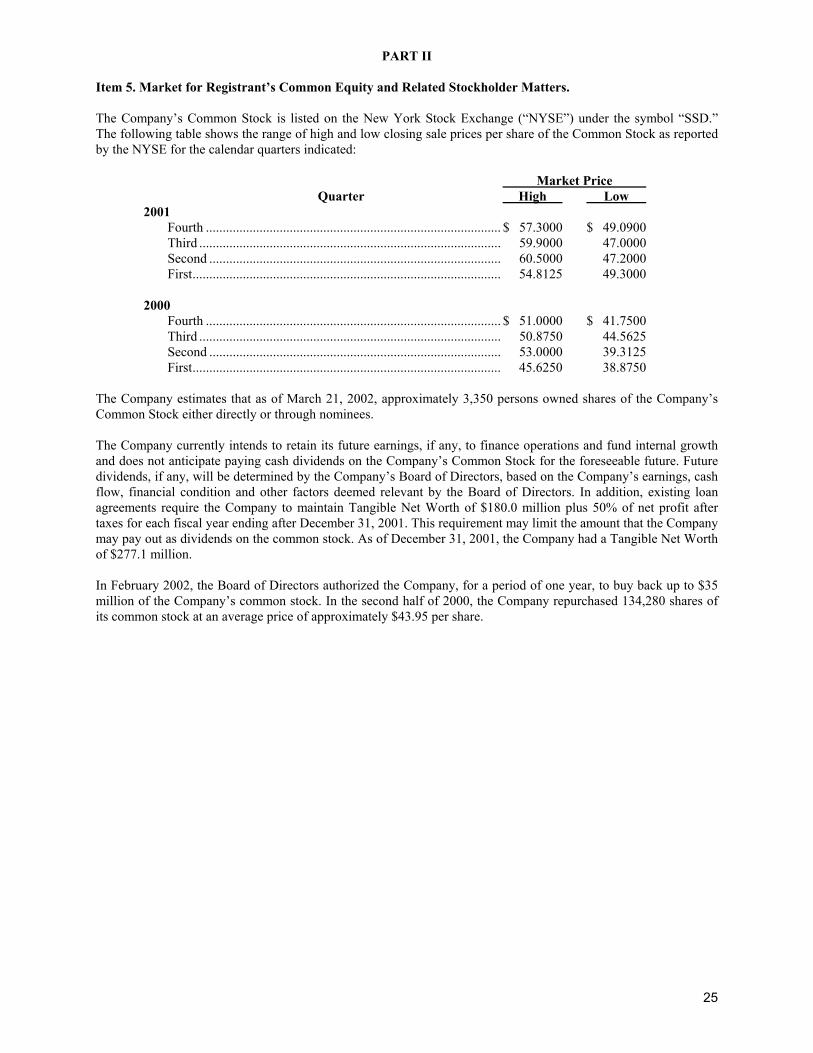
25
PART II Item 5. Market for Registrant’s Common Equity and Related Stockholder Matters. The Company’s Common Stock is listed on the New York Stock Exchange (“NYSE”) under the symbol “SSD.” The following table shows the range of high and low closing sale prices per share of the Common Stock as reported by the NYSE for the calendar quarters indicated: Market Price Quarter High Low 2001 Fourth ........................................................................................ $ 57.3000 $ 49.0900 Third .......................................................................................... 59.9000 47.0000 Second ....................................................................................... 60.5000 47.2000 First............................................................................................ 54.8125 49.3000 2000 Fourth ........................................................................................ $ 51.0000 $ 41.7500 Third .......................................................................................... 50.8750 44.5625 Second ....................................................................................... 53.0000 39.3125 First............................................................................................ 45.6250 38.8750 The Company estimates that as of March 21, 2002, approximately 3,350 persons owned shares of the Company’s Common Stock either directly or through nominees. The Company currently intends to retain its future earnings, if any, to finance operations and fund internal growth and does not anticipate paying cash dividends on the Company’s Common Stock for the foreseeable future. Future dividends, if any, will be determined by the Company’s Board of Directors, based on the Company’s earnings, cash flow, financial condition and other factors deemed relevant by the Board of Directors. In addition, existing loan agreements require the Company to maintain Tangible Net Worth of $180.0 million plus 50% of net profit after taxes for each fiscal year ending after December 31, 2001. This requirement may limit the amount that the Company may pay out as dividends on the common stock. As of December 31, 2001, the Company had a Tangible Net Worth of $277.1 million. In February 2002, the Board of Directors authorized the Company, for a period of one year, to buy back up to $35 million of the Company’s common stock. In the second half of 2000, the Company repurchased 134,280 shares of its common stock at an average price of approximately $43.95 per share.
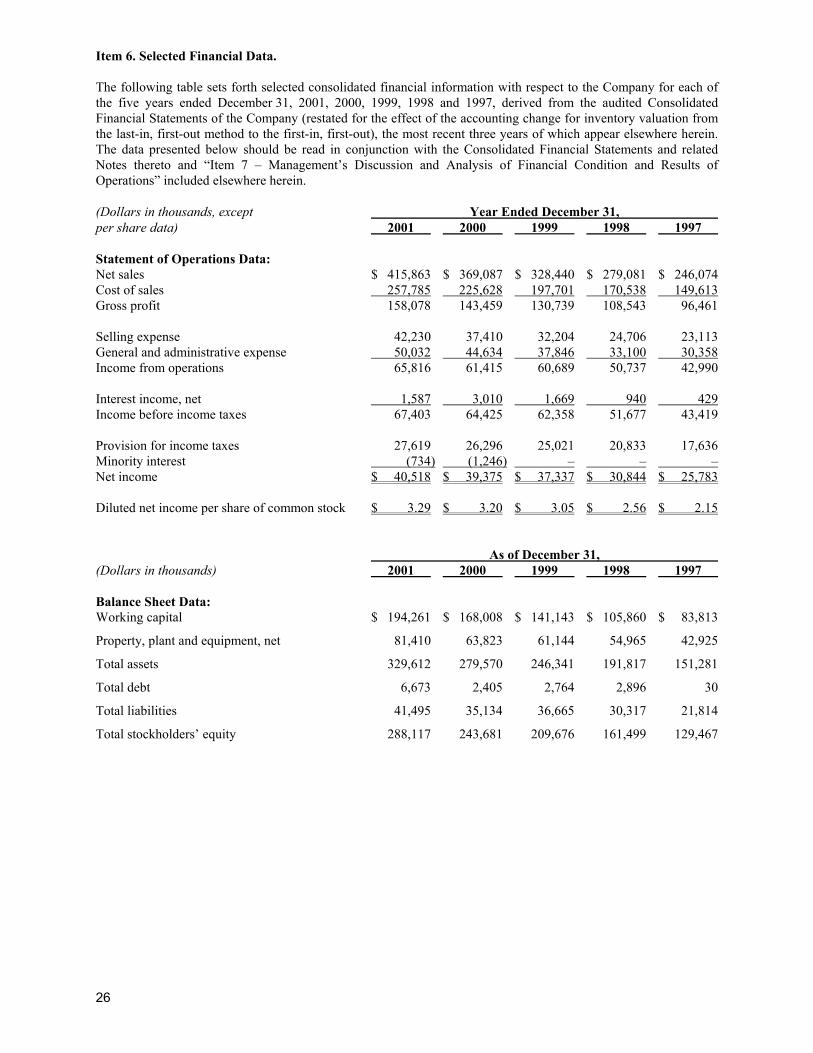
26
Item 6. Selected Financial Data. The following table sets forth selected consolidated financial information with respect to the Company for each of the five years ended December 31, 2001, 2000, 1999, 1998 and 1997, derived from the audited Consolidated Financial Statements of the Company (restated for the effect of the accounting change for inventory valuation from the last-in, first-out method to the first-in, first-out), the most recent three years of which appear elsewhere herein. The data presented below should be read in conjunction with the Consolidated Financial Statements and related Notes thereto and “Item 7 – Management’s Discussion and Analysis of Financial Condition and Results of Operations” included elsewhere herein. (Dollars in thousands, except Year Ended December 31, per share data) 2001 2000 1999 1998 1997 Statement of Operations Data: Net sales $ 415,863 $ 369,087 $ 328,440 $ 279,081 $ 246,074 Cost of sales 257,785 225,628 197,701 170,538 149,613 Gross profit 158,078 143,459 130,739 108,543 96,461 Selling expense 42,230 37,410 32,204 24,706 23,113 General and administrative expense 50,032 44,634 37,846 33,100 30,358 Income from operations 65,816 61,415 60,689 50,737 42,990 Interest income, net 1,587 3,010 1,669 940 429 Income before income taxes 67,403 64,425 62,358 51,677 43,419 Provision for income taxes 27,619 26,296 25,021 20,833 17,636 Minority interest (734) (1,246) – – – Net income $ 40,518 $ 39,375 $ 37,337 $ 30,844 $ 25,783 Diluted net income per share of common stock $ 3.29 $ 3.20 $ 3.05 $ 2.56 $ 2.15 As of December 31, (Dollars in thousands) 2001 2000 1999 1998 1997 Balance Sheet Data: Working capital $ 194,261 $ 168,008 $ 141,143 $ 105,860 $ 83,813
Property, plant and equipment, net 81,410 63,823 61,144 54,965 42,925
Total assets 329,612 279,570 246,341 191,817 151,281
Total debt 6,673 2,405 2,764 2,896 30
Total liabilities 41,495 35,134 36,665 30,317 21,814
Total stockholders’ equity 288,117 243,681 209,676 161,499 129,467
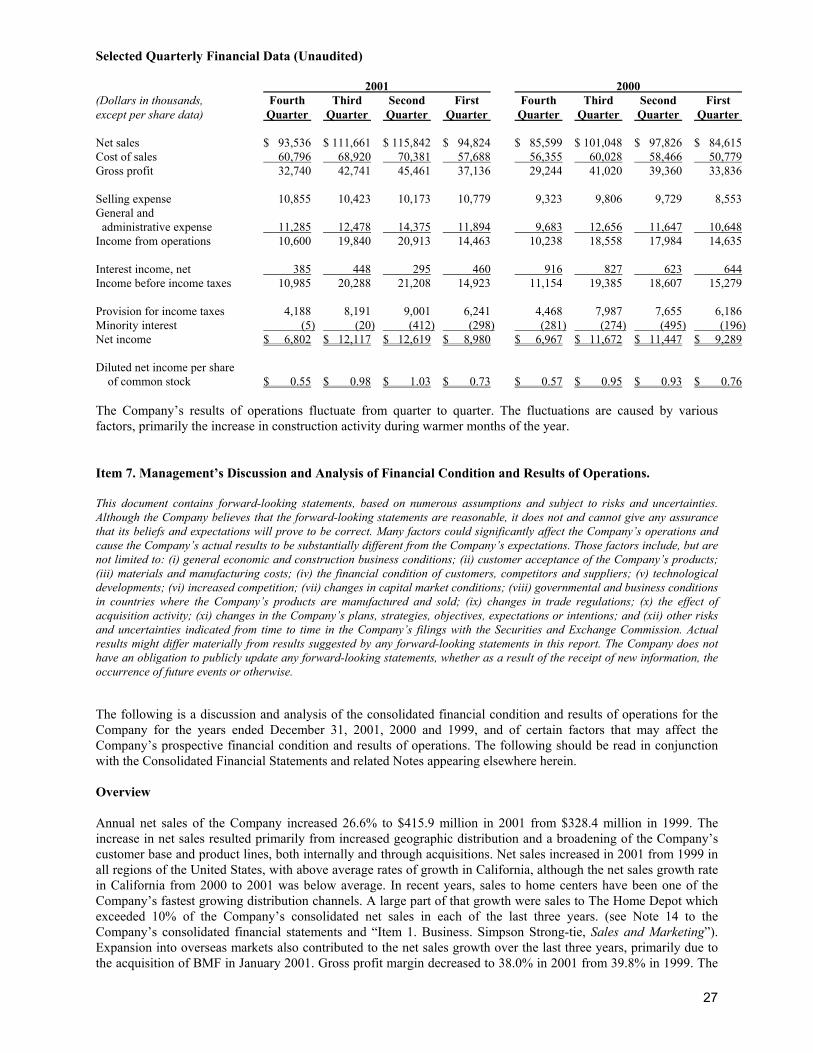
27
Selected Quarterly Financial Data (Unaudited) 2001 2000 (Dollars in thousands, Fourth Third Second First Fourth Third Second First except per share data) Quarter Quarter Quarter Quarter Quarter Quarter Quarter Quarter Net sales $ 93,536 $ 111,661 $ 115,842 $ 94,824 $ 85,599 $ 101,048 $ 97,826 $ 84,615 Cost of sales 60,796 68,920 70,381 57,688 56,355 60,028 58,466 50,779 Gross profit 32,740 42,741 45,461 37,136 29,244 41,020 39,360 33,836 Selling expense 10,855 10,423 10,173 10,779 9,323 9,806 9,729 8,553 General and administrative expense 11,285 12,478 14,375 11,894 9,683 12,656 11,647 10,648 Income from operations 10,600 19,840 20,913 14,463 10,238 18,558 17,984 14,635 Interest income, net 385 448 295 460 916 827 623 644 Income before income taxes 10,985 20,288 21,208 14,923 11,154 19,385 18,607 15,279 Provision for income taxes 4,188 8,191 9,001 6,241 4,468 7,987 7,655 6,186 Minority interest (5) (20) (412) (298) (281) (274) (495) (196) Net income $ 6,802 $ 12,117 $ 12,619 $ 8,980 $ 6,967 $ 11,672 $ 11,447 $ 9,289 Diluted net income per share of common stock $ 0.55 $ 0.98 $ 1.03 $ 0.73 $ 0.57 $ 0.95 $ 0.93 $ 0.76 The Company’s results of operations fluctuate from quarter to quarter. The fluctuations are caused by various factors, primarily the increase in construction activity during warmer months of the year. Item 7. Management’s Discussion and Analysis of Financial Condition and Results of Operations. This document contains forward-looking statements, based on numerous assumptions and subject to risks and uncertainties. Although the Company believes that the forward-looking statements are reasonable, it does not and cannot give any assurance that its beliefs and expectations will prove to be correct. Many factors could significantly affect the Company’s operations and cause the Company’s actual results to be substantially different from the Company’s expectations. Those factors include, but are not limited to: (i) general economic and construction business conditions; (ii) customer acceptance of the Company’s products; (iii) materials and manufacturing costs; (iv) the financial condition of customers, competitors and suppliers; (v) technological developments; (vi) increased competition; (vii) changes in capital market conditions; (viii) governmental and business conditions in countries where the Company’s products are manufactured and sold; (ix) changes in trade regulations; (x) the effect of acquisition activity; (xi) changes in the Company’s plans, strategies, objectives, expectations or intentions; and (xii) other risks and uncertainties indicated from time to time in the Company’s filings with the Securities and Exchange Commission. Actual results might differ materially from results suggested by any forward-looking statements in this report. The Company does not have an obligation to publicly update any forward-looking statements, whether as a result of the receipt of new information, the occurrence of future events or otherwise. The following is a discussion and analysis of the consolidated financial condition and results of operations for the Company for the years ended December 31, 2001, 2000 and 1999, and of certain factors that may affect the Company’s prospective financial condition and results of operations. The following should be read in conjunction with the Consolidated Financial Statements and related Notes appearing elsewhere herein. Overview Annual net sales of the Company increased 26.6% to $415.9 million in 2001 from $328.4 million in 1999. The increase in net sales resulted primarily from increased geographic distribution and a broadening of the Company’s customer base and product lines, both internally and through acquisitions. Net sales increased in 2001 from 1999 in all regions of the United States, with above average rates of growth in California, although the net sales growth rate in California from 2000 to 2001 was below average. In recent years, sales to home centers have been one of the Company’s fastest growing distribution channels. A large part of that growth were sales to The Home Depot which exceeded 10% of the Company’s consolidated net sales in each of the last three years. (see Note 14 to the Company’s consolidated financial statements and “Item 1. Business. Simpson Strong-tie, Sales and Marketing”). Expansion into overseas markets also contributed to the net sales growth over the last three years, primarily due to the acquisition of BMF in January 2001. Gross profit margin decreased to 38.0% in 2001 from 39.8% in 1999. The
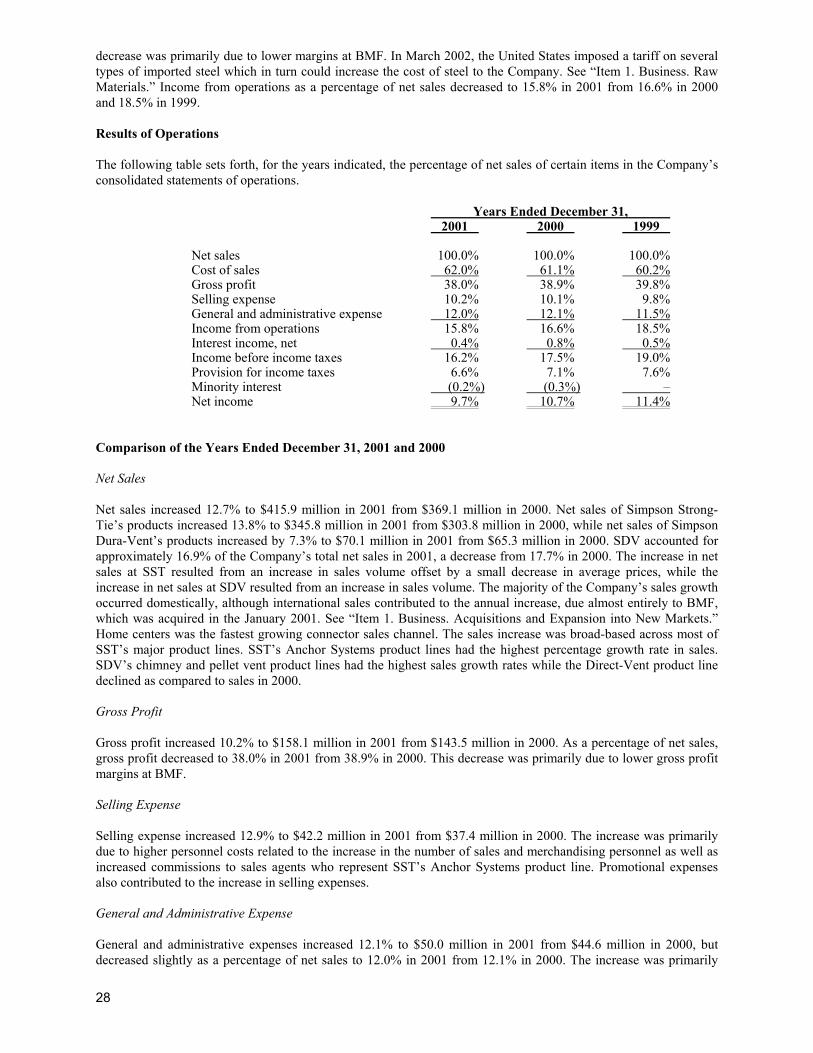
28
decrease was primarily due to lower margins at BMF. In March 2002, the United States imposed a tariff on several types of imported steel which in turn could increase the cost of steel to the Company. See “Item 1. Business. Raw Materials.” Income from operations as a percentage of net sales decreased to 15.8% in 2001 from 16.6% in 2000 and 18.5% in 1999. Results of Operations The following table sets forth, for the years indicated, the percentage of net sales of certain items in the Company’s consolidated statements of operations. Years Ended December 31, 2001 2000 1999 Net sales 100.0% 100.0% 100.0% Cost of sales 62.0% 61.1% 60.2% Gross profit 38.0% 38.9% 39.8% Selling expense 10.2% 10.1% 9.8% General and administrative expense 12.0% 12.1% 11.5% Income from operations 15.8% 16.6% 18.5% Interest income, net 0.4% 0.8% 0.5% Income before income taxes 16.2% 17.5% 19.0% Provision for income taxes 6.6% 7.1% 7.6% Minority interest (0.2%) (0.3%) – Net income 9.7% 10.7% 11.4% Comparison of the Years Ended December 31, 2001 and 2000 Net Sales Net sales increased 12.7% to $415.9 million in 2001 from $369.1 million in 2000. Net sales of Simpson Strong-Tie’s products increased 13.8% to $345.8 million in 2001 from $303.8 million in 2000, while net sales of Simpson Dura-Vent’s products increased by 7.3% to $70.1 million in 2001 from $65.3 million in 2000. SDV accounted for approximately 16.9% of the Company’s total net sales in 2001, a decrease from 17.7% in 2000. The increase in net sales at SST resulted from an increase in sales volume offset by a small decrease in average prices, while the increase in net sales at SDV resulted from an increase in sales volume. The majority of the Company’s sales growth occurred domestically, although international sales contributed to the annual increase, due almost entirely to BMF, which was acquired in the January 2001. See “Item 1. Business. Acquisitions and Expansion into New Markets.” Home centers was the fastest growing connector sales channel. The sales increase was broad-based across most of SST’s major product lines. SST’s Anchor Systems product lines had the highest percentage growth rate in sales. SDV’s chimney and pellet vent product lines had the highest sales growth rates while the Direct-Vent product line declined as compared to sales in 2000. Gross Profit Gross profit increased 10.2% to $158.1 million in 2001 from $143.5 million in 2000. As a percentage of net sales, gross profit decreased to 38.0% in 2001 from 38.9% in 2000. This decrease was primarily due to lower gross profit margins at BMF. Selling Expense Selling expense increased 12.9% to $42.2 million in 2001 from $37.4 million in 2000. The increase was primarily due to higher personnel costs related to the increase in the number of sales and merchandising personnel as well as increased commissions to sales agents who represent SST’s Anchor Systems product line. Promotional expenses also contributed to the increase in selling expenses. General and Administrative Expense General and administrative expenses increased 12.1% to $50.0 million in 2001 from $44.6 million in 2000, but decreased slightly as a percentage of net sales to 12.0% in 2001 from 12.1% in 2000. The increase was primarily
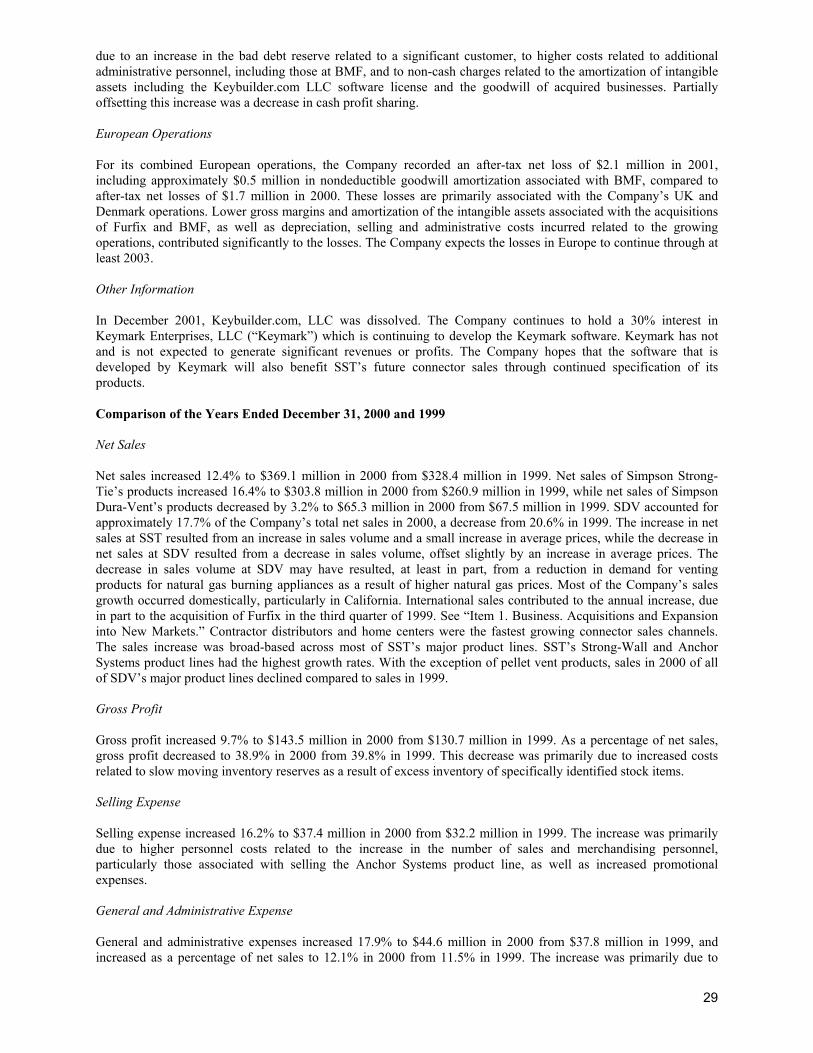
29
due to an increase in the bad debt reserve related to a significant customer, to higher costs related to additional administrative personnel, including those at BMF, and to non-cash charges related to the amortization of intangible assets including the Keybuilder.com LLC software license and the goodwill of acquired businesses. Partially offsetting this increase was a decrease in cash profit sharing. European Operations For its combined European operations, the Company recorded an after-tax net loss of $2.1 million in 2001, including approximately $0.5 million in nondeductible goodwill amortization associated with BMF, compared to after-tax net losses of $1.7 million in 2000. These losses are primarily associated with the Company’s UK and Denmark operations. Lower gross margins and amortization of the intangible assets associated with the acquisitions of Furfix and BMF, as well as depreciation, selling and administrative costs incurred related to the growing operations, contributed significantly to the losses. The Company expects the losses in Europe to continue through at least 2003. Other Information In December 2001, Keybuilder.com, LLC was dissolved. The Company continues to hold a 30% interest in Keymark Enterprises, LLC (“Keymark”) which is continuing to develop the Keymark software. Keymark has not and is not expected to generate significant revenues or profits. The Company hopes that the software that is developed by Keymark will also benefit SST’s future connector sales through continued specification of its products. Comparison of the Years Ended December 31, 2000 and 1999 Net Sales Net sales increased 12.4% to $369.1 million in 2000 from $328.4 million in 1999. Net sales of Simpson Strong-Tie’s products increased 16.4% to $303.8 million in 2000 from $260.9 million in 1999, while net sales of Simpson Dura-Vent’s products decreased by 3.2% to $65.3 million in 2000 from $67.5 million in 1999. SDV accounted for approximately 17.7% of the Company’s total net sales in 2000, a decrease from 20.6% in 1999. The increase in net sales at SST resulted from an increase in sales volume and a small increase in average prices, while the decrease in net sales at SDV resulted from a decrease in sales volume, offset slightly by an increase in average prices. The decrease in sales volume at SDV may have resulted, at least in part, from a reduction in demand for venting products for natural gas burning appliances as a result of higher natural gas prices. Most of the Company’s sales growth occurred domestically, particularly in California. International sales contributed to the annual increase, due in part to the acquisition of Furfix in the third quarter of 1999. See “Item 1. Business. Acquisitions and Expansion into New Markets.” Contractor distributors and home centers were the fastest growing connector sales channels. The sales increase was broad-based across most of SST’s major product lines. SST’s Strong-Wall and Anchor Systems product lines had the highest growth rates. With the exception of pellet vent products, sales in 2000 of all of SDV’s major product lines declined compared to sales in 1999. Gross Profit Gross profit increased 9.7% to $143.5 million in 2000 from $130.7 million in 1999. As a percentage of net sales, gross profit decreased to 38.9% in 2000 from 39.8% in 1999. This decrease was primarily due to increased costs related to slow moving inventory reserves as a result of excess inventory of specifically identified stock items. Selling Expense Selling expense increased 16.2% to $37.4 million in 2000 from $32.2 million in 1999. The increase was primarily due to higher personnel costs related to the increase in the number of sales and merchandising personnel, particularly those associated with selling the Anchor Systems product line, as well as increased promotional expenses. General and Administrative Expense General and administrative expenses increased 17.9% to $44.6 million in 2000 from $37.8 million in 1999, and increased as a percentage of net sales to 12.1% in 2000 from 11.5% in 1999. The increase was primarily due to
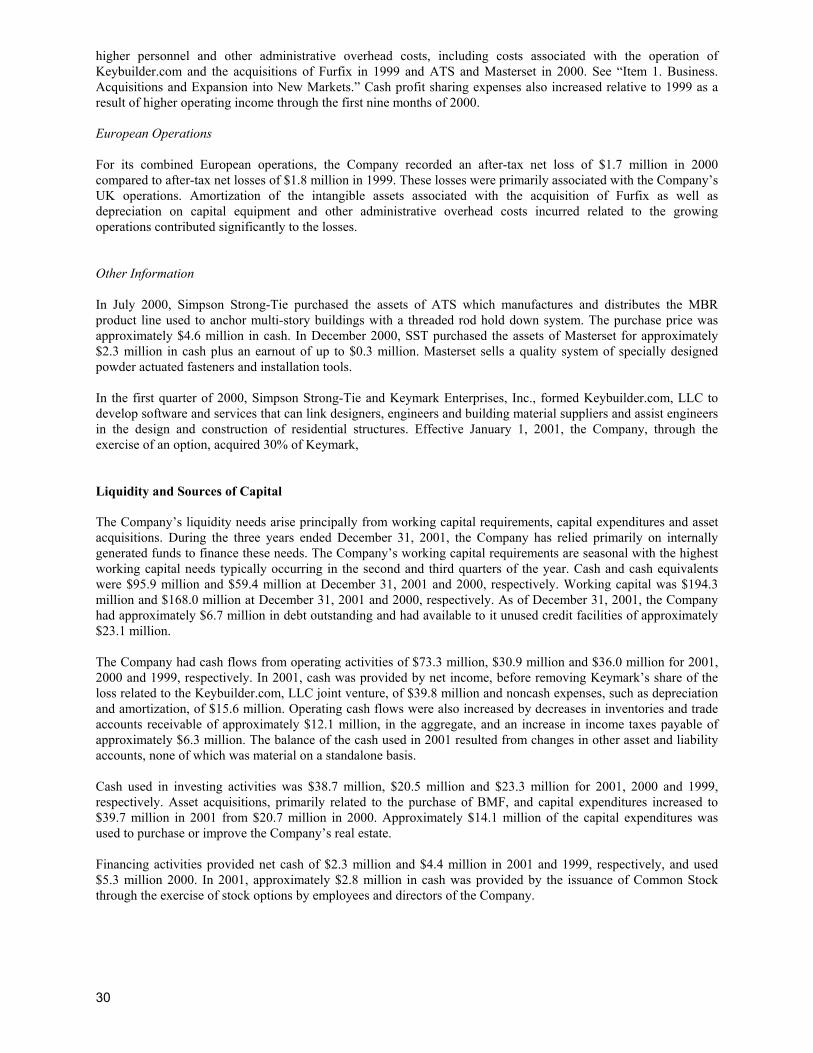
30
higher personnel and other administrative overhead costs, including costs associated with the operation of Keybuilder.com and the acquisitions of Furfix in 1999 and ATS and Masterset in 2000. See “Item 1. Business. Acquisitions and Expansion into New Markets.” Cash profit sharing expenses also increased relative to 1999 as a result of higher operating income through the first nine months of 2000. European Operations For its combined European operations, the Company recorded an after-tax net loss of $1.7 million in 2000 compared to after-tax net losses of $1.8 million in 1999. These losses were primarily associated with the Company’s UK operations. Amortization of the intangible assets associated with the acquisition of Furfix as well as depreciation on capital equipment and other administrative overhead costs incurred related to the growing operations contributed significantly to the losses. Other Information In July 2000, Simpson Strong-Tie purchased the assets of ATS which manufactures and distributes the MBR product line used to anchor multi-story buildings with a threaded rod hold down system. The purchase price was approximately $4.6 million in cash. In December 2000, SST purchased the assets of Masterset for approximately $2.3 million in cash plus an earnout of up to $0.3 million. Masterset sells a quality system of specially designed powder actuated fasteners and installation tools. In the first quarter of 2000, Simpson Strong-Tie and Keymark Enterprises, Inc., formed Keybuilder.com, LLC to develop software and services that can link designers, engineers and building material suppliers and assist engineers in the design and construction of residential structures. Effective January 1, 2001, the Company, through the exercise of an option, acquired 30% of Keymark, Liquidity and Sources of Capital The Company’s liquidity needs arise principally from working capital requirements, capital expenditures and asset acquisitions. During the three years ended December 31, 2001, the Company has relied primarily on internally generated funds to finance these needs. The Company’s working capital requirements are seasonal with the highest working capital needs typically occurring in the second and third quarters of the year. Cash and cash equivalents were $95.9 million and $59.4 million at December 31, 2001 and 2000, respectively. Working capital was $194.3 million and $168.0 million at December 31, 2001 and 2000, respectively. As of December 31, 2001, the Company had approximately $6.7 million in debt outstanding and had available to it unused credit facilities of approximately $23.1 million. The Company had cash flows from operating activities of $73.3 million, $30.9 million and $36.0 million for 2001, 2000 and 1999, respectively. In 2001, cash was provided by net income, before removing Keymark’s share of the loss related to the Keybuilder.com, LLC joint venture, of $39.8 million and noncash expenses, such as depreciation and amortization, of $15.6 million. Operating cash flows were also increased by decreases in inventories and trade accounts receivable of approximately $12.1 million, in the aggregate, and an increase in income taxes payable of approximately $6.3 million. The balance of the cash used in 2001 resulted from changes in other asset and liability accounts, none of which was material on a standalone basis. Cash used in investing activities was $38.7 million, $20.5 million and $23.3 million for 2001, 2000 and 1999, respectively. Asset acquisitions, primarily related to the purchase of BMF, and capital expenditures increased to $39.7 million in 2001 from $20.7 million in 2000. Approximately $14.1 million of the capital expenditures was used to purchase or improve the Company’s real estate. Financing activities provided net cash of $2.3 million and $4.4 million in 2001 and 1999, respectively, and used $5.3 million 2000. In 2001, approximately $2.8 million in cash was provided by the issuance of Common Stock through the exercise of stock options by employees and directors of the Company.
31
The Company believes that cash generated by operations, borrowings available under its existing credit agreements, the majority of which have been renewed through at least September 2002, and other available financing will be sufficient for the Company’s working capital needs and planned capital expenditures through at least 2002. Inflation The Company believes that the effect of inflation on the Company has not been material in recent years, as inflation rates have remained low. Item 7A. Quantitative and Qualitative Disclosures About Market Risk Not applicable.
32
Item 8. Financial Statements and Supplementary Data.
SIMPSON MANUFACTURING CO., INC. INDEX TO CONSOLIDATED FINANCIAL STATEMENTS
Financial Statements Report of Independent Accountants ............................................................................................... 32 Consolidated Balance Sheets at December 31, 2001 and 2000 ...................................................... 33 Consolidated Statements of Operations for the years ended December 31, 2001, 2000 and 1999 ........................................................................................... 34 Consolidated Statements of Stockholders’ Equity for the years ended December 31, 1999, 2000 and 2001 ........................................................................................... 35 Consolidated Statements of Cash Flows for the years ended December 31, 2001, 2000 and 1999 ........................................................................................... 36 Notes to the Consolidated Financial Statements............................................................................. 37 Financial Statement Schedule Schedule II – Valuation and Qualifying Accounts ......................................................................... 49
33
Report of Independent Accountants To the Board of Directors and Stockholders of Simpson Manufacturing Co., Inc.: In our opinion, the accompanying consolidated financial statements listed in the index on page 31 of this Form 10-K present fairly, in all material respects, the financial position of Simpson Manufacturing Co., Inc. (the “Company”) and its subsidiaries at December 31, 2001 and 2000, and the results of their operations and their cash flows for each of the three years in the period ended December 31, 2001, in conformity with accounting principles generally accepted in the United States of America. In addition, in our opinion, the financial statement schedule listed in the accompanying index presents fairly, in all material respects, the information set forth therein when read in conjunction with the related consolidated financial statements. These financial statements and the financial statement schedule are the responsibility of the Company’s management; our responsibility is to express an opinion on these financial statements and the financial statement schedule based on our audits. We conducted our audits of these financial statements in accordance with auditing standards generally accepted in the United States of America which require that we plan and perform the audit to obtain reasonable assurance about whether the financial statements are free of material misstatement. An audit includes examining, on a test basis, evidence supporting the amounts and disclosures in the financial statements, assessing the accounting principles used and significant estimates made by management, and evaluating the overall financial statement presentation. We believe that our audits provide a reasonable basis for our opinion. As discussed in Note 1 to the consolidated financial statements, the Company changed its method of valuing inventories from the last-in, first-out method to the first-in, first-out method. /s/PricewaterhouseCoopers LLP San Francisco, California February 4, 2002
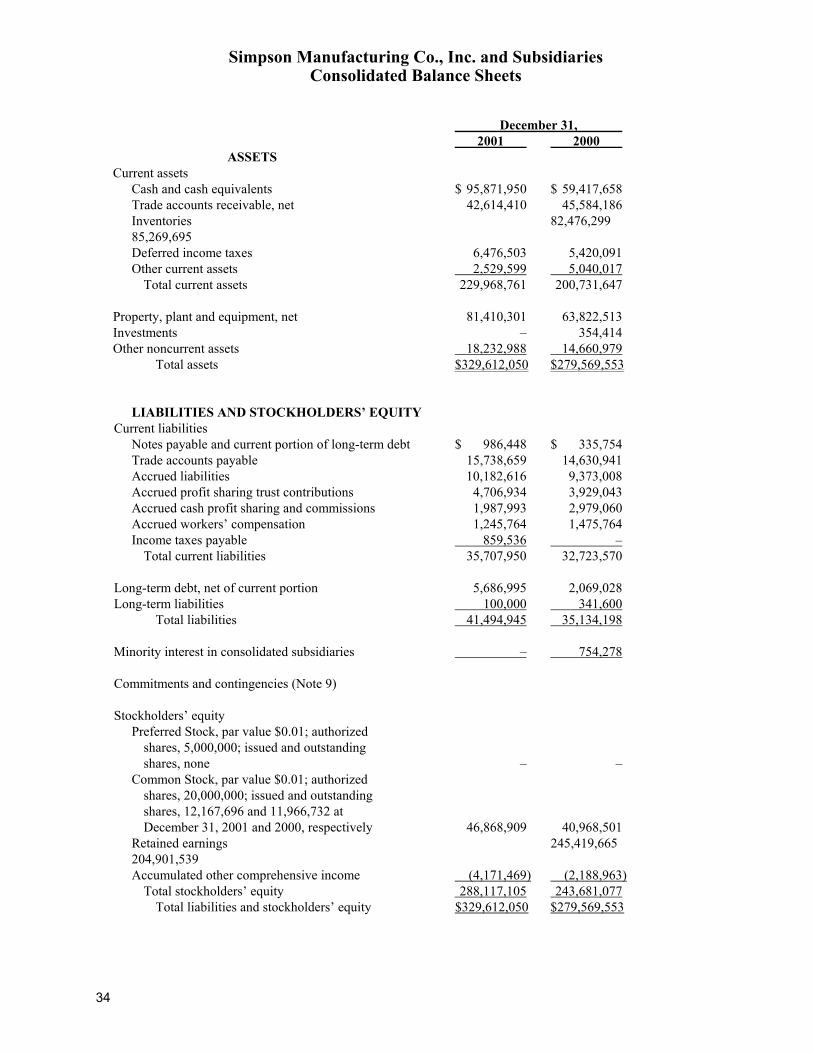
34
Simpson Manufacturing Co., Inc. and Subsidiaries Consolidated Balance Sheets
December 31, 2001 2000 ASSETS Current assets Cash and cash equivalents $ 95,871,950 $ 59,417,658 Trade accounts receivable, net 42,614,410 45,584,186 Inventories 82,476,299 85,269,695 Deferred income taxes 6,476,503 5,420,091 Other current assets 2,529,599 5,040,017 Total current assets 229,968,761 200,731,647 Property, plant and equipment, net 81,410,301 63,822,513 Investments – 354,414 Other noncurrent assets 18,232,988 14,660,979 Total assets $329,612,050 $279,569,553
LIABILITIES AND STOCKHOLDERS’ EQUITY Current liabilities Notes payable and current portion of long-term debt $ 986,448 $ 335,754 Trade accounts payable 15,738,659 14,630,941 Accrued liabilities 10,182,616 9,373,008 Accrued profit sharing trust contributions 4,706,934 3,929,043 Accrued cash profit sharing and commissions 1,987,993 2,979,060 Accrued workers’ compensation 1,245,764 1,475,764 Income taxes payable 859,536 – Total current liabilities 35,707,950 32,723,570 Long-term debt, net of current portion 5,686,995 2,069,028 Long-term liabilities 100,000 341,600 Total liabilities 41,494,945 35,134,198 Minority interest in consolidated subsidiaries – 754,278 Commitments and contingencies (Note 9) Stockholders’ equity Preferred Stock, par value $0.01; authorized shares, 5,000,000; issued and outstanding shares, none – – Common Stock, par value $0.01; authorized shares, 20,000,000; issued and outstanding shares, 12,167,696 and 11,966,732 at December 31, 2001 and 2000, respectively 46,868,909 40,968,501 Retained earnings 245,419,665 204,901,539 Accumulated other comprehensive income (4,171,469) (2,188,963) Total stockholders’ equity 288,117,105 243,681,077 Total liabilities and stockholders’ equity $329,612,050 $279,569,553

35
The accompanying notes are an integral part of these consolidated financial statements.
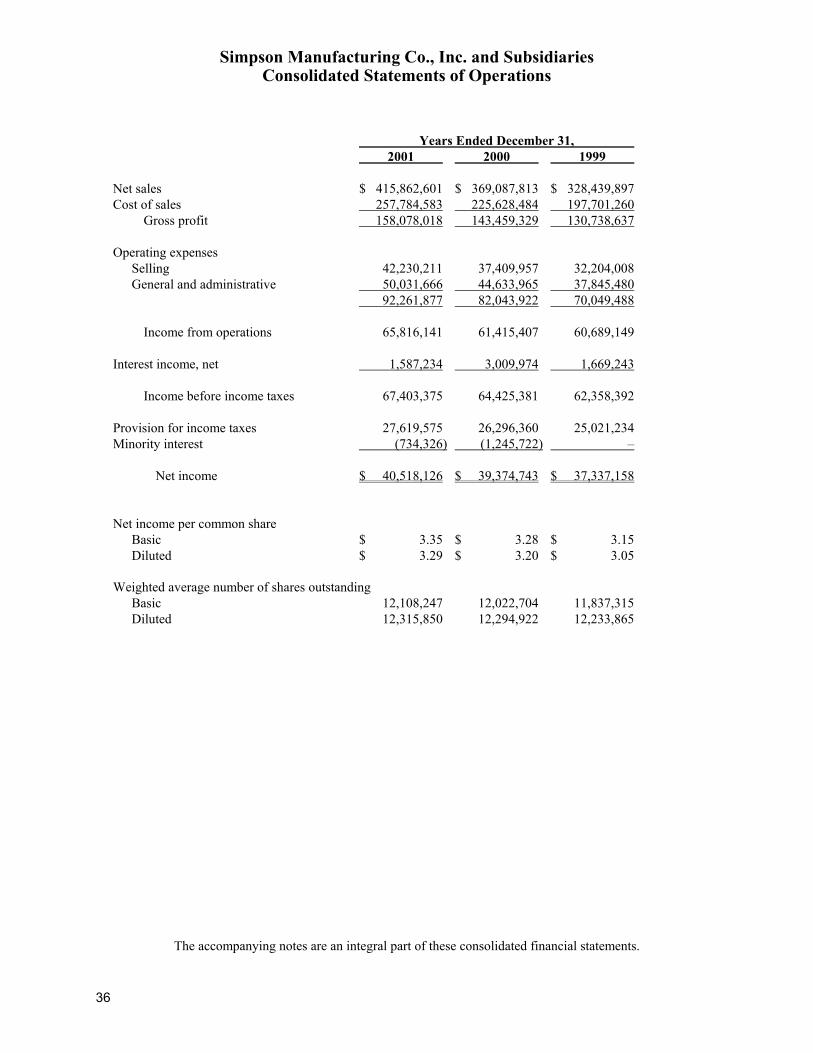
36
Simpson Manufacturing Co., Inc. and Subsidiaries Consolidated Statements of Operations
Years Ended December 31, 2001 2000 1999 Net sales $ 415,862,601 $ 369,087,813 $ 328,439,897 Cost of sales 257,784,583 225,628,484 197,701,260 Gross profit 158,078,018 143,459,329 130,738,637 Operating expenses Selling 42,230,211 37,409,957 32,204,008 General and administrative 50,031,666 44,633,965 37,845,480 92,261,877 82,043,922 70,049,488 Income from operations 65,816,141 61,415,407 60,689,149 Interest income, net 1,587,234 3,009,974 1,669,243 Income before income taxes 67,403,375 64,425,381 62,358,392 Provision for income taxes 27,619,575 26,296,360 25,021,234 Minority interest (734,326) (1,245,722) – Net income $ 40,518,126 $ 39,374,743 $ 37,337,158 Net income per common share Basic $ 3.35 $ 3.28 $ 3.15 Diluted $ 3.29 $ 3.20 $ 3.05
Weighted average number of shares outstanding Basic 12,108,247 12,022,704 11,837,315 Diluted 12,315,850 12,294,922 12,233,865
The accompanying notes are an integral part of these consolidated financial statements.
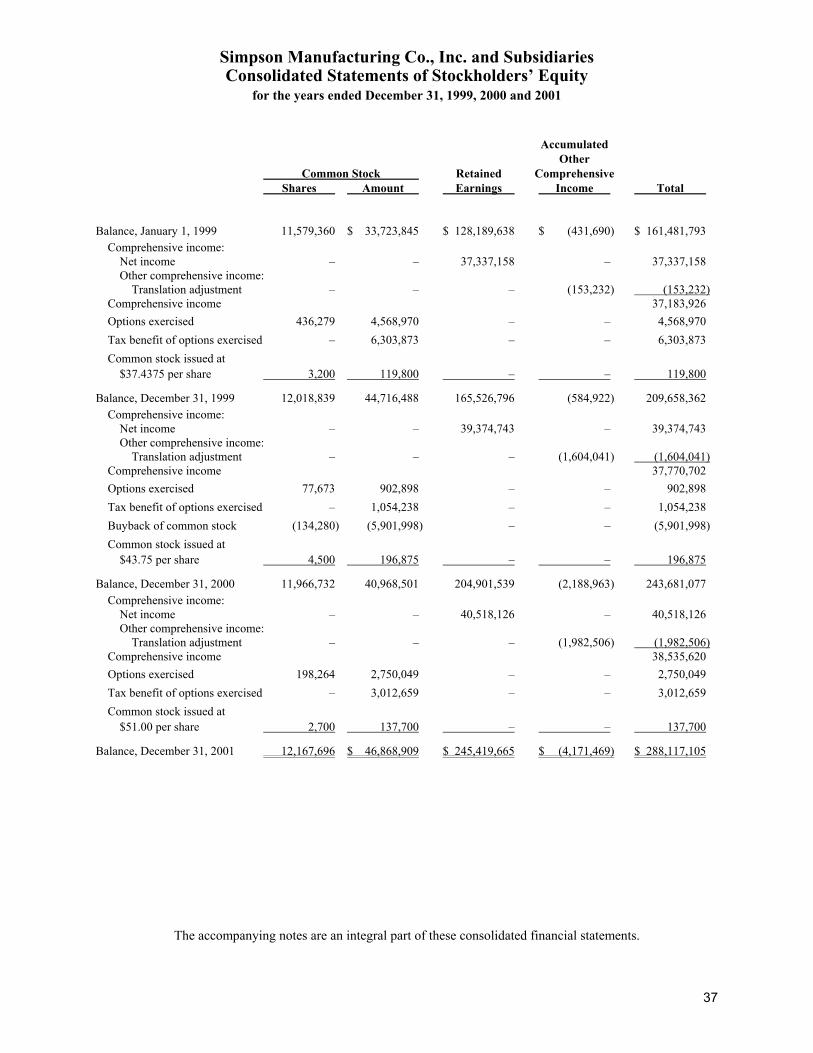
37
Simpson Manufacturing Co., Inc. and Subsidiaries Consolidated Statements of Stockholders’ Equity
for the years ended December 31, 1999, 2000 and 2001
Accumulated Other Common Stock Retained Comprehensive Shares Amount Earnings Income Total
Balance, January 1, 1999 11,579,360 $ 33,723,845 $ 128,189,638 $ (431,690) $ 161,481,793 Comprehensive income: Net income – – 37,337,158 – 37,337,158 Other comprehensive income: Translation adjustment – – – (153,232) (153,232) Comprehensive income 37,183,926 Options exercised 436,279 4,568,970 – – 4,568,970 Tax benefit of options exercised – 6,303,873 – – 6,303,873 Common stock issued at $37.4375 per share 3,200 119,800 – – 119,800
Balance, December 31, 1999 12,018,839 44,716,488 165,526,796 (584,922) 209,658,362 Comprehensive income: Net income – – 39,374,743 – 39,374,743 Other comprehensive income: Translation adjustment – – – (1,604,041) (1,604,041) Comprehensive income 37,770,702 Options exercised 77,673 902,898 – – 902,898 Tax benefit of options exercised – 1,054,238 – – 1,054,238 Buyback of common stock (134,280) (5,901,998) – – (5,901,998) Common stock issued at $43.75 per share 4,500 196,875 – – 196,875
Balance, December 31, 2000 11,966,732 40,968,501 204,901,539 (2,188,963) 243,681,077 Comprehensive income: Net income – – 40,518,126 – 40,518,126 Other comprehensive income: Translation adjustment – – – (1,982,506) (1,982,506) Comprehensive income 38,535,620 Options exercised 198,264 2,750,049 – – 2,750,049 Tax benefit of options exercised – 3,012,659 – – 3,012,659 Common stock issued at $51.00 per share 2,700 137,700 – – 137,700
Balance, December 31, 2001 12,167,696 $ 46,868,909 $ 245,419,665 $ (4,171,469) $ 288,117,105
The accompanying notes are an integral part of these consolidated financial statements.
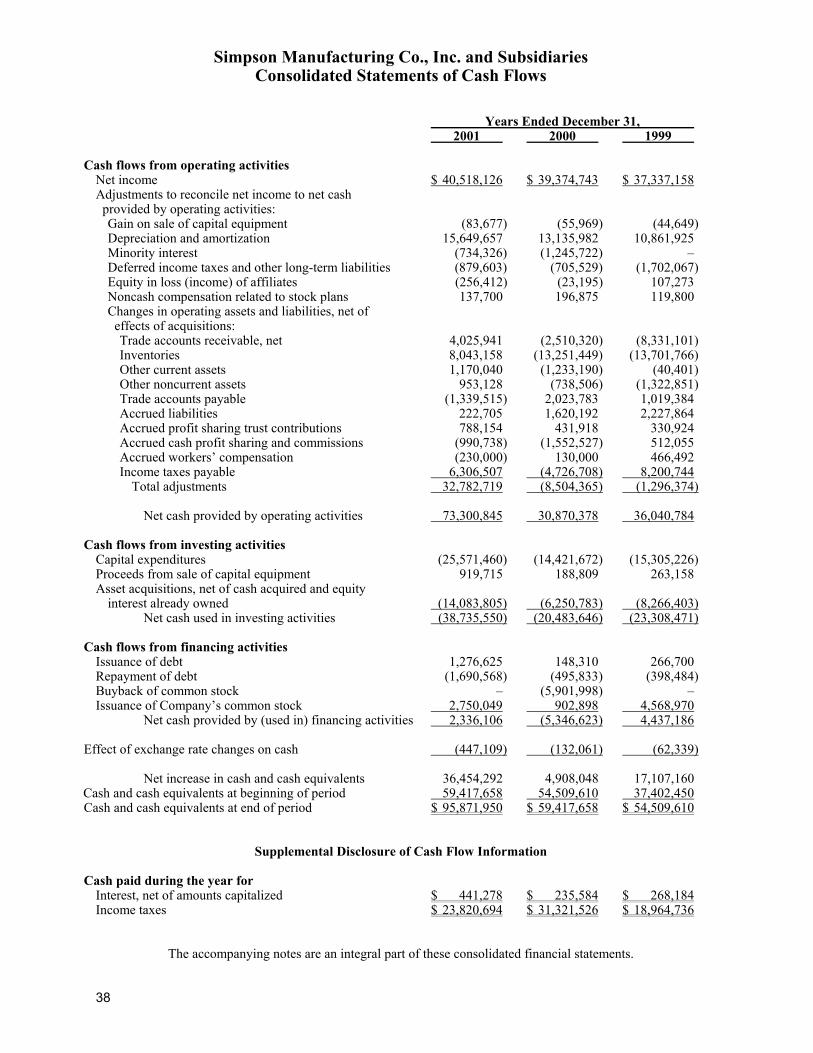
38
Simpson Manufacturing Co., Inc. and Subsidiaries Consolidated Statements of Cash Flows
Years Ended December 31, 2001 2000 1999 Cash flows from operating activities Net income $ 40,518,126 $ 39,374,743 $ 37,337,158 Adjustments to reconcile net income to net cash provided by operating activities: Gain on sale of capital equipment (83,677) (55,969) (44,649) Depreciation and amortization 15,649,657 13,135,982 10,861,925 Minority interest (734,326) (1,245,722) – Deferred income taxes and other long-term liabilities (879,603) (705,529) (1,702,067) Equity in loss (income) of affiliates (256,412) (23,195) 107,273 Noncash compensation related to stock plans 137,700 196,875 119,800 Changes in operating assets and liabilities, net of effects of acquisitions: Trade accounts receivable, net 4,025,941 (2,510,320) (8,331,101) Inventories 8,043,158 (13,251,449) (13,701,766) Other current assets 1,170,040 (1,233,190) (40,401) Other noncurrent assets 953,128 (738,506) (1,322,851) Trade accounts payable (1,339,515) 2,023,783 1,019,384 Accrued liabilities 222,705 1,620,192 2,227,864 Accrued profit sharing trust contributions 788,154 431,918 330,924 Accrued cash profit sharing and commissions (990,738) (1,552,527) 512,055 Accrued workers’ compensation (230,000) 130,000 466,492 Income taxes payable 6,306,507 (4,726,708) 8,200,744 Total adjustments 32,782,719 (8,504,365) (1,296,374) Net cash provided by operating activities 73,300,845 30,870,378 36,040,784 Cash flows from investing activities Capital expenditures (25,571,460) (14,421,672) (15,305,226) Proceeds from sale of capital equipment 919,715 188,809 263,158 Asset acquisitions, net of cash acquired and equity interest already owned (14,083,805) (6,250,783) (8,266,403) Net cash used in investing activities (38,735,550) (20,483,646) (23,308,471) Cash flows from financing activities Issuance of debt 1,276,625 148,310 266,700 Repayment of debt (1,690,568) (495,833) (398,484) Buyback of common stock – (5,901,998) – Issuance of Company’s common stock 2,750,049 902,898 4,568,970 Net cash provided by (used in) financing activities 2,336,106 (5,346,623) 4,437,186 Effect of exchange rate changes on cash (447,109) (132,061) (62,339) Net increase in cash and cash equivalents 36,454,292 4,908,048 17,107,160 Cash and cash equivalents at beginning of period 59,417,658 54,509,610 37,402,450 Cash and cash equivalents at end of period $ 95,871,950 $ 59,417,658 $ 54,509,610
Supplemental Disclosure of Cash Flow Information Cash paid during the year for Interest, net of amounts capitalized $ 441,278 $ 235,584 $ 268,184 Income taxes $ 23,820,694 $ 31,321,526 $ 18,964,736
The accompanying notes are an integral part of these consolidated financial statements.
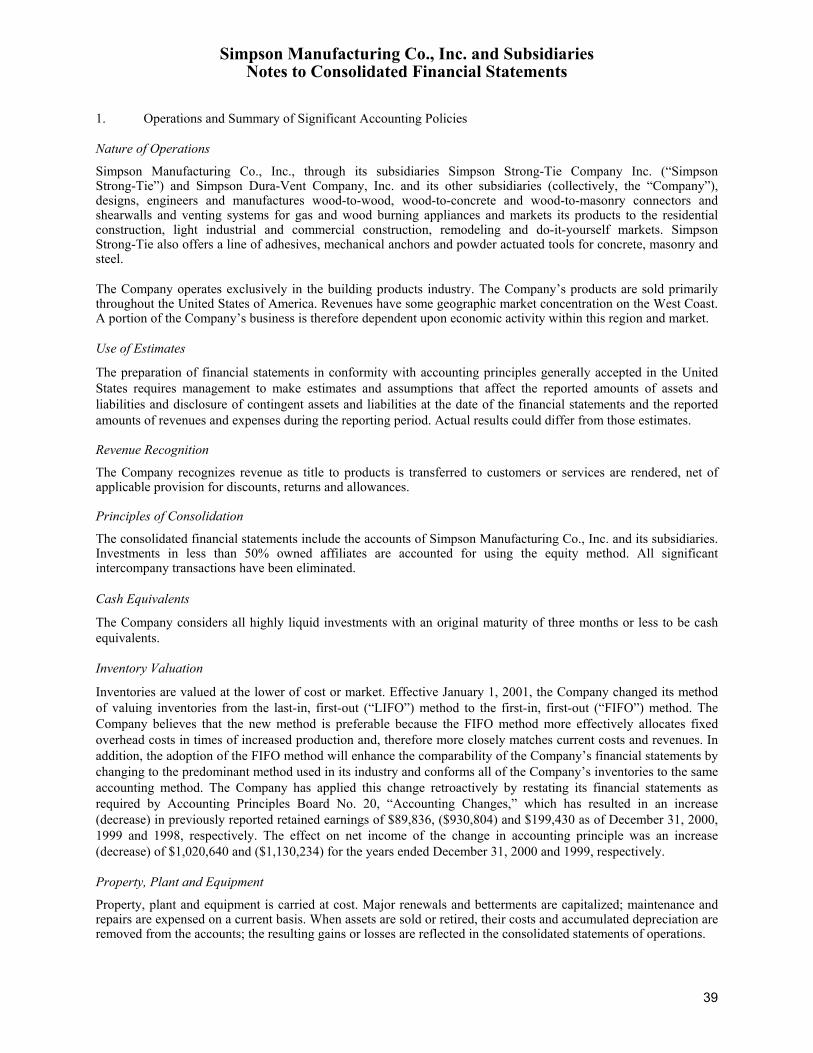
39
Simpson Manufacturing Co., Inc. and Subsidiaries Notes to Consolidated Financial Statements
1. Operations and Summary of Significant Accounting Policies Nature of Operations Simpson Manufacturing Co., Inc., through its subsidiaries Simpson Strong-Tie Company Inc. (“Simpson Strong-Tie”) and Simpson Dura-Vent Company, Inc. and its other subsidiaries (collectively, the “Company”), designs, engineers and manufactures wood-to-wood, wood-to-concrete and wood-to-masonry connectors and shearwalls and venting systems for gas and wood burning appliances and markets its products to the residential construction, light industrial and commercial construction, remodeling and do-it-yourself markets. Simpson Strong-Tie also offers a line of adhesives, mechanical anchors and powder actuated tools for concrete, masonry and steel. The Company operates exclusively in the building products industry. The Company’s products are sold primarily throughout the United States of America. Revenues have some geographic market concentration on the West Coast. A portion of the Company’s business is therefore dependent upon economic activity within this region and market. Use of Estimates The preparation of financial statements in conformity with accounting principles generally accepted in the United States requires management to make estimates and assumptions that affect the reported amounts of assets and liabilities and disclosure of contingent assets and liabilities at the date of the financial statements and the reported amounts of revenues and expenses during the reporting period. Actual results could differ from those estimates. Revenue Recognition The Company recognizes revenue as title to products is transferred to customers or services are rendered, net of applicable provision for discounts, returns and allowances. Principles of Consolidation The consolidated financial statements include the accounts of Simpson Manufacturing Co., Inc. and its subsidiaries. Investments in less than 50% owned affiliates are accounted for using the equity method. All significant intercompany transactions have been eliminated. Cash Equivalents The Company considers all highly liquid investments with an original maturity of three months or less to be cash equivalents. Inventory Valuation Inventories are valued at the lower of cost or market. Effective January 1, 2001, the Company changed its method of valuing inventories from the last-in, first-out (“LIFO”) method to the first-in, first-out (“FIFO”) method. The Company believes that the new method is preferable because the FIFO method more effectively allocates fixed overhead costs in times of increased production and, therefore more closely matches current costs and revenues. In addition, the adoption of the FIFO method will enhance the comparability of the Company’s financial statements by changing to the predominant method used in its industry and conforms all of the Company’s inventories to the same accounting method. The Company has applied this change retroactively by restating its financial statements as required by Accounting Principles Board No. 20, “Accounting Changes,” which has resulted in an increase (decrease) in previously reported retained earnings of $89,836, ($930,804) and $199,430 as of December 31, 2000, 1999 and 1998, respectively. The effect on net income of the change in accounting principle was an increase (decrease) of $1,020,640 and ($1,130,234) for the years ended December 31, 2000 and 1999, respectively. Property, Plant and Equipment Property, plant and equipment is carried at cost. Major renewals and betterments are capitalized; maintenance and repairs are expensed on a current basis. When assets are sold or retired, their costs and accumulated depreciation are removed from the accounts; the resulting gains or losses are reflected in the consolidated statements of operations.
40
Depreciation and Amortization Depreciation of property, plant and equipment is provided for using accelerated methods over the following estimated useful lives: Factory machinery and equipment 5 to 10 years Automobiles, trucks and other equipment 3 to 10 years Office equipment 3 to 8 years Buildings and site improvements 20 to 45 years Leasehold improvements are amortized using the straight-line method over the shorter of the expected life or the remaining term of the lease. Amortization of intangible assets is computed using the straight-line method over the estimated useful lives of the asset. Product Research and Development Costs Product research and development costs, which are included in cost of sales, were charged against income as incurred and approximated $2,747,000, $2,226,000 and $1,809,000 in 2001, 2000 and 1999, respectively. Tooling Costs Tool and die costs are included in product costs in the year incurred. Income Taxes Income taxes are calculated using an asset and liability approach. The provision for income taxes includes federal and state taxes currently payable and deferred taxes, due to temporary differences between the financial statement and tax bases of assets and liabilities. In addition, the future tax benefits are recognized to the extent that realization of such benefits is more likely than not. Foreign Currency Translation The local currency is the functional currency of the Company’s operations in Europe and Canada. Assets and liabilities denominated in foreign currencies are translated using the exchange rate on the balance sheet date. Revenues and expenses are translated using average exchange rates prevailing during the year. The translation adjustment resulting from this process is shown separately as a component of stockholders’ equity. Foreign currency transaction gains or losses are included in the determination of net income. Common Stock Subject to the rights of holders of any Preferred Stock that may be issued in the future, holders of Common Stock are entitled to receive such dividends, if any, as may be declared from time to time by the Board of Directors (the “Board”) out of legally available funds and in the event of liquidation, dissolution or winding-up of the Company, to share ratably in all assets available for distribution. The holders of Common Stock have no preemptive or conversion rights. Subject to the rights of any Preferred Stock that may be issued in the future, the holders of Common Stock are entitled to one vote per share on any matter submitted to a vote of the stockholders, except that, on giving notice as required by law and subject to compliance with other statutory conditions, stockholders may cumulate their votes in an election of directors, and each stockholder may give one candidate a number of votes equal to the number of directors to be elected multiplied by the number of shares held by such stockholder or may distribute such stockholder’s votes on the same principle among as many candidates as such stockholder thinks fit. There are no redemption or sinking fund provisions applicable to the Common Stock.
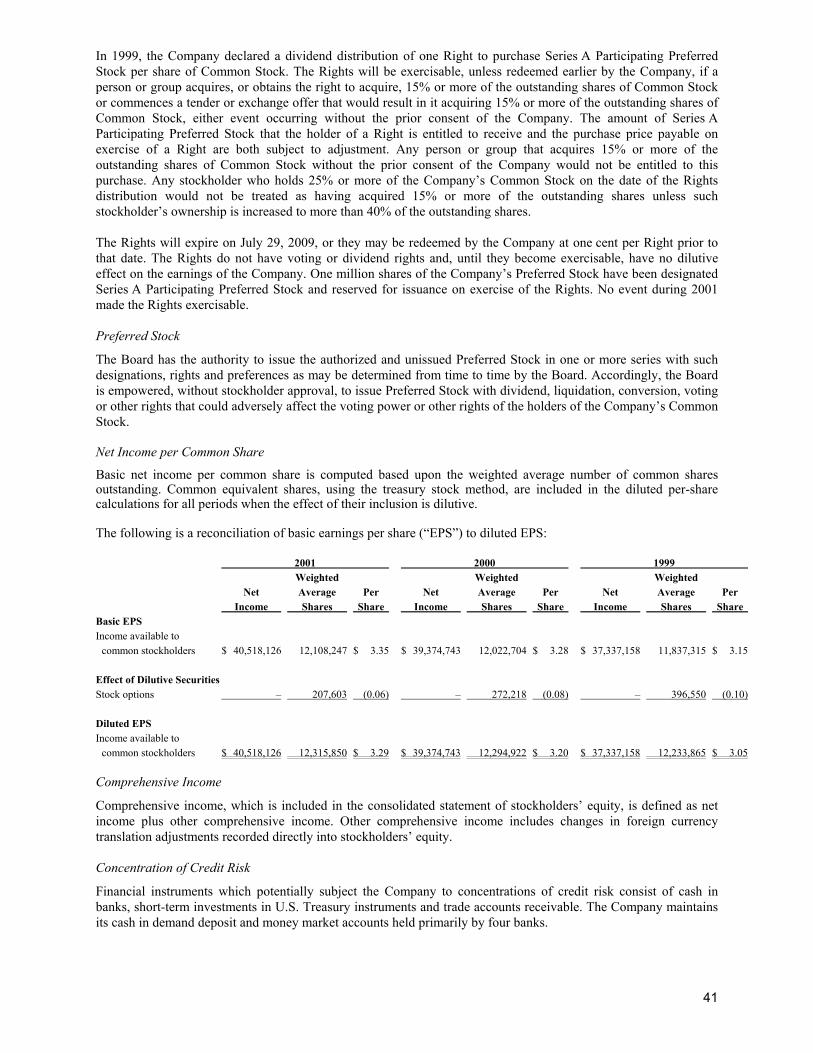
41
In 1999, the Company declared a dividend distribution of one Right to purchase Series A Participating Preferred Stock per share of Common Stock. The Rights will be exercisable, unless redeemed earlier by the Company, if a person or group acquires, or obtains the right to acquire, 15% or more of the outstanding shares of Common Stock or commences a tender or exchange offer that would result in it acquiring 15% or more of the outstanding shares of Common Stock, either event occurring without the prior consent of the Company. The amount of Series A Participating Preferred Stock that the holder of a Right is entitled to receive and the purchase price payable on exercise of a Right are both subject to adjustment. Any person or group that acquires 15% or more of the outstanding shares of Common Stock without the prior consent of the Company would not be entitled to this purchase. Any stockholder who holds 25% or more of the Company’s Common Stock on the date of the Rights distribution would not be treated as having acquired 15% or more of the outstanding shares unless such stockholder’s ownership is increased to more than 40% of the outstanding shares. The Rights will expire on July 29, 2009, or they may be redeemed by the Company at one cent per Right prior to that date. The Rights do not have voting or dividend rights and, until they become exercisable, have no dilutive effect on the earnings of the Company. One million shares of the Company’s Preferred Stock have been designated Series A Participating Preferred Stock and reserved for issuance on exercise of the Rights. No event during 2001 made the Rights exercisable. Preferred Stock The Board has the authority to issue the authorized and unissued Preferred Stock in one or more series with such designations, rights and preferences as may be determined from time to time by the Board. Accordingly, the Board is empowered, without stockholder approval, to issue Preferred Stock with dividend, liquidation, conversion, voting or other rights that could adversely affect the voting power or other rights of the holders of the Company’s Common Stock. Net Income per Common Share Basic net income per common share is computed based upon the weighted average number of common shares outstanding. Common equivalent shares, using the treasury stock method, are included in the diluted per-share calculations for all periods when the effect of their inclusion is dilutive. The following is a reconciliation of basic earnings per share (“EPS”) to diluted EPS: 2001 2000 1999 Weighted Weighted Weighted Net Average Per Net Average Per Net Average Per Income Shares Share Income Shares Share Income Shares Share Basic EPS Income available to common stockholders $ 40,518,126 12,108,247 $ 3.35 $ 39,374,743 12,022,704 $ 3.28 $ 37,337,158 11,837,315 $ 3.15 Effect of Dilutive Securities Stock options – 207,603 (0.06) – 272,218 (0.08) – 396,550 (0.10) Diluted EPS Income available to common stockholders $ 40,518,126 12,315,850 $ 3.29 $ 39,374,743 12,294,922 $ 3.20 $ 37,337,158 12,233,865 $ 3.05 Comprehensive Income Comprehensive income, which is included in the consolidated statement of stockholders’ equity, is defined as net income plus other comprehensive income. Other comprehensive income includes changes in foreign currency translation adjustments recorded directly into stockholders’ equity. Concentration of Credit Risk Financial instruments which potentially subject the Company to concentrations of credit risk consist of cash in banks, short-term investments in U.S. Treasury instruments and trade accounts receivable. The Company maintains its cash in demand deposit and money market accounts held primarily by four banks.
42
Adoption of Statements of Financial Accounting Standards In June 2000, Financial Accounting Standards Board (“FASB”) statement No. 138, “Accounting for Certain Derivative Instruments and Certain Hedging Activities—an amendment of FASB statement No. 133” was issued. FASB statement No. 133 was amended by FASB statement No. 137, which deferred the effective date of implementation to the first quarter of fiscal years beginning after June 15, 2000. FASB statement No. 133 requires companies to record derivative financial instruments on the balance sheet as assets or liabilities, as appropriate, at fair value. Gains or losses resulting from changes in the fair value of those derivatives are accounted for depending on the use of the derivative and whether it qualifies for hedge accounting. The Company does not hold or issue any hedge instruments. Therefore, the adoption of this standard by the Company has not had a material effect on its financial position as of December 31, 2001, or results of operations for the period then ended. In July 2001, the FASB issued SFAS No. 141, “Business Combinations” which requires all business combinations initiated after June 30, 2001, to be accounted for using the purchase method of accounting. As a result, use of the pooling-of-interests method is prohibited for business combinations initiated thereafter. SFAS 141 also establishes criteria for the separate recognition of intangible assets acquired in a business combination. The adoption of this standard by the Company is not expected to have a material effect on its financial position or results of operations. In July 2001, the FASB issued SFAS No. 142, “Goodwill and Other Intangible Assets” which requires that goodwill and certain other intangible assets having indefinite lives no longer be amortized to earnings, but instead be subject to periodic testing for impairment. Intangible assets determined to have definitive lives will continue to be amortized over their useful lives. SFAS No. 142 is effective for the Company’s fiscal year beginning January 1, 2002. However, goodwill and intangible assets acquired after June 30, 2001, are subject immediately to the non-amortization and amortization provisions of this Statement. The amount of amortization related to goodwill for the years ended December 31, 2001 and 2000, was approximately $1,672,000 and $946,000, respectively. The Company has not yet determined the effect of the adoption of SFAS 142 on its financial position and its results of operations for fiscal year 2002. Reclassifications Certain prior year amounts have been reclassified to conform to the 2001 presentation with no effect on net income or retained earnings as previously reported. 2. Acquisitions In January 2001, Simpson Strong-Tie International, Inc. (“SSTI”), a subsidiary of the Company, acquired 100% of the shares of BMF Bygningsbeslag A/S (“BMF”) of Denmark for approximately $13.6 million in cash. BMF manufactures and distributes connector products in northern and central Europe. In August 2001, the German subsidiary of BMF purchased the remaining 51% stake in Bulldog-Simpson GmbH (“Bulldog”) for approximately $0.6 million in cash. In July 2000, Simpson Strong-Tie purchased the assets of Anchor Tiedown Systems, Inc. (“ATS”). ATS manufactures and distributes a product line used to anchor multi-story buildings with a threaded rod hold down system. The purchase price was approximately $4.6 million in cash. In December 2000, Simpson Strong-Tie purchased the assets of Masterset Fastening Systems, Inc. (“Masterset”) for approximately $2.3 million in cash plus an earnout of up to $0.3 million. Masterset sells a system of specially designed powder actuated fasteners and installation tools. In August 1999, SSTI purchased the assets of Furfix Products Limited and Easy Arches Limited (together, “Furfix”), which manufacture a line of structural connectors for the wood and masonry construction markets in the United Kingdom and Europe. The purchase price was approximately $7.8 million in cash plus an earnout based on future operating performance. Included in the purchase price were costs associated with the closure of Furfix’s existing facility and integration into SSTI’s facility in Tamworth, England.
43
3. Trade Accounts Receivable Trade accounts receivable consist of the following:
December 31, 2001 2000
Trade accounts receivable $ 46,706,227 $ 47,119,344 Allowance for doubtful accounts (3,736,098) (1,201,289) Allowance for sales discounts (355,719) (333,869) $ 42,614,410 $ 45,584,186
The Company sells product on credit and generally does not require collateral.
4. Inventories The components of inventories consist of the following:
December 31, 2001 2000 Raw materials $ 25,933,323 $ 26,979,866 In-process products 13,419,637 10,882,721 Finished products 43,123,339 47,407,108 $ 82,476,299 $ 85,269,695
5. Property, Plant and Equipment, net Property, plant and equipment consists of the following:
December 31, 2001 2000 Land $ 10,558,241 $ 4,454,322 Buildings and site improvements 37,438,423 27,634,848 Leasehold improvements 5,774,165 4,042,063 Machinery and equipment 101,774,552 88,221,556 155,545,381 124,352,789 Less accumulated depreciation and amortization (80,501,488) (69,293,151) 75,043,893 55,059,638 Capital projects in progress 6,366,408 8,762,875 $ 81,410,301 $ 63,822,513
Included in property, plant and equipment at December 31, 2001 and 2000, are fully depreciated assets with an original cost of approximately $34,873,000 and $26,475,000, respectively. These fully depreciated assets are still in use in the Company’s operations. 6. Investments The Company has a 30% investment in Keymark Enterprises, LLC (“Keymark”) which it accounts for using the equity method. The Company’s equity in the earnings or losses of this investment or its initial 49% investment in Bulldog (see Note 2) has not been material in any of the three years in the period ended December 31, 2001.
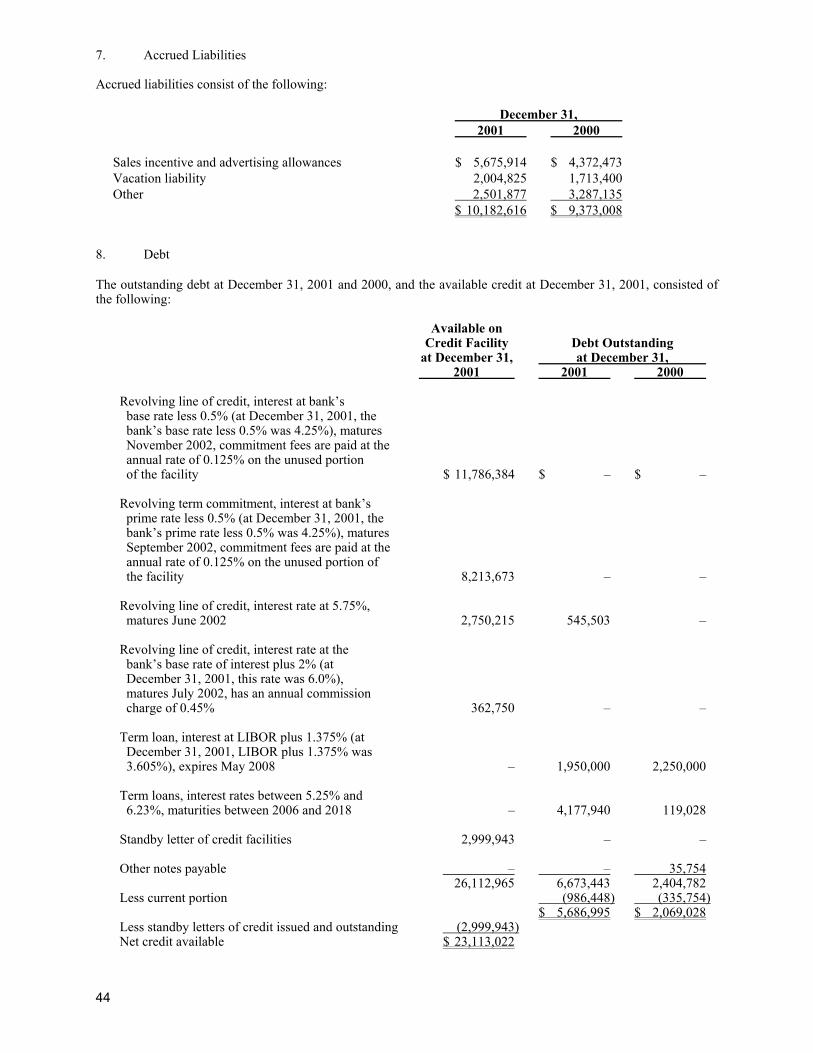
44
7. Accrued Liabilities Accrued liabilities consist of the following:
December 31, 2001 2000 Sales incentive and advertising allowances $ 5,675,914 $ 4,372,473 Vacation liability 2,004,825 1,713,400 Other 2,501,877 3,287,135 $ 10,182,616 $ 9,373,008
8. Debt The outstanding debt at December 31, 2001 and 2000, and the available credit at December 31, 2001, consisted of the following: Available on Credit Facility Debt Outstanding at December 31, at December 31, 2001 2001 2000
Revolving line of credit, interest at bank’s base rate less 0.5% (at December 31, 2001, the bank’s base rate less 0.5% was 4.25%), matures November 2002, commitment fees are paid at the annual rate of 0.125% on the unused portion of the facility $ 11,786,384 $ – $ – Revolving term commitment, interest at bank’s prime rate less 0.5% (at December 31, 2001, the bank’s prime rate less 0.5% was 4.25%), matures September 2002, commitment fees are paid at the annual rate of 0.125% on the unused portion of the facility 8,213,673 – – Revolving line of credit, interest rate at 5.75%, matures June 2002 2,750,215 545,503 – Revolving line of credit, interest rate at the bank’s base rate of interest plus 2% (at December 31, 2001, this rate was 6.0%), matures July 2002, has an annual commission charge of 0.45% 362,750 – – Term loan, interest at LIBOR plus 1.375% (at December 31, 2001, LIBOR plus 1.375% was 3.605%), expires May 2008 – 1,950,000 2,250,000 Term loans, interest rates between 5.25% and 6.23%, maturities between 2006 and 2018 – 4,177,940 119,028 Standby letter of credit facilities 2,999,943 – – Other notes payable – – 35,754 26,112,965 6,673,443 2,404,782 Less current portion (986,448) (335,754) $ 5,686,995 $ 2,069,028 Less standby letters of credit issued and outstanding (2,999,943) Net credit available $ 23,113,022
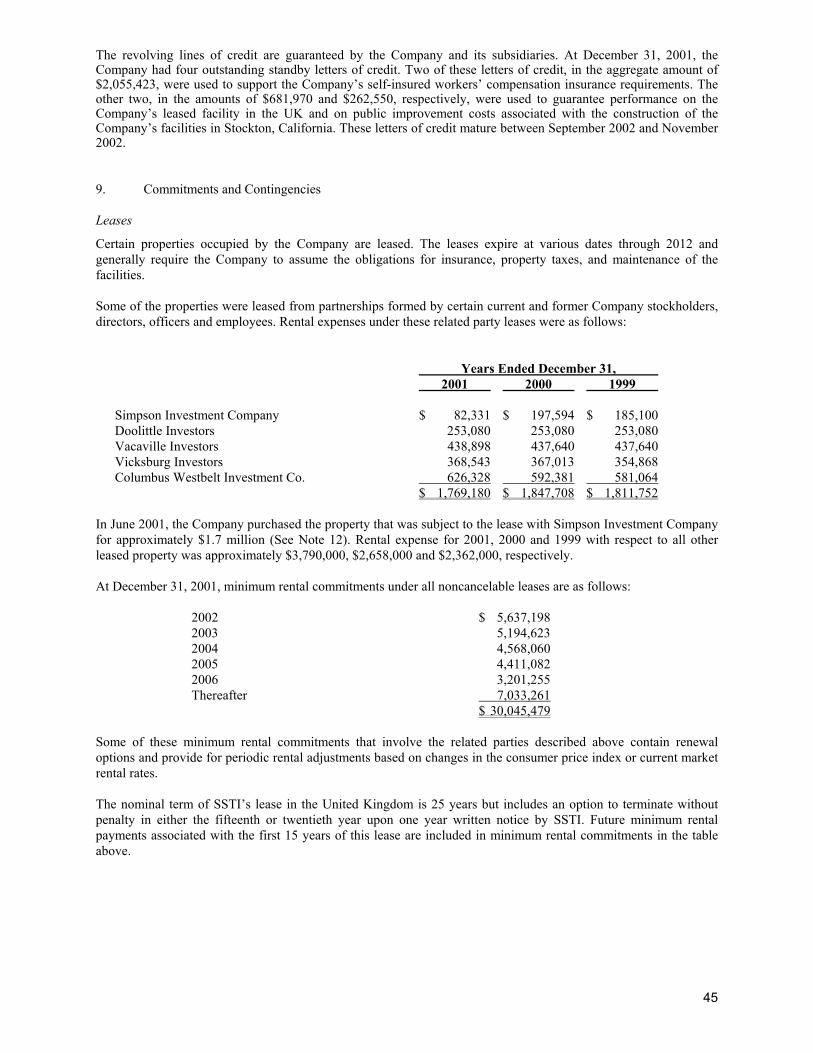
45
The revolving lines of credit are guaranteed by the Company and its subsidiaries. At December 31, 2001, the Company had four outstanding standby letters of credit. Two of these letters of credit, in the aggregate amount of $2,055,423, were used to support the Company’s self-insured workers’ compensation insurance requirements. The other two, in the amounts of $681,970 and $262,550, respectively, were used to guarantee performance on the Company’s leased facility in the UK and on public improvement costs associated with the construction of the Company’s facilities in Stockton, California. These letters of credit mature between September 2002 and November 2002. 9. Commitments and Contingencies Leases Certain properties occupied by the Company are leased. The leases expire at various dates through 2012 and generally require the Company to assume the obligations for insurance, property taxes, and maintenance of the facilities. Some of the properties were leased from partnerships formed by certain current and former Company stockholders, directors, officers and employees. Rental expenses under these related party leases were as follows:
Years Ended December 31, 2001 2000 1999 Simpson Investment Company $ 82,331 $ 197,594 $ 185,100 Doolittle Investors 253,080 253,080 253,080 Vacaville Investors 438,898 437,640 437,640 Vicksburg Investors 368,543 367,013 354,868 Columbus Westbelt Investment Co. 626,328 592,381 581,064 $ 1,769,180 $ 1,847,708 $ 1,811,752
In June 2001, the Company purchased the property that was subject to the lease with Simpson Investment Company for approximately $1.7 million (See Note 12). Rental expense for 2001, 2000 and 1999 with respect to all other leased property was approximately $3,790,000, $2,658,000 and $2,362,000, respectively. At December 31, 2001, minimum rental commitments under all noncancelable leases are as follows: 2002 $ 5,637,198 2003 5,194,623 2004 4,568,060 2005 4,411,082 2006 3,201,255 Thereafter 7,033,261 $ 30,045,479 Some of these minimum rental commitments that involve the related parties described above contain renewal options and provide for periodic rental adjustments based on changes in the consumer price index or current market rental rates. The nominal term of SSTI’s lease in the United Kingdom is 25 years but includes an option to terminate without penalty in either the fifteenth or twentieth year upon one year written notice by SSTI. Future minimum rental payments associated with the first 15 years of this lease are included in minimum rental commitments in the table above.
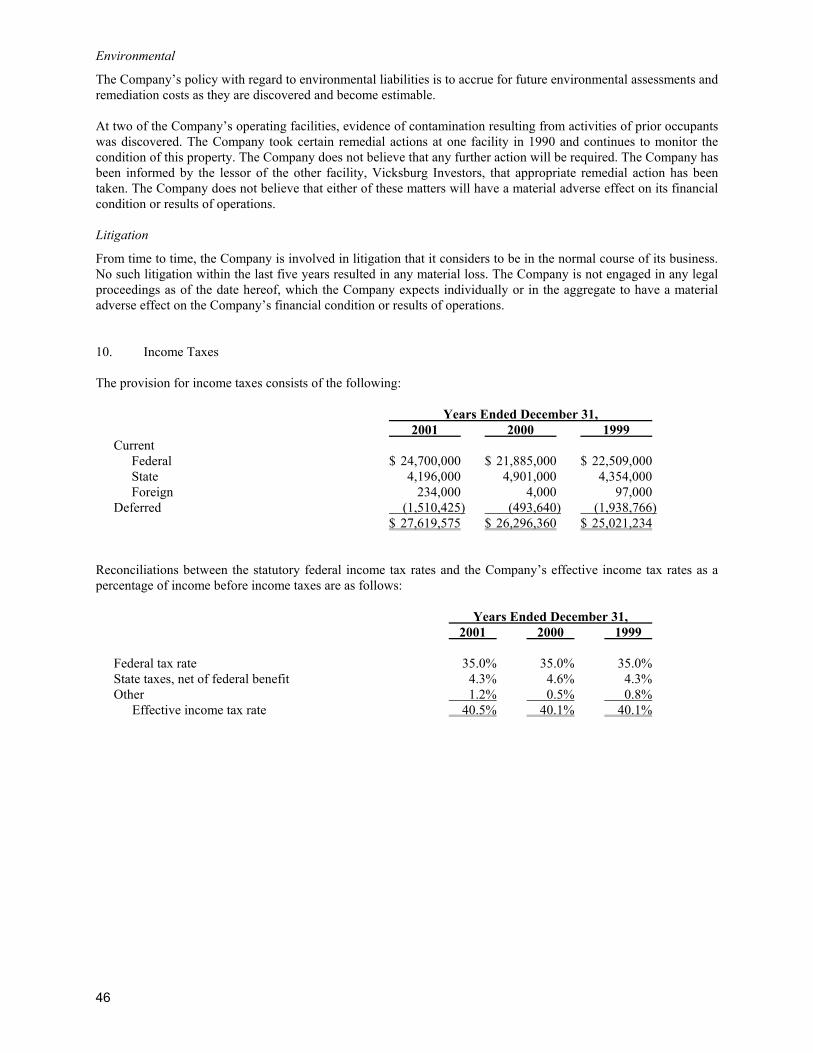
46
Environmental The Company’s policy with regard to environmental liabilities is to accrue for future environmental assessments and remediation costs as they are discovered and become estimable. At two of the Company’s operating facilities, evidence of contamination resulting from activities of prior occupants was discovered. The Company took certain remedial actions at one facility in 1990 and continues to monitor the condition of this property. The Company does not believe that any further action will be required. The Company has been informed by the lessor of the other facility, Vicksburg Investors, that appropriate remedial action has been taken. The Company does not believe that either of these matters will have a material adverse effect on its financial condition or results of operations. Litigation From time to time, the Company is involved in litigation that it considers to be in the normal course of its business. No such litigation within the last five years resulted in any material loss. The Company is not engaged in any legal proceedings as of the date hereof, which the Company expects individually or in the aggregate to have a material adverse effect on the Company’s financial condition or results of operations. 10. Income Taxes The provision for income taxes consists of the following:
Years Ended December 31, 2001 2000 1999 Current Federal $ 24,700,000 $ 21,885,000 $ 22,509,000 State 4,196,000 4,901,000 4,354,000 Foreign 234,000 4,000 97,000 Deferred (1,510,425) (493,640) (1,938,766) $ 27,619,575 $ 26,296,360 $ 25,021,234
Reconciliations between the statutory federal income tax rates and the Company’s effective income tax rates as a percentage of income before income taxes are as follows:
Years Ended December 31, 2001 2000 1999 Federal tax rate 35.0% 35.0% 35.0% State taxes, net of federal benefit 4.3% 4.6% 4.3% Other 1.2% 0.5% 0.8% Effective income tax rate 40.5% 40.1% 40.1%
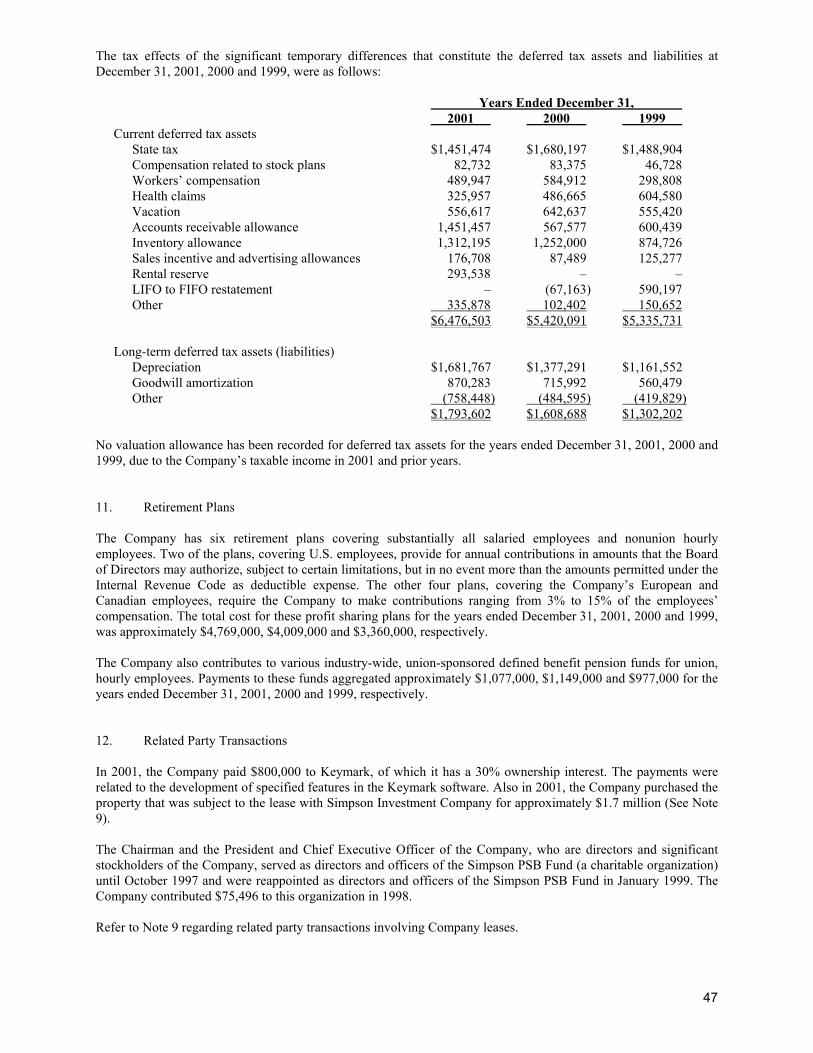
47
The tax effects of the significant temporary differences that constitute the deferred tax assets and liabilities at December 31, 2001, 2000 and 1999, were as follows:
Years Ended December 31, 2001 2000 1999 Current deferred tax assets State tax $1,451,474 $1,680,197 $1,488,904 Compensation related to stock plans 82,732 83,375 46,728 Workers’ compensation 489,947 584,912 298,808 Health claims 325,957 486,665 604,580 Vacation 556,617 642,637 555,420 Accounts receivable allowance 1,451,457 567,577 600,439 Inventory allowance 1,312,195 1,252,000 874,726 Sales incentive and advertising allowances 176,708 87,489 125,277 Rental reserve 293,538 – – LIFO to FIFO restatement – (67,163) 590,197 Other 335,878 102,402 150,652 $6,476,503 $5,420,091 $5,335,731
Long-term deferred tax assets (liabilities) Depreciation $1,681,767 $1,377,291 $1,161,552 Goodwill amortization 870,283 715,992 560,479 Other (758,448) (484,595) (419,829) $1,793,602 $1,608,688 $1,302,202
No valuation allowance has been recorded for deferred tax assets for the years ended December 31, 2001, 2000 and 1999, due to the Company’s taxable income in 2001 and prior years. 11. Retirement Plans The Company has six retirement plans covering substantially all salaried employees and nonunion hourly employees. Two of the plans, covering U.S. employees, provide for annual contributions in amounts that the Board of Directors may authorize, subject to certain limitations, but in no event more than the amounts permitted under the Internal Revenue Code as deductible expense. The other four plans, covering the Company’s European and Canadian employees, require the Company to make contributions ranging from 3% to 15% of the employees’ compensation. The total cost for these profit sharing plans for the years ended December 31, 2001, 2000 and 1999, was approximately $4,769,000, $4,009,000 and $3,360,000, respectively. The Company also contributes to various industry-wide, union-sponsored defined benefit pension funds for union, hourly employees. Payments to these funds aggregated approximately $1,077,000, $1,149,000 and $977,000 for the years ended December 31, 2001, 2000 and 1999, respectively. 12. Related Party Transactions In 2001, the Company paid $800,000 to Keymark, of which it has a 30% ownership interest. The payments were related to the development of specified features in the Keymark software. Also in 2001, the Company purchased the property that was subject to the lease with Simpson Investment Company for approximately $1.7 million (See Note 9). The Chairman and the President and Chief Executive Officer of the Company, who are directors and significant stockholders of the Company, served as directors and officers of the Simpson PSB Fund (a charitable organization) until October 1997 and were reappointed as directors and officers of the Simpson PSB Fund in January 1999. The Company contributed $75,496 to this organization in 1998. Refer to Note 9 regarding related party transactions involving Company leases.
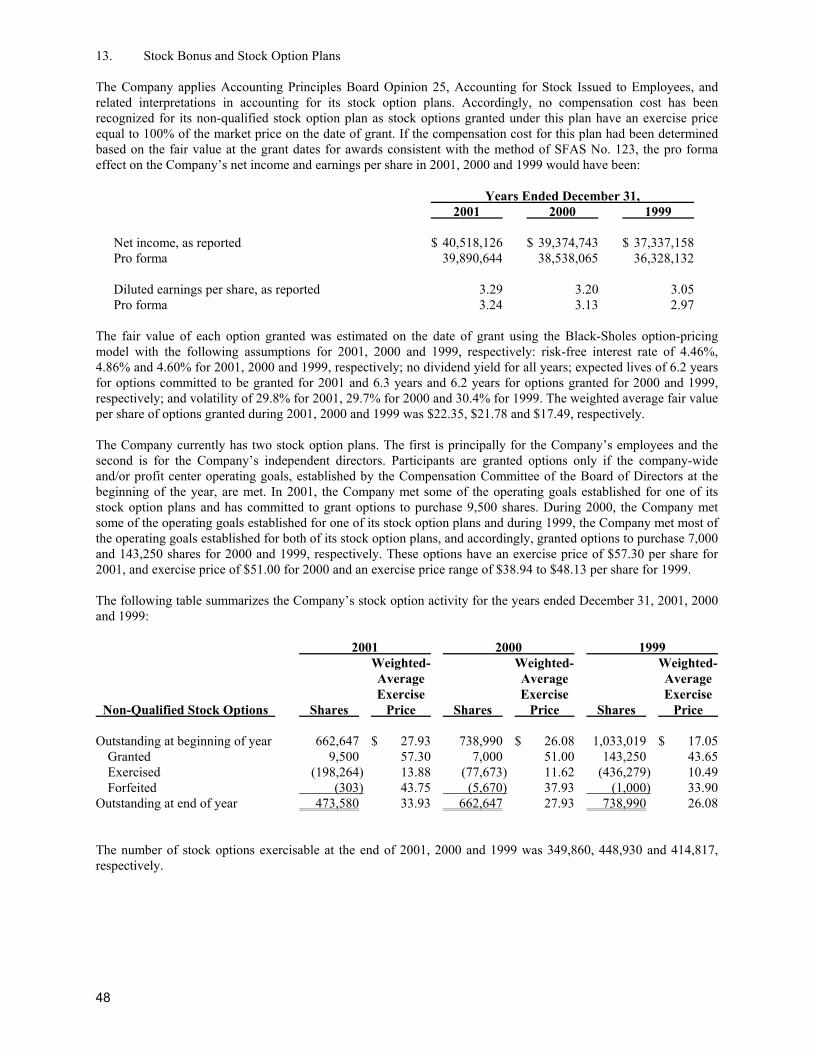
48
13. Stock Bonus and Stock Option Plans The Company applies Accounting Principles Board Opinion 25, Accounting for Stock Issued to Employees, and related interpretations in accounting for its stock option plans. Accordingly, no compensation cost has been recognized for its non-qualified stock option plan as stock options granted under this plan have an exercise price equal to 100% of the market price on the date of grant. If the compensation cost for this plan had been determined based on the fair value at the grant dates for awards consistent with the method of SFAS No. 123, the pro forma effect on the Company’s net income and earnings per share in 2001, 2000 and 1999 would have been:
Years Ended December 31, 2001 2000 1999 Net income, as reported $ 40,518,126 $ 39,374,743 $ 37,337,158 Pro forma 39,890,644 38,538,065 36,328,132 Diluted earnings per share, as reported 3.29 3.20 3.05 Pro forma 3.24 3.13 2.97
The fair value of each option granted was estimated on the date of grant using the Black-Sholes option-pricing model with the following assumptions for 2001, 2000 and 1999, respectively: risk-free interest rate of 4.46%, 4.86% and 4.60% for 2001, 2000 and 1999, respectively; no dividend yield for all years; expected lives of 6.2 years for options committed to be granted for 2001 and 6.3 years and 6.2 years for options granted for 2000 and 1999, respectively; and volatility of 29.8% for 2001, 29.7% for 2000 and 30.4% for 1999. The weighted average fair value per share of options granted during 2001, 2000 and 1999 was $22.35, $21.78 and $17.49, respectively. The Company currently has two stock option plans. The first is principally for the Company’s employees and the second is for the Company’s independent directors. Participants are granted options only if the company-wide and/or profit center operating goals, established by the Compensation Committee of the Board of Directors at the beginning of the year, are met. In 2001, the Company met some of the operating goals established for one of its stock option plans and has committed to grant options to purchase 9,500 shares. During 2000, the Company met some of the operating goals established for one of its stock option plans and during 1999, the Company met most of the operating goals established for both of its stock option plans, and accordingly, granted options to purchase 7,000 and 143,250 shares for 2000 and 1999, respectively. These options have an exercise price of $57.30 per share for 2001, and exercise price of $51.00 for 2000 and an exercise price range of $38.94 to $48.13 per share for 1999. The following table summarizes the Company’s stock option activity for the years ended December 31, 2001, 2000 and 1999: 2001 2000 1999 Weighted- Weighted- Weighted- Average Average Average Exercise Exercise Exercise Non-Qualified Stock Options Shares Price Shares Price Shares Price Outstanding at beginning of year 662,647 $ 27.93 738,990 $ 26.08 1,033,019 $ 17.05 Granted 9,500 57.30 7,000 51.00 143,250 43.65 Exercised (198,264) 13.88 (77,673) 11.62 (436,279) 10.49 Forfeited (303) 43.75 (5,670) 37.93 (1,000) 33.90 Outstanding at end of year 473,580 33.93 662,647 27.93 738,990 26.08 The number of stock options exercisable at the end of 2001, 2000 and 1999 was 349,860, 448,930 and 414,817, respectively.
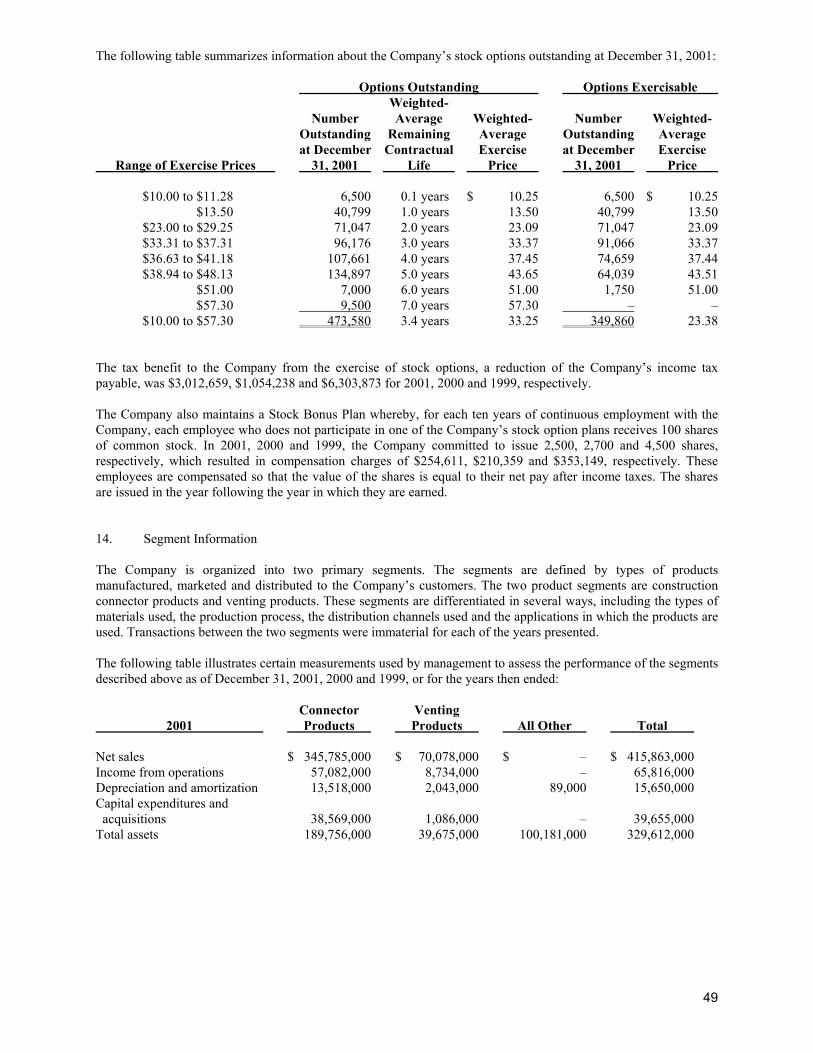
49
The following table summarizes information about the Company’s stock options outstanding at December 31, 2001: Options Outstanding Options Exercisable Weighted- Number Average Weighted- Number Weighted- Outstanding Remaining Average Outstanding Average at December Contractual Exercise at December Exercise Range of Exercise Prices 31, 2001 Life Price 31, 2001 Price $10.00 to $11.28 6,500 0.1 years $ 10.25 6,500 $ 10.25 $13.50 40,799 1.0 years 13.50 40,799 13.50 $23.00 to $29.25 71,047 2.0 years 23.09 71,047 23.09 $33.31 to $37.31 96,176 3.0 years 33.37 91,066 33.37 $36.63 to $41.18 107,661 4.0 years 37.45 74,659 37.44 $38.94 to $48.13 134,897 5.0 years 43.65 64,039 43.51 $51.00 7,000 6.0 years 51.00 1,750 51.00 $57.30 9,500 7.0 years 57.30 – – $10.00 to $57.30 473,580 3.4 years 33.25 349,860 23.38 The tax benefit to the Company from the exercise of stock options, a reduction of the Company’s income tax payable, was $3,012,659, $1,054,238 and $6,303,873 for 2001, 2000 and 1999, respectively. The Company also maintains a Stock Bonus Plan whereby, for each ten years of continuous employment with the Company, each employee who does not participate in one of the Company’s stock option plans receives 100 shares of common stock. In 2001, 2000 and 1999, the Company committed to issue 2,500, 2,700 and 4,500 shares, respectively, which resulted in compensation charges of $254,611, $210,359 and $353,149, respectively. These employees are compensated so that the value of the shares is equal to their net pay after income taxes. The shares are issued in the year following the year in which they are earned. 14. Segment Information The Company is organized into two primary segments. The segments are defined by types of products manufactured, marketed and distributed to the Company’s customers. The two product segments are construction connector products and venting products. These segments are differentiated in several ways, including the types of materials used, the production process, the distribution channels used and the applications in which the products are used. Transactions between the two segments were immaterial for each of the years presented. The following table illustrates certain measurements used by management to assess the performance of the segments described above as of December 31, 2001, 2000 and 1999, or for the years then ended: Connector Venting 2001 Products Products All Other Total Net sales $ 345,785,000 $ 70,078,000 $ – $ 415,863,000 Income from operations 57,082,000 8,734,000 – 65,816,000 Depreciation and amortization 13,518,000 2,043,000 89,000 15,650,000 Capital expenditures and acquisitions 38,569,000 1,086,000 – 39,655,000 Total assets 189,756,000 39,675,000 100,181,000 329,612,000
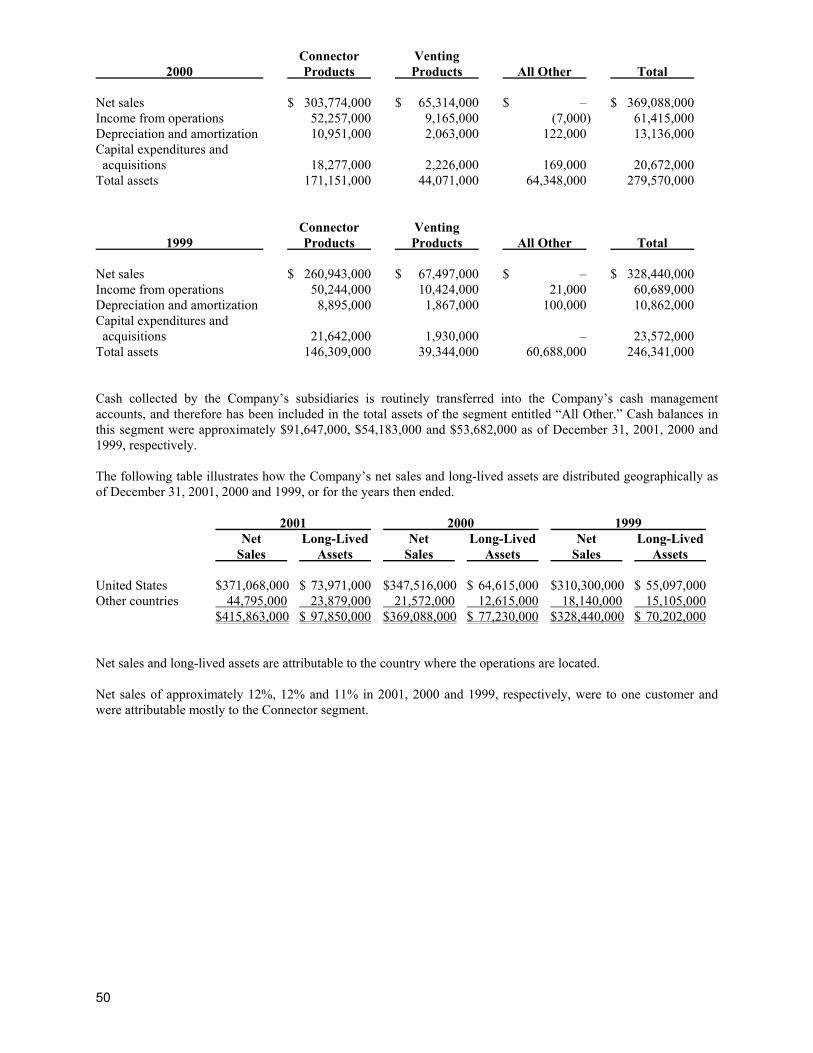
50
Connector Venting 2000 Products Products All Other Total Net sales $ 303,774,000 $ 65,314,000 $ – $ 369,088,000 Income from operations 52,257,000 9,165,000 (7,000) 61,415,000 Depreciation and amortization 10,951,000 2,063,000 122,000 13,136,000 Capital expenditures and acquisitions 18,277,000 2,226,000 169,000 20,672,000 Total assets 171,151,000 44,071,000 64,348,000 279,570,000 Connector Venting 1999 Products Products All Other Total Net sales $ 260,943,000 $ 67,497,000 $ – $ 328,440,000 Income from operations 50,244,000 10,424,000 21,000 60,689,000 Depreciation and amortization 8,895,000 1,867,000 100,000 10,862,000 Capital expenditures and acquisitions 21,642,000 1,930,000 – 23,572,000 Total assets 146,309,000 39,344,000 60,688,000 246,341,000 Cash collected by the Company’s subsidiaries is routinely transferred into the Company’s cash management accounts, and therefore has been included in the total assets of the segment entitled “All Other.” Cash balances in this segment were approximately $91,647,000, $54,183,000 and $53,682,000 as of December 31, 2001, 2000 and 1999, respectively. The following table illustrates how the Company’s net sales and long-lived assets are distributed geographically as of December 31, 2001, 2000 and 1999, or for the years then ended. 2001 2000 1999 Net Long-Lived Net Long-Lived Net Long-Lived Sales Assets Sales Assets Sales Assets United States $371,068,000 $ 73,971,000 $347,516,000 $ 64,615,000 $310,300,000 $ 55,097,000 Other countries 44,795,000 23,879,000 21,572,000 12,615,000 18,140,000 15,105,000 $415,863,000 $ 97,850,000 $369,088,000 $ 77,230,000 $328,440,000 $ 70,202,000 Net sales and long-lived assets are attributable to the country where the operations are located. Net sales of approximately 12%, 12% and 11% in 2001, 2000 and 1999, respectively, were to one customer and were attributable mostly to the Connector segment.
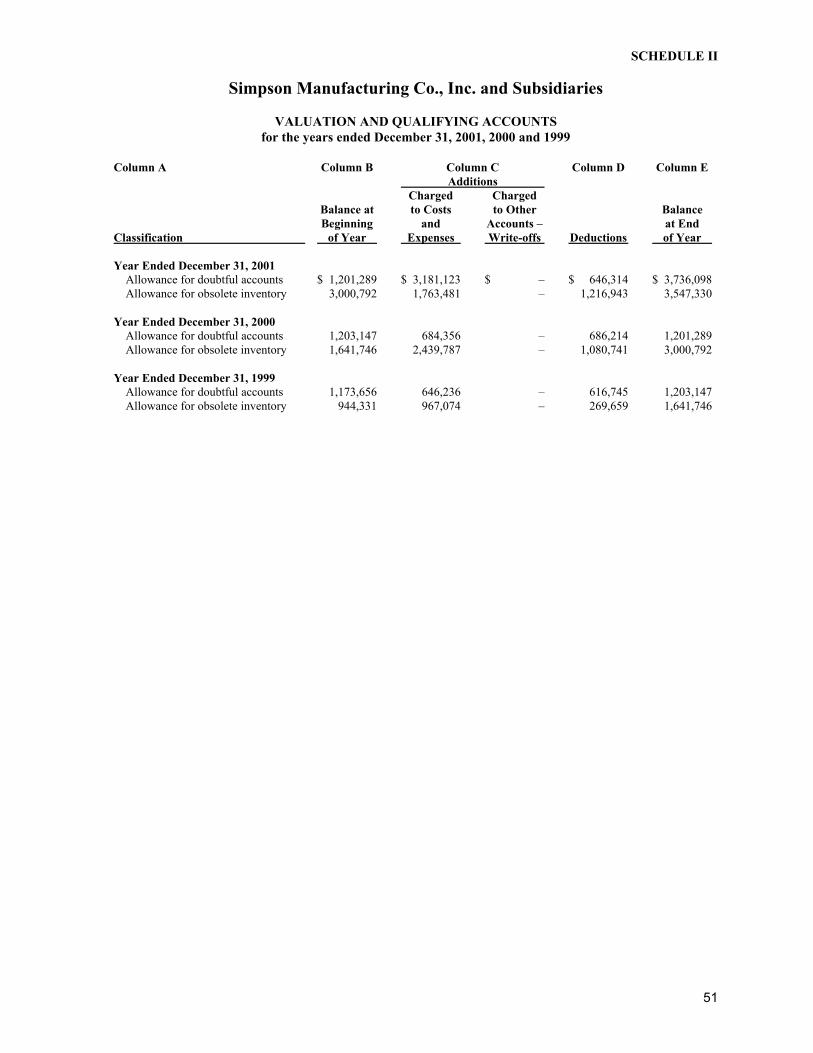
51
SCHEDULE II
Simpson Manufacturing Co., Inc. and Subsidiaries
VALUATION AND QUALIFYING ACCOUNTS for the years ended December 31, 2001, 2000 and 1999
Column A Column B Column C Column D Column E Additions Charged Charged Balance at to Costs to Other Balance Beginning and Accounts – at End Classification of Year Expenses Write-offs Deductions of Year Year Ended December 31, 2001 Allowance for doubtful accounts $ 1,201,289 $ 3,181,123 $ – $ 646,314 $ 3,736,098 Allowance for obsolete inventory 3,000,792 1,763,481 – 1,216,943 3,547,330
Year Ended December 31, 2000 Allowance for doubtful accounts 1,203,147 684,356 – 686,214 1,201,289 Allowance for obsolete inventory 1,641,746 2,439,787 – 1,080,741 3,000,792 Year Ended December 31, 1999 Allowance for doubtful accounts 1,173,656 646,236 – 616,745 1,203,147 Allowance for obsolete inventory 944,331 967,074 – 269,659 1,641,746
52
Item 9. Changes in and Disagreements with Accountants on Accounting and Financial Disclosures. None.
PART III Item 10. Directors and Executive Officers of the Registrant. Information required by this Item will be contained in the Registrant’s proxy statement for the annual meeting of stockholders to be held on May 13, 2002, to be filed not later than 120 days following the end of the Registrant’s fiscal year ended December 31, 2001, which will set forth certain information with respect to the directors and executive officers of the Registrant and is incorporated herein by reference. Item 11. Executive Compensation. Information required by this Item will be contained in the Registrant’s proxy statement for the annual meeting of stockholders to be held on May 13, 2002, to be filed not later than 120 days following the end of the Registrant’s fiscal year ended December 31, 2001, which will set forth certain information with respect to executive compensation of the Registrant and is incorporated herein by reference. Item 12. Security Ownership of Certain Beneficial Owners and Management. Information required by this Item will be contained in the Registrant’s proxy statement for the annual meeting of stockholders to be held on May 13, 2002, to be filed not later than 120 days following the end of the Registrant’s fiscal year ended December 31, 2001, which will set forth certain information with respect to security ownership of certain beneficial owners and management of the Registrant and is incorporated herein by reference. Item 13. Certain Relationships and Related Transactions. Information required by this Item will be contained in the Registrant’s proxy statement for the annual meeting of stockholders to be held on May 13, 2002, to be filed not later than 120 days following the end of the Registrant’s fiscal year ended December 31, 2001, which will set forth certain information with respect to certain relationships and related transactions of the Registrant and is incorporated herein by reference.
PART IV
Item 14. Exhibits, Financial Statement Schedules, and Reports on Form 8-K. a. Exhibits
10.1 Loan Agreement, dated November 6, 2001, between Simpson Manufacturing Co., Inc. and Union Bank of California, N.A.
10.2 Purchase and Sale Agreement, dated February 26, 2001, between Carl D. Panattoni and Simpson Manufacturing Co., Inc.
11. Statement re computation of earnings per share. 21. List of Subsidiaries of the Registrant. 23. Consent of Independent Accountants.
b. Reports on Form 8-K
No reports on Form 8-K were filed during the last quarter of the period for which this report is filed.
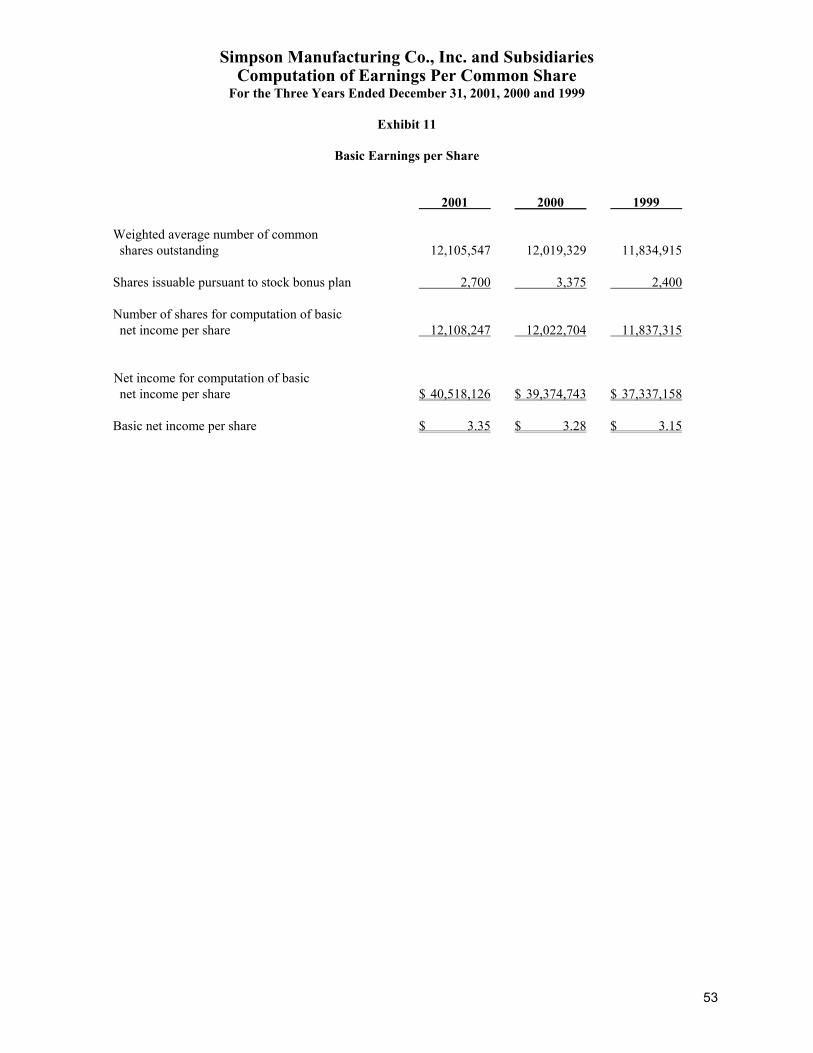
53
Simpson Manufacturing Co., Inc. and Subsidiaries Computation of Earnings Per Common Share
For the Three Years Ended December 31, 2001, 2000 and 1999
Exhibit 11
Basic Earnings per Share
2001 2000 1999 Weighted average number of common shares outstanding 12,105,547 12,019,329 11,834,915 Shares issuable pursuant to stock bonus plan 2,700 3,375 2,400 Number of shares for computation of basic net income per share 12,108,247 12,022,704 11,837,315 Net income for computation of basic net income per share $ 40,518,126 $ 39,374,743 $ 37,337,158 Basic net income per share $ 3.35 $ 3.28 $ 3.15
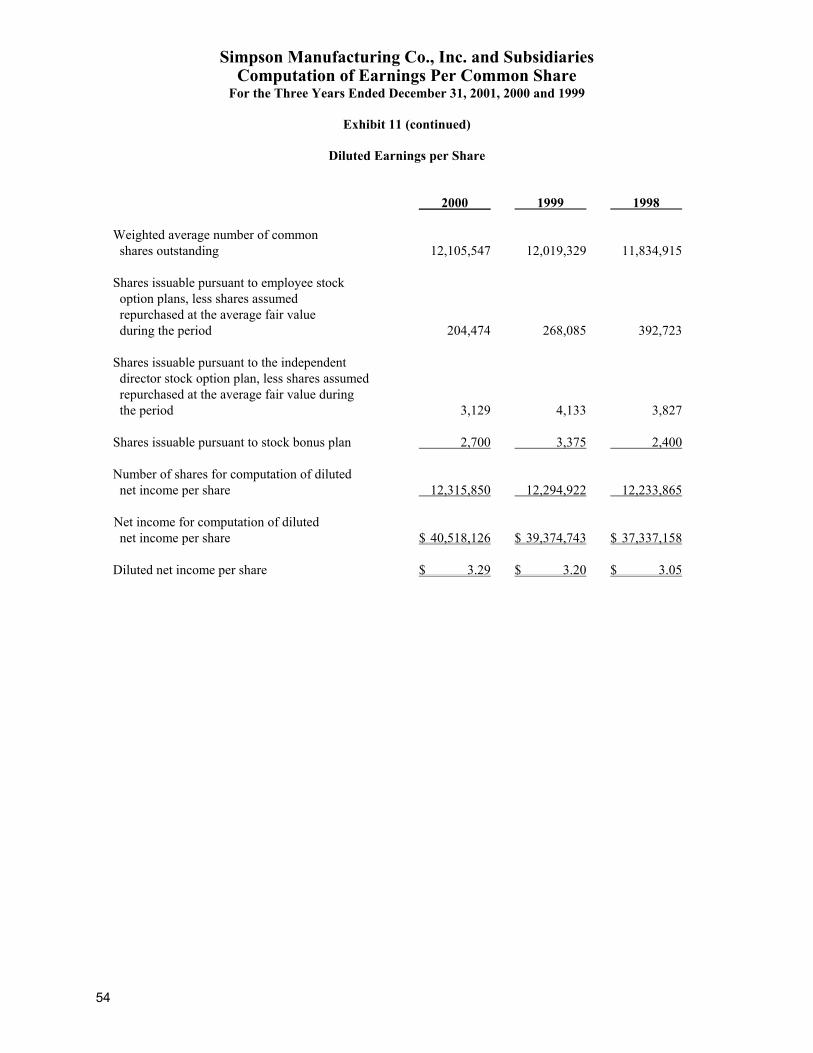
54
Simpson Manufacturing Co., Inc. and Subsidiaries Computation of Earnings Per Common Share
For the Three Years Ended December 31, 2001, 2000 and 1999
Exhibit 11 (continued)
Diluted Earnings per Share
2000 1999 1998 Weighted average number of common shares outstanding 12,105,547 12,019,329 11,834,915 Shares issuable pursuant to employee stock option plans, less shares assumed repurchased at the average fair value during the period 204,474 268,085 392,723 Shares issuable pursuant to the independent director stock option plan, less shares assumed repurchased at the average fair value during the period 3,129 4,133 3,827 Shares issuable pursuant to stock bonus plan 2,700 3,375 2,400 Number of shares for computation of diluted net income per share 12,315,850 12,294,922 12,233,865 Net income for computation of diluted net income per share $ 40,518,126 $ 39,374,743 $ 37,337,158 Diluted net income per share $ 3.29 $ 3.20 $ 3.05
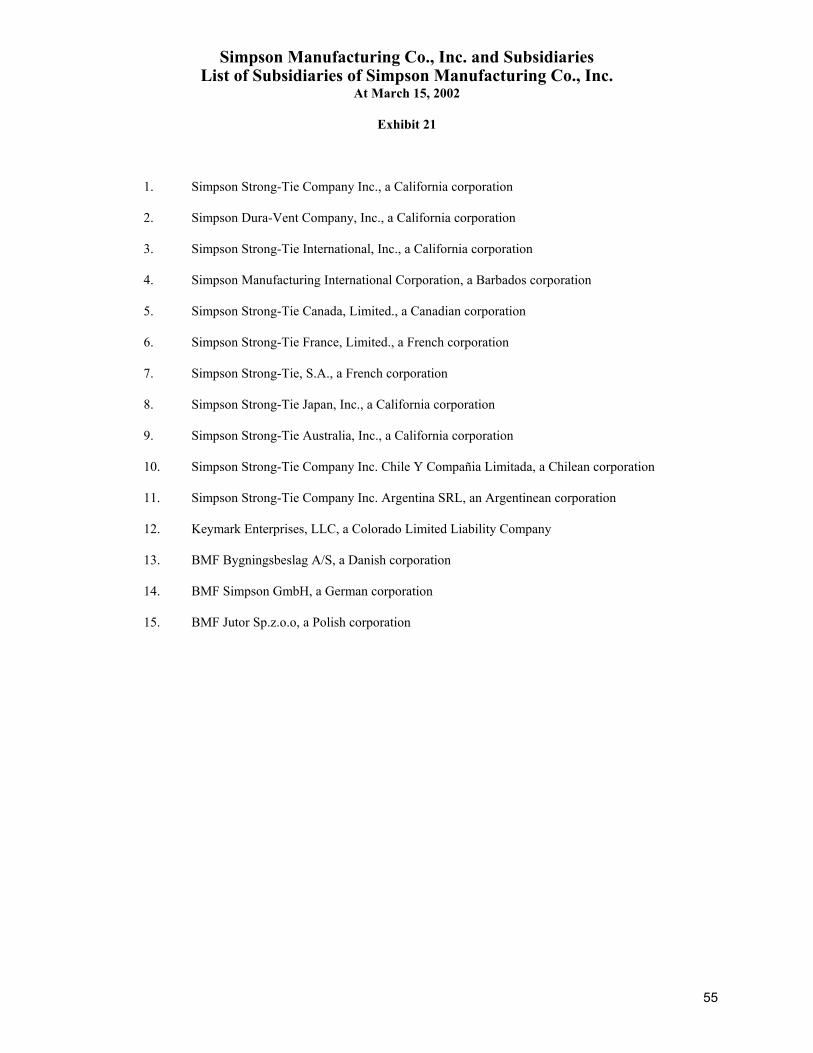
55
Simpson Manufacturing Co., Inc. and Subsidiaries List of Subsidiaries of Simpson Manufacturing Co., Inc.
At March 15, 2002
Exhibit 21
1. Simpson Strong-Tie Company Inc., a California corporation 2. Simpson Dura-Vent Company, Inc., a California corporation 3. Simpson Strong-Tie International, Inc., a California corporation 4. Simpson Manufacturing International Corporation, a Barbados corporation 5. Simpson Strong-Tie Canada, Limited., a Canadian corporation 6. Simpson Strong-Tie France, Limited., a French corporation 7. Simpson Strong-Tie, S.A., a French corporation 8. Simpson Strong-Tie Japan, Inc., a California corporation 9. Simpson Strong-Tie Australia, Inc., a California corporation 10. Simpson Strong-Tie Company Inc. Chile Y Compañia Limitada, a Chilean corporation 11. Simpson Strong-Tie Company Inc. Argentina SRL, an Argentinean corporation 12. Keymark Enterprises, LLC, a Colorado Limited Liability Company 13. BMF Bygningsbeslag A/S, a Danish corporation 14. BMF Simpson GmbH, a German corporation 15. BMF Jutor Sp.z.o.o, a Polish corporation
56
Simpson Manufacturing Co., Inc. and Subsidiaries Consent of Independent Accountants
Exhibit 23
We hereby consent to the incorporation by reference in the Registration Statement on Forms S-8 (File No. 33-85662 and File No. 33-90964) of Simpson Manufacturing Co., Inc. of our report dated February 4, 2002, relating to the financial statements and financial statement schedule, which appears in this Form 10-K. /s/PricewaterhouseCoopers LLP San Francisco, California March 29, 2002
57
SIGNATURES
Pursuant to the requirements Section 13 or 15(d) of the Securities Exchange Act of 1934, the Registrant has duly caused this report to be signed on its behalf by the undersigned, thereunto duly authorized. Dated: March 29, 2002 Simpson Manufacturing Co., Inc. (Registrant) By /s/ Michael J. Herbert Michael J. Herbert Chief Financial Officer and Duly Authorized Officer of the Registrant Pursuant to the requirements of the Securities Exchange Act of 1934, this report has been signed below by the following persons on behalf of the Registrant and in the capacities and on the dates indicated below. Signature Title Date Chief Executive Officer: /s/ Thomas J Fitzmyers President, Chief Executive March 29, 2002 (Thomas J Fitzmyers) Officer and Director Chief Financial Officer: /s/ Michael J. Herbert Chief Financial Officer, March 29, 2002 (Michael J. Herbert) Treasurer and Secretary Directors: /s/ Barclay Simpson Chairman of the Board March 29, 2002 (Barclay Simpson) /s/ Earl F. Cheit Director March 29, 2002 (Earl F. Cheit) /s/ Stephen B. Lamson Director March 29, 2002 (Stephen B. Lamson) /s/ Peter N. Louras Director March 29, 2002 (Peter N. Louras) /s/ Sunne Wright McPeak Director March 29, 2002 (Sunne Wright McPeak) /s/ Barry Lawson Williams Director March 29, 2002 (Barry Lawson Williams)
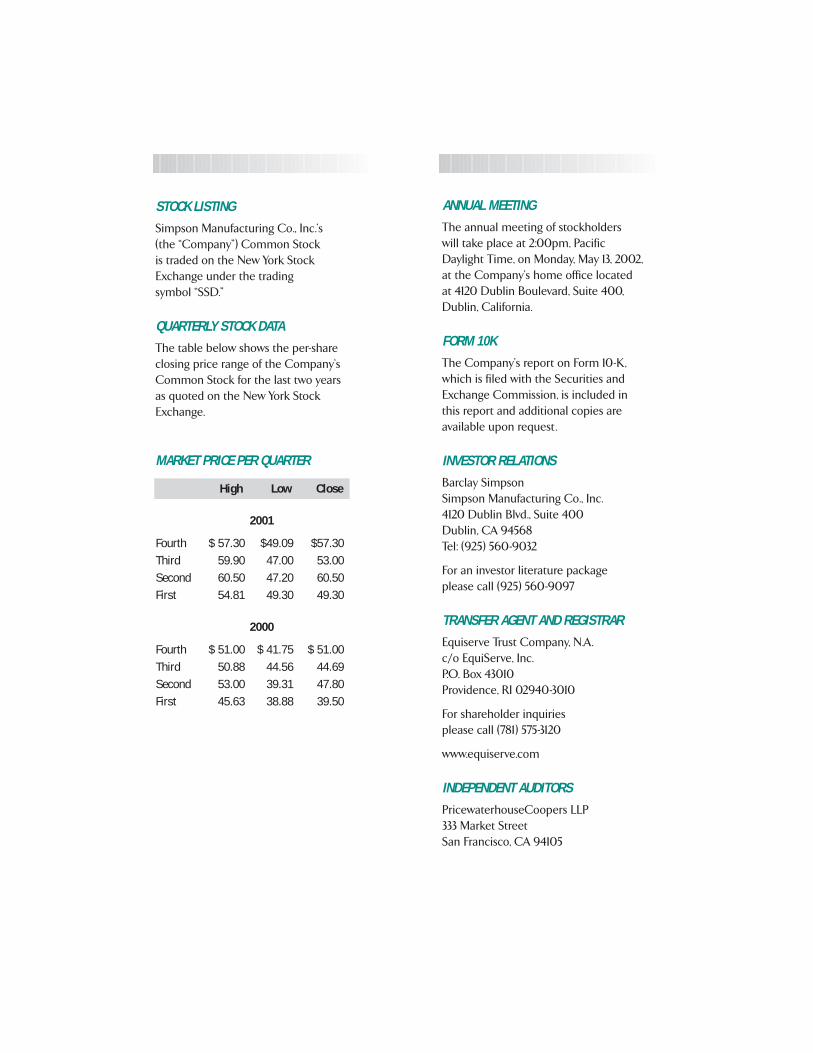
ANNUAL MEETINGThe annual meeting of stockholders
will take place at 2:00pm, Pacific
Daylight Time, on Monday, May 13, 2002,
at the Company’s home office located
at 4120 Dublin Boulevard, Suite 400,
Dublin, California.
FORM 10KThe Company’s report on Form 10-K,
which is filed with the Securities and
Exchange Commission, is included in
this report and additional copies are
available upon request.
INVESTOR RELATIONSBarclay Simpson
Simpson Manufacturing Co., Inc.
4120 Dublin Blvd., Suite 400
Dublin, CA 94568
Tel: (925) 560-9032
For an investor literature package
please call (925) 560-9097
TRANSFER AGENT AND REGISTRAREquiserve Trust Company, N.A.
c/o EquiServe, Inc.
P.O. Box 43010
Providence, RI 02940-3010
For shareholder inquiries
please call (781) 575-3120
www.equiserve.com
INDEPENDENT AUDITORSPricewaterhouseCoopers LLP
333 Market Street
San Francisco, CA 94105
STOCK LISTINGSimpson Manufacturing Co., Inc.’s
(the “Company”) Common Stock
is traded on the New York Stock
Exchange under the trading
symbol “SSD.”
QUARTERLY STOCK DATAThe table below shows the per-share
closing price range of the Company’s
Common Stock for the last two years
as quoted on the New York Stock
Exchange.
MARKET PRICE PER QUARTER
High Low Close
2001
Fourth $ 57.30 $49.09 $57.30Third 59.90 47.00 53.00Second 60.50 47.20 60.50First 54.81 49.30 49.30
2000
Fourth $ 51.00 $ 41.75 $ 51.00Third 50.88 44.56 44.69Second 53.00 39.31 47.80First 45.63 38.88 39.50
SIMPSON M
ANUFACTURING CO., INC. 20
01 A
NN
UA
L R
EP
OR
T
SIMPSON MANUFACTURING CO., INC.4120 Dublin Boulevard, Suite 400, Dublin, California 94568
Tel: (925) 560-9000 Fax: (925) 833-1496
www.simpsonmfg.com
1317-AR-02
OUR QUALITY POLICY
We help people build safer structures
economically. We do this by designing,
engineering and manufacturing “No Equal”
structural connectors and other related
products that meet or exceed our
customers’ needs and expectations.
Everyone is responsible for product
quality and is committed to ensuring
the effectiveness of the quality
management system.
R
THERE IS NO EQUAL


![CB Richard Ellis [Read-Only] - NEWMOA• Certified by the USGBC’s ... RESULTS One Boston Place will achieve a projected $213,000 annual savings with an investment payback period](https://img.pdfslide.us/doc/110x75/5fae013911d8d11b7d2af9fa/cb-richard-ellis-read-only-a-certified-by-the-usgbcas-results-one-boston.jpg)