Embed Size (px)
Citation preview
11
2. Sustainable fuelwood production in Brazil Luiz Augusto Horta Nogueira, Universidade Federal de Itajubá; Suani Teixeira Coelho, CENBIO & Alexandre Uhlig, Instituto Acende Brasil
INTRODUCTIONSince colonial times, wood has played an important role as energy source in Brazil. Even with industrialization and introduction of fossil fuels, fuelwood from native and planted forests remains a relevant source of heat in Brazilian industries and households, representing about 13% of total energy demand. Wood is abundant and an important resource in the economy of Brazil. The Brazilian native forests cover about 416 million hectares and accounts for 31.1% of world total woodlands. On the other hand, the afforested area is estimated to be 4.1 million hectares and the ranks fifth in the world. The afforested area is known to increase approximately 250 thousand hectares per year. Forestry is conducive to Brazil due to the following factors: (1) Favorable climate; (2) large agricultural land, and; (3) Presence of good forestry technology. In fact, 4.5% (or US$ 28 billion) of GDP comes from forestry. Despite all these, forest resources are at present becoming scarce.
At present, there seems to be a decline in forest resource production. For instance, in 1990, round wood production recorded 308.2 million cubic meters whereby 26.8% of it was contributed by planted forests. However, in 2004, production decreased to only 218.2 million cubic meters, with 62.6% coming from planted forests. The trend over the past 15 years showed that total round wood production and production from native forest has markedly declined at annual rates of 2.36% and 7.27% respectively. According to Bacha et al., (2006), even with a growth rate of 3.39%, planted forests will not be able to cope with wood demand for industrial and energy needs. Apparently, there may be a current difficulty to supply wood demand in Brazil as shown by the following indicators: (1) Reduced wood production for export; (2) Higher prices, and; (3) Government’s urgent need to promote reforestation.
The supply and demand imbalances is becoming acute and has resulted in heightened environmental concerns and doubts about the sustainability of intensive use of biofuels. In some areas fuelwood use contribute to high rates of deforestation e.g. industrial use of fuelwood from native forests. Forestation activities on the other hand, have decreased over the last few years thereby reducing wood availability for industry and energy. Related to energy, there are situations that deserve urgent attention to reduce the depletion of natural forest resources. For example, the pressures on savannah cover, caatinga, in the Northeast Region, to supply fuelwood to gypsum kilns, or the growing difficulty for the pig iron industry to obtain charcoal. According to IBGE, 2006, the commercial fuelwood sales in Brazil amounted to 81.0 million cubic meters in 2005 and generated USD 1.3 billion* in annual sales. These are fuelwood from both native forests and forestry plantation.
There is no official estimate of the actual number of jobs provided by fuelwood production. Developing an estimate of the actual number of jobs requires some assumptions about how much the average of fuelwood produced per worker is. This is done using the data from pulp and paper sector, where on the average, workers produced 1 100 stereo cubic meters of fuelwood per capita per year (BRACELPA, 2007). For fuelwood from native forest, the productivity is about half compared to
* The exchange rate in 12 January 2007 was BRL 2.14 to a US dollar.

12
those in forestry plantation e.g. 550 stereo cubic meters of fuelwood per worker per year. Thus, fuelwood production provides employment to approximately 115 thousand people in Brazil in 2005.
Following this introduction, a brief review of demand and supply of fuelwood is presented. These are obtained from official sources. Although there are many indications of inconsistencies in fuelwood data even in the National Energy Balance, it is worthwhile to recognize that efforts have been done towards improving this information. The current methodology for fuelwood demand evaluation and the improvements in the study are shown. Finally, a set of policy guidelines are recommended in order to increase fuelwood availability in the context of sound environmental management conditions.
FUELWOOD SUPPLY AND DEMAND Energy use has been growing rapidly in Brazil. Total energy consumption nearly doubled between 1975 and 2000. Energy consumption per capita increased by 60% and energy consumption per unit of Gross Domestic Product (GDP) increased by 22% (GELLER et al., 2004). Rapid industrialization, high growth in some energy-intensive industries i.e. aluminium and steel production, and the increasing residential and commercial energy services are among the main causes of increased energy use and energy intensity (TOLMASQUIM et al.,1998). Total primary energy supply (TPES) grew in average around 2.5% per year in the last 20 years. This number is slightly higher than the annual economic growth rate of 2.1% during this period.
Energy policy in Brazil in the last three decades attempted to reduce the country’s dependence on foreign energy supplies and stimulate the development of domestic energy sources, mainly from hydrocarbons. Also during this period natural gas and hydroelectricity production increased steadily over time; oil consumption decreased in the first half of the 1980s, but since the oil counter shock in 1986, it has been recovering its market share. The demand for coal increased due to the metallurgical sector. Biomass consumption increased in the transport and industrial sectors.Biomass for transport is very important in Brazil due to ethanol from sugar cane, which production corresponds to approximately 300 thousands barrels of oil equivalent per day, but it is out of scope of the current study. Biomass use in the residential sector decreased due to fuelwood substitution. In the next paragraphs the current status of the fuelwood use and an analysis of the sustainability of the supply are presented.
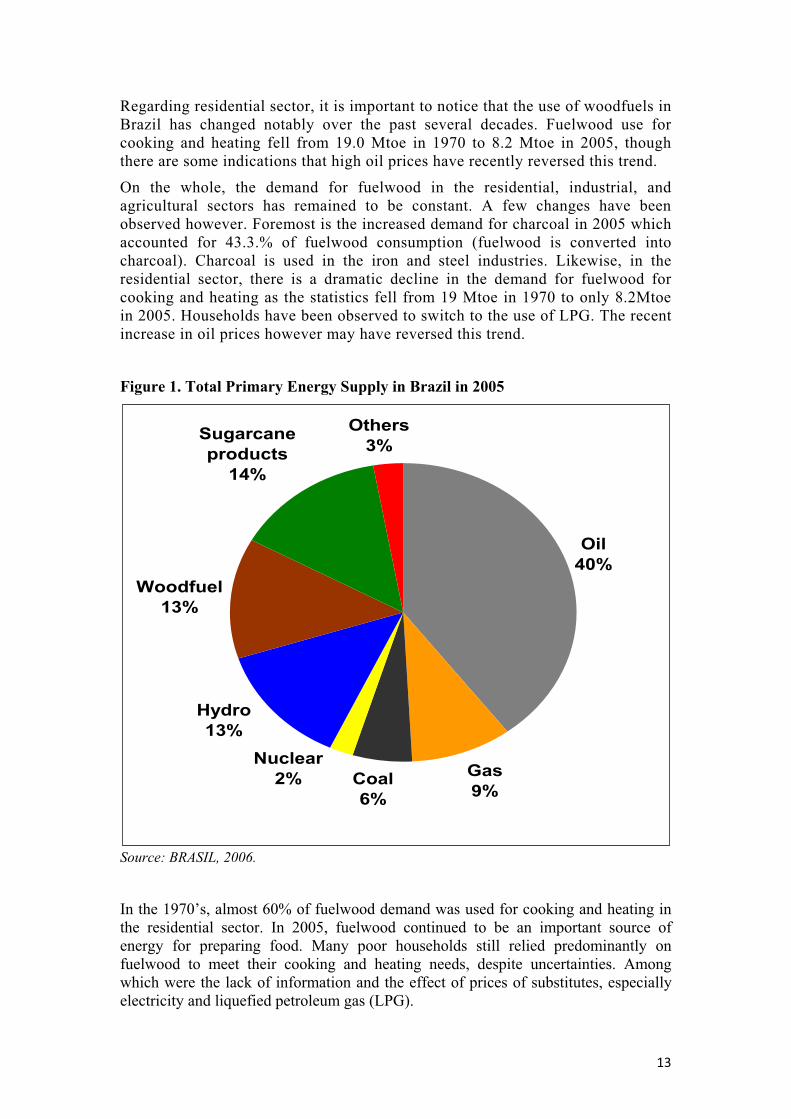
According to the Ministry of Mines and Energy, 13% or 28.4Mtoe (2005) of TPES is provided by woodfuels (Brasil, 2006). This is almost at the same level with the rate supplied by hydropower generation. Despite the importance of woodfuels in the energy mix, the demand for woodfuels steadily decreased from 1970 to 2000. In 2004 however, the trend reversed as woodfuel demand rose to the level similar to that during the 1980’s (see Figure 2).
In the last ten years, the fuelwood demand has remained almost constant in residential, industry and agriculture sectors. The changes in fuelwood consumption happened basically in the transformation sector, where fuelwood is converted into charcoal. This product is directly related with iron and steel industry and represented 43.3% of total fuelwood consumption, in 2005. Due to its relevance, charcoal issues will be analyzed in more detail in a separated paper.
13
Oil40%
Gas9%
Coal6%
Nuclear2%
Hydro13%
Woodfuel13%
Sugarcane products
14%
Others3%
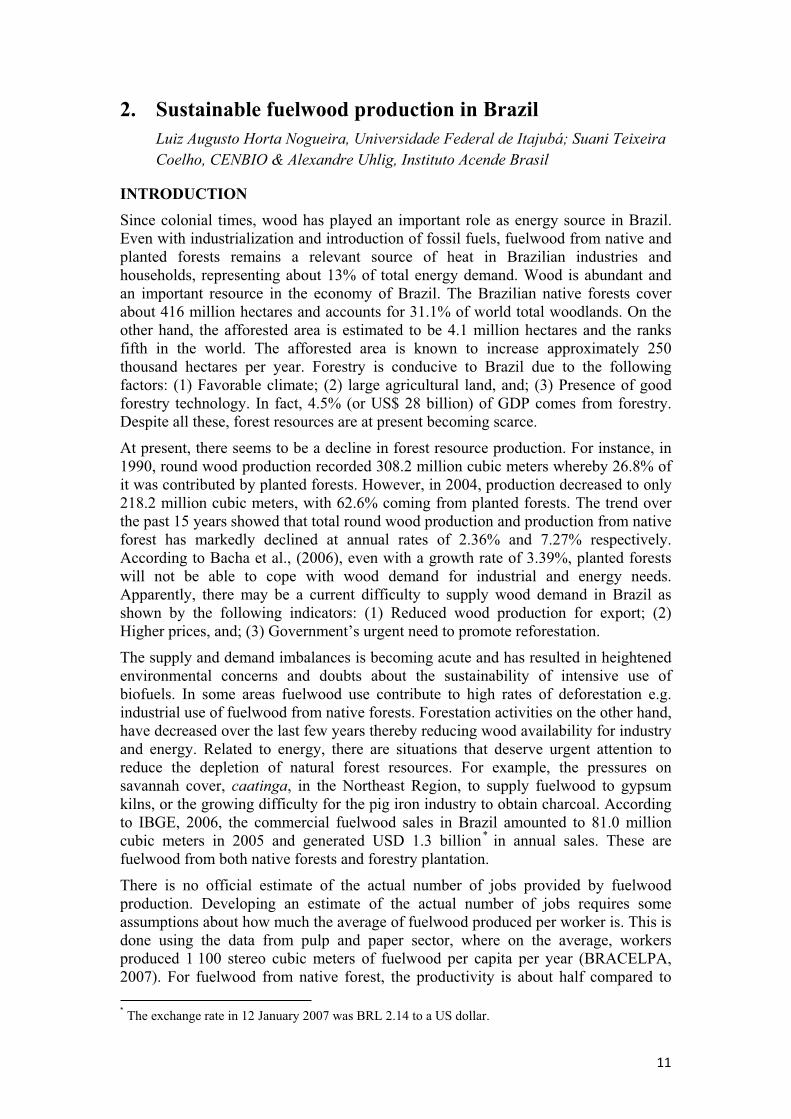
Regarding residential sector, it is important to notice that the use of woodfuels in Brazil has changed notably over the past several decades. Fuelwood use for cooking and heating fell from 19.0 Mtoe in 1970 to 8.2 Mtoe in 2005, though there are some indications that high oil prices have recently reversed this trend.
On the whole, the demand for fuelwood in the residential, industrial, and agricultural sectors has remained to be constant. A few changes have been observed however. Foremost is the increased demand for charcoal in 2005 which accounted for 43.3.% of fuelwood consumption (fuelwood is converted into charcoal). Charcoal is used in the iron and steel industries. Likewise, in the residential sector, there is a dramatic decline in the demand for fuelwood for cooking and heating as the statistics fell from 19 Mtoe in 1970 to only 8.2Mtoe in 2005. Households have been observed to switch to the use of LPG. The recent increase in oil prices however may have reversed this trend.
Figure 1. Total Primary Energy Supply in Brazil in 2005
Source: BRASIL, 2006.
In the 1970’s, almost 60% of fuelwood demand was used for cooking and heating in the residential sector. In 2005, fuelwood continued to be an important source of energy for preparing food. Many poor households still relied predominantly on fuelwood to meet their cooking and heating needs, despite uncertainties. Among which were the lack of information and the effect of prices of substitutes, especially electricity and liquefied petroleum gas (LPG).
14
0
20.000
40.000
60.000
80.000
100.000
120.000
1970 1972 1974 1976 1978 1980 1982 1984 1986 1988 1990 1992 1994 1996 1998 2000 2002 2004
103 t
Transformation Residential Agriculture Industry Total
Figure 2. Fuelwood consumption in Brazil by sector
Source: BRASIL, 2005.
The Brazilian experience with LPG
In Brazil, 98% of households, including 93% of rural households, have access to liquefied petroleum gas LPG, a situation that can be mainly attributed to government policy that has promoted the development of an LPG delivery infrastructure in all regions, including rural zones and subsidies to LPG users (LUCON et al., 2004; JANNUZZI; SANGA, 2004). Until the late 1990’s, the rise in LPG use was accompanied by a sharp decline in residential wood consumption (Figure 2).
During the period 1973-2001, retail LPG prices were set at the same level in all regions and the average level of the subsidy amounted to 18% of the retail price. In May 2001, end user prices were liberalized, as part of a process of deregulating the petroleum sector. At the same time, the government introduced an Auxílio-Gas (“gas assistance”) programme to enable qualifying low-income households to purchase LPG. Qualifying families were those with incomes less than half the minimum wage (an average daily per-capita income of $0.34 a day in 2003).
The total programme cost in 2002 was about half that of price subsidization. This program now forms part of the Bolsa Familia, by far the largest conditional cash transfer program in the developing world (Managing for Development Results, 2006). Recent LPG price increases, however, appear to have led to a reversal of the trend towards lower residential biomass consumption (Figure 2).

15
The energy required for cooking represents an important cost for low income people. According to the last official survey on household expenses (IBGE, 2006a), for the lower income group or families receiving up to two minimum wages monthly (14% of Brazilian population), the energy required to prepare food means USD 6.77 every month, approximately the same amount of money used for medicines.
Most woodfuel information comes from the Ministry of Mines and Energy (Brasil, 2006). Despite this limitation, a recent trend has been noticed. There is now a rise in fuelwood consumption per capita as many poor households switched back to its use due to price increases in LPG. In fact, some poor communities in Brazil are now returning to use their old, forgotten inefficient wood stoves.
According to IEA (2006), household fuelwood use in Brazil accounts for 3.7% of TPE. In the rural areas, approximately 13% of the population or 23 million people rely on fuelwood. It is also possible that these figures are in fact lower inasmuch as there are other considerations: Stove efficiency, population, cooking practices, among others. Table 1 reflects multiple fuel use among many of the households.
The exclusive fuelwood consumers are concentrated in the poorest region of the country: the Brazilian semi-arid region, north of Minas Gerais State, interior of the States of Bahia, Pernambuco, Ceará, Piauí and Maranhão (Figure 3).
Table 1. Household consumption by fuel and situation in Brazil in 2003
Fuel Urban Rural Total
Only LPG 31,916,473 2,480,533 34,397,006
LPG and fuelwood 3,007,274 4,096,489 7,103,763
Only fuelwood 462,382 1,312,046 1,774,428
LPG and charcoal 4,248,244 874,777 5,123,021
Fuelwood and charcoal
89,244 270,041 359,285
Only charcoal 323,916 311,889 635,805
LPG, fuelwood and charcoal
387,338 442,242 829,580
Total 40,434,871 9,788,017 50,222,888
Source: IBGE, 2004d

16
Figure 3. Distribution of exclusive fuelwood user in residential sector at municipal district level in Brazil, 1991
Source: Prepared by UHLIG, A. from IBGE, 2004c.
The scenario however changes when one considers the distribution of households using multiple fuels e.g. fuelwood and LPG. The pattern changes as it now appears that the whole country uses fuelwood (supplemented with other fuels i.e. LPG). Only the more developed states of Sao Paulo, Rio de Janeiro and Distrito Federal do not show fuelwood consumption (Figure 4). Likewise, fuelwood consumption is not significant in the Maranhao State due to a greater reliance on charcoal as this is largely available among pig iron producing areas in this region.
Due to the spatial distribution of industries, there is not much information about fuelwood consumption in the industrial and agricultural sectors. These are areas where detailed studies in fuelwood are much needed as compare to the residential sector where some data already exists. One can only surmise that the fuelwood consumption exists in nearby areas where fuelwood is produced or originates. The Brazilian Pulp and Paper Association (Bracelpa, 2007) for instance, denotes the presence of wood transported within 500 km radius.

17
Figure 4. Distribution of fuelwood and LPG and fuelwood user in residential sector at municipal district level in Brazil, 1991
Source: Prepared by UHLIG, A. from IBGE, 2004c.
It is a fact however that fuelwood has many uses in the agricultural sector: Drying agricultural products, preparation and production of animal meals, and in the ancillary agro-industries such as cassava flour manufacturing, sugar cane processing, pottery making, and lime kiln preparations, among others. Official figures do recognize that 7 million tons of fuelwood was used by the agricultural sector in 2004 (Brasil, 2006). These numbers correspond to 10% of total fuelwood consumption.
Fuelwood in Brazil is obtained from native forests and forestry plantations. Regardless of end use, fuelwood consumption in 2004 came from native forests (IBGE, 2005b). Fuelwood production from native forests is spread throughout the country but is more pronounced and intensive in Acre (AC) and Pará (PA) in the North Region; Bahia (BA) and Ceará (CE) in the Northeast Region; Mato Grosso (MT) in Center-West Region and Paraná (PR) and Santa Catarina in the South Region (Figure 5).

18
Figure 5. Fuelwood production from native forest municipal district level, 1991
Source: Prepared by UHLIG, A. from IBGE, 2004a.
On the other hand, fuelwood production from forestry plantation is concentrated in South and Southeast Region (Figure 6), where industry activity is concentrated. In the industrial sector, fuelwood demand represents 2.6% of TPES and 20% of the total fuelwood consumption. Food (6.4%), ceramic (6.0%) and paper pulp (4.1%) industries are the most important fuelwood consumers. Food and ceramic industries are spread over the country, with plants of diversified capacity; the pulp and paper industry is however is more “homogeneous.”
The pulp and paper industry helps to explain the concentration of the fuelwood production from forestry activities. Brazil manufactures pulp and paper exclusively from planted forests of eucalyptus and pine. The distribution of the volume of wood consumed to produce pulp, paper and fuel in each of the Brazilian States confirm this (Figures 6 & 7). It should be observed that just five states (São

19
Paulo, Espírito Santo, Bahia, Paraná and Minas Gerais States) are responsible for most of Brazilian wood demand in this industry. According to Bracelpa, 2007, the pulp and paper sector consumed 45.2 millions of cubic meters of wood by-products for the production of pulp and paper; 4.5 millions of cubic meters of wood wastes for the complementation of energy. In the overall process, wood residues and black liquor are also produced.
Figure 6. Fuelwood production from planted forest at municipal district level, 1991
Source: Prepared by UHLIG, A. from IBGE, 2004b.

20
0
2.000
4.000
6.000
8.000
10.000
12.000
14.000
16.000
18.000
20.000
AP BA ES MG PA PR RS SC SP
103 m
3 w/b
Figure 7. Volume of wood consumed to produce pulp, paper and fuel per State in Brazil, 2005 (w/b – with bark)
Source: BRACELPA, 2007
Wood as energy in pulp and paper industry
In most Brazilian plants the cellulosic pulp is manufactured from eucalyptus wood but in some cases also from pinus. The pulping process consists of the transformation of wood in fibrous material, called paste, pulp or cellulose. The wood logs are received with bark and are processed in rotating debarking drums, generating barks as residues, which are used on steam and energy generation to the process. Rinds constitute from 12 to 18% in residues weight on the process and supply 10% of the necessary energy.
From debarking drums, the logs are led to the chippers and transformed into chips. These chips go to the digesters, where the lignin between the fibre and the wood is separated. The liberated fibres form the cellulose and the by-product of the digestion process, black liquor, which constitutes an important source of energy for the cellulose industry, supplying even 85% from the energy demand of the cellulose plants (ARACRUZ, 2007). It has lower heating value of 2 860 kcal/kg and is produced, typically, from 2.5 to 2.8 tons per tons of cellulose (NOGUEIRA; LORA, 2003). Using cogeneration systems with extraction-condensing steam turbines and live steam at pressures above 60 bars, the Brazilian pulp and paper industry basically generates all thermal and electrical energy consumed in process. The total installed capacity is 1 028 MW (BRASIL, 2006). Recent decisions towards promoting independent power production have stimulated the expansion of such systems.
21
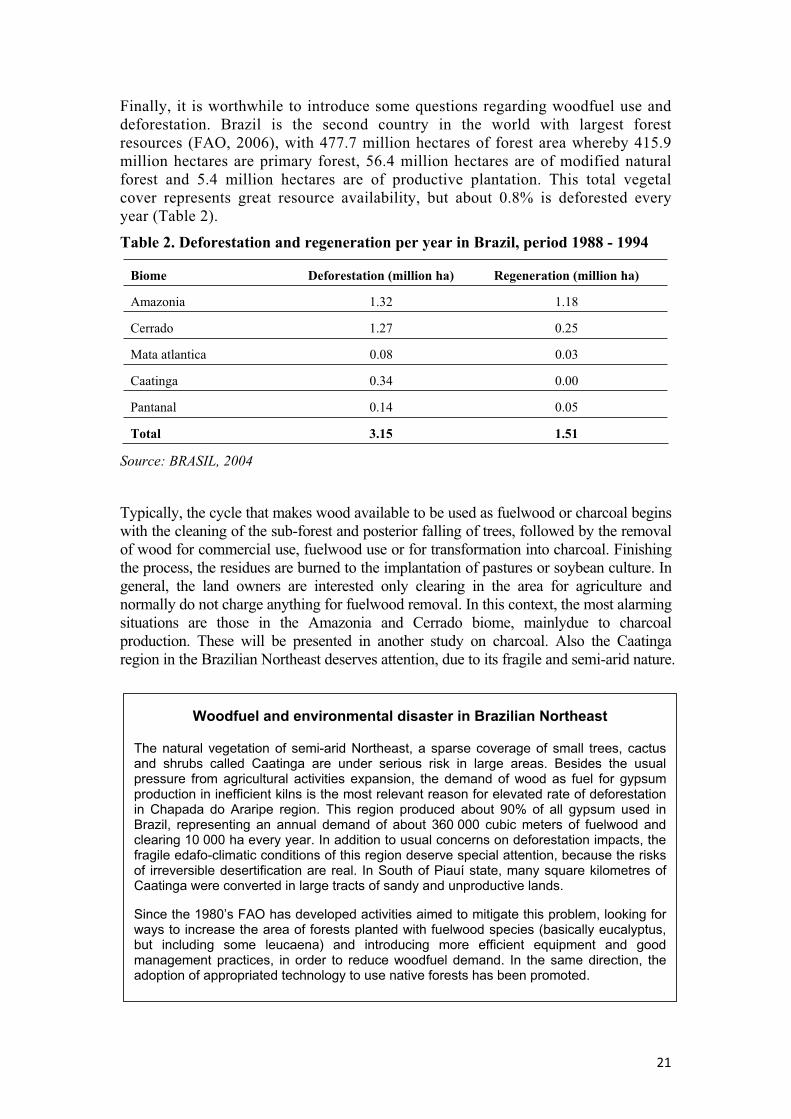
Finally, it is worthwhile to introduce some questions regarding woodfuel use and deforestation. Brazil is the second country in the world with largest forest resources (FAO, 2006), with 477.7 million hectares of forest area whereby 415.9 million hectares are primary forest, 56.4 million hectares are of modified natural forest and 5.4 million hectares are of productive plantation. This total vegetal cover represents great resource availability, but about 0.8% is deforested every year (Table 2).
Table 2. Deforestation and regeneration per year in Brazil, period 1988 - 1994
Biome Deforestation (million ha) Regeneration (million ha)
Amazonia 1.32 1.18
Cerrado 1.27 0.25
Mata atlantica 0.08 0.03
Caatinga 0.34 0.00
Pantanal 0.14 0.05
Total 3.15 1.51
Source: BRASIL, 2004
Typically, the cycle that makes wood available to be used as fuelwood or charcoal begins with the cleaning of the sub-forest and posterior falling of trees, followed by the removal of wood for commercial use, fuelwood use or for transformation into charcoal. Finishing the process, the residues are burned to the implantation of pastures or soybean culture. In general, the land owners are interested only clearing in the area for agriculture and normally do not charge anything for fuelwood removal. In this context, the most alarming situations are those in the Amazonia and Cerrado biome, mainlydue to charcoal production. These will be presented in another study on charcoal. Also the Caatinga region in the Brazilian Northeast deserves attention, due to its fragile and semi-arid nature.
Woodfuel and environmental disaster in Brazilian Northeast
The natural vegetation of semi-arid Northeast, a sparse coverage of small trees, cactus and shrubs called Caatinga are under serious risk in large areas. Besides the usual pressure from agricultural activities expansion, the demand of wood as fuel for gypsum production in inefficient kilns is the most relevant reason for elevated rate of deforestation in Chapada do Araripe region. This region produced about 90% of all gypsum used in Brazil, representing an annual demand of about 360 000 cubic meters of fuelwood and clearing 10 000 ha every year. In addition to usual concerns on deforestation impacts, the fragile edafo-climatic conditions of this region deserve special attention, because the risks of irreversible desertification are real. In South of Piauí state, many square kilometres of Caatinga were converted in large tracts of sandy and unproductive lands.
Since the 1980’s FAO has developed activities aimed to mitigate this problem, looking for ways to increase the area of forests planted with fuelwood species (basically eucalyptus, but including some leucaena) and introducing more efficient equipment and good management practices, in order to reduce woodfuel demand. In the same direction, the adoption of appropriated technology to use native forests has been promoted.

22
METHODOLOGICAL ISSUES Some fundamentals The current era is faced with several energy related challenges: Rapid and great expansion of energy demand, complexity and diversity of modern energy systems, and the environmental of energy production and use. There is therefore now a need for a comprehensive evaluation of the feasibility of energy systems in terms of two key concepts: sustainability and renewability. These two concepts should be applied particularly in wood energy and woodfuel systems.
According to the First Law of Thermodynamics energy can not be destroyed, yet effective energy sources can irreversibly be exhausted, thus converting useful energy into useless low temperature heat. For fossil fuels this concept is evident and the value of oil or natural gas reserve defines the remaining available energy. Using this principle on “depletion of energy reserves,” it is then possible to define renewability. Such that an energy source is renewable when its reserves are permanent (at least for foreseeable future) or can be refilled in accordance to use. Thus, observing that energy renewability is related to the type of energy source, in principle and in appropriated conditions, woodfuels, e.g. fuelwood or charcoal, are renewable sources of energy since they are able to regenerate permanently. Under a more rigid concept for any biofuel, renewability may result to zero emission of CO2, but is impossible to achieve because in agro- industrial processing some amounts of conventional fossil fuels are always used (BERC, 2004). Nevertheless, net emission of CO2 is a good indicator of the renewability for woodfuels sources.
The Brundtland Commission has defined sustainability as the ability of the present generation to meet current needs without reducing future opportunities within the purview of social, environmental and economic frameworks. To examine and understand the idea of effects and implications of energy systems vis-à-vis the concept of sustainable development is not a simple task. One needs to consider several factors. For one, sources and origins of energy production, processing, transportation, and consumption patterns have to be accounted for. On the other hand, sustainable development requires sound, stable, productive development which does not deplete natural resources and is economically feasible and socially acceptable.
The criteria used in the Santiago Declaration 1995 could serve as a model for wood energy systems sustainability goals. The Declaration consists of basic/ general biodiversity objectives, maintenance of productive capacity, soil and water conservation, among others. The entire document is divided into 67 parameters meant to quantify sustainability and eventually leading to the certification of forest products (USDA, 1996). The country of Brazil should consider this model as a good example.
Sustainability is a broad subject particularly when it involves ecosystems and energy flows. Perhaps a definition for sustainability more appropriate in bioenergy systems is "the amount of consumption that can be continued indefinitely without degrading capital stocks - including natural capital stocks" (Goodland et al., 1992). In this definition, it is feasible to evaluate soil fertility preservation or degradation and water resources maintenance in order to obtain sustainability of wood energy systems. All these studies impose long-term analysis, and a relevant quote to all these is from an Indian old proverb: “a forest well managed can supply seven generations” (IEA/Task 29, 2005).

23
While the sustainability of bioenergy systems is a formidable question to bear, suffice it to say that it is worthwhile to identify what factors cause the “non-sustainability” of these systems. One important starting point is the supply and demand balance for woodfuels as a valuable indicator of sustainability. If the supply of woodfuels is greater than its demand for a long-term, it is an assurance for “sustainability.” In this case, the social, economic, and environmental aspects need to be factored in so as to complete the evaluation of sustainability.
Woodfuel data in Brazil: a critical reviewNo regular exhaustive statistics is kept about the production of fuelwood in Brazil. It is also very difficult to estimate stocks of fuelwood built up by retailers and individual consumers. Therefore the conventional assumption is that production of fuelwood is equal to consumption. Another assumption is that variation in stock and the import-export balance are negligible. The official data of wood demand for energy is estimated based on methodologies established about 30 years ago and may no longer be relevant to present day reality. New procedures for woodfuel demand estimation are being discussed to improve future data quality.It is therefore important to manage Brazil’s woodfuel statistics as professionally and scientifically as possible.
For the residential sector, the National Energy Balance uses the correlation with LPG. This considers the sum of useful energy necessary for cooking family food and it is based on the IBGE statistics. The statistics revolves around about the number of stoves by kind of fuel and obtained on prompt researches conducted in some states. For residential sector alone, the estimated consumption of woodfuel is about 10 millions of m3/year or 5.2 millions of ton/year (BRASIL, 2006). For the other sectors, as agriculture, ceramics, foods and beverages and other industries, the estimates are done taking into account that the woodfuel consumption behaves according to the commercial energy demand and the aggregated value of the sector. Data from IBGE, of the extraction of native forests products and of planted forests along with data from census and economic researches are used as estimates.
It can be affirmed that the woodfuel production and consumption statistics and estimations used by the Brazilian Energy Balance in all sectors are unreliable and vulnerable. However, the improvement of the production and consumption statistics of forest products and forest by-products can still be ascertained by developing a better and more relevant estimation methodolgy. Moreover, the quality of the data becomes more realistic when these estimates are subjected to the objectives of the National Energy Balance.
Among the sectors of economic activity that uses intensively the forest products and by-products are found in manufacturing. Along this line, it is observed that only the pulp and paper sector and some companies in the metallurgic sector produce a more systematic accounting of production and consumption. These sectors are large producers and consumers of forest products in terms of volume and weight.
The evaluation of fuelwood used in residential sector as a supplement or complement to LPG presents problems and lack of precision. For instance, when the LPG prices increase, in theory the elasticity effects on the consumption of LPG is said to decrease as a consequence. It does not always follow however that there will be an escalation in fuelwood consumption. In the recent past, a press release noted that there was an increased demand for woodfuels as a result in a decreased consumption for LPG (Soares, 2006). This was not true as the displacement in LPG was more due to the

24
0
1
10
100
1.000
10.000
1970 1972 1974 1976 1978 1980 1982 1984 1986 1988 1990 1992 1994 1996 1998 2000 2002 2004
[mil
toe]
Natural gas LPG Gas-work
increased in natural gas consumption from 5 to 217 million cubic meters during the last 15 years. This was prompted by the expansion of natural gas grid distribution (Figure 8). Aside from the increased availability of natural gas, LPG consumption was also replaced by more electricity use as urban families were now using more electrical appliances i.e. microwave ovens, coffe and tea makers, among others. Despite the increased consumption in natural gas, it is still unsafe to say that all LPG can be replaced by natural gas and electricity in large urban centers.
Figure 8. Gas consumption in households in Brazil
Source: BRASIL, 2005
Estimation methodologies should also consider modern improvements in LPG stoves. LPG stoves are now more efficient. In terms of energy contents, 3 kg of fuelwood corresponds to 1 kg of LPG. However, woodfuel stoves are four times less efficient than LPG stoves such that it may be necessary to have 12 kg of fuelwood to supply the same amount of useful energy in only 1 kg of LPG for cooking applications. Along this line, during the past two years, the National Labelling Program for Energy Efficiency induced a gain of 15% in average efficiency of Brazilian gas stoves. Labelling stimulates the rationalization of energy consumption, allowing consumers to evaluate products based on their energy income and select the more efficient ones. If we assume that each family consumes, on average, one bottle of 13 kg of LPG each month, the potential savings of the Program is about two bottles of LPG per family per year (BRASIL, 2007). It is estimated that this program, under CONPET (the National Program of Rationalization of Petroleum Derivatives and Natural Gas) and INMETRO (the National Metrology Institute) has the potential to save about 780 thousands of tons of LPG annually. It will also decrease importation of LPG. Again, this reduced demand in LPG was brought about by improved LPG stove efficiency and therefore the reduction was not replaced by woodfuels.

25
-
5.000
10.000
15.000
20.000
25.000
30.000
1990 1991 1992 1993 1994 1995 1996 1997 1998 1999 2000 2001 2002
103 te
p
FAO IEA MME IBGE
Aside from the problems related to the fuelwood consumption estimation in households and the difficulty on obtaining information from the service and industry sectors, there is a significant amount of wood residues coming from sawmills and from the furniture industry. These are could also be used in energy production or conversion into charcoal (MONTEIRO, 2000) and is probably is not included. The potential conservative estimates were done by Coelho, Paletta and Freitas (2000). Accordingly it can reach 7.5 millions of tons of wood residue, where 2.8 millions of tons originate from the states north of the country and 4.7 millions of tons from the states that receive the wood, mainly South and Southeast of Brazil.
Figure 9 presents the contribution of woodfuel to the Brazilian total primary energy supply from 1990 -2002. The data is derived from IBGE (the Brazilian National Statistics Agency) and MME (the Ministry of Energy and Mines). Various methodologies were used to estimate these values which affected the presentation of the results. While IBGE data were generally industry field studies and direct surveys, MME values were correlated indirectly with social and macroeconomic indicators. A closer study is needed to address these differences. In addition, figures from IEA (International Energy Agency) and FAO were also included in this figure, indicating that these agencies may have used adjusted data from MME for woodfuel demand and could raise the total woodfuel demand in some amount.
Figure 9. Woodfuel total primary energy supply - TPES in Brazil
Sources: BRASIL (2003); FAO (2004); IBGE (2004 a & b) and IEA (2003)

26
Sustainability and renewability issues In order to evaluate Brazil’s woodfuel demand and supply vis-à-vis their environmental implications, it is useful to separate residential and industrial contexts. In the residential sector, local air quality and health concerns can be related to woodfuel utilization, cooking practices do not seem to pose any serious implications for the environment, i.e.land degradation and regional air pollution. The depletion of forest cover should not be attributed to the demand for fuelwood in Brazilian households. Fuelwood is more often gathered from the roadside and trees outside forests, rather than from natural forests. Studies at the regional level indicate that as much as two thirds of fuelwood for cooking worldwide comes from non-forest sources such as agricultural land and roadsides (ARNOLD et al., 2003). In this way, woodfuel in the residential sector can be consideredrenewable and mostly sustainable, at least in energy terms.
The clearing of land for agricultural development and timber are the main causes of deforestation in Brazil. The demand of woodfuel in some industries however presents evident negative impacts. For instance, in the Northeast where ceramic stoves and lime pits exist. In these cases, woodfuels are non-renewable and unsustainable, and is associated with impoverishment and desertification. It is not possible to quantify the unsustainable fuelwood share in the industrial sector, yet there are some indicators that exploitation of wood may have been declining. The main reasons are:
substitution by wood from reforestation, higher efficiency in the use of the energy source (increased quality of fuelwood), implementation of better and modern end use technologies and fuel substitution (LPG, natural gas, electricity).
The pulp and paper industry could be assumed as a model for wood use in Brazil, included for energy production. According to Bracelpa, 2007, 96% of reforested area for pulp and paper industry was certified, indicating that good renewability and sustainability indicators have been obtained and are being monitored. The certified reforested areas are located in eleven Brazilian States: Amapá and Pará States in North Region; Bahia and Maranhão States in Northeast Region; Espiríto Santo, Minas Gerais and São Paulo States in Southeast Region; Paraná, Santa Catarina e Rio Grande do Sul States in South Region and Mato Grosso do Sul in Center-West Region. Add to that, the pulp and paper industry in Brazil is responsible for the growing of certified reforested areas in Brazil. It is estimated that 60.7% of the total reforested area in Brazil corresponds to certified forests, mostly in the pulp and paper sector. These has been growing quickly especially in the last three years (Figure 10). Fourteen companies were certified in 2006. From the 77 companies certified for forest handling, 49 feed the pulp and paper sector and 8 are certified to supply wood for energy ends; fuelwood and charcoal (FSC,2007; INMETRO, 2007).
Besides forest certification in the pulp and paper industry, there are also production processes certified in the charcoal industry. Amongst the products of 192 certified companies, 16 are related to energy production, three in charcoal production at Minas Gerais State, one in fuelwood production, five in shaving production and seven in cellulose production. Over the last three years, 90% of these products have been certified. These are signs of the growing concern in regulating the origins of woodfuels and improving the sustainability of the forest resources (FSC, 2007).

27
-
500,00
1.000,00
1.500,00
2.000,00
2.500,00
3.000,00
3.500,00
1995 1996 1997 1998 1999 2000 2001 2002 2003 2004 2005 2006
[103 h
a]
Certified area per year Accumulated certified area
Certified forests and wood products
Certification is a voluntary process to promote responsible management of the forests. There are two kinds of certification: forest management – FM certification and chain of custody - COC certification. The forest management certification involves an inspection of the forest management unit by an independent accredited certification body to check that the forest complies with the internationally-agreed principles of responsible forest management defined by the institution. If the forest complies with standards, then the accredited certification body issues a certificate for the operation. Certified forest operations can claim the forest products they produce from a responsibly managed forest. Chain of custody certification provides a guarantee about the production of certified products. Chain-of-custody is the path taken by raw materials from the forest to the consumer, including all successive stages of processing, transformation, manufacturing and distribution. The institutions that accredit independent third party organizations that can certify forest managers and forest product producers are detached Forest Stewardship Council – FSC and Programme for the Endorsement of Forest Certification – PEFC Council. The Brazilian Program of Forest Certification – Cerflor of Instituto Nacional de Metrologia, Normalização e Qualidade Industrial - Inmetro has been endorsed by the PEFC Council as meeting their requirements for forest certification schemes. There are five organizations accredited by FSC and Inmetro in Brazil that can certify forest managers and products: Bureau Veritas Certification – BVQI, Instituto de Manejo e Certificação Florestal e Agrícola – Imaflora, Scientific Certification Systems – SCS, SGS do Brasil Ltda. and Skal. (FSC, 2007; INMETRO, 2007)
Figure 10. Forestry plantation certified area in Brazil
Source: FSC, 2007 and INMETRO, 2007.

28
CONCLUSIONS Brazil and its forest is a living paradox. This country has one of the biggest native forest cover in the planet (416 millions of hectares, or 31% of native forest covert in the planet) and has the fifth biggest reforested area in the world. However, there is scarcity of wood in Brazil, for all uses including energy.
This situation will have to be addressed by formulating policies particularly in regard woodfuel production, conversion efficiency, and final consumption-related guidelines. . Although the whole wood energy chain is formed by private stakeholders, the government should play a central role by launching initiatives and creating regulatory, economic and fiscal directions, consolidated in a National Policy for Wood Energy. Following are some proposals:
Identify long-term production targets and timetables aimed at increasing supply and reducing costs of wood used for energy purposes; Create an organization, preferably at the regional level, that will be responsible for the establishment of a National Wood Energy Information System. This organization will be tasked to develop consistent methodologies, conduct of surveys, sourcing of funds and resources, information dissemination, and the preparation of annual wood balance report.Define norms and standards on wood energy systems preferably similar to “Certification” techniques and methods. These standards should be aimed at promoting efficiency, reducing losses, and increasing sustainability.Develop conditions for forestry-related scientific and technological development i.e. forestry and wood energy process, and expertise in production, conversion and management of wood energy systems. Enforce regulations not only in transportation of wood but also in its final use.
The last proposal is very relevant. The use of fuelwood in Brazil is regulated but the enforcement is quite fragile. Recent initiatives of Sao Paulo State (Decrees 4967 and 49674, 2004) were aimed to improve enforcement in roads and the use of sustainable native wood in all governmental purchases. The Federal Government is also introducing changes in fuelwood control, devolving the responsibility to the States. However, difficulties such as the lack of local capacity and of inadequate funds still exist.
REFERENCES Aracruz. 2007. Processo de produção de celulose (available at
http://www.aracruz.com.br/).
Arnold, M. et al. 2003. Fuelwood revisited? What has changed in the last decade.CIFOR, Jakarta.
Bacha, C.J.C. et al. 2006. Estudo da dimensão territorial do PPA: setor silvicultura, manejo florestal, madeira e celulose, preliminary version, Brasília.
BERC, 2004. Forest Sustainability. Biomass Energy Resource Center, Vermont.
BRACELPA. 2006. Relatório estatístico florestal 2005 (available at http://www.ipef.br/estatisticas/).
29
BRASIL. 2003. Balanço Energético Nacional 2003, Ministério de Minas e Energia, Brasília.
BRASIL. 2004. Comunicação nacional inicial do Brasil à convenção quadro das Nações Unidas sobre mudança do clima, Ministério da Ciência e Tecnologia, Brasília.
BRASIL. 2006. Balanço Energético Nacional 2005, Ministério de Minas e Energia, Brasília.
BRASIL. 2006. Programa brasileiro de etiquetagem, Ministério de Minas e Energia (available at http://www.conpet.gov.br/. Cited 2007 jan.20).
Brasil. 2006. Balanço Energético Nacional 2005, Ministério de Minas e Energia, Brasília.
Coelho, S.T., Paletta, C.E.M. & Freitas, M.A.V. 2000. Medidas mitigadoras para a redução de emissões de gases de efeito estufa na geração termelétrica, Dupligráfica Ed., Brasília.
FAO. 2006. Global forest resources assessment 2005. Food and Agriculture Organization of the United Nations, Rome.
FAO. 2006. Woodfuel consumption. Food and Agriculture Organization of the United Nations, Rome (available at http://www.fao.org/forestry/site/14012/em).
FAO. 2007. Sustainable Woodfuel Production in Brazil. Draft prepared by Nogueira, L.A.H., Coelho, S.T., Uhlig, A., Food and Agriculture Organization of the United Nations, Rome.
FSC. 2007. Produtos e florestas certificadas no Brasil, Forestry Stewardship Council (available at http://www.fsc.org.br/index.cfm?fuseaction=conteudo&IDsecao=180).
Geller, H. et al. 2004. Policies for advancing energy efficiency and renewable energy use in Brazil. Energy Policy, 32 (12): 1437–50, London.
Goodland, R., Daly, H.E., El Serafy, S. (ed.) 1992. Population, technology, and lifestyle: the transition to sustainability. Island Press, New York:112.
IBGE. 2004a. Tabela 289 - Quantidade produzida na extração vegetal por tipo de produto extrativo, Instituto Brasileiro de Geografia e Estatística, Rio de Janeiro (available at http://www.sidra.ibge.gov.br/bda/tabela/listabl.asp?z=t&c=289.
IBGE. 2004b. Tabela 291 - Quantidade produzida na extração vegetal por tipo de produto da silvicultura, Instituto Brasileiro de Geografia e Estatística, Rio de Janeiro (available at http://www.sidra.ibge.gov.br/bda/tabela/listabl.asp?z=t&c=291).
IBGE. 2004c. Tabela 471 - Domicílios particulares permanentes por classes de rendimento nominal médio mensal domiciliar, combustível usado para cozinhar e situação, Instituto Brasileiro de Geografia e Estatística, Rio de Janeiro (available at http://www.sidra.ibge.gov.br/bda/tabela/listabl.asp?z=t&c=471).
IBGE. 2004d. Pesquisa de orçamentos familiares 2002 - 2003, microdados, Instituto Brasileiro de Geografia e Estatística, Rio de Janeiro, CD-ROM.
IBGE. 2005a. Pesquisa nacional pro amostragem de domicílios 2004, microdados Brasil, Instituto Brasileiro de Geografia e Estatística, Rio de Janeiro, CD-ROM.
IBGE. 2005b. Produção da extração vegetal e da silvicultura 2004, Instituto Brasileiro de Geografia e Estatística, Coordenação de Agropecuária, Rio de Janeiro.

30
IBGE. 2006. Produção da extração vegetal e da silvicultura 2005, Instituto Brasileiro de Geografia e Estatística, Coordenação de Agropecuária, Rio de Janeiro.
IEA. 2003. Energy balances of non-OECD countries 2000-2001. International Energy Agency, Paris.
IEA. 2006. World Energy Outlook. International Energy Agency, Paris.
IEA. Task 29, 2005, Bioenergy definitions (available at http://www.aboutbioenergy.info/sustainability.html).
Inee. 2006. Política para a madeira energética, Instituto Nacional de Eficiência Energética, Rio de Janeiro
INMETRO. 2007. Relação das organizações certificadas conforme NBR 14789, Instituto Nacional de Metrologia, available from: http://www.inmetro.gov.br/qualidade/cerflor_ocf.asp
Jannuzi, G.M. & Sanga, G.A. 2004. LPG subsidies in Brazil: an estimate. Energy for Sustainable Development, VIII (3), Paris.
Lucon, O. et al. 2004. LPG in Brazil: lessons and challenges. Energy for Sustainable Development, VIII (3), Paris.
Monteiro, M.A. 2005. Siderurgia na Amazônia oriental brasileira e a pressão sobre a floresta primária, Universidade Federal do Pará, Belém.
Nogueira, L.A.H. & Lora, E.E.S. 2003. Dendroenergia: fundamentos e aplicações, : Editora Interciência, 2nd ed., Rio de Janeiro.
Soreas, P. 2006. Lenha ganha espaço de gás de cozinha. Folha de São Paulo (Caderno Dinheiro), São Paulo, 4 jan. 2006.
Tolmasquim, M.T. et al. 1998. Tendências da eficiência energética no Brasil, Eletrobrás, Rio de Janeiro.
USDA. 1996. A Report to Facilitate Discussion of Indicators of Sustainable Forest Management. Forest Service (available at http://www.fs.fed.us/land/sustain_dev.).