Embed Size (px)
Citation preview
Department RecFind No: Division/HHS: File Ref No:
Department Minister’s office
SUBJECT: Long Stay Older Patients Steering Committee Meeting 7 September 2016
Recommendation/s It is recommended the Deputy Director-General Strategic, Policy and Planning Division: 1. Approve the attached Summary Report of the 2016 Long Stay Older Patients Census to
be provided to the Long Stay Older Patients Steering Committee APPROVED / NOT APPROVED
2. Send the attached meeting documents to the Long Stay Older Patients Steering Committee Members ahead of the first meeting on 7 September 2016 APPROVED / NOT APPROVED
KATHLEEN FORRESTER
Date: / /
Deputy Director-General
Ministerial / Director-General Brief for Approval required
Ministerial / Director-General Brief for Noting required
Deputy Director-General’s comment Issue/s 1. The Deputy Director-General is chairing the first meeting of the Long Stay Older Patients
Steering Committee on Wednesday 7 September 2016, 3:30 to 5:00pm. Attached is the run sheet with speaking notes for the meeting (Attachment 1).
2. The Steering Committee members include Graham Kraak, Acting Executive Director, Strategic Policy and Legislation Branch and four Board Chairs:
Mr Robert McCarthy, Chair, Torres and Cape Hospital and Health Board
Ms Carolyn Eagle, Chair, Cairns and Hinterland Hospital and Health Board
Mr Tony Mooney, Chair, Townsville Hospital and Health Board
Mr Michael Horan, Chair, Darling Downs Hospital and Health Board.
3. As approved in the previous briefing note (Attachment 2: ST000253), the Deputy Director- General sent an email inviting the four board chairs to attend the meeting, with the draft Terms of Reference for the Steering Committee attached with the email. The email also noted that prior to the first meeting, the Agenda and the Summary Report of the 2016 Long Stay Older Patients Census would be sent in advance with any other background papers.
4. The draft Terms of Reference for the Steering Committee, notes that meeting papers will be sent to Committee members at least five days prior to the meeting. Therefore, meeting papers should be sent by Wednesday 31 August 2016 at the latest.
5. The Summary Report for the 2016 Long Stay Older Patients Census has been completed and is attached for the Deputy Director-General’s approval to send to Steering Committee Members
Deputy Director-General Brief for Approval
RTI R
elea
se
RTI Page No. 1DOH-DL 17/18-031
Department RecFind No: Division/HHS: File Ref No:
with meeting papers. It is suggested that for background information, the Summary Report for the 2014 Long Stay Older Patients Census also be sent to Steering Committee Members.
6. An email has been drafted (Attachment 3) for the Deputy Director General to send to the Steering Committee Members with the following papers attached to the email:
Agenda (Attachment 4)
Draft Terms of Reference for the Long Stay Older Patients Steering Committee (Attachment 5)
Summary Report of the 2016 Long Stay Older Patients Census (Attachment 6)
Summary Report of the 2014 Long Stay Older Patients Census (Attachment 7)
Background Paper: Aged Care in Queensland (Attachment 8)
Vision 7. Addressing the issues around Long Stay Older Patients in Queensland’s public hospitals aligns
with three of the Directions in the Vision: Delivering healthcare; Connecting healthcare; and Pursing Innovation.
Results of Consultation 8. Further consultation with HHSs is required to investigate the reasons for delay in discharge and
identify strategies to address the issue.
Resource Implications (including Financial) 9. For the financial years 2011-12 to 2013-14 the Queensland Government was a signatory to the
multilateral National Partnership Agreement on Financial Assistance for Long Stay Older Patients (NPA LSOP). The NPA LSOP recognised that the Commonwealth and State and Territory governments had a mutual interest in improving the outcomes in relation to LSOPs and they needed to work together to achieve those outcomes. Under the NPA LSOP the Queensland Government received $51.61 million as a contribution to the cost of providing care to LSOPs in public hospitals.
10. While the Commonwealth no longer provides this financial assistance for these patients, the information collected through this census is still beneficial for the Department in monitoring the impacts of aged care reforms.
Background 11. The impact of long stay older patients on public hospital service provision was raised at the
Hospital and Health Board Chairs meeting on 25 November 2015. Members recommended establishing a LSOP Steering committee to develop options for managing this issue into the future, including negotiations with the Commonwealth and presenting papers to the Council of Australian Governments (COAG) Health Council.
Attachments 12. Attachment 1: Meeting run sheet with speaking notes
13. Attachment 2: Previous DDG Brief regarding the Steering Committee meeting (ST000253)
14. Attachment 3: Email to Steering Committee Members
15. Attachment 4: Agenda
RTI R
elea
se
RTI Page No. 2DOH-DL 17/18-031
Department RecFind No: Division/HHS: File Ref No:
16. Attachment 5: Steering Committee Draft Terms of Reference
17. Attachment 6: Summary Report for the 2016 Long Stay Older Patients Census
18. Attachment 7: Summary Report for the 2014 Long Stay Older Patients Census
19. Attachment 8: Background Paper – Aged Care in Queensland
Author Cleared by: (SD/Dir) Content verified by: (CEO/DDG/Div Head) Emily Cross
Stephen Stewart
Graham Kraak
Principal Policy Officer
Manager
A/Executive Director
Strategic Policy
Strategic Policy Unit
Strategic Policy and Legislation Branch
322 22924 3234 0259 3234 0914 25 August 2016 26 August 2016 31 August 2016
RTI R
elea
se
RTI Page No. 3DOH-DL 17/18-031
Time Activity Deputy Director-General’s speaking points Speaker
3.30pm – 3.40
Welcome and Scene Setting
Good afternoon and welcome to the first Long Stay Older Patients Steering
Committee meeting of Board Chairs.
My name is Kathleen Forrester and I am the Deputy Director-General of the
Strategy, Policy and Planning Division and I will be your Chair for today.
To commence proceedings, I would like to respectfully acknowledge the
Turrabul and Jagera people as Traditional Owners of the land on which this
event is taking place and Elders both past and present.
I also recognise those whose ongoing effort to protect and promote Aboriginal
and Torres Strait Islander cultures will leave a lasting legacy for future Elders
and leaders.
Thank you for nominating yourselves to form the Long Stay Older Patient
Steering Committee following the meeting of Board Chairs on 25 November
2015, where it was recommended to form the Committee.
I thank you for your patience this year while the 2016 Long Stay Older Patient
Census was conducted, with data collected from 74 facilities throughout
Queensland. The findings from this census are presented in the Summary
Report we will review today.
Deputy Director-General, Department of Health
Long Stay Older Patients Census DDG Run Sheet
Purpose of Meeting:
To review the 2016 Long Stay Older Patients Summary Report and provide strategic advice on managing Long Stay Older Patient issues into the future.
RTI Release
RTI Page No. 4DOH-DL 17/18-031
Purpose of Meeting: - 2 -
Time Activity Deputy Director-General’s speaking points Speaker
I would also like to thank the Hospital and Health Services (HHSs) and their
officers for their participation in this manual census and acknowledge their
commitment of conducting the census on top of their day to day demands.
Background and Purpose of Today’s Meeting
The purpose of this first meeting of the Steering Committee today is to firstly
endorse the Terms of Reference for the Committee; and secondly to review the
Long Stay Older Patient (LSOP) data collected from the 2016 census; and
discuss the findings presented in the Summary Report provided.
As you can see from the Agenda, the Committee is also asked to consider the
methodology of the manual census for collecting the data and consider how this
could be improved to increase the reliability of assumptions we make from the
data. And what further consultation with the HHSs is necessary for this
Committee to identify the key issues and provide strategic advice on managing
LSOPs into the future.
LSOPs in public facilities have been a long standing issue for State Health
systems. You may be aware from 2011-12 to 2013-14 there was a National
Partnerships Agreement on Financial Assistance for Long Stay Older Patients
between the Commonwealth and the States and Territories. This agreement
formalised a Commonwealth funding contribution to recognise that some older
people in public hospitals who have finished acute and post-acute care and
have been assessed as being suitable for Commonwealth aged care remain in
hospital longer than would otherwise be necessary while they secure an
appropriate community or residential aged care place.
RTI Release
RTI Page No. 5DOH-DL 17/18-031
Purpose of Meeting: - 3 -
Time Activity Deputy Director-General’s speaking points Speaker
While this came to an end in 2013-14, with no further financial assistance from
the Commonwealth, the subsequent manual censuses conducted in 2014 and
2016 reveal that LSOPs remain a large cohort in public facilities. This is a
concerning issue for our patients and for Queensland’s public health system.
3.40pm – 3.45
Endorse Terms of Reference
I trust you received a copy of the draft Terms of Reference for the formation of
the Steering Committee. The draft Terms of Reference provides a brief
background and details the purpose of the Steering Committee and meeting
parameters. I note in the Terms of Reference that while this initial meeting is
face-to-face our subsequent meetings maybe held via teleconference or video
conference if members would prefer.
I invite your feedback on the draft Terms of Reference for amendments; or if no
amendments are put forward, I suggest a Steering Committee member move a
motion that the attached Terms of Reference are endorsed.
Deputy Director-General, Department of Health
3.45pm – 4.00
Discuss 2016 LSOP Census Report
Comments and feedback regarding the 2016 report and findings.
The collated data and findings from the 2016 manual census are provided in
the Long Stay Older Patients Census Summary Report. This report makes
comparisons with the data collected from the 2014 census. The 2014
Summary Report has also been provided for your information.
For patients to be counted in the 2016 census they needed to be:
o publicly funded patients;
o who were aged 65 years or over; or 50 years or over for Aboriginal
and Torres Strait Islander people; and
o had been assessed by an Aged Care Assessment Team (ACAT) as
Deputy Director-General, Department of Health Board Chairs RTI R
elease
RTI Page No. 6DOH-DL 17/18-031
Purpose of Meeting: - 4 -
Time Activity Deputy Director-General’s speaking points Speaker
being eligible for permanent aged care services (residential care or
community packaged care) and unable to return to the community
without that care in place; and
o no longer needed inpatient acute or post/sub-acute care and are
declared medically ready for discharge if the appropriate aged care
services were available.
Some fast facts from the Summary Report:
o There were 238 LSOPs in acute facilities in 2014 and 298 in 2016,
representing a 25 percent increase from 2014.
o Townsville had the largest share of the total number of LSOPs in
acute facilities in 2016 at 24 percent; Metro North had the next
largest share at 14 percent.
o The increase in LSOPs was not uniform across the HHSs – Cairns
and Hinterland HHSs had the largest decrease, while Townsville saw
the largest proportional increase.
o Gold Coast, Metro North and Torres and Cape had similar numbers
identified in their acute facilities in both the 2014 and 2016 censuses.
o Occupied bed days in this report is the number of days between the
date the patient was considered to be safe for discharge and the
census date of 18 May 2016.
o On the census date in 2014, the 238 LSOPs accounted for 12,200
occupied bed days; and in 2016 this number was 24,000 occupied
bed days.
o This means LSOPs stayed longer on average in 2016 with almost
RTI Release
RTI Page No. 7DOH-DL 17/18-031
Purpose of Meeting: - 5 -
Time Activity Deputy Director-General’s speaking points Speaker
double the number of occupied bed days compared to 2014.
o The demographics remain similar across the 2014 and 2016. And a
similar number of Aboriginal or Torres Strait Islander people were
identified in the 2014 and 2016.
o The occupied bed days for the 65-69 year age group decreased from
17 percent of the total in 2014 to 9 percent in 2016.
o The occupied bed days for the 85 years and over age group
increased from 35 percent of the total in 2014 to 43 percent in 2016.
o Both the 2014 and 2016 censuses revealed that as remoteness
increases the average length of stay of the LSOP also increases –
length of stay was up to four times long in outer regional areas
compared with major cities and inner regional.
o The leading reason for the delay in discharging LSOPs remained the
same in 2014 and 2016 and was, “Wait for a Residential Aged Care
bed”. However, “Difficult to place due to behaviour/dementia”
replaced, “Waiting asset test/financial assessment” as the next
leading cause for the delay.
Open discussion from Steering Committee members.
Review the reliability of existing data sources for on-going reporting on the LSOP issue and for the suitability of monitoring the effectiveness of possible strategies.
The data collected on LSOPs is intended to assist HHSs in monitoring this
issue; and to provide evidence to support decision making and review of
RTI Release
RTI Page No. 8DOH-DL 17/18-031
Purpose of Meeting: - 6 -
Time Activity Deputy Director-General’s speaking points Speaker
strategies that are put in place.
The Department will also continue to use the data to inform feedback to the
Commonwealth Government regarding the impact of Aged Care Reforms and
LSOPs on the public hospital system.
Increasing the reliability of the data and improving the collection method for
HHSs could improve the effectiveness of the data for both HHSs and the
Department.
The current method to conduct the 2016 census relied on HHSs to nominate
contacts in each of their facilities and then each contact manually identifying
every LSOP who met the inclusion criteria. HHSs employed different
methodologies for identifying LSOPs including running database searchers or
working through patient charts.
Last year the Strategic Policy Unit further investigated other possible
methods for collecting the data with the aim to decrease the burden on the
HHSs in manually collecting the data; increasing the reliability of the data
through removing inconsistences to identifying LSOPs; and being able to
replicate the data multiple times across the year.
As noted in the Summary Report, Statistical Services Branch trialed a Data
Matching Exercise to identify LSOPs by matching data held in the
Queensland Health Admitted Patient Data Collection and the Aged Care
Evaluation Database.
The data matching exercise identified 184 LSOPs in public health facilities on
21 October 2015. In light of the 2014 and 2016 manual censuses, this
RTI Release
RTI Page No. 9DOH-DL 17/18-031
Purpose of Meeting: - 7 -
Time Activity Deputy Director-General’s speaking points Speaker
number appears low and may reflect that the data matching methodology
may not comprehensively identify all LSOPs. This method also does not
allow collection of the qualitative data such as the reason for the delay in
discharge.
Open discussion from the Steering Committee members on the collection of
data; the usefulness of the data for HHSs in terms of monitoring the issue;
and how improvements could be made such as the use of systems within
HHSs to monitor LSOPs within their hospitals?
Discussion regarding future consultation with HHSs to investigate the reasons for delay in discharge of LSOPs and impact on bed days (e.g. Wait for RACF place, wait for asset test/financial assessment, difficult to place due to behavior/dementia, other and family to select facility).
I’d like to start the discussion by inviting the Cairns and Hinterland and
Townsville Chairs to share their thoughts – Cairns and Hinterland the HHS
with the largest decrease in LSOP numbers and Townsville with the largest
increase in LSOPs – as this is a great opportunity to understand if there are
any specific reasons that can be identified for these numbers. Has Cairns
and Hinterland put in place specific strategies that might have impacted their
LSOP numbers?
Further looking into the Cairns and Hinterland and Townsville data reveals
that Cairns and Hinterland LSOPs stayed an average 50 days, while
Townsville’s LSOPs stayed on average 163 days. The average length of stay
for all LSOPs in 2016 was 81 days.
RTI Release
RTI Page No. 10DOH-DL 17/18-031
Purpose of Meeting: - 8 -
Time Activity Deputy Director-General’s speaking points Speaker
Thoughts from Steering Committee Members on what further consultation
with HHSs is advised to investigate the reasons for delay in discharge
further?
Report will be updated and sent to Steering Committee for further feedback.
Thank you for feedback and discussion today on the findings from the 2016
Census. The Strategic Policy Unit will update the 2016 Long Stay Older
Patients Summary Report to reflect these discussions and send to members
with a copy of the minutes. 4.00pm – 4.15
Discuss Plans for future meetings
How do we develop options for managing this issue into the future?
How will the Steering Committee achieve its purpose of identifying issues associated with LSOPs and providing strategic advice on managing the issues to address future impacts?
What further information is required to provide strategic advice on this issue?
Future agenda items.
Deputy Director-General, Department of Health Board Chairs
4.15pm – 4.20
Close A brief summary of the outcomes of the meeting.
The Strategic Policy Unit will draft the minutes including any action items from the meeting and send to Steering Committee members.
What date suits Steering Committee members for the next meeting?
Deputy Director-General, Department of Health
4.20 End of meeting
RTI Release
RTI Page No. 11DOH-DL 17/18-031
Department RecFind No: ST000253Division: SPPFile Ref No: SPL_1546
Department Minister’s office
SUBJECT: 2015 Report for Long Stay Older Patients
Recommendations
It is recommended that the Deputy Director-General, Strategy, Policy and Planning Division:
1. Approve the draft Long Stay Older Patients Steering Committee Terms of Reference and Agenda for the first meeting.
2. Approve the draft email to the four self-nominated Board Chairs inviting them to the first Steering Committee Meeting
APPROVED
KATHLEEN FORRESTER Date: 23 / 06 / 2016
Deputy Director-General
Ministerial / Director-General Brief for Approval required Ministerial / Director-General Brief for Noting required
Deputy Director-General’s comment:
Issues1. The impact of long stay older patients (LSOP) on public hospital service provision was
raised at the Hospital and Health Board Chairs meeting on 25 November 2015. Members recommended establishing a LSOP Steering committee to develop options for managing this issue into the future, including negotiations with the Commonwealth and presenting papers to the Council of Australian Governments (COAG) Health Council.
2. The Office of Health Statutory Agencies (OHSA) circulated an expression of interest to Hospitals and Health Board Chairs seeking nominees for a small working group on aged care to assist the Strategic Policy Unit to develop a paper outlining the issues and potential actions for addressing these issues. The following nominations were received in January 2016:
2.1 Mr Robert McCarthy, Chair, Torres and Cape Hospital and Health Board2.2 Ms Carolyn Eagle, Chair, Cairns and Hinterland Hospital and Health Board2.3 Mr John Bearne, Chair, Townsville Hospital and Health Board (however, Mr Tony
Mooney has since taken on the role of the Chair)2.4 Mr Michael Horan, Chair, Darling Downs Hospital and Health Board.
3. On 1 March 2016, the Director-General approved a proposed approach for developing a strategic response to LSOP, including establishment of a high level steering committee, review of existing data, preparing an overview of the current aged care situation in Queensland and identifying potential options for addressing issues, in consultation with stakeholders (Attachment 1).
4. A draft Terms of Reference (ToR) for a Queensland Health LSOP Steering Committee has been developed (Attachment 2). It is proposed the Committee consist of four Hospital and Health Board Chairs and be chaired by the Deputy Director-General, Strategy, Policy and Planning Division, with secretariat support provided by the Strategic Policy Unit.
Deputy Director-General Brief for Approval
RTI R
elea
se
RTI Page No. 12DOH-DL 17/18-031
Department RecFind No: ST000253Division: SPPFile Ref No: SPL_1546
5. Should the Deputy Director-General approve the draft ToR, an email has been drafted for approval (Attachment 3) to be sent to the nominated Board Chairs inviting them to the first meeting of the Queensland Health LSOP Steering Committee. A draft agenda for the first meeting is at Attachment 4.
6. A manual census of publicly funded long stay older patients was conducted on 18 May 2016 and will provide a snapshot of the number of older patients who remain in hospital because, while medically ready for discharge, they are unable to return to the community as they are waiting on access to a community aged care package or a place in a residential aged care facility to become available. A draft report for the Steering Committee from the manual census will be prepared in time for the meeting with comparable data from the same census conducted in 2014 report.
7. Statistical Services Branch have also recently conducted a data matching exercise to determine an indicative number of LSOPs. As at 21 October 2015, 184 public patients in 51public health facilities across 15 Hospital and Health Services (HHSs), and one private facility in Queensland met the LSOP eligibility criteria. The majority of these LSOPs were ingeographical regions classified as major cities or inner regional, while the majority of occupied bed days used (that is, days between ready for discharge and census date), were in facilities in outer regional areas. This information will also be utilised in the draft report to the Steering Committee.
Results of Consultation8. Further consultation with HHSs is required to investigate the reasons for delay in discharge.9. Statistical Services Branch undertook a data matching exercise to provide an indicative
number of LSOP public patients in Queensland.
Resource Implications (including Financial)10. For the financial years 2011-12 to 2013-14 the Queensland Government was a signatory to
the multilateral National Partnership Agreement on Financial Assistance for Long Stay Older Patients (NPA LSOP). The NPA LSOP recognised that the Commonwealth and State and Territory governments had a mutual interest in improving the outcomes in relation to LSOPs and they needed to work together to achieve those outcomes. Under the NPA LSOP the Queensland Government received $51.61 million as a contribution to the cost of providing care to LSOPs in public hospitals.
11. While the Commonwealth no longer provides this financial assistance for these patients, the information collected through this census is still beneficial for the Department in monitoring the impacts of aged care reforms.
Background12. A public patient is considered a LSOP when they meet the following criteria:
a. aged 65 years or over (or 50 years or over for Aboriginal and Torres Strait Islander people), and
b. has been assessed by an Aged Care Assessment Team (ACAT) as being eligible for permanent aged care services (residential care or packaged care) and are unable to be discharged from hospital without this care in place, and
c. no longer in need of in-patient acute or post/sub-acute care and declared medically ready for discharge.
13. Previous LSOP censuses have been undertaken since 2008.
Attachments14. Attachment 1 – BR063494
Attachment 2 – Proposed LSOP Steering Committee TORAttachment 3 – Draft email to LSOP Steering Committee membersAttachment 4 – Proposed LSOP Steering Committee agenda
RTI R
elea
se
RTI Page No. 13DOH-DL 17/18-031

Department RecFind No: ST000253Division: SPPFile Ref No: SPL_1546
Author: Cleared by: Content verified by:Stephen Stewart Rachel Vowles Graham KraakManager A/Director A/Executive DirectorStrategic Policy Strategic Policy Strategic Policy and Legislation Branch3234 0259 3234 0289 3234 0914
4 May 2016 9 June 2016 14 June 2016
RTI R
elea
se
RTI Page No. 14DOH-DL 17/18-031
Enquiries to: First name last name
Title
Unit / Branch
Telephone: Telephone Number File Ref: DGNumber
title first name/initial surname occupational title organisation address CITY STATE POSTCODE Email: Dear I am looking forward to meeting with you on Wednesday 7 September for the first meeting of the Long Stay Older Patients Steering Committee. Please find attached the following documents ahead of the meeting: Attachment 1: Agenda Attachment 2: Draft Terms of Reference Attachment 3: Summary Report of the 2016 Long Stay Older Patients Census Attachment 4: Summary Report of the 2014 Long Stay Older Patients Census Attachment 5: Back ground Paper - Aged Care in Queensland The first meeting of the Steering Committee is scheduled to take place in Brisbane on Wednesday 7 September from 3.30pm to 5pm. The meeting will be held in the level 13 Conference Room, Queensland Health Building, 147-163 Charlotte St, Brisbane. Please advise if you would like a car park booked in the Queensland Health Building and if you have any dietary requirements for afternoon tea. Yours sincerely Kathleen Forrester Deputy Director-General Strategy, Policy and Planning Queensland Health Office Postal Phone Fax 16th Floor Queensland Health Building 147 - 163 Charlotte Street BRISBANE QLD 4000
GPO Box 48 BRISBANE QLD 4001
3234 1766 [email protected]
RTI R
elea
se
RTI Page No. 15DOH-DL 17/18-031
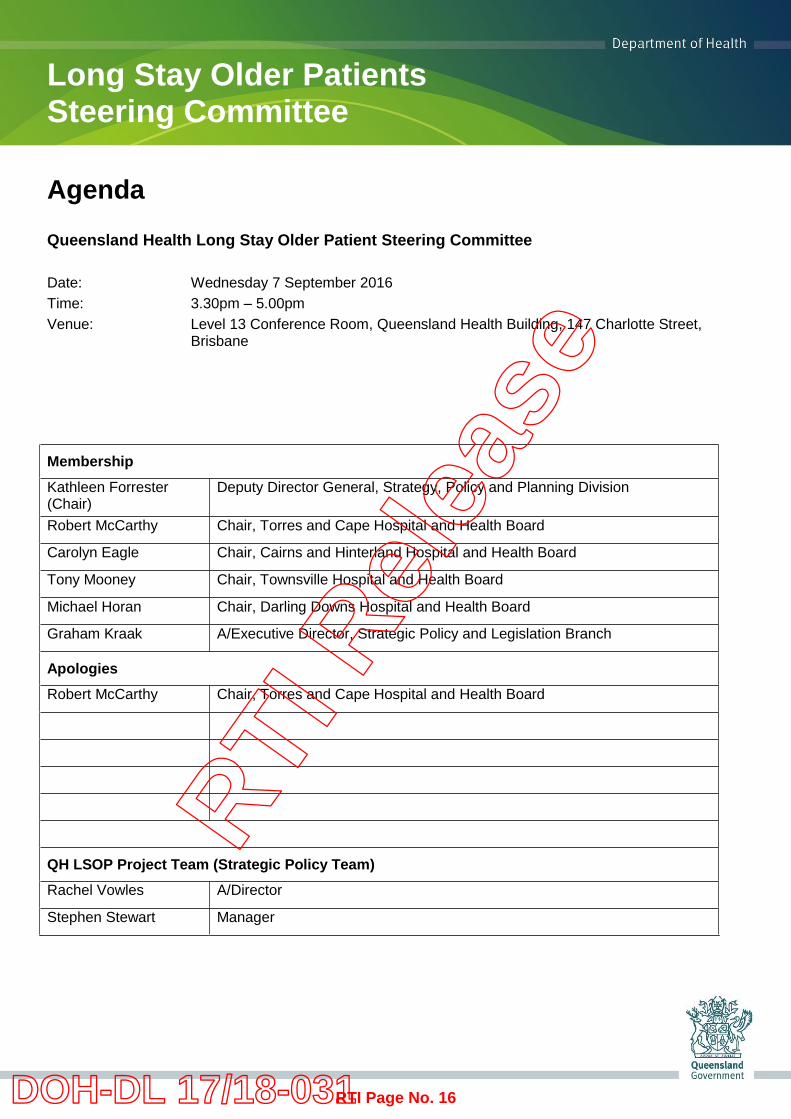
Agenda Queensland Health Long Stay Older Patient Steering Committee Date: Wednesday 7 September 2016 Time: 3.30pm – 5.00pm Venue: Level 13 Conference Room, Queensland Health Building, 147 Charlotte Street,
Brisbane
Long Stay Older Patients Steering Committee
Membership
Kathleen Forrester (Chair)
Deputy Director General, Strategy, Policy and Planning Division
Robert McCarthy Chair, Torres and Cape Hospital and Health Board
Carolyn Eagle Chair, Cairns and Hinterland Hospital and Health Board
Tony Mooney Chair, Townsville Hospital and Health Board
Michael Horan Chair, Darling Downs Hospital and Health Board
Graham Kraak A/Executive Director, Strategic Policy and Legislation Branch
Apologies
Robert McCarthy Chair, Torres and Cape Hospital and Health Board
QH LSOP Project Team (Strategic Policy Team) Rachel Vowles A/Director
Stephen Stewart Manager
RTI R
elea
se
RTI Page No. 16DOH-DL 17/18-031
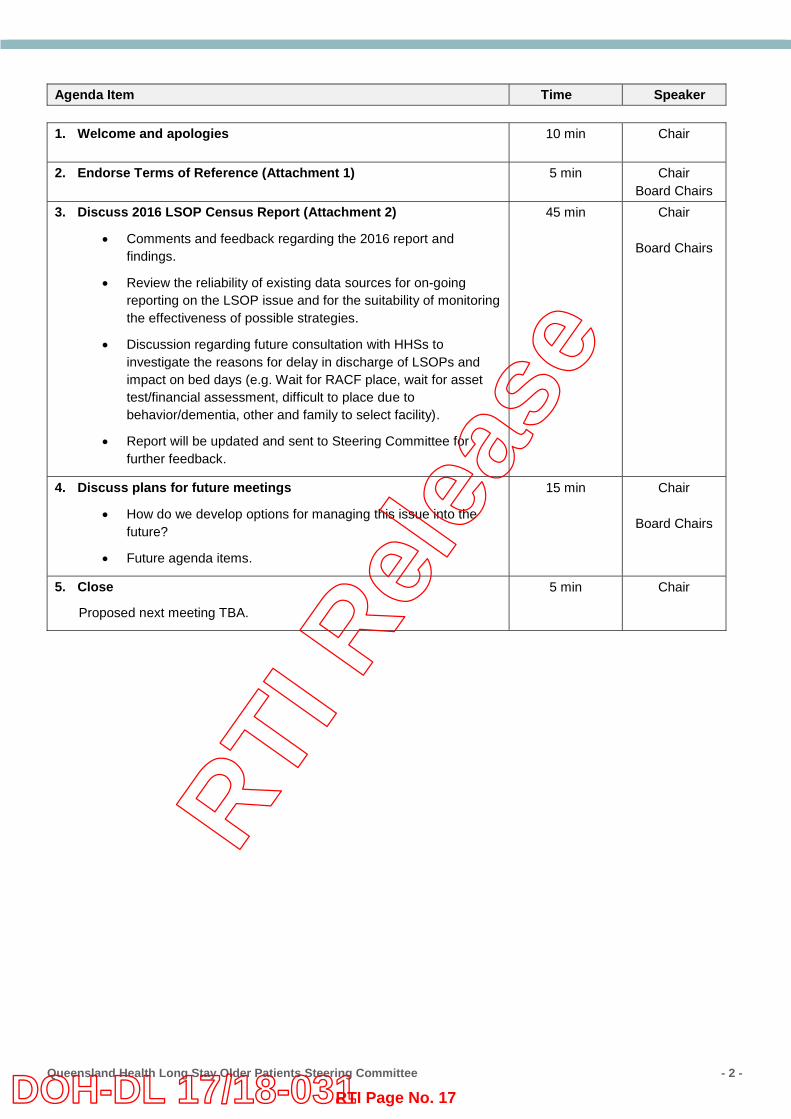
Queensland Health Long Stay Older Patients Steering Committee - 2 -
Agenda Item Time Speaker
1. Welcome and apologies 10 min Chair
2. Endorse Terms of Reference (Attachment 1) 5 min Chair Board Chairs
3. Discuss 2016 LSOP Census Report (Attachment 2)
Comments and feedback regarding the 2016 report and findings.
Review the reliability of existing data sources for on-going reporting on the LSOP issue and for the suitability of monitoring the effectiveness of possible strategies.
Discussion regarding future consultation with HHSs to investigate the reasons for delay in discharge of LSOPs and impact on bed days (e.g. Wait for RACF place, wait for asset test/financial assessment, difficult to place due to behavior/dementia, other and family to select facility).
Report will be updated and sent to Steering Committee for further feedback.
45 min Chair
Board Chairs
4. Discuss plans for future meetings
How do we develop options for managing this issue into the future?
Future agenda items.
15 min Chair
Board Chairs
5. Close
Proposed next meeting TBA.
5 min Chair
RTI R
elea
se
RTI Page No. 17DOH-DL 17/18-031
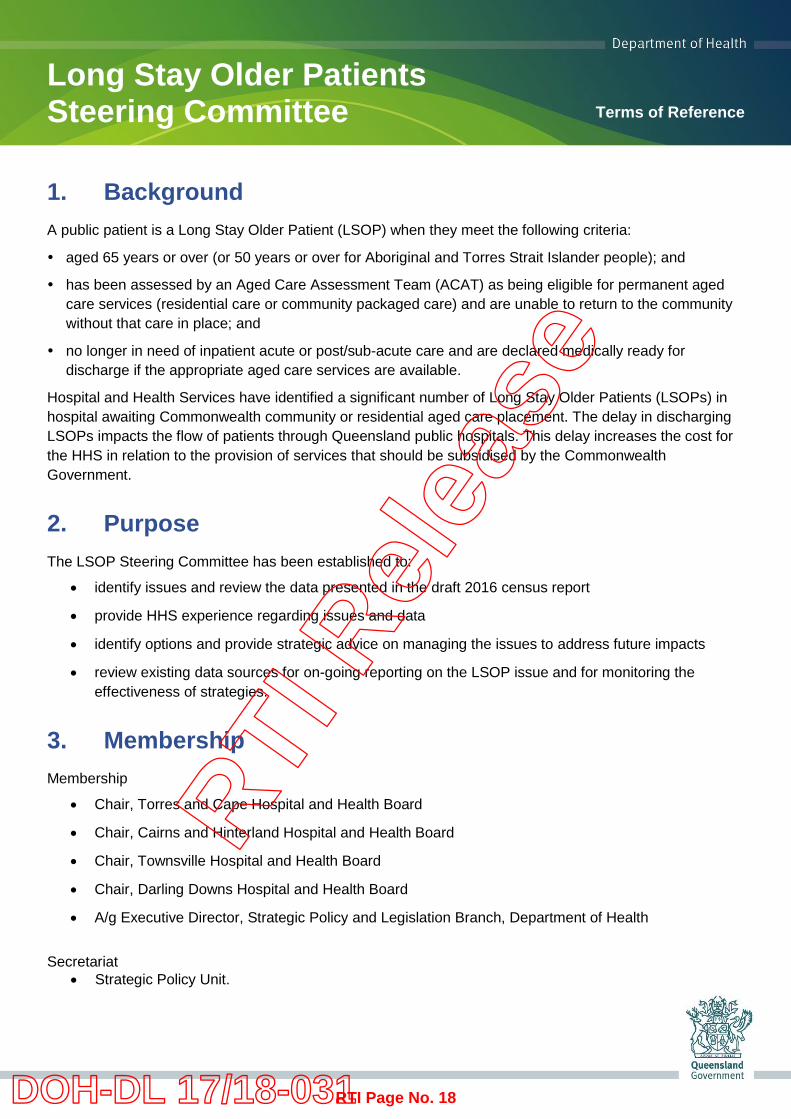
1. Background A public patient is a Long Stay Older Patient (LSOP) when they meet the following criteria:
aged 65 years or over (or 50 years or over for Aboriginal and Torres Strait Islander people); and
has been assessed by an Aged Care Assessment Team (ACAT) as being eligible for permanent aged care services (residential care or community packaged care) and are unable to return to the community without that care in place; and
no longer in need of inpatient acute or post/sub-acute care and are declared medically ready for discharge if the appropriate aged care services are available.
Hospital and Health Services have identified a significant number of Long Stay Older Patients (LSOPs) in hospital awaiting Commonwealth community or residential aged care placement. The delay in discharging LSOPs impacts the flow of patients through Queensland public hospitals. This delay increases the cost for the HHS in relation to the provision of services that should be subsidised by the Commonwealth Government.
2. Purpose The LSOP Steering Committee has been established to:
identify issues and review the data presented in the draft 2016 census report
provide HHS experience regarding issues and data
identify options and provide strategic advice on managing the issues to address future impacts
review existing data sources for on-going reporting on the LSOP issue and for monitoring the effectiveness of strategies.
3. Membership Membership
Chair, Torres and Cape Hospital and Health Board
Chair, Cairns and Hinterland Hospital and Health Board
Chair, Townsville Hospital and Health Board
Chair, Darling Downs Hospital and Health Board
A/g Executive Director, Strategic Policy and Legislation Branch, Department of Health
Secretariat
Strategic Policy Unit.
Long Stay Older Patients Steering Committee Terms of Reference
RTI R
elea
se
RTI Page No. 18DOH-DL 17/18-031
Long Stay Older Patients Steering Committee - 2 -
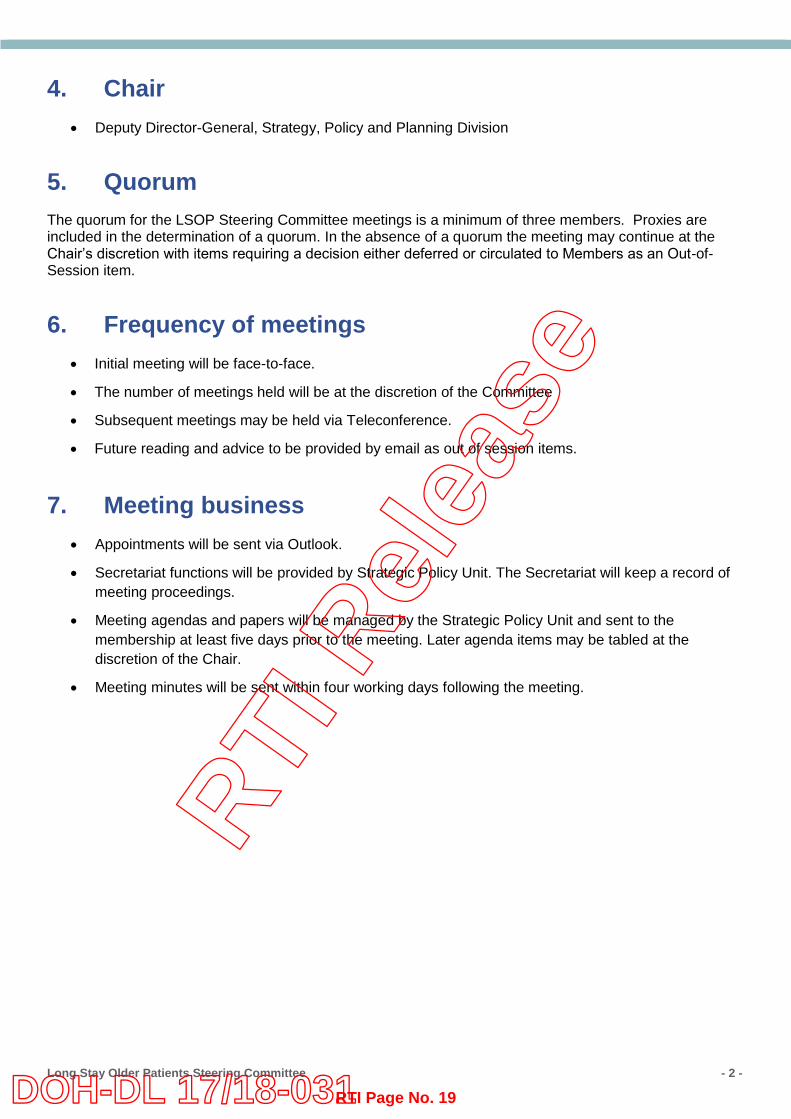
4. Chair Deputy Director-General, Strategy, Policy and Planning Division
5. Quorum The quorum for the LSOP Steering Committee meetings is a minimum of three members. Proxies are included in the determination of a quorum. In the absence of a quorum the meeting may continue at the Chair’s discretion with items requiring a decision either deferred or circulated to Members as an Out-of-Session item.
6. Frequency of meetings Initial meeting will be face-to-face.
The number of meetings held will be at the discretion of the Committee
Subsequent meetings may be held via Teleconference.
Future reading and advice to be provided by email as out of session items.
7. Meeting business Appointments will be sent via Outlook.
Secretariat functions will be provided by Strategic Policy Unit. The Secretariat will keep a record of meeting proceedings.
Meeting agendas and papers will be managed by the Strategic Policy Unit and sent to the membership at least five days prior to the meeting. Later agenda items may be tabled at the discretion of the Chair.
Meeting minutes will be sent within four working days following the meeting.
RTI R
elea
se
RTI Page No. 19DOH-DL 17/18-031
Long Stay Older Patients Census
Summary Report
2016
RTI R
elea
se
RTI Page No. 20DOH-DL 17/18-031
Long Stay Older Patients Census – Summary Report - ii -
For internal use only. Due to potential confidentiality issues, permission should be sought from the Strategic Policy Unit before content is shared or reproduced in whole or part.
Long Stay Older Patients Census: Summary Report
This Summary Report is for internal Department of Health use only. Due to potential patient confidentiality issues, permission should be sought from the Strategic Policy Unit before content is shared or reproduced in whole or part.
For more information contact: Strategic Policy Unit, Strategic Policy and Legislation Branch, Strategy, Policy and Planning Division, Department of Health, GPO Box 48, Brisbane QLD 4001, email [email protected], phone 3222 2916.
Disclaimer: The content presented in this publication is distributed by the Queensland Government as an information source only. The State of Queensland makes no statements, representations or warranties about the accuracy, completeness or reliability of any information contained in this publication. The State of Queensland disclaims all responsibility and all liability (including without limitation for liability in negligence) for all expenses, losses, damages and costs you might incur as a result of the information being inaccurate or incomplete in any way, and for any reason reliance was placed on such information.
RTI R
elea
se
RTI Page No. 21DOH-DL 17/18-031
Long Stay Older Patients Census – Summary Report - iii -
For internal use only. Due to potential confidentiality issues, permission should be sought from the Strategic Policy Unit before content is shared or reproduced in whole or part.
Contents 1. Background ................................................................................................ 1
1.1 Older People in Queensland ....................................................................... 1
2. Methodology .............................................................................................. 4 2.1 Overview .................................................................................................... 4 2.2 Inclusion Criteria ......................................................................................... 4 2.3 Exclusions .................................................................................................. 4 2.4 Data Verification and Analysis .................................................................... 5 2.5 Census Data Limitations ............................................................................. 5
3. Results for the 2016 Queensland LSOP Census ....................................... 6 3.1 Facilities ..................................................................................................... 6 3.2 Occupied Bed Days .................................................................................... 7 3.3 Location of LSOPs ...................................................................................... 8 3.4 Demographics of LSOPs ............................................................................ 9 3.5 ACAT Approval ......................................................................................... 10 3.6 Reasons for delays in discharge ............................................................... 10
4. Operational Residential Aged Care Facilities ........................................... 14
5. Discussion ............................................................................................... 15
RTI R
elea
se
RTI Page No. 22DOH-DL 17/18-031
Long Stay Older Patients Census – Summary Report - iv -
For internal use only. Due to potential confidentiality issues, permission should be sought from the Strategic Policy Unit before content is shared or reproduced in whole or part.
Figures Figure 1 POPULATION AGED 65 YEARS AND OVER, Statistical Areas Level
2, Queensland - 30 June 2014 .................................................................... 2
Tables Table 1 Estimated Resident Population of Queensland as at June 2014 ................. 3 Table 2 Number of LSOPs by HHS and Mater Health Service ................................. 6 Table 3 Number of LSOPs in HHSs and Mater Health Service 2014, 2015 &
2016 ........................................................................................................... 7 Table 4 Number of LSOPs in Queensland 2006, 2012, 2013, 2014 & 2016* ........... 7 Table 5 Occupied Bed Days for LSOPs between date considered safe for
discharge if appropriate aged care services in place and census date 2014 and 2016 ............................................................................................ 8
Table 6 Number and Percentage of LSOPs by AGSC-RA Category 2016 All Facilities ..................................................................................................... 8
Table 7 Number and Percentage of LSOPs by AGSC-RA Category 2014 & 2016 (Acute Facilities Only) ........................................................................ 9
Table 8 Total OBDs by AGSC-RA Category from Safe to Discharge Date to Census Date 2016 ...................................................................................... 9
Table 9 Age Group of LSOPs 2014 & 2016 ........................................................... 10 Table 10 OBD per age group for the 2014 & 2016 ................................................... 10 Table 11 Reasons for delays in discharge and impact on OBDs 2014 ..................... 11 Table 12 Reasons for delays in discharge and impact on OBDs 2016 (Acute
Facilities Only) .......................................................................................... 11 Table 13 Reasons for delays in discharge by HHS and impact on OBDs (in
order of most OBDs) from all facilities in the 2016 census. ....................... 12 Table 14 Operational Residential Care Places at 30 June 2015 .............................. 14
RTI R
elea
se
RTI Page No. 23DOH-DL 17/18-031
Long Stay Older Patients Census – Summary Report - 1 -
For internal use only. Due to potential confidentiality issues, permission should be sought from the Strategic Policy Unit before content is shared or reproduced in whole or part.
1. Background On 18 May 2016, a statewide census of public patients who met the criteria to be recognised as long stay older patients (LSOPs) was conducted in Queensland. This included all public hospitals and private hospitals where beds are purchased for public patients (for example the Mater Adult Hospital in Brisbane).
The last manual census was undertaken on 22 October 2014, with results included in this report to compare with the 2016 census. The LSOP Censuses of 2011-12 and 2012-13 were undertaken as part of the National Partnership Agreement on Financial Assistance for Long Stay Older Patients (NPA LSOP). The NPA LSOP was established between the Commonwealth and States and Territories in recognition that they have a mutual interest in improving outcomes in relation to LSOPs and need to work together to achieve those outcomes.
The NPA LSOP provided a funding contribution from the Commonwealth Government to State and Territory Governments in recognition that some older people in public hospitals, who have finished acute and post-acute care and have been assessed as being suitable for Commonwealth aged care, remain in hospital longer than would otherwise be necessary while they secure an appropriate community or residential aged care place. The NPA LSOP expired on 30 June 2012, however the Queensland Department of Health has continued to regularly undertake the census in order to monitor the ongoing issue of LSOPs in Queensland’s public facilities.
On 21 October 2015, a data matching exercise to identify public patients who met the criteria to be recognised as LSOPs was undertaken. This exercise was conducted by Statistical Services Branch through a data matching process between data held in the Queensland Health Admitted Patient Data Collection and Aged Care Evaluation Database. This methodology was trialled to determine whether existing data sets could be used to exact the data in place of the manual census.
Benefits of the data matching exercise is the possible increase in the quality of the data collected (versus the manual collection of data); and the ability to replicate the data matching exercise across the year to test for seasonal variation. The drawbacks of the data matching exercise is that although the data quality is reliable (the data matches the search criteria) the data set maybe incomplete as the data matching criteria is limited compared with manually determining exclusion and inclusion of patients. The manual census also allows for collection of additional qualitative data such as the reason for delay in discharge.
1.1 Older People in Queensland The Australian Bureau of Statistics reports that in the five years to June 2014, the number of people aged 65 years and over in Queensland increased by 124,300 people to reach 659,800, accounting for 14 percent of the state’s population.1 Figure 1 shows the
1 Australian Bureau of Statistics. Population by Aged and Sex, Regions in Australia, 2014. (Cat. No. 3235.0)
RTI R
elea
se
RTI Page No. 24DOH-DL 17/18-031
Long Stay Older Patients Census – Summary Report - 2 -
For internal use only. Due to potential confidentiality issues, permission should be sought from the Strategic Policy Unit before content is shared or reproduced in whole or part.
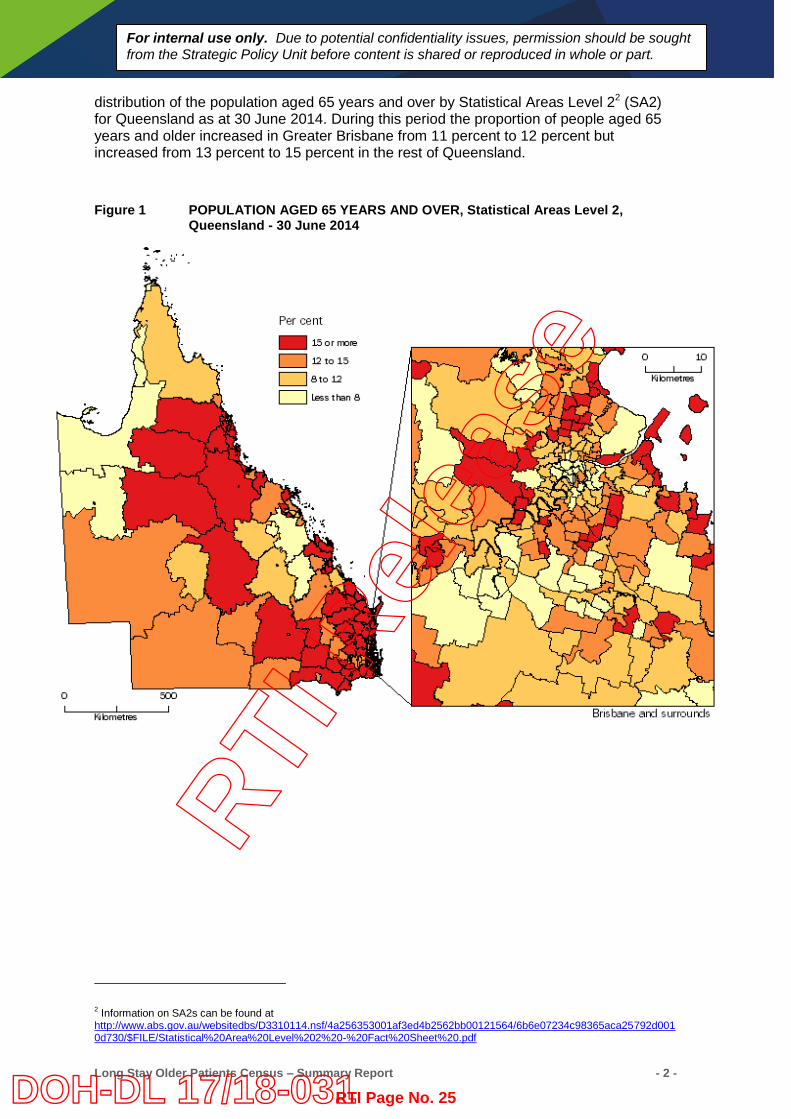
distribution of the population aged 65 years and over by Statistical Areas Level 22 (SA2) for Queensland as at 30 June 2014. During this period the proportion of people aged 65 years and older increased in Greater Brisbane from 11 percent to 12 percent but increased from 13 percent to 15 percent in the rest of Queensland. Figure 1 POPULATION AGED 65 YEARS AND OVER, Statistical Areas Level 2,
Queensland - 30 June 2014
2 Information on SA2s can be found at http://www.abs.gov.au/websitedbs/D3310114.nsf/4a256353001af3ed4b2562bb00121564/6b6e07234c98365aca25792d0010d730/$FILE/Statistical%20Area%20Level%202%20-%20Fact%20Sheet%20.pdf
RTI R
elea
se
RTI Page No. 25DOH-DL 17/18-031
Long Stay Older Patients Census – Summary Report - 3 -
For internal use only. Due to potential confidentiality issues, permission should be sought from the Strategic Policy Unit before content is shared or reproduced in whole or part.
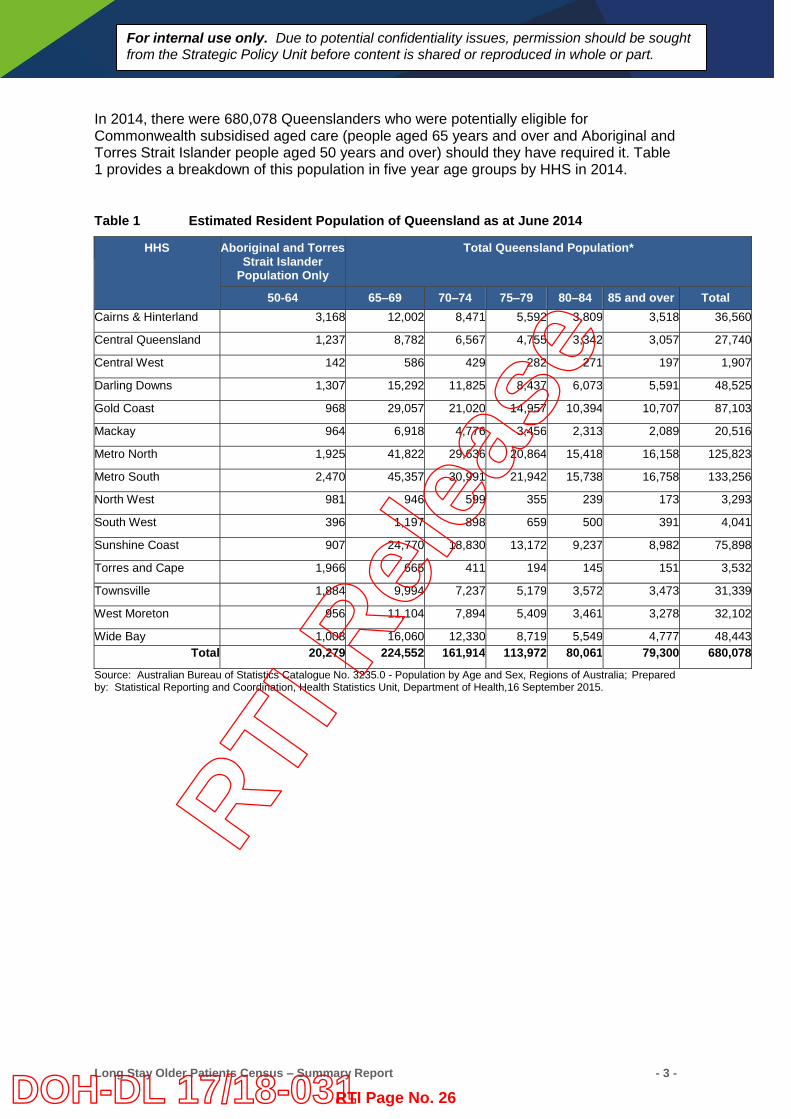
In 2014, there were 680,078 Queenslanders who were potentially eligible for Commonwealth subsidised aged care (people aged 65 years and over and Aboriginal and Torres Strait Islander people aged 50 years and over) should they have required it. Table 1 provides a breakdown of this population in five year age groups by HHS in 2014.
Table 1 Estimated Resident Population of Queensland as at June 2014
HHS Aboriginal and Torres Strait Islander
Population Only
Total Queensland Population*
50-64 65–69 70–74 75–79 80–84 85 and over Total Cairns & Hinterland 3,168 12,002 8,471 5,592 3,809 3,518 36,560
Central Queensland 1,237 8,782 6,567 4,755 3,342 3,057 27,740
Central West 142 586 429 282 271 197 1,907
Darling Downs 1,307 15,292 11,825 8,437 6,073 5,591 48,525
Gold Coast 968 29,057 21,020 14,957 10,394 10,707 87,103
Mackay 964 6,918 4,776 3,456 2,313 2,089 20,516
Metro North 1,925 41,822 29,636 20,864 15,418 16,158 125,823
Metro South 2,470 45,357 30,991 21,942 15,738 16,758 133,256
North West 981 946 599 355 239 173 3,293
South West 396 1,197 898 659 500 391 4,041
Sunshine Coast 907 24,770 18,830 13,172 9,237 8,982 75,898
Torres and Cape 1,966 665 411 194 145 151 3,532
Townsville 1,884 9,994 7,237 5,179 3,572 3,473 31,339
West Moreton 956 11,104 7,894 5,409 3,461 3,278 32,102
Wide Bay 1,008 16,060 12,330 8,719 5,549 4,777 48,443 Total 20,279 224,552 161,914 113,972 80,061 79,300 680,078
Source: Australian Bureau of Statistics Catalogue No. 3235.0 - Population by Age and Sex, Regions of Australia; Prepared by: Statistical Reporting and Coordination, Health Statistics Unit, Department of Health,16 September 2015.
RTI R
elea
se
RTI Page No. 26DOH-DL 17/18-031
Long Stay Older Patients Census – Summary Report - 4 -
For internal use only. Due to potential confidentiality issues, permission should be sought from the Strategic Policy Unit before content is shared or reproduced in whole or part.
2. Methodology
2.1 Overview On 22 April 2016 a memo was sent to 15 of Queensland’s16 HHSs (excluding Children’s Health Queensland), plus the Mater Health Service, requesting they nominate a single contact to coordinate the collection of census data from relevant facilities in their HHS. Nominated contacts were subsequently sent a data collection tool, including guidelines for how to complete the census, and were asked to send this onto relevant facilities within their HHS for completion on the census date of 18 May 2016. Each HHS contact then collated the data sets from their HHS and returned to Strategic Policy Unit for data verification and analysis.
2.2 Inclusion Criteria The Queensland Department of Health conducted a LSOP census on Wednesday 18 May 2016 to identify the number of older patients in all metropolitan, regional, rural and remote public hospitals who no longer require acute inpatient, post-acute care or sub-acute care but who have been unable to return to the community because a residential place or community aged care package is not yet available. This includes public patients, funded by the Queensland Department of Health, who are receiving care in non-government facilities while they are waiting placement in a residential aged care facility (RACF) such as those receiving publicly funded interim/maintenance care in a private hospital.
The criteria for inclusion in the census count were publicly funded patients:
who were aged 65 years or over (or 50 years or over for Aboriginal and Torres Strait Islander people); and
had been assessed by an Aged Care Assessment Team (ACAT) as being eligible for permanent aged care services (residential care or community packaged care) and unable to return to the community without that care in place; and
no longer needed inpatient acute or post/sub-acute care and are declared medically ready for discharge if the appropriate aged care services were available.
2.3 Exclusions Not all the data submitted by Queensland’s Hospital and Health Services could be included in the census count. The reason for excluding some patients was because they were:
eligible for aged care but whose ACAT approval had not been finalised by the census date even though the ACAT assessment might have been completed; or
long stay public patients but were not in the right age category; or still receiving some form of acute or sub-acute care as an admitted public patient.
RTI R
elea
se
RTI Page No. 27DOH-DL 17/18-031
Long Stay Older Patients Census – Summary Report - 5 -
For internal use only. Due to potential confidentiality issues, permission should be sought from the Strategic Policy Unit before content is shared or reproduced in whole or part.
2.4 Data Verification and Analysis The data in each census received from the HHS’s nominated contact was checked to ensure the patient met the inclusion criteria and was further verified with the HHS contact when discrepancies were identified. The verified data was then collated into a single data base and similar analyses were conducted to the 2014 census report to allow comparisons across the years.
2.5 Census Data Limitations There are a number of limitations to be aware of regarding the integrity of the data collected and the ability to compare the data sets with previous years of census data. The data is collected by multiple staff members across the HHS facilities, and for each facility the data for successive censuses may be collected by different staff members. This means that a range of interpretations of the census guidelines and inclusion criteria may have been applied to the data collection task across facilities and from year to year. Consequently, there is potential for inconsistencies in the identification of people who meet the census criteria.
While HHSs took due care in completing the census and the Excel template assisted in ensuring the integrity of the patient data entered was consistent; HHSs applied different methodologies for identifying patients in their facilities who no longer needed inpatient acute or post-sub-acute care. Different methodologies included running searches of hospital databases; manual reviews of patient charts; and other locally available information.
Another limitation is acknowledging that the census is a point in time measure and may be subject to seasonal variability. For example, the 2014 census was conducted in October 2014, while the 2016 census was conducted in May 2016.
RTI R
elea
se
RTI Page No. 28DOH-DL 17/18-031
Long Stay Older Patients Census – Summary Report - 6 -
For internal use only. Due to potential confidentiality issues, permission should be sought from the Strategic Policy Unit before content is shared or reproduced in whole or part.
3. Results for the 2016 Queensland LSOP Census
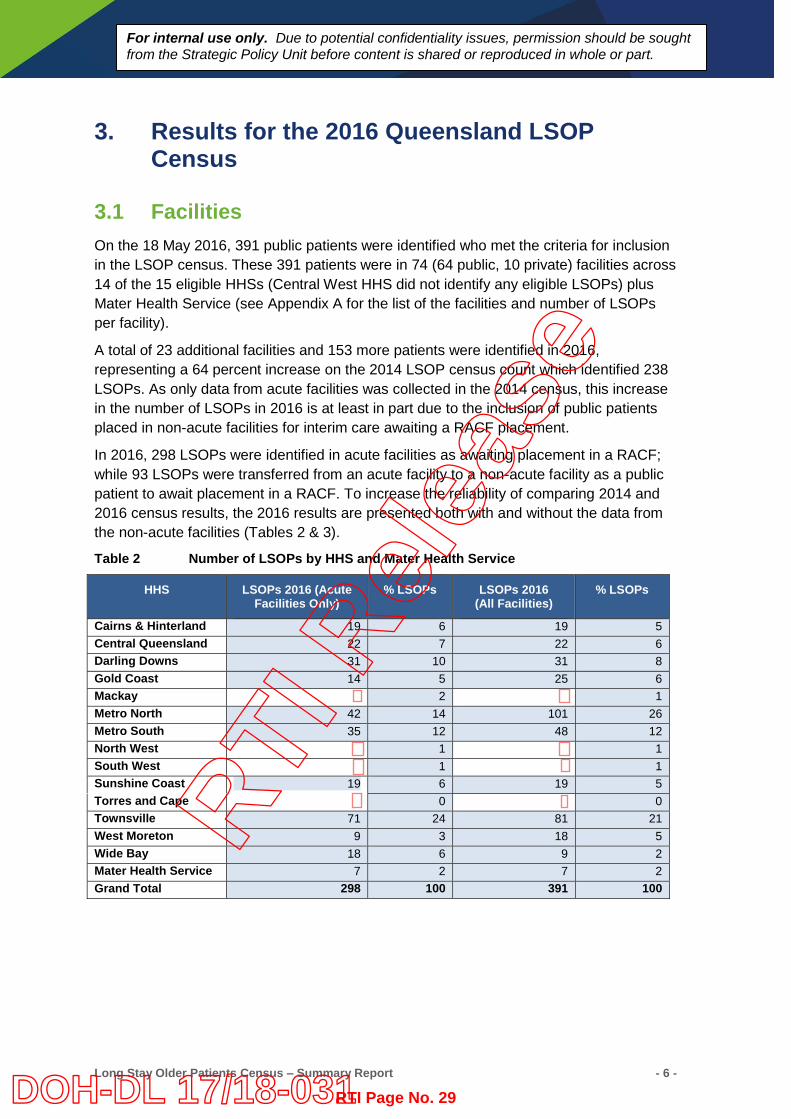
3.1 Facilities On the 18 May 2016, 391 public patients were identified who met the criteria for inclusion in the LSOP census. These 391 patients were in 74 (64 public, 10 private) facilities across 14 of the 15 eligible HHSs (Central West HHS did not identify any eligible LSOPs) plus Mater Health Service (see Appendix A for the list of the facilities and number of LSOPs per facility).
A total of 23 additional facilities and 153 more patients were identified in 2016, representing a 64 percent increase on the 2014 LSOP census count which identified 238 LSOPs. As only data from acute facilities was collected in the 2014 census, this increase in the number of LSOPs in 2016 is at least in part due to the inclusion of public patients placed in non-acute facilities for interim care awaiting a RACF placement.
In 2016, 298 LSOPs were identified in acute facilities as awaiting placement in a RACF; while 93 LSOPs were transferred from an acute facility to a non-acute facility as a public patient to await placement in a RACF. To increase the reliability of comparing 2014 and 2016 census results, the 2016 results are presented both with and without the data from the non-acute facilities (Tables 2 & 3).
Table 2 Number of LSOPs by HHS and Mater Health Service
HHS LSOPs 2016 (Acute Facilities Only)
% LSOPs LSOPs 2016 (All Facilities)
% LSOPs
Cairns & Hinterland 19 6 19 5 Central Queensland 22 7 22 6 Darling Downs 31 10 31 8 Gold Coast 14 5 25 6 Mackay 2 1 Metro North 42 14 101 26 Metro South 35 12 48 12 North West 1 1 South West 1 1 Sunshine Coast 19 6 19 5 Torres and Cape 0 0 Townsville 71 24 81 21 West Moreton 9 3 18 5 Wide Bay 18 6 9 2 Mater Health Service 7 2 7 2 Grand Total 298 100 391 100
RTI R
elea
se
RTI Page No. 29DOH-DL 17/18-031
Long Stay Older Patients Census – Summary Report - 7 -
For internal use only. Due to potential confidentiality issues, permission should be sought from the Strategic Policy Unit before content is shared or reproduced in whole or part.
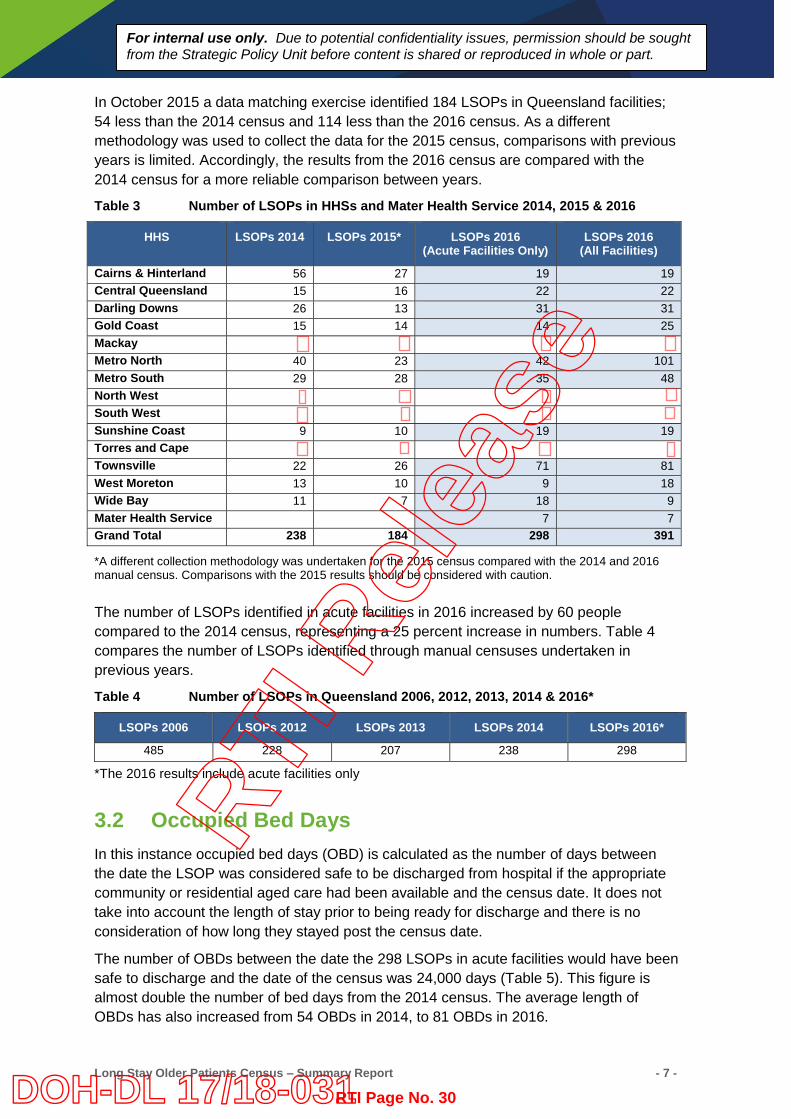
In October 2015 a data matching exercise identified 184 LSOPs in Queensland facilities; 54 less than the 2014 census and 114 less than the 2016 census. As a different methodology was used to collect the data for the 2015 census, comparisons with previous years is limited. Accordingly, the results from the 2016 census are compared with the 2014 census for a more reliable comparison between years.
Table 3 Number of LSOPs in HHSs and Mater Health Service 2014, 2015 & 2016
HHS LSOPs 2014 LSOPs 2015* LSOPs 2016 (Acute Facilities Only)
LSOPs 2016 (All Facilities)
Cairns & Hinterland 56 27 19 19 Central Queensland 15 16 22 22 Darling Downs 26 13 31 31 Gold Coast 15 14 14 25 Mackay
Metro North 40 23 42 101 Metro South 29 28 35 48 North West
South West Sunshine Coast 9 10 19 19 Torres and Cape Townsville 22 26 71 81 West Moreton 13 10 9 18 Wide Bay 11 7 18 9 Mater Health Service 7 7 Grand Total 238 184 298 391
*A different collection methodology was undertaken for the 2015 census compared with the 2014 and 2016 manual census. Comparisons with the 2015 results should be considered with caution.
The number of LSOPs identified in acute facilities in 2016 increased by 60 people compared to the 2014 census, representing a 25 percent increase in numbers. Table 4 compares the number of LSOPs identified through manual censuses undertaken in previous years.
Table 4 Number of LSOPs in Queensland 2006, 2012, 2013, 2014 & 2016*
LSOPs 2006 LSOPs 2012 LSOPs 2013 LSOPs 2014 LSOPs 2016*
485 228 207 238 298
*The 2016 results include acute facilities only
3.2 Occupied Bed Days In this instance occupied bed days (OBD) is calculated as the number of days between the date the LSOP was considered safe to be discharged from hospital if the appropriate community or residential aged care had been available and the census date. It does not take into account the length of stay prior to being ready for discharge and there is no consideration of how long they stayed post the census date.
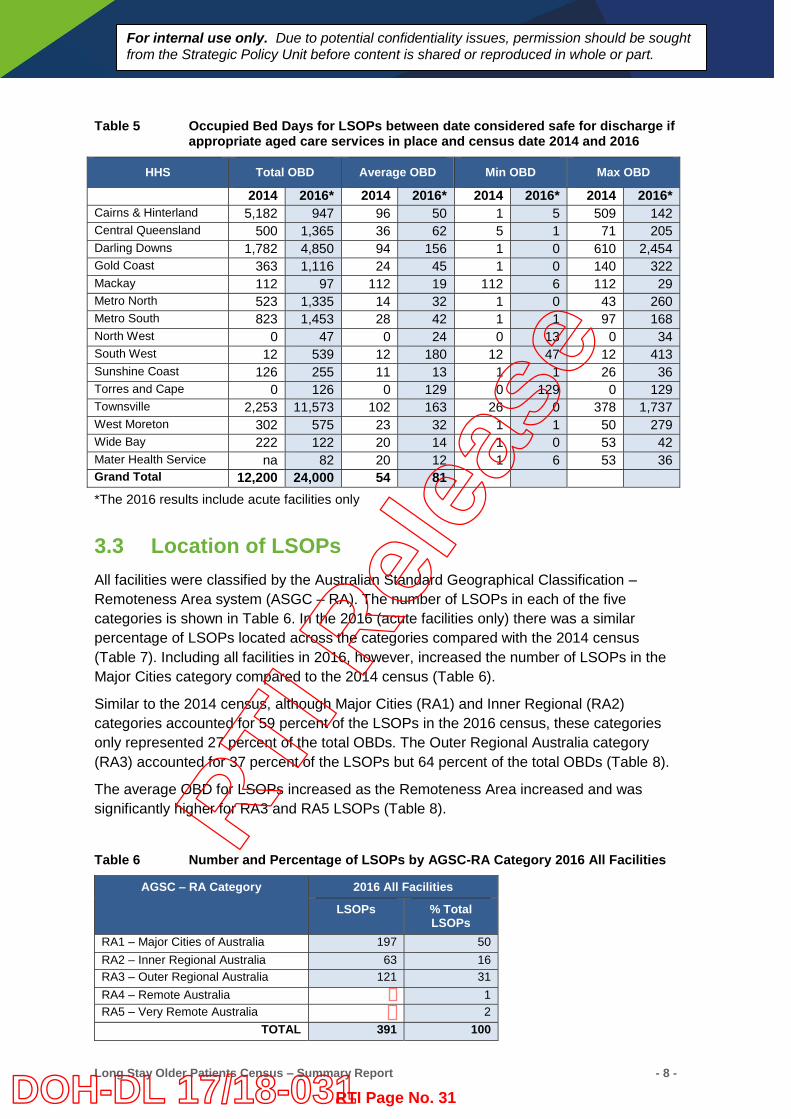
The number of OBDs between the date the 298 LSOPs in acute facilities would have been safe to discharge and the date of the census was 24,000 days (Table 5). This figure is almost double the number of bed days from the 2014 census. The average length of OBDs has also increased from 54 OBDs in 2014, to 81 OBDs in 2016.
RTI R
elea
se
RTI Page No. 30DOH-DL 17/18-031
Long Stay Older Patients Census – Summary Report - 8 -
For internal use only. Due to potential confidentiality issues, permission should be sought from the Strategic Policy Unit before content is shared or reproduced in whole or part.
Table 5 Occupied Bed Days for LSOPs between date considered safe for discharge if
appropriate aged care services in place and census date 2014 and 2016
HHS Total OBD Average OBD Min OBD Max OBD
2014 2016* 2014 2016* 2014 2016* 2014 2016* Cairns & Hinterland 5,182 947 96 50 1 5 509 142 Central Queensland 500 1,365 36 62 5 1 71 205 Darling Downs 1,782 4,850 94 156 1 0 610 2,454 Gold Coast 363 1,116 24 45 1 0 140 322 Mackay 112 97 112 19 112 6 112 29 Metro North 523 1,335 14 32 1 0 43 260 Metro South 823 1,453 28 42 1 1 97 168 North West 0 47 0 24 0 13 0 34 South West 12 539 12 180 12 47 12 413 Sunshine Coast 126 255 11 13 1 1 26 36 Torres and Cape 0 126 0 129 0 129 0 129 Townsville 2,253 11,573 102 163 26 0 378 1,737 West Moreton 302 575 23 32 1 1 50 279 Wide Bay 222 122 20 14 1 0 53 42 Mater Health Service na 82 20 12 1 6 53 36 Grand Total 12,200 24,000 54 81 *The 2016 results include acute facilities only
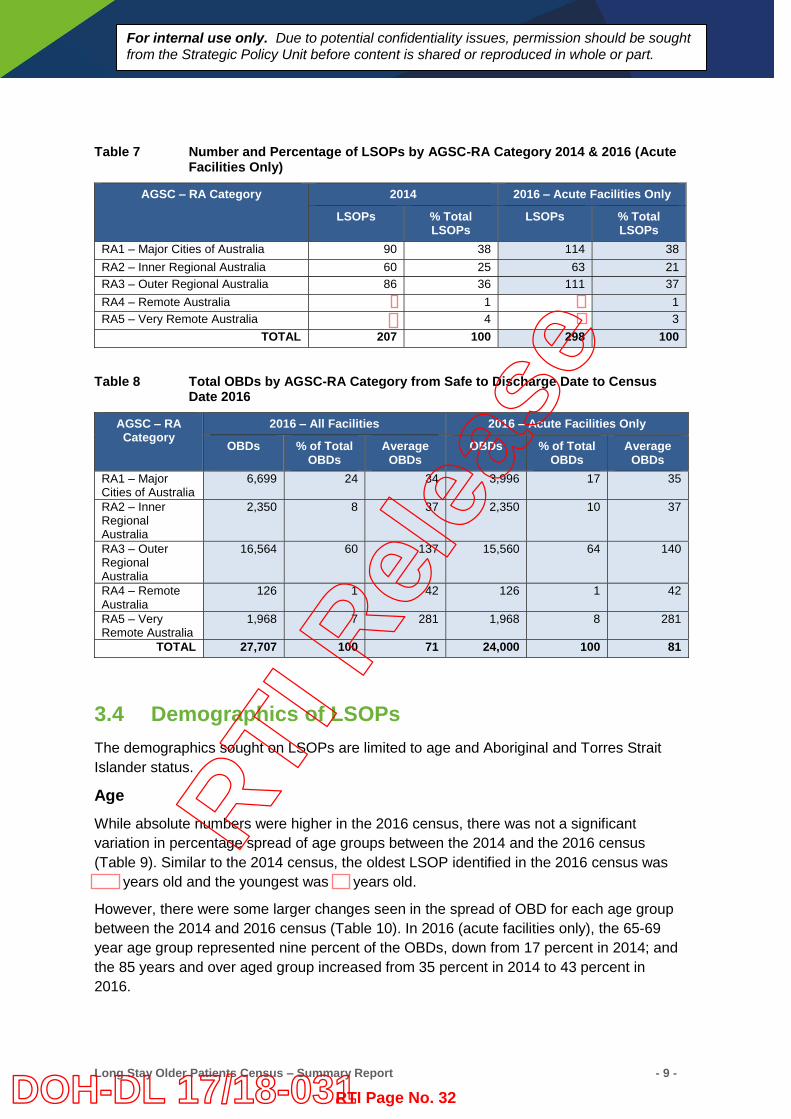
3.3 Location of LSOPs All facilities were classified by the Australian Standard Geographical Classification – Remoteness Area system (ASGC – RA). The number of LSOPs in each of the five categories is shown in Table 6. In the 2016 (acute facilities only) there was a similar percentage of LSOPs located across the categories compared with the 2014 census (Table 7). Including all facilities in 2016, however, increased the number of LSOPs in the Major Cities category compared to the 2014 census (Table 6).
Similar to the 2014 census, although Major Cities (RA1) and Inner Regional (RA2) categories accounted for 59 percent of the LSOPs in the 2016 census, these categories only represented 27 percent of the total OBDs. The Outer Regional Australia category (RA3) accounted for 37 percent of the LSOPs but 64 percent of the total OBDs (Table 8).
The average OBD for LSOPs increased as the Remoteness Area increased and was significantly higher for RA3 and RA5 LSOPs (Table 8).
Table 6 Number and Percentage of LSOPs by AGSC-RA Category 2016 All Facilities
AGSC – RA Category 2016 All Facilities
LSOPs % Total LSOPs
RA1 – Major Cities of Australia 197 50 RA2 – Inner Regional Australia 63 16 RA3 – Outer Regional Australia 121 31 RA4 – Remote Australia 1 RA5 – Very Remote Australia 2
TOTAL 391 100
RTI R
elea
se
RTI Page No. 31DOH-DL 17/18-031
Long Stay Older Patients Census – Summary Report - 9 -
For internal use only. Due to potential confidentiality issues, permission should be sought from the Strategic Policy Unit before content is shared or reproduced in whole or part.
Table 7 Number and Percentage of LSOPs by AGSC-RA Category 2014 & 2016 (Acute Facilities Only)
AGSC – RA Category 2014 2016 – Acute Facilities Only
LSOPs % Total LSOPs
LSOPs % Total LSOPs
RA1 – Major Cities of Australia 90 38 114 38 RA2 – Inner Regional Australia 60 25 63 21 RA3 – Outer Regional Australia 86 36 111 37 RA4 – Remote Australia 1 1 RA5 – Very Remote Australia 4 3
TOTAL 207 100 298 100
Table 8 Total OBDs by AGSC-RA Category from Safe to Discharge Date to Census Date 2016
AGSC – RA Category
2016 – All Facilities 2016 – Acute Facilities Only
OBDs % of Total OBDs
Average OBDs
OBDs % of Total OBDs
Average OBDs
RA1 – Major Cities of Australia
6,699 24 34
3,996 17 35
RA2 – Inner Regional Australia
2,350 8 37 2,350 10 37
RA3 – Outer Regional Australia
16,564 60 137 15,560 64 140
RA4 – Remote Australia
126 1 42 126 1 42
RA5 – Very Remote Australia
1,968 7 281 1,968 8 281
TOTAL 27,707 100 71 24,000 100 81
3.4 Demographics of LSOPs The demographics sought on LSOPs are limited to age and Aboriginal and Torres Strait Islander status.
Age While absolute numbers were higher in the 2016 census, there was not a significant variation in percentage spread of age groups between the 2014 and the 2016 census (Table 9). Similar to the 2014 census, the oldest LSOP identified in the 2016 census was
years old and the youngest was years old.
However, there were some larger changes seen in the spread of OBD for each age group between the 2014 and 2016 census (Table 10). In 2016 (acute facilities only), the 65-69 year age group represented nine percent of the OBDs, down from 17 percent in 2014; and the 85 years and over aged group increased from 35 percent in 2014 to 43 percent in 2016.
RTI R
elea
se
RTI Page No. 32DOH-DL 17/18-031
Long Stay Older Patients Census – Summary Report - 10 -
For internal use only. Due to potential confidentiality issues, permission should be sought from the Strategic Policy Unit before content is shared or reproduced in whole or part.
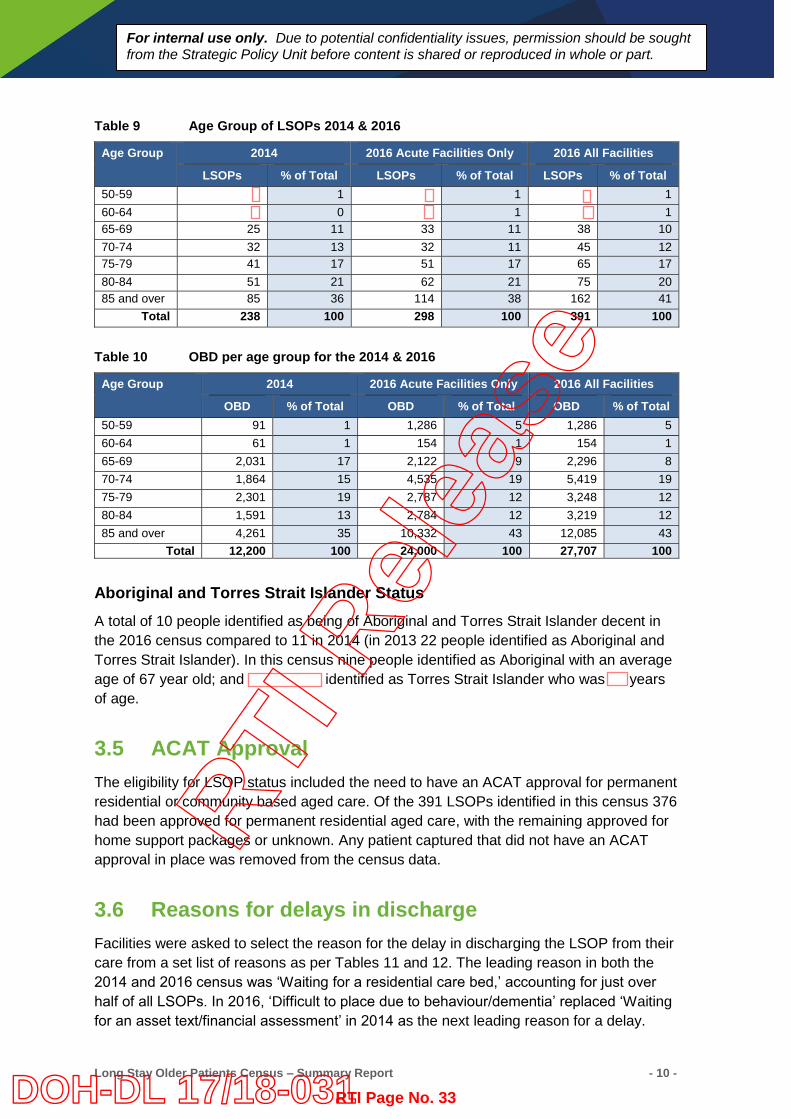
Table 9 Age Group of LSOPs 2014 & 2016
Age Group 2014 2016 Acute Facilities Only 2016 All Facilities
LSOPs % of Total LSOPs % of Total LSOPs % of Total 50-59 1 1 1 60-64 0 1 1 65-69 25 11 33 11 38 10 70-74 32 13 32 11 45 12 75-79 41 17 51 17 65 17 80-84 51 21 62 21 75 20 85 and over 85 36 114 38 162 41
Total 238 100 298 100 391 100
Table 10 OBD per age group for the 2014 & 2016
Age Group 2014 2016 Acute Facilities Only 2016 All Facilities
OBD % of Total OBD % of Total OBD % of Total 50-59 91 1 1,286 5 1,286 5 60-64 61 1 154 1 154 1 65-69 2,031 17 2,122 9 2,296 8 70-74 1,864 15 4,535 19 5,419 19 75-79 2,301 19 2,787 12 3,248 12 80-84 1,591 13 2,784 12 3,219 12 85 and over 4,261 35 10,332 43 12,085 43
Total 12,200 100 24,000 100 27,707 100
Aboriginal and Torres Strait Islander Status A total of 10 people identified as being of Aboriginal and Torres Strait Islander decent in the 2016 census compared to 11 in 2014 (in 2013 22 people identified as Aboriginal and Torres Strait Islander). In this census nine people identified as Aboriginal with an average age of 67 year old; and identified as Torres Strait Islander who was years of age.
3.5 ACAT Approval The eligibility for LSOP status included the need to have an ACAT approval for permanent residential or community based aged care. Of the 391 LSOPs identified in this census 376 had been approved for permanent residential aged care, with the remaining approved for home support packages or unknown. Any patient captured that did not have an ACAT approval in place was removed from the census data.
3.6 Reasons for delays in discharge Facilities were asked to select the reason for the delay in discharging the LSOP from their care from a set list of reasons as per Tables 11 and 12. The leading reason in both the 2014 and 2016 census was ‘Waiting for a residential care bed,’ accounting for just over half of all LSOPs. In 2016, ‘Difficult to place due to behaviour/dementia’ replaced ‘Waiting for an asset text/financial assessment’ in 2014 as the next leading reason for a delay.
RTI R
elea
se
RTI Page No. 33DOH-DL 17/18-031
Long Stay Older Patients Census – Summary Report - 11 -
For internal use only. Due to potential confidentiality issues, permission should be sought from the Strategic Policy Unit before content is shared or reproduced in whole or part.
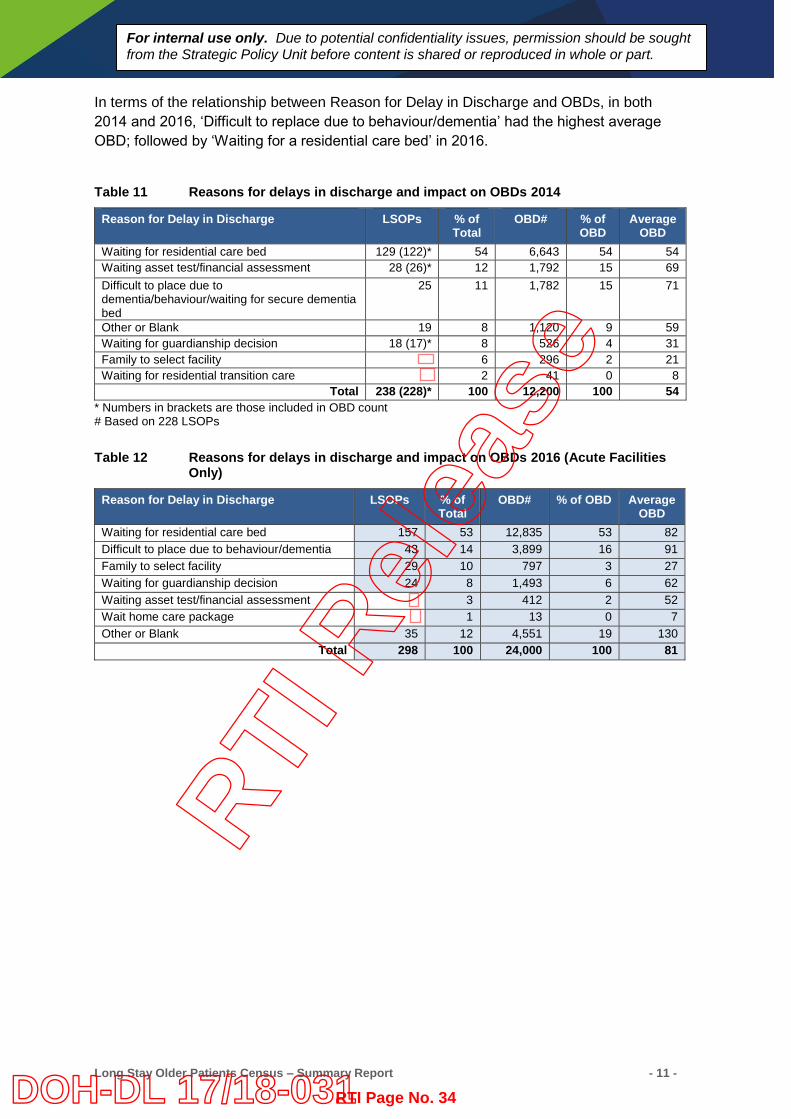
In terms of the relationship between Reason for Delay in Discharge and OBDs, in both 2014 and 2016, ‘Difficult to replace due to behaviour/dementia’ had the highest average OBD; followed by ‘Waiting for a residential care bed’ in 2016.
Table 11 Reasons for delays in discharge and impact on OBDs 2014
Reason for Delay in Discharge LSOPs % of Total
OBD# % of OBD
Average OBD
Waiting for residential care bed 129 (122)* 54 6,643 54 54 Waiting asset test/financial assessment 28 (26)* 12 1,792 15 69 Difficult to place due to dementia/behaviour/waiting for secure dementia bed
25 11 1,782 15 71
Other or Blank 19 8 1,120 9 59 Waiting for guardianship decision 18 (17)* 8 526 4 31 Family to select facility 6 296 2 21 Waiting for residential transition care 2 41 0 8
Total 238 (228)* 100 12,200 100 54 * Numbers in brackets are those included in OBD count # Based on 228 LSOPs
Table 12 Reasons for delays in discharge and impact on OBDs 2016 (Acute Facilities Only)
Reason for Delay in Discharge LSOPs % of Total
OBD# % of OBD Average OBD
Waiting for residential care bed 157 53 12,835 53 82 Difficult to place due to behaviour/dementia 43 14 3,899 16 91 Family to select facility 29 10 797 3 27 Waiting for guardianship decision 24 8 1,493 6 62 Waiting asset test/financial assessment 3 412 2 52 Wait home care package 1 13 0 7 Other or Blank 35 12 4,551 19 130
Total 298 100 24,000 100 81
RTI R
elea
se
RTI Page No. 34DOH-DL 17/18-031
Long Stay Older Patients Census – Summary Report - 12 -
For internal use only. Due to potential confidentiality issues, permission should be sought from the Strategic Policy Unit before content is shared or reproduced in whole or part.
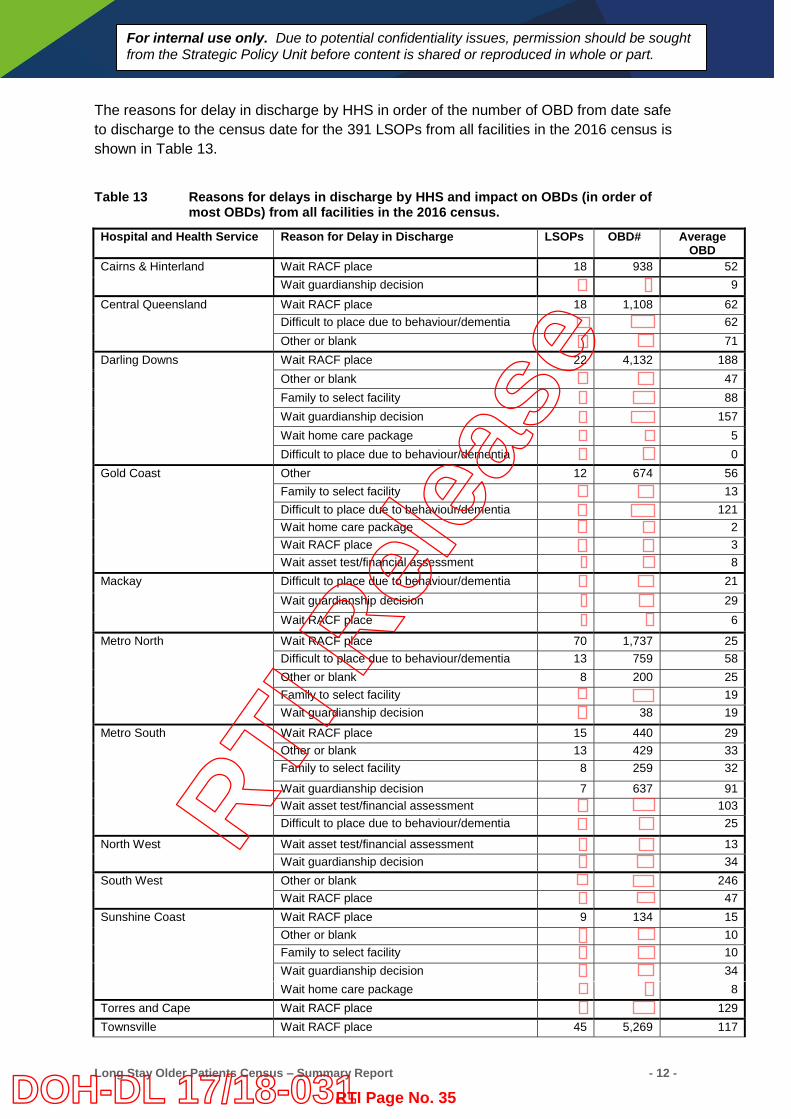
The reasons for delay in discharge by HHS in order of the number of OBD from date safe to discharge to the census date for the 391 LSOPs from all facilities in the 2016 census is shown in Table 13.
Table 13 Reasons for delays in discharge by HHS and impact on OBDs (in order of most OBDs) from all facilities in the 2016 census.
Hospital and Health Service Reason for Delay in Discharge LSOPs OBD# Average OBD
Cairns & Hinterland Wait RACF place 18 938 52 Wait guardianship decision 9
Central Queensland Wait RACF place 18 1,108 62 Difficult to place due to behaviour/dementia 62 Other or blank 71
Darling Downs Wait RACF place 22 4,132 188 Other or blank 47 Family to select facility 88 Wait guardianship decision 157 Wait home care package 5 Difficult to place due to behaviour/dementia 0
Gold Coast Other 12 674 56 Family to select facility 13 Difficult to place due to behaviour/dementia 121 Wait home care package 2 Wait RACF place 3 Wait asset test/financial assessment 8
Mackay Difficult to place due to behaviour/dementia 21 Wait guardianship decision 29 Wait RACF place 6
Metro North Wait RACF place 70 1,737 25 Difficult to place due to behaviour/dementia 13 759 58 Other or blank 8 200 25 Family to select facility 19 Wait guardianship decision 38 19
Metro South Wait RACF place 15 440 29 Other or blank 13 429 33 Family to select facility 8 259 32
Wait guardianship decision 7 637 91 Wait asset test/financial assessment 103 Difficult to place due to behaviour/dementia 25
North West Wait asset test/financial assessment 13 Wait guardianship decision 34
South West Other or blank 246 Wait RACF place 47
Sunshine Coast Wait RACF place 9 134 15 Other or blank 10 Family to select facility 10 Wait guardianship decision 34 Wait home care package 8
Torres and Cape Wait RACF place 129 Townsville Wait RACF place 45 5,269 117
RTI R
elea
se
RTI Page No. 35DOH-DL 17/18-031
Long Stay Older Patients Census – Summary Report - 13 -
For internal use only. Due to potential confidentiality issues, permission should be sought from the Strategic Policy Unit before content is shared or reproduced in whole or part.
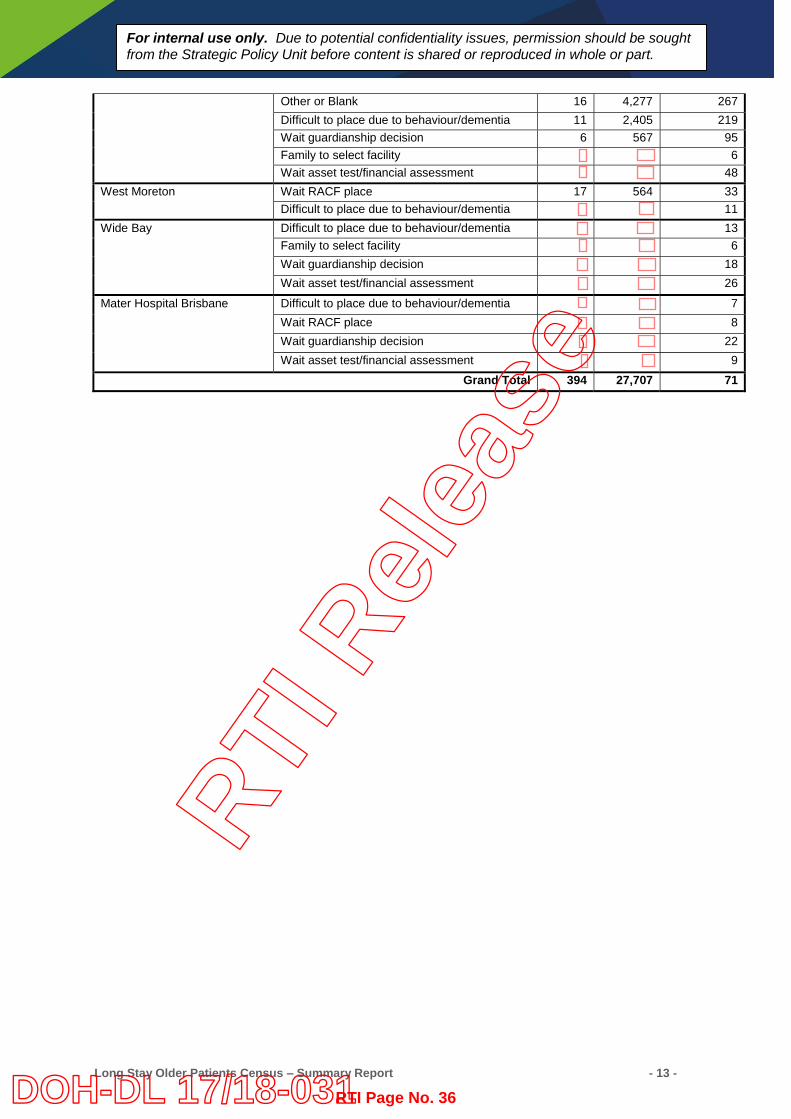
Other or Blank 16 4,277 267 Difficult to place due to behaviour/dementia 11 2,405 219 Wait guardianship decision 6 567 95 Family to select facility 6 Wait asset test/financial assessment 48
West Moreton Wait RACF place 17 564 33 Difficult to place due to behaviour/dementia 11
Wide Bay Difficult to place due to behaviour/dementia 13 Family to select facility 6 Wait guardianship decision 18 Wait asset test/financial assessment 26
Mater Hospital Brisbane Difficult to place due to behaviour/dementia 7 Wait RACF place 8 Wait guardianship decision 22 Wait asset test/financial assessment 9
Grand Total 394 27,707 71
RTI R
elea
se
RTI Page No. 36DOH-DL 17/18-031
Long Stay Older Patients Census – Summary Report - 14 -
For internal use only. Due to potential confidentiality issues, permission should be sought from the Strategic Policy Unit before content is shared or reproduced in whole or part.
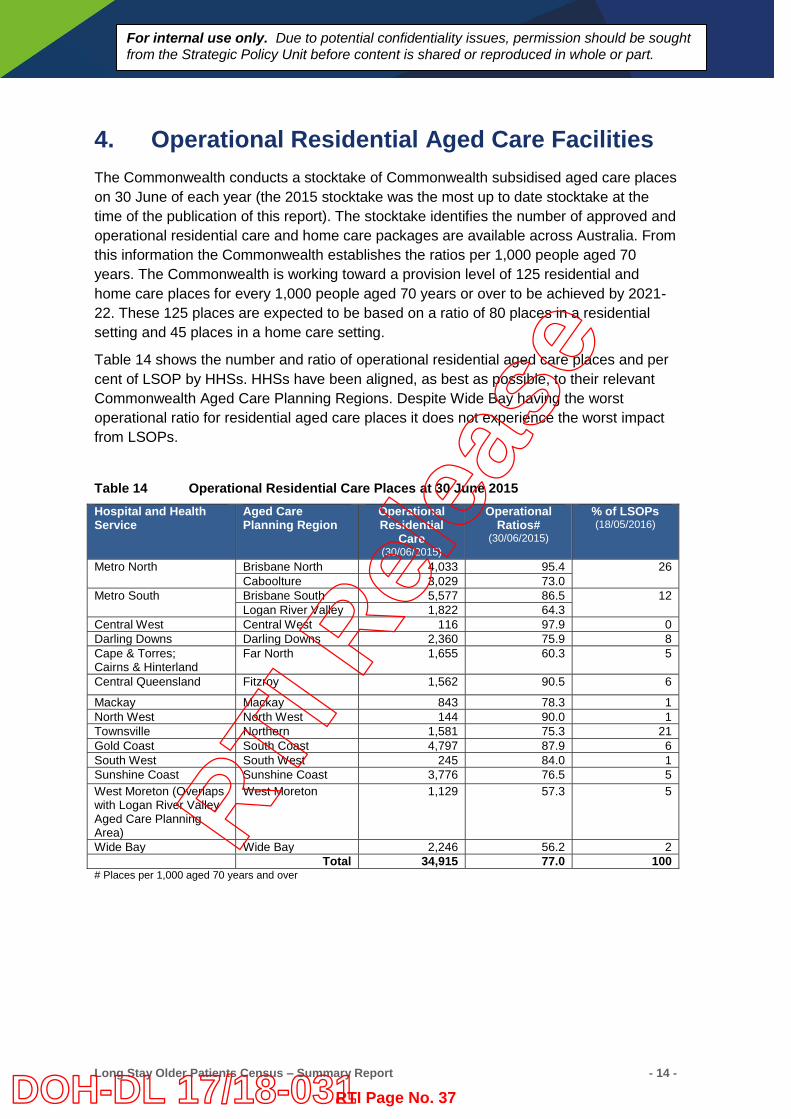
4. Operational Residential Aged Care Facilities The Commonwealth conducts a stocktake of Commonwealth subsidised aged care places on 30 June of each year (the 2015 stocktake was the most up to date stocktake at the time of the publication of this report). The stocktake identifies the number of approved and operational residential care and home care packages are available across Australia. From this information the Commonwealth establishes the ratios per 1,000 people aged 70 years. The Commonwealth is working toward a provision level of 125 residential and home care places for every 1,000 people aged 70 years or over to be achieved by 2021-22. These 125 places are expected to be based on a ratio of 80 places in a residential setting and 45 places in a home care setting.
Table 14 shows the number and ratio of operational residential aged care places and per cent of LSOP by HHSs. HHSs have been aligned, as best as possible, to their relevant Commonwealth Aged Care Planning Regions. Despite Wide Bay having the worst operational ratio for residential aged care places it does not experience the worst impact from LSOPs.
Table 14 Operational Residential Care Places at 30 June 2015 Hospital and Health Service
Aged Care Planning Region
Operational Residential
Care (30/06/2015)
Operational Ratios#
(30/06/2015)
% of LSOPs (18/05/2016)
Metro North Brisbane North 4,033 95.4 26 Caboolture 3,029 73.0
Metro South Brisbane South 5,577 86.5 12 Logan River Valley 1,822 64.3
Central West Central West 116 97.9 0 Darling Downs Darling Downs 2,360 75.9 8 Cape & Torres; Cairns & Hinterland
Far North 1,655 60.3 5
Central Queensland Fitzroy 1,562 90.5 6
Mackay Mackay 843 78.3 1 North West North West 144 90.0 1 Townsville Northern 1,581 75.3 21 Gold Coast South Coast 4,797 87.9 6 South West South West 245 84.0 1 Sunshine Coast Sunshine Coast 3,776 76.5 5 West Moreton (Overlaps with Logan River Valley Aged Care Planning Area)
West Moreton 1,129 57.3 5
Wide Bay Wide Bay 2,246 56.2 2 Total 34,915 77.0 100
# Places per 1,000 aged 70 years and over
RTI R
elea
se
RTI Page No. 37DOH-DL 17/18-031
Long Stay Older Patients Census – Summary Report - 15 -
For internal use only. Due to potential confidentiality issues, permission should be sought from the Strategic Policy Unit before content is shared or reproduced in whole or part.
5. Discussion The 2016 census identified the largest cohort of publicly funded LSOPs since the first census was conducted in 2006. Even after removing the data collected from non-acute facilities, the number of LSOPs increased by 25 percent from the 2014 census. These 2016 results further continue the upward trend of increasing numbers of LSOPs identified in 2013 and 2014 censuses. The 2016 results also showed that not only did the number of LSOPs increase but each LSOP stayed longer on average in Queensland facilities while they waited for an appropriate residential place or community aged care package.
The increase in LSOPs was not uniform across the HHSs and a couple of HHSs reported less LSOPs in 2016 compared to the 2014 census. Cairns and Hinterland HHS numbers fell by 66 percent (37 less LSOPs) the largest decrease across the HHSs. West Moreton saw a 30 percent decrease in numbers (4 less LSOPs) in 2016 but did have a small increase overall when looking at acute and non-acute facilities together. The largest increase across the HHSs was Townsville with over three times as many LSOPs in 2016 compared to 2014. Although the numbers were much smaller, Mackay and South West HHSs also had three times as many LSOPs in 2014 compared to 2016.
The location of LSOPs and geographical spread of LSOPs remained similar to the findings from the 2014 census. The 2014 and 2016 both revealed that as the remoteness area increased so did the average length of stay of the LSOP. In outer regional areas (RA3) this was on average four times longer than LSOPs in major cities or inner regional Queensland. These results reflect the issue of the availability of residential care places and/or community based services in outer regional locations across Queensland. Some discussions with outer regional services revealed that patients and families requested to stay in their local facility because they didn’t want to be transferred out of their town to the available residential bed in another locality.
The reasons for delays in discharge did change between the 2014 and 2016 and perhaps is reflective of other changing factors. While ‘waiting for a residential care bed’ remained the leading cause, ‘difficult to place due to dementia and behaviour’ replaced ‘waiting for an asset test’ as the next leading cause from 2014. As the Commonwealth introduced a new means test for residential and home care packages on 1 July 2014, it is possible this caused delays in discharging LSOPs when the census was undertaken in October 2014.
The dementia supplement for people in residential aged care facilities was removed from 31 July 2014 and it was noted in the 2014 census report that this decision could have an impact on delaying the discharge of LSOPs who have dementia or complex behaviours from hospital to residential aged care facilities. The 2016 census did reveal an increase in the number of LSOPs who were delayed due to this reason and an increase in their average length of stay compared to the 2014 census.
In summary, considering the increasing numbers of LSOPs identified in the 2016 census, it would be appropriate to continue the monitoring of LSOPs on a yearly basis and provide reports to the Queensland Minister for Health, the Department of Health executive and Hospital and Health Service Executives and Boards. This information can also be used to continue discussions with the Commonwealth Minister for Ageing and the Department of Social Services.
RTI R
elea
se
RTI Page No. 38DOH-DL 17/18-031
Long Stay Older Patients Census – Summary Report - 16 -
For internal use only. Due to potential confidentiality issues, permission should be sought from the Strategic Policy Unit before content is shared or reproduced in whole or part.
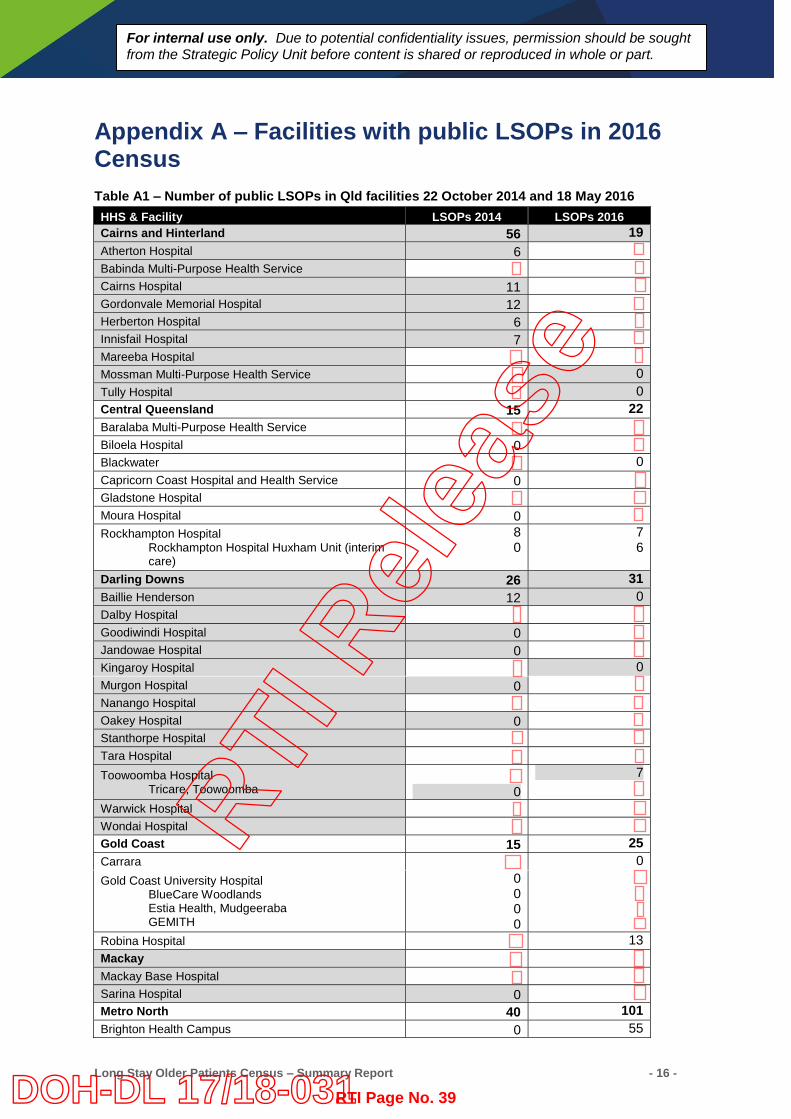
Appendix A – Facilities with public LSOPs in 2016 Census Table A1 – Number of public LSOPs in Qld facilities 22 October 2014 and 18 May 2016 HHS & Facility LSOPs 2014 LSOPs 2016 Cairns and Hinterland 56 19 Atherton Hospital 6 Babinda Multi-Purpose Health Service Cairns Hospital 11 Gordonvale Memorial Hospital 12 Herberton Hospital 6 Innisfail Hospital 7 Mareeba Hospital Mossman Multi-Purpose Health Service 0 Tully Hospital 0 Central Queensland 15 22 Baralaba Multi-Purpose Health Service Biloela Hospital 0 Blackwater 0 Capricorn Coast Hospital and Health Service 0 Gladstone Hospital Moura Hospital 0 Rockhampton Hospital
Rockhampton Hospital Huxham Unit (interim care)
8 0
7 6
Darling Downs 26 31 Baillie Henderson 12 0 Dalby Hospital Goodiwindi Hospital 0 Jandowae Hospital 0 Kingaroy Hospital 0 Murgon Hospital 0 Nanango Hospital Oakey Hospital 0 Stanthorpe Hospital Tara Hospital Toowoomba Hospital
Tricare, Toowoomba
0 7
Warwick Hospital Wondai Hospital Gold Coast 15 25 Carrara 0 Gold Coast University Hospital
BlueCare Woodlands Estia Health, Mudgeeraba GEMITH
0 0 0 0
Robina Hospital 13 Mackay Mackay Base Hospital Sarina Hospital 0 Metro North 40 101 Brighton Health Campus 0 55
RTI R
elea
se
RTI Page No. 39DOH-DL 17/18-031
Long Stay Older Patients Census – Summary Report - 17 -
For internal use only. Due to potential confidentiality issues, permission should be sought from the Strategic Policy Unit before content is shared or reproduced in whole or part.
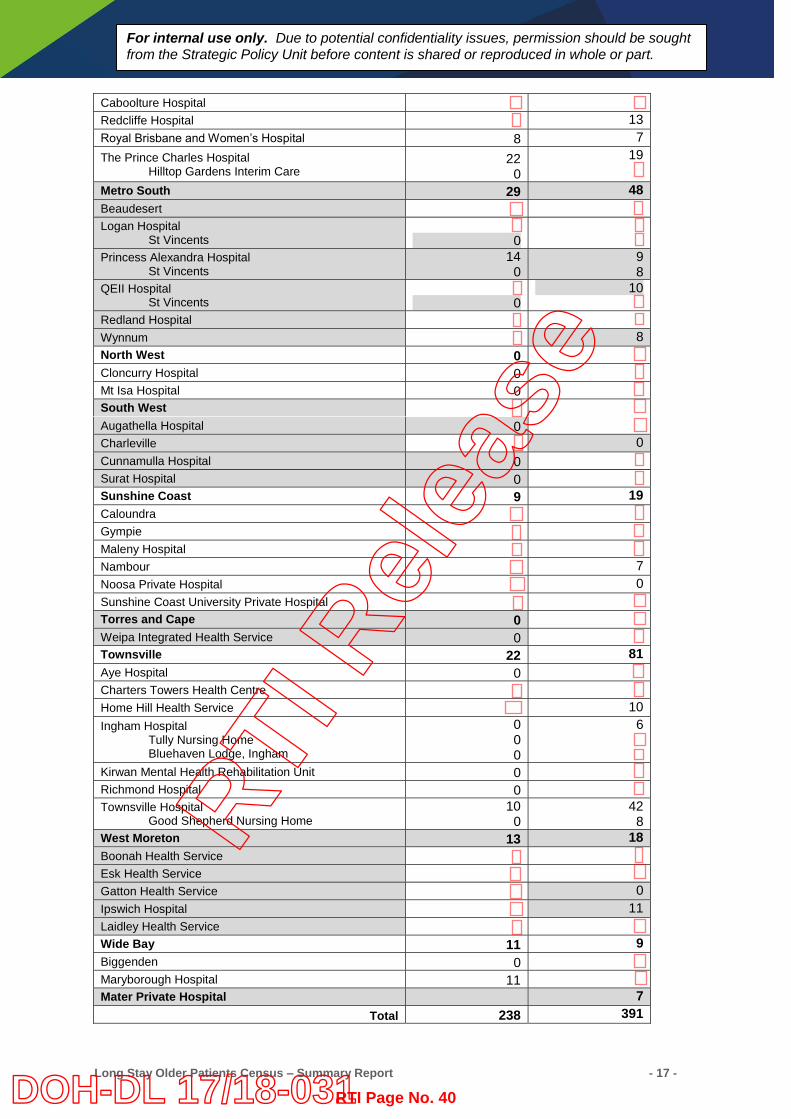
Caboolture Hospital Redcliffe Hospital 13 Royal Brisbane and Women’s Hospital 8 7 The Prince Charles Hospital
Hilltop Gardens Interim Care 22
0 19
Metro South 29 48 Beaudesert Logan Hospital
St Vincents
0
Princess Alexandra Hospital St Vincents
14 0
9 8
QEII Hospital St Vincents
0
10
Redland Hospital Wynnum 8 North West 0 Cloncurry Hospital 0 Mt Isa Hospital 0 South West Augathella Hospital 0 Charleville 0 Cunnamulla Hospital 0 Surat Hospital 0 Sunshine Coast 9 19 Caloundra Gympie Maleny Hospital Nambour 7 Noosa Private Hospital 0 Sunshine Coast University Private Hospital Torres and Cape 0 Weipa Integrated Health Service 0 Townsville 22 81 Aye Hospital 0 Charters Towers Health Centre Home Hill Health Service 10 Ingham Hospital
Tully Nursing Home Bluehaven Lodge, Ingham
0 0 0
6
Kirwan Mental Health Rehabilitation Unit 0 Richmond Hospital 0 Townsville Hospital
Good Shepherd Nursing Home 10
0 42
8 West Moreton 13 18 Boonah Health Service Esk Health Service Gatton Health Service 0 Ipswich Hospital 11 Laidley Health Service Wide Bay 11 9 Biggenden 0 Maryborough Hospital 11 Mater Private Hospital 7
Total 238 391
RTI R
elea
se
RTI Page No. 40DOH-DL 17/18-031
Long Stay Older Patients Census – Summary Report - 18 -
For internal use only. Due to potential confidentiality issues, permission should be sought from the Strategic Policy Unit before content is shared or reproduced in whole or part.
RTI R
elea
se
RTI Page No. 41DOH-DL 17/18-031
Summary: long stay older patients census results
2014 Strategic Policy Health Systems Innovation Branch Health Service and Clinical Innovation Division February 2015
RTI R
elea
se
RTI Page No. 42DOH-DL 17/18-031
For internal use only. Due to potential confidentiality issues, permission should be sought from the Strategic Policy Unit before content is shared or reproduced in whole or part.
1. Background On 22 October 2014 a census of public patients who meet the criteria to be recognised as long stay older patients (LSOPs) was conducted in Queensland. This included all public hospitals and private hospitals where beds are purchased for public patients (for example the Mater Adult Hospital in Brisbane). At total of 240 eligible pubic patients were identified in 49 public and two private facilities across 12 Hospital and Health Services in Queensland. 1.1. Definition of a Long Stay Older Patient A public patient is an LSOP when they meet the following criteria: is aged 65 years or over (or 50 years or over for Aboriginal and Torres Strait Islander people);
and has been assessed by an Aged Care Assessment Team (ACAT) as being eligible for
permanent aged care services (residential care or community packaged care) and are unable to return to the community without that care in place; and
no longer in need of inpatient acute or post/sub-acute care and are declared medically ready for discharge if the appropriate aged care services are available.
1.2. Exclusions Not all the data submitted by Queensland’s Hospital and Health Services could be included in the census count. The reason for excluding some patients was because they were: eligible for aged care but whose ACAT approval had not been finalised by the census date even
though the ACAT assessment might have been completed; or long stay public patients but were not in the right age category; or still receiving some form of acute or sub-acute care as an admitted public patient.
1.3. National Partnership Agreement on Financial Assistance for Long Stay
Older Patients The LSOP Census of 2011-12 and 2012-13 were undertaken as part of the National Partnership Agreement on Financial Assistance for Long Stay Older Patients (NPA LSOP). The NPA LSOP was established between the Commonwealth and States and Territories in recognition that they have a mutual interest in improving outcomes in relation to LSOPs and need to work together to achieve those outcomes. The NPA LSOP provided a funding contribution from the Commonwealth Government to State and Territory Governments in recognition that some older people in public hospitals who have finished acute and post-acute care and have been assessed as being suitable for Commonwealth aged care remain in hospital longer than would otherwise be necessary while they secure an appropriate community or residential aged care place. The NPA LSOP funding that was provided between 2011 and 2014 is listed in Table One. As the NPA LSOP has not been extended no funding will flow as a result of the 2014 census. RTI
Rel
ease
RTI Page No. 43DOH-DL 17/18-031
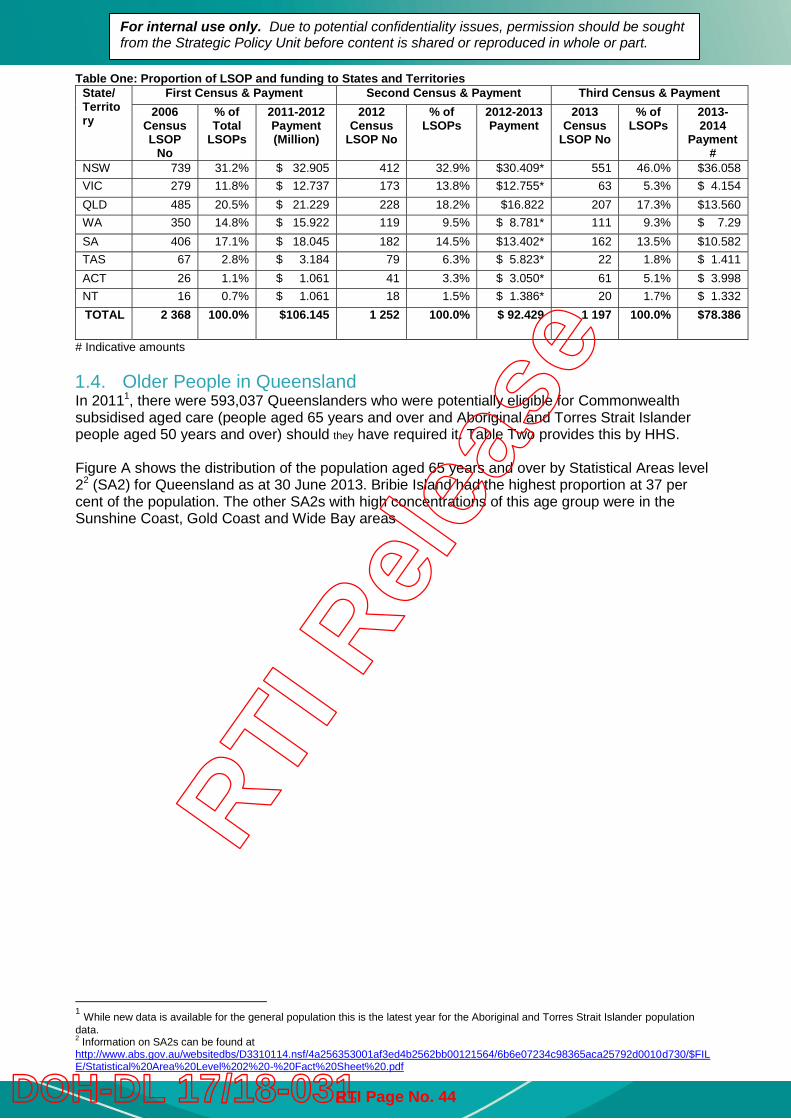
For internal use only. Due to potential confidentiality issues, permission should be sought from the Strategic Policy Unit before content is shared or reproduced in whole or part.
Table One: Proportion of LSOP and funding to States and Territories State/ Territory
First Census & Payment Second Census & Payment Third Census & Payment 2006
Census LSOP
No
% of Total
LSOPs
2011-2012 Payment (Million)
2012 Census
LSOP No
% of LSOPs
2012-2013 Payment
2013 Census
LSOP No
% of LSOPs
2013-2014
Payment#
NSW 739 31.2% $ 32.905 412 32.9% $30.409* 551 46.0% $36.058 VIC 279 11.8% $ 12.737 173 13.8% $12.755* 63 5.3% $ 4.154 QLD 485 20.5% $ 21.229 228 18.2% $16.822 207 17.3% $13.560 WA 350 14.8% $ 15.922 119 9.5% $ 8.781* 111 9.3% $ 7.29 SA 406 17.1% $ 18.045 182 14.5% $13.402* 162 13.5% $10.582 TAS 67 2.8% $ 3.184 79 6.3% $ 5.823* 22 1.8% $ 1.411 ACT 26 1.1% $ 1.061 41 3.3% $ 3.050* 61 5.1% $ 3.998 NT 16 0.7% $ 1.061 18 1.5% $ 1.386* 20 1.7% $ 1.332 TOTAL 2 368 100.0% $106.145 1 252 100.0% $ 92.429 1 197 100.0% $78.386
# Indicative amounts 1.4. Older People in Queensland In 20111, there were 593,037 Queenslanders who were potentially eligible for Commonwealth subsidised aged care (people aged 65 years and over and Aboriginal and Torres Strait Islander people aged 50 years and over) should they have required it. Table Two provides this by HHS. Figure A shows the distribution of the population aged 65 years and over by Statistical Areas level 22 (SA2) for Queensland as at 30 June 2013. Bribie Island had the highest proportion at 37 per cent of the population. The other SA2s with high concentrations of this age group were in the Sunshine Coast, Gold Coast and Wide Bay areas
1 While new data is available for the general population this is the latest year for the Aboriginal and Torres Strait Islander population data. 2 Information on SA2s can be found at http://www.abs.gov.au/websitedbs/D3310114.nsf/4a256353001af3ed4b2562bb00121564/6b6e07234c98365aca25792d0010d730/$FILE/Statistical%20Area%20Level%202%20-%20Fact%20Sheet%20.pdf
RTI R
elea
se
RTI Page No. 44DOH-DL 17/18-031
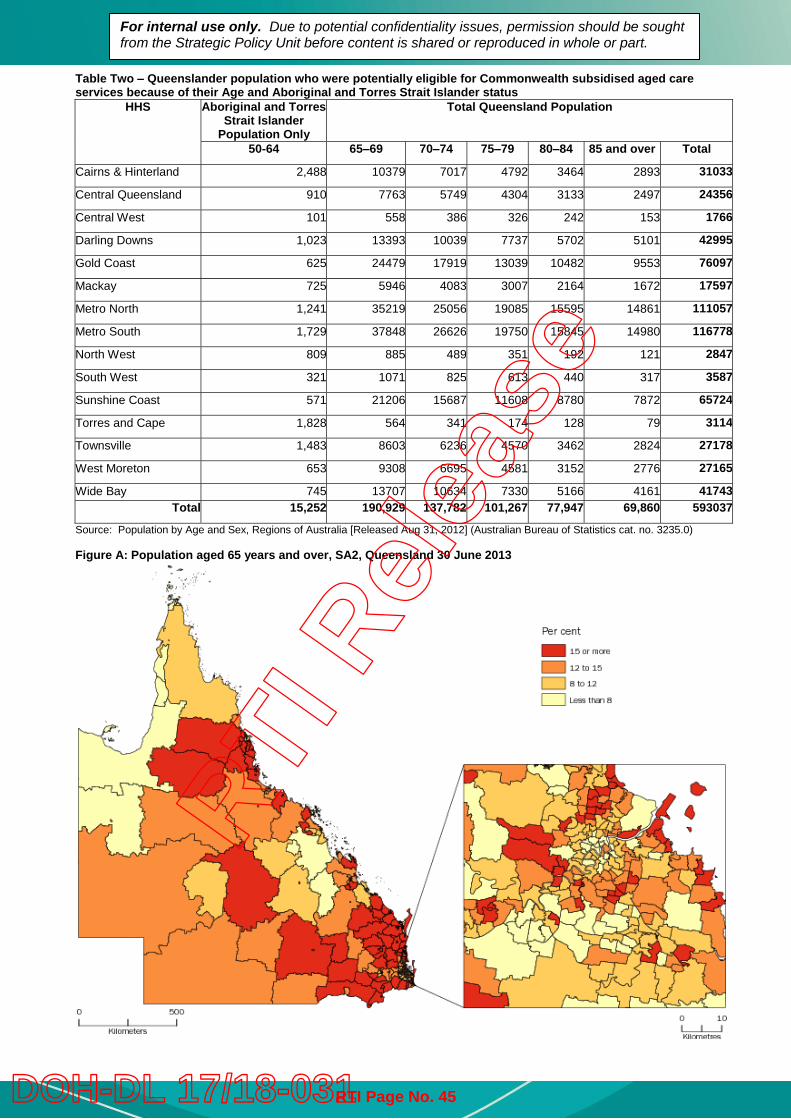
For internal use only. Due to potential confidentiality issues, permission should be sought from the Strategic Policy Unit before content is shared or reproduced in whole or part.
Table Two – Queenslander population who were potentially eligible for Commonwealth subsidised aged care services because of their Age and Aboriginal and Torres Strait Islander status
HHS Aboriginal and Torres Strait Islander
Population Only
Total Queensland Population
50-64 65–69 70–74 75–79 80–84 85 and over Total
Cairns & Hinterland 2,488 10379 7017 4792 3464 2893 31033
Central Queensland 910 7763 5749 4304 3133 2497 24356
Central West 101 558 386 326 242 153 1766
Darling Downs 1,023 13393 10039 7737 5702 5101 42995
Gold Coast 625 24479 17919 13039 10482 9553 76097
Mackay 725 5946 4083 3007 2164 1672 17597
Metro North 1,241 35219 25056 19085 15595 14861 111057
Metro South 1,729 37848 26626 19750 15845 14980 116778
North West 809 885 489 351 192 121 2847
South West 321 1071 825 613 440 317 3587
Sunshine Coast 571 21206 15687 11608 8780 7872 65724
Torres and Cape 1,828 564 341 174 128 79 3114
Townsville 1,483 8603 6236 4570 3462 2824 27178
West Moreton 653 9308 6695 4581 3152 2776 27165
Wide Bay 745 13707 10634 7330 5166 4161 41743 Total 15,252 190,929 137,782 101,267 77,947 69,860 593037
Source: Population by Age and Sex, Regions of Australia [Released Aug 31, 2012] (Australian Bureau of Statistics cat. no. 3235.0) Figure A: Population aged 65 years and over, SA2, Queensland 30 June 2013
RTI R
elea
se
RTI Page No. 45DOH-DL 17/18-031
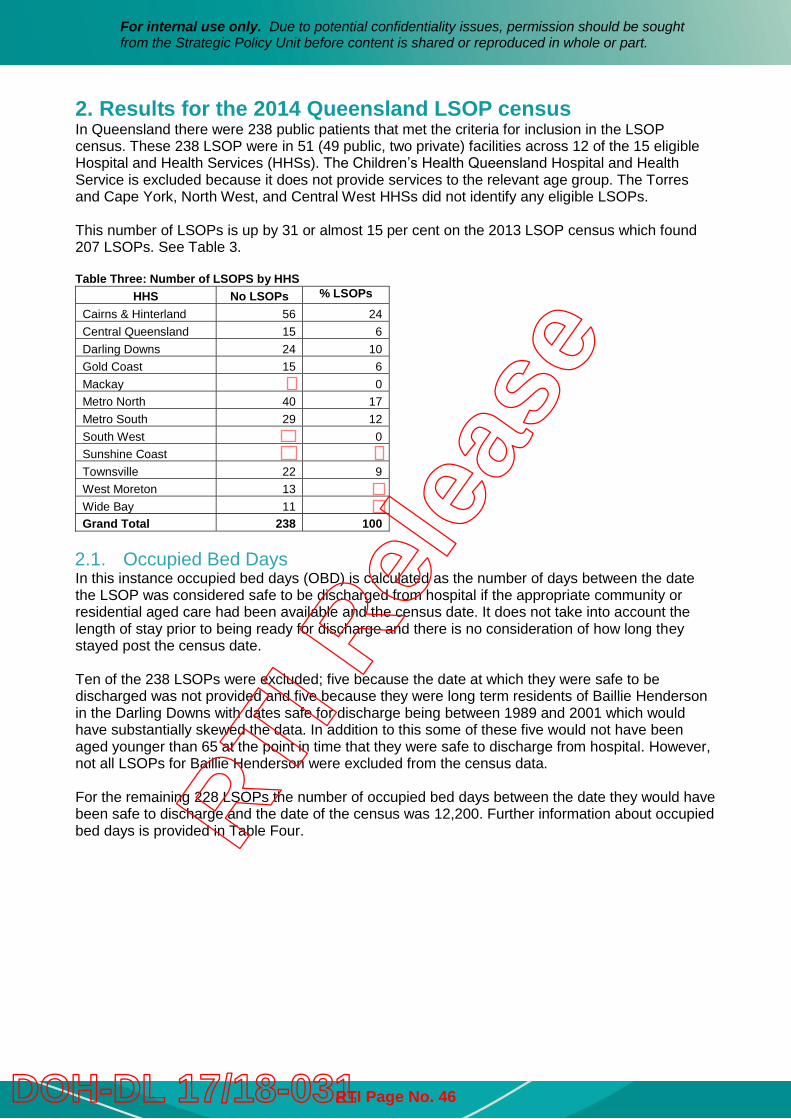
For internal use only. Due to potential confidentiality issues, permission should be sought from the Strategic Policy Unit before content is shared or reproduced in whole or part.
2. Results for the 2014 Queensland LSOP census In Queensland there were 238 public patients that met the criteria for inclusion in the LSOP census. These 238 LSOP were in 51 (49 public, two private) facilities across 12 of the 15 eligible Hospital and Health Services (HHSs). The Children’s Health Queensland Hospital and Health Service is excluded because it does not provide services to the relevant age group. The Torres and Cape York, North West, and Central West HHSs did not identify any eligible LSOPs. This number of LSOPs is up by 31 or almost 15 per cent on the 2013 LSOP census which found 207 LSOPs. See Table 3. Table Three: Number of LSOPS by HHS
HHS No LSOPs % LSOPs Cairns & Hinterland 56 24 Central Queensland 15 6 Darling Downs 24 10 Gold Coast 15 6 Mackay 0 Metro North 40 17 Metro South 29 12 South West 0 Sunshine Coast Townsville 22 9 West Moreton 13
Wide Bay 11
Grand Total 238 100 2.1. Occupied Bed Days In this instance occupied bed days (OBD) is calculated as the number of days between the date the LSOP was considered safe to be discharged from hospital if the appropriate community or residential aged care had been available and the census date. It does not take into account the length of stay prior to being ready for discharge and there is no consideration of how long they stayed post the census date. Ten of the 238 LSOPs were excluded; five because the date at which they were safe to be discharged was not provided and five because they were long term residents of Baillie Henderson in the Darling Downs with dates safe for discharge being between 1989 and 2001 which would have substantially skewed the data. In addition to this some of these five would not have been aged younger than 65 at the point in time that they were safe to discharge from hospital. However, not all LSOPs for Baillie Henderson were excluded from the census data. For the remaining 228 LSOPs the number of occupied bed days between the date they would have been safe to discharge and the date of the census was 12,200. Further information about occupied bed days is provided in Table Four. RTI
Rel
ease
RTI Page No. 46DOH-DL 17/18-031
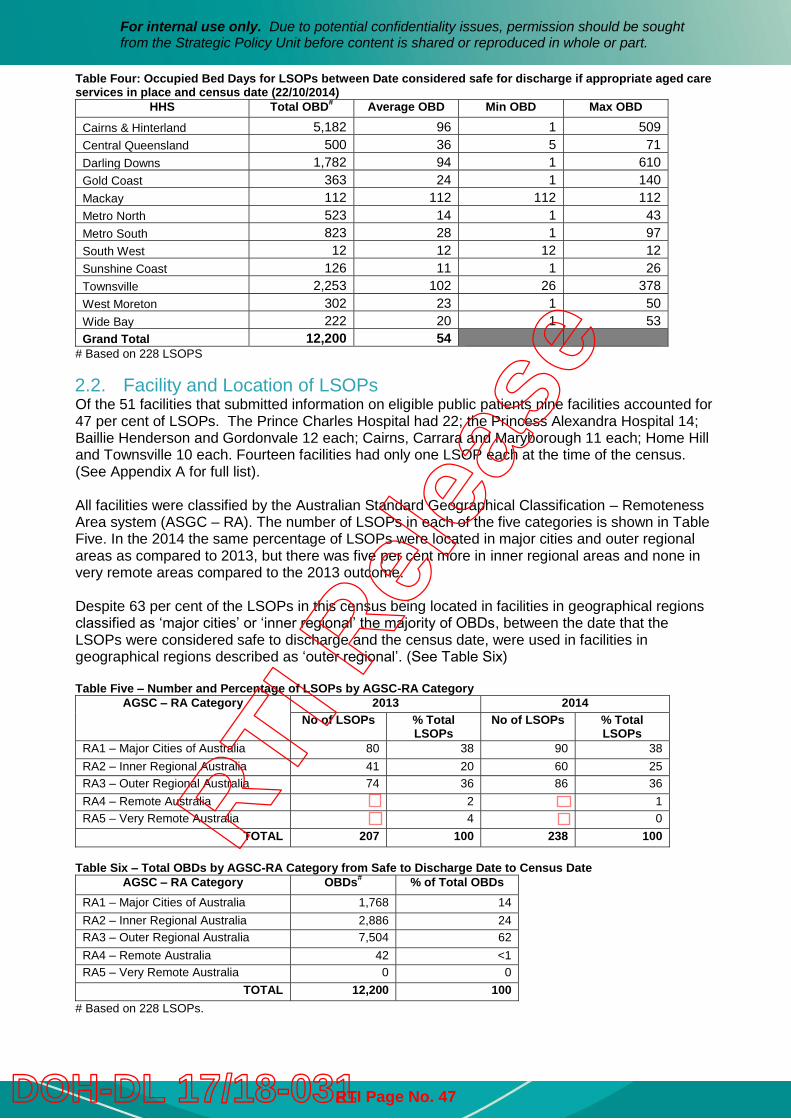
For internal use only. Due to potential confidentiality issues, permission should be sought from the Strategic Policy Unit before content is shared or reproduced in whole or part.
Table Four: Occupied Bed Days for LSOPs between Date considered safe for discharge if appropriate aged care services in place and census date (22/10/2014)
HHS Total OBD# Average OBD Min OBD Max OBD
Cairns & Hinterland 5,182 96 1 509 Central Queensland 500 36 5 71 Darling Downs 1,782 94 1 610 Gold Coast 363 24 1 140 Mackay 112 112 112 112 Metro North 523 14 1 43 Metro South 823 28 1 97 South West 12 12 12 12 Sunshine Coast 126 11 1 26 Townsville 2,253 102 26 378 West Moreton 302 23 1 50 Wide Bay 222 20 1 53 Grand Total 12,200 54
# Based on 228 LSOPS 2.2. Facility and Location of LSOPs Of the 51 facilities that submitted information on eligible public patients nine facilities accounted for 47 per cent of LSOPs. The Prince Charles Hospital had 22; the Princess Alexandra Hospital 14; Baillie Henderson and Gordonvale 12 each; Cairns, Carrara and Maryborough 11 each; Home Hill and Townsville 10 each. Fourteen facilities had only one LSOP each at the time of the census. (See Appendix A for full list). All facilities were classified by the Australian Standard Geographical Classification – Remoteness Area system (ASGC – RA). The number of LSOPs in each of the five categories is shown in Table Five. In the 2014 the same percentage of LSOPs were located in major cities and outer regional areas as compared to 2013, but there was five per cent more in inner regional areas and none in very remote areas compared to the 2013 outcome. Despite 63 per cent of the LSOPs in this census being located in facilities in geographical regions classified as ‘major cities’ or ‘inner regional’ the majority of OBDs, between the date that the LSOPs were considered safe to discharge and the census date, were used in facilities in geographical regions described as ‘outer regional’. (See Table Six) Table Five – Number and Percentage of LSOPs by AGSC-RA Category
AGSC – RA Category 2013 2014 No of LSOPs % Total
LSOPs No of LSOPs % Total
LSOPs RA1 – Major Cities of Australia 80 38 90 38 RA2 – Inner Regional Australia 41 20 60 25 RA3 – Outer Regional Australia 74 36 86 36 RA4 – Remote Australia 2 1 RA5 – Very Remote Australia 4 0
TOTAL 207 100 238 100 Table Six – Total OBDs by AGSC-RA Category from Safe to Discharge Date to Census Date
AGSC – RA Category OBDs# % of Total OBDs RA1 – Major Cities of Australia 1,768 14 RA2 – Inner Regional Australia 2,886 24 RA3 – Outer Regional Australia 7,504 62 RA4 – Remote Australia 42 <1 RA5 – Very Remote Australia 0 0
TOTAL 12,200 100 # Based on 228 LSOPs.
RTI R
elea
se
RTI Page No. 47DOH-DL 17/18-031
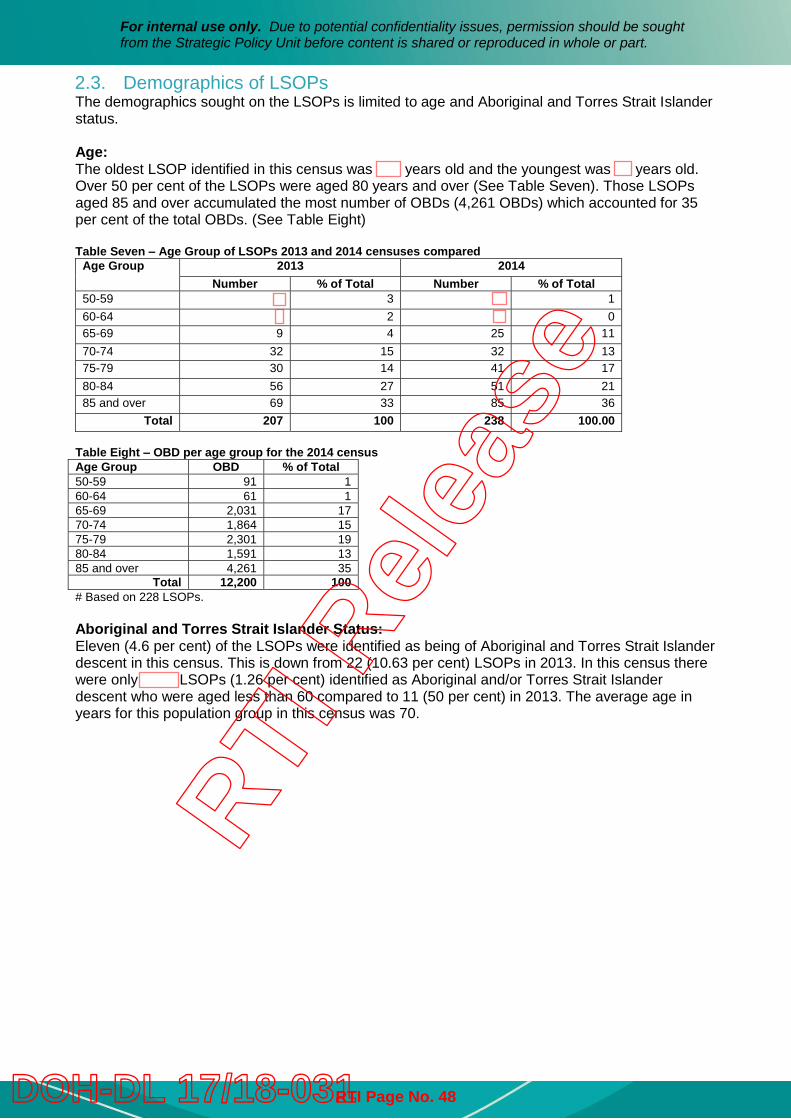
For internal use only. Due to potential confidentiality issues, permission should be sought from the Strategic Policy Unit before content is shared or reproduced in whole or part.
2.3. Demographics of LSOPs The demographics sought on the LSOPs is limited to age and Aboriginal and Torres Strait Islander status. Age: The oldest LSOP identified in this census was years old and the youngest was years old. Over 50 per cent of the LSOPs were aged 80 years and over (See Table Seven). Those LSOPs aged 85 and over accumulated the most number of OBDs (4,261 OBDs) which accounted for 35 per cent of the total OBDs. (See Table Eight) Table Seven – Age Group of LSOPs 2013 and 2014 censuses compared
Age Group 2013 2014 Number % of Total Number % of Total
50-59 3 1 60-64 2 0 65-69 9 4 25 11 70-74 32 15 32 13 75-79 30 14 41 17 80-84 56 27 51 21 85 and over 69 33 85 36
Total 207 100 238 100.00 Table Eight – OBD per age group for the 2014 census Age Group OBD % of Total 50-59 91 1 60-64 61 1 65-69 2,031 17 70-74 1,864 15 75-79 2,301 19 80-84 1,591 13 85 and over 4,261 35
Total 12,200 100 # Based on 228 LSOPs. Aboriginal and Torres Strait Islander Status: Eleven (4.6 per cent) of the LSOPs were identified as being of Aboriginal and Torres Strait Islander descent in this census. This is down from 22 (10.63 per cent) LSOPs in 2013. In this census there were only LSOPs (1.26 per cent) identified as Aboriginal and/or Torres Strait Islander descent who were aged less than 60 compared to 11 (50 per cent) in 2013. The average age in years for this population group in this census was 70.
RTI R
elea
se
RTI Page No. 48DOH-DL 17/18-031
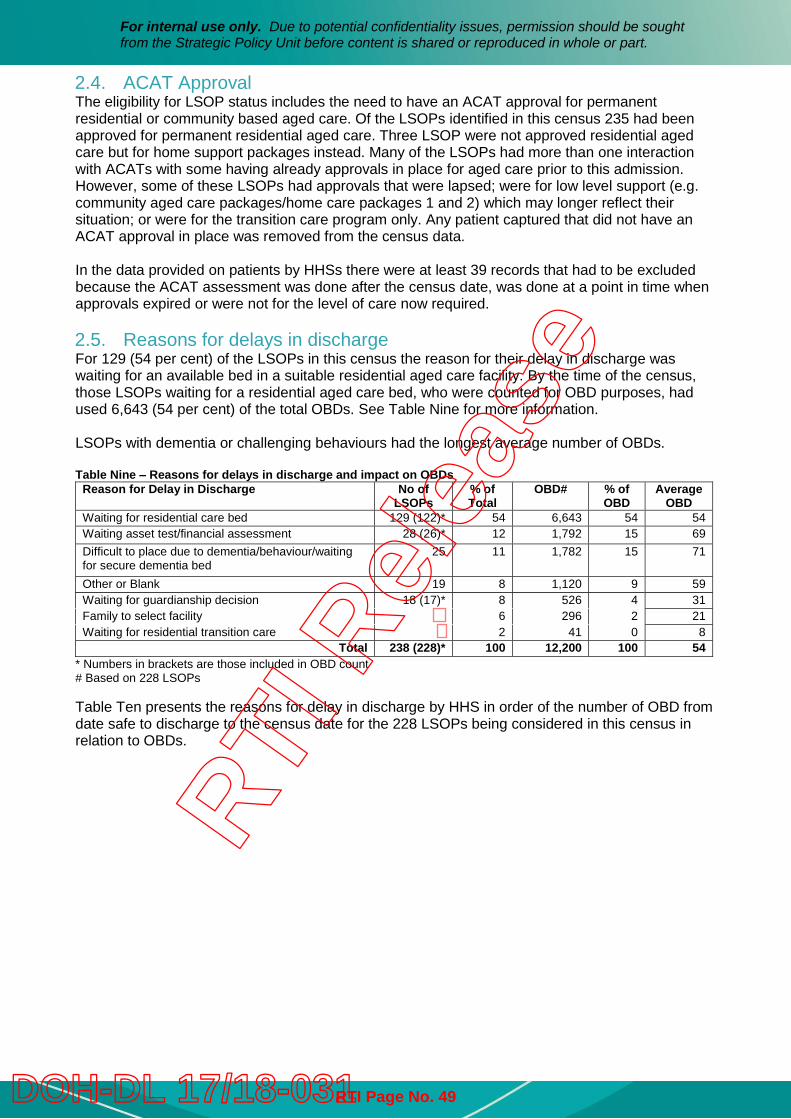
For internal use only. Due to potential confidentiality issues, permission should be sought from the Strategic Policy Unit before content is shared or reproduced in whole or part.
2.4. ACAT Approval The eligibility for LSOP status includes the need to have an ACAT approval for permanent residential or community based aged care. Of the LSOPs identified in this census 235 had been approved for permanent residential aged care. Three LSOP were not approved residential aged care but for home support packages instead. Many of the LSOPs had more than one interaction with ACATs with some having already approvals in place for aged care prior to this admission. However, some of these LSOPs had approvals that were lapsed; were for low level support (e.g. community aged care packages/home care packages 1 and 2) which may longer reflect their situation; or were for the transition care program only. Any patient captured that did not have an ACAT approval in place was removed from the census data. In the data provided on patients by HHSs there were at least 39 records that had to be excluded because the ACAT assessment was done after the census date, was done at a point in time when approvals expired or were not for the level of care now required. 2.5. Reasons for delays in discharge For 129 (54 per cent) of the LSOPs in this census the reason for their delay in discharge was waiting for an available bed in a suitable residential aged care facility. By the time of the census, those LSOPs waiting for a residential aged care bed, who were counted for OBD purposes, had used 6,643 (54 per cent) of the total OBDs. See Table Nine for more information. LSOPs with dementia or challenging behaviours had the longest average number of OBDs. Table Nine – Reasons for delays in discharge and impact on OBDs
Reason for Delay in Discharge No of LSOPs
% of Total
OBD# % of OBD
Average OBD
Waiting for residential care bed 129 (122)* 54 6,643 54 54 Waiting asset test/financial assessment 28 (26)* 12 1,792 15 69 Difficult to place due to dementia/behaviour/waiting for secure dementia bed
25 11 1,782 15 71
Other or Blank 19 8 1,120 9 59 Waiting for guardianship decision 18 (17)* 8 526 4 31 Family to select facility 6 296 2 21 Waiting for residential transition care 2 41 0 8
Total 238 (228)* 100 12,200 100 54 * Numbers in brackets are those included in OBD count # Based on 228 LSOPs Table Ten presents the reasons for delay in discharge by HHS in order of the number of OBD from date safe to discharge to the census date for the 228 LSOPs being considered in this census in relation to OBDs.
RTI R
elea
se
RTI Page No. 49DOH-DL 17/18-031
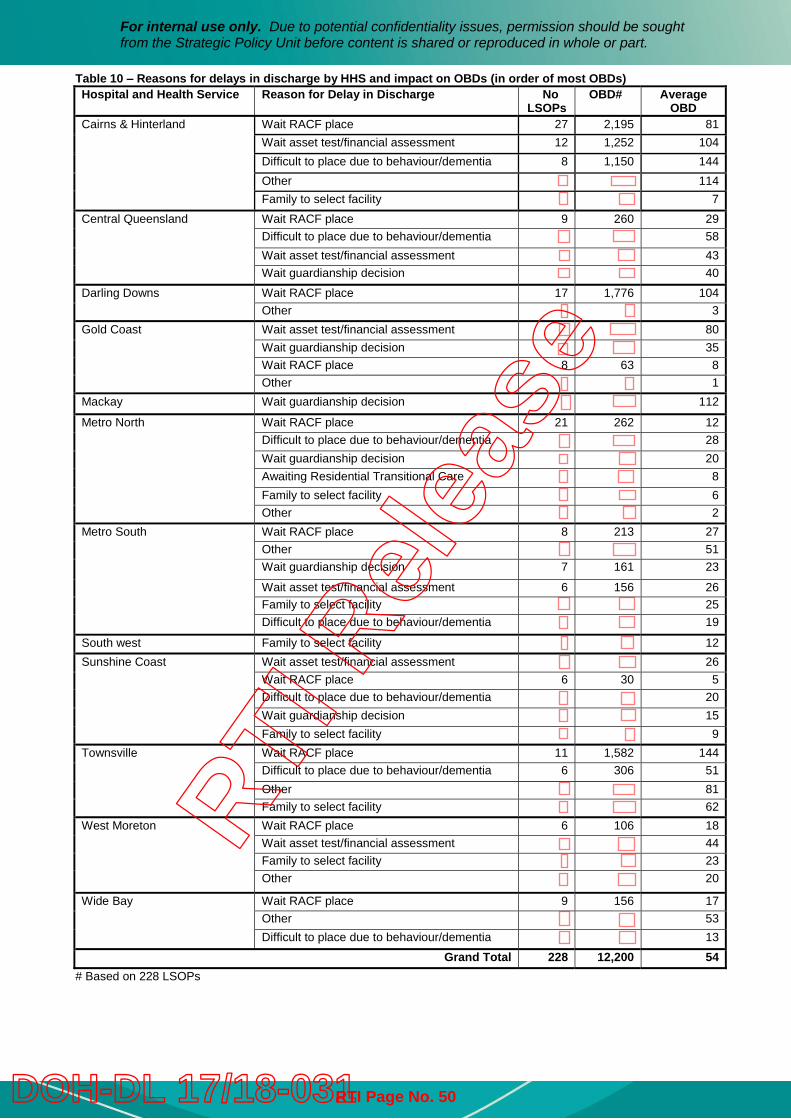
For internal use only. Due to potential confidentiality issues, permission should be sought from the Strategic Policy Unit before content is shared or reproduced in whole or part.
Table 10 – Reasons for delays in discharge by HHS and impact on OBDs (in order of most OBDs) Hospital and Health Service Reason for Delay in Discharge No
LSOPs OBD# Average
OBD Cairns & Hinterland Wait RACF place 27 2,195 81
Wait asset test/financial assessment 12 1,252 104 Difficult to place due to behaviour/dementia 8 1,150 144 Other 114 Family to select facility 7
Central Queensland Wait RACF place 9 260 29 Difficult to place due to behaviour/dementia 58 Wait asset test/financial assessment 43 Wait guardianship decision 40
Darling Downs Wait RACF place 17 1,776 104 Other 3
Gold Coast Wait asset test/financial assessment 80 Wait guardianship decision 35 Wait RACF place 8 63 8 Other 1
Mackay Wait guardianship decision 112
Metro North Wait RACF place 21 262 12 Difficult to place due to behaviour/dementia 28 Wait guardianship decision 20 Awaiting Residential Transitional Care 8 Family to select facility 6 Other 2
Metro South Wait RACF place 8 213 27 Other 51 Wait guardianship decision 7 161 23
Wait asset test/financial assessment 6 156 26 Family to select facility 25 Difficult to place due to behaviour/dementia 19
South west Family to select facility 12 Sunshine Coast Wait asset test/financial assessment 26
Wait RACF place 6 30 5 Difficult to place due to behaviour/dementia 20 Wait guardianship decision 15 Family to select facility 9
Townsville Wait RACF place 11 1,582 144 Difficult to place due to behaviour/dementia 6 306 51 Other 81 Family to select facility 62
West Moreton Wait RACF place 6 106 18 Wait asset test/financial assessment 44 Family to select facility 23 Other 20
Wide Bay Wait RACF place 9 156 17 Other 53 Difficult to place due to behaviour/dementia 13
Grand Total 228 12,200 54 # Based on 228 LSOPs
RTI R
elea
se
RTI Page No. 50DOH-DL 17/18-031
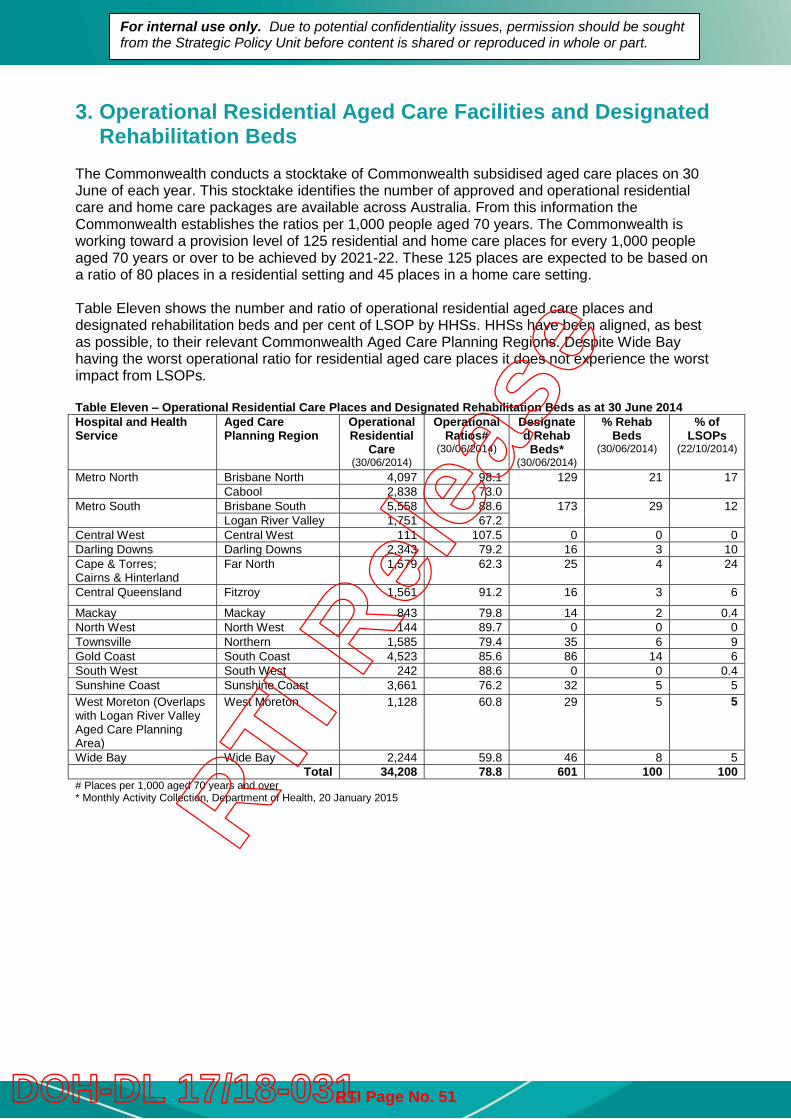
For internal use only. Due to potential confidentiality issues, permission should be sought from the Strategic Policy Unit before content is shared or reproduced in whole or part.
3. Operational Residential Aged Care Facilities and Designated Rehabilitation Beds
The Commonwealth conducts a stocktake of Commonwealth subsidised aged care places on 30 June of each year. This stocktake identifies the number of approved and operational residential care and home care packages are available across Australia. From this information the Commonwealth establishes the ratios per 1,000 people aged 70 years. The Commonwealth is working toward a provision level of 125 residential and home care places for every 1,000 people aged 70 years or over to be achieved by 2021-22. These 125 places are expected to be based on a ratio of 80 places in a residential setting and 45 places in a home care setting. Table Eleven shows the number and ratio of operational residential aged care places and designated rehabilitation beds and per cent of LSOP by HHSs. HHSs have been aligned, as best as possible, to their relevant Commonwealth Aged Care Planning Regions. Despite Wide Bay having the worst operational ratio for residential aged care places it does not experience the worst impact from LSOPs. Table Eleven – Operational Residential Care Places and Designated Rehabilitation Beds as at 30 June 2014 Hospital and Health Service
Aged Care Planning Region
Operational Residential
Care (30/06/2014)
Operational Ratios#
(30/06/2014)
Designated Rehab
Beds* (30/06/2014)
% Rehab Beds
(30/06/2014)
% of LSOPs
(22/10/2014)
Metro North Brisbane North 4,097 98.1 129 21 17 Cabool 2,838 73.0
Metro South Brisbane South 5,558 88.6 173 29 12 Logan River Valley 1,751 67.2
Central West Central West 111 107.5 0 0 0 Darling Downs Darling Downs 2,343 79.2 16 3 10 Cape & Torres; Cairns & Hinterland
Far North 1,579 62.3 25 4 24
Central Queensland Fitzroy 1,561 91.2 16 3 6
Mackay Mackay 843 79.8 14 2 0.4 North West North West 144 89.7 0 0 0 Townsville Northern 1,585 79.4 35 6 9 Gold Coast South Coast 4,523 85.6 86 14 6 South West South West 242 88.6 0 0 0.4 Sunshine Coast Sunshine Coast 3,661 76.2 32 5 5 West Moreton (Overlaps with Logan River Valley Aged Care Planning Area)
West Moreton 1,128 60.8 29 5 5
Wide Bay Wide Bay 2,244 59.8 46 8 5 Total 34,208 78.8 601 100 100
# Places per 1,000 aged 70 years and over * Monthly Activity Collection, Department of Health, 20 January 2015RTI
Rel
ease
RTI Page No. 51DOH-DL 17/18-031
For internal use only. Due to potential confidentiality issues, permission should be sought from the Strategic Policy Unit before content is shared or reproduced in whole or part.
4. Conclusions It would appear that there is still a blockage in the discharge process of older public patients from hospital when they require formal aged care to return to the community and this is particularly the case when they need to be discharged to a residential aged care facility. The upward trend between 2013 and 2014 is disturbing given that the Commonwealth Government has withdrawn its contribution to the State for the cost of maintaining these older people in hospitals when they should be accessing Commonwealth subsidised aged care instead. While there are higher numbers of LSOPs in Queensland facilities located in major cities or inner regional areas the impact on occupied bed days is larger on those facilities in outer regional areas. This probably reflects the fact that there are fewer if indeed any options for taking up residential and/or community based service in certain regional locations across Queensland. With the 1 July 2014 reform to the aged care system, whereby anybody wishing to take up a Commonwealth residential aged care place must contribute to the cost of their accommodation through a lump sum or per diem amount, it may now be more likely that waiting for asset testing/financial assessments to be finalised causes a delay discharge from hospital. This issue will be monitored over future LSOPs censuses. With the recent removal of the dementia supplement for people in residential aged care facilities and the implementation of the multidisciplinary ‘severe response teams’ it will need to be seen if this has an impact on delaying the discharge of LSOPs who have dementia or complex behaviours from hospital to residential aged care facilities. It would appear appropriate to continue the monitoring of LSOPs on a yearly basis and provide reports to the Queensland Minister for Health, the Department of Health executive and Hospital and Health Service executives. This information can also be used to continue discussions with the Commonwealth Minister for Ageing and the Department of Social Services.
RTI R
elea
se
RTI Page No. 52DOH-DL 17/18-031
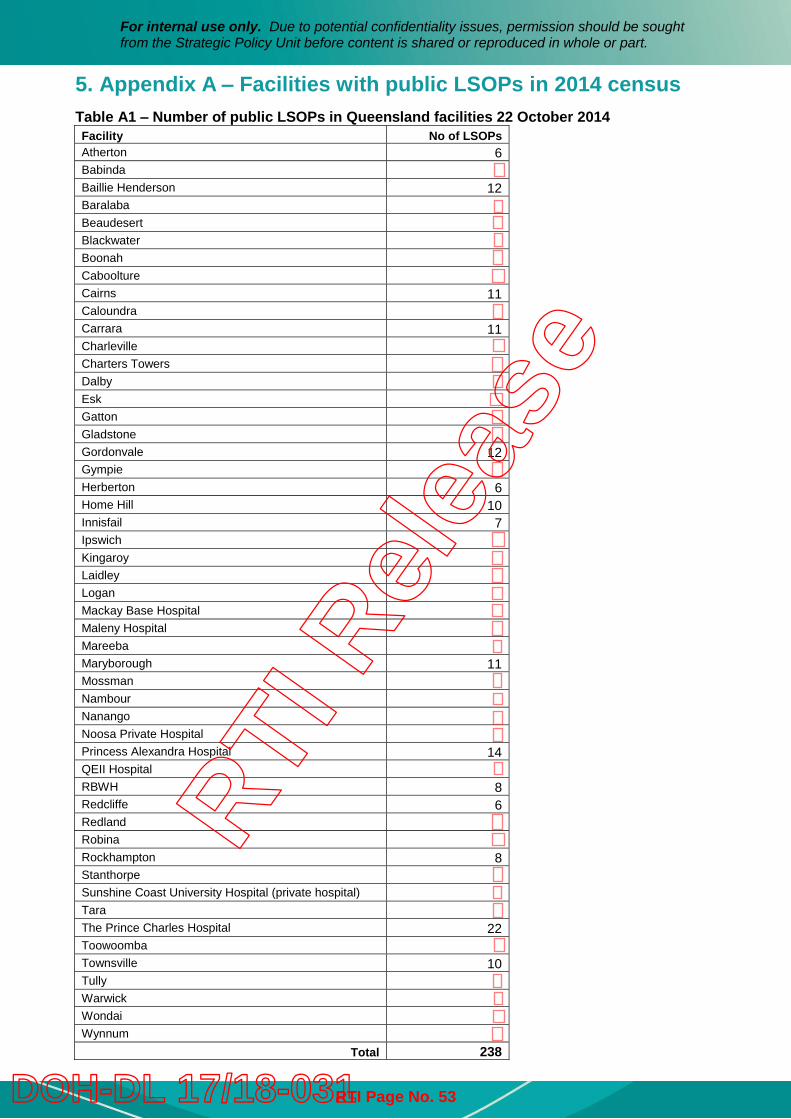
For internal use only. Due to potential confidentiality issues, permission should be sought from the Strategic Policy Unit before content is shared or reproduced in whole or part.
5. Appendix A – Facilities with public LSOPs in 2014 census Table A1 – Number of public LSOPs in Queensland facilities 22 October 2014 Facility No of LSOPs Atherton 6 Babinda Baillie Henderson 12 Baralaba Beaudesert Blackwater Boonah Caboolture Cairns 11 Caloundra Carrara 11 Charleville Charters Towers Dalby Esk Gatton Gladstone Gordonvale 12 Gympie Herberton 6 Home Hill 10 Innisfail 7 Ipswich Kingaroy Laidley Logan Mackay Base Hospital Maleny Hospital Mareeba Maryborough 11 Mossman Nambour Nanango Noosa Private Hospital Princess Alexandra Hospital 14 QEII Hospital RBWH 8 Redcliffe 6 Redland Robina Rockhampton 8 Stanthorpe Sunshine Coast University Hospital (private hospital) Tara The Prince Charles Hospital 22 Toowoomba Townsville 10 Tully Warwick Wondai Wynnum
Total 238
RTI R
elea
se
RTI Page No. 53DOH-DL 17/18-031
Background The Commonwealth Government is responsible for the policy, planning, regulating and subsidisation of aged care services in Australia to people aged 65 years and over and 50 years and over for people who identify as an Aboriginal or Torres Strait Islander. The Commonwealth Government allocates and subsidises residential aged care services including respite care. The Commonwealth also funds community support programs including the Commonwealth Home Support Program and Home Care Packages.
The Queensland Government through the Community Care Program administered by the Department of Communities, Child Safety and Disability Services provides a range of services similar to the Commonwealth Home Support Program for eligible people under the age of 65. This includes nursing and personal care, in-home and centre based respite services. A number of Hospital and Health Services (HHSs) deliver residential aged care services and are on occasion called to care for persons with significant behavioural or health issues.
Aged care services provided by HHSs are funded through a complex mix of Commonwealth Government subsidies and supplements, client contributions based on their means, and funding from the State to meet any funding shortfall. As of 30 June 2015, HHSs had a total of 1,172 residential aged care places, not including the flexible places in the 32 multipurpose health services (MPHSs).
HHSs deliver around 3.4 per cent of the total operational residential places in Queensland and only 1.75 per cent of the operational home care packages available.
The Department is funded by the Commonwealth Government to provide comprehensive aged care assessments under the Aged Care Assessment Program (ACAP). A person must be deemed eligible through an assessment conducted by a member of an Aged Care Assessment Team (ACAT) to receive Commonwealth subsidised aged care.
Aged Care Reforms In April 2010, the Commonwealth requested the Productivity Commission to conduct an inquiry into aged care services as part of its national health reform program. This Inquiry was wide ranging and covered issues including the social, clinical and institutional aspects of aged care, funding and regulatory arrangements for residential and community care, interests of special needs groups, future workforce issues and assessed the medium and long-term financial implications of changes in aged care roles and responsibilities. The final report titled Productivity Commission Inquiry Report: Caring for Older Australians was released on 8 August 2011.
On 20 April 2012, the Commonwealth Government released an aged care reform package, Living Longer Living Better. This package was the Commonwealth’s response to the Productivity Commission’s inquiry report.
Aged Care in Queensland Background Paper
RTI R
elea
se
RTI Page No. 54DOH-DL 17/18-031
Aged Care in Queensland - 2 -
The Commonwealth is now progressively implementing aged care reforms over a ten year period in three phases with the aim to develop an aged care system that is sustainable and affordable, and be the best possible system for all Australians.
The Commonwealth Government commenced the 10 year program of reform in 2012-13. Significant reforms to date include the introduction of means tested accommodation contributions on 1 July 2014; the My Aged Care website and national phone line on 1 July 2015; and changes to the Aged Care Funding Instrument (ACFI) on the 1 July 2016.
Daily Accommodation Payment and Refundable Accommodation Deposit Residential aged care places are funded from a mix of subsidies paid by the Commonwealth Government and contributions from residents based on their ability to pay. The Commonwealth Government uses the ACFI as the means of allocating its subsidies to approved residential aged care providers. From 1 July 2014, new residential aged care residents who have been assessed by either Centrelink or Department of Veterans’ Affairs as having the financial means to pay will be asked to make a contribution to their accommodation costs. An aged care provider may ask a new permanent resident to pay either a Daily Accommodation Payment (DAP) or a Refundable Accommodation Deposit (RAD) or a combination of both.
My Aged Care Model and System My aged care was initially a website and national phone line established to assist older people, their families and carers to access aged care information and services. From 1 July 2015, My Aged Care commenced as a single gateway for the aged care system, including screening and referral to assessment and service providers. Also, on 1 July 2015 assessments for basic home support services provided through the Commonwealth Home Support Program commenced through the newly established My Age Care Regional Assessment Services (RASs).
Aged Care Funding Instrument The Commonwealth announced a savings measure in the 2016 Budget to change the scoring matrix of the ACFI which determines the level of funding that providers of residential aged care homes receive for providing care. Changes to the scoring may mean that some residents who previously were assessed as high or medium in some of the domains will be now be assessed as medium or low respectively. The Commonwealth will also reduce indexation of the Complex Health Care component of the ACFI by 50 per cent in 2016-17.
This reform will result in a reduction in Commonwealth revenue for all providers of residential aged care facilities, including the 17 operated by the Queensland Government. In Queensland, as at 30 June 2015, there were 34,453 operational residential aged care places. An estimated budget reduction of $230.4m over four years equates to a funding reduction of $1,671 per resident per year in Queensland.
If the funding reduction occurs equally across all services this reduction equates to a $7.8 million reduction over four years for Queensland Government operated facilities (nearly $2m per annum). This equates to 1.6% for the operational costs of delivering these services or 5% of Commonwealth subsidy annually.
Most providers do a mock ACFI to determine which resident they will offer a place to. If the cost of delivering care is more than the funding that is received for a particular client then the provider will offer the place to a different client. With the reduction of indexation to those residents assessed as requiring Complex Health Care it is likely that access to aged care services for these clients may be reduced. Any reduced access is likely to affect public hospitals given that around 30 percent of residents move to aged care facilities from public hospitals.
RTI R
elea
se
RTI Page No. 55DOH-DL 17/18-031
Aged Care in Queensland - 3 -
The Commonwealth will establish a $53.3 million transitional assistance fund to support providers adjust to the ACFI changes.
Future Reforms The Commonwealth Government’s Aged Care Sector Committee released their paper Aged Care Roadmap to set out future reform directions for aged care. Key features of the systems are: Consumers, their families and carers are proactive in preparing for their future care needs and are
empowered to do so A single government operated assessment process that is independent and free, and includes
assessment of eligibility, care needs, means and maximum funding level Regardless of cultural or linguistic background, sexuality, life circumstances or location, consumers can
access the care and support that they need The community is dementia aware and dementia care is integrated as core business throughout the
aged care system A single aged care and support system that is market based and consumer driven, with access based on
assessed need A single provider registration scheme that recognises organisations registered or accredited in similar
systems, and that has a staged approach to registration depending on the scope of practice of the providers
Sustainable aged care sector financing arrangements where the market determines price, those that can contribute to their care do, and government acts as the ‘safety net’ and contributes when there is insufficient market response
A well-led, well-training workforce that is adept at adjusting care to meet the needs of older Australians Greater consumer choice drives quality and innovation, responsive providers and increased competition,
supported by an agile and proportionate regulatory framework.
RTI R
elea
se
RTI Page No. 56DOH-DL 17/18-031