Embed Size (px)
Citation preview
Stefan Krause26 April 2012
Deutsche BankInvestor Relations
financial transparency.
Deutsche Bank
1Q2012 ResultsStefan KrauseChief Financial Officer
Analyst Call, 26 April 2012
Stefan Krause26 April 2012
Deutsche BankInvestor Relations
financial transparency.
1 Group results
2 Segment results
Agenda
2
3 Key current issues
Stefan Krause26 April 2012
Deutsche BankInvestor Relations
financial transparency.
Key take-aways
— Solid Group profitability driven by market stabilization as macro challenges remained
— CB&S showed strong rebound in profitability versus 2H2011 despite utilizing risk levels well below limits
— GTB delivered best ever first quarter result driven by strong performance across products and regions
— PBC driven by strong credit and deposit business, but impacted by negative effects from Postbank de-risking and muted client investment activity
— Strategic Review of Asset Management progressing; PWM with solid performance and positive new money trends
— Core Tier 1 ratio strengthened, progress on certain litigation matters, risk discipline and strong liquidity profile maintained
3
Combination of world-class investment banking and strong retail banking and wealth management franchise continues to prove solidity of business model across the cycle

Stefan Krause26 April 2012
Deutsche BankInvestor Relations
financial transparency.
1Q2012 1Q2011
Income before income taxes (in EUR bn) 1.9 3.0Net income (in EUR bn) 1.4 2.1
Pre-tax RoE (target definition)(1) 14% 22%Diluted EPS (in EUR) 1.44 2.13
31 Mar 2012 31 Dec 2011
Core Tier 1 capital ratio 10.0% 9.5%Tier 1 capital ratio 13.4% 12.9%Core Tier 1 capital (in EUR bn) 37.0 36.3
Total assets (adjusted, in EUR bn)(2) 1,256 1,267
Leverage ratio (target definition)(3) 21 21
Liquidity reserves (in EUR bn)(4) >195 219
Balance Sheet
Profitability
Capital
(1) Based on average active equity(2) Adjusted for netting of derivatives and certain other components (Total assets according to IFRS were EUR 2,103 bn as of 31 Mar 2012 and EUR 2,164 bn as of 31
Dec 2011)(3) Total assets (adjusted) divided by total equity (adjusted) per target definition(4) The bank's liquidity reserves include (a) available excess cash held primarily at central banks, (b) unencumbered central bank eligible business inventory, as well
as (c) the strategic liquidity reserve of highly liquid government securities and other central bank eligible assets. Excludes any positions held by Postbank.
Overview
4
Stefan Krause26 April 2012
Deutsche BankInvestor Relations
financial transparency.
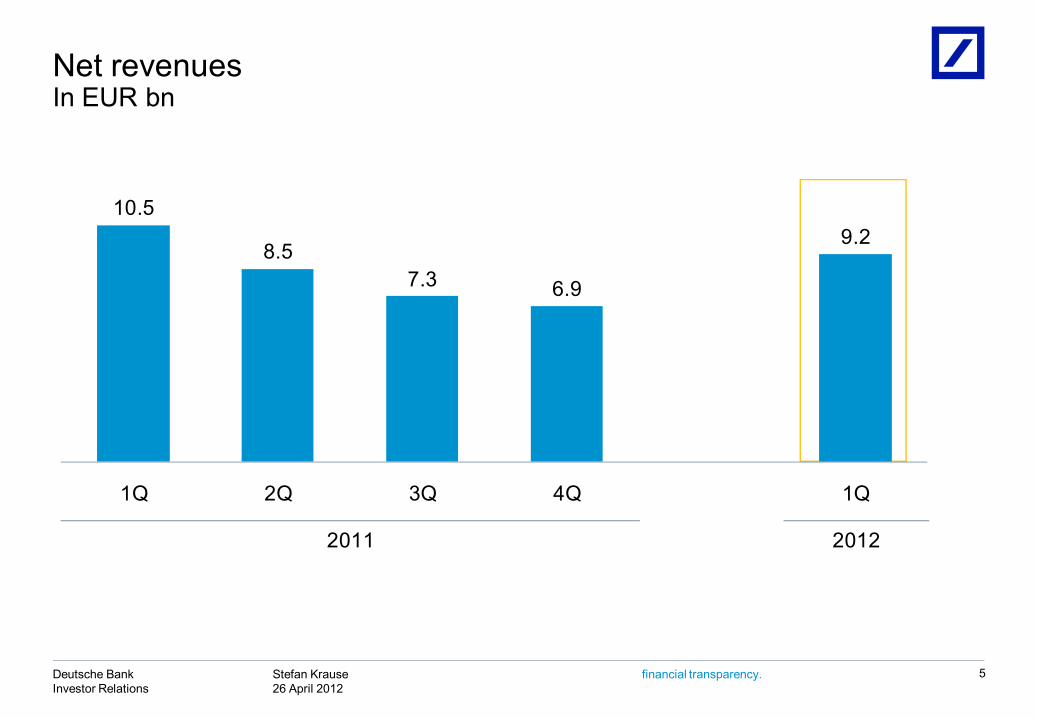
Net revenuesIn EUR bn
5
2011 2012
10.5
8.57.3 6.9
9.2
1Q 2Q 3Q 4Q 1Q
Stefan Krause26 April 2012
Deutsche BankInvestor Relations
financial transparency.
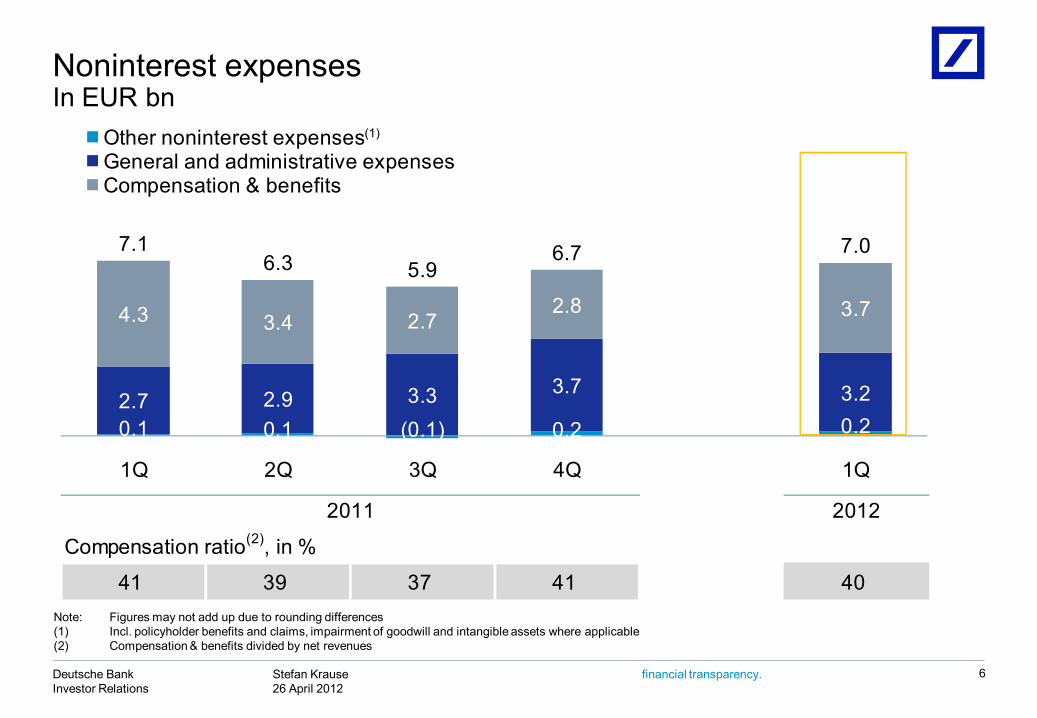
0.1 0.1 (0.1) 0.2 0.22.7 2.9 3.3 3.7 3.2
4.3 3.4 2.72.8 3.7
7.16.3 5.9
6.7 7.0
1Q 2Q 3Q 4Q 1Q
Other noninterest expenses⁽¹⁾General and administrative expensesCompensation & benefits
Note: Figures may not add up due to rounding differences(1) Incl. policyholder benefits and claims, impairment of goodwill and intangible assets where applicable(2) Compensation & benefits divided by net revenues
6
Noninterest expenses In EUR bn
Compensation ratio(2), in %
41 39 37 41 40
2011 2012
(1)

Stefan Krause26 April 2012
Deutsche BankInvestor Relations
financial transparency.
Provision for credit lossesIn EUR m
7
Note: Divisional figures do not add up due to omission of Corporate Investments; figures may not add up due to rounding differences(1) Provisions for credit losses after Postbank releases in relation to allowances established before consolidation
2012
CIB 33 127 92 210 118PCAM(2) 338 333 370 322 194
2011
234303 329 385
224
22
79 23
64
54117
82 111
91
36
373
464 463540
314
1Q 2Q 3Q 4Q 1Q
449
Related to IAS 39 reclassified assets
Effect from Postbank releases shown as net interest income at DB Group / PBC level
(1)
352382256
(1)(1)
(1) 278(1)

Stefan Krause26 April 2012
Deutsche BankInvestor Relations
financial transparency.
Profitability
8
(1) Annualized, based on average active equity
Pre-tax return on equity(1), in % Effective tax rate, in %24 14 7 (3) 14 29 31 18 153 25
2011 2012 2011 2012
FY2011: 10 FY2011: 20
Income before income taxes Net incomeIn EUR bn In EUR bn
3.0
1.8
0.9
(0.4)
1.9
1Q 2Q 3Q 4Q 1Q
2.1
1.20.8
0.2
1.4
1Q 2Q 3Q 4Q 1Q

Stefan Krause26 April 2012
Deutsche BankInvestor Relations
financial transparency.
Earnings mix Share of income before income taxes
9
32% 29%
56%34%
68% 71%
44%66%
2009 2010 2011 1Q2012
Classic banking (PCAM / GTB)Investment banking (CB&S)
Diversified business leads to balanced earnings mix through the cycle
Note: Split excludes IBIT from Corporate Investments and Consolidation & Adjustments

Stefan Krause26 April 2012
Deutsche BankInvestor Relations
financial transparency.
1 Group results
2 Segment results
Agenda
10
3 Key current issues

Stefan Krause26 April 2012
Deutsche BankInvestor Relations
financial transparency.
Segment overviewIncome before income taxes, in EUR m
11
1Q2012 significant items
EUR 213 m litigation charges
EUR 257 m impairment charge related to our exposure in Actavis
(353)
(165)
788
190
274
2,287
(431)
(303)
413
142
340
1,717
C&A
CI
PBC
AWM
GTB
CB&S
1Q2012 1Q2011
Stefan Krause26 April 2012
Deutsche BankInvestor Relations
financial transparency.
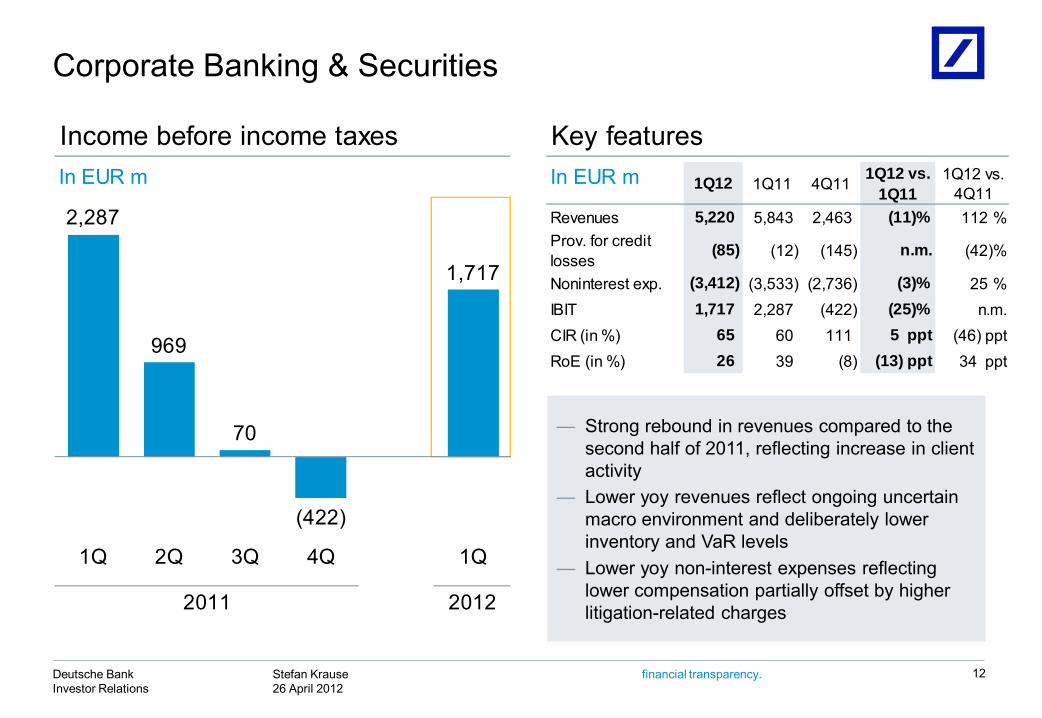
Income before income taxes Key featuresIn EUR m In EUR m 1Q12 1Q11 4Q11 1Q12 vs.
1Q111Q12 vs.
4Q11Revenues 5,220 5,843 2,463 (11)% 112 %Prov. for credit losses
(85) (12) (145) n.m. (42)%
Noninterest exp. (3,412) (3,533) (2,736) (3)% 25 %IBIT 1,717 2,287 (422) (25)% n.m.CIR (in %) 65 60 111 5 ppt (46) pptRoE (in %) 26 39 (8) (13) ppt 34 ppt
2011 2012
2,287
969
70
(422)
1,717
1Q 2Q 3Q 4Q 1Q
Corporate Banking & Securities
12
— Strong rebound in revenues compared to the second half of 2011, reflecting increase in client activity
— Lower yoy revenues reflect ongoing uncertain macro environment and deliberately lower inventory and VaR levels
— Lower yoy non-interest expenses reflecting lower compensation partially offset by higher litigation-related charges
Stefan Krause26 April 2012
Deutsche BankInvestor Relations
financial transparency.
Revenues Key featuresIn EUR m 1Q12 1Q11 4Q11 1Q12 vs.
1Q111Q12 vs.
4Q11RevenuesProv. for credit lossesNon-interest
IBITCIR (in %)RoE (in %)
2011 2012
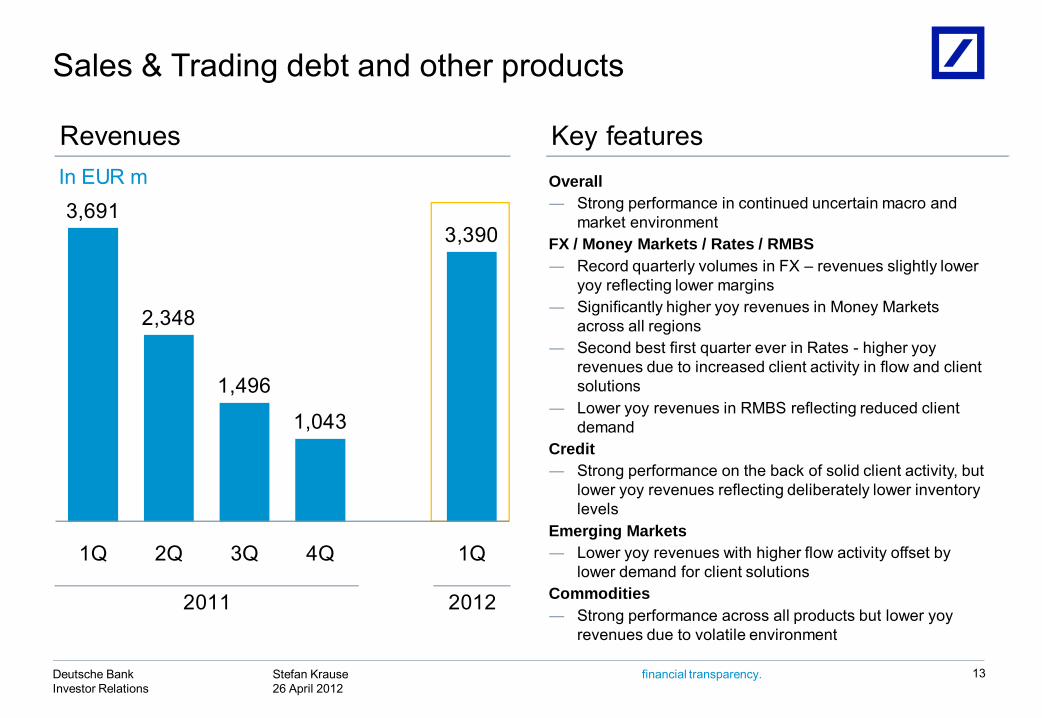
3,691
2,348
1,496
1,043
3,390
1Q 2Q 3Q 4Q 1Q
Sales & Trading debt and other products
13
Overall― Strong performance in continued uncertain macro and
market environmentFX / Money Markets / Rates / RMBS― Record quarterly volumes in FX – revenues slightly lower
yoy reflecting lower margins― Significantly higher yoy revenues in Money Markets
across all regions― Second best first quarter ever in Rates - higher yoy
revenues due to increased client activity in flow and client solutions
― Lower yoy revenues in RMBS reflecting reduced client demand
Credit― Strong performance on the back of solid client activity, but
lower yoy revenues reflecting deliberately lower inventory levels
Emerging Markets― Lower yoy revenues with higher flow activity offset by
lower demand for client solutionsCommodities― Strong performance across all products but lower yoy
revenues due to volatile environment

Stefan Krause26 April 2012
Deutsche BankInvestor Relations
financial transparency.
Revenues Key featuresIn EUR m 1Q12 1Q11 4Q11 1Q12 vs.
1Q111Q12 vs.
4Q11RevenuesProv. for credit lossesNon-interest
IBITCIR (in %)RoE (in %)
2011 2012
943
555
384
539
726
1Q 2Q 3Q 4Q 1Q
Sales & Trading equity
14
Overall― Solid performance reflecting improved market
environment compared to the second half of 2011― Lower yoy revenues reflecting decline in industry-wide
client activity― Voted No. 1 for European Sales, Trading and Research
in Institutional Investor All-Europe survey
Cash Equities― Lower yoy revenues reflecting lower market volumes,
partially offset by market share gains in Europe and US
Equity Derivatives― Lower yoy revenues due to decreased flow and
corporate client volumes
Prime Brokerage― Revenues in line with prior year quarter with higher
balances offset by lower margins
Stefan Krause26 April 2012
Deutsche BankInvestor Relations
financial transparency.
Revenues Key featuresIn EUR m 1Q12 1Q11 4Q11 1Q12 vs.
1Q111Q12 vs.
4Q11RevenuesProv. for credit lossesNon-interest
IBITCIR (in %)RoE (in %)
2011 2012
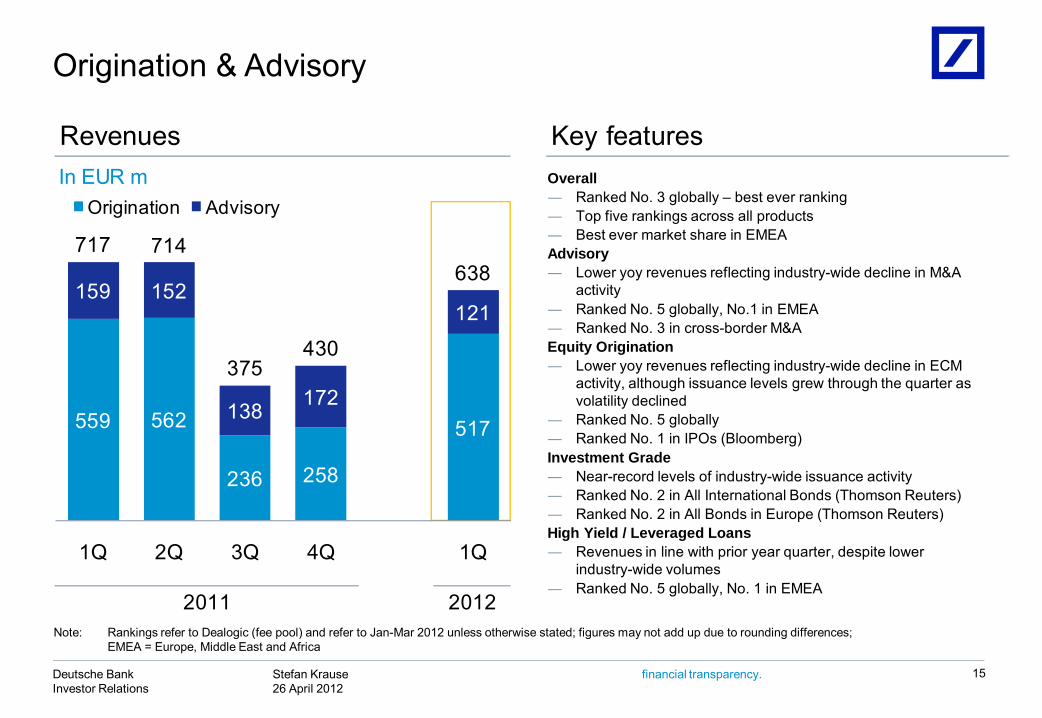
559 562
236 258
517
159 152
138 172
121
717 714
375430
638
1Q 2Q 3Q 4Q 1Q
Origination Advisory
Note: Rankings refer to Dealogic (fee pool) and refer to Jan-Mar 2012 unless otherwise stated; figures may not add up due to rounding differences;EMEA = Europe, Middle East and Africa
Origination & Advisory
15
Overall― Ranked No. 3 globally – best ever ranking― Top five rankings across all products― Best ever market share in EMEAAdvisory― Lower yoy revenues reflecting industry-wide decline in M&A
activity― Ranked No. 5 globally, No.1 in EMEA― Ranked No. 3 in cross-border M&AEquity Origination― Lower yoy revenues reflecting industry-wide decline in ECM
activity, although issuance levels grew through the quarter as volatility declined
― Ranked No. 5 globally― Ranked No. 1 in IPOs (Bloomberg)Investment Grade― Near-record levels of industry-wide issuance activity― Ranked No. 2 in All International Bonds (Thomson Reuters)― Ranked No. 2 in All Bonds in Europe (Thomson Reuters)High Yield / Leveraged Loans― Revenues in line with prior year quarter, despite lower
industry-wide volumes― Ranked No. 5 globally, No. 1 in EMEA

Stefan Krause26 April 2012
Deutsche BankInvestor Relations
financial transparency.
Income before income taxes Key featuresIn EUR m In EUR m 1Q12 1Q11 4Q11 1Q12 vs.
1Q111Q12 vs.
4Q11Revenues 967 853 929 13 % 4 %Prov. for credit losses
(33) (21) (64) 55 % (48)%
Noninterest exp. (593) (558) (581) 6 % 2 %IBIT 340 274 283 24 % 20 %CIR (in %) 61 65 63 (4) ppt (2) pptRoE (in %) 46 35 37 11 ppt 9 ppt
2011 2012
274306
259283
340
1Q 2Q 3Q 4Q 1Q
Global Transaction Banking
16
— Best ever first quarter revenues and IBIT driven by continued strong performance spread across products and regions
— Strong fee as well as interest income, benefiting from higher balances and client volumes
— Maintained cost discipline - slightly higher yoynoninterest expenses reflect growth in business activity
— 11 Quality and Share Leader Awards by Greenwich, incl. ‘European Large Corporate Cash Management Quality’, ‘Asian Large Corporate Cash Management Quality’ (1)
— Named ‘Global Corporate Trust Services Provider of the Year’ by Infrastructure Investor Awards(2)(1) Greenwich Associates 2012 Awards, March 2012
(2) March 2012

Stefan Krause26 April 2012
Deutsche BankInvestor Relations
financial transparency.
Income before income taxes Key featuresIn EUR m In EUR m 1Q12 1Q11 4Q11 1Q12 vs.
1Q111Q12 vs.
4Q11Revenues 883 1,002 909 (12)% (3)%Prov. for credit losses
(0) (19) (11) (98)% (97)%
Noninterest exp. (739) (792) (733) (7)% 1 %IBIT 142 190 165 (25)% (14)%
Invested assets(1) 820 799 813 3 % 1 %
Net new money(1) (8) (2) 5 n.m. n.m.
2011 2012
190
227
186165
142
1Q 2Q 3Q 4Q 1Q
Asset and Wealth Management
17
(1) In EUR bn
— Lower profitability due to Sal. Oppenheim realignment in 2011 and lower client activity in Asset Management
— Strategic Review of Asset Management business progressing
— Solid performance across Private Wealth Management despite continued market uncertainty

Stefan Krause26 April 2012
Deutsche BankInvestor Relations
financial transparency.
Income before income taxes Key featuresIn EUR m In EUR m 1Q12 1Q11 4Q11 1Q12 vs.
1Q111Q12 vs.
4Q11Revenues 380 441 453 (14)% (16)%Prov. for credit losses
0 (0) (0) n.m. n.m.
Noninterest exp. (325) (366) (322) (11)% 1 %IBIT 54 75 131 (27)% (58)%
Invested assets(1) 542 529 544 2 % (0)%
Net new money(1) (10) (5) 8 n.m. n.m.
2011 2012
75
124117
131
54
1Q 2Q 3Q 4Q 1Q
Asset Management
18
(1) In EUR bn
— Despite stronger equity markets, active investment management remains under pressure
— Strategic review impacting flows, resulting in lower fees
— Maintained lower operating cost base as a result of platform optimization
Stefan Krause26 April 2012
Deutsche BankInvestor Relations
financial transparency.
Income before income taxes Key featuresIn EUR m In EUR m 1Q12 1Q11 4Q11 1Q12 vs.
1Q111Q12 vs.
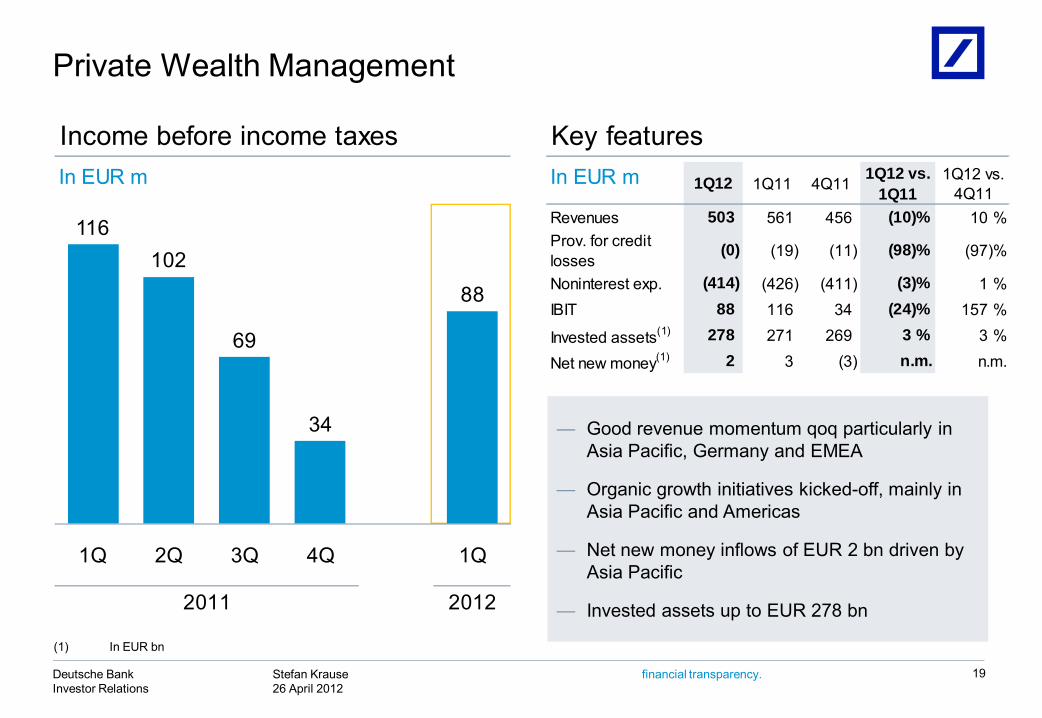
4Q11Revenues 503 561 456 (10)% 10 %Prov. for credit losses
(0) (19) (11) (98)% (97)%
Noninterest exp. (414) (426) (411) (3)% 1 %IBIT 88 116 34 (24)% 157 %
Invested assets(1) 278 271 269 3 % 3 %
Net new money(1) 2 3 (3) n.m. n.m.
2011 2012
Private Wealth Management
(1) In EUR bn
19
— Good revenue momentum qoq particularly in Asia Pacific, Germany and EMEA
— Organic growth initiatives kicked-off, mainly in Asia Pacific and Americas
— Net new money inflows of EUR 2 bn driven by Asia Pacific
— Invested assets up to EUR 278 bn
116102
69
34
88
1Q 2Q 3Q 4Q 1Q

Stefan Krause26 April 2012
Deutsche BankInvestor Relations
financial transparency.
Income before income taxes Key featuresIn EUR m In EUR m 1Q12 1Q11 4Q11 1Q12 vs.
1Q111Q12 vs.
4Q11Revenues 2,501 3,072 2,556 (19)% (2)%Prov. for credit losses
(194) (320) (311) (39)% (38)%
Noninterest exp. (1,865) (1,888) (1,983) (1)% (6)%IBIT 413 788 227 (48)% 82 %CIR (in %) 75 61 78 14 ppt (3) pptRoE (in %) 12 23 7 (11) ppt 5 ppt
2011 2012
525 458310 227
413
263(2)
132
185
118
24
70
3940
13468
1Q 2Q 3Q 4Q 1Q
788
Negative impact from Greek government bonds(1)
Cost-to-achieve related to Postbank acquisition(1)
Net Hua Xia one-off gain
Private & Business Clients
20
(1) Does not include noncontrolling interest(2) Reflected in revenues
— Balance sheet based business remained strong
— Lower provision for credit losses mainly attributable to high portfolio quality and lower releases in Postbankrelated to allowances established prior to consolidation
— Client investment activity remained subdued in Germany
— CB Germany impacted by de-risking, Greek government bonds and lower PPA
— AB International with good performance in all countries
— Postbank integration remains on track

Stefan Krause26 April 2012
Deutsche BankInvestor Relations
financial transparency.
PBC – business division performance Income before income taxes, post-minorities, in EUR m
21
Note: Synergies are also reflected on business division level
1Q2012 – Reported results1Q2011 – Reported results
Net HuaXia one-off gain
788413
25895
127
231191Advisory Banking Germany
Advisory Banking International
Consumer Banking Germany
PBC Total
263 298
263

Stefan Krause26 April 2012
Deutsche BankInvestor Relations
financial transparency.
Income before income taxes Key featuresIn EUR m In EUR m 1Q12 1Q11 4Q11 1Q12 vs.
1Q111Q12 vs.
4Q11Revenues 4 180 (193) (98)% n.m.Prov. for credit losses
(2) (1) (8) 22 % (78)%
Noninterest exp. (312) (344) (520) (9)% (40)%IBIT (303) (165) (722) 84 % (58)%
2011 2012
Corporate Investments
22
EUR 257 m further Actavisimpairment charge
— Actavis: Impairment of EUR 257 m triggered by the transaction which is expected to close in the fourth quarter of 2012. Net positive impact on Core Tier 1 capital ratio of approximately 6 bps
— All major assets (Cosmopolitan, BHF Bank, Maher Terminals) are performing according to plan
(165) (139)(85)
(722)
(303)
1Q 2Q 3Q 4Q 1Q

Stefan Krause26 April 2012
Deutsche BankInvestor Relations
financial transparency.
Agenda
23
1 Group results
2 Segment results
3 Key current issues

Stefan Krause26 April 2012
Deutsche BankInvestor Relations
financial transparency.
Capital ratios and risk-weighted assets
24
Note: Tier 1 ratio = Tier 1 capital / RWA; Core Tier 1 ratio = (Tier 1 capital - hybrid Tier 1 capital) / RWA
12.3 13.4 14.0 13.8
12.9 13.4Tier 1 ratio, in %
2010 2011
Core Tier 1 ratio, in %
RWA, in EUR bn
8.79.6 10.2 10.1 9.5 10.0
346 328 320 338 381 368
4Q 1Q 2Q 3Q 4Q 1Q
Basel 2.5Basel 2
2012

Stefan Krause26 April 2012
Deutsche BankInvestor Relations
financial transparency.
Core Tier 1 capital and RWA development
25
Note: Figures may not add up due to rounding differences(1) Net income attributable to Deutsche Bank shareholders(2) CDI = Capital Deduction Items
RWAIn EUR bn
381.2
(2.4)
(8.3)
(3.2)
1.0 368.4
31 Dec 2011 FX effect Creditrisk
Marketrisk
Operationalrisk
31 Mar 2012
Core Tier 1 capitalIn EUR bnIn EUR bn
36.3
1.4
(0.2)0.2
(0.2) (0.2) (0.3)37.0
31 Dec 2011
Net income
Dividend accrual
CDI Equity comp
Other FX Effect 31 Mar 2012
(1)(2)

Stefan Krause26 April 2012
Deutsche BankInvestor Relations
financial transparency.
Basel 3 simulation(1)
In EUR bn
26
10.0% 8.8%
Note: Figures may not add up due to rounding differences(1) Subject to final Basel rules and European / German implementation of the revised framework(2) Based on analyst consensus collected on 13 April 2012 from Bloomberg; 75% of FY 2012; dividend accrual of 75 cents per share(3) E.g. further RWA mitigation, asset sales or compensation and dividend adjustments
Pro forma Core Tier 1 capital and ratios
(2)
Pro forma RWA
37 3 40 3 43
(8)
35
1 Jan 2013 pro
forma (w/o
phase-in)
Application of 2019
rules
Dec 12Net income
after div. remain.
2012
Mar 12 1 Jan 2013 pro
forma (with
phase-in)
10.5%
Capital toolbox provides further flexibility(3)
7.2%
Core Tier 1 ratio (%)xx
368 12 380
105 485 3 488
1 Jan 2013 pro
forma (w/o
phase-in)
Dec 12Normali-zation of market
risk
Mar 12 Application of 2019
rules
1 Jan 2013 pro
forma (with
phase-in)
Basel 3 after
targeted mgmt. action
Add-back securiti-zation
deductions incl. Mgmt.
action

Stefan Krause26 April 2012
Deutsche BankInvestor Relations
financial transparency.
Simplified US entity structure
27
― DBTCA is well capitalized under the Federal Reserve’s capital requirements― DBSI continues to be an indirect subsidiary of Taunus and continues to be an SEC-registered broker-dealer meeting its current applicable
regulatory and capital requirements― DB AG continues to be a bank holding company subject to regulation by the Federal Reserve― DBTC is a US bank holding company and is well capitalized under the Federal Reserve’s capital requirements― Taunus is a non-operating entity and an intermediate holding company and is no longer a bank holding company
Former structure New structure
DB AG
Taunus
DBTC DBSIand other subs
DBTCA and other subs subject to bank regulation US Operating entities
US Banking Group
DB AG
Taunus
DBSIand other subs
DBTC
DBTCA and other subs
subject to bank regulation
Illustrative
Note: Deutsche Bank Trust Company Americas (DBTCA), Deutsche Bank Trust Corporation (DBTC), Deutsche Bank Securities Inc. (DBSI), Deutsche Bank AG (DBAG)
Stefan Krause26 April 2012
Deutsche BankInvestor Relations
financial transparency.
Impact of new capital allocation approach
28
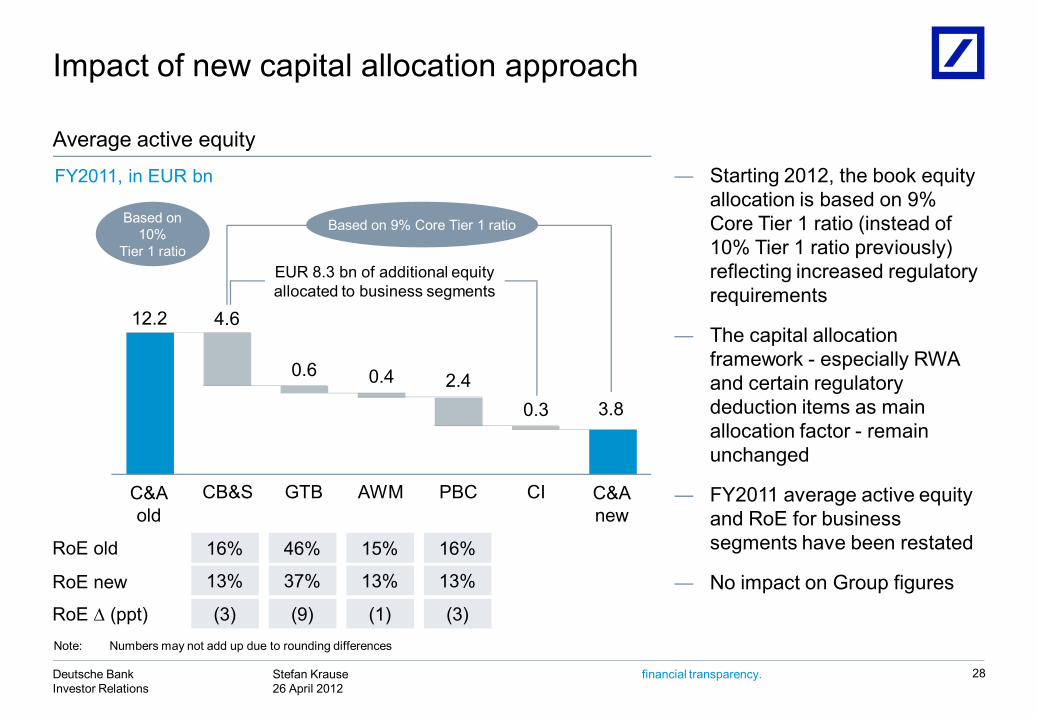
― Starting 2012, the book equity allocation is based on 9% Core Tier 1 ratio (instead of 10% Tier 1 ratio previously) reflecting increased regulatory requirements
― The capital allocation framework - especially RWA and certain regulatory deduction items as main allocation factor - remain unchanged
― FY2011 average active equity and RoE for business segments have been restated
― No impact on Group figures
12.2
0.6 0.4 2.40.3 3.8
4.6
RoE old
13% 37% 13% 13%RoE new
16% 46% 15% 16%
RoE ∆ (ppt) (3) (9) (1) (3)
Based on 10%
Tier 1 ratio
C&Aold
GTB AWM PBC CI C&Anew
CB&S
EUR 8.3 bn of additional equityallocated to business segments
Based on 9% Core Tier 1 ratio
Average active equity
FY2011, in EUR bn
Note: Numbers may not add up due to rounding differences

Stefan Krause26 April 2012
Deutsche BankInvestor Relations
financial transparency.
Accounting asymmetry effect:
Consolidation & AdjustmentsIn EUR m, 1Q2012
29
― Some EUR funding (held at cost) swapped into USD (swaps are m-t-m)
― Swaps are sensitive to changes in USD/EUR mid to long-term spread differences (basis swap spreads)
― Basis spreads have narrowed in 1Q2012 resulting in (temporary) loss
3
Loss before income taxes
Non-controlling
interest (reversal)(2)
Timing differences (accounting
effects)
Corporateitems(1)
(431)
(141)
29 (319)
(167)
(82)
(70)
(1) Hedging of net investments in certain foreign operations, bank levy, other(2) Reversal of noncontrolling interests booked in operating segments (mainly Postbank)
Loss
es re
vers
e ov
er ti
me
Hedging of interest rate risk
M-t-m loss from own debt valuation
Stefan Krause26 April 2012
Deutsche BankInvestor Relations
financial transparency.
Summary
30
Delivered rebound in profitability versus 2H2011 as markets stabilizedbut macro challenges remained
Maintained excellent client franchise while preserving prudent approach to risk-taking
Core Tier 1 ratio further improved, well on track to meet regulatory requirements ahead of time and continued focus on de-risking strategy
Preserved a well-funded and highly liquid balance sheet
Outlook remains variable – DB well-positioned to capture growth opportunities

Deutsche Bank
Additional information
Stefan Krause26 April 2012
Deutsche BankInvestor Relations
financial transparency.
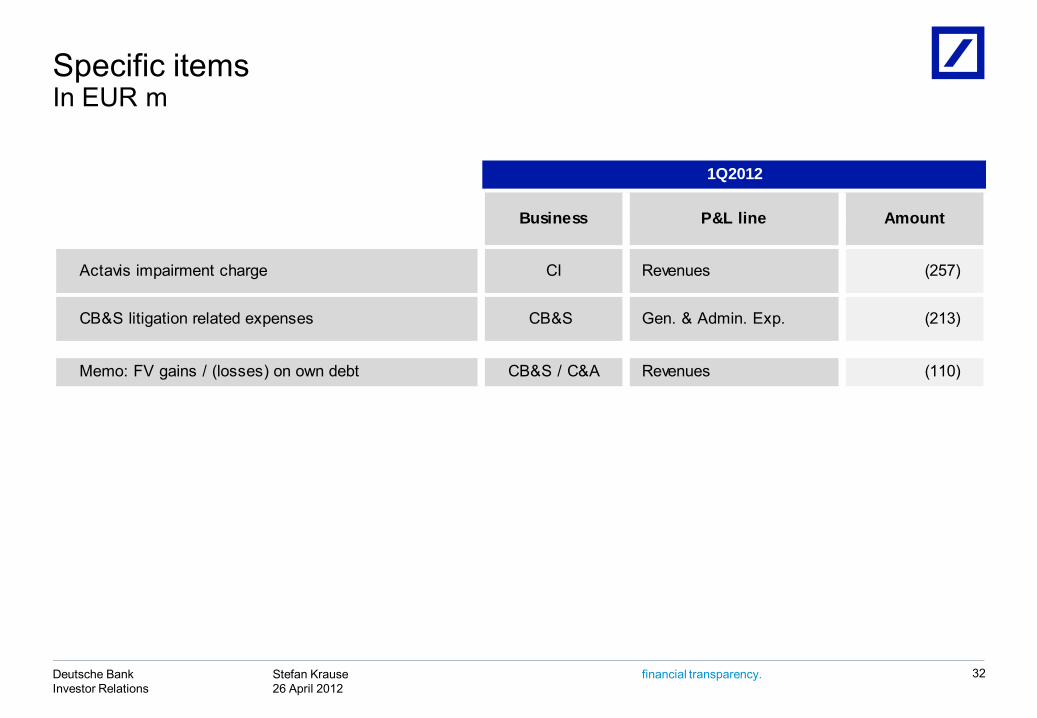
Specific itemsIn EUR m
32
Actavis impairment charge CI Revenues (257)
CB&S litigation related expenses CB&S Gen. & Admin. Exp. (213)
Memo: FV gains / (losses) on own debt CB&S / C&A Revenues (110)
1Q2012
Business P&L line Amount

Stefan Krause26 April 2012
Deutsche BankInvestor Relations
financial transparency.
Exposure on selected countries
33
Note: Numbers may not add up due to rounding differences(1) Exposures are presented after effects of collateral held, guarantees received and further risk mitigation. Loan exposures held at amortized cost are presented after
deduction of allowance for loan losses
Spain
Portugal
Greece
Italy
Ireland
Net sovereign exposure(1)
31 Mar 201231 Dec 2011
Total
3,9443,669
1,3581,318
1,9531,767
94448
350181
(45)
7%
In EUR m
189
Stefan Krause26 April 2012
Deutsche BankInvestor Relations
financial transparency.
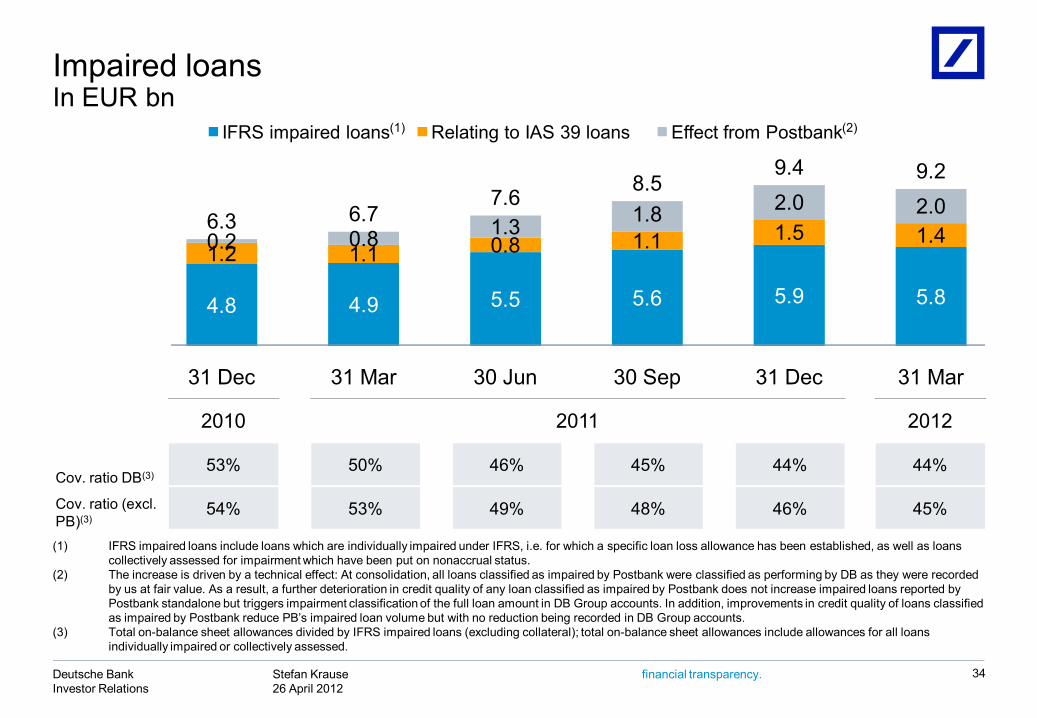
Impaired loansIn EUR bn
34
(1) IFRS impaired loans include loans which are individually impaired under IFRS, i.e. for which a specific loan loss allowance has been established, as well as loans collectively assessed for impairment which have been put on nonaccrual status.
(2) The increase is driven by a technical effect: At consolidation, all loans classified as impaired by Postbank were classified as performing by DB as they were recorded by us at fair value. As a result, a further deterioration in credit quality of any loan classified as impaired by Postbank does not increase impaired loans reported by Postbank standalone but triggers impairment classification of the full loan amount in DB Group accounts. In addition, improvements in credit quality of loans classified as impaired by Postbank reduce PB’s impaired loan volume but with no reduction being recorded in DB Group accounts.
(3) Total on-balance sheet allowances divided by IFRS impaired loans (excluding collateral); total on-balance sheet allowances include allowances for all loans individually impaired or collectively assessed.
4.8 4.9 5.5 5.6 5.9 5.8
1.2 1.1 0.8 1.1 1.5 1.40.2 0.8 1.3 1.8 2.0 2.06.3 6.7
7.68.5
9.4 9.2
31 Dec 31 Mar 30 Jun 30 Sep 31 Dec 31 Mar
IFRS impaired loans Relating to IAS 39 loans Effect from Postbank(1) (2)
2010 2011 2012
Cov. ratio DB(3)53% 50% 46% 45% 44% 44%
Cov. ratio (excl. PB)(3)
54% 53% 49% 48% 46% 45%
Stefan Krause26 April 2012
Deutsche BankInvestor Relations
financial transparency.
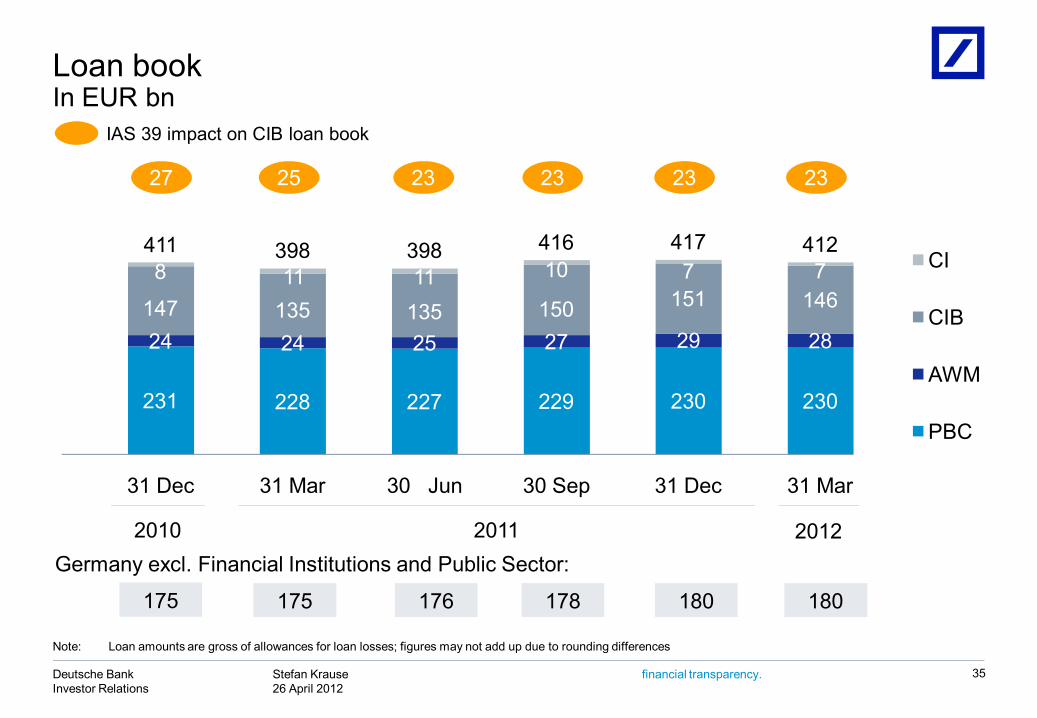
231 228 227 229 230 230
24 24 25 27 29 28147 135 135 150 151 1468 11 11 10 7 7
411 398 398 416 417 412
31 Dec 31 Mar 30 Jun 30 Sep 31 Dec 31 Mar
CI
CIB
AWM
PBC
175 175 176 178 180 180
Germany excl. Financial Institutions and Public Sector:2010 2011
Loan bookIn EUR bn
35
IAS 39 impact on CIB loan book
Note: Loan amounts are gross of allowances for loan losses; figures may not add up due to rounding differences
27 25 23 23 23 23
2012

Stefan Krause26 April 2012
Deutsche BankInvestor Relations
financial transparency.
Composition of loan book and provisions by categoryIn EUR bn, as of 31 Mar 2012
(70)
(28)
(2)
(4)(17) (1)
389
23
(6) (5)(1) (7)
(4)
Postbank (PB) 1Q2012 provision for credit losses(1)(2), in EUR m...DB 1Q2012 provision for credit losses(1) ex. PB, in EUR m...
IAS 39 reclassified assets Postbank
Note: Loan amounts are gross of allowances for loan losses; figures may not add up due to rounding diff.(1) Includes provision for off-balance sheet positions; releases shown as negative number (2) Postbank LLPs gross (does not reflect releases booked as Other Interest Income)(3) Includes loans of EUR 3.9 bn in relation to one non-investment grade counterparty relationship (4) Includes loans from Corporate Finance (EUR 1.1 bn) and LEMG (EUR 4.1 bn)(5) Includes loans from CMBS securitizations
Moderate risk bucketLower risk bucket
89%
75%Higher risk bucket
PBC mort-gages
Inv grade / German mid-
cap
GTB PWM PBCsmall
corporates/others
Corporate Invest-ments(3)
Total loan
book, gross
Structured transactions collateralized
by Govts, cash and own debt
Asset Finance
(DB sponsored conduits)
PBC consumer
finance
Financing of pipeline
assets
Collatera-lized /
hedged structured
transactions
Leveraged Finance(4)
OtherCommercialReal
Estate(5)
412
Substantial collateral / hedging
Partiallyhedged
High margin business
Strong underlying asset quality
Low loan to value
Partially hedged
Mostlysenior secured
Diversified assetpools
Predominantly mortgage secured
Diversified by asset type and location
Highly diversified
Short term Credit
umbrella Mostly collateralized
Liquid collateral Substantial
collateral Partially
Gov’tg’teed
Subst-antiallycollater-alised by Gov’tsecurities
Additional hedging mitigants
26 35127189
125314
(147)
(47)
(58)(28)
(18) (7) (5)(16)
(19) (18) (6) (5) (29) (9)
36
Stefan Krause26 April 2012
Deutsche BankInvestor Relations
financial transparency.
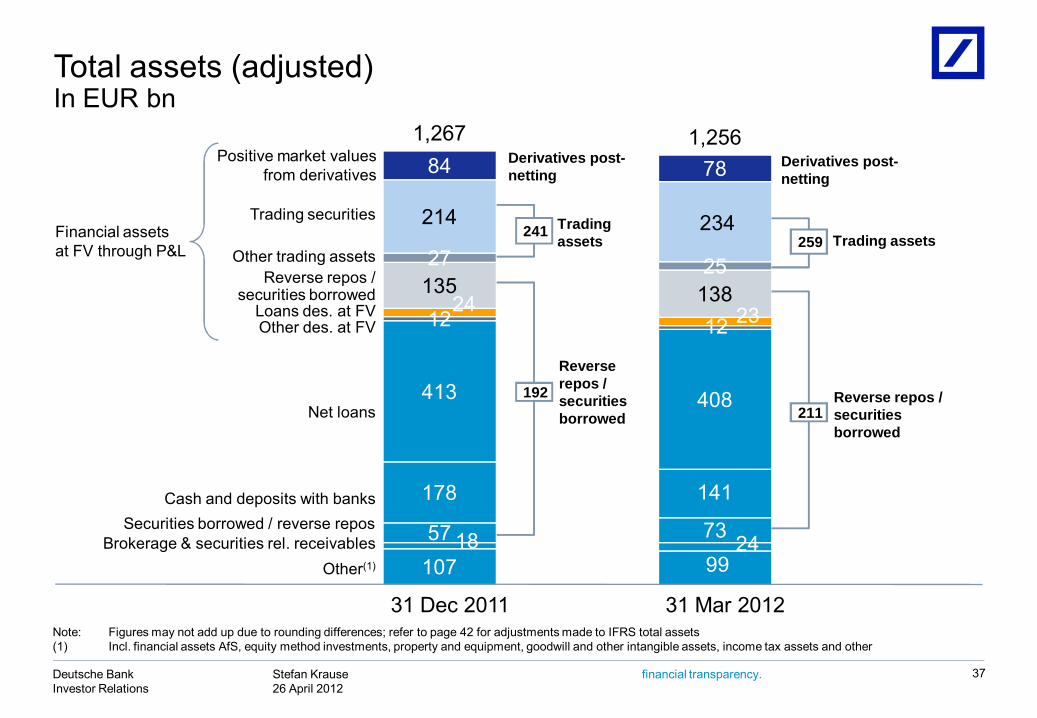
Total assets (adjusted)In EUR bn
37
Note: Figures may not add up due to rounding differences; refer to page 42 for adjustments made to IFRS total assets(1) Incl. financial assets AfS, equity method investments, property and equipment, goodwill and other intangible assets, income tax assets and other
107 9918 2457 73
178 141
413 408
12 1224 23
135 138
27 25
214 234
84 78
1,267 1,256
Trading assets241
Derivatives post-netting
Reverse repos / securitiesborrowed
192
Trading assets259
Securities borrowed / reverse repos
Other(1)
Cash and deposits with banks
Net loans
Positive market valuesfrom derivatives
Trading securities
Reverse repos / securities borrowed
Other des. at FV
Financial assets at FV through P&L
Brokerage & securities rel. receivables
Loans des. at FV
Other trading assets
31 Dec 2011 31 Mar 2012
Derivatives post-netting
Reverse repos / securitiesborrowed
211

Stefan Krause26 April 2012
Deutsche BankInvestor Relations
financial transparency.
Funding activities update
38
ObservationsFunding cost development
— 2011 recap— EUR 22.5 bn raised in capital
markets at an average spread of L+65 bps, ca. 75% raised outside of public unsecured markets
— Very successful deposit campaigns, raising EUR 9 bntowards 2011 funding plan
— 2012 YTD & outlook— Modest funding plan of
EUR 15 bn; heaviest concentration of maturities in 3Q
— YTD issuance at EUR 7 bn ataverage L+90 bps (ca. 70 bps inside CDS); ca. 75% raised via retail & other private placements
— EUR 500 m 7y Pfandbrief at mid-swap +22 bps (more planned)
0
40
80
120
160
200
240
280
320
360
2Q2010EUR 7 bn
1Q2011EUR 10
bn
4Q2010EUR 4 bn
2Q2011EUR 3 bn
31 Mar 30 Jun 30 Sep 31 Dec
20112010
3Q2011EUR 6 bn
European Peer CDS(1)
US Peer CDS(2)
DB 5yr Senior CDSDB issuance spread (4wk mov avg.)DB issuance activity
4Q2011EUR 3.5
bn
31 Mar 30 Jun 30 Sep 31 Dec
3Q2010EUR 4 bn
31 Mar
1Q2012EUR 6 bn
2012Source: Bloomberg, Deutsche Bank(1) Average of BNP, Barclays, UBS, Credit Suisse, SocGen, HSBC(2) Average of JPM, Citi, Bofa, Goldman
In bps

Stefan Krause26 April 2012
Deutsche BankInvestor Relations
financial transparency.
Funding profile
39
(1) Dec 2007 has been rebased to ensure consistency with Mar 2012 presentation(2) Includes Postbank
Liquidity reserves
Recalibrating of our funding profile is paying off: We maintain excellent access to broad range of funding sources
EUR > 195 bnEUR 65 bn
Capital Markets and
Equity19%
Retail24%
Transaction Banking
15%
Other Customers
10%
Discretionary Wholesale
10%
Secured Funding and
Shorts20%
Financing Vehicles
2%
As at 31 Dec 200758% (EUR 655 bn) of overall funding from most stable funding
sources
As at 31 Mar 201230% (EUR 361 bn) of overall funding frommost stable funding
sources(1)Capital
Markets and Equity12%
Retail11%
Transaction Banking
7%
Other Customers
13%Discretionary
Wholesale13%
Secured Funding and
Shorts39%
Financing Vehicles
5%
Total: EUR 1,206 bn Total: EUR 1,139 bn(2)

Stefan Krause26 April 2012
Deutsche BankInvestor Relations
financial transparency.
PBC – business division performanceIn EUR m, post-minorities
40
Reported IBIT
Impact from Greek
government bonds
Cost-to-achieve
related to Postbank
PPA(1) Hua Xia Adjusted IBIT
1Q2011 231 (38) 2692Q2011 124 (42) (35) 2013Q2011 132 (11) (35) 1784Q2011 85 (9) (73) 167FY2011 572 (62) (180) 8141Q2012 191 1 (46) 2361Q2011 298 263 352Q2011 105 1053Q2011 113 1134Q2011 51 51FY2011 567 263 3041Q2012 127 1271Q2011 258 (32) 47 2442Q2011 229 (90) (4) 42 2813Q2011 65 (175) (5) 141 1044Q2011 90 (108) (62) 106 155FY2011 643 (373) (102) 335 7831Q2012 95 (25) (22) 24 1181Q2011 788 (70) 47 263 5472Q2011 458 (132) (39) 42 5873Q2011 310 (185) (40) 141 3944Q2011 227 (118) (134) 106 373FY2011 1,782 (435) (283) 335 263 1,9011Q2012 413 (24) (68) 24 481
Advisory Banking Germany
Advisory Banking International
Consumer Banking Germany
PBC
(1) Net regular FVA amortization

Stefan Krause26 April 2012
Deutsche BankInvestor Relations
financial transparency.
IAS 39 reclassification
41
Carrying Value vs. Fair Value 1Q2012 developmentsIn EUR bn
(3.3) (2.8) (2.5) (2.2)
(0.5)(0.2)
(0.2)(0.2)
(3.7)
(3.0)(2.7)
(2.3)
31 Dec 2009 31 Dec 2010 31 Dec 2011 31 Mar 2012
Sales & Trading - Debt Origination & Advisory
— The gap between carrying value and fair value has decreased by EUR 0.4 bn in 1Q2012
— Decrease of fair value by EUR 0.5 bn largely driven by redemption / sale of assets and by FX movements, partially offset by price improvements
— Decrease of carrying value by EUR 0.8 bnlargely driven by redemption / sale of assets and by FX movements
— Assets sold during 1Q2012 had a book value of EUR 234 m; net loss on disposal was EUR 16 m
CarryingValueFair Value
33.6 22.1
29.8
22.9
19.823.7
26.7
20.2
Note: At the reclassification dates, assets had a carrying value of EUR 37.9 bn; incremental RWAs were EUR 4.4 bn; there have been no reclasses since 1Q2009; above figures may not add up due to rounding differences
Stefan Krause26 April 2012
Deutsche BankInvestor Relations
financial transparency.
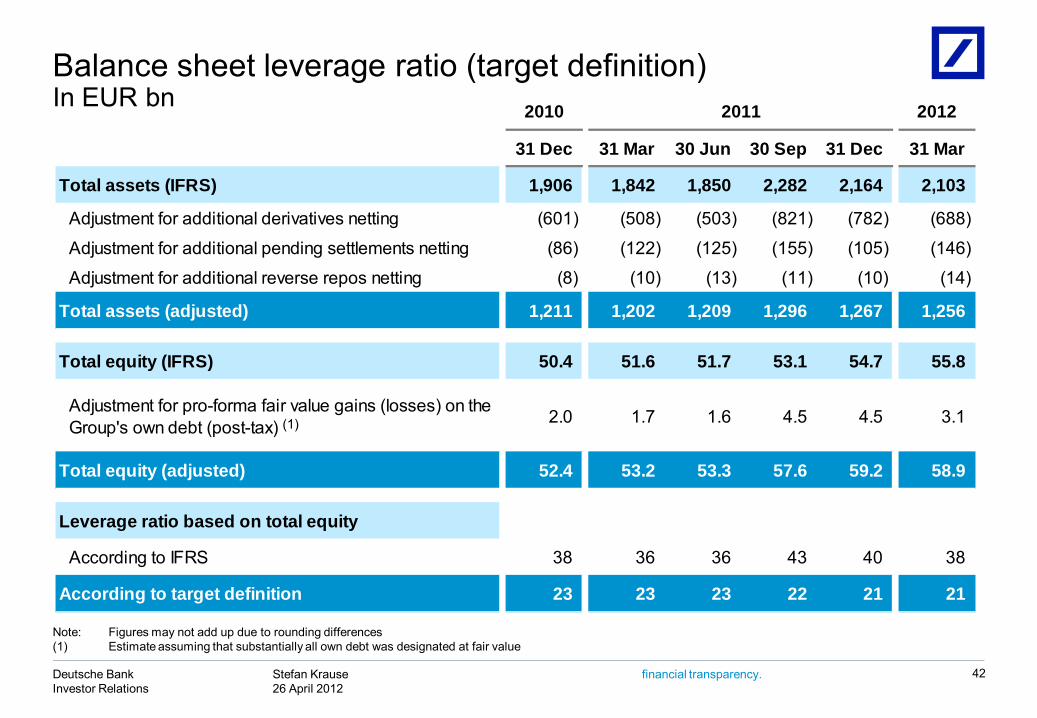
31 Dec 31 Mar 30 Jun 30 Sep 31 Dec 31 Mar
Total assets (IFRS) 1,906 1,842 1,850 2,282 2,164 2,103
Adjustment for additional derivatives netting (601) (508) (503) (821) (782) (688)
Adjustment for additional pending settlements netting (86) (122) (125) (155) (105) (146)
Adjustment for additional reverse repos netting (8) (10) (13) (11) (10) (14)
Total assets (adjusted) 1,211 1,202 1,209 1,296 1,267 1,256
Total equity (IFRS) 50.4 51.6 51.7 53.1 54.7 55.8
Adjustment for pro-forma fair value gains (losses) on the Group's own debt (post-tax) 2.0 1.7 1.6 4.5 4.5 3.1
Total equity (adjusted) 52.4 53.2 53.3 57.6 59.2 58.9
Leverage ratio based on total equity
According to IFRS 38 36 36 43 40 38
According to target definition 23 23 23 22 21 21
2010 2011 2012
(1)
Balance sheet leverage ratio (target definition)In EUR bn
42
Note: Figures may not add up due to rounding differences(1) Estimate assuming that substantially all own debt was designated at fair value
Stefan Krause26 April 2012
Deutsche BankInvestor Relations
financial transparency. 43
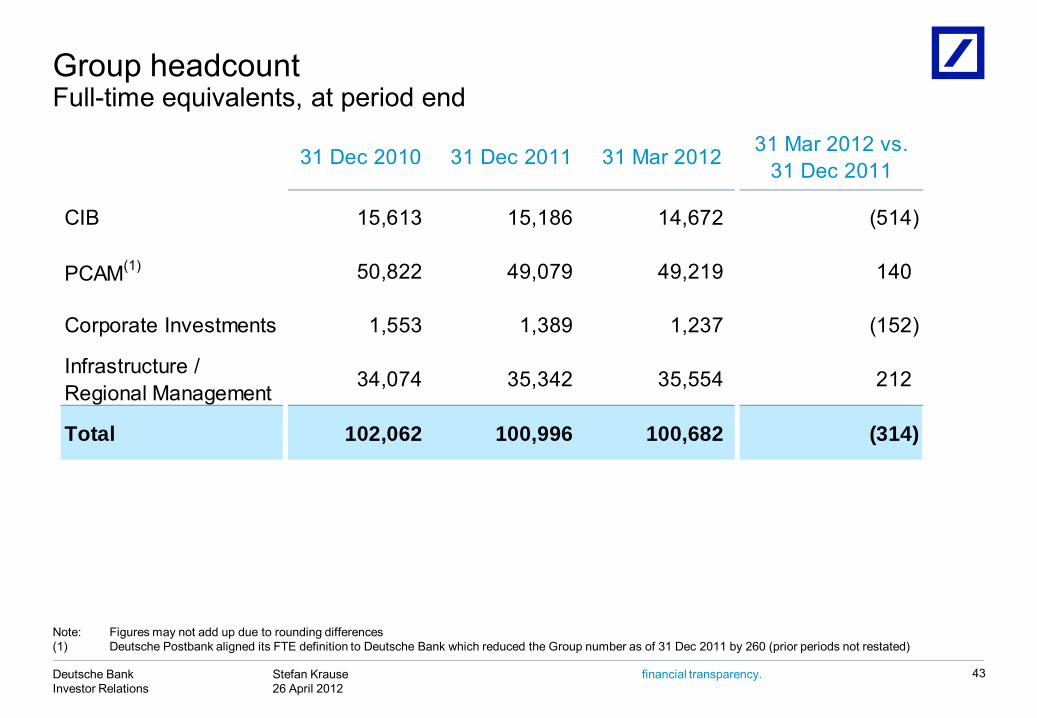
Group headcountFull-time equivalents, at period end
Note: Figures may not add up due to rounding differences(1) Deutsche Postbank aligned its FTE definition to Deutsche Bank which reduced the Group number as of 31 Dec 2011 by 260 (prior periods not restated)
31 Dec 2010 31 Dec 2011 31 Mar 2012 31 Mar 2012 vs. 31 Dec 2011
CCIB 15,613 15,186 14,672 (514)
PPCAM(1) 50,822 49,079 49,219 140
CCorporate Investments 1,553 1,389 1,237 (152)
IInfrastructure / Regional Management
34,074 35,342 35,554 212
GTotal 102,062 100,996 100,682 (314)
Stefan Krause26 April 2012
Deutsche BankInvestor Relations
financial transparency.
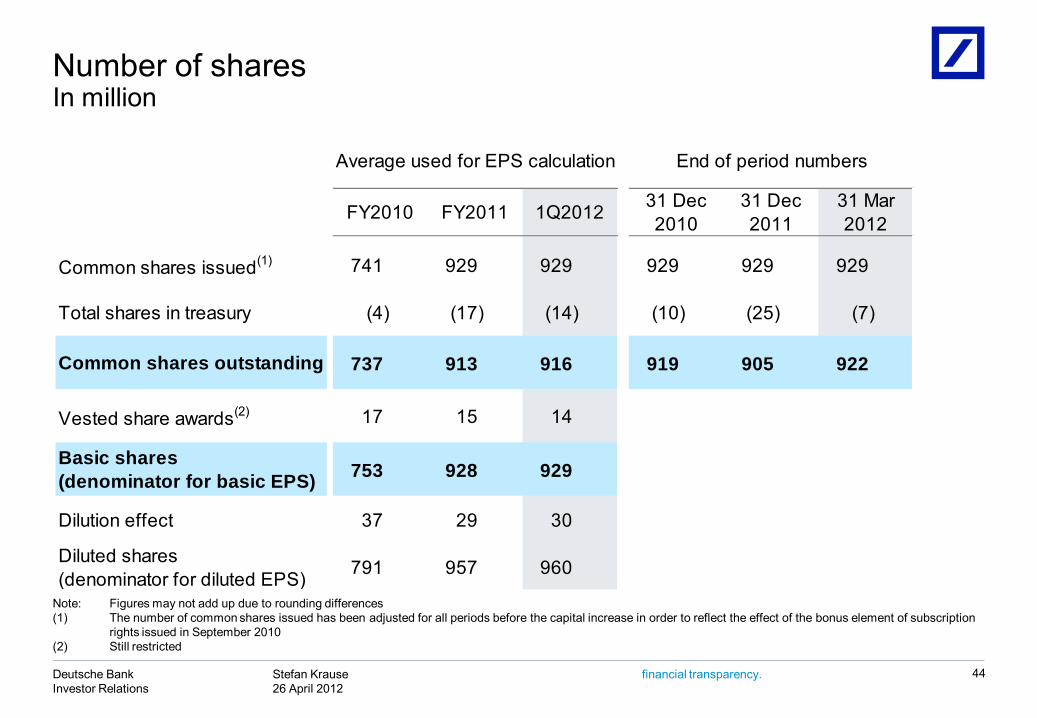
Number of sharesIn million
44
Note: Figures may not add up due to rounding differences(1) The number of common shares issued has been adjusted for all periods before the capital increase in order to reflect the effect of the bonus element of subscription
rights issued in September 2010(2) Still restricted
FY2010 FY2011 1Q2012 31 Dec2010
31 Dec2011
31 Mar2012
Common shares issued(1) 741 929 929 929 929 929
Total shares in treasury (4) (17) (14) (10) (25) (7)
737 913 916 919 905 922
Vested share awards(2) 17 15 14
753 928 929
Dilution effect 37 29 30
791 957 960
Common shares outstanding
End of period numbersAverage used for EPS calculation
Basic shares(denominator for basic EPS)
Diluted shares(denominator for diluted EPS)

Stefan Krause26 April 2012
Deutsche BankInvestor Relations
financial transparency.
Invested assets(1) reportIn EUR bn
45
Note: Figures may not add up due to rounding differences (1) Assets held by Deutsche Bank on behalf of customers for investment purposes and / or managed by Deutsche Bank on a discretionary or advisory basis or deposited
with Deutsche Bank(2) Life insurance surrender value
1Q11 1Q12Asset and Wealth Management 799 797 780 813 820 (2) (8)Asset Management 529 523 516 544 542 (5) (10)Institutional 164 163 162 174 174 (4) 0Retail 175 173 157 164 169 1 (2)Alternatives 46 45 46 49 47 0 (0)Insurance 143 142 150 157 151 (3) (7)
Private Wealth Management 271 274 264 269 278 3 2Private & Business Clients 313 313 303 304 308 7 (1)
Securities 129 129 117 121 128 1 1Deposits excl. sight deposits 171 171 173 170 168 6 (2)Insurance(2) 13 13 13 13 13 0 0
PCAM 1,112 1,109 1,083 1,116 1,128 5 (10)
31 Mar 201231 Dec 201130 Sep 2011Net new money
31 Mar 2011 30 Jun 2011
Stefan Krause26 April 2012
Deutsche BankInvestor Relations
financial transparency.
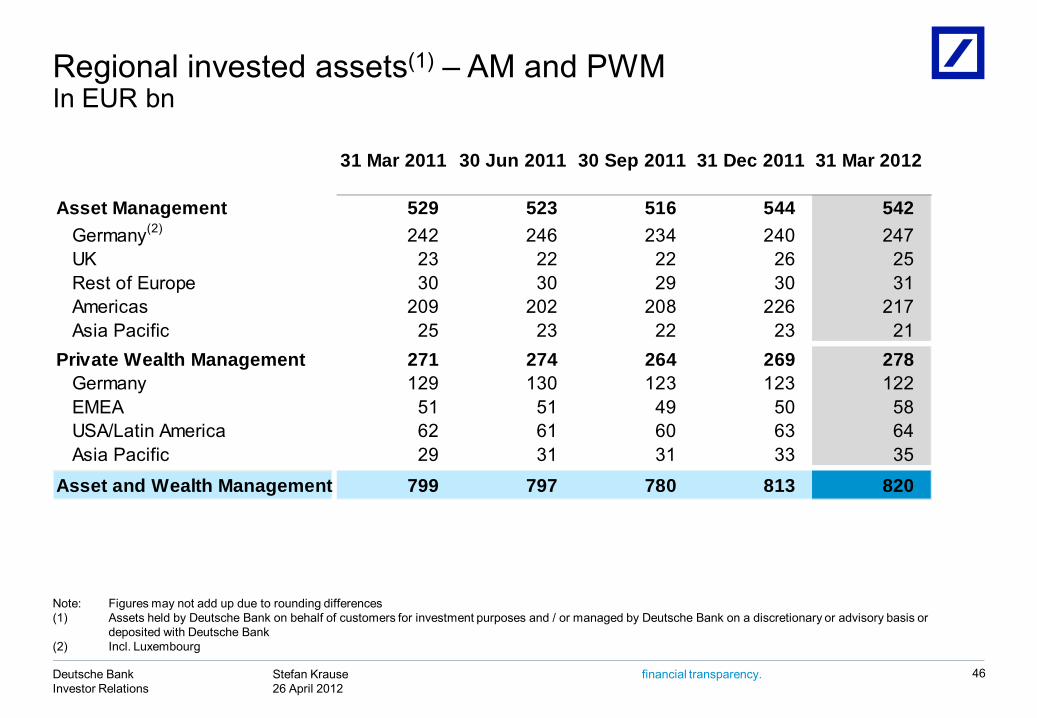
Regional invested assets(1) – AM and PWMIn EUR bn
46
Note: Figures may not add up due to rounding differences(1) Assets held by Deutsche Bank on behalf of customers for investment purposes and / or managed by Deutsche Bank on a discretionary or advisory basis or
deposited with Deutsche Bank (2) Incl. Luxembourg
31 Mar 2011 30 Jun 2011 30 Sep 2011 31 Dec 2011 31 Mar 2012
Asset Management 529 523 516 544 542Germany(2) 242 246 234 240 247UK 23 22 22 26 25Rest of Europe 30 30 29 30 31Americas 209 202 208 226 217Asia Pacific 25 23 22 23 21
Private Wealth Management 271 274 264 269 278Germany 129 130 123 123 122EMEA 51 51 49 50 58USA/Latin America 62 61 60 63 64Asia Pacific 29 31 31 33 35
Asset and Wealth Management 799 797 780 813 820
Stefan Krause26 April 2012
Deutsche BankInvestor Relations
financial transparency.
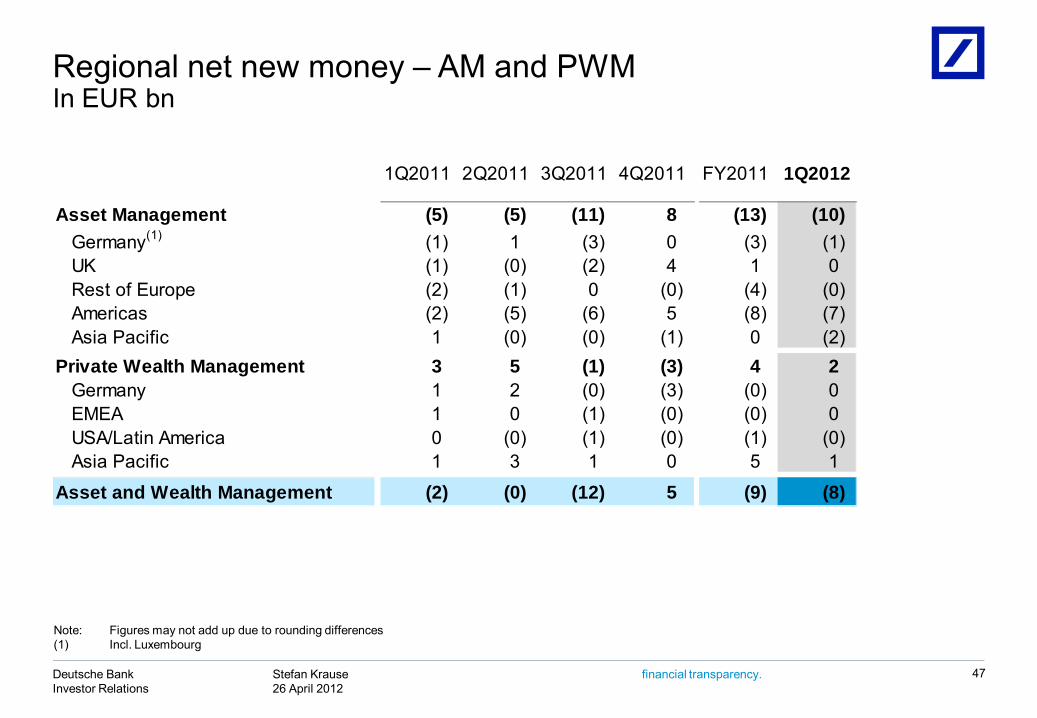
Regional net new money – AM and PWMIn EUR bn
47
Note: Figures may not add up due to rounding differences(1) Incl. Luxembourg
1Q2011 2Q2011 3Q2011 4Q2011 FY2011 1Q2012
Asset Management (5) (5) (11) 8 (13) (10)Germany(1) (1) 1 (3) 0 (3) (1)UK (1) (0) (2) 4 1 0Rest of Europe (2) (1) 0 (0) (4) (0)Americas (2) (5) (6) 5 (8) (7)Asia Pacific 1 (0) (0) (1) 0 (2)
Private Wealth Management 3 5 (1) (3) 4 2Germany 1 2 (0) (3) (0) 0EMEA 1 0 (1) (0) (0) 0USA/Latin America 0 (0) (1) (0) (1) (0)Asia Pacific 1 3 1 0 5 1
Asset and Wealth Management (2) (0) (12) 5 (9) (8)
Stefan Krause26 April 2012
Deutsche BankInvestor Relations
financial transparency.
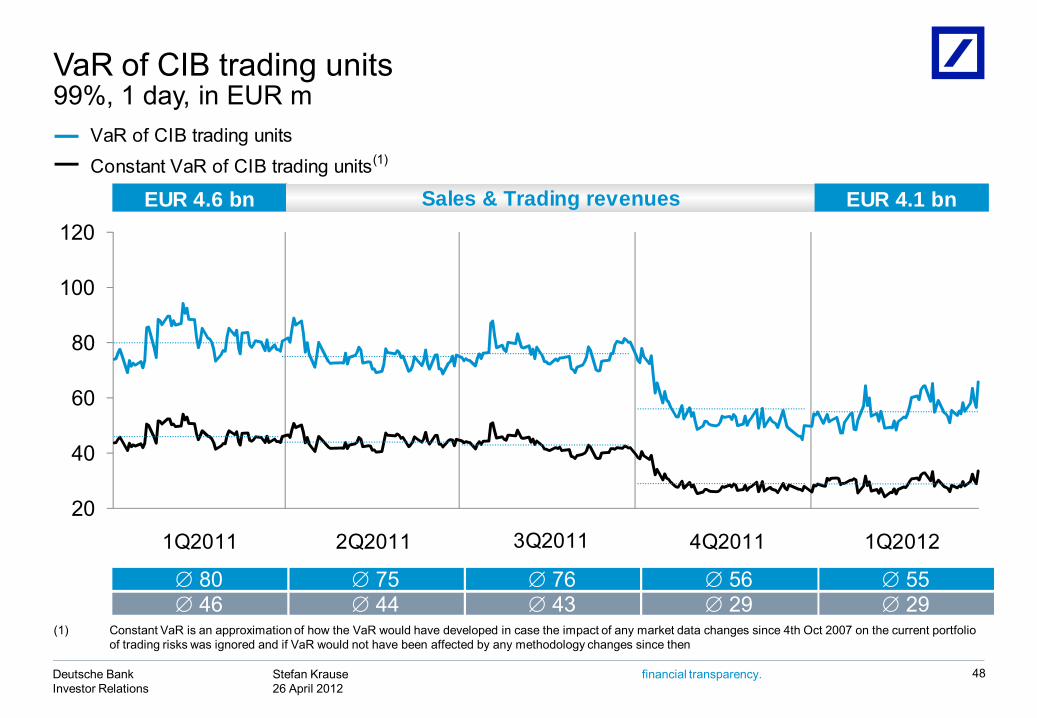
EUR 4.6 bn EUR 4.1 bn
1Q2011 2Q2011 4Q2011 1Q20123Q2011
Sales & Trading revenues
VaR of CIB trading unitsConstant VaR of CIB trading units(1)
99%, 1 day, in EUR mVaR of CIB trading units
48
20
40
60
80
100
120
76 43
75 44
55 29
80 46
56 29
(1) Constant VaR is an approximation of how the VaR would have developed in case the impact of any market data changes since 4th Oct 2007 on the current portfolio of trading risks was ignored and if VaR would not have been affected by any methodology changes since then
Stefan Krause26 April 2012
Deutsche BankInvestor Relations
financial transparency.
This presentation contains forward-looking statements. Forward-looking statements are statements that are not historicalfacts; they include statements about our beliefs and expectations and the assumptions underlying them. Thesestatements are based on plans, estimates and projections as they are currently available to the management of DeutscheBank. Forward-looking statements therefore speak only as of the date they are made, and we undertake no obligation toupdate publicly any of them in light of new information or future events.
By their very nature, forward-looking statements involve risks and uncertainties. A number of important factors couldtherefore cause actual results to differ materially from those contained in any forward-looking statement. Such factorsinclude the conditions in the financial markets in Germany, in Europe, in the United States and elsewhere from which wederive a substantial portion of our revenues and in which we hold a substantial portion of our assets, the development ofasset prices and market volatility, potential defaults of borrowers or trading counterparties, the implementation of ourstrategic initiatives, the reliability of our risk management policies, procedures and methods, and other risks referenced inour filings with the U.S. Securities and Exchange Commission. Such factors are described in detail in our SEC Form20-F of 20 March 2012 under the heading “Risk Factors.” Copies of this document are readily available upon request orcan be downloaded from www.deutsche-bank.com/ir.
This presentation also contains non-IFRS financial measures. For a reconciliation to directly comparable figures reportedunder IFRS, to the extent such reconciliation is not provided in this presentation, refer to the 1Q2012 Financial DataSupplement, which is accompanying this presentation and available at www.deutsche-bank.com/ir.
Cautionary statements
49