Embed Size (px)
Citation preview
1H 2008 Results
7 August 2008Results Conference Call Presentation
1H 2008 – Conference Call Presentation
1
DISCLAIMER
Forward looking statementsHellenic Petroleum do not in general publish forecasts regarding their future financial results. The financial forecasts contained in this document are based on a series of assumptions, which are subject to the occurrence of events that can neither be reasonably foreseen by Hellenic Petroleum, nor are within Hellenic Petroleum's control. The said forecasts represent management's estimates, and should be treated as mere estimates. There is no certainty that the actual financial results of Hellenic Petroleum will be in line with the forecasted ones.
In particular, the actual results may differ (even materially) from the forecasted ones due to, among other reasons, changes in the financial conditions within Greece, fluctuations in the prices of crude oil and oil products in general, as well as fluctuations in foreign currencies rates, international petrochemicals prices, changes in supply and demand and changes of weather conditions. Consequently, it should be stressed that Hellenic Petroleum do not, and could not reasonably be expected to, provide any representation or guarantee, with respect to the creditworthiness of the forecasts.
This presentation also contains certain financial information and key performance indicators which are primarily focused at providing a “business” perspective and as a consequence may not be presented in accordance with International Financial Reporting Standards (IFRS).
1H 2008 – Conference Call Presentation
2
• 1H 2008 Results Highlights
• Business Units Performance
• Financial Results
• Strategy Update
• Q&A
AGENDA
1H 2008 – Conference Call Presentation
3
2Q 2008 RESULTS HIGHLIGHTS
2Q Reported EBITDA up 6% and Net Income up 3%, as the poor margin environment and weak €/$ were offset by inventory gains (net of the €/$ impact), operating efficiencies and trading results and higher profitability in Marketing and Power & Gas
• 2Q EBITDA amounted to €221m (1H: €362m, +17%), up 6% from last year. Excluding the inventory effect, ‘Clean’ EBITDA stood at €129m (1H: €226m)
• 2Q Comparable EBITDA (ie Clean EBITDA adjusted for FX and one-off items) fell 7% to €149m, as the y-o-y drop in refining margins was partly offset by yield improvements, trading results and continued strength in Marketing and Power & Gas, as well as tight cost management
• DEPA (in which we hold a 35% stake) contributed to group results €12m, a quadrupling over 2Q07 levels, driven by improving market dynamics and the company’s strengthening performance
• Net Income at €130m and EPS at €0.43, bringing 1H08 Net Income and EPS to €227m and €0.74, respectively, higher by 25% y-o-y. Annualized ROE at 16% and ROACE at 12%
• Capital expenditure in the quarter amounted to €70m, with key refinery upgrade projects rolling out and International Marketing growth accelerating
1H 2008 – Conference Call Presentation
4
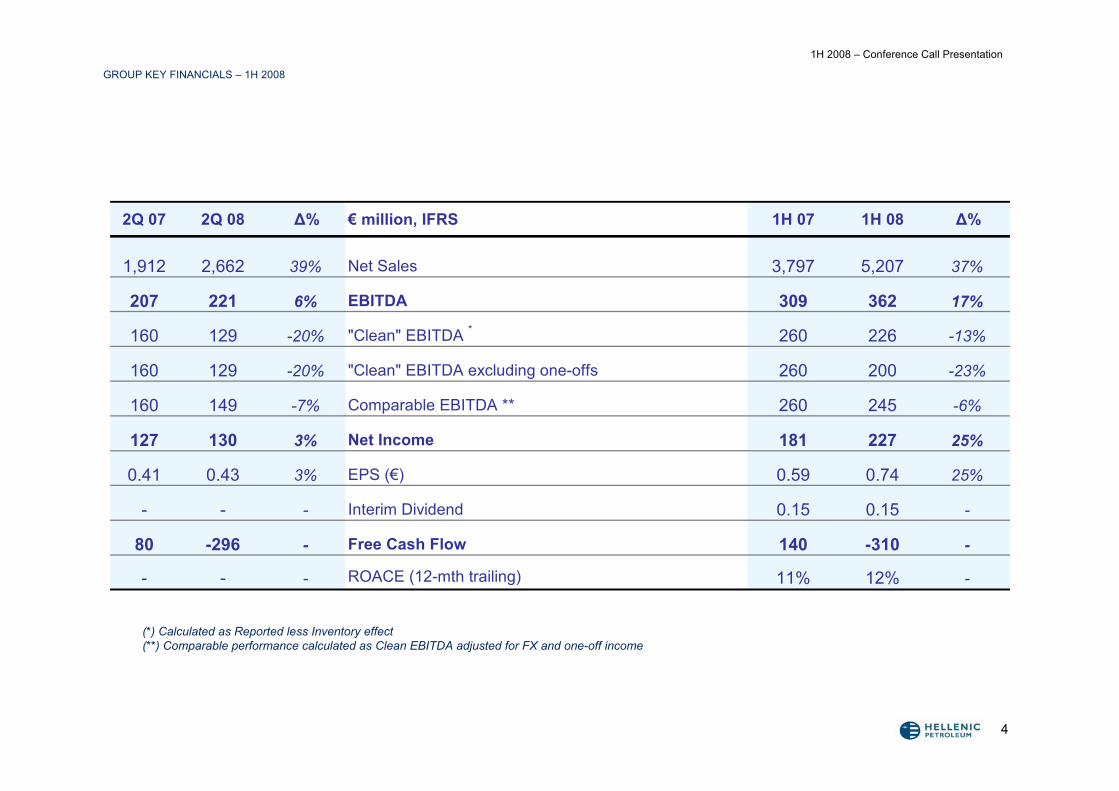
GROUP KEY FINANCIALS – 1H 2008
(*) Calculated as Reported less Inventory effect(**) Comparable performance calculated as Clean EBITDA adjusted for FX and one-off income
2Q 07 2Q 08 Δ% € million, IFRS 1H 07 1H 08 Δ%
1,912 2,662 39% Net Sales 3,797 5,207 37%
207 221 6% EBITDA 309 362 17%
160 129 -20% "Clean" EBITDA * 260 226 -13%
160 129 -20% "Clean" EBITDA excluding one-offs 260 200 -23%
160 149 -7% Comparable EBITDA ** 260 245 -6%
127 130 3% Net Income 181 227 25%
0.41 0.43 3% EPS (€) 0.59 0.74 25%
- - - Interim Dividend 0.15 0.15 -
80 -296 - Free Cash Flow 140 -310 -
- - - ROACE (12-mth trailing) 11% 12% -
1H 2008 – Conference Call Presentation
5
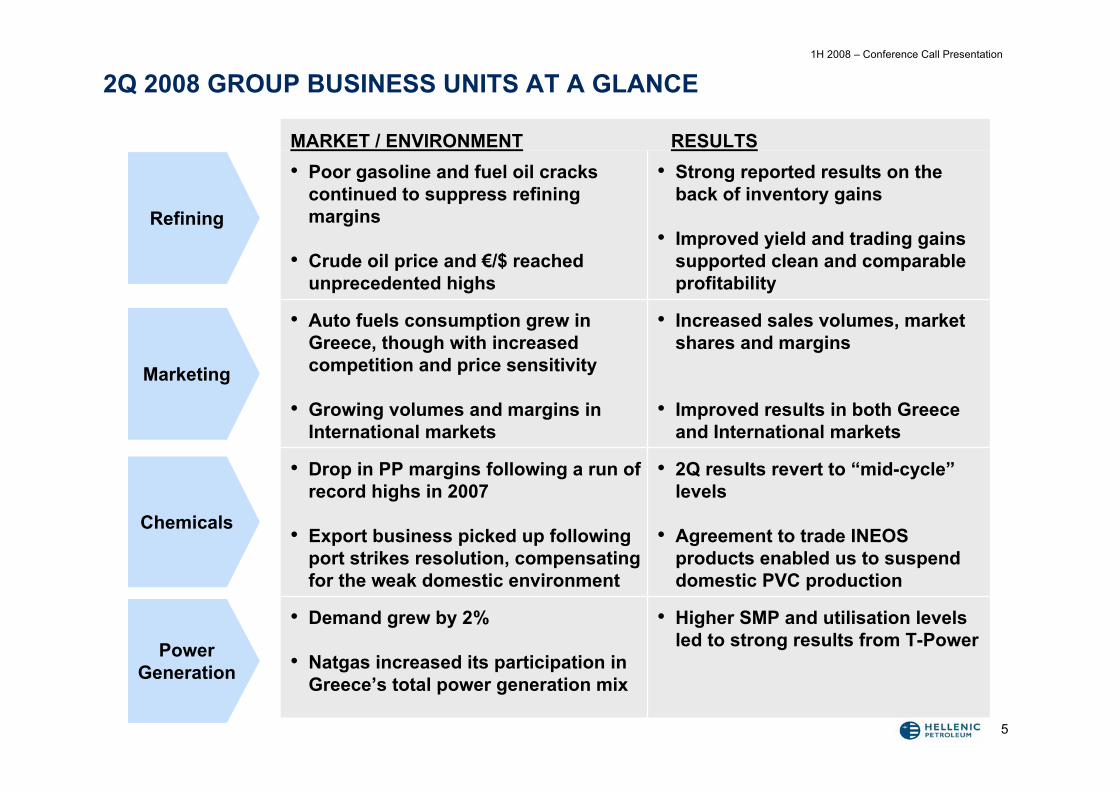
2Q 2008 GROUP BUSINESS UNITS AT A GLANCE
Marketing
Chemicals
PowerGeneration
Refining
• Higher SMP and utilisation levels led to strong results from T-Power
• Demand grew by 2%
• Natgas increased its participation in Greece’s total power generation mix
• 2Q results revert to “mid-cycle”levels
• Agreement to trade INEOS products enabled us to suspend domestic PVC production
• Drop in PP margins following a run of record highs in 2007
• Export business picked up following port strikes resolution, compensating for the weak domestic environment
• Increased sales volumes, market shares and margins
• Improved results in both Greece and International markets
• Auto fuels consumption grew in Greece, though with increased competition and price sensitivity
• Growing volumes and margins in International markets
• Strong reported results on the back of inventory gains
• Improved yield and trading gains supported clean and comparable profitability
• Poor gasoline and fuel oil cracks continued to suppress refining margins
• Crude oil price and €/$ reached unprecedented highs
RESULTSMARKET / ENVIRONMENT
1H 2008 – Conference Call Presentation
6
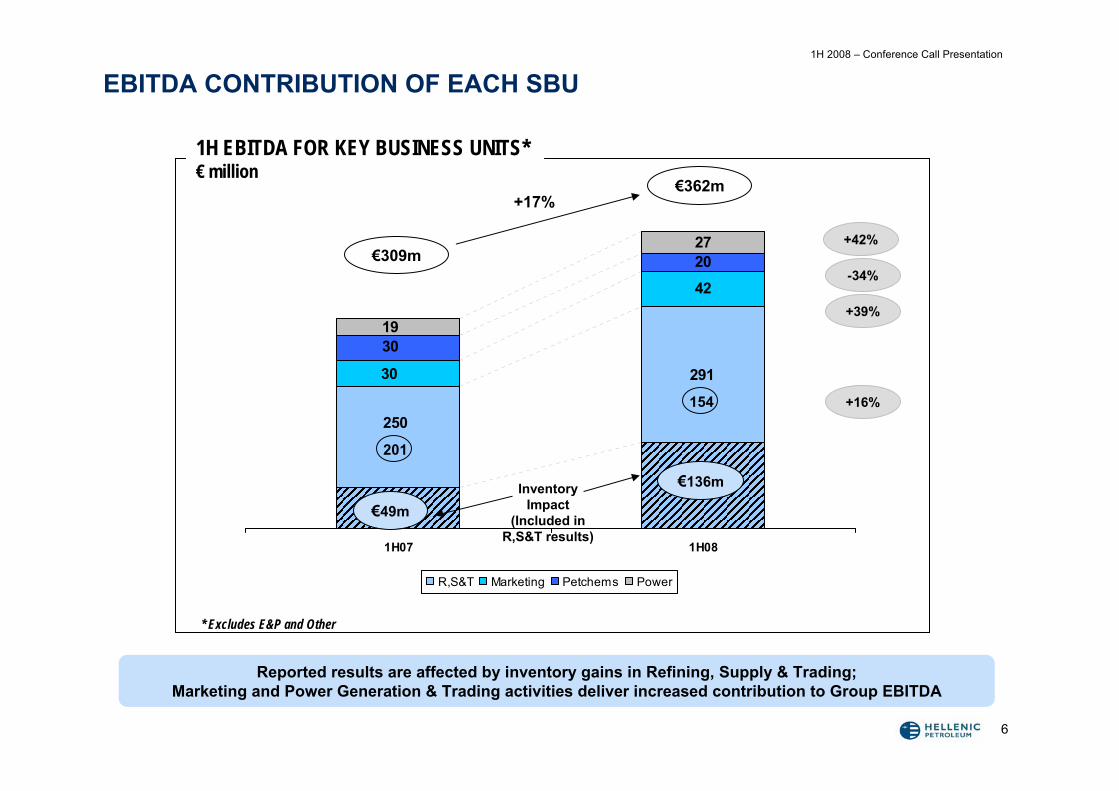
EBITDA CONTRIBUTION OF EACH SBU
42
20
291
250
30
30
27
19
1H07 1H08
R,S&T Marketing Petchems Power
Reported results are affected by inventory gains in Refining, Supply & Trading; Marketing and Power Generation & Trading activities deliver increased contribution to Group EBITDA
1H EBITDA FOR KEY BUSINESS UNITS*€ million
+42%
-34%
+39%
+16%
€309m
€362m+17%
€49m
€136mInventory Impact
(Included in R,S&T results)
* Excludes E&P and Other
201
154
1H 2008 – Conference Call Presentation
7
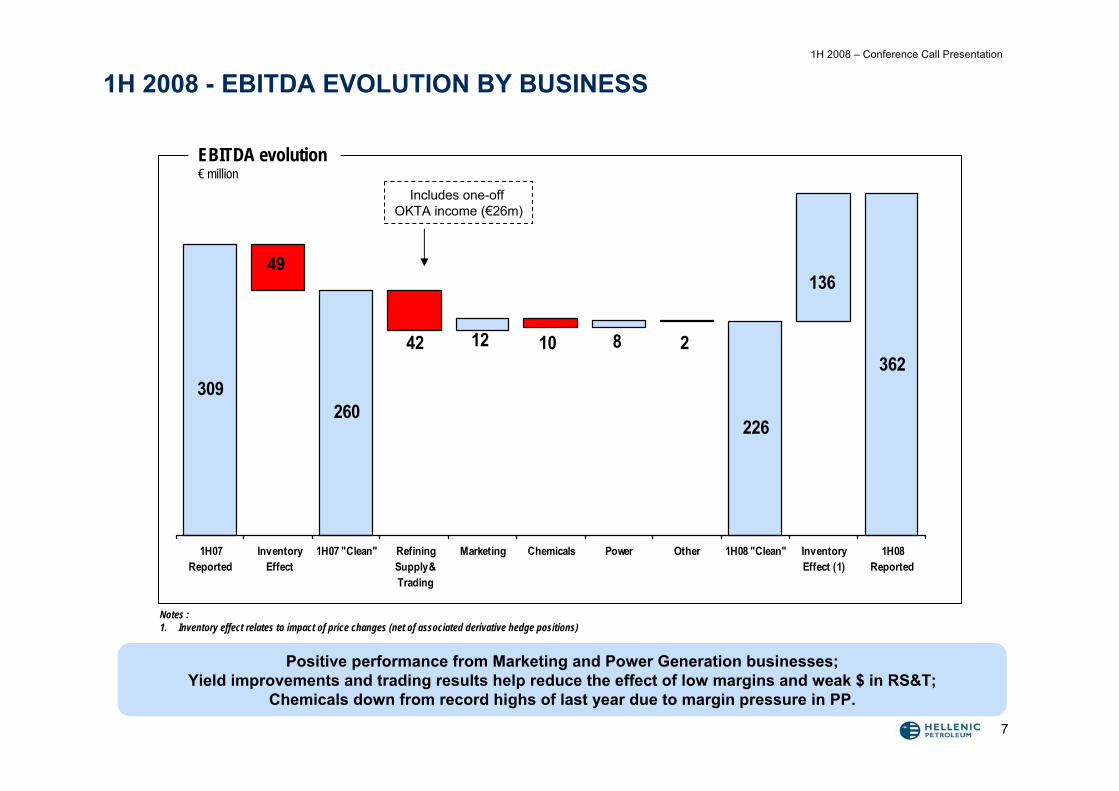
1H 2008 - EBITDA EVOLUTION BY BUSINESS
Positive performance from Marketing and Power Generation businesses; Yield improvements and trading results help reduce the effect of low margins and weak $ in RS&T;
Chemicals down from record highs of last year due to margin pressure in PP.
Notes :1. Inventory effect relates to impact of price changes (net of associated derivative hedge positions)
309260
226
36212 10 8 242
49136
1H07Reported
InventoryEffect
1H07 "Clean" RefiningSupply &Trading
Marketing Chemicals Power Other 1H08 "Clean" InventoryEffect (1)
1H08Reported
EBITDA evolution€ million
Includes one-off OKTA income (€26m)
1H 2008 – Conference Call Presentation
8
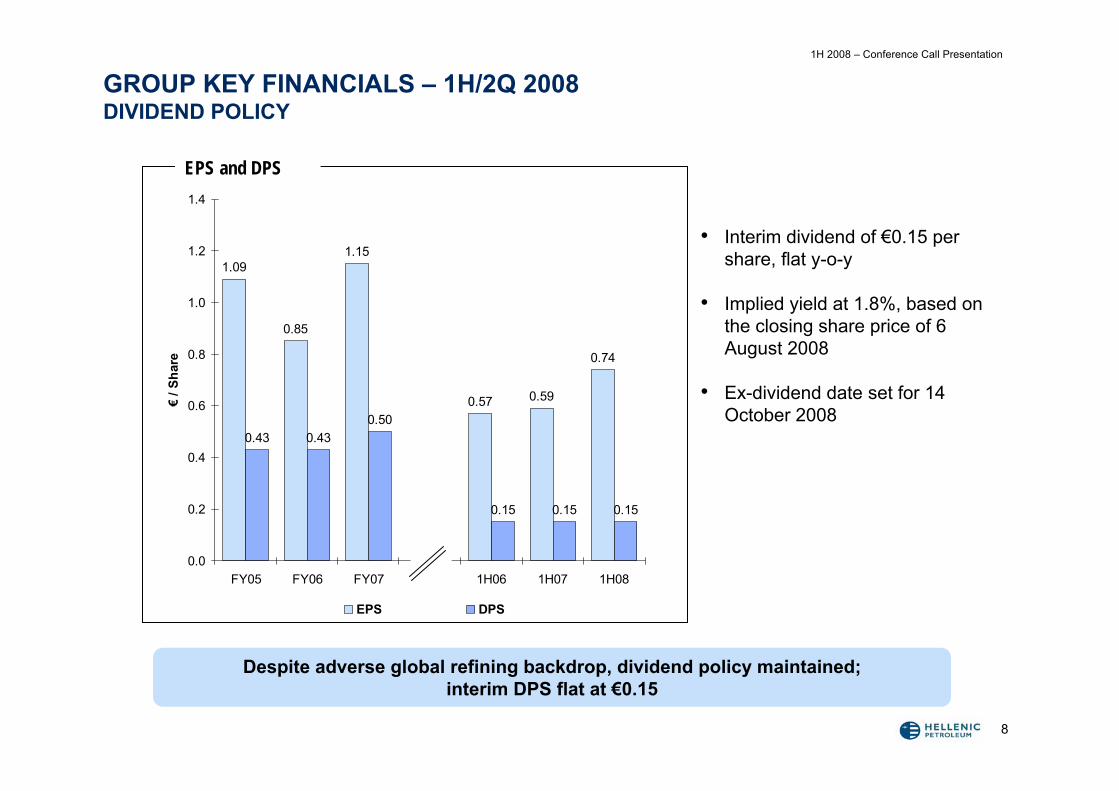
GROUP KEY FINANCIALS – 1H/2Q 2008 DIVIDEND POLICY
1.09
0.85
1.15
0.57 0.59
0.74
0.43 0.430.50
0.15 0.15 0.15
0.0
0.2
0.4
0.6
0.8
1.0
1.2
1.4
FY05 FY06 FY07 1H06 1H07 1H08
€ / S
hare
EPS DPS
Despite adverse global refining backdrop, dividend policy maintained;interim DPS flat at €0.15
EPS and DPS
• Interim dividend of €0.15 per share, flat y-o-y
• Implied yield at 1.8%, based on the closing share price of 6 August 2008
• Ex-dividend date set for 14 October 2008
1H 2008 – Conference Call Presentation
9
• 1H 2008 Results Highlights
• Business Unit Performance
• Financial Results
• Strategy Update
• Q&A
AGENDA
1H 2008 – Conference Call Presentation
10
• Refining
• Marketing
• Petrochemicals
• Power
• E&P
• Gas
BUSINESS UNITS PERFORMANCE
1H 2008 – Conference Call Presentation
11
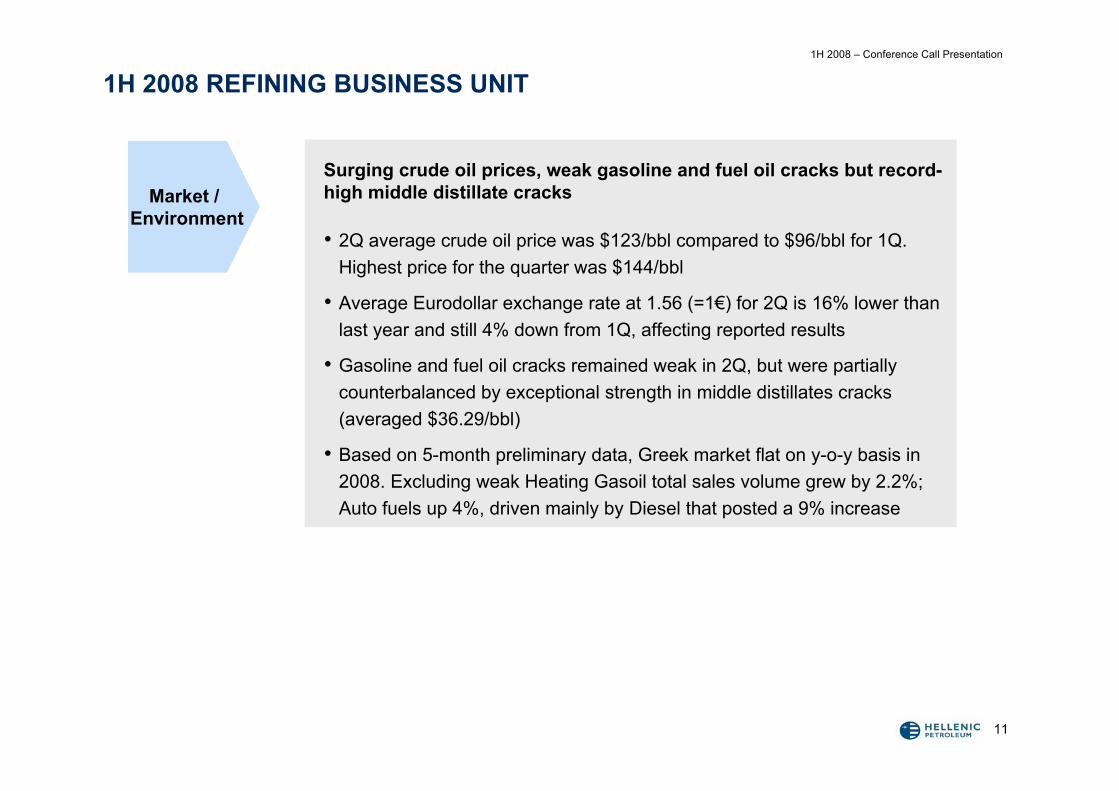
1H 2008 REFINING BUSINESS UNIT
Surging crude oil prices, weak gasoline and fuel oil cracks but record-high middle distillate cracks
• 2Q average crude oil price was $123/bbl compared to $96/bbl for 1Q. Highest price for the quarter was $144/bbl
• Average Eurodollar exchange rate at 1.56 (=1€) for 2Q is 16% lower than last year and still 4% down from 1Q, affecting reported results
• Gasoline and fuel oil cracks remained weak in 2Q, but were partially counterbalanced by exceptional strength in middle distillates cracks (averaged $36.29/bbl)
• Based on 5-month preliminary data, Greek market flat on y-o-y basis in 2008. Excluding weak Heating Gasoil total sales volume grew by 2.2%; Auto fuels up 4%, driven mainly by Diesel that posted a 9% increase
Market / Environment
1H 2008 – Conference Call Presentation
12
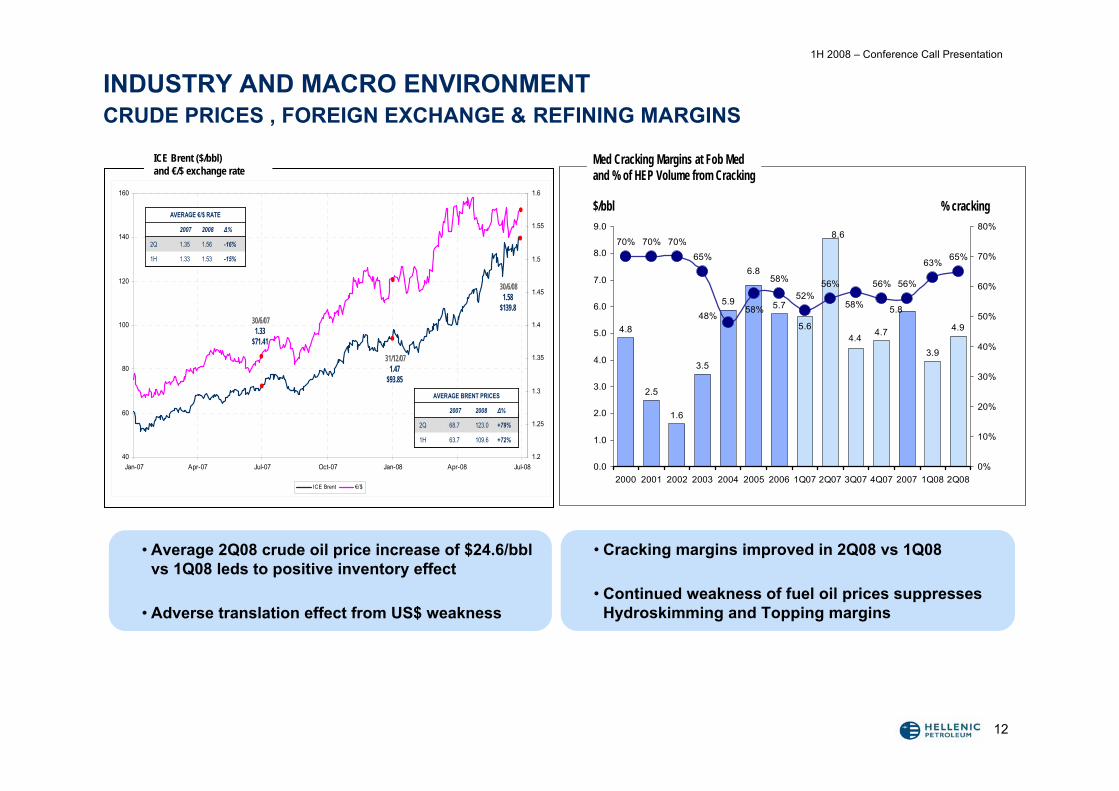
INDUSTRY AND MACRO ENVIRONMENTCRUDE PRICES , FOREIGN EXCHANGE & REFINING MARGINS
• Cracking margins improved in 2Q08 vs 1Q08
• Continued weakness of fuel oil prices suppresses Hydroskimming and Topping margins
• Average 2Q08 crude oil price increase of $24.6/bbl vs 1Q08 leds to positive inventory effect
• Adverse translation effect from US$ weakness
ICE Brent ($/bbl)and €/$ exchange rate
40
60
80
100
120
140
160
Jan-07 Apr-07 Jul-07 Oct-07 Jan-08 Apr-08 Jul-081.2
1.25
1.3
1.35
1.4
1.45
1.5
1.55
1.6
ICE Brent €/$
-15%1.531.331H
-16%1.561.352Q
Δ%20082007
AVERAGE €/$ RATE
-15%1.531.331H
-16%1.561.352Q
Δ%20082007
AVERAGE €/$ RATE
+72%109.663.71H
+79%123.068.72Q
Δ%20082007
AVERAGE BRENT PRICES
+72%109.663.71H
+79%123.068.72Q
Δ%20082007
AVERAGE BRENT PRICES
31/12/071.47
$93.85
30/6/081.58
$139.830/6/071.33
$71.41
Med Cracking Margins at Fob Med and % of HEP Volume from Cracking
4.8
2.5
1.6
3.5
5.9 5.7
4.7 4.95.6
5.8
8.6
6.8
3.94.4
70% 70% 70%
65%
58%
52%56% 56% 56%
63%65%
58%58%48%
0.0
1.0
2.0
3.0
4.0
5.0
6.0
7.0
8.0
9.0
2000 2001 2002 2003 2004 2005 2006 1Q07 2Q07 3Q07 4Q07 2007 1Q08 2Q080%
10%
20%
30%
40%
50%
60%
70%
80%
$/bbl % cracking
1H 2008 – Conference Call Presentation
13
1H 2008 REFINING BUSINESS UNIT
2Q08 EBITDA at €191m, driven by inventory gains as well as improvements in underlying operating performance
• Improved margins, yields and trading gains led 2Q08 Clean EBITDA higher by 241% q-o-q to €99m, though 23% lower on a y-o-y basis. Stripping out FX fluctuations, EBITDA on a comparable basis was down 8% vs 2Q07
• Improved refinery yields due to the switch to lighter crude feedstock; increased production of lighter products helps mitigate the y-o-y impact of lower margins on profitability
• Overall 2Q sales volume flat y-o-y, but with an improved mix: lower Heating Gasoil sales and PPC-related fuel oil off-takes compensated by increased sales for auto fuels, bunkering and aviation
• 2Q refinery production reached 3.3m M/T, down -14% following the planned Thessaloniki shut-down for maintenance
Results / Operations
1H 2008 – Conference Call Presentation
14
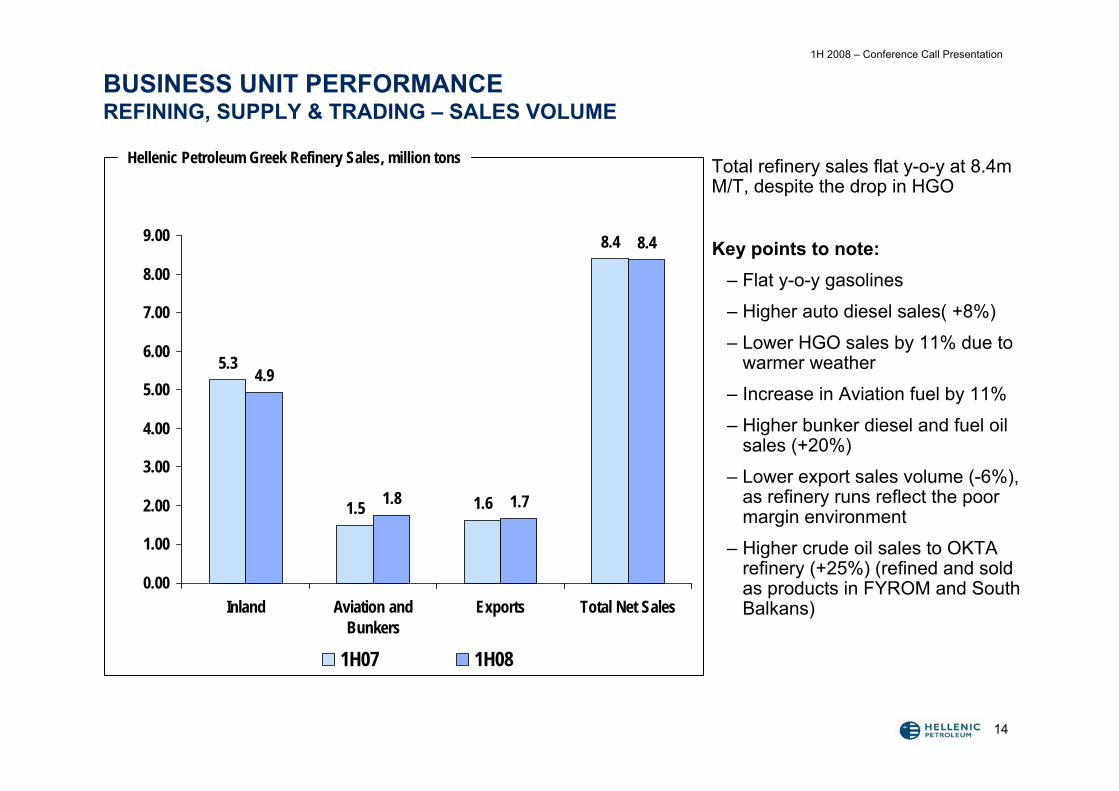
BUSINESS UNIT PERFORMANCEREFINING, SUPPLY & TRADING – SALES VOLUME
5.3
1.5 1.6
8.4
4.9
1.8 1.7
8.4
0.00
1.00
2.00
3.00
4.00
5.00
6.00
7.00
8.00
9.00
Inland Aviation andBunkers
Exports Total Net Sales
1H07 1H08
Total refinery sales flat y-o-y at 8.4m M/T, despite the drop in HGO
Key points to note:– Flat y-o-y gasolines
– Higher auto diesel sales( +8%)
– Lower HGO sales by 11% due to warmer weather
– Increase in Aviation fuel by 11%
– Higher bunker diesel and fuel oil sales (+20%)
– Lower export sales volume (-6%), as refinery runs reflect the poor margin environment
– Higher crude oil sales to OKTA refinery (+25%) (refined and sold as products in FYROM and South Balkans)
Hellenic Petroleum Greek Refinery Sales, million tons
1H 2008 – Conference Call Presentation
15
Q2 IFRS FINANCIAL STATEMENTS HALF YEAR2007 2008 Δ% € MILLION 2007 2008 Δ%
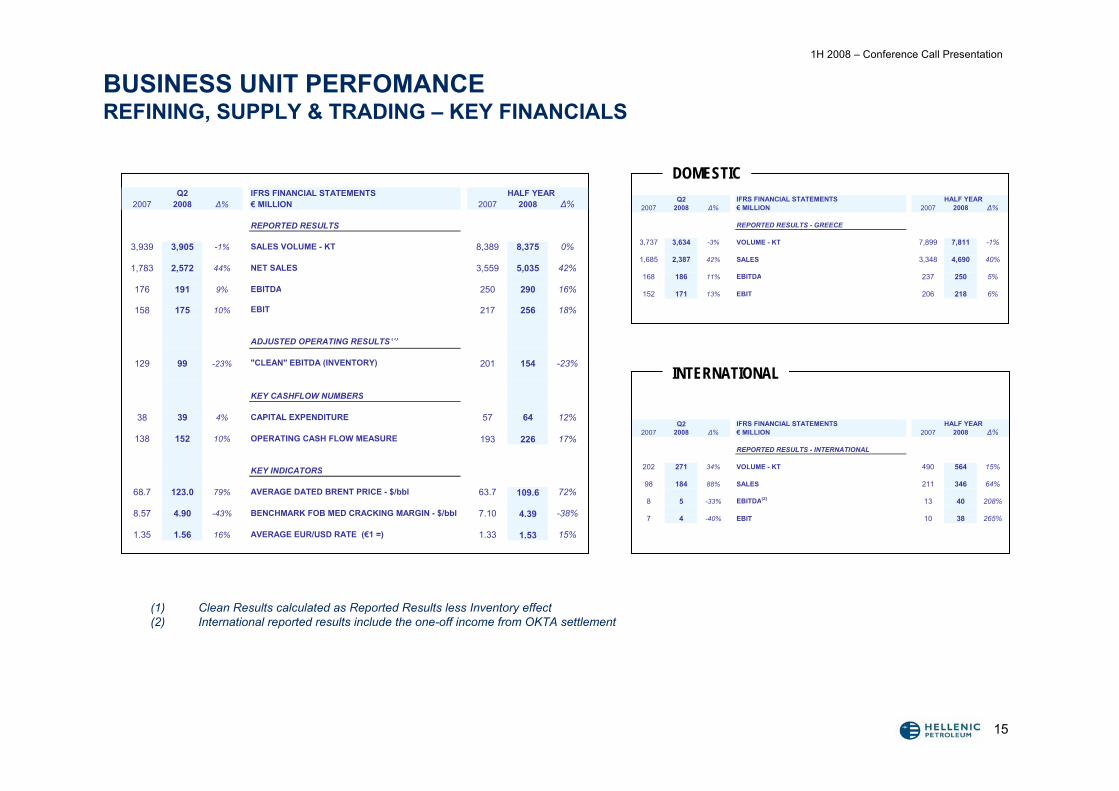
REPORTED RESULTS - GREECE
3,737 3,634 -3% VOLUME - KT 7,899 7,811 -1%
1,685 2,387 42% SALES 3,348 4,690 40%
168 186 11% EBITDA 237 250 5%
152 171 13% EBIT 206 218 6%
Q2 IFRS FINANCIAL STATEMENTS HALF YEAR2007 2008 Δ% € MILLION 2007 2008 Δ%
REPORTED RESULTS - INTERNATIONAL
202 271 34% VOLUME - KT 490 564 15%
98 184 88% SALES 211 346 64%
8 5 -33% EBITDA(2) 13 40 208%
7 4 -40% EBIT 10 38 265%
BUSINESS UNIT PERFOMANCEREFINING, SUPPLY & TRADING – KEY FINANCIALS
(1) Clean Results calculated as Reported Results less Inventory effect(2) International reported results include the one-off income from OKTA settlement
DOMESTIC
INTERNATIONAL
Q2 IFRS FINANCIAL STATEMENTS HALF YEAR2007 2008 Δ% € MILLION 2007 2008 Δ%
REPORTED RESULTS
3,939 3,905 -1% SALES VOLUME - KT 8,389 8,375 0%
1,783 2,572 44% NET SALES 3,559 5,035 42%
176 191 9% EBITDA 250 290 16%
158 175 10% EBIT 217 256 18%
ADJUSTED OPERATING RESULTS (1)
129 99 -23% "CLEAN" EBITDA (INVENTORY) 201 154 -23%
KEY CASHFLOW NUMBERS
38 39 4% CAPITAL EXPENDITURE 57 64 12%
138 152 10% OPERATING CASH FLOW MEASURE 193 226 17%
KEY INDICATORS
68.7 123.0 79% AVERAGE DATED BRENT PRICE - $/bbl 63.7 109.6 72%
8.57 4.90 -43% BENCHMARK FOB MED CRACKING MARGIN - $/bbl 7.10 4.39 -38%
1.35 1.56 16% AVERAGE EUR/USD RATE (€1 =) 1.33 1.53 15%
1H 2008 – Conference Call Presentation
16
• Refining
• Marketing
• Petrochemicals
• Power
• E&P
• Gas
BUSINESS UNITS PERFORMANCE
1H 2008 – Conference Call Presentation
17
1H 2008 MARKETING BUSINESS UNIT
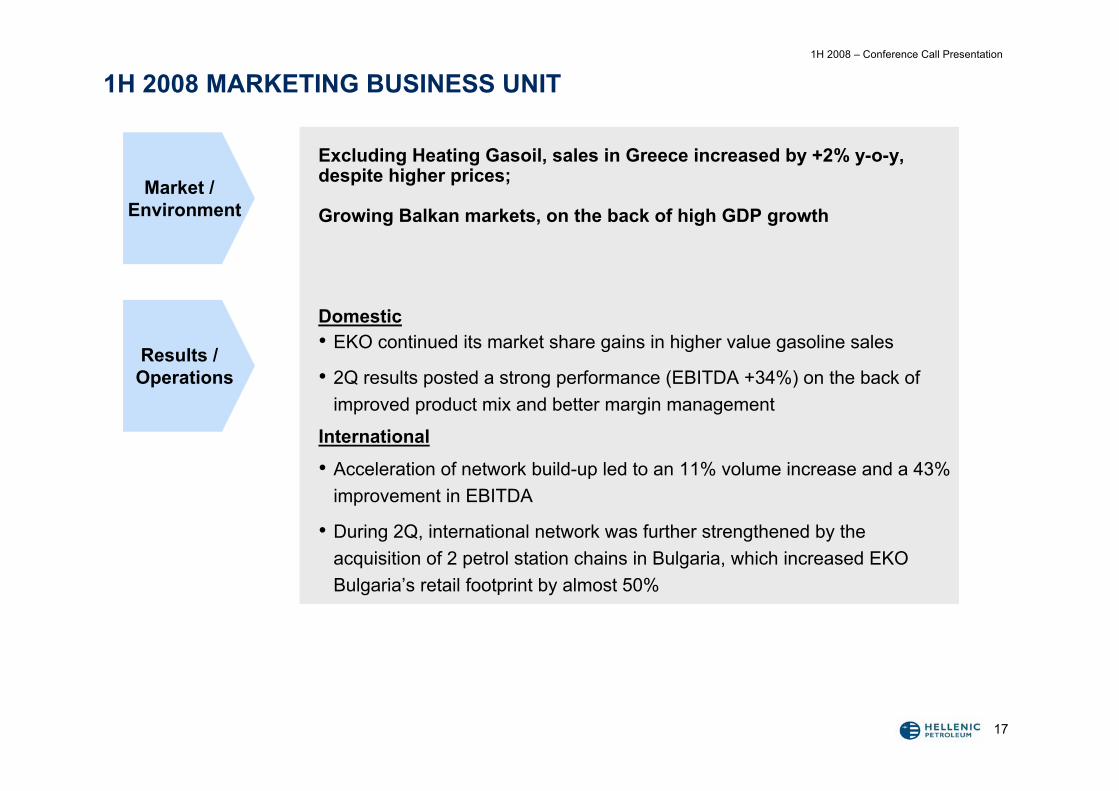
Excluding Heating Gasoil, sales in Greece increased by +2% y-o-y, despite higher prices;
Growing Balkan markets, on the back of high GDP growth
Domestic• EKO continued its market share gains in higher value gasoline sales
• 2Q results posted a strong performance (EBITDA +34%) on the back of improved product mix and better margin management
International
• Acceleration of network build-up led to an 11% volume increase and a 43% improvement in EBITDA
• During 2Q, international network was further strengthened by theacquisition of 2 petrol station chains in Bulgaria, which increased EKO Bulgaria’s retail footprint by almost 50%
Market / Environment
Results / Operations
1H 2008 – Conference Call Presentation
18
BUSINESS UNIT PERFORMANCEMARKETING – KEY FINANCIALS
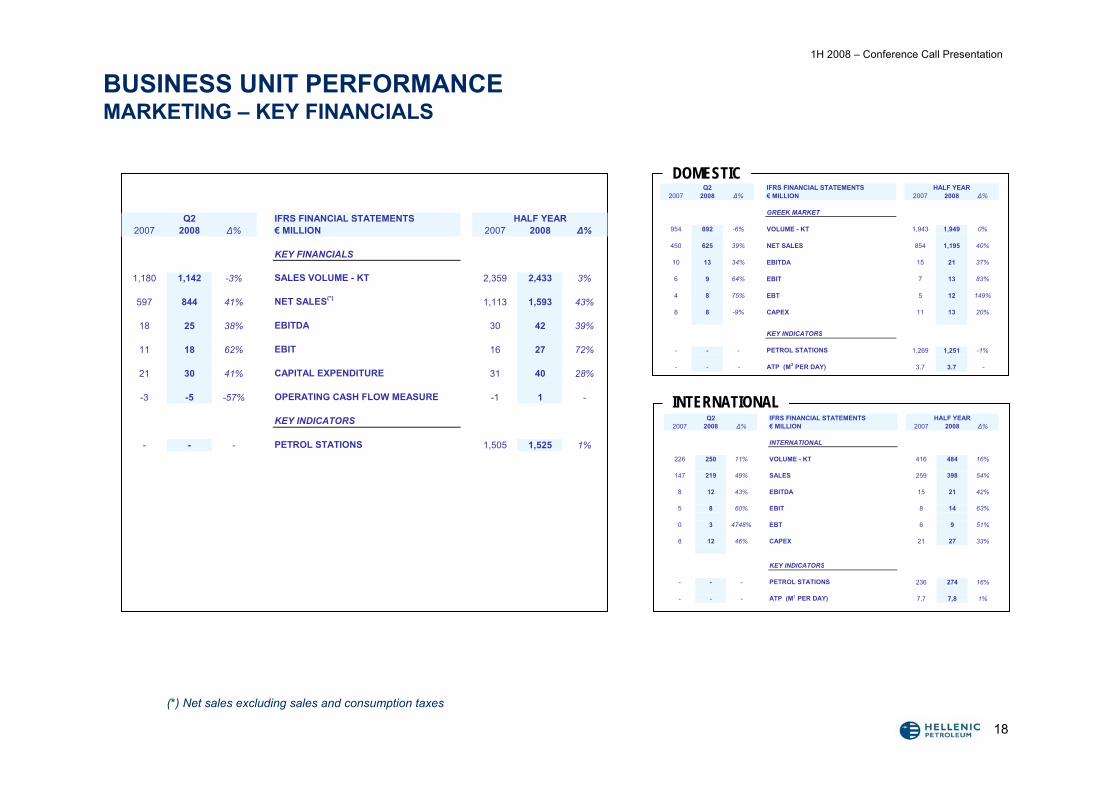
(*) Net sales excluding sales and consumption taxes
DOMESTIC
INTERNATIONAL
Q2 IFRS FINANCIAL STATEMENTS2007 2008 Δ% € MILLION 2007 2008 Δ%
KEY FINANCIALS
1,180 1,142 -3% SALES VOLUME - KT 2,359 2,433 3%
597 844 41% NET SALES(*) 1,113 1,593 43%
18 25 38% EBITDA 30 42 39%
11 18 62% EBIT 16 27 72%
21 30 41% CAPITAL EXPENDITURE 31 40 28%
-3 -5 -57% OPERATING CASH FLOW MEASURE -1 1 -
KEY INDICATORS
- - - PETROL STATIONS 1,505 1,525 1%
HALF YEAR
Q2 IFRS FINANCIAL STATEMENTS2007 2008 Δ% € MILLION 2007 2008 Δ%
GREEK MARKET
954 892 -6% VOLUME - KT 1,943 1,949 0%
450 625 39% NET SALES 854 1,195 40%
10 13 34% EBITDA 15 21 37%
6 9 64% EBIT 7 13 83%
4 8 75% EBT 5 12 149%
8 8 -9% CAPEX 11 13 20%
KEY INDICATORS
- - - PETROL STATIONS 1,269 1,251 -1%
- - - ATP (M3 PER DAY) 3.7 3.7 -
HALF YEAR
Q2 IFRS FINANCIAL STATEMENTS2007 2008 Δ% € MILLION 2007 2008 Δ%
INTERNATIONAL
226 250 11% VOLUME - KT 416 484 16%
147 219 49% SALES 259 398 54%
8 12 43% EBITDA 15 21 42%
5 8 60% EBIT 8 14 63%
0 3 4748% EBT 6 9 51%
8 12 46% CAPEX 21 27 33%
KEY INDICATORS
- - - PETROL STATIONS 236 274 16%
- - - ATP (M3 PER DAY) 7,7 7,8 1%
HALF YEAR
1H 2008 – Conference Call Presentation
19
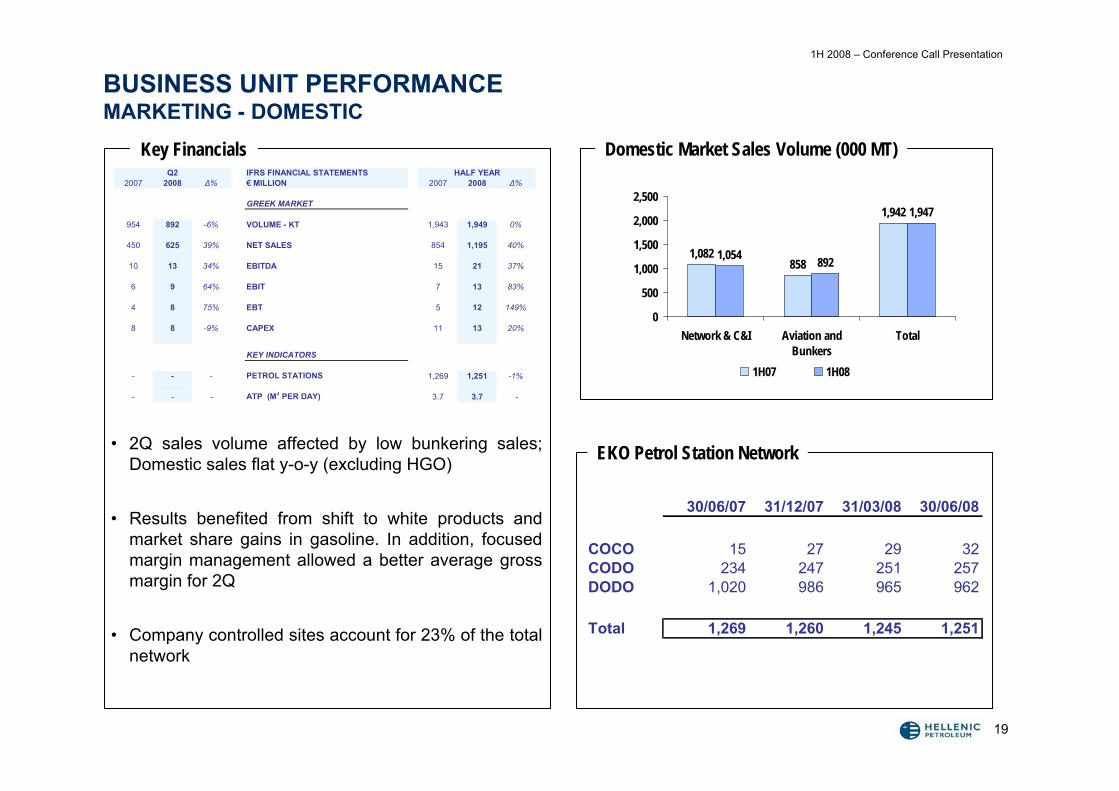
• 2Q sales volume affected by low bunkering sales; Domestic sales flat y-o-y (excluding HGO)
• Results benefited from shift to white products and market share gains in gasoline. In addition, focused margin management allowed a better average gross margin for 2Q
• Company controlled sites account for 23% of the total network
BUSINESS UNIT PERFORMANCEMARKETING - DOMESTIC
Key Financials Domestic Market Sales Volume (000 MT)
EKO Petrol Station Network
1,082858
1,942
1,054 892
1,947
0
500
1,000
1,500
2,000
2,500
Network & C&I Aviation andBunkers
Total
1H07 1H08
30/06/07 31/12/07 31/03/08 30/06/08
COCO 15 27 29 32CODO 234 247 251 257DODO 1,020 986 965 962
Total 1,269 1,260 1,245 1,251
Q2 IFRS FINANCIAL STATEMENTS2007 2008 Δ% € MILLION 2007 2008 Δ%
GREEK MARKET
954 892 -6% VOLUME - KT 1,943 1,949 0%
450 625 39% NET SALES 854 1,195 40%
10 13 34% EBITDA 15 21 37%
6 9 64% EBIT 7 13 83%
4 8 75% EBT 5 12 149%
8 8 -9% CAPEX 11 13 20%
KEY INDICATORS
- - - PETROL STATIONS 1,269 1,251 -1%
- - - ATP (M3 PER DAY) 3.7 3.7 -
HALF YEAR
1H 2008 – Conference Call Presentation
20
BUSINESS UNIT PERFORMANCEMARKETING - INTERNATIONAL
160 166
219
252236
274
2004 2005 2006 2007 1H07 1H08
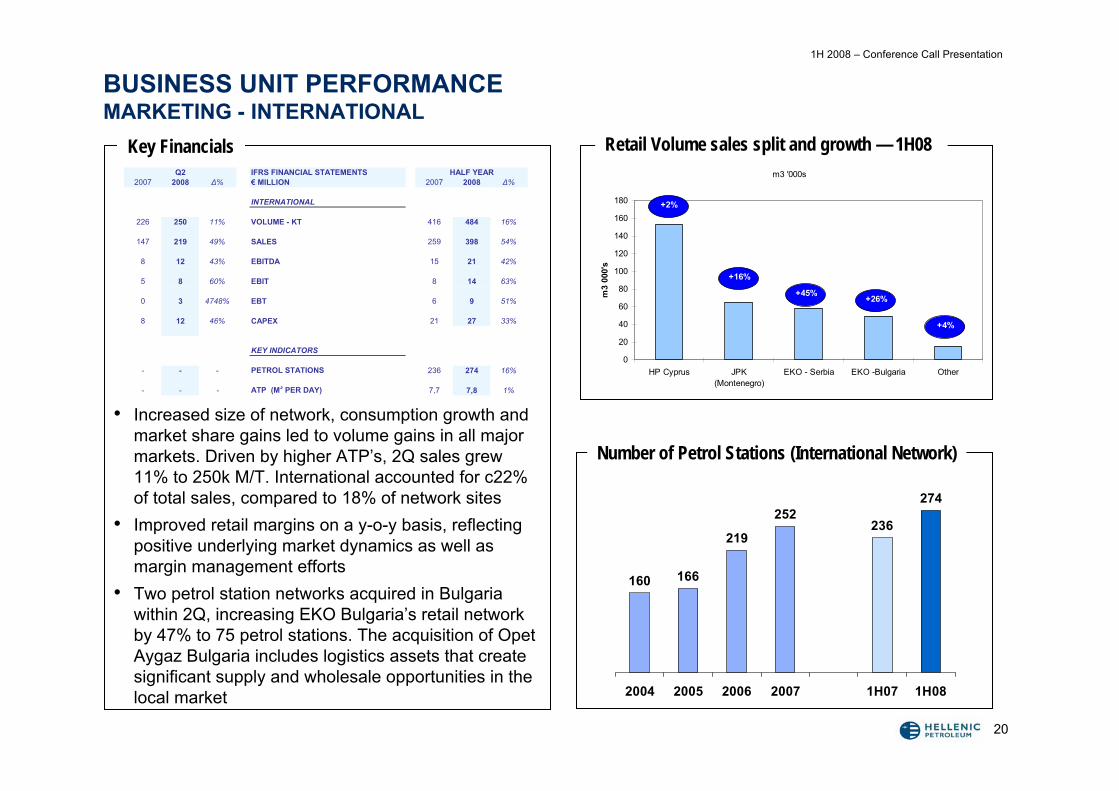
Retail Volume sales split and growth — 1H08
Number of Petrol Stations (International Network)
• Increased size of network, consumption growth and market share gains led to volume gains in all major markets. Driven by higher ATP’s, 2Q sales grew 11% to 250k M/T. International accounted for c22% of total sales, compared to 18% of network sites
• Improved retail margins on a y-o-y basis, reflecting positive underlying market dynamics as well as margin management efforts
• Two petrol station networks acquired in Bulgaria within 2Q, increasing EKO Bulgaria’s retail network by 47% to 75 petrol stations. The acquisition of OpetAygaz Bulgaria includes logistics assets that create significant supply and wholesale opportunities in the local market
Key Financialsm3 '000s
0
20
40
60
80
100
120
140
160
180
HP Cyprus JPK(Montenegro)
EKO - Serbia EKO -Bulgaria Other
m3
000'
s
+16%
+45%+26%
+2%
+4%
Q2 IFRS FINANCIAL STATEMENTS2007 2008 Δ% € MILLION 2007 2008 Δ%
INTERNATIONAL
226 250 11% VOLUME - KT 416 484 16%
147 219 49% SALES 259 398 54%
8 12 43% EBITDA 15 21 42%
5 8 60% EBIT 8 14 63%
0 3 4748% EBT 6 9 51%
8 12 46% CAPEX 21 27 33%
KEY INDICATORS
- - - PETROL STATIONS 236 274 16%
- - - ATP (M3 PER DAY) 7,7 7,8 1%
HALF YEAR
1H 2008 – Conference Call Presentation
21
• Refining
• Marketing
• Petrochemicals
• Power
• E&P
• Gas
BUSINESS UNITS PERFORMANCE
1H 2008 – Conference Call Presentation
22
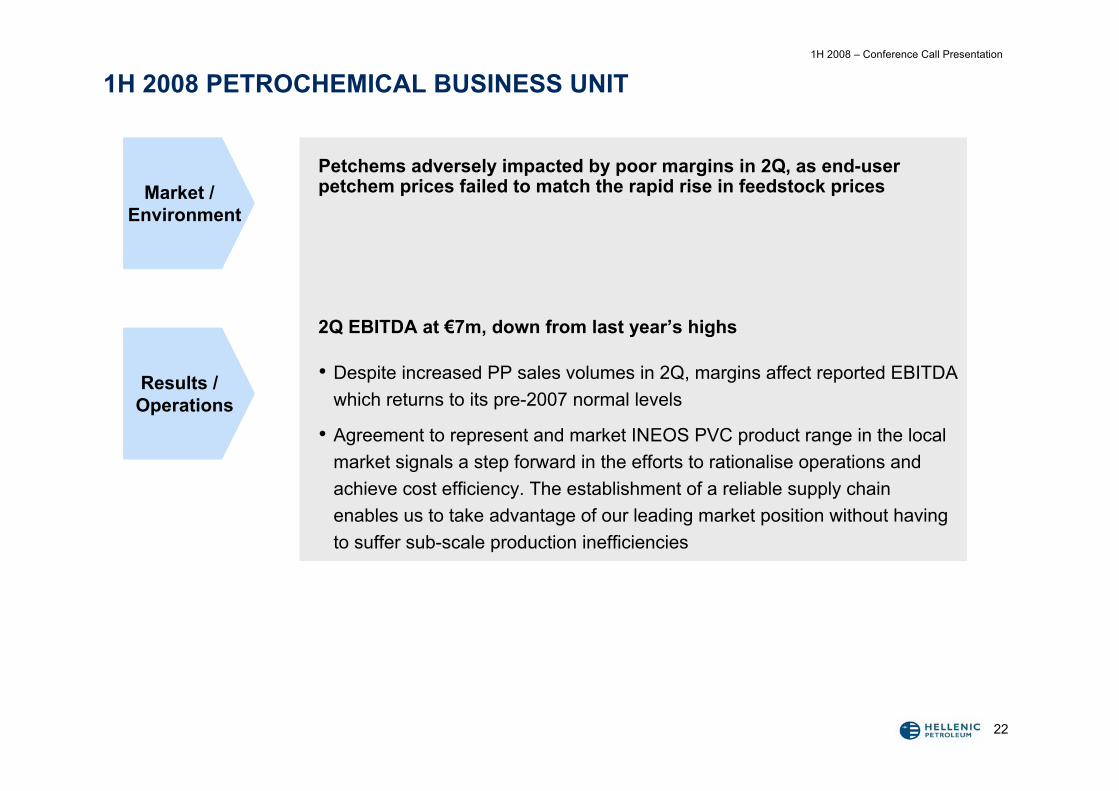
1H 2008 PETROCHEMICAL BUSINESS UNIT
Petchems adversely impacted by poor margins in 2Q, as end-user petchem prices failed to match the rapid rise in feedstock prices
2Q EBITDA at €7m, down from last year’s highs
• Despite increased PP sales volumes in 2Q, margins affect reported EBITDA which returns to its pre-2007 normal levels
• Agreement to represent and market INEOS PVC product range in the local market signals a step forward in the efforts to rationalise operations and achieve cost efficiency. The establishment of a reliable supply chain enables us to take advantage of our leading market position without having to suffer sub-scale production inefficiencies
Market / Environment
Results / Operations
1H 2008 – Conference Call Presentation
23
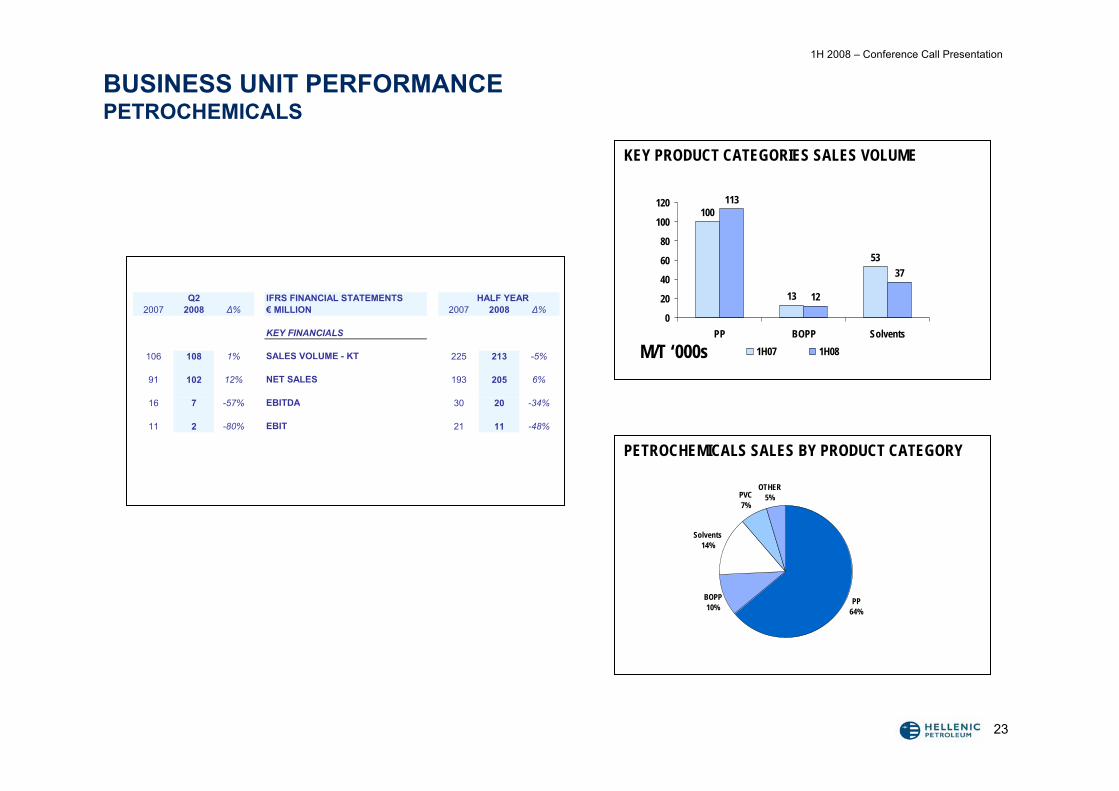
BUSINESS UNIT PERFORMANCEPETROCHEMICALS
100
13
53
113
12
37
0
20
40
60
80
100
120
PP BOPP Solvents1H07 1H08
KEY PRODUCT CATEGORIES SALES VOLUME
PP64%
BOPP10%
Solvents14%
PVC7%
OTHER5%
PETROCHEMICALS SALES BY PRODUCT CATEGORY
M/T ‘000s
Q2 IFRS FINANCIAL STATEMENTS HALF YEAR2007 2008 Δ% € MILLION 2007 2008 Δ%
KEY FINANCIALS
106 108 1% SALES VOLUME - KT 225 213 -5%
91 102 12% NET SALES 193 205 6%
16 7 -57% EBITDA 30 20 -34%
11 2 -80% EBIT 21 11 -48%
1H 2008 – Conference Call Presentation
24
• Refining
• Marketing
• Petrochemicals
• Power
• E&P
• Gas
BUSINESS UNITS PERFORMANCE
1H 2008 – Conference Call Presentation
25
1H 2008 POWER GENERATION BUSINESS UNIT
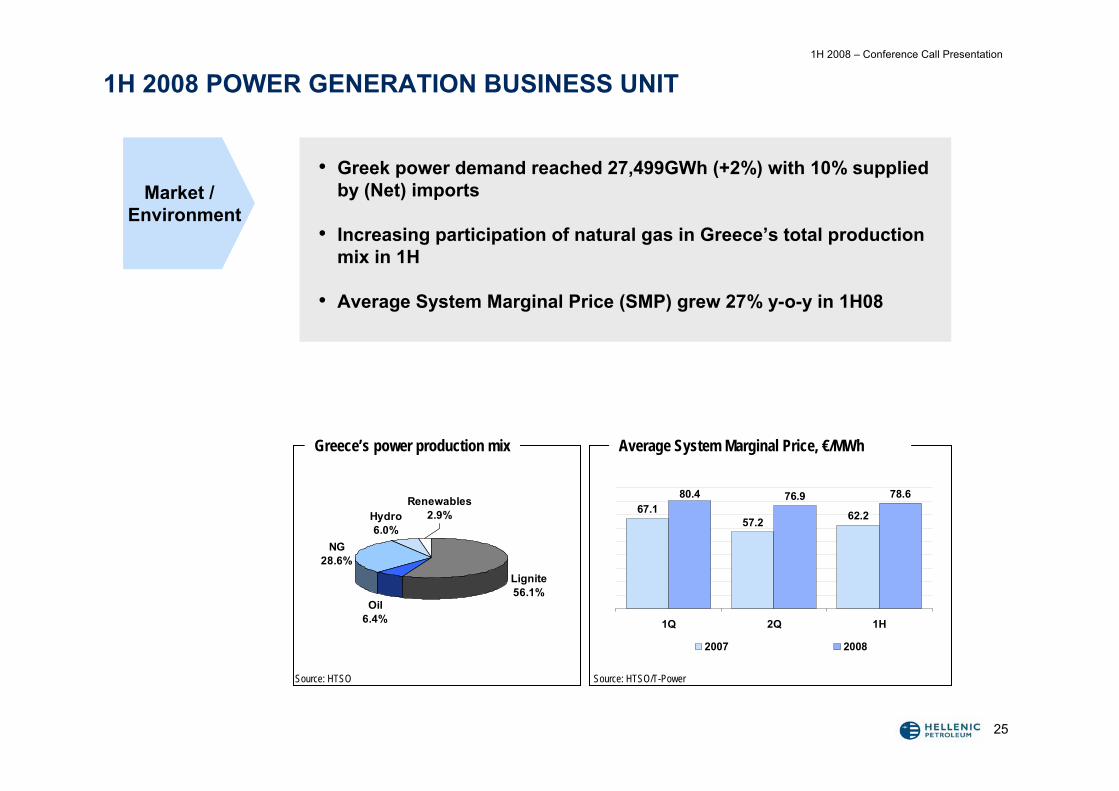
• Greek power demand reached 27,499GWh (+2%) with 10% supplied by (Net) imports
• Increasing participation of natural gas in Greece’s total production mix in 1H
• Average System Marginal Price (SMP) grew 27% y-o-y in 1H08
Market / Environment
Lignite56.1%
Oil6.4%
NG28.6%
Hydro6.0%
Renewables2.9%
Greece’s power production mix
Source: HTSO Source: HTSO/T-Power
Average System Marginal Price, €/MWh
62.257.267.1
78.676.980.4
1Q 2Q 1H
2007 2008
1H 2008 – Conference Call Presentation
26
BUSINESS UNIT PERFORMANCEPOWER GENERATION & TRADING
54.060.3 57.1
68.759.7 64.2
1Q 2Q 1H
2006 2007
Key financials
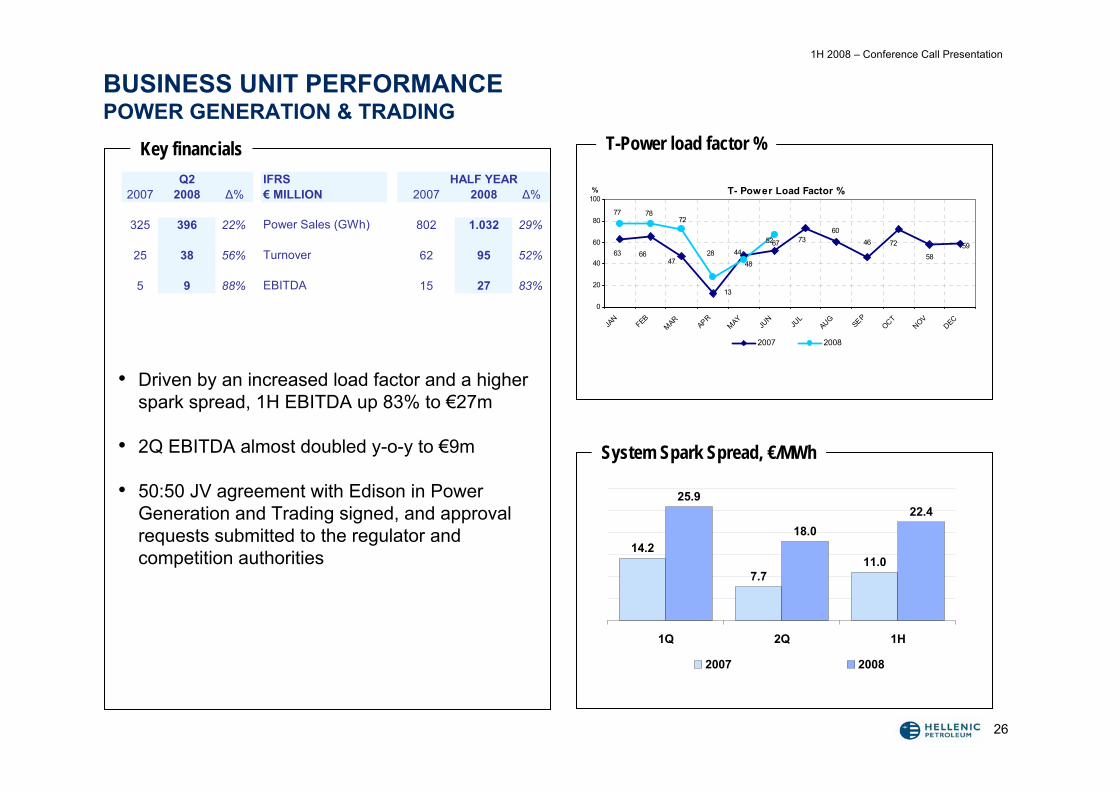
• Driven by an increased load factor and a higher spark spread, 1H EBITDA up 83% to €27m
• 2Q EBITDA almost doubled y-o-y to €9m
• 50:50 JV agreement with Edison in Power Generation and Trading signed, and approval requests submitted to the regulator and competition authorities
T-Power load factor %
System Spark Spread, €/MWh
Q2 IFRS HALF YEAR2007 2008 Δ% € MILLION 2007 2008 Δ%
325 396 22% Power Sales (GWh) 802 1.032 29%
25 38 56% Turnover 62 95 52%
5 9 88% EBITDA 15 27 83%
14.2
7.711.0
25.9
18.022.4
1Q 2Q 1H
2007 2008
T- Power Load Factor %
58637252 73
6046
13
484766
5944
727877
6728
0
20
40
60
80
100
JAN
FEB
MAR
APR
MAY
JUN
JUL
AUG
SEP
OCT
NOV
DEC
%
2007 2008
1H 2008 – Conference Call Presentation
27
• Refining
• Marketing
• Petrochemicals
• Power
• E&P
• Gas
BUSINESS UNITS PERFORMANCE
1H 2008 – Conference Call Presentation
28
BUSINESS UNIT PERFORMANCEE&P
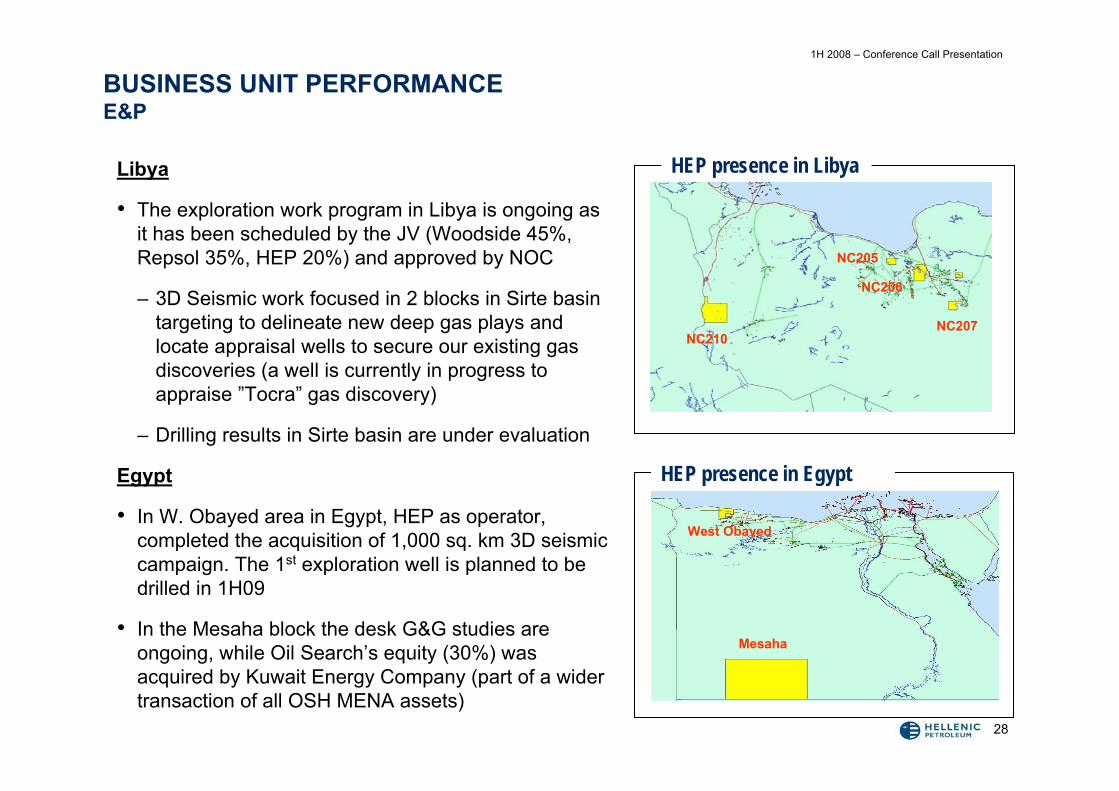
Libya
• The exploration work program in Libya is ongoing as it has been scheduled by the JV (Woodside 45%, Repsol 35%, HEP 20%) and approved by NOC
– 3D Seismic work focused in 2 blocks in Sirte basin targeting to delineate new deep gas plays and locate appraisal wells to secure our existing gas discoveries (a well is currently in progress to appraise ”Tocra” gas discovery)
– Drilling results in Sirte basin are under evaluation
Egypt
• In W. Obayed area in Egypt, HEP as operator, completed the acquisition of 1,000 sq. km 3D seismic campaign. The 1st exploration well is planned to be drilled in 1H09
• In the Mesaha block the desk G&G studies are ongoing, while Oil Search’s equity (30%) was acquired by Kuwait Energy Company (part of a wider transaction of all OSH MENA assets)
HEP presence in Libya
NC208/209
NC210NC207
NC205
NC206
HEP presence in Egypt
Mesaha
West Obayed
1H 2008 – Conference Call Presentation
29
• Refining
• Marketing
• Petrochemicals
• Power
• E&P
• Gas
BUSINESS UNITS PERFORMANCE
1H 2008 – Conference Call Presentation
30
GAS (INVESTMENT IN DEPA)
• Hellenic Petroleum owns 35% of the DEPA Group (Natural Gas Supply, Trading & Distribution Company - 65% state-owned) which includes the main pipeline system owner DESFA, the regional distribution companies (EPAs) and the project for the Turkey-Greece-Italy pipeline.
• Results are consolidated under the equity method appearing in the P&L below EBITDA, under Income from Associates. The DEPA investment in the balance sheet is carried under the equity method at a book value of close to €400m.
• 2Q reported share of profits from DEPA was €12m bringing the total Income from Associates to €30m for 1H 2008, up by 150%.
• Sales of Natural Gas for 2Q were up 13% (1.0 bcm). Key growth drivers are the increasing Natural Gas-fired power generation and increasing penetration at commercial, industrial and domestic consumption levels
Results
1H 2008 – Conference Call Presentation
31
• 1H 2008 Highlights
• Business Unit Performance
• Financial Results
• Strategy Update
• Q&A
AGENDA
1H 2008 – Conference Call Presentation
32
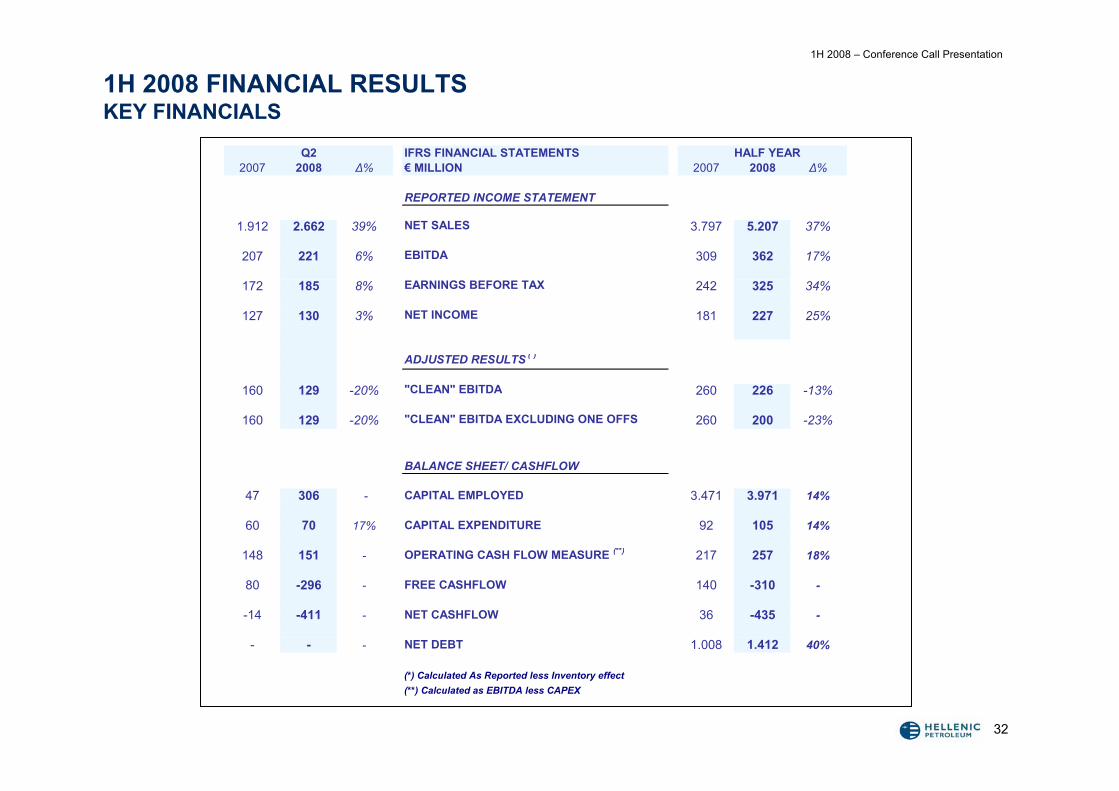
1H 2008 FINANCIAL RESULTSKEY FINANCIALS
Q2 IFRS FINANCIAL STATEMENTS HALF YEAR2007 2008 Δ% € MILLION 2007 2008 Δ%
REPORTED INCOME STATEMENT
1.912 2.662 39% NET SALES 3.797 5.207 37%
207 221 6% EBITDA 309 362 17%
172 185 8% EARNINGS BEFORE TAX 242 325 34%
127 130 3% NET INCOME 181 227 25%
ADJUSTED RESULTS ( )
160 129 -20% "CLEAN" EBITDA 260 226 -13%
160 129 -20% "CLEAN" EBITDA EXCLUDING ONE OFFS 260 200 -23%
BALANCE SHEET/ CASHFLOW
47 306 - CAPITAL EMPLOYED 3.471 3.971 14%
60 70 17% CAPITAL EXPENDITURE 92 105 14%
148 151 - OPERATING CASH FLOW MEASURE (**) 217 257 18%
80 -296 - FREE CASHFLOW 140 -310 -
-14 -411 - NET CASHFLOW 36 -435 -
- - - NET DEBT 1.008 1.412 40%
(*) Calculated As Reported less Inventory effect(**) Calculated as EBITDA less CAPEX
1H 2008 – Conference Call Presentation
33
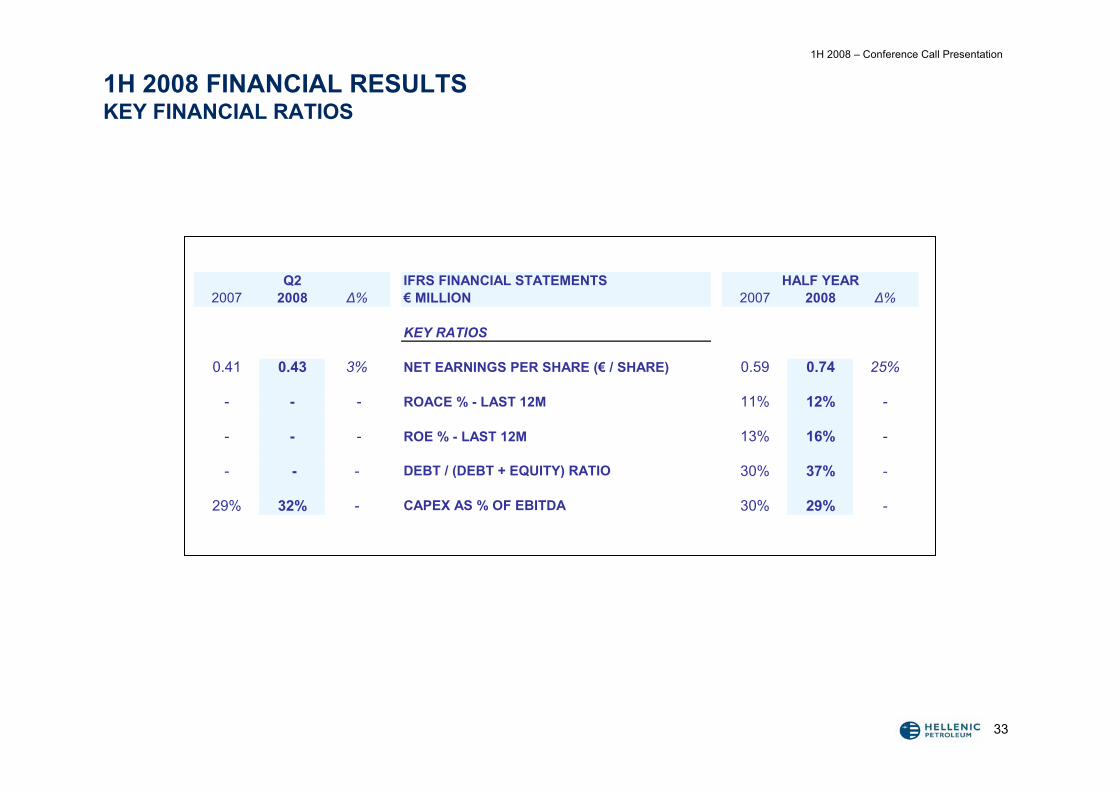
1H 2008 FINANCIAL RESULTSKEY FINANCIAL RATIOS
Q2 IFRS FINANCIAL STATEMENTS2007 2008 Δ% € MILLION 2007 2008 Δ%
KEY RATIOS
0.41 0.43 3% NET EARNINGS PER SHARE (€ / SHARE) 0.59 0.74 25%
- - - ROACE % - LAST 12M 11% 12% -
- - - ROE % - LAST 12M 13% 16% -
- - - DEBT / (DEBT + EQUITY) RATIO 30% 37% -
29% 32% - CAPEX AS % OF EBITDA 30% 29% -
HALF YEAR
1H 2008 – Conference Call Presentation
34
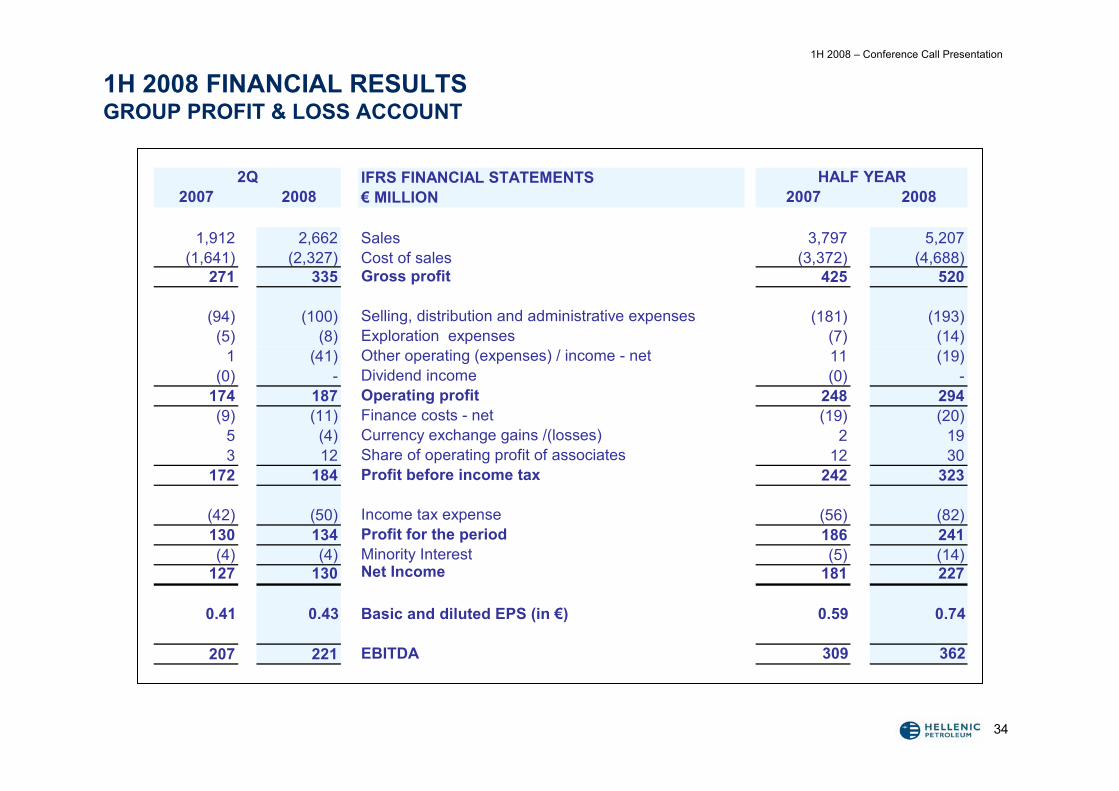
1H 2008 FINANCIAL RESULTSGROUP PROFIT & LOSS ACCOUNT
2Q IFRS FINANCIAL STATEMENTS HALF YEAR2007 2008 € MILLION 2007 2008
1,912 2,662 Sales 3,797 5,207(1,641) (2,327) Cost of sales (3,372) (4,688)
271 335 Gross profit 425 520
(94) (100) Selling, distribution and administrative expenses (181) (193)(5) (8) Exploration expenses (7) (14)
1 (41) Other operating (expenses) / income - net 11 (19)(0) - Dividend income (0) -
174 187 Operating profit 248 294(9) (11) Finance costs - net (19) (20)
5 (4) Currency exchange gains /(losses) 2 193 12 Share of operating profit of associates 12 30
172 184 Profit before income tax 242 323
(42) (50) Income tax expense (56) (82)130 134 Profit for the period 186 241(4) (4) Minority Interest (5) (14)
127 130 Net Income 181 227
0.41 0.43 Basic and diluted EPS (in €) 0.59 0.74
207 221 EBITDA 309 362
1H 2008 – Conference Call Presentation
35
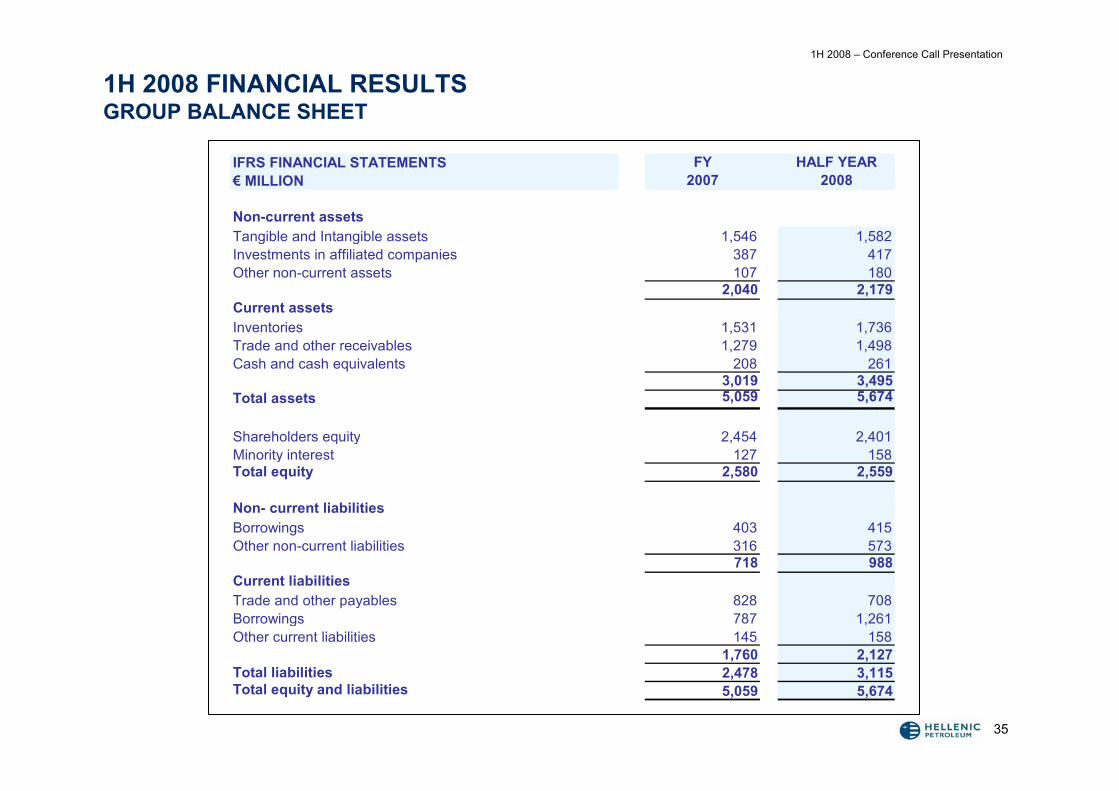
1H 2008 FINANCIAL RESULTSGROUP BALANCE SHEET
IFRS FINANCIAL STATEMENTS FY HALF YEAR€ MILLION 2007 2008
Non-current assetsTangible and Intangible assets 1,546 1,582Investments in affiliated companies 387 417Other non-current assets 107 180
2,040 2,179Current assetsInventories 1,531 1,736Trade and other receivables 1,279 1,498Cash and cash equivalents 208 261
3,019 3,495Total assets 5,059 5,674
Shareholders equity 2,454 2,401Minority interest 127 158Total equity 2,580 2,559
Non- current liabilitiesBorrowings 403 415Other non-current liabilities 316 573
718 988Current liabilitiesTrade and other payables 828 708Borrowings 787 1,261Other current liabilities 145 158
1,760 2,127Total liabilities 2,478 3,115Total equity and liabilities 5,059 5,674
1H 2008 – Conference Call Presentation
36
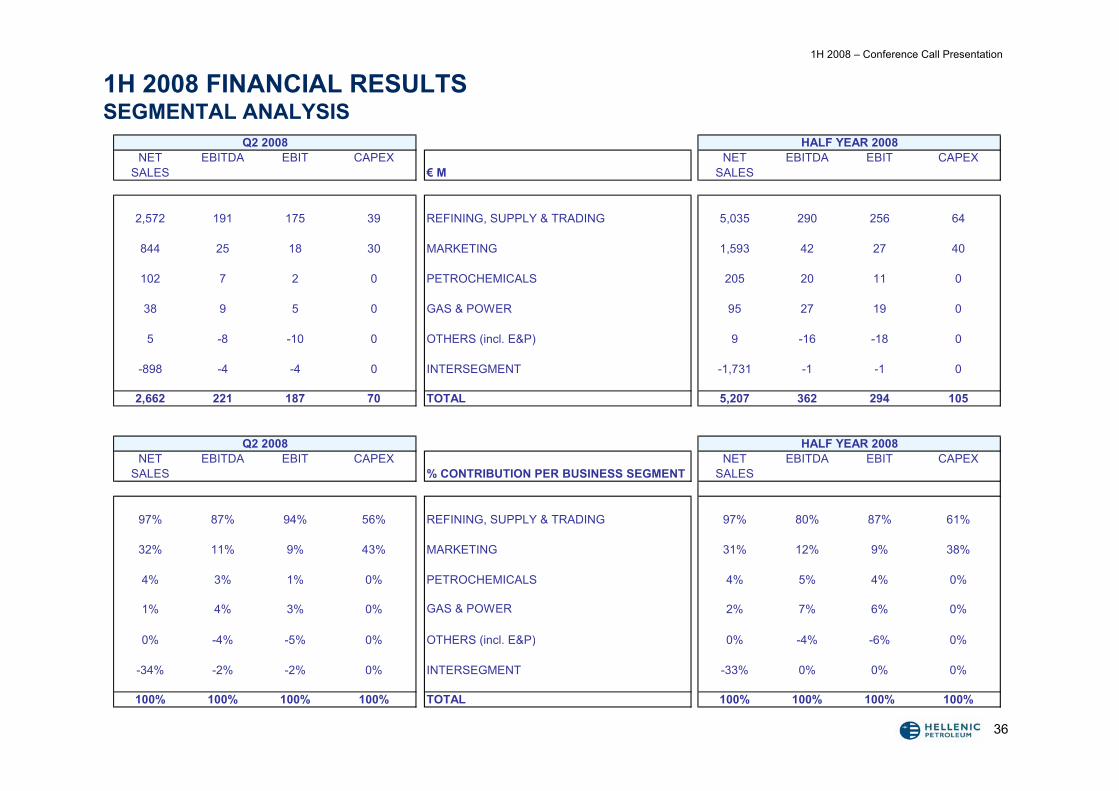
1H 2008 FINANCIAL RESULTSSEGMENTAL ANALYSIS
Q2 2008 HALF YEAR 2008NET EBITDA EBIT CAPEX NET EBITDA EBIT CAPEX
SALES € M SALES
2,572 191 175 39 REFINING, SUPPLY & TRADING 5,035 290 256 64
844 25 18 30 MARKETING 1,593 42 27 40
102 7 2 0 PETROCHEMICALS 205 20 11 0
38 9 5 0 GAS & POWER 95 27 19 0
5 -8 -10 0 OTHERS (incl. E&P) 9 -16 -18 0
-898 -4 -4 0 INTERSEGMENT -1,731 -1 -1 0
2,662 221 187 70 TOTAL 5,207 362 294 105
Q2 2008 HALF YEAR 2008NET EBITDA EBIT CAPEX NET EBITDA EBIT CAPEX
SALES % CONTRIBUTION PER BUSINESS SEGMENT SALES
97% 87% 94% 56% REFINING, SUPPLY & TRADING 97% 80% 87% 61%
32% 11% 9% 43% MARKETING 31% 12% 9% 38%
4% 3% 1% 0% PETROCHEMICALS 4% 5% 4% 0%
1% 4% 3% 0% GAS & POWER 2% 7% 6% 0%
0% -4% -5% 0% OTHERS (incl. E&P) 0% -4% -6% 0%
-34% -2% -2% 0% INTERSEGMENT -33% 0% 0% 0%
100% 100% 100% 100% TOTAL 100% 100% 100% 100%
1H 2008 – Conference Call Presentation
37
• 1H 2008 Highlights
• Business Units Performance
• Financial Results
• Strategy update
• Q&A
AGENDA
1H 2008 – Conference Call Presentation
38
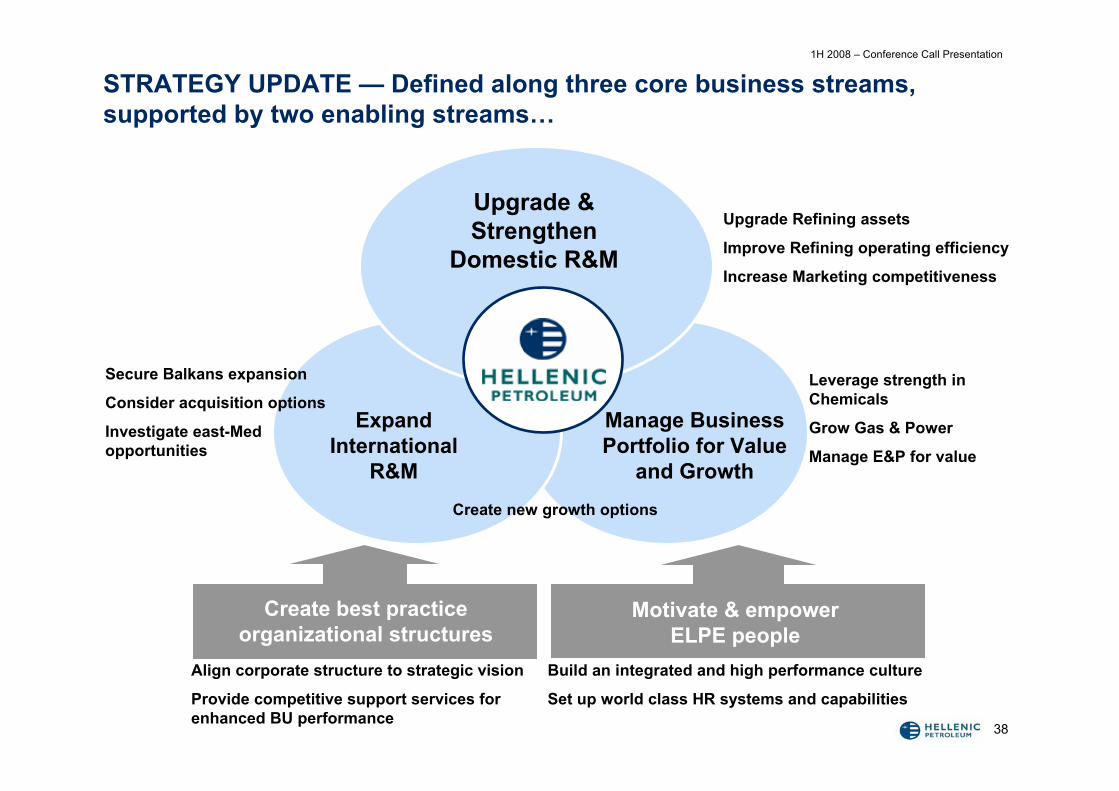
STRATEGY UPDATE — Defined along three core business streams, supported by two enabling streams…
Create best practice organizational structures
Motivate & empower ELPE people
Build an integrated and high performance culture
Set up world class HR systems and capabilities
Align corporate structure to strategic vision
Provide competitive support services for enhanced BU performance
Expand International
R&M
Manage Business Portfolio for Value
and Growth
Upgrade Refining assets
Improve Refining operating efficiency
Increase Marketing competitiveness
Secure Balkans expansion
Consider acquisition options
Investigate east-Med opportunities
Leverage strength in Chemicals
Grow Gas & Power
Manage E&P for value
Upgrade & Strengthen
Domestic R&M
Create new growth options
1H 2008 – Conference Call Presentation
39
Strategic Imperative Business
Restructure the network and relationship with channels Enhance marketing offer (inc. ‘Co’ roll-out)Improve operational effectiveness (logistics, above site operations etc.)
Manage Business
Portfolio for Value and
Growth
Restructure organisation to match future requirements Farm out Libya and meet obligations in EgyptSelf-finance any further opportunities in Egypt by June ‘09
Expand International Refining & Marketing
E&P
Chemicals
International Refining
Upgrade and Strengthen Domestic Refining & Marketing
Domestic Refining
Operational re-engineering to reduce fixed and variable costsOperate refineries in two hubs (North & South)Upgrade Elefsina refineryFurther upgrade Thessaloniki potentially in phases Maintenance of Aspropyrgos refinery through continuous investment
Domestic Marketing
Power & Gas
Strengthen Chemicals along the propylene value chainLeverage local market access through trading
Create growth options in gas (with DEPA)Continue development of JV with Edison in Greece
Build and maintain strong position in Montenegro, Cyprus and FYROMExtend the Northern hub by securing supply options for a sustainable
position in Serbia and Bulgaria and invest in retail network to secure top 2-3 position in these two countries
Maintain and develop wholesale business in AlbaniaExit GeorgiaEvaluate bold stoke options, I.e. Petrol AD, MakPetrolInvestigate east-med opportunities (e.g., Turkey)
Strategic Actions
Increase or maintain market share
Improve EBITDA margin to industry levels
Ensure no further funding needed by 2009
Reduce refining cost by $1-$1,5 per bbl
Improve refineries position to Q3 by 2010 and Q2 by 2012
Implement de-bottlenecking investment in PP by 2009
Create a portfolio of 2000 MW with Edison
Targets
International
Marketing
Include OKTA in Northern Refining Hub At par with peer group pace setter by 2012
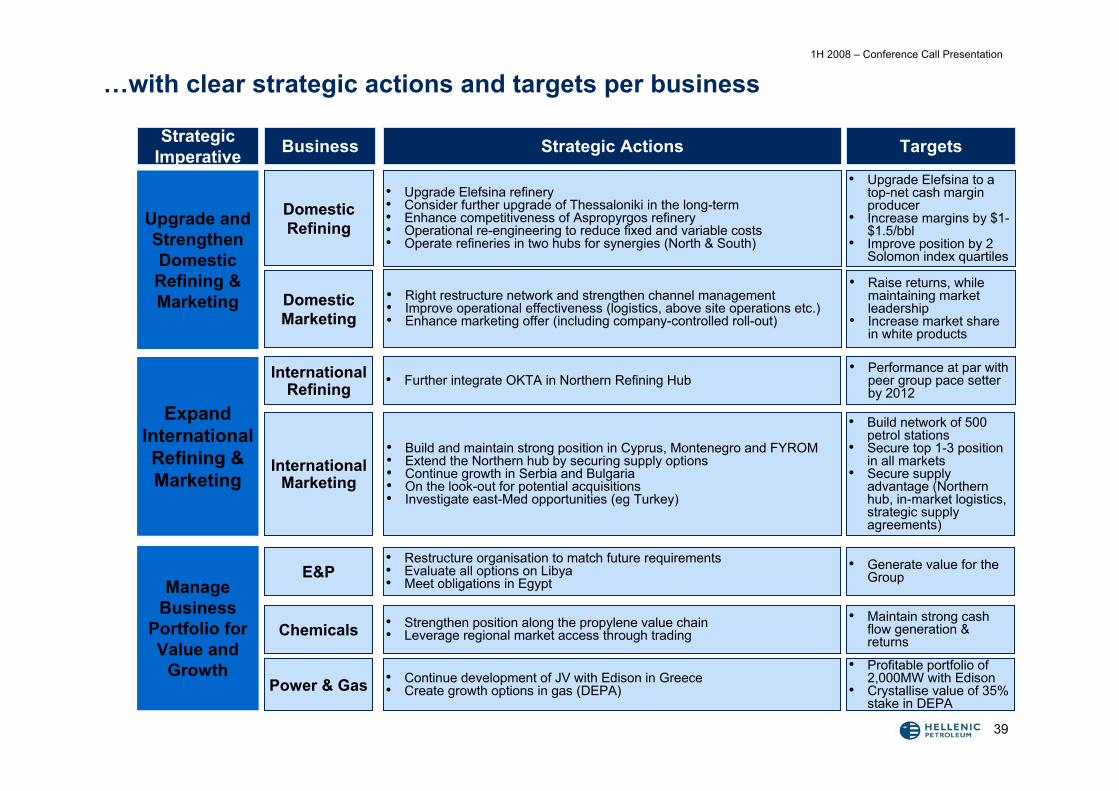
• Right restructure network and strengthen channel management• Improve operational effectiveness (logistics, above site operations etc.)• Enhance marketing offer (including company-controlled roll-out)
• Restructure organisation to match future requirements • Evaluate all options on Libya• Meet obligations in Egypt
E&P
Chemicals
International Refining
Domestic Refining
• Upgrade Elefsina refinery• Consider further upgrade of Thessaloniki in the long-term• Enhance competitiveness of Aspropyrgos refinery• Operational re-engineering to reduce fixed and variable costs• Operate refineries in two hubs for synergies (North & South)
Domestic Marketing
Power & Gas
• Strengthen position along the propylene value chain• Leverage regional market access through trading
• Continue development of JV with Edison in Greece• Create growth options in gas (DEPA)
• Build and maintain strong position in Cyprus, Montenegro and FYROM• Extend the Northern hub by securing supply options• Continue growth in Serbia and Bulgaria• On the look-out for potential acquisitions• Investigate east-Med opportunities (eg Turkey)
• Raise returns, while maintaining market leadership
• Increase market share in white products
• Generate value for the Group
• Upgrade Elefsina to a top-net cash margin producer
• Increase margins by $1-$1.5/bbl
• Improve position by 2 Solomon index quartiles
• Maintain strong cash flow generation & returns
• Profitable portfolio of 2,000MW with Edison
• Crystallise value of 35% stake in DEPA
• Build network of 500 petrol stations
• Secure top 1-3 position in all markets
• Secure supply advantage (Northern hub, in-market logistics, strategic supply agreements)
International Marketing
• Further integrate OKTA in Northern Refining Hub• Performance at par with
peer group pace setter by 2012
…with clear strategic actions and targets per business
1H 2008 – Conference Call Presentation
40
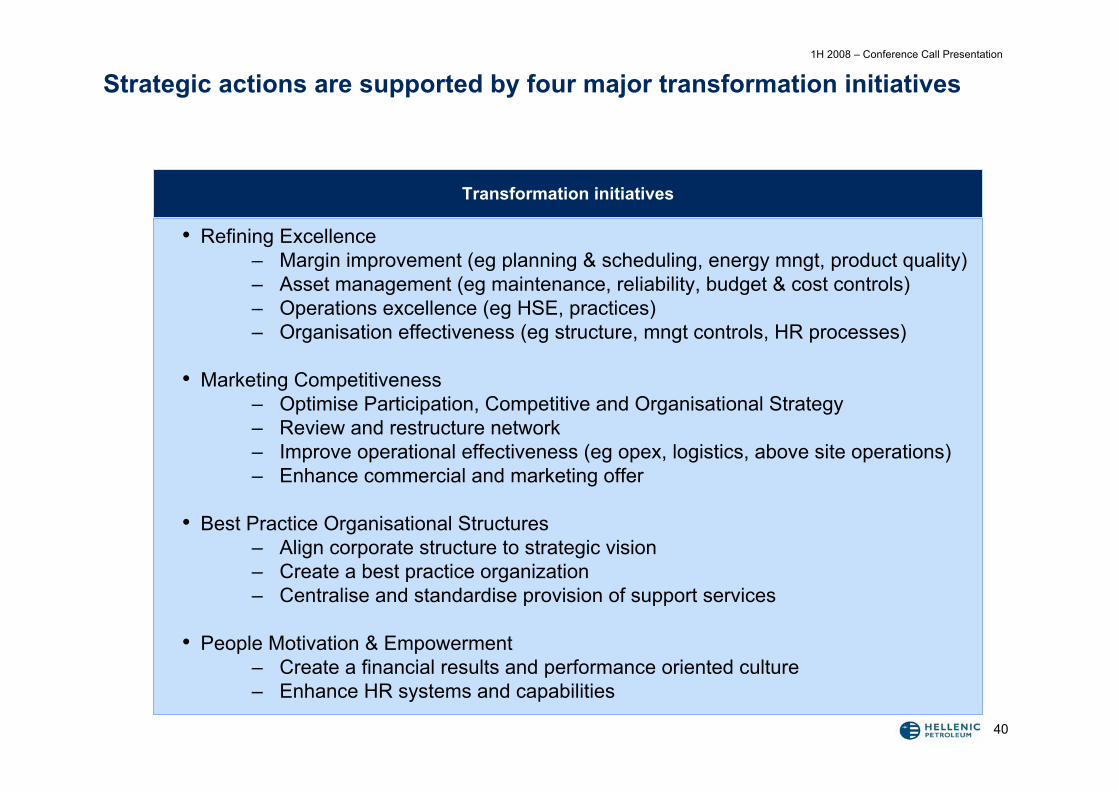
Strategic actions are supported by four major transformation initiatives
Transformation initiatives
• Refining Excellence– Margin improvement (eg planning & scheduling, energy mngt, product quality)– Asset management (eg maintenance, reliability, budget & cost controls)– Operations excellence (eg HSE, practices)– Organisation effectiveness (eg structure, mngt controls, HR processes)
• Marketing Competitiveness– Optimise Participation, Competitive and Organisational Strategy– Review and restructure network– Improve operational effectiveness (eg opex, logistics, above site operations)– Enhance commercial and marketing offer
• Best Practice Organisational Structures– Align corporate structure to strategic vision– Create a best practice organization– Centralise and standardise provision of support services
• People Motivation & Empowerment– Create a financial results and performance oriented culture– Enhance HR systems and capabilities
1H 2008 – Conference Call Presentation
41
• 1H 2008 Highlights
• Business Units Performance
• Financial Results
• Strategy update
• Q&A
AGENDA


![Konica Minolta Group€¦ · 2Q/March 2014 financial results highlight - Overview [Billions of yen] 1H 1H 2Q 2Q Mar 2014 Mar 2013 YoY Mar 2014 Mar 2013 QoQ Net sales (a) 450.5](https://img.pdfslide.us/doc/110x75/601d42db77ec0143f53c282a/konica-minolta-group-2qmarch-2014-financial-results-highlight-overview-billions.jpg)