Embed Size (px)
Citation preview
2Q 2017 and 1H 2017 Results Presentation 10 August 2017

About IREIT Global
Key Highlights
Portfolio Summary
Economy & Real Estate Review
Looking Ahead
Appendix : Overview of Tikehau Capital
Agenda
2
About IREIT Global
Europe-focused First Singapore-listed real estate investment trust with the investment strategy
of principally investing, directly or indirectly, in a portfolio of income-producing real estate in Europe which is used primarily for office, retail and industrial (including logistics) purposes, as well as real estate-related assets
Quality Freehold Assets, Long-term Stable Income Current portfolio comprises five freehold properties strategically located in the
key German cities of Berlin, Bonn, Darmstadt, Münster and Munich
Well-managed IREIT Global is managed by IREIT Global Group Pte. Ltd., a subsidiary of pan-
European asset management and investment firm Tikehau Capital
About IREIT Global
4
Key Highlights
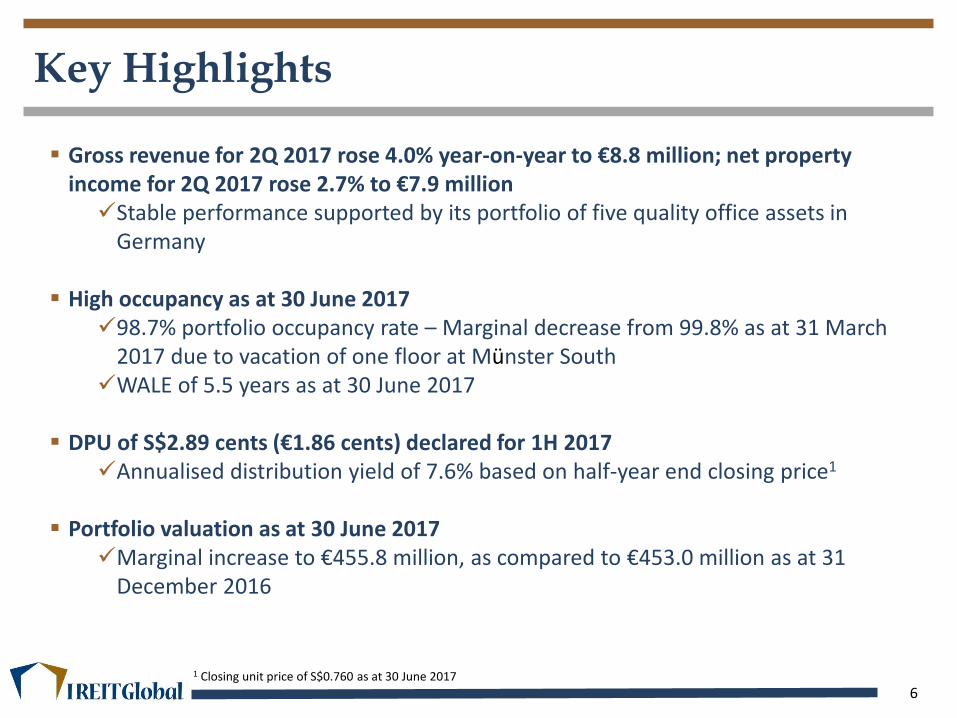
Gross revenue for 2Q 2017 rose 4.0% year-on-year to €8.8 million; net property income for 2Q 2017 rose 2.7% to €7.9 million
Stable performance supported by its portfolio of five quality office assets in Germany
High occupancy as at 30 June 201798.7% portfolio occupancy rate – Marginal decrease from 99.8% as at 31 March
2017 due to vacation of one floor at Münster South WALE of 5.5 years as at 30 June 2017
DPU of S$2.89 cents (€1.86 cents) declared for 1H 2017 Annualised distribution yield of 7.6% based on half-year end closing price1
Portfolio valuation as at 30 June 2017Marginal increase to €455.8 million, as compared to €453.0 million as at 31
December 2016
Key Highlights
6
1 Closing unit price of S$0.760 as at 30 June 2017
Operating & Financial Performance – 2Q 2017 and 1H 2017
(€’000) 2Q 2017 2Q 2016VARIANCE
(%)1H 2017 1H 2016
VARIANCE
(%)
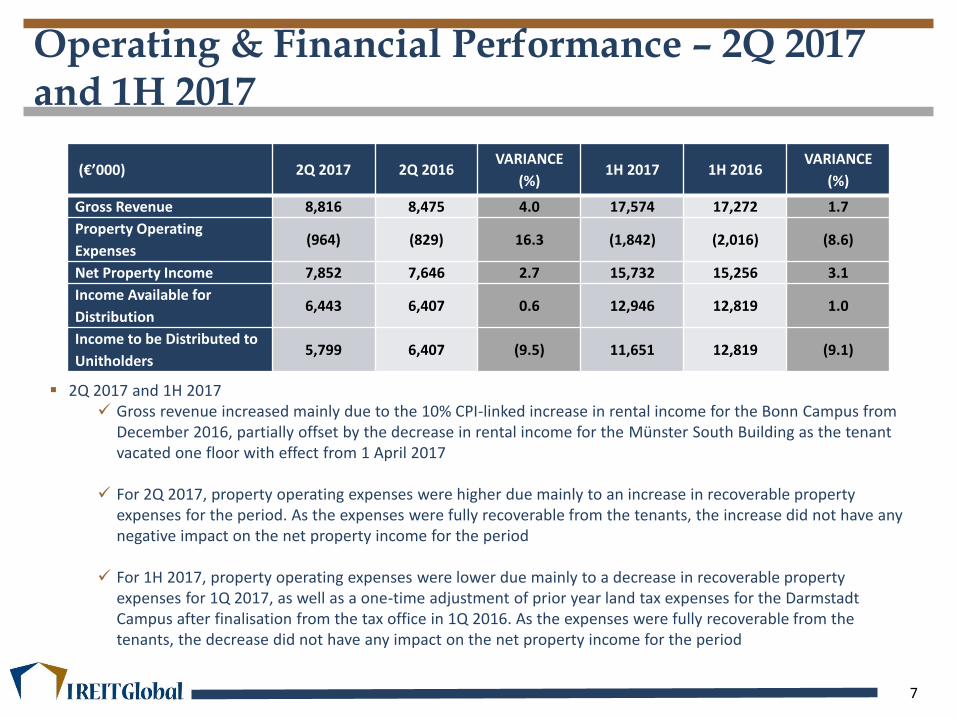
Gross Revenue 8,816 8,475 4.0 17,574 17,272 1.7
Property Operating
Expenses(964) (829) 16.3 (1,842) (2,016) (8.6)
Net Property Income 7,852 7,646 2.7 15,732 15,256 3.1
Income Available for
Distribution6,443 6,407 0.6 12,946 12,819 1.0
Income to be Distributed to
Unitholders5,799 6,407 (9.5) 11,651 12,819 (9.1)
7
2Q 2017 and 1H 2017 Gross revenue increased mainly due to the 10% CPI-linked increase in rental income for the Bonn Campus from
December 2016, partially offset by the decrease in rental income for the Münster South Building as the tenant vacated one floor with effect from 1 April 2017
For 2Q 2017, property operating expenses were higher due mainly to an increase in recoverable property expenses for the period. As the expenses were fully recoverable from the tenants, the increase did not have any negative impact on the net property income for the period
For 1H 2017, property operating expenses were lower due mainly to a decrease in recoverable property expenses for 1Q 2017, as well as a one-time adjustment of prior year land tax expenses for the Darmstadt Campus after finalisation from the tax office in 1Q 2016. As the expenses were fully recoverable from the tenants, the decrease did not have any impact on the net property income for the period
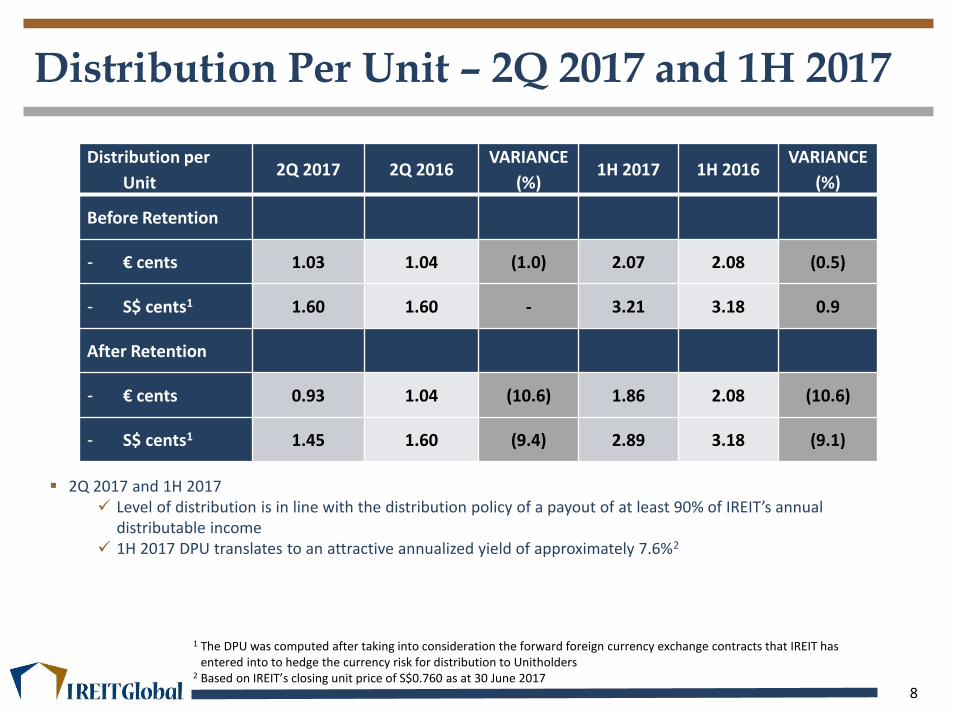
Distribution Per Unit – 2Q 2017 and 1H 2017
Distribution per
Unit2Q 2017 2Q 2016
VARIANCE
(%)1H 2017 1H 2016
VARIANCE
(%)
Before Retention
- € cents 1.03 1.04 (1.0) 2.07 2.08 (0.5)
- S$ cents1 1.60 1.60 - 3.21 3.18 0.9
After Retention
- € cents 0.93 1.04 (10.6) 1.86 2.08 (10.6)
- S$ cents1 1.45 1.60 (9.4) 2.89 3.18 (9.1)
1 The DPU was computed after taking into consideration the forward foreign currency exchange contracts that IREIT has entered into to hedge the currency risk for distribution to Unitholders
2 Based on IREIT’s closing unit price of S$0.760 as at 30 June 20178
2Q 2017 and 1H 2017 Level of distribution is in line with the distribution policy of a payout of at least 90% of IREIT’s annual
distributable income 1H 2017 DPU translates to an attractive annualized yield of approximately 7.6%2
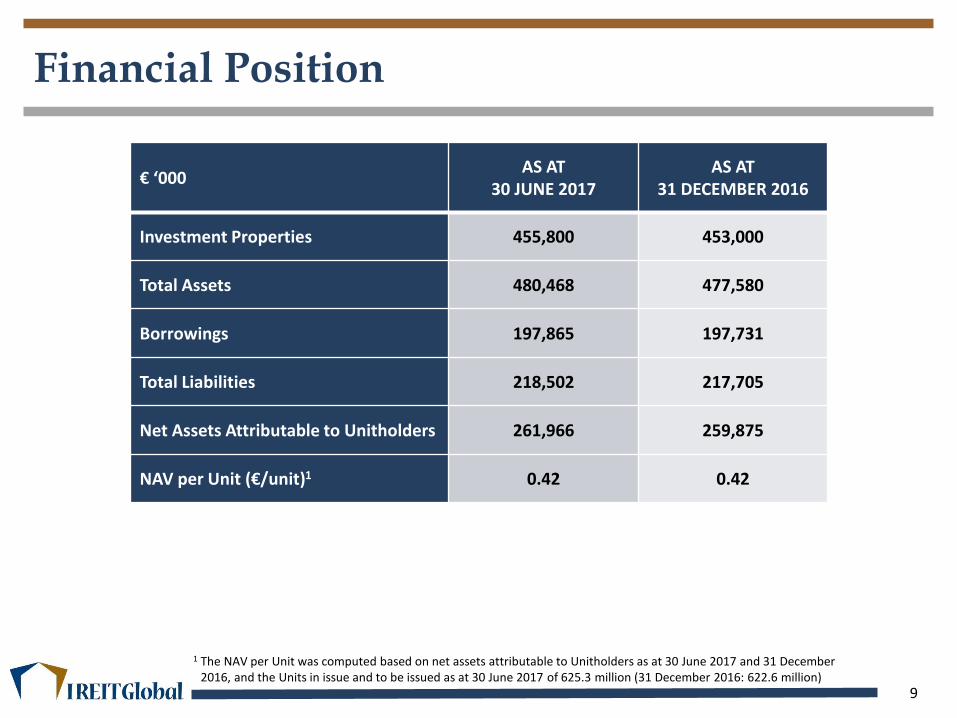
Financial Position
€ ‘000AS AT
30 JUNE 2017AS AT
31 DECEMBER 2016
Investment Properties 455,800 453,000
Total Assets 480,468 477,580
Borrowings 197,865 197,731
Total Liabilities 218,502 217,705
Net Assets Attributable to Unitholders 261,966 259,875
NAV per Unit (€/unit)1 0.42 0.42
1 The NAV per Unit was computed based on net assets attributable to Unitholders as at 30 June 2017 and 31 December 2016, and the Units in issue and to be issued as at 30 June 2017 of 625.3 million (31 December 2016: 622.6 million)
9
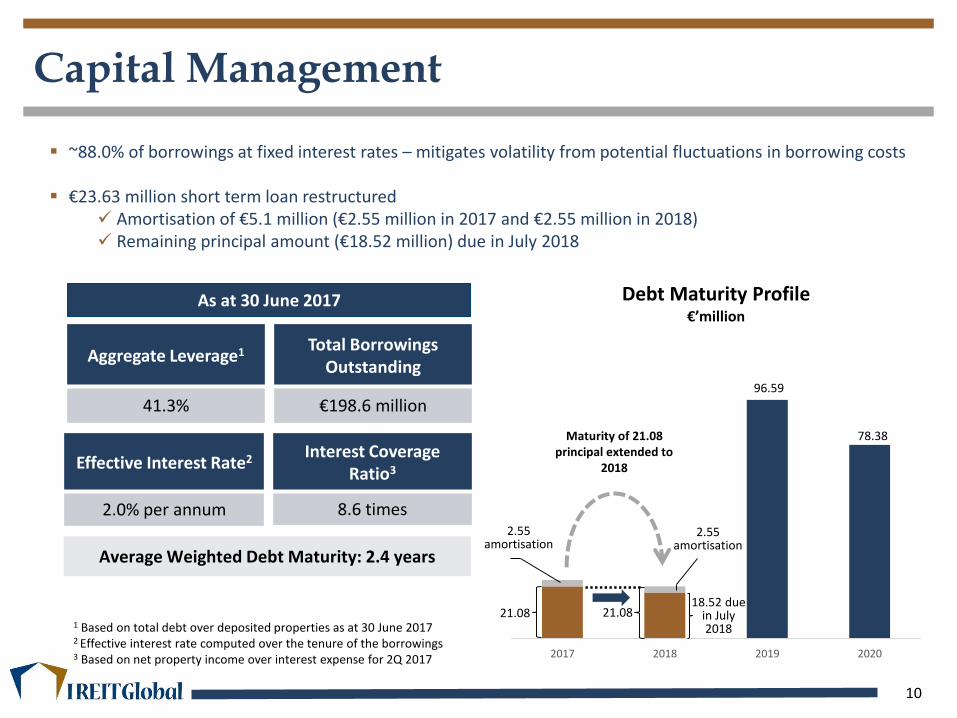
1 Based on total debt over deposited properties as at 30 June 20172 Effective interest rate computed over the tenure of the borrowings3 Based on net property income over interest expense for 2Q 2017
~88.0% of borrowings at fixed interest rates – mitigates volatility from potential fluctuations in borrowing costs
€23.63 million short term loan restructured Amortisation of €5.1 million (€2.55 million in 2017 and €2.55 million in 2018) Remaining principal amount (€18.52 million) due in July 2018
Capital Management
Aggregate Leverage1
41.3%
Effective Interest Rate2
2.0% per annum
Interest CoverageRatio3
8.6 times
As at 30 June 2017
Total BorrowingsOutstanding
€198.6 million
Average Weighted Debt Maturity: 2.4 years
2.55 amortisation
Maturity of 21.08 principal extended to
2018
10
96.59
78.38
2017 2018 2019 2020
Debt Maturity Profile€’million
21.08
2.55 amortisation
18.52 duein July 2018
21.08
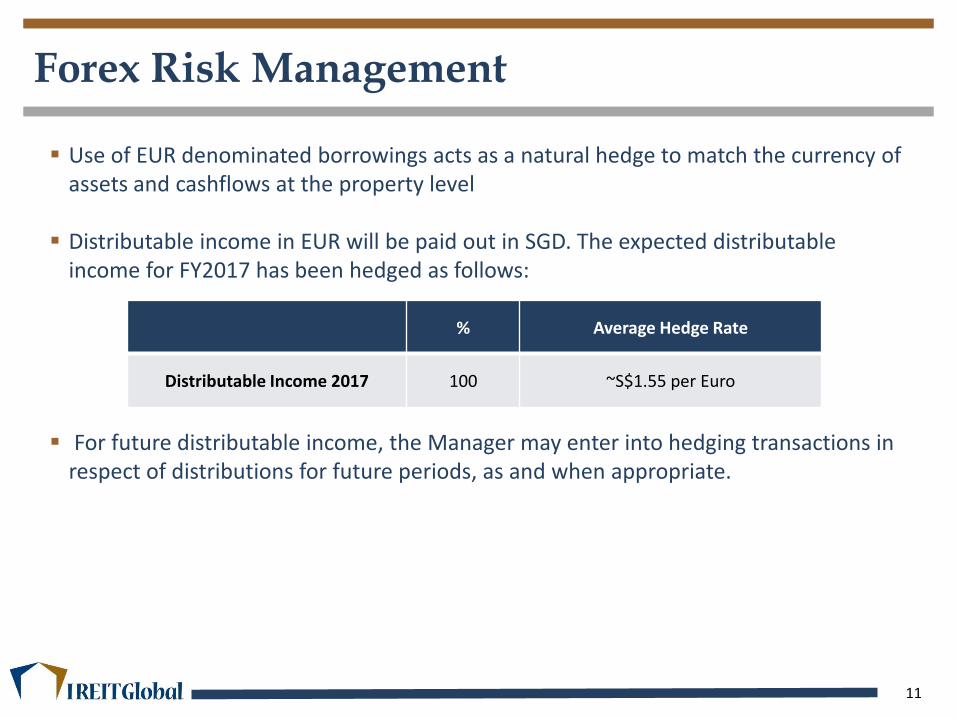
Use of EUR denominated borrowings acts as a natural hedge to match the currency of assets and cashflows at the property level
Distributable income in EUR will be paid out in SGD. The expected distributable income for FY2017 has been hedged as follows:
For future distributable income, the Manager may enter into hedging transactions in respect of distributions for future periods, as and when appropriate.
Forex Risk Management
% Average Hedge Rate
Distributable Income 2017 100 ~S$1.55 per Euro
11
Portfolio Summary
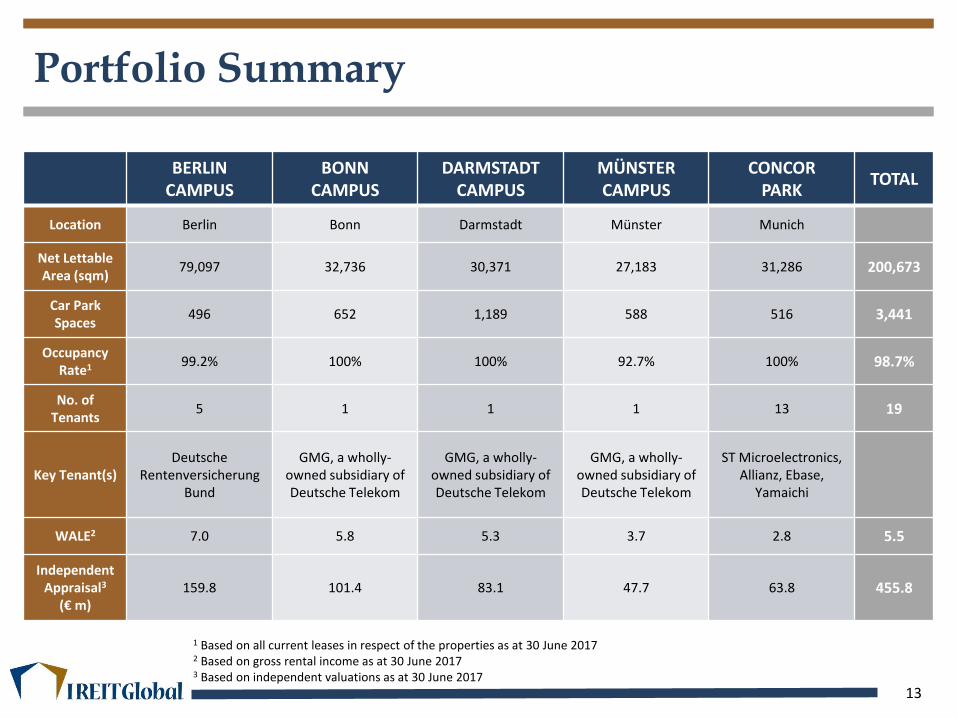
Portfolio Summary
13
1 Based on all current leases in respect of the properties as at 30 June 20172 Based on gross rental income as at 30 June 20173 Based on independent valuations as at 30 June 2017
BERLINCAMPUS
BONNCAMPUS
DARMSTADT CAMPUS
MÜNSTERCAMPUS
CONCORPARK
TOTAL
Location Berlin Bonn Darmstadt Münster Munich
Net LettableArea (sqm)
79,097 32,736 30,371 27,183 31,286 200,673
Car Park Spaces
496 652 1,189 588 516 3,441
Occupancy Rate1 99.2% 100% 100% 92.7% 100% 98.7%
No. of Tenants
5 1 1 1 13 19
Key Tenant(s)Deutsche
RentenversicherungBund
GMG, a wholly-owned subsidiary of Deutsche Telekom
GMG, a wholly-owned subsidiary of Deutsche Telekom
GMG, a wholly-owned subsidiary of Deutsche Telekom
ST Microelectronics, Allianz, Ebase,
Yamaichi
WALE2 7.0 5.8 5.3 3.7 2.8 5.5
IndependentAppraisal3
(€ m)159.8 101.4 83.1 47.7 63.8 455.8
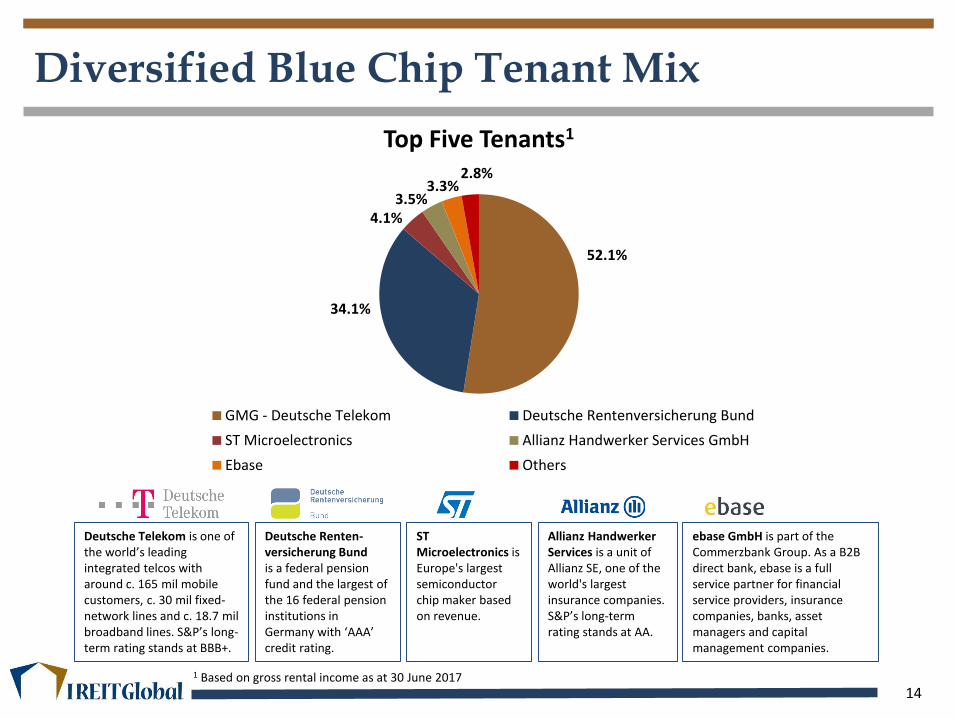
Diversified Blue Chip Tenant Mix
1 Based on gross rental income as at 30 June 201714
GMG - Deutsche Telekom Deutsche Rentenversicherung Bund
ST Microelectronics Allianz Handwerker Services GmbH
Ebase Others
52.1%
Top Five Tenants1
2.8%3.3%
3.5%4.1%
34.1%
ebase GmbH is part of the Commerzbank Group. As a B2B direct bank, ebase is a full service partner for financial service providers, insurance companies, banks, asset managers and capital management companies.
Allianz HandwerkerServices is a unit of Allianz SE, one of the world's largest insurance companies. S&P’s long-term rating stands at AA.
ST Microelectronics is Europe's largest semiconductor chip maker based on revenue.
Deutsche Telekom is one of the world’s leading integrated telcos with around c. 165 mil mobile customers, c. 30 mil fixed-network lines and c. 18.7 mil broadband lines. S&P’s long-term rating stands at BBB+.
Deutsche Renten-versicherung Bundis a federal pension fund and the largest of the 16 federal pension institutions in Germany with ‘AAA’ credit rating.
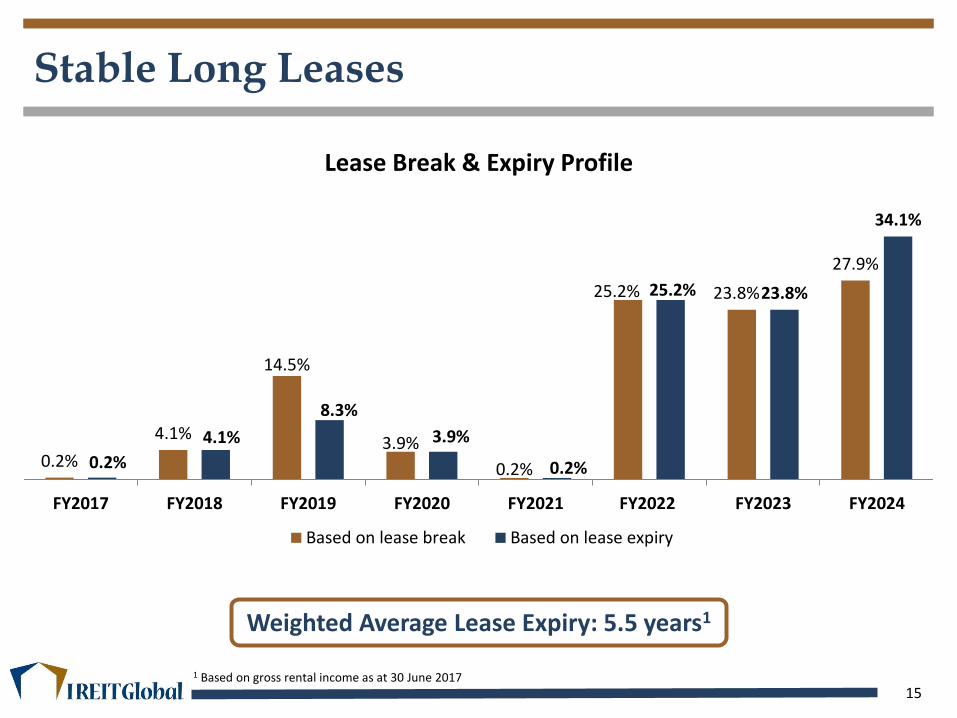
Stable Long Leases
0.2%
4.1%
14.5%
3.9%
0.2%
25.2% 23.8%
27.9%
0.2%
4.1%
8.3%
3.9%
0.2%
25.2% 23.8%
34.1%
FY2017 FY2018 FY2019 FY2020 FY2021 FY2022 FY2023 FY2024
Lease Break & Expiry Profile
Based on lease break Based on lease expiry
Weighted Average Lease Expiry: 5.5 years1
1 Based on gross rental income as at 30 June 201715
Economy and Real
Estate Review
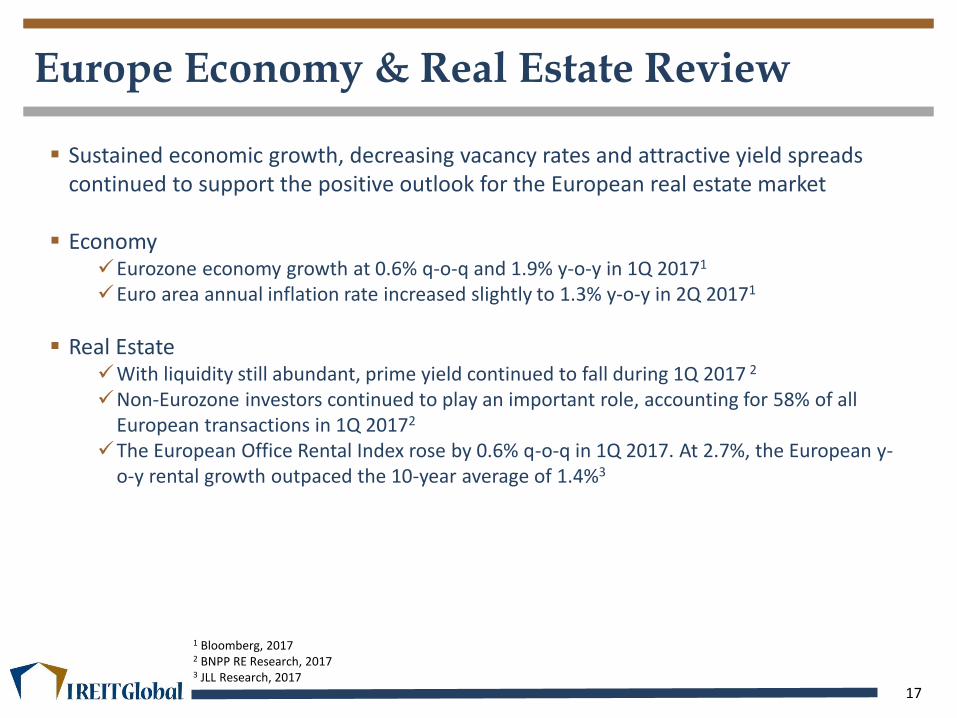
1 Bloomberg, 20172 BNPP RE Research, 20173 JLL Research, 2017
Sustained economic growth, decreasing vacancy rates and attractive yield spreads continued to support the positive outlook for the European real estate market
EconomyEurozone economy growth at 0.6% q-o-q and 1.9% y-o-y in 1Q 20171
Euro area annual inflation rate increased slightly to 1.3% y-o-y in 2Q 20171
Real Estate With liquidity still abundant, prime yield continued to fall during 1Q 2017 2
Non-Eurozone investors continued to play an important role, accounting for 58% of all European transactions in 1Q 20172
The European Office Rental Index rose by 0.6% q-o-q in 1Q 2017. At 2.7%, the European y-o-y rental growth outpaced the 10-year average of 1.4%3
Europe Economy & Real Estate Review
17
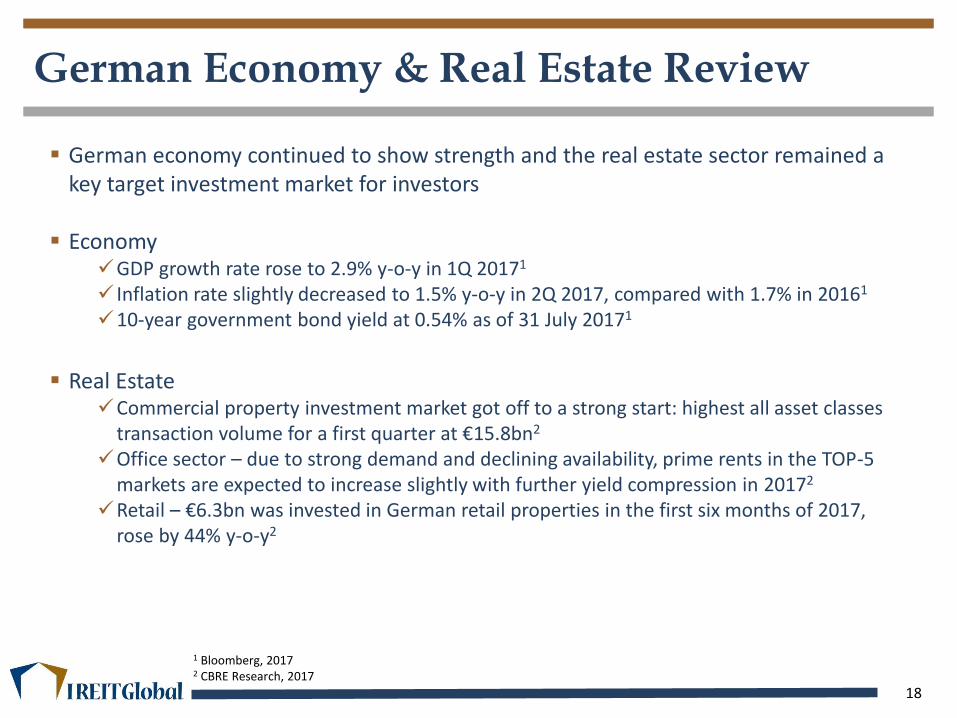
1 Bloomberg, 20172 CBRE Research, 2017
German economy continued to show strength and the real estate sector remained a key target investment market for investors
EconomyGDP growth rate rose to 2.9% y-o-y in 1Q 20171
Inflation rate slightly decreased to 1.5% y-o-y in 2Q 2017, compared with 1.7% in 20161
10-year government bond yield at 0.54% as of 31 July 20171
Real EstateCommercial property investment market got off to a strong start: highest all asset classes
transaction volume for a first quarter at €15.8bn2
Office sector – due to strong demand and declining availability, prime rents in the TOP-5 markets are expected to increase slightly with further yield compression in 20172
Retail – €6.3bn was invested in German retail properties in the first six months of 2017, rose by 44% y-o-y2
German Economy & Real Estate Review
18
Looking Ahead
Looking Ahead
20
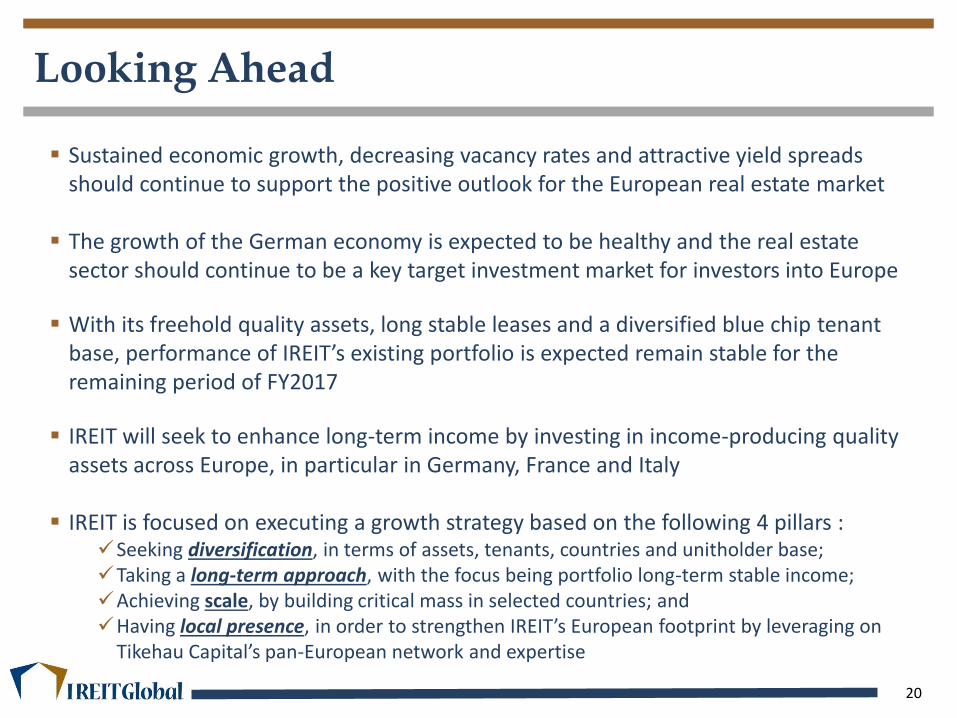
Sustained economic growth, decreasing vacancy rates and attractive yield spreads should continue to support the positive outlook for the European real estate market
The growth of the German economy is expected to be healthy and the real estate sector should continue to be a key target investment market for investors into Europe
With its freehold quality assets, long stable leases and a diversified blue chip tenant base, performance of IREIT’s existing portfolio is expected remain stable for the remaining period of FY2017
IREIT will seek to enhance long-term income by investing in income-producing quality assets across Europe, in particular in Germany, France and Italy
IREIT is focused on executing a growth strategy based on the following 4 pillars :Seeking diversification, in terms of assets, tenants, countries and unitholder base; Taking a long-term approach, with the focus being portfolio long-term stable income;Achieving scale, by building critical mass in selected countries; andHaving local presence, in order to strengthen IREIT’s European footprint by leveraging on
Tikehau Capital’s pan-European network and expertise
Appendix
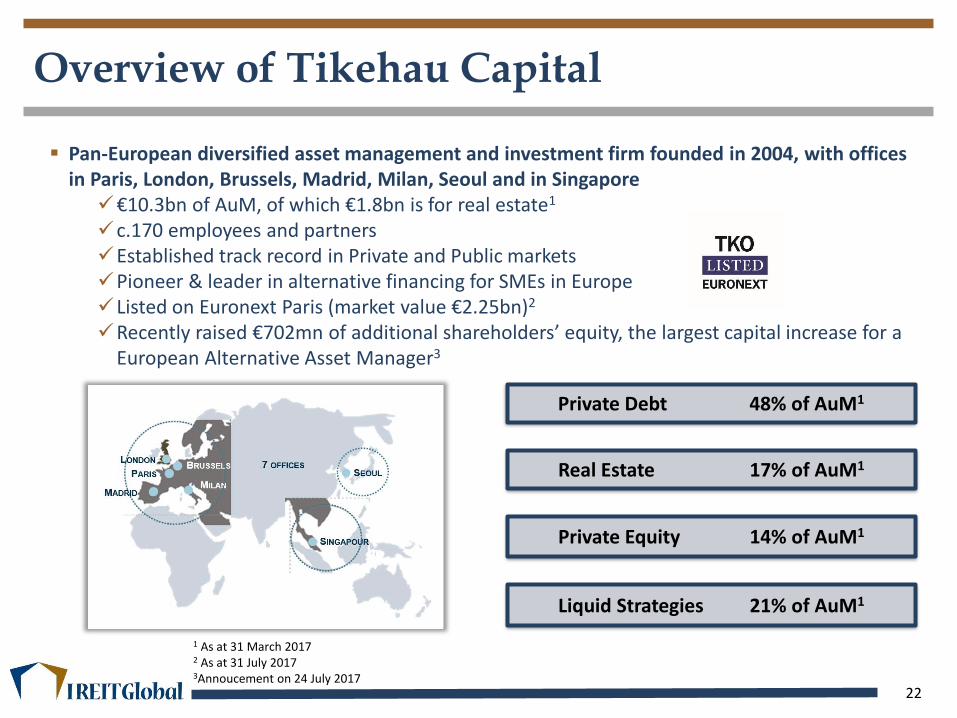
Pan-European diversified asset management and investment firm founded in 2004, with offices in Paris, London, Brussels, Madrid, Milan, Seoul and in Singapore
€10.3bn of AuM, of which €1.8bn is for real estate1
c.170 employees and partnersEstablished track record in Private and Public marketsPioneer & leader in alternative financing for SMEs in Europe Listed on Euronext Paris (market value €2.25bn)2
Recently raised €702mn of additional shareholders’ equity, the largest capital increase for a European Alternative Asset Manager3
Overview of Tikehau Capital
22
Private Debt 48% of AuM1
Private Equity 14% of AuM1
Liquid Strategies 21% of AuM1
Real Estate 17% of AuM1
1 As at 31 March 20172 As at 31 July 20173Annoucement on 24 July 2017
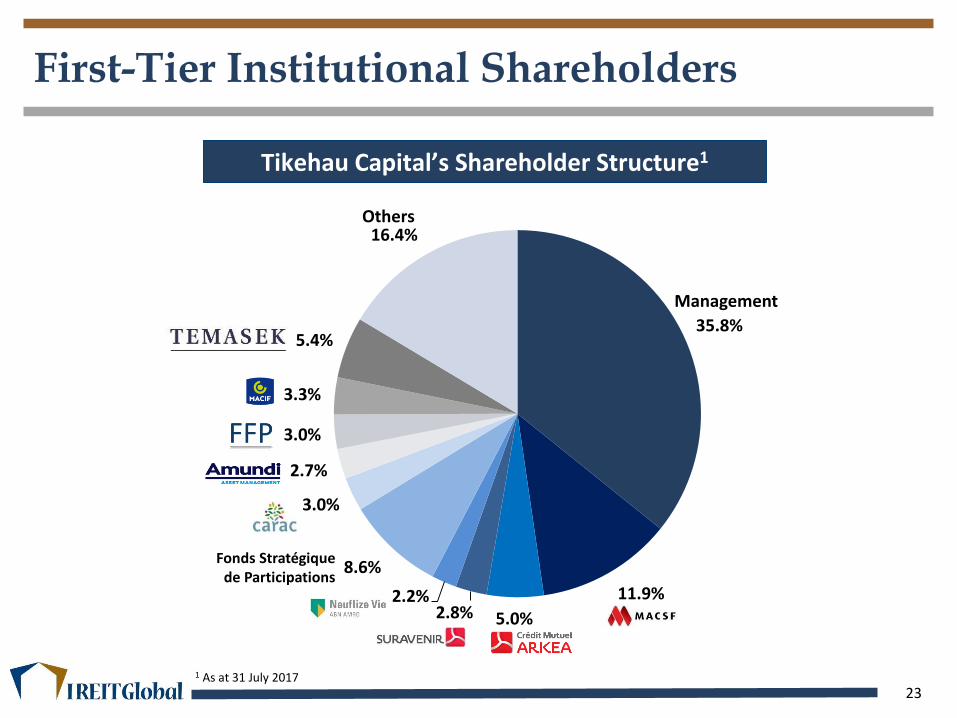
35.8%
11.9%
5.0%2.8%2.2%
8.6%
3.0%
2.7%
3.0%
3.3%
5.4%
16.4%Others
First-Tier Institutional Shareholders
23
1 As at 31 July 2017
Tikehau Capital’s Shareholder Structure1
Fonds Stratégique de Participations
Management
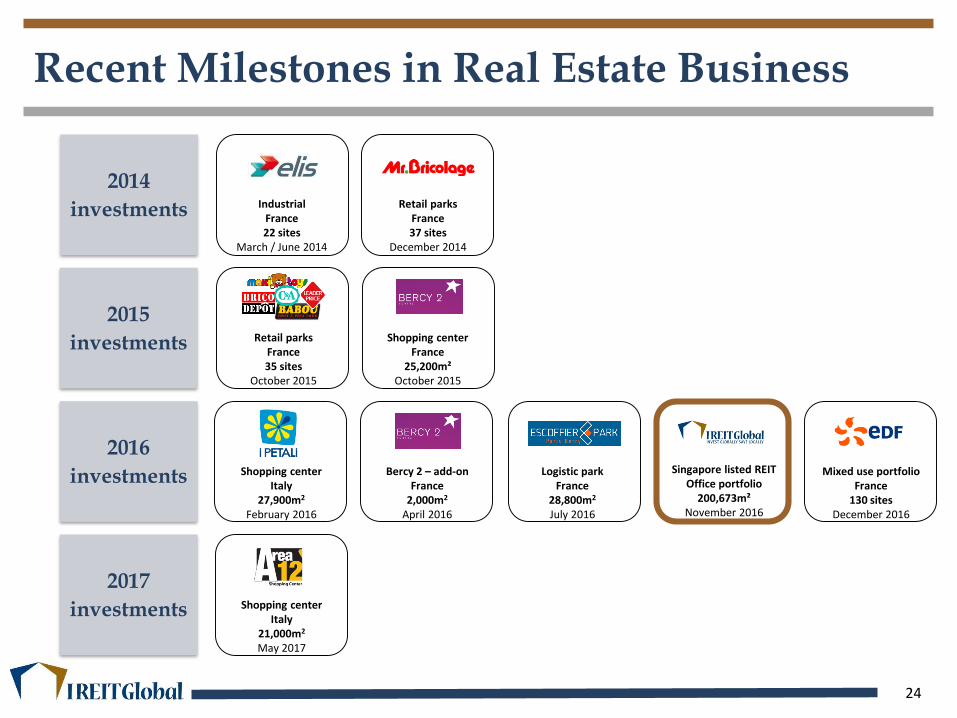
Shopping centerItaly
27,900m2
February 2016
Retail parksFrance35 sites
October 2015
Shopping centerFrance
25,200m²October 2015
IndustrialFrance22 sites
March / June 2014
Retail parksFrance37 sites
December 2014
Bercy 2 – add-onFrance
2,000m2
April 2016
Logistic parkFrance
28,800m2
July 2016
Singapore listed REITOffice portfolio
200,673m²November 2016
Mixed use portfolioFrance
130 sitesDecember 2016
24
Shopping centerItaly
21,000m2
May 2017
Recent Milestones in Real Estate Business
2014
investments
2015
investments
2016
investments
2017
investments
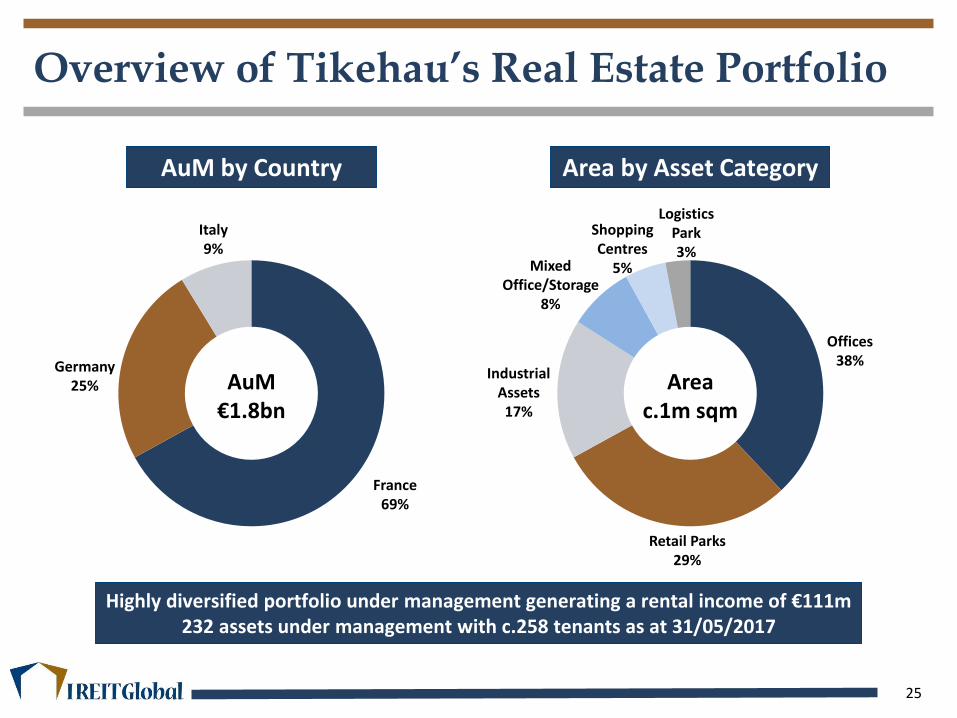
Overview of Tikehau’s Real Estate Portfolio
25
Highly diversified portfolio under management generating a rental income of €111m232 assets under management with c.258 tenants as at 31/05/2017
AuM by Country Area by Asset Category
AuM€1.8bn
Area c.1m sqm
France69%
Germany25%
Italy9%
Offices38%
Industrial Assets17%
Retail Parks29%
Mixed Office/Storage
8%
Shopping Centres
5%
Logistics Park3%
Thank You
26

This presentation may contain forward-looking statements that involve assumptions, risks and uncertainties. Actual future performance,outcomes and results may differ materially from those expressed in forward-looking statements as a result of a number of risks,uncertainties and assumptions. Representative examples of these factors include (without limitation) general industry and economicconditions, interest rate trends, cost of capital and capital availability, competition from other developments or companies, shifts inexpected levels of occupancy rate, property rental income, charge out collections, changes in operating expenses (including employeewages, benefits and training costs), governmental and public policy changes and the continued availability of financing in the amounts andthe terms necessary to support future business. You are cautioned not to place undue reliance on these forward-looking statements, whichare based on the current view of management on future events. The information contained in this presentation has not been independentlyverified. No representation or warranty, expressed or implied, is made as to, and no reliance should be placed on, the fairness, accuracy,completeness or correctness of the information or opinions contained in this presentation. Neither IREIT Global Group Pte. Ltd. (the“Manager”) or any of its affiliates, advisers or representatives shall have any liability whatsoever (in negligence or otherwise) for any losshowsoever arising, whether directly or indirectly, from any use, reliance or distribution of this presentation or its contents or otherwisearising in connection with this presentation. The past performance of IREIT Global (“IREIT”) is not indicative of the future performance ofIREIT. Similarly, the past performance of the Manager is not indicative of the future performance of the Manager. The value of units in IREIT(“Units”) and the income derived from them may fall as well as rise. Units are not obligations of, deposits in, or guaranteed by, the Manageror any of its affiliates. An investment in Units is subject to investment risks, including the possible loss of the principal amount invested.Investors should note that they will have no right to request the Manager to redeem or purchase their Units for so long as the Units arelisted on the Singapore Exchange Securities Trading Limited (the “SGX-ST”). It is intended that unitholders of IREIT may only deal in theirUnits through trading on the SGX-ST. Listing of the Units on the SGX-ST does not guarantee a liquid market for the Units. This presentation isfor information only and does not constitute an invitation or offer to acquire, purchase or subscribe for Units.
Important Notice
27