Embed Size (px)
Citation preview
2Q 2013 Results
30 August 2013
Dato’ Sri Jamaludin Ibrahim, President & Group CEO
James Maclaurin, Group CFO
2Q 2013 2
Overall results showed good revenue traction but EBITDA and PAT impacted by
adverse pricing and data investments at XL and forex:
• YTD growth : Revenue +5.2% ; EBITDA -3.2% ; PAT -2.2%
• QoQ growth : Revenue +3.3% ; EBITDA +4.7% ; PAT +4.7%
• 2Q YoY growth : Revenue +4.8% ; EBITDA -3.9% ; PAT -8.0%
Group posted stronger results @ constant currency. Most local currencies
weakened against RM (except for BDT).
• YTD growth : Revenue +7.6% ; EBITDA -0.9% ; PAT -1.0%
• QoQ growth : Revenue +3.7% ; EBITDA +5.2% ; PAT +5.1%
• 2Q YoY growth : Revenue +7.1% ; EBITDA -1.7% ; PAT -6.9%
Annualised ROIC at 10.7% and ROCE at 8.6%.
The Board of Directors has declared an interim tax exempt dividend under single tier system of 8 sen per share for the financial year ending 31st December 2013.
Executive Summary: 2Q 2013Strong QoQ growth aided by modest performance improvement at XL in 2Q 2013
2Q 2013 3
Key Group Highlights (1/2):1H 2013: Operating companies performed well despite challenges in data profitability
• XL’s results improved in 2Q13 due to data growth and revenue traction from gradual price optimization strategy
• QoQ revenue increased 5% due to overall growth indicating a modest recovery
• Celcom announced the launch of Escape (an OTT play), for 1st September 2013.
• Moderate growth in revenue (4% YTD) despite loss of domestic roaming revenues in September 2012. Excluding domestic roaming, 1H2013 revenue growth would have been 7%.
Growth number based on results in local currency in respective operating markets
2Q 2013 4
Key Group Highlights (2/2):1H 2013: Operating companies performed well despite challenges in data profitability, with double-digit revenue growth in Dialog, Robi and Smart
• Strong progress in all aspects of business• Outstanding double-digit revenue growth of 21%; EBITDA grew by 37% and
PAT by >100% (YTD)
• Strong double-digit revenue growth at 15% (YTD) and EBITDA growth at 9% (YTD)• Data revenue (excluding SMS and VAS) grew 57% while voice revenue grew 5%
(YTD)
Growth number based on results in local currency in respective operating markets
• Successful integration of Smart and Hello delivering results ahead of schedule• Revenue for the combined entity grew by 38% YTD and EBITDA grew at >100%
YTD• More than 100% growth in data revenue driven by Smart Exchange
2Q 2013 5
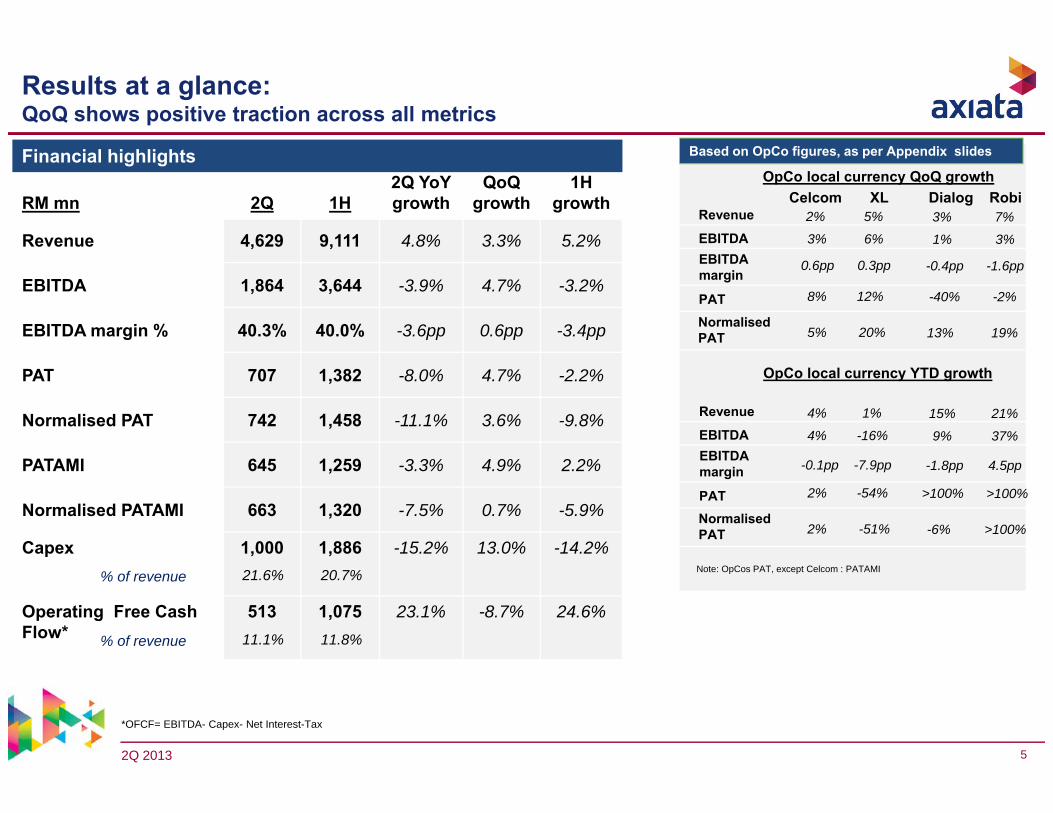
Results at a glance: QoQ shows positive traction across all metrics
RM mn 2Q 1H2Q YoYgrowth
QoQgrowth
1H growth
Revenue 4,629 9,111 4.8% 3.3% 5.2%
EBITDA 1,864 3,644 -3.9% 4.7% -3.2%
EBITDA margin % 40.3% 40.0% -3.6pp 0.6pp -3.4pp
PAT 707 1,382 -8.0% 4.7% -2.2%
Normalised PAT 742 1,458 -11.1% 3.6% -9.8%
PATAMI 645 1,259 -3.3% 4.9% 2.2%
Normalised PATAMI 663 1,320 -7.5% 0.7% -5.9%
Capex 1,000 1,886 -15.2% 13.0% -14.2%
Operating Free Cash Flow*
513 1,075 23.1% -8.7% 24.6%
*OFCF= EBITDA- Capex- Net Interest-Tax
Financial highlights
% of revenue 21.6%
% of revenue 11.1%
20.7%
11.8%
OpCo local currency QoQ growthCelcom XL Dialog Robi
2%
3%
0.6pp
8%
5%
5%
6%
0.3pp
12%
20%
3%
1%
-0.4pp
-40%
13%
7%
3%
-1.6pp
-2%
19%
Revenue
EBITDAEBITDA margin
PATNormalisedPAT
OpCo local currency YTD growth
4%
4%
-0.1pp
2%
2%
1%
-16%
-7.9pp
-54%
-51%
15%
9%
-1.8pp
>100%
-6%
21%
37%
4.5pp
>100%
Revenue
EBITDAEBITDA margin
PATNormalisedPAT
Note: OpCos PAT, except Celcom : PATAMI
Based on OpCo figures, as per Appendix slides
>100%
2Q 2013 6
‐ 42 ‐‐ ‐
21 ‐ 81 11
142
RevenueQ2 12
Voice SMS Pure Data VAS Others RevenueQ2 13
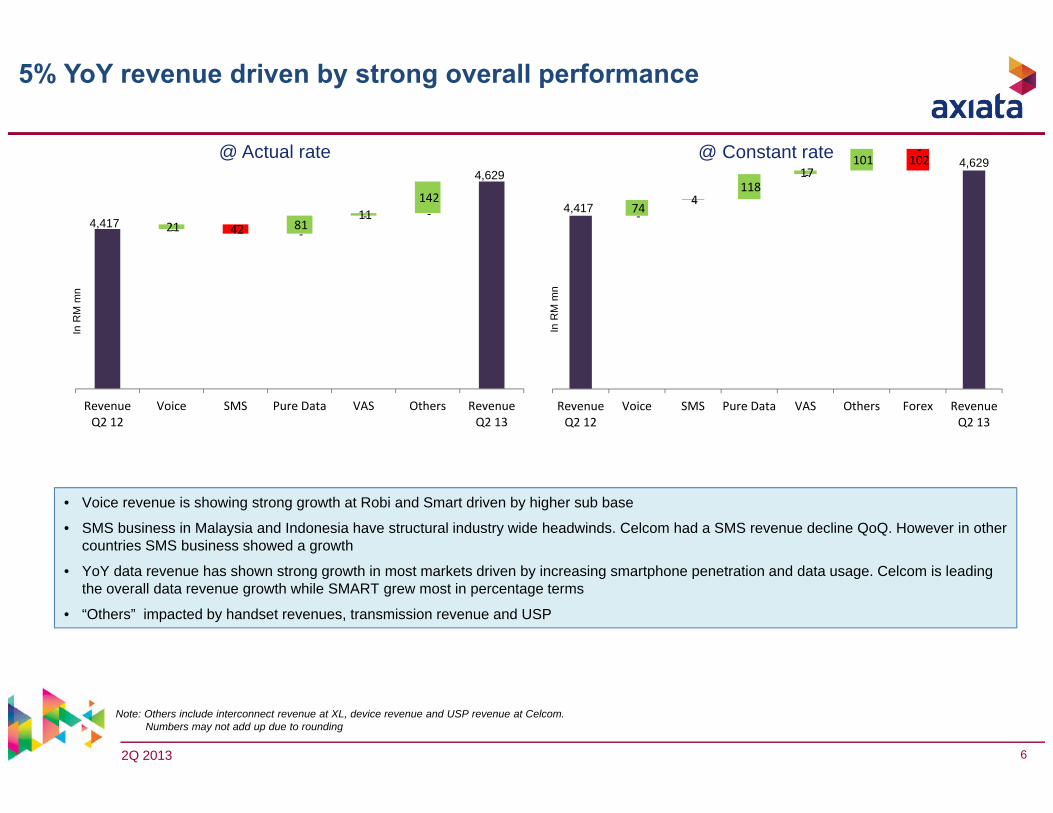
5% YoY revenue driven by strong overall performance
• Voice revenue is showing strong growth at Robi and Smart driven by higher sub base
• SMS business in Malaysia and Indonesia have structural industry wide headwinds. Celcom had a SMS revenue decline QoQ. However in other countries SMS business showed a growth
• YoY data revenue has shown strong growth in most markets driven by increasing smartphone penetration and data usage. Celcom is leading the overall data revenue growth while SMART grew most in percentage terms
• “Others” impacted by handset revenues, transmission revenue and USP
In R
M m
n
In R
M m
n
@ Actual rate @ Constant rate
‐‐
‐102
74 4 118
17 101
‐
RevenueQ2 12
Voice SMS Pure Data VAS Others Forex RevenueQ2 13
4,417
4,629
4,417
4,629
Note: Others include interconnect revenue at XL, device revenue and USP revenue at Celcom.Numbers may not add up due to rounding
2Q 2013 7
3,494
3,764 3,644 119 21 18 41 10 61
82 351
21 91 47 10
EBITDA YTD'11
Celcom XL
Dialog
Robi
Hello
Inter‐
Elim
ination/
Multin
et/O
thers
EBITDA YTD'12
Celcom XL
Dialog
Robi
Smart
Inter‐
Elim
ination/
Multin
et/O
thers
EBITDA YTD'13
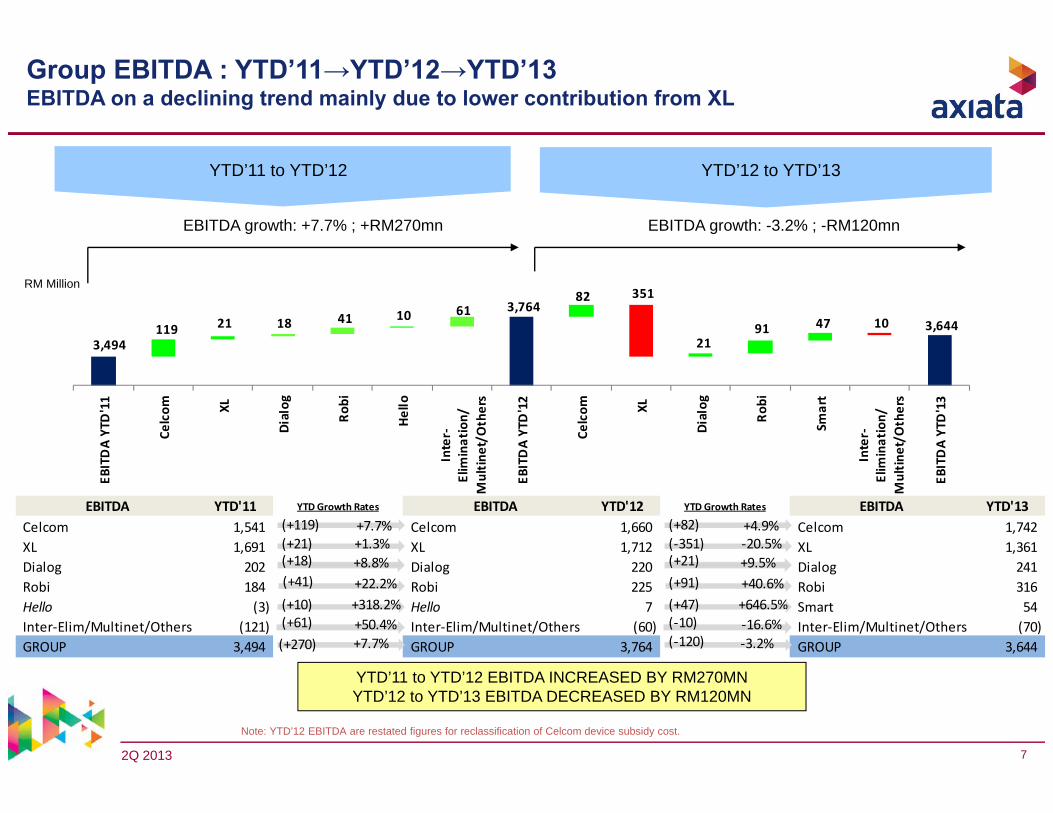
Group EBITDA : YTD’11→YTD’12→YTD’13 EBITDA on a declining trend mainly due to lower contribution from XL
YTD’11 to YTD’12 YTD’12 to YTD’13
RM Million
YTD’11 to YTD’12 EBITDA INCREASED BY RM270MN YTD’12 to YTD’13 EBITDA DECREASED BY RM120MN
EBITDA growth: -3.2% ; -RM120mnEBITDA growth: +7.7% ; +RM270mn
Note: YTD’12 EBITDA are restated figures for reclassification of Celcom device subsidy cost.
EBITDA YTD'11 YTD Growth Rates EBITDA YTD'12 YTD Growth Rates EBITDA YTD'13Celcom 1,541 Celcom 1,660 Celcom 1,742 XL 1,691 XL 1,712 XL 1,361 Dialog 202 Dialog 220 Dialog 241 Robi 184 Robi 225 Robi 316 Hello (3) Hello 7 Smart 54 Inter‐Elim/Multinet/Others (121) Inter‐Elim/Multinet/Others (60) Inter‐Elim/Multinet/Others (70) GROUP 3,494 GROUP 3,764 GROUP 3,644
+4.9%‐20.5%+9.5%+40.6%+646.5%‐16.6%‐3.2%
(+82)(‐351)(+21)(+91)(+47)(‐10)(‐120)
+7.7%+1.3%+8.8%+22.2%+318.2%+50.4%+7.7%
(+119)(+21)(+18)
(+10)(+61)(+270)
(+41)
2Q 2013 8
1,406 1,467 1,414 1,618 1,458 1,382 31 69 23 152 109 57
56 76 56
YTD
'11
Fore
x G
ain
Acq
uisi
tion
ofId
ea Ass
etim
pairm
ent
Nor
mal
ised
YTD
'11
YTD
'12
FORE
X Lo
ss
Ass
etim
pairm
ent
Cel
com
tax
ince
ntiv
e
Nor
mal
ised
YTD
'12
Ope
ratio
ns
Nor
mal
ised
YTD
'13
Cel
com
tax
ince
ntiv
e
Ass
etim
pairm
ent /
writ
e-of
f
Fore
x Lo
ss
YTD
'13
Normalised YTD’13 PATNormalised YTD’12 PAT
Normalised Growth: -9.8%
RM Million
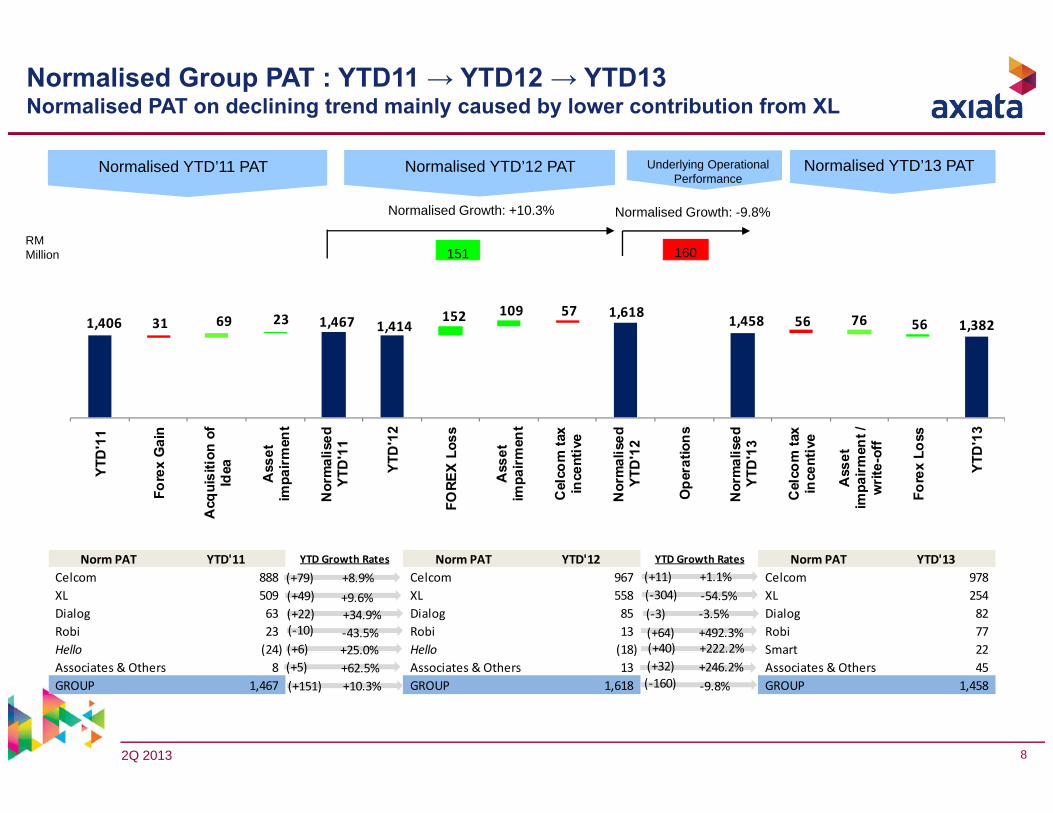
Normalised Group PAT : YTD11 → YTD12 → YTD13Normalised PAT on declining trend mainly caused by lower contribution from XL
Normalised YTD’11 PAT
Normalised Growth: +10.3%
Underlying Operational Performance
151 160
Norm PAT YTD'11 YTD Growth Rates Norm PAT YTD'12 YTD Growth Rates Norm PAT YTD'13Celcom 888 Celcom 967 Celcom 978 XL 509 XL 558 XL 254 Dialog 63 Dialog 85 Dialog 82 Robi 23 Robi 13 Robi 77 Hello (24) Hello (18) Smart 22 Associates & Others 8 Associates & Others 13 Associates & Others 45 GROUP 1,467 GROUP 1,618 GROUP 1,458
+1.1%(+11)(‐304)(‐3)(+64)(+40)(+32)(‐160)
‐54.5%‐3.5%+492.3%+222.2%+246.2%‐9.8%
(+79)
(+22)(‐10)(+6)(+5)(+151)
+8.9%+9.6%+34.9%‐43.5%+25.0%+62.5%+10.3%
(+49)
2Q 2013 9
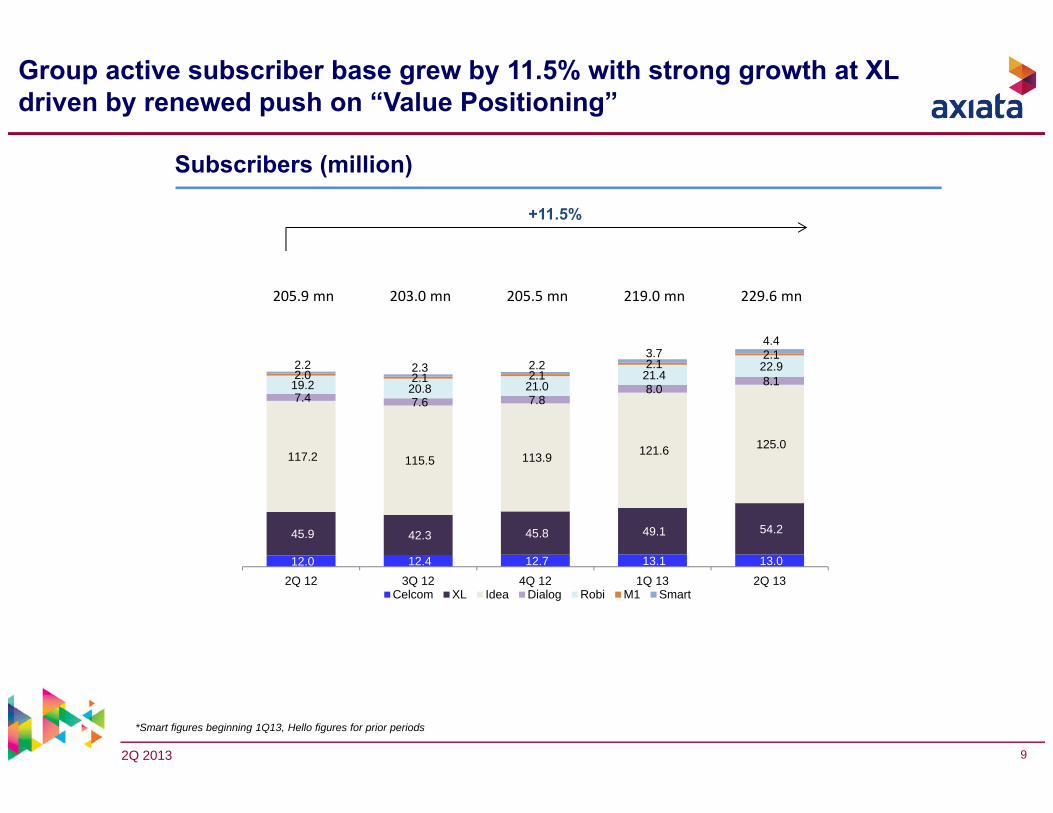
Group active subscriber base grew by 11.5% with strong growth at XL driven by renewed push on “Value Positioning”
+11.5%
*Smart figures beginning 1Q13, Hello figures for prior periods
Subscribers (million)
12.0 12.4 12.7 13.1 13.0
45.9 42.3 45.8 49.1 54.2
117.2 115.5 113.9 121.6 125.0
7.4 7.6 7.8 8.0
8.1 19.2 20.8 21.0 21.4
22.9 2.0 2.1 2.1
2.1 2.1
2.2 2.3 2.2 3.7
4.4
2Q 12 3Q 12 4Q 12 1Q 13 2Q 13Celcom XL Idea Dialog Robi M1 Smart
205.9 mn 203.0 mn 205.5 mn 219.0 mn 229.6 mn
2Q 2013 10
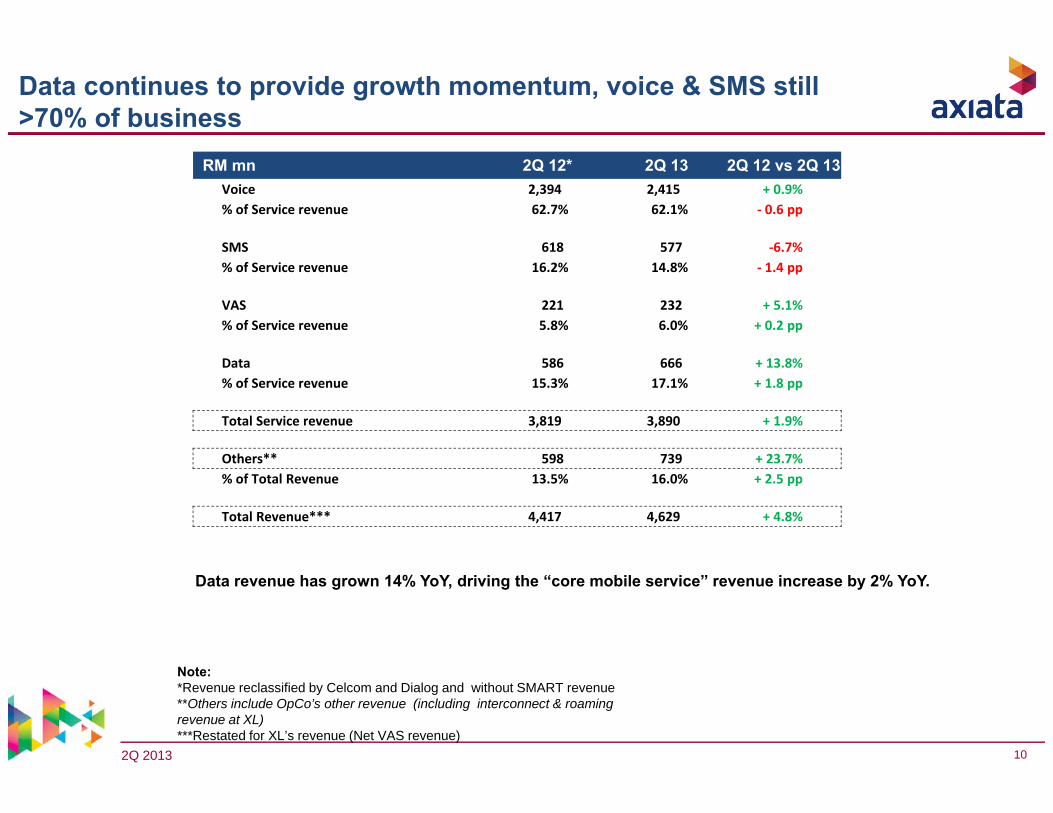
Data continues to provide growth momentum, voice & SMS still >70% of business
Note:*Revenue reclassified by Celcom and Dialog and without SMART revenue**Others include OpCo’s other revenue (including interconnect & roaming revenue at XL) ***Restated for XL’s revenue (Net VAS revenue)
Data revenue has grown 14% YoY, driving the “core mobile service” revenue increase by 2% YoY.
RM mn 2Q 12* 2Q 13 2Q 12 vs 2Q 13Voice 2,394 2,415 + 0.9%% of Service revenue 62.7% 62.1% ‐ 0.6 pp
SMS 618 577 ‐6.7%% of Service revenue 16.2% 14.8% ‐ 1.4 pp
VAS 221 232 + 5.1%% of Service revenue 5.8% 6.0% + 0.2 pp
Data 586 666 + 13.8%% of Service revenue 15.3% 17.1% + 1.8 pp
Total Service revenue 3,819 3,890 + 1.9%
Others** 598 739 + 23.7%% of Total Revenue 13.5% 16.0% + 2.5 pp
Total Revenue*** 4,417 4,629 + 4.8%
2Q 2013 11
863
1,075
417 485
141
562 513
‐
100
200
300
400
500
600
700
800
900
1,000
2Q 12 3Q 12 4Q 12 1Q 13 2Q 13 YTD 12 YTD 130
200
400
600
800
1000
1200
761 806
455
894 864 1,566
1,758
0
200
400
600
800
1000
1200
1400
1600
1800
2000
‐
200
400
600
800
1,000
1,200
2Q 12 3Q 12 4Q 12 1Q 13 2Q 13 YTD 12 YTD 13
FCF*RM mn
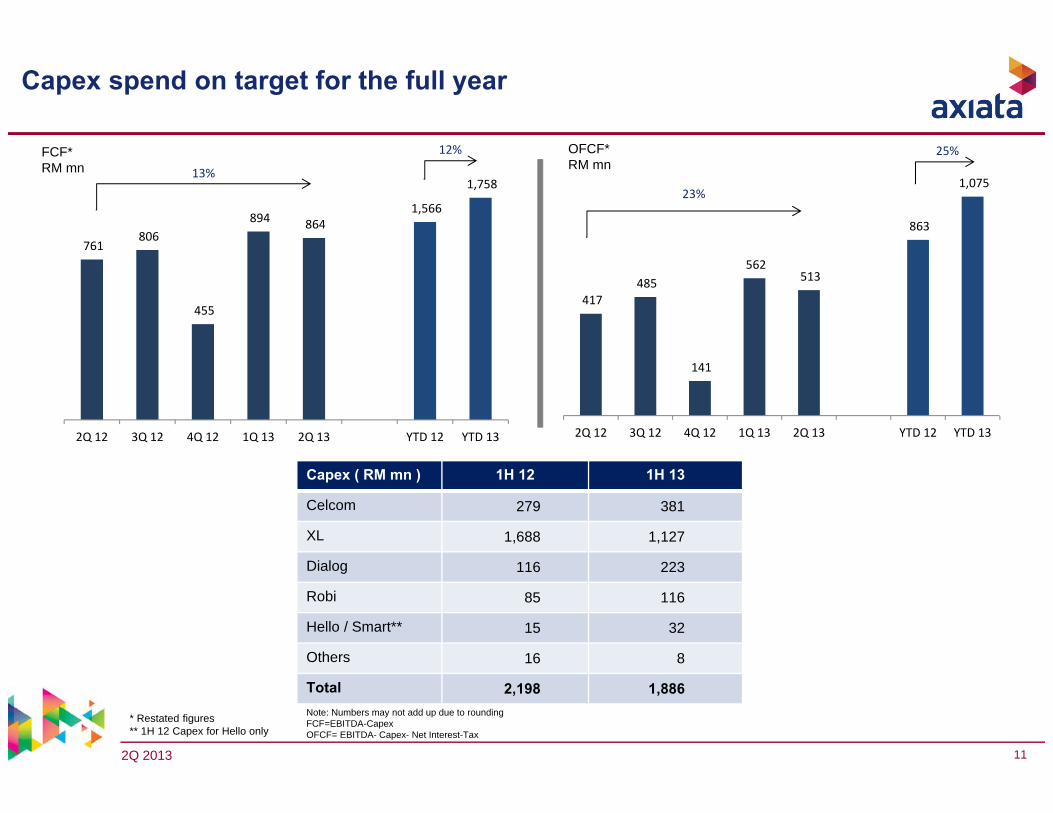
Capex spend on target for the full year
Capex ( RM mn ) 1H 12 1H 13
Celcom 279 381
XL 1,688 1,127
Dialog 116 223
Robi 85 116
Hello / Smart** 15 32
Others 16 8
Total 2,198 1,886
OFCF*RM mn13%
Note: Numbers may not add up due to roundingFCF=EBITDA-CapexOFCF= EBITDA- Capex- Net Interest-Tax
23%
* Restated figures** 1H 12 Capex for Hello only
12% 25%
2Q 2013 12
6,480
8,622 7,906 7,997
6,644
30‐Jun‐12 30‐Sep‐12 31‐Dec‐12 31‐Mar‐13 30‐Jun‐13
Cash and BankRM' Million1.58
1.801.70
1.83 1.89
0.71 0.64 0.64 0.70
0.98
30-Jun-12 30-Sep-12 31-Dec-12 31-Mar-13 30-Jun-13
Gross debt to EBITDA Net debt to EBITDA
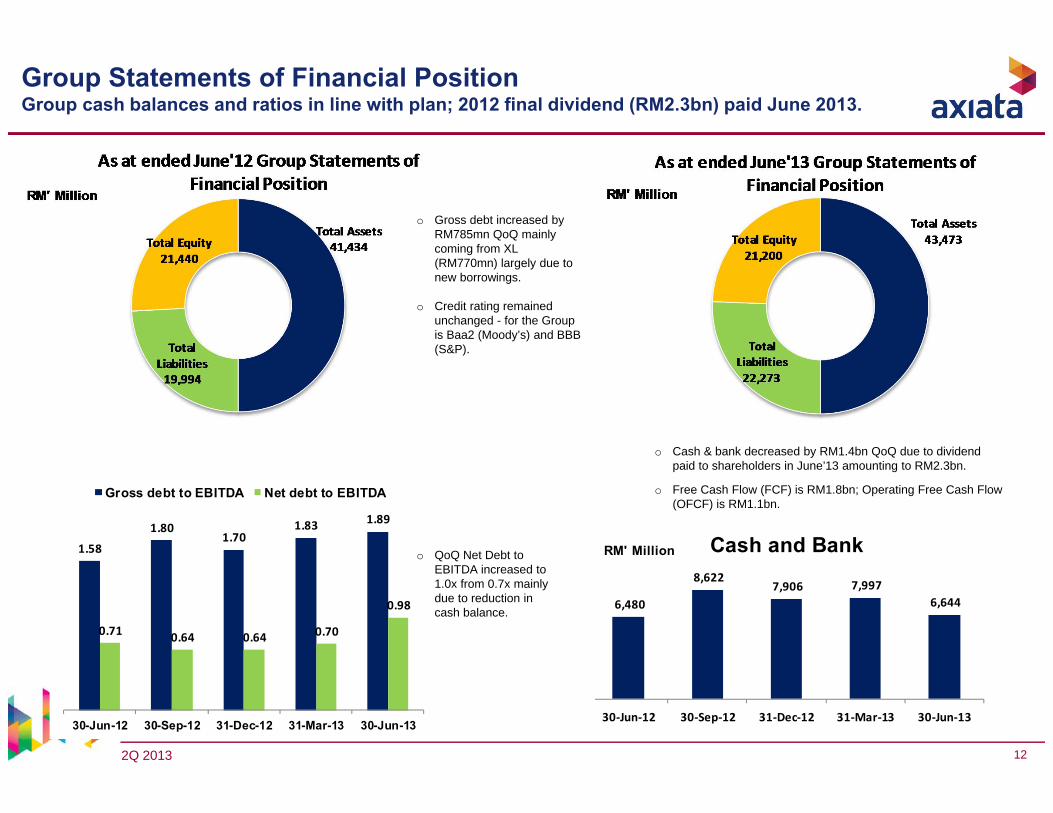
Group Statements of Financial Position Group cash balances and ratios in line with plan; 2012 final dividend (RM2.3bn) paid June 2013.
o Gross debt increased by RM785mn QoQ mainly coming from XL (RM770mn) largely due to new borrowings.
o Credit rating remained unchanged - for the Group is Baa2 (Moody’s) and BBB (S&P).
o Cash & bank decreased by RM1.4bn QoQ due to dividend paid to shareholders in June’13 amounting to RM2.3bn.
o Free Cash Flow (FCF) is RM1.8bn; Operating Free Cash Flow (OFCF) is RM1.1bn.
o QoQ Net Debt to EBITDA increased to 1.0x from 0.7x mainly due to reduction in cash balance.
2Q 2013 13
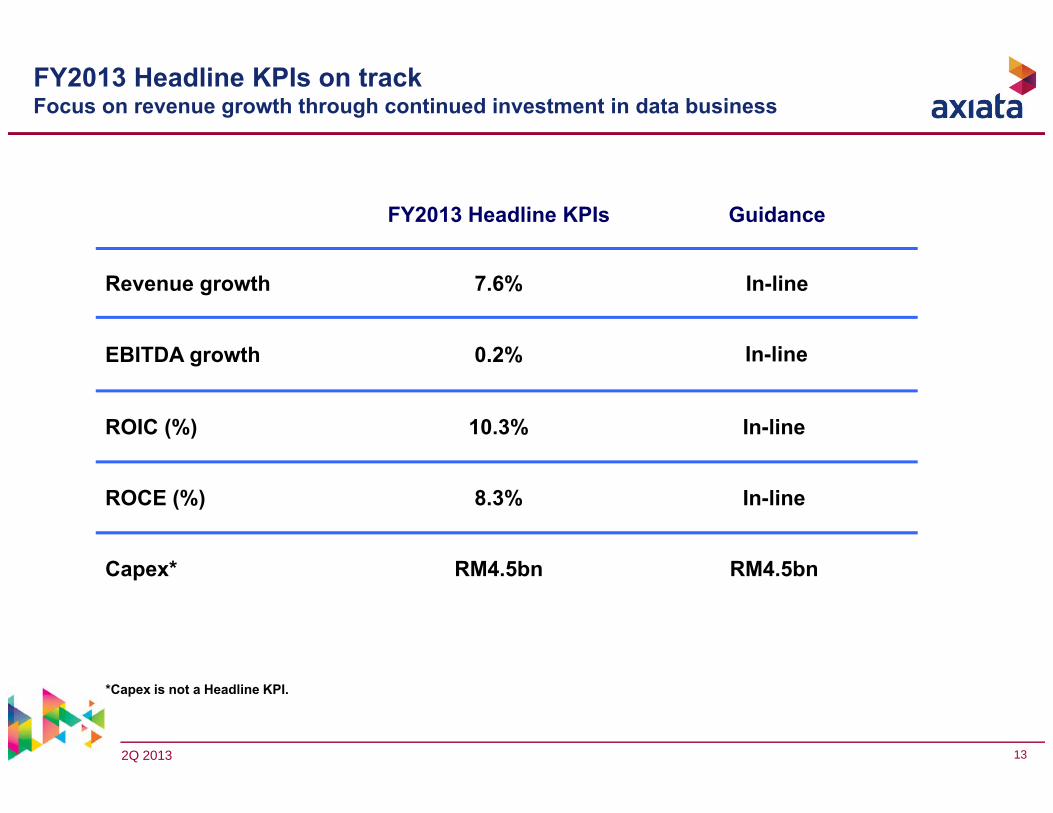
FY2013 Headline KPIs on trackFocus on revenue growth through continued investment in data business
*Capex is not a Headline KPI.
FY2013 Headline KPIs Guidance
Revenue growth 7.6% In-line
EBITDA growth 0.2% In-line
ROIC (%) 10.3% In-line
ROCE (%) 8.3% In-line
Capex* RM4.5bn RM4.5bn
2Q 2013 14
Appendix
2Q 2013 15
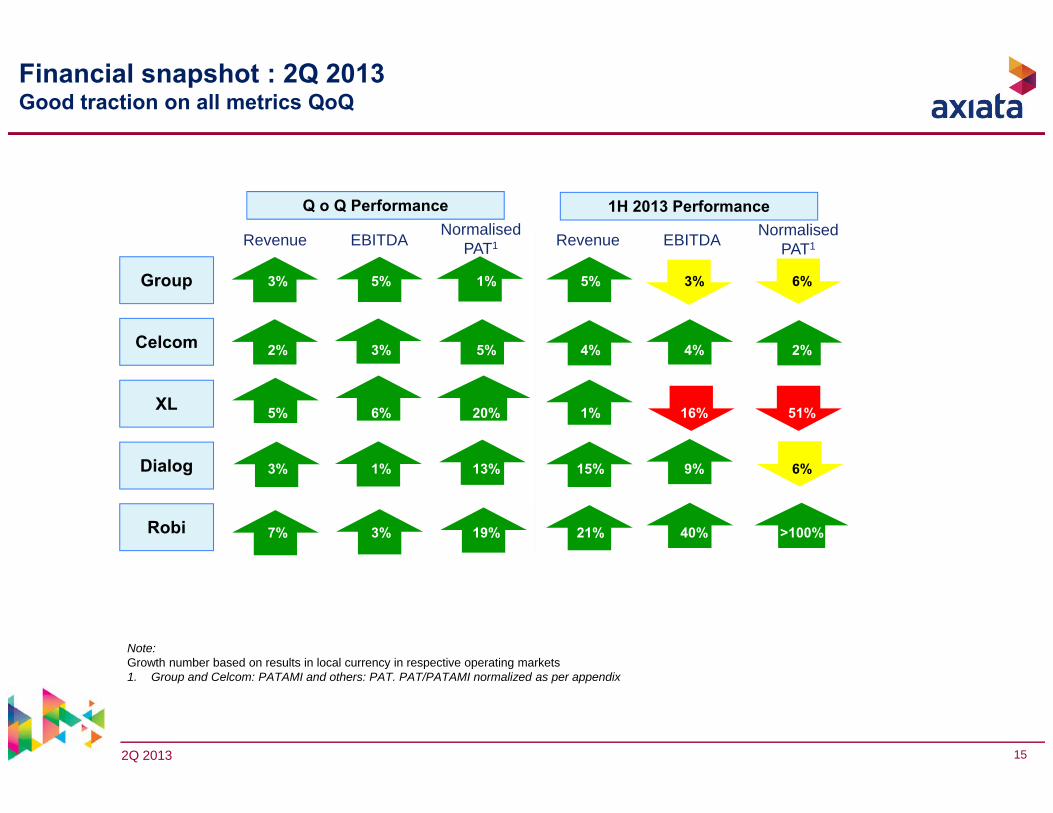
3% 5% 1% 5% 3% 6%
2% 3% 5% 4% 4% 2%
5% 6% 20% 1% 16% 51%
3% 1% 13% 15% 9% 6%
7% 3% 19% 21% 40% >100%
Revenue EBITDA Revenue EBITDA
Group
Celcom
XL
Dialog
Robi
NormalisedPAT1
Q o Q Performance 1H 2013 Performance
Financial snapshot : 2Q 2013Good traction on all metrics QoQ
Note: Growth number based on results in local currency in respective operating markets1. Group and Celcom: PATAMI and others: PAT. PAT/PATAMI normalized as per appendix
NormalisedPAT1
2Q 2013 16
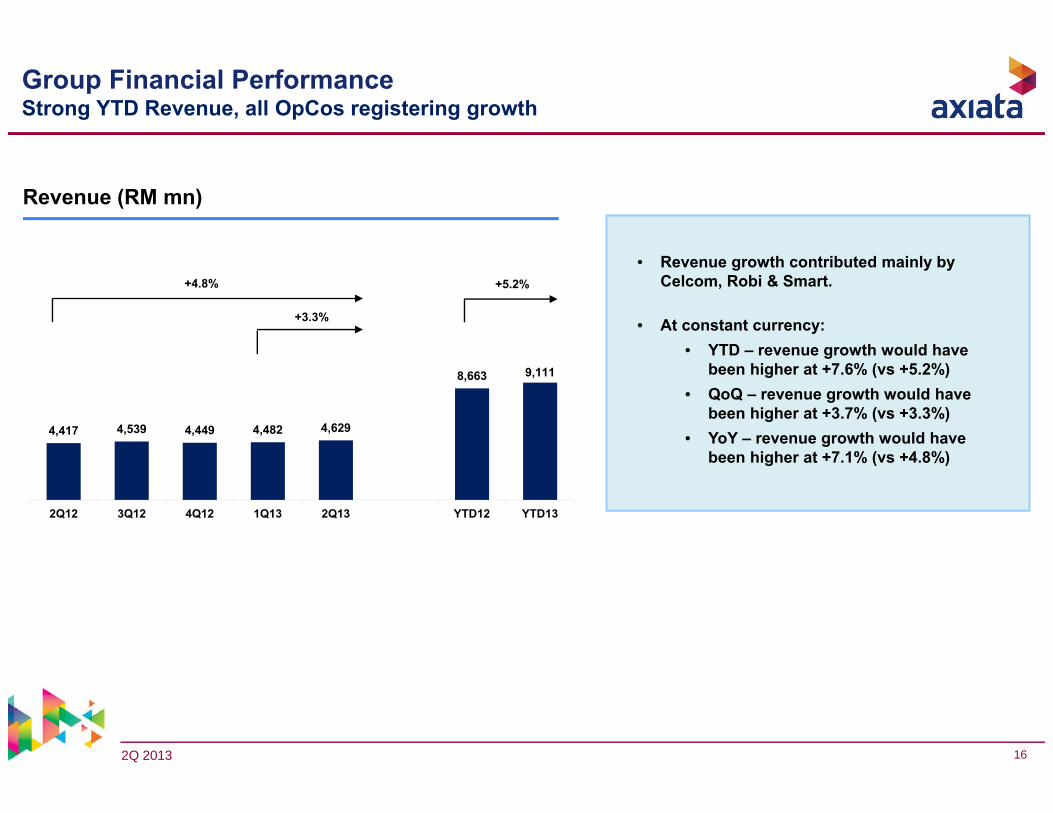
4,417 4,539 4,449 4,482 4,629
8,663 9,111
2Q12 3Q12 4Q12 1Q13 2Q13 YTD12 YTD13
+4.8%
+3.3%
+5.2%
Group Financial PerformanceStrong YTD Revenue, all OpCos registering growth
Revenue (RM mn)
• Revenue growth contributed mainly by Celcom, Robi & Smart.
• At constant currency:• YTD – revenue growth would have
been higher at +7.6% (vs +5.2%)• QoQ – revenue growth would have
been higher at +3.7% (vs +3.3%)• YoY – revenue growth would have
been higher at +7.1% (vs +4.8%)
2Q 2013 17
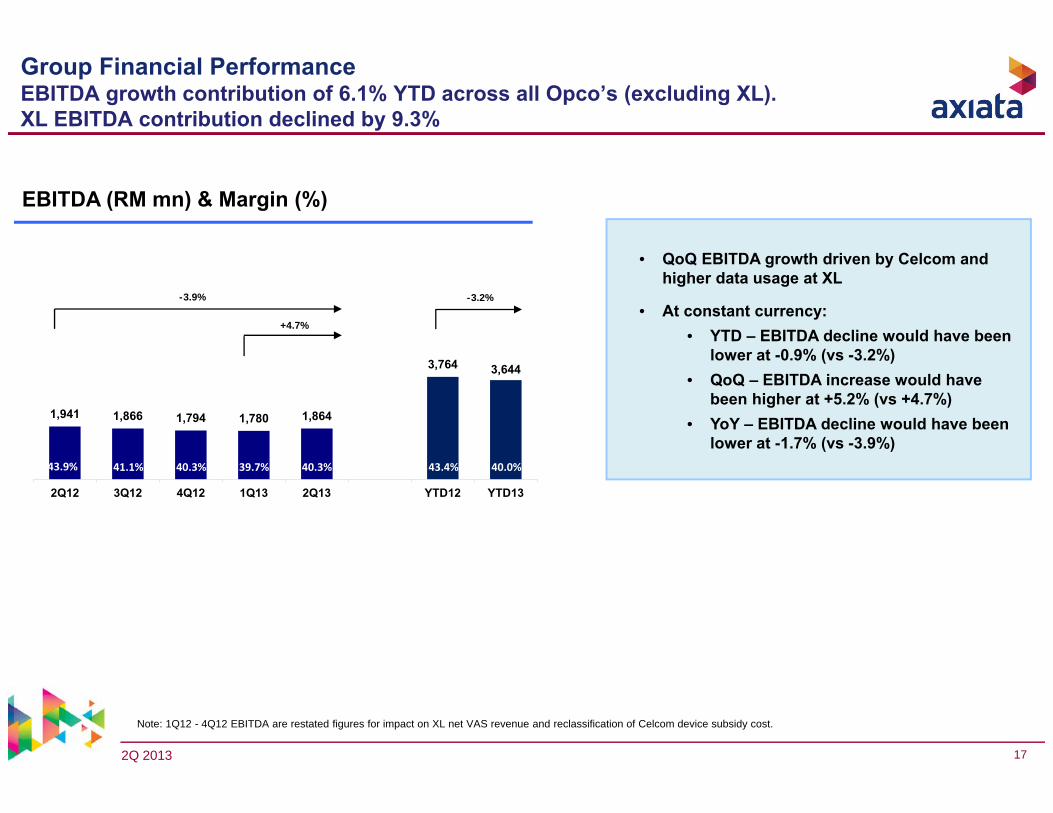
1,941 1,866 1,794 1,780 1,864
3,764 3,644
2Q12 3Q12 4Q12 1Q13 2Q13 YTD12 YTD13
-3.9%
+4.7%
-3.2%
41.1% 39.7% 40.3% 43.4% 40.0%40.3%43.9%
EBITDA (RM mn) & Margin (%)
Group Financial PerformanceEBITDA growth contribution of 6.1% YTD across all Opco’s (excluding XL). XL EBITDA contribution declined by 9.3%
Note: 1Q12 - 4Q12 EBITDA are restated figures for impact on XL net VAS revenue and reclassification of Celcom device subsidy cost.
• QoQ EBITDA growth driven by Celcom and higher data usage at XL
• At constant currency:• YTD – EBITDA decline would have been
lower at -0.9% (vs -3.2%)• QoQ – EBITDA increase would have
been higher at +5.2% (vs +4.7%)• YoY – EBITDA decline would have been
lower at -1.7% (vs -3.9%)
2Q 2013 18
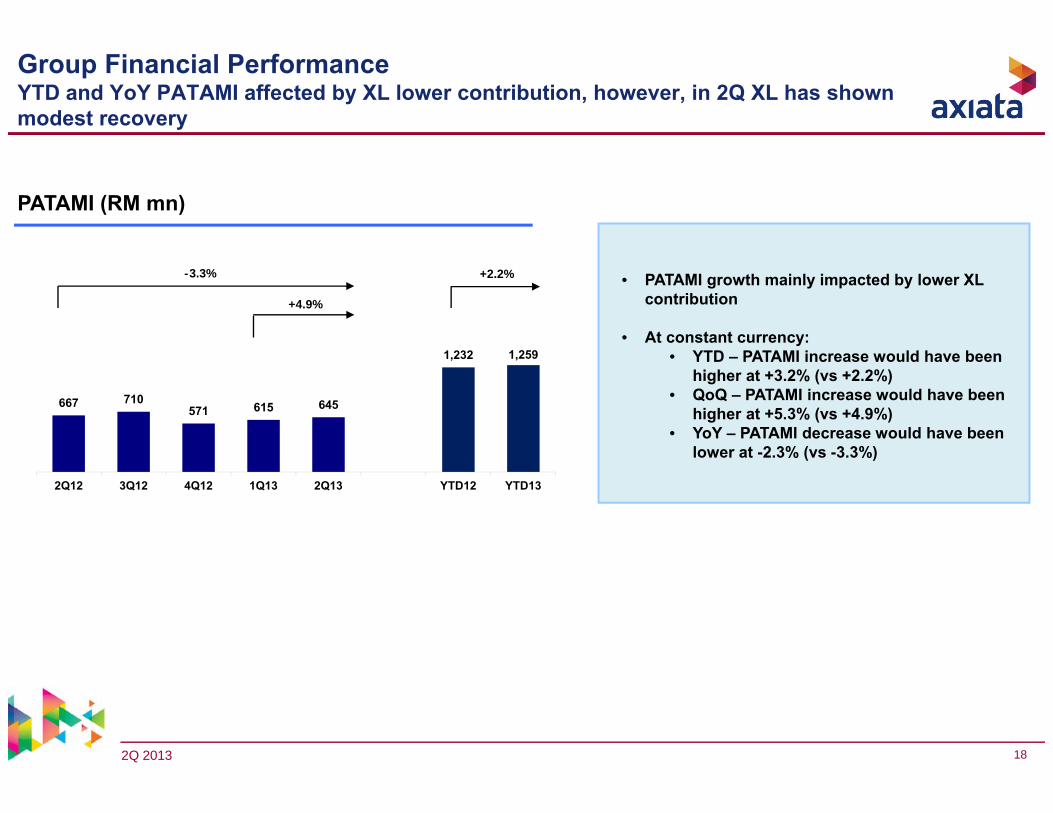
667 710571 615 645
1,232 1,259
2Q12 3Q12 4Q12 1Q13 2Q13 YTD12 YTD13
-3.3%
+4.9%
+2.2%
Group Financial PerformanceYTD and YoY PATAMI affected by XL lower contribution, however, in 2Q XL has shown modest recovery
• PATAMI growth mainly impacted by lower XL contribution
• At constant currency:• YTD – PATAMI increase would have been
higher at +3.2% (vs +2.2%)• QoQ – PATAMI increase would have been
higher at +5.3% (vs +4.9%)• YoY – PATAMI decrease would have been
lower at -2.3% (vs -3.3%)
PATAMI (RM mn)
2Q 2013 19
• Continuing competition in Indonesia has put profitability under pressure- XL has reacted to competitive practice by adjusting its prices and packages to regain market
positioning. XL has been able to regain its subscriber base over last couple of months.However profitability remains a challenge
• SMS revenue continues to be under pressure in Malaysia- Industry wide SMS revenue still under pressure in Malaysia, with revenue decline in Celcom
this quarter. However, apart from Celcom, SMS revenue posted growth in all other opcos QoQ.- To ensure stability of SMS revenue, both XL and Celcom are concentrating on bundled
offerings.
• Data Prices in Sri Lanka• Although Sri Lanka’s data market is growing rapidly, we are witnessing uncompetitive pricing
by certain competition. Dialog will continue to play its market leadership role in providing goodquality data experience to its customers
• 3G in Bangladesh- 3G Auctions in Bangladesh are expected to be conducted in the coming weeks. Industry is still
discussing terms with government
• Capital call by Idea- Idea has recently issued a notice for a capital call for ~600m USD. Axiata has an option to
subscribe to its share, which may result in a cash outflow of ~120m USD in 3Q 2013
Challenges and mitigating factorsIncreasing competitive intensity, continuing data network investments in Indonesia and structural challenges in SMS markets in Malaysia and Indonesia
2Q 2013 20
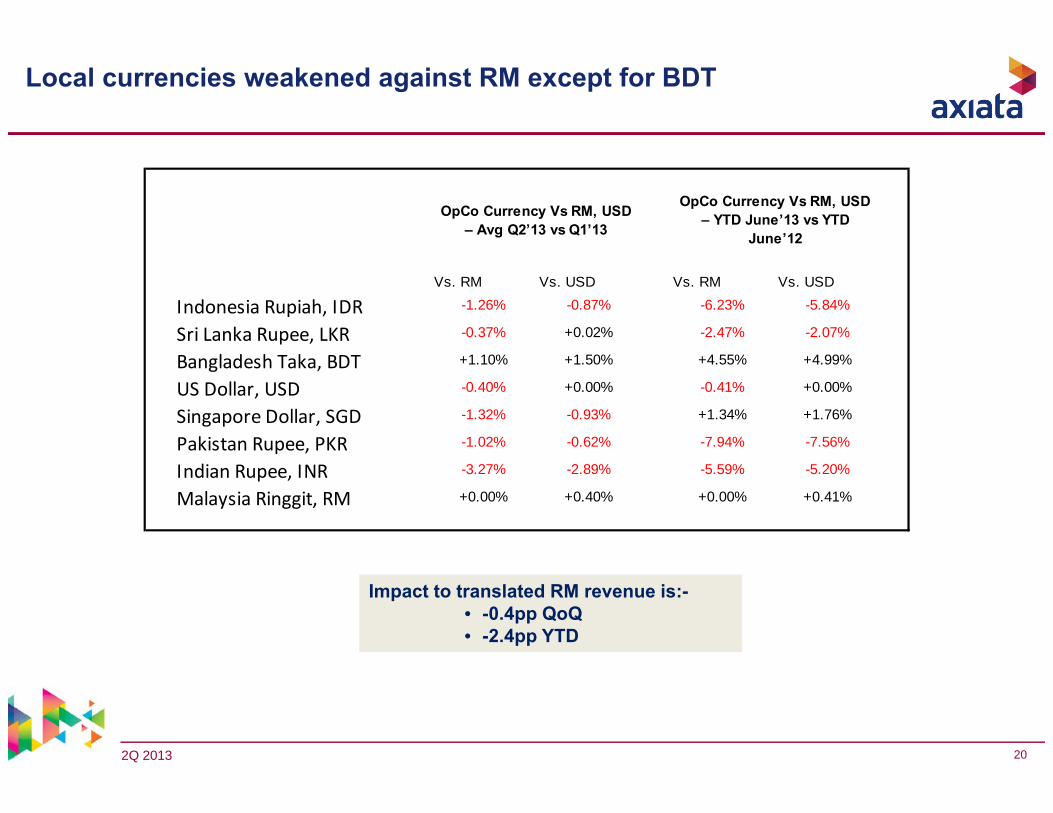
Local currencies weakened against RM except for BDT
Vs. RM Vs. USD Vs. RM Vs. USD
Indonesia Rupiah, IDR -1.26% -0.87% -6.23% -5.84%
Sri Lanka Rupee, LKR -0.37% +0.02% -2.47% -2.07%
Bangladesh Taka, BDT +1.10% +1.50% +4.55% +4.99%
US Dollar, USD -0.40% +0.00% -0.41% +0.00%
Singapore Dollar, SGD -1.32% -0.93% +1.34% +1.76%
Pakistan Rupee, PKR -1.02% -0.62% -7.94% -7.56%
Indian Rupee, INR -3.27% -2.89% -5.59% -5.20%
Malaysia Ringgit, RM +0.00% +0.40% +0.00% +0.41%
OpCo Currency Vs RM, USD – Avg Q2’13 vs Q1’13
OpCo Currency Vs RM, USD – YTD June’13 vs YTD
June’12
Impact to translated RM revenue is:-• -0.4pp QoQ• -2.4pp YTD
2Q 2013 21
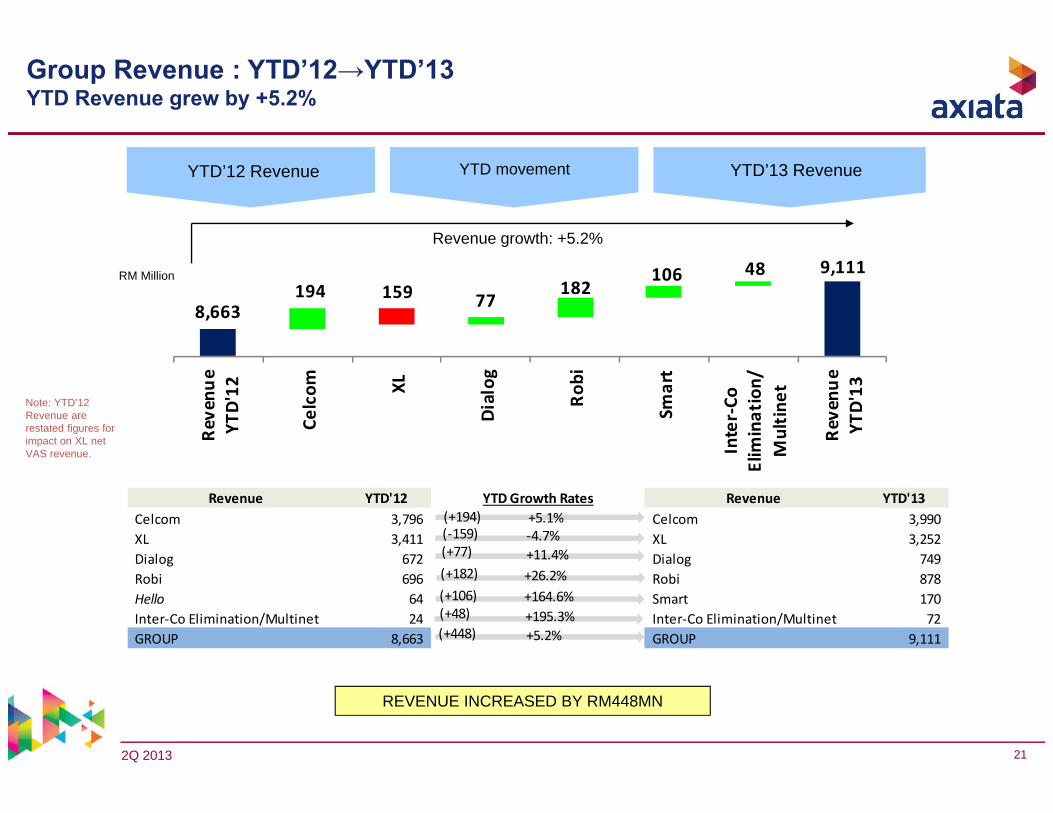
8,663
9,111 194 159 77
182 106 48
Revenu
eYT
D'12
Celcom XL
Dialog
Robi
Smart
Inter‐Co
Elim
ination/
Multin
et
Revenu
eYT
D'13
YTD’12 Revenue YTD’13 RevenueYTD movement
RM Million
REVENUE INCREASED BY RM448MN
Revenue growth: +5.2%
Revenue YTD'12 YTD Growth Rates Revenue YTD'13Celcom 3,796 Celcom 3,990 XL 3,411 XL 3,252 Dialog 672 Dialog 749 Robi 696 Robi 878 Hello 64 Smart 170 Inter‐Co Elimination/Multinet 24 Inter‐Co Elimination/Multinet 72 GROUP 8,663 GROUP 9,111
+5.1%‐4.7%+11.4%+26.2%+164.6%+195.3%+5.2%
(+194)(‐159)(+77)(+182)(+106)(+48)(+448)
Note: YTD’12 Revenue are restated figures for impact on XL net VAS revenue.
Group Revenue : YTD’12→YTD’13YTD Revenue grew by +5.2%
2Q 2013 22
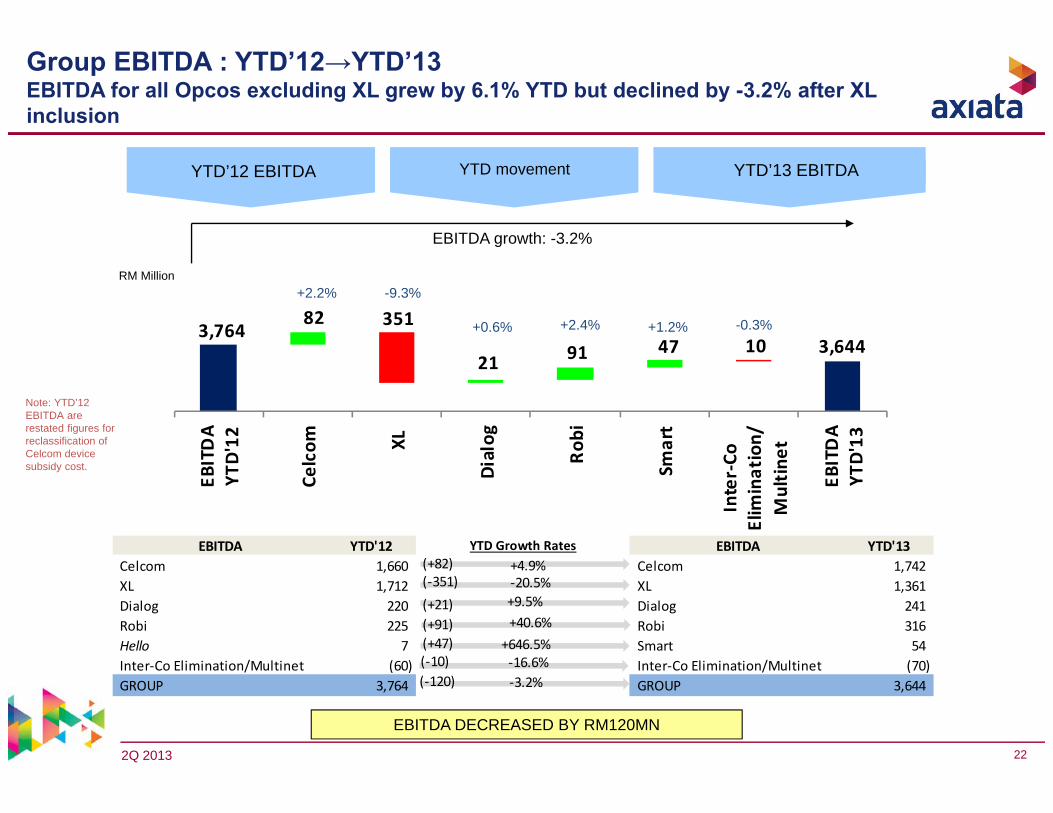
3,764 3,644
82 351
21 91 47 10
EBITDA
YTD'12
Celcom XL
Dialog
Robi
Smart
Inter‐Co
Elim
ination/
Multin
et
EBITDA
YTD'13
YTD’12 EBITDA YTD’13 EBITDAYTD movement
RM Million
EBITDA DECREASED BY RM120MN
EBITDA growth: -3.2%
Note: YTD’12 EBITDA are restated figures for reclassification of Celcom device subsidy cost.
EBITDA YTD'12 YTD Growth Rates EBITDA YTD'13Celcom 1,660 Celcom 1,742 XL 1,712 XL 1,361 Dialog 220 Dialog 241 Robi 225 Robi 316 Hello 7 Smart 54 Inter‐Co Elimination/Multinet (60) Inter‐Co Elimination/Multinet (70) GROUP 3,764 GROUP 3,644
+4.9%‐20.5%+9.5%+40.6%
+646.5%‐16.6%‐3.2%
(+82)(‐351)(+21)(+91)(+47)(‐10)(‐120)
+2.2% -9.3%
+0.6% +2.4% +1.2% -0.3%
Group EBITDA : YTD’12→YTD’13 EBITDA for all Opcos excluding XL grew by 6.1% YTD but declined by -3.2% after XL inclusion
2Q 2013 23
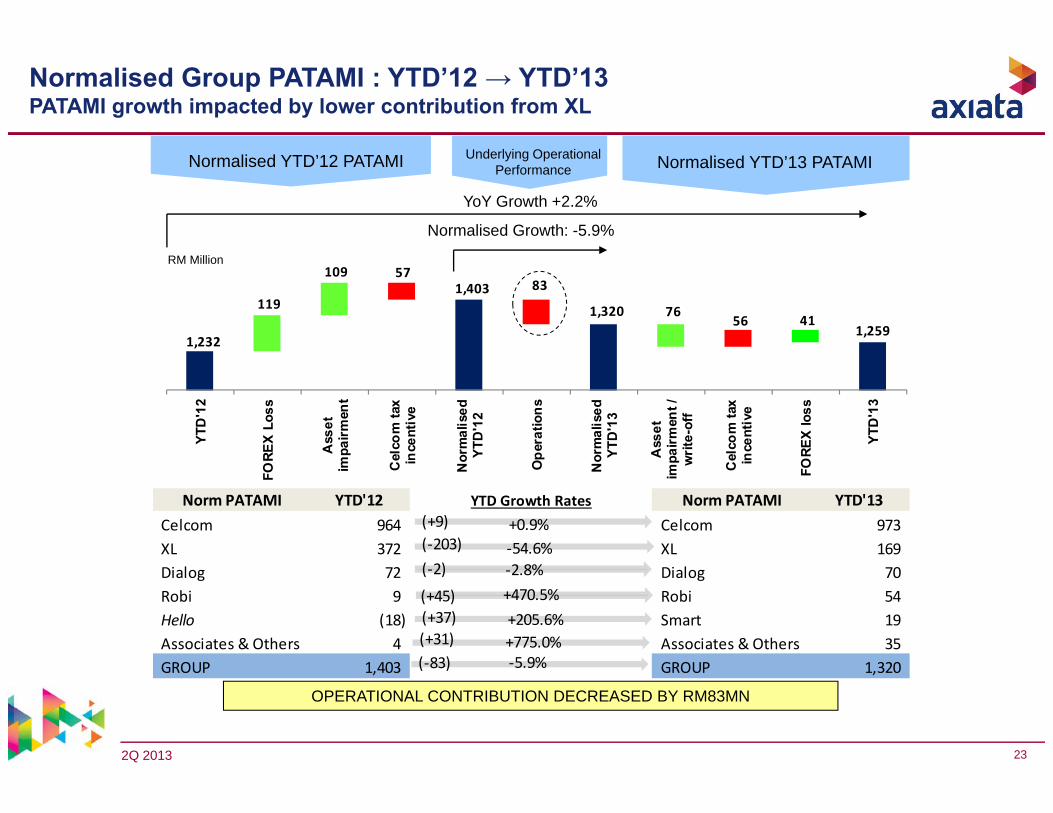
1,232
1,403 1,320
1,259
119
109 57 83
76 56 41
YTD
'12
FORE
X Lo
ss
Ass
etim
pairm
ent
Cel
com
tax
ince
ntiv
e
Nor
mal
ised
YTD
'12
Ope
ratio
ns
Nor
mal
ised
YTD
'13
Ass
etim
pairm
ent /
writ
e-of
f
Cel
com
tax
ince
ntiv
e
FORE
X lo
ss
YTD
'13
Normalised YTD’13 PATAMINormalised YTD’12 PATAMI
Normalised Growth: -5.9%
YoY Growth +2.2%
RM Million
OPERATIONAL CONTRIBUTION DECREASED BY RM83MN
Underlying Operational Performance
Norm PATAMI YTD'12 YTD Growth Rates Norm PATAMI YTD'13Celcom 964 Celcom 973 XL 372 XL 169 Dialog 72 Dialog 70 Robi 9 Robi 54 Hello (18) Smart 19 Associates & Others 4 Associates & Others 35 GROUP 1,403 GROUP 1,320
+0.9%‐54.6%‐2.8%+470.5%+205.6%+775.0%‐5.9%
(+9)(‐203)(‐2)
(+45)(+37)(+31)(‐83)
Normalised Group PATAMI : YTD’12 → YTD’13PATAMI growth impacted by lower contribution from XL
2Q 2013 24
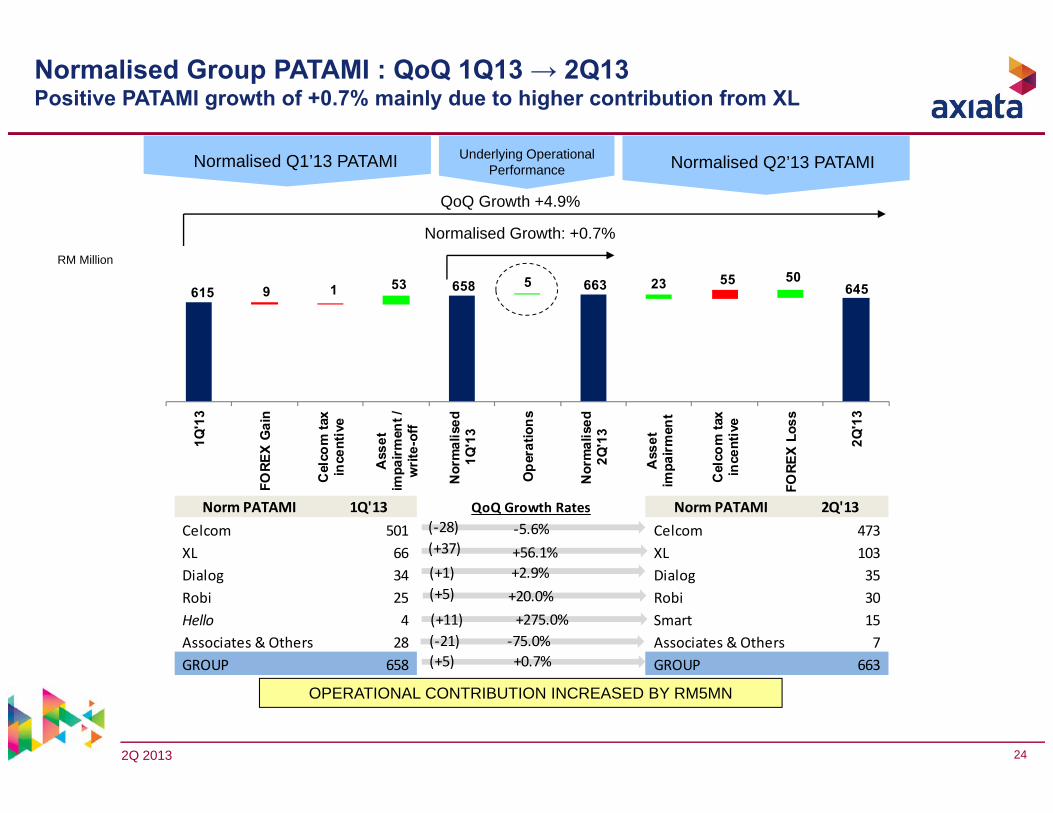
615 658 663 645 9 1 53 5 23 55 50
1Q'1
3
FORE
X G
ain
Cel
com
tax
ince
ntiv
e
Ass
etim
pairm
ent /
writ
e-of
f
Nor
mal
ised
1Q'1
3
Ope
ratio
ns
Nor
mal
ised
2Q'1
3
Ass
etim
pairm
ent
Cel
com
tax
ince
ntiv
e
FORE
X Lo
ss
2Q'1
3
Normalised Q2’13 PATAMINormalised Q1’13 PATAMI
Normalised Growth: +0.7%
QoQ Growth +4.9%
RM Million
OPERATIONAL CONTRIBUTION INCREASED BY RM5MN
Normalised Group PATAMI : QoQ 1Q13 → 2Q13Positive PATAMI growth of +0.7% mainly due to higher contribution from XL
Underlying Operational Performance
Norm PATAMI 1Q'13 QoQ Growth Rates Norm PATAMI 2Q'13Celcom 501 Celcom 473 XL 66 XL 103 Dialog 34 Dialog 35 Robi 25 Robi 30 Hello 4 Smart 15 Associates & Others 28 Associates & Others 7 GROUP 658 GROUP 663
‐5.6%+56.1%+2.9%+20.0%+275.0%
‐75.0%+0.7%
(‐28)(+37)(+1)(+5)
(+11)(‐21)(+5)
2Q 2013 25
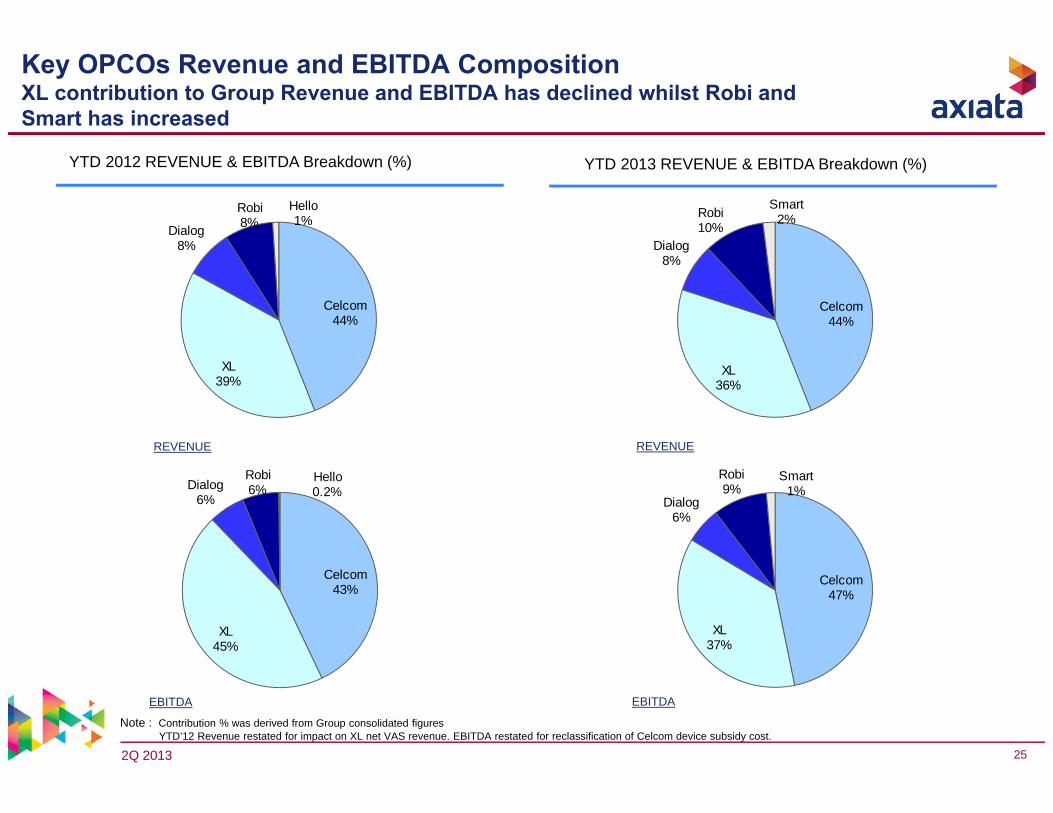
Key OPCOs Revenue and EBITDA CompositionXL contribution to Group Revenue and EBITDA has declined whilst Robi and Smart has increased
YTD 2013 REVENUE & EBITDA Breakdown (%)YTD 2012 REVENUE & EBITDA Breakdown (%)
REVENUE
EBITDA
REVENUE
EBITDA
Note : Contribution % was derived from Group consolidated figuresYTD’12 Revenue restated for impact on XL net VAS revenue. EBITDA restated for reclassification of Celcom device subsidy cost.
Celcom 44%
XL39%
Dialog8%
Robi8%
Hello1%
Celcom 43%
XL45%
Dialog6%
Robi6%
Hello0.2%
Celcom 44%
XL36%
Dialog8%
Robi10%
Smart2%
Celcom 47%
XL37%
Dialog6%
Robi9%
Smart1%
2Q 2013 26
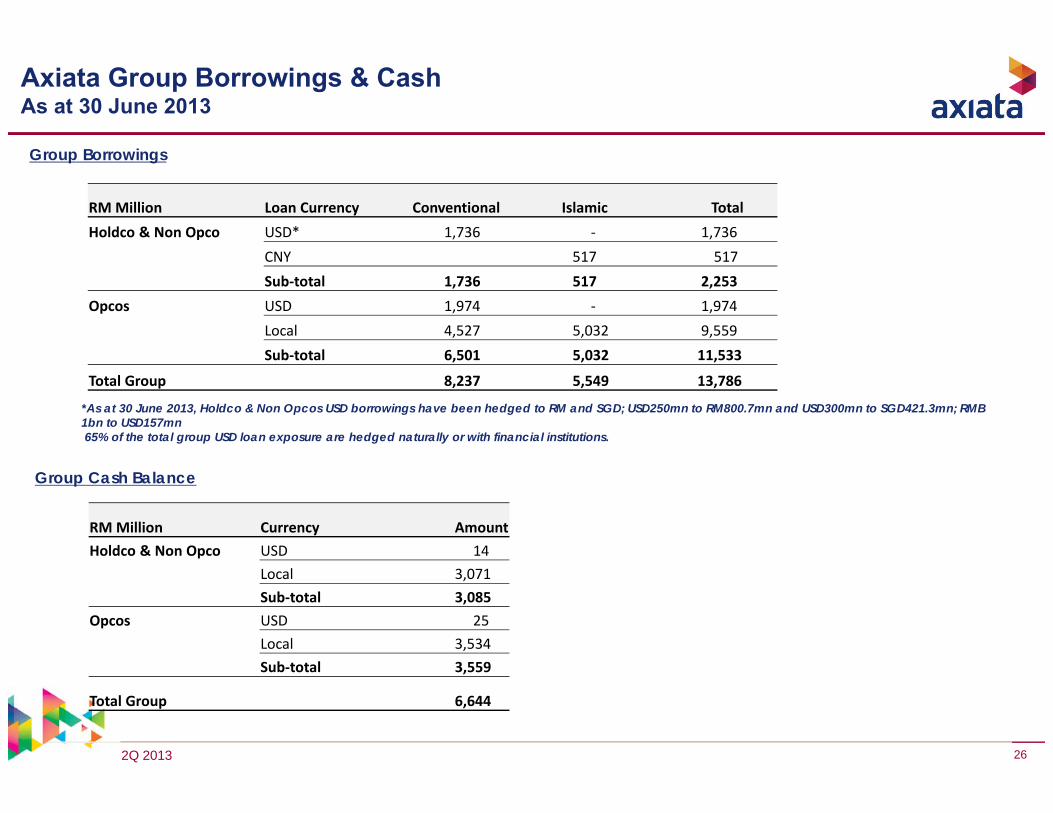
Axiata Group Borrowings & Cash As at 30 June 2013
*As at 30 June 2013, Holdco & Non Opcos USD borrowings have been hedged to RM and SGD; USD250mn to RM800.7mn and USD300mn to SGD421.3mn; RMB 1bn to USD157mn65% of the total group USD loan exposure are hedged naturally or with financial institutions.
Group Borrowings
Group Cash Balance
RM Million Currency AmountHoldco & Non Opco USD 14
Local 3,071Sub‐total 3,085
Opcos USD 25Local 3,534Sub‐total 3,559
Total Group 6,644
RM Million Loan Currency Conventional Islamic TotalHoldco & Non Opco USD* 1,736 ‐ 1,736
CNY 517 517Sub‐total 1,736 517 2,253
Opcos USD 1,974 ‐ 1,974Local 4,527 5,032 9,559Sub‐total 6,501 5,032 11,533
Total Group 8,237 5,549 13,786
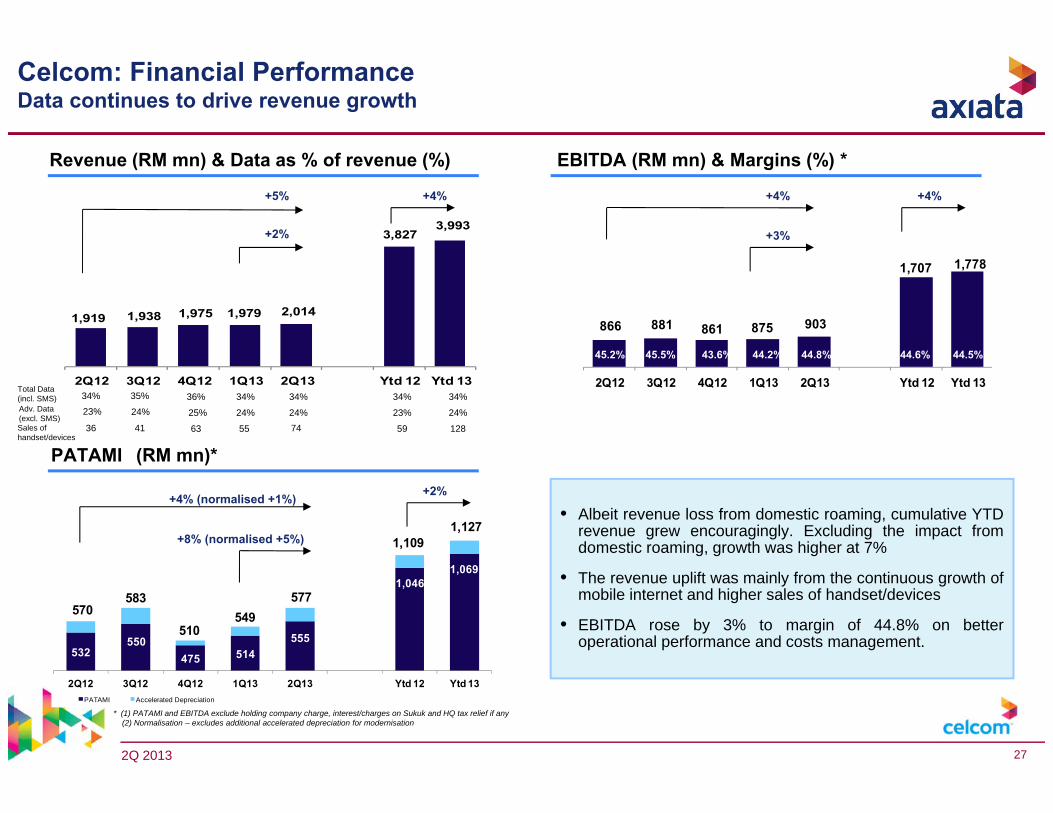
2Q 2013 27
532550
475 514555
1,0461,069
570583
510549
577
1,1091,127
2Q12 3Q12 4Q12 1Q13 2Q13 Ytd 12 Ytd 13PATAMI Accelerated Depreciation
1,919 1,938 1,975 1,979 2,014
3,8273,993
2Q12 3Q12 4Q12 1Q13 2Q13 Ytd 12 Ytd 13
866 881 861 875 903
1,707 1,778
2Q12 3Q12 4Q12 1Q13 2Q13 Ytd 12 Ytd 13
PATAMI (RM mn)*
EBITDA (RM mn) & Margins (%) *
+5%
* (1) PATAMI and EBITDA exclude holding company charge, interest/charges on Sukuk and HQ tax relief if any(2) Normalisation – excludes additional accelerated depreciation for modernisation
Revenue (RM mn) & Data as % of revenue (%)
+4%
+3%+2%
+8% (normalised +5%)
Celcom: Financial Performance Data continues to drive revenue growth
Total Data (incl. SMS)Adv. Data (excl. SMS)
34%
23%34%35% 36% 34%
24%24% 25% 24%
+4% (normalised +1%) • Albeit revenue loss from domestic roaming, cumulative YTD
revenue grew encouragingly. Excluding the impact fromdomestic roaming, growth was higher at 7%
• The revenue uplift was mainly from the continuous growth ofmobile internet and higher sales of handset/devices
• EBITDA rose by 3% to margin of 44.8% on betteroperational performance and costs management.
44.2%45.5% 43.6%45.2% 44.8% 44.6% 44.5%
+4%+4%
+2%
34%
23% 24%
34%
36 7441 63 55Sales of handset/devices
59 128
2Q 2013 28
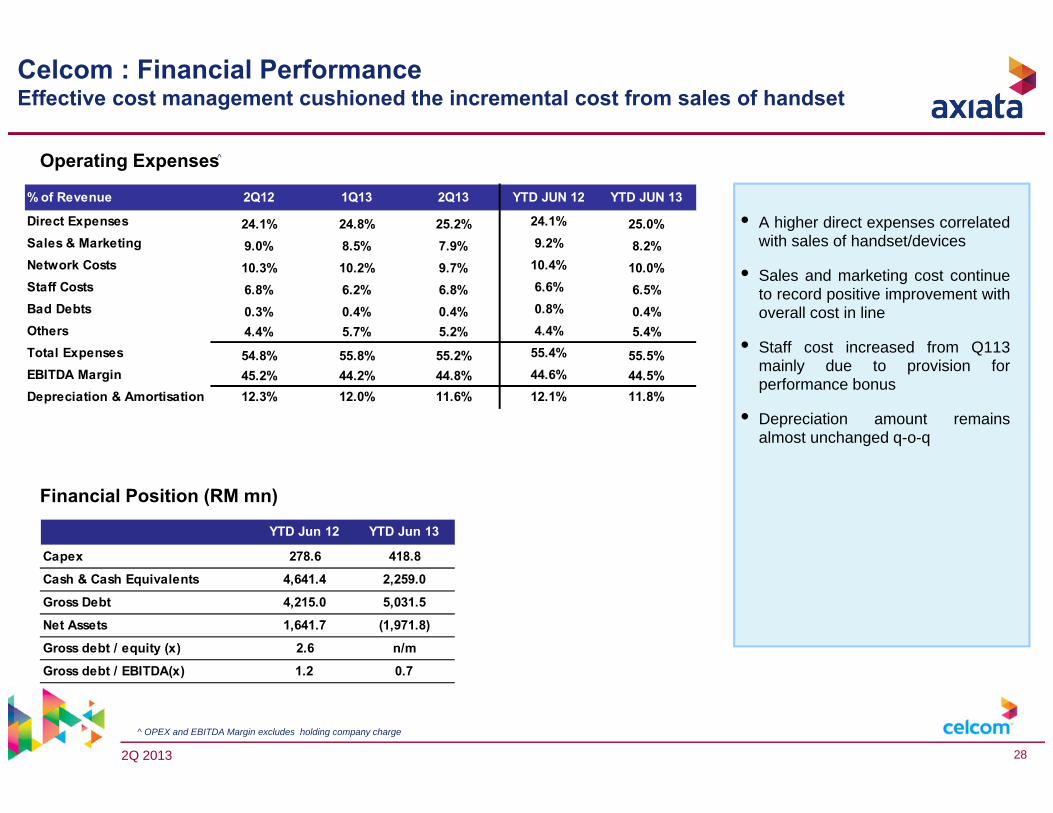
Operating Expenses
Financial Position (RM mn)
^ OPEX and EBITDA Margin excludes holding company charge
Celcom : Financial PerformanceEffective cost management cushioned the incremental cost from sales of handset
^
• A higher direct expenses correlatedwith sales of handset/devices
• Sales and marketing cost continueto record positive improvement withoverall cost in line
• Staff cost increased from Q113mainly due to provision forperformance bonus
• Depreciation amount remainsalmost unchanged q-o-q
YTD Jun 12 YTD Jun 13
Capex 278.6 418.8
Cash & Cash Equivalents 4,641.4 2,259.0
Gross Debt 4,215.0 5,031.5
Net Assets 1,641.7 (1,971.8)
Gross debt / equity (x) 2.6 n/m
Gross debt / EBITDA(x) 1.2 0.7
% of Revenue 2Q12 1Q13 2Q13 YTD JUN 12 YTD JUN 13
Direct Expenses 24.1% 24.8% 25.2% 24.1% 25.0%Sales & Marketing 9.0% 8.5% 7.9% 9.2% 8.2%Network Costs 10.3% 10.2% 9.7% 10.4% 10.0%Staff Costs 6.8% 6.2% 6.8% 6.6% 6.5%Bad Debts 0.3% 0.4% 0.4% 0.8% 0.4%Others 4.4% 5.7% 5.2% 4.4% 5.4%Total Expenses 54.8% 55.8% 55.2% 55.4% 55.5%EBITDA Margin 45.2% 44.2% 44.8% 44.6% 44.5%Depreciation & Amortisation 12.3% 12.0% 11.6% 12.1% 11.8%
2Q 2013 29
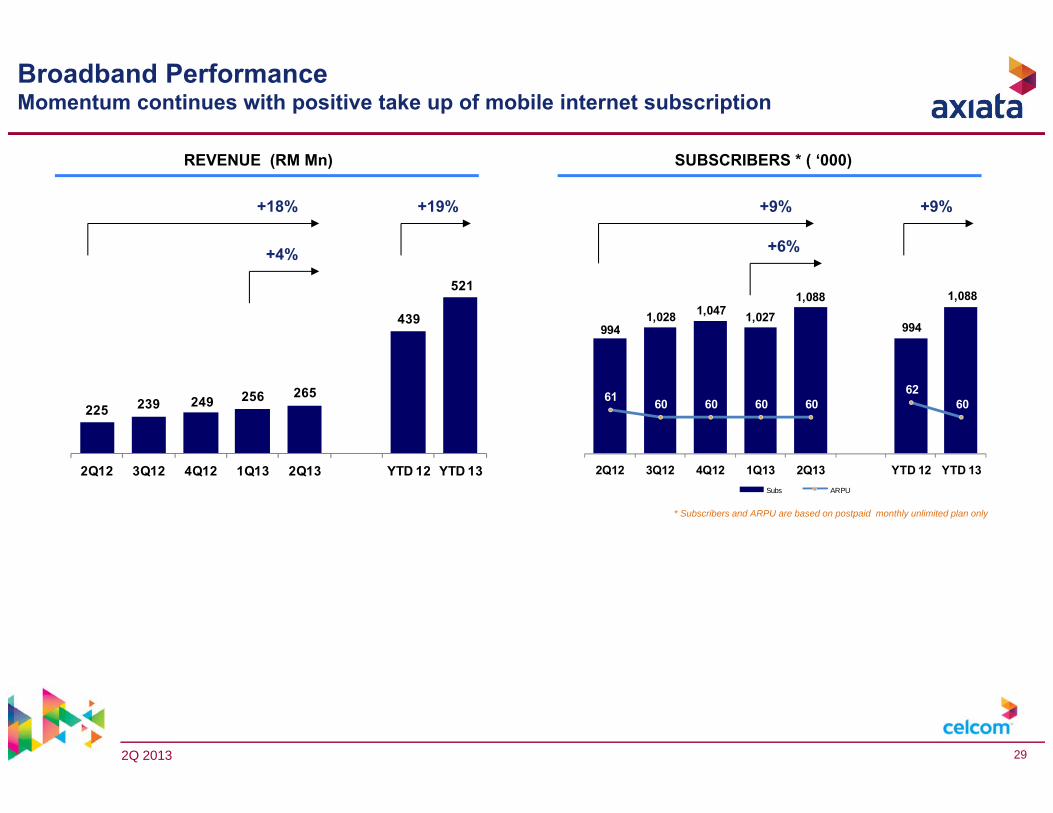
Broadband PerformanceMomentum continues with positive take up of mobile internet subscription
9941,028 1,047 1,027
1,088
994
1,088
61 60 60 60 6062
60
2Q12 3Q12 4Q12 1Q13 2Q13 YTD 12 YTD 13Subs ARPU
225 239 249 256 265
439
521
2Q12 3Q12 4Q12 1Q13 2Q13 YTD 12 YTD 13
REVENUE (RM Mn) SUBSCRIBERS * ( ‘000)
+18% +9%
* Subscribers and ARPU are based on postpaid monthly unlimited plan only
+6%+4%
+19% +9%
2Q 2013 30
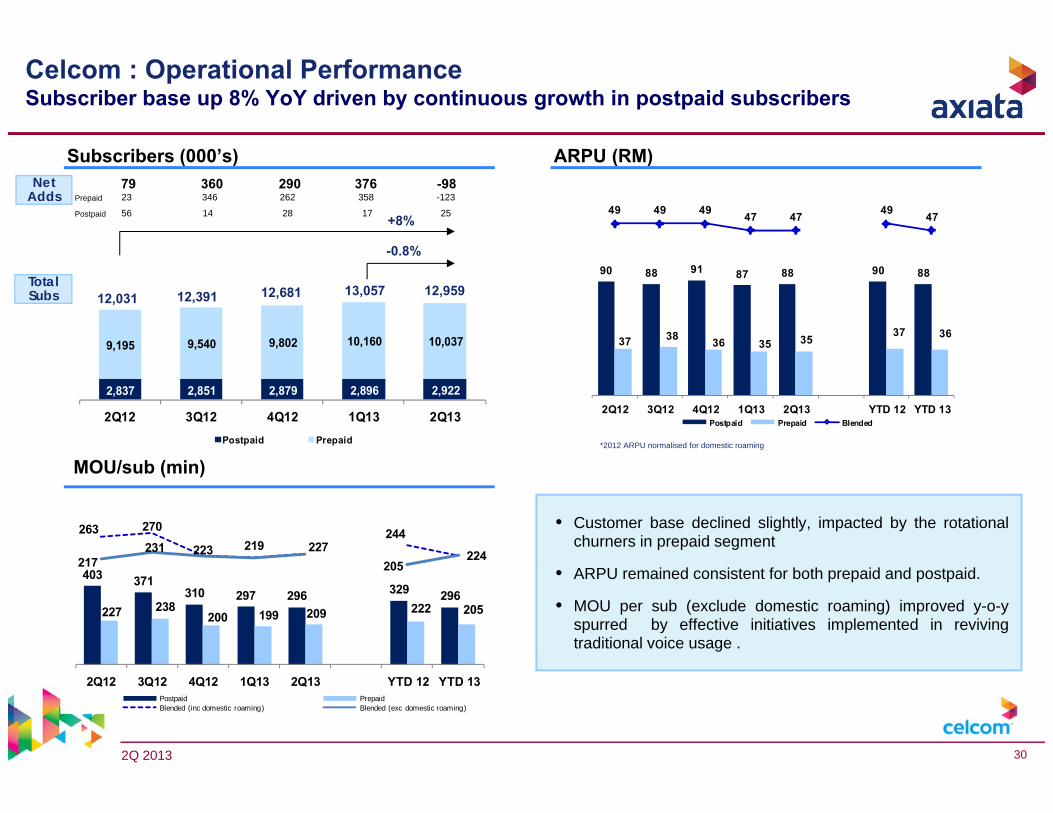
90 88 91 87 88 90 88
37 38 36 35 35 37 36
49 49 49 47 47 49 47
2Q12 3Q12 4Q12 1Q13 2Q13 YTD 12 YTD 13Postpaid Prepaid Blended
2,837 2,851 2,879 2,896 2,922
9,195 9,540 9,802 10,160 10,037
2Q12 3Q12 4Q12 1Q13 2Q13Postpaid Prepaid
Celcom : Operational PerformanceSubscriber base up 8% YoY driven by continuous growth in postpaid subscribers
Subscribers (000’s) ARPU (RM)
• Customer base declined slightly, impacted by the rotationalchurners in prepaid segment
• ARPU remained consistent for both prepaid and postpaid.
• MOU per sub (exclude domestic roaming) improved y-o-yspurred by effective initiatives implemented in revivingtraditional voice usage .
12,95912,391 12,68112,031Total Subs 13,057
-0.8%
Net Adds
+8%
MOU/sub (min)
Prepaid-98-123
25Postpaid
360346
14
290262
28
376358
17
7923
56
403 371310 297 296 329 296
227 238200 199 209 222 205
263 270
223 219 227244
224217231
205
2Q12 3Q12 4Q12 1Q13 2Q13 YTD 12 YTD 13Postpaid PrepaidBlended (inc domestic roaming) Blended (exc domestic roaming)
*2012 ARPU normalised for domestic roaming
2Q 2013 31
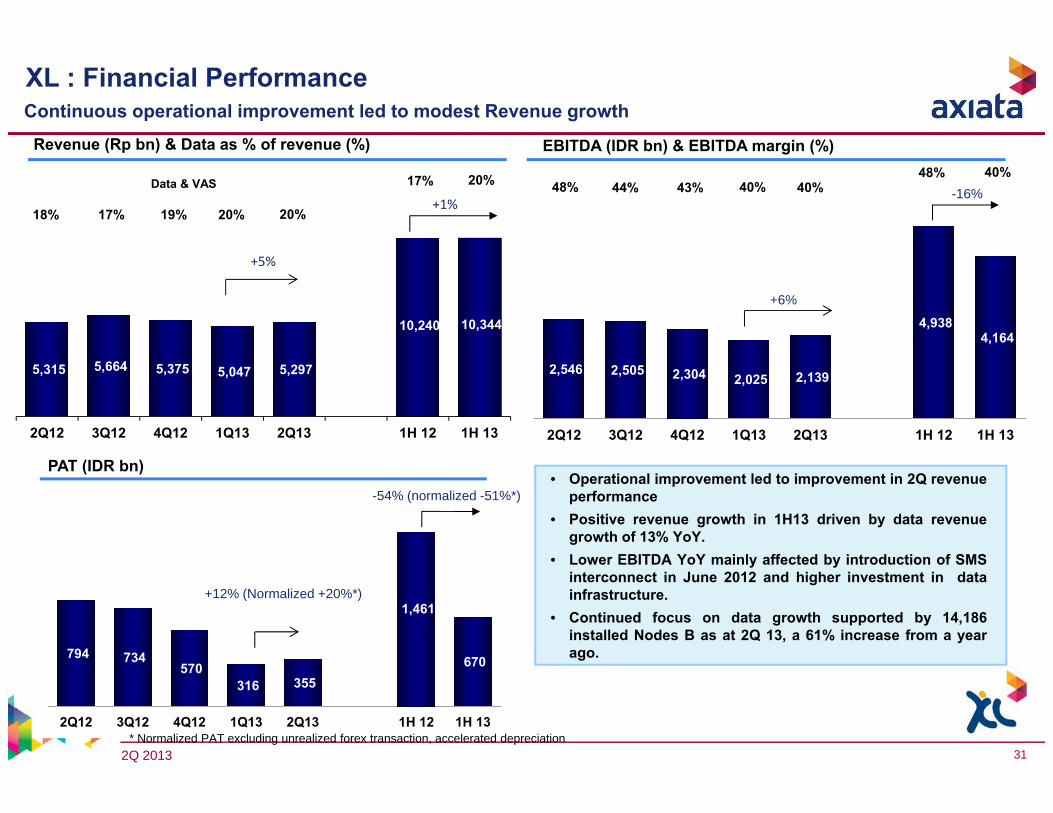
794 734 570
316 355
1,461
670
2Q12 3Q12 4Q12 1Q13 2Q13 1H 12 1H 13
2,546 2,505 2,304 2,025 2,139
4,938 4,164
2Q12 3Q12 4Q12 1Q13 2Q13 1H 12 1H 13
5,315 5,664 5,375 5,047 5,297
10,240 10,344
2Q12 3Q12 4Q12 1Q13 2Q13 1H 12 1H 13
XL : Financial PerformanceContinuous operational improvement led to modest Revenue growth
• Operational improvement led to improvement in 2Q revenueperformance
• Positive revenue growth in 1H13 driven by data revenuegrowth of 13% YoY.
• Lower EBITDA YoY mainly affected by introduction of SMSinterconnect in June 2012 and higher investment in datainfrastructure.
• Continued focus on data growth supported by 14,186installed Nodes B as at 2Q 13, a 61% increase from a yearago.
EBITDA (IDR bn) & EBITDA margin (%)
PAT (IDR bn)
-16%
+12% (Normalized +20%*)
+1%
+6%
+5%
-54% (normalized -51%*)
* Normalized PAT excluding unrealized forex transaction, accelerated depreciation
Revenue (Rp bn) & Data as % of revenue (%)
Data & VAS
20%19%18% 17% 20%
20%17% 43%44%48% 40%40%40%48%
2Q 2013 32
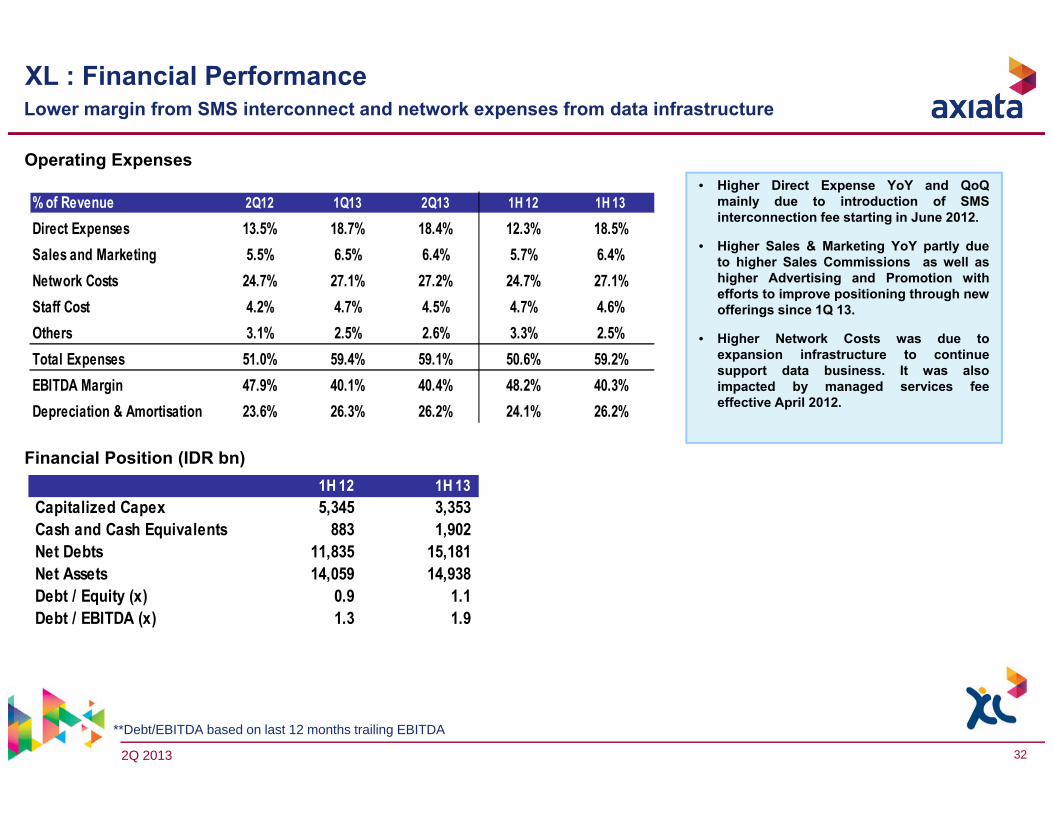
XL : Financial PerformanceLower margin from SMS interconnect and network expenses from data infrastructure
Operating Expenses
Financial Position (IDR bn)
• Higher Direct Expense YoY and QoQmainly due to introduction of SMSinterconnection fee starting in June 2012.
• Higher Sales & Marketing YoY partly dueto higher Sales Commissions as well ashigher Advertising and Promotion withefforts to improve positioning through newofferings since 1Q 13.
• Higher Network Costs was due toexpansion infrastructure to continuesupport data business. It was alsoimpacted by managed services feeeffective April 2012.
**Debt/EBITDA based on last 12 months trailing EBITDA
% of Revenue 2Q12 1Q13 2Q13 1H 12 1H 13
Direct Expenses 13.5% 18.7% 18.4% 12.3% 18.5%Sales and Marketing 5.5% 6.5% 6.4% 5.7% 6.4%Network Costs 24.7% 27.1% 27.2% 24.7% 27.1%Staff Cost 4.2% 4.7% 4.5% 4.7% 4.6%Others 3.1% 2.5% 2.6% 3.3% 2.5%Total Expenses 51.0% 59.4% 59.1% 50.6% 59.2%EBITDA Margin 47.9% 40.1% 40.4% 48.2% 40.3%Depreciation & Amortisation 23.6% 26.3% 26.2% 24.1% 26.2%
1H 12 1H 13Capitalized Capex 5,345 3,353 Cash and Cash Equivalents 883 1,902 Net Debts 11,835 15,181 Net Assets 14,059 14,938 Debt / Equity (x) 0.9 1.1 Debt / EBITDA (x) 1.3 1.9
2Q 2013 33
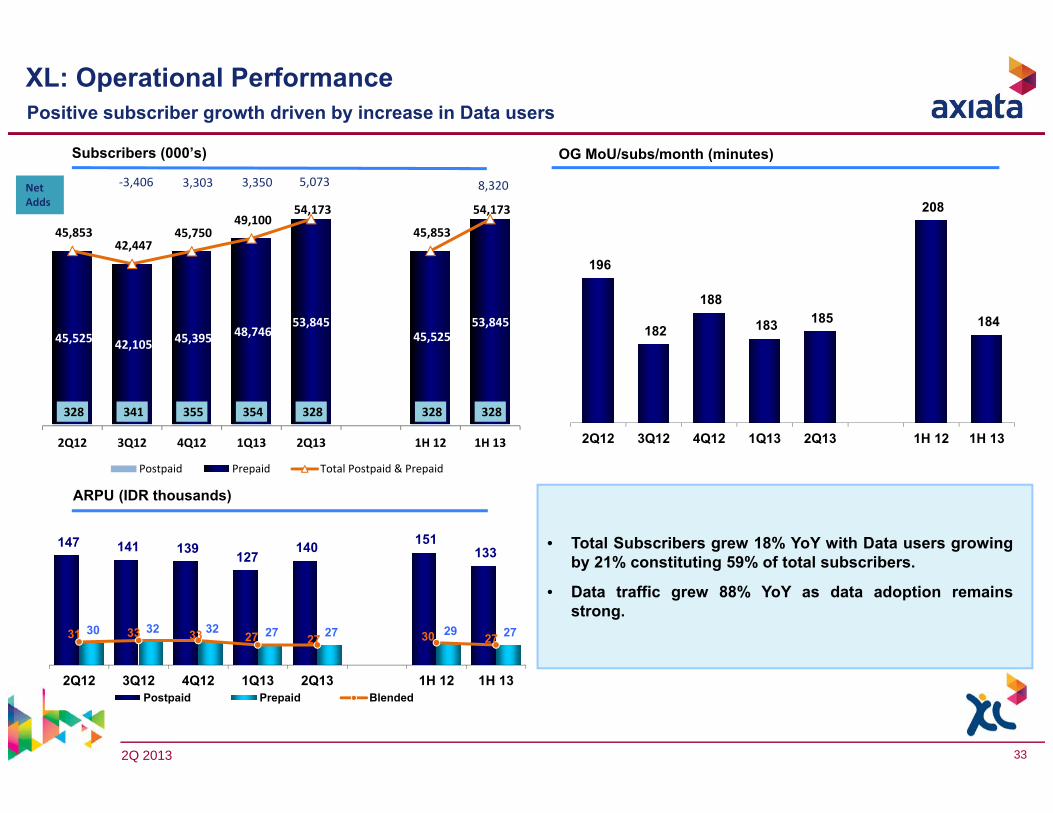
XL: Operational PerformancePositive subscriber growth driven by increase in Data users
Subscribers (000’s)
ARPU (IDR thousands)
OG MoU/subs/month (minutes)
Net Adds
5,0733,303 8,3203,350
196
182
188
183 185
208
184
2Q12 3Q12 4Q12 1Q13 2Q13 1H 12 1H 13
‐3,406
147 141 139 127 140 151
133
30 32 32 27 27 29 27 31 33 33 27 27 30 27
2Q12 3Q12 4Q12 1Q13 2Q13 1H 12 1H 13Postpaid Prepaid Blended
328 341 355 354 328 328 328
45,525 42,105 45,395 48,746 53,845
45,525 53,845
45,853 42,447
45,750 49,100
54,173
45,853
54,173
2Q12 3Q12 4Q12 1Q13 2Q13 1H 12 1H 13
Postpaid Prepaid Total Postpaid & Prepaid
• Total Subscribers grew 18% YoY with Data users growingby 21% constituting 59% of total subscribers.
• Data traffic grew 88% YoY as data adoption remainsstrong.
2Q 2013 34
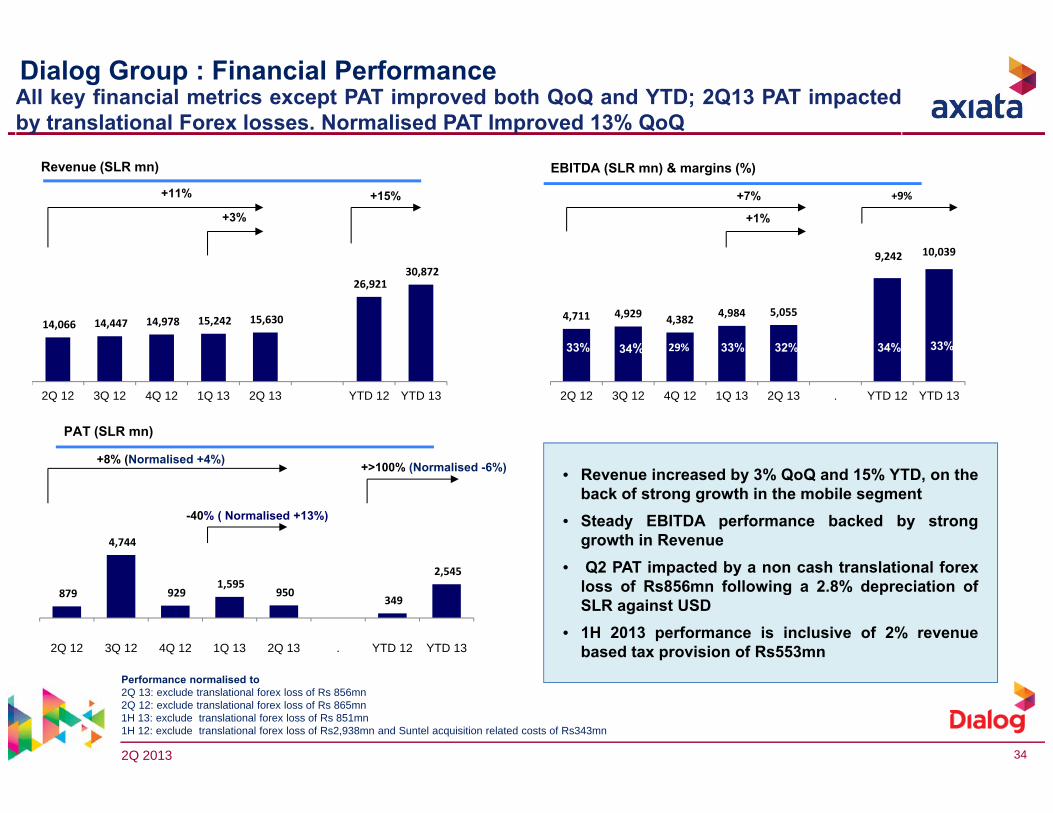
4,711 4,929 4,382 4,984 5,055
9,242 10,039
‐
2,000.00
4,000.00
6,000.00
8,000.00
10,000.00
12,000.00
2Q 12 3Q 12 4Q 12 1Q 13 2Q 13 . YTD 12 YTD 13
34%29%33% 34% 32%33% 33%
All key financial metrics except PAT improved both QoQ and YTD; 2Q13 PAT impactedby translational Forex losses. Normalised PAT Improved 13% QoQ
879
4,744
929 1,595
950 349
2,545
2Q 12 3Q 12 4Q 12 1Q 13 2Q 13 . YTD 12 YTD 13
14,066 14,447 14,978 15,242 15,630
26,921 30,872
2Q 12 3Q 12 4Q 12 1Q 13 2Q 13 YTD 12 YTD 13
EBITDA (SLR mn) & margins (%)
PAT (SLR mn)
Dialog Group : Financial Performance
• Revenue increased by 3% QoQ and 15% YTD, on theback of strong growth in the mobile segment
• Steady EBITDA performance backed by stronggrowth in Revenue
• Q2 PAT impacted by a non cash translational forexloss of Rs856mn following a 2.8% depreciation ofSLR against USD
• 1H 2013 performance is inclusive of 2% revenuebased tax provision of Rs553mn
+1%
+7%
-40% ( Normalised +13%)
+15% +9%
+8% (Normalised +4%) +>100% (Normalised -6%)
Performance normalised to2Q 13: exclude translational forex loss of Rs 856mn2Q 12: exclude translational forex loss of Rs 865mn1H 13: exclude translational forex loss of Rs 851mn 1H 12: exclude translational forex loss of Rs2,938mn and Suntel acquisition related costs of Rs343mn
Revenue (SLR mn)
+3%
+11%
2Q 2013 35
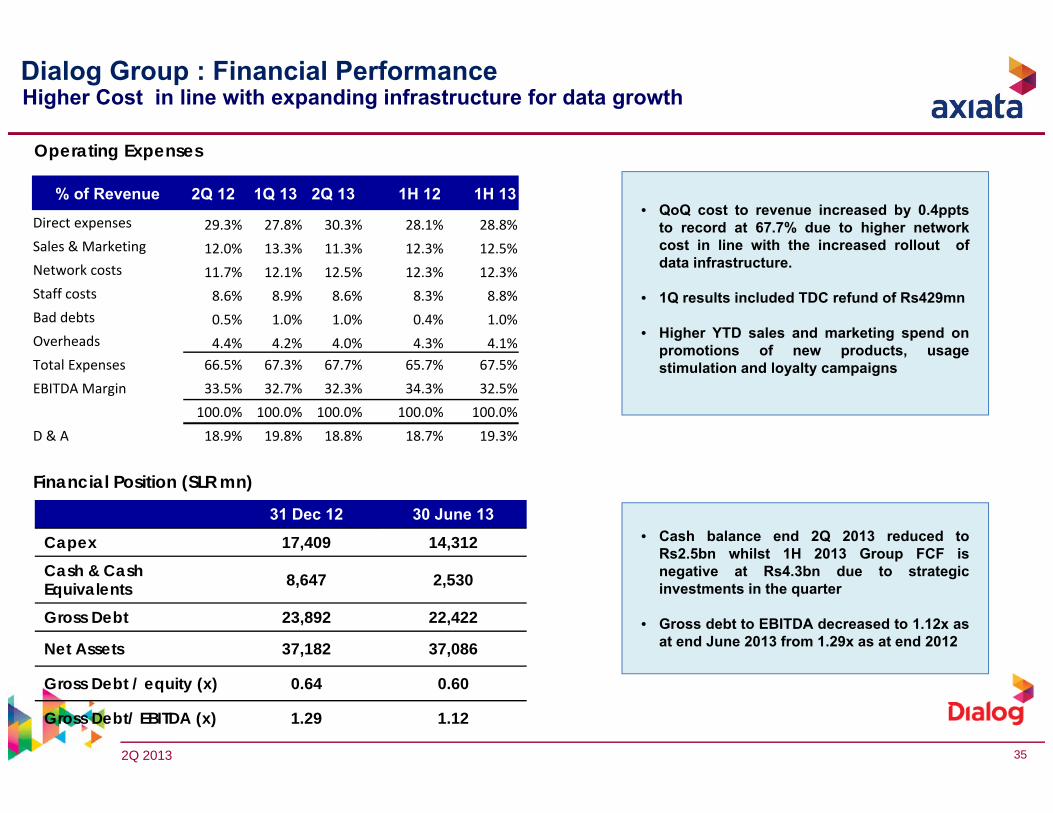
Operating Expenses
Dialog Group : Financial Performance
Financial Position (SLR mn)
Higher Cost in line with expanding infrastructure for data growth
31 Dec 12 30 June 13
Capex 17,409 14,312Cash & Cash Equivalents 8,647 2,530
Gross Debt 23,892 22,422
Net Assets 37,182 37,086
Gross Debt / equity (x) 0.64 0.60
Gross Debt/ EBITDA (x) 1.29 1.12
• QoQ cost to revenue increased by 0.4pptsto record at 67.7% due to higher networkcost in line with the increased rollout ofdata infrastructure.
• 1Q results included TDC refund of Rs429mn
• Higher YTD sales and marketing spend onpromotions of new products, usagestimulation and loyalty campaigns
• Cash balance end 2Q 2013 reduced toRs2.5bn whilst 1H 2013 Group FCF isnegative at Rs4.3bn due to strategicinvestments in the quarter
• Gross debt to EBITDA decreased to 1.12x asat end June 2013 from 1.29x as at end 2012
% of Revenue 2Q 12 1Q 13 2Q 13 1H 12 1H 13
Direct expenses 29.3% 27.8% 30.3% 28.1% 28.8%Sales & Marketing 12.0% 13.3% 11.3% 12.3% 12.5%Network costs 11.7% 12.1% 12.5% 12.3% 12.3%Staff costs 8.6% 8.9% 8.6% 8.3% 8.8%Bad debts 0.5% 1.0% 1.0% 0.4% 1.0%Overheads 4.4% 4.2% 4.0% 4.3% 4.1%Total Expenses 66.5% 67.3% 67.7% 65.7% 67.5%EBITDA Margin 33.5% 32.7% 32.3% 34.3% 32.5%
100.0% 100.0% 100.0% 100.0% 100.0%D & A 18.9% 19.8% 18.8% 18.7% 19.3%
2Q 2013 36
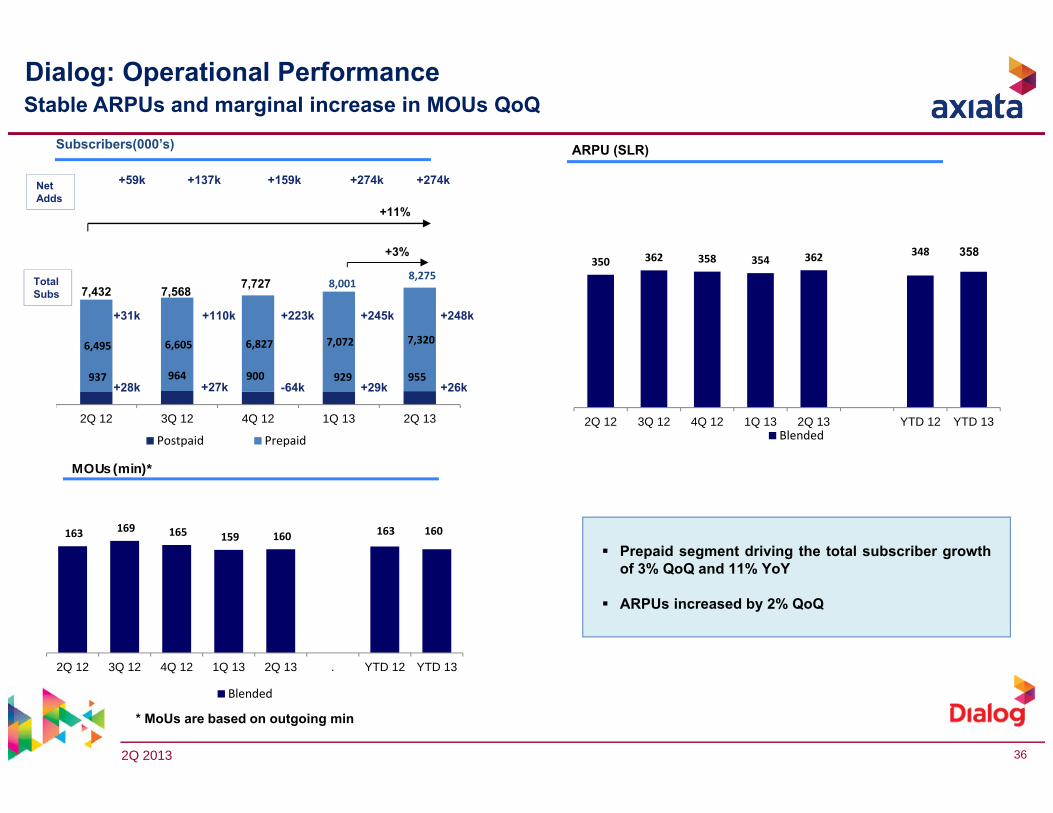
350 362 358 354 362
‐
20
40
60
80
100
120
140
160
180
200
220
240
260
280
300
320
340
360
380
400
2Q 12 3Q 12 4Q 12 1Q 13 2Q 13 YTD 12 YTD 13Blended
358348
163 169 165 159 160
2Q 12 3Q 12 4Q 12 1Q 13 2Q 13 . YTD 12 YTD 13
Blended
163 160
937 964 900 929 955
6,495 6,605 6,827 7,072 7,320
2Q 12 3Q 12 4Q 12 1Q 13 2Q 13
Postpaid Prepaid
7,432 7,568 7,727
Dialog: Operational Performance
Subscribers(000’s)
+3%
+11%
ARPU (SLR)
MOUs (min)*
* MoUs are based on outgoing min
Stable ARPUs and marginal increase in MOUs QoQ
Total Subs
Net Adds
+137k +274k
+29k
+245k
Prepaid segment driving the total subscriber growthof 3% QoQ and 11% YoY
ARPUs increased by 2% QoQ
+31k
+28k
+59k
+110k
+27k
+159k
-64k
+223k
8,001
+274k
+26k
+248k
8,275
2Q 2013 37
259 606 355207
-660
1,249 1,131 1,108
322
2,240
2Q 12 3Q 12 4Q 12 1Q 13 2Q 13 YTD 12 YTD 13
3,756 4,663
4,186 4,306
8,491 3,244 1,938
4,285 4,104 4,219
6,071
8,323
2Q 12 3Q 12 4Q 12 1Q 13 2Q 13 YTD 12 YTD 13
36.4%
9,627 10,146 10,243 10,806 11,594
18,564
22,400
2Q 12 3Q 12 4Q 12 1Q 13 2Q 13 YTD 12 YTD 13
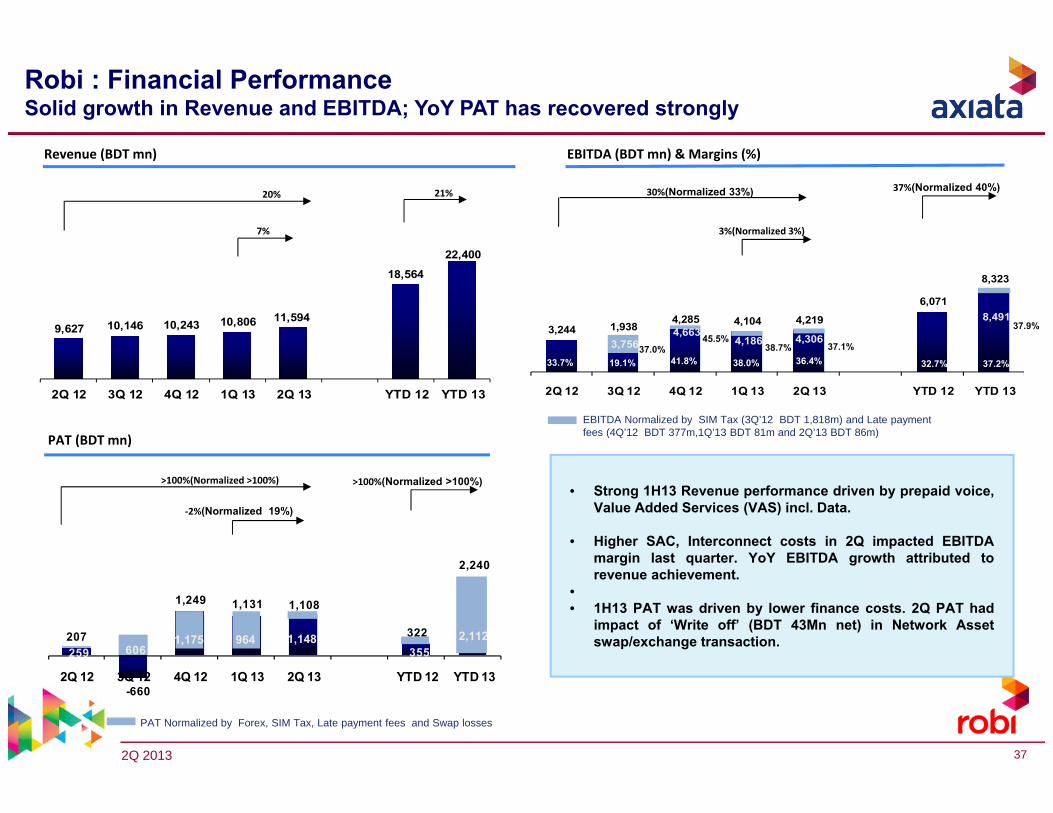
Robi : Financial PerformanceSolid growth in Revenue and EBITDA; YoY PAT has recovered strongly
Revenue (BDT mn) EBITDA (BDT mn) & Margins (%)
PAT (BDT mn)
7%
20%
>100%(Normalized >100%)
‐2%(Normalized 19%)
3%(Normalized 3%)
30%(Normalized 33%)
32.7%
38.0%19.1% 41.8%
37%(Normalized 40%)21%
33.7% 32.7%
>100%(Normalized >100%)
PAT Normalized by Forex, SIM Tax, Late payment fees and Swap losses
• Strong 1H13 Revenue performance driven by prepaid voice,Value Added Services (VAS) incl. Data.
• Higher SAC, Interconnect costs in 2Q impacted EBITDAmargin last quarter. YoY EBITDA growth attributed torevenue achievement.
•• 1H13 PAT was driven by lower finance costs. 2Q PAT had
impact of ‘Write off’ (BDT 43Mn net) in Network Assetswap/exchange transaction.
37.2%37.0%
45.5%38.7% 37.1%
37.9%
EBITDA Normalized by SIM Tax (3Q’12 BDT 1,818m) and Late payment fees (4Q’12 BDT 377m,1Q’13 BDT 81m and 2Q’13 BDT 86m)
1,1481,175 964 2,112
2Q 2013 38
Operating Expenses
Financial Position (BDT mn)
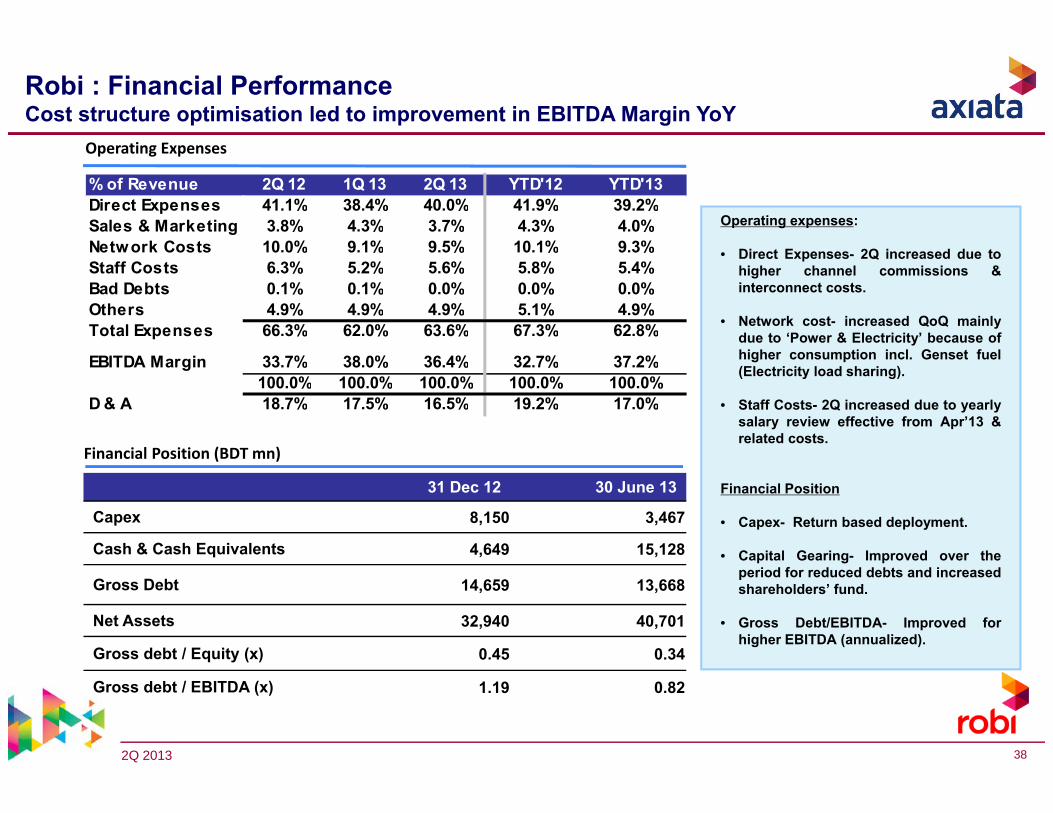
31 Dec 12 30 June 13
Capex 8,150 3,467
Cash & Cash Equivalents 4,649 15,128
Gross Debt 14,659 13,668
Net Assets 32,940 40,701
Gross debt / Equity (x) 0.45 0.34
Gross debt / EBITDA (x) 1.19 0.82
Robi : Financial PerformanceCost structure optimisation led to improvement in EBITDA Margin YoY
Operating expenses:
• Direct Expenses- 2Q increased due tohigher channel commissions &interconnect costs.
• Network cost- increased QoQ mainlydue to ‘Power & Electricity’ because ofhigher consumption incl. Genset fuel(Electricity load sharing).
• Staff Costs- 2Q increased due to yearlysalary review effective from Apr’13 &related costs.
Financial Position
• Capex- Return based deployment.
• Capital Gearing- Improved over theperiod for reduced debts and increasedshareholders’ fund.
• Gross Debt/EBITDA- Improved forhigher EBITDA (annualized).
% of Revenue 2Q 12 1Q 13 2Q 13 YTD'12 YTD'13Direct Expenses 41.1% 38.4% 40.0% 41.9% 39.2%Sales & Marketing 3.8% 4.3% 3.7% 4.3% 4.0%Network Costs 10.0% 9.1% 9.5% 10.1% 9.3%Staff Costs 6.3% 5.2% 5.6% 5.8% 5.4%Bad Debts 0.1% 0.1% 0.0% 0.0% 0.0%Others 4.9% 4.9% 4.9% 5.1% 4.9%Total Expenses 66.3% 62.0% 63.6% 67.3% 62.8%
EBITDA Margin 33.7% 38.0% 36.4% 32.7% 37.2%100.0% 100.0% 100.0% 100.0% 100.0%
D & A 18.7% 17.5% 16.5% 19.2% 17.0%
2Q 2013 39
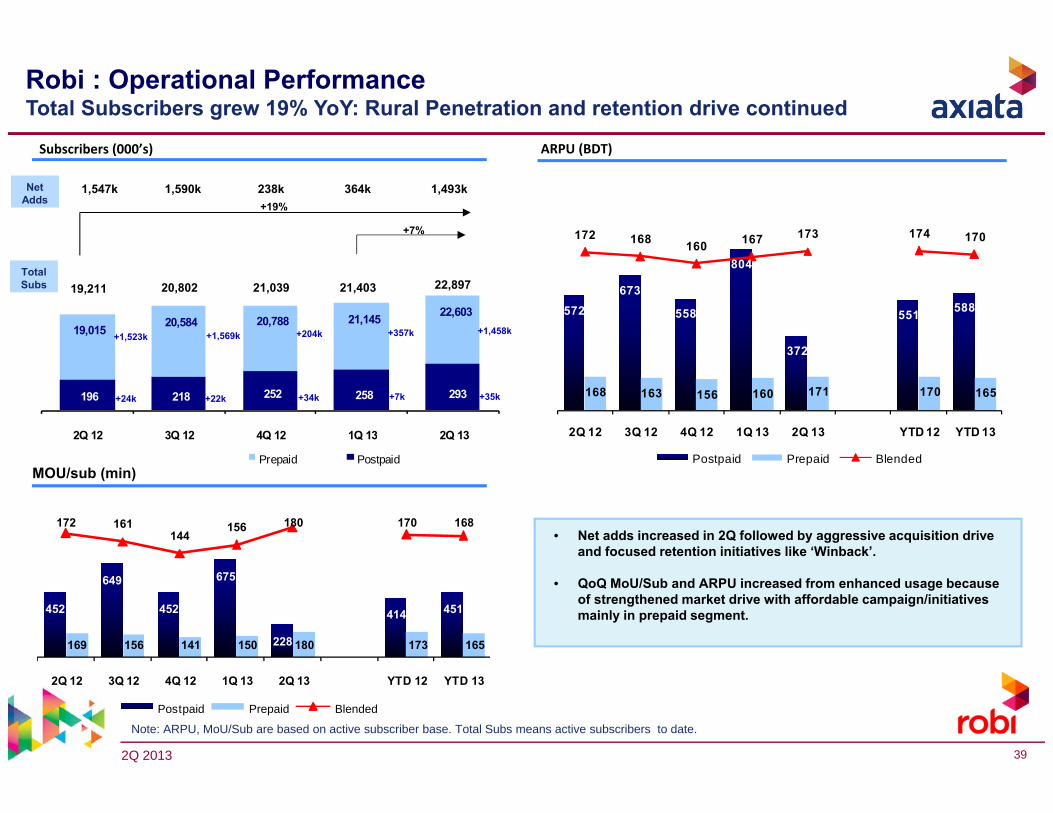
19,015 20,584 20,788 21,145 22,603
196 218 252 258 293
2Q 12 3Q 12 4Q 12 1Q 13 2Q 13
Prepaid Postpaid
1,547k 1,590k 238k 364k 1,493k
ARPU (BDT)
MOU/sub (min)
Robi : Operational PerformanceTotal Subscribers grew 19% YoY: Rural Penetration and retention drive continued
+19%
Subscribers (000’s)
+7%
+357k+204k
+34k +7k
Net Adds
TotalSubs
+1,523k
+24k
Note: ARPU, MoU/Sub are based on active subscriber base. Total Subs means active subscribers to date.
• Net adds increased in 2Q followed by aggressive acquisition drive and focused retention initiatives like ‘Winback’.
• QoQ MoU/Sub and ARPU increased from enhanced usage because of strengthened market drive with affordable campaign/initiatives mainly in prepaid segment.
+22k
+1,569k
572673
558
804
372
551 588
168 163 156 160 171 170 165
172 168 160 167 173 174 170
2Q 12 3Q 12 4Q 12 1Q 13 2Q 13 YTD 12 YTD 13
Postpaid Prepaid Blended
452
649
452
675
228
414 451
169 156 141 150 180 173 165
172 161144
156 180 170 168
2Q 12 3Q 12 4Q 12 1Q 13 2Q 13 YTD 12 YTD 13
Postpaid Prepaid Blended
+1,458k
+35k
19,211 20,802 21,039 21,403 22,897
2Q 2013 40
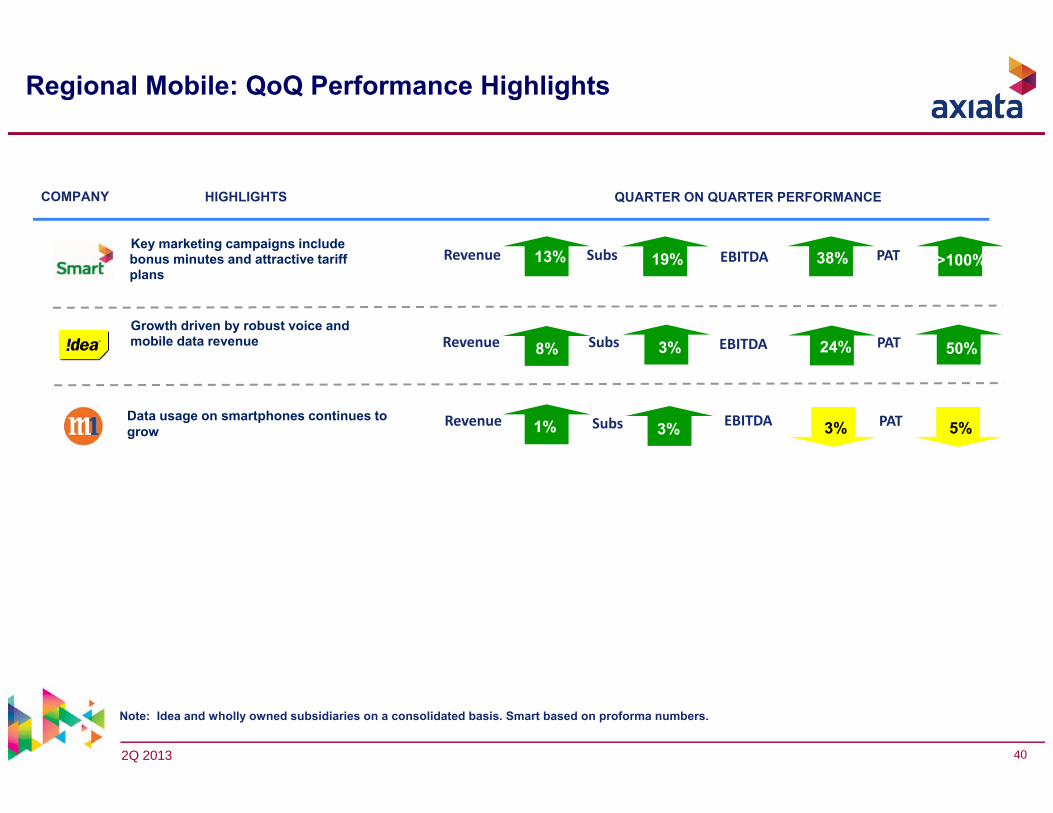
HIGHLIGHTSCOMPANY
Regional Mobile: QoQ Performance Highlights
Data usage on smartphones continues to grow
Revenue EBITDA PAT
EBITDARevenue Subs PAT8%
QUARTER ON QUARTER PERFORMANCE
Note: Idea and wholly owned subsidiaries on a consolidated basis. Smart based on proforma numbers.
24%
Subs
Growth driven by robust voice and mobile data revenue
1% 3%
EBITDARevenue Subs PAT38% >100%13% 19%
50%3%
Key marketing campaigns include bonus minutes and attractive tariff plans
5%3%
2Q 2013 41
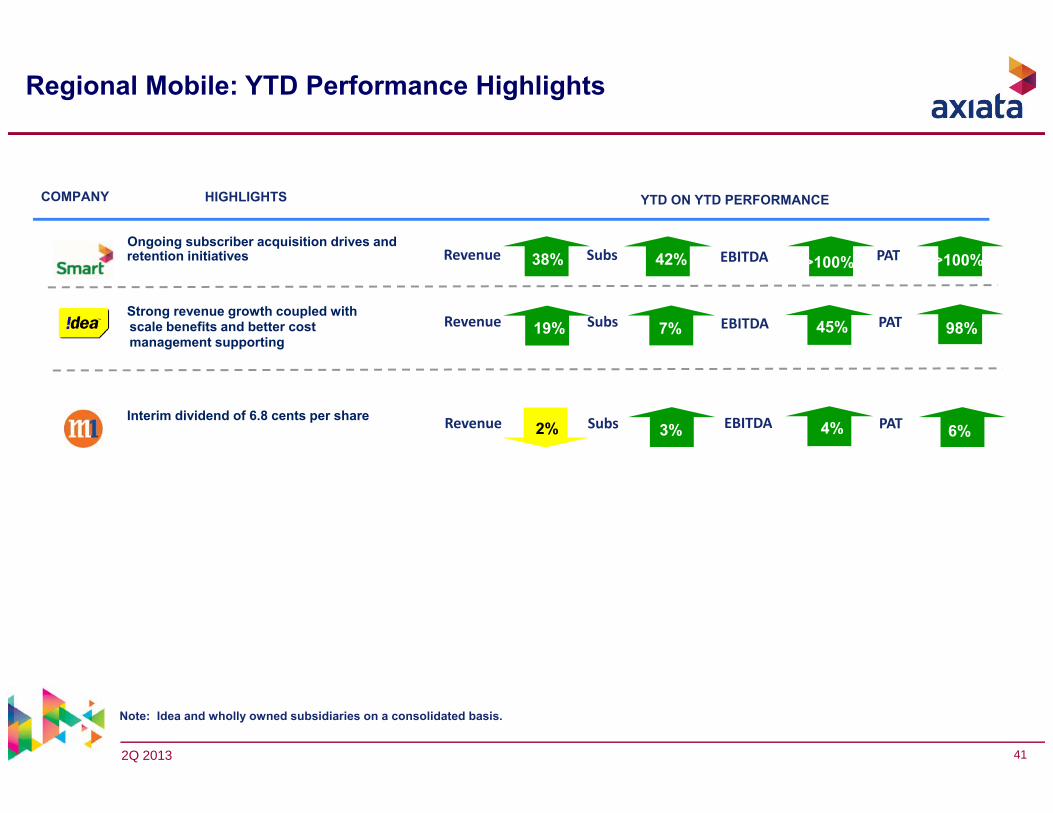
HIGHLIGHTSCOMPANY
Regional Mobile: YTD Performance Highlights
Interim dividend of 6.8 cents per share Revenue Subs EBITDA PAT
EBITDA7%Revenue Subs PAT19%
YTD ON YTD PERFORMANCE
45%
Note: Idea and wholly owned subsidiaries on a consolidated basis.
98%
3%1%
Strong revenue growth coupled with scale benefits and better cost management supporting
2% 4% 6%
EBITDARevenue Subs PAT >100%38% 42% >100%Ongoing subscriber acquisition drives and retention initiatives
company confidential42
Thank You
www.axiata.com
Axiata Group Berhad


![PowerPoint 프레젠테이션 · 2019-08-09 · 4 1. 2019년2분기경영실적 2q 2018 2q 2019 증감 1h 2018 1h 2019 증감 매출액 4,413 4,456 1.0% 8,747 8,903 1.8% [총매출액]](https://img.pdfslide.us/doc/110x75/5ecc81b1c487e33d9409992a/powerpoint-eoe-2019-08-09-4-1-2019e2eee-2q-2018.jpg)


![Konica Minolta Group€¦ · 2Q/March 2014 financial results highlight - Overview [Billions of yen] 1H 1H 2Q 2Q Mar 2014 Mar 2013 YoY Mar 2014 Mar 2013 QoQ Net sales (a) 450.5](https://img.pdfslide.us/doc/110x75/601d42db77ec0143f53c282a/konica-minolta-group-2qmarch-2014-financial-results-highlight-overview-billions.jpg)