Embed Size (px)
Citation preview

1 9 9 9 A n n u a l R e p o r t
TABLE OF CONTENTS
1 LETTER TO SHAREHOLDERS
ANNUAL REPORT ON FORM 10K—CENTER INSERT
5 F INANCIAL HIGHLIGHTS
6 DIRECTORS & CORPORATE OFF ICERS
7 OTHER CORPORATE INFORMATION
8 EXIST ING L INE OF BUSINESS STRUCTURE
1 9 9 9 M O D I S P R O F E S S I O N A L S E R V I C E S A N N U A L R E P O R T Page 1
LETTER TO SHAREHOLDERS
The combined value of our company’s divisions operating as two independent, publicly traded businesses, should
exceed the value of the entire current organization if our services and employees are optimally positioned. All of these
elements are in place as Modis Professional Services, Inc. prepares to split into two separate, highly distinct, public
companies: one concentrating on Information Technology (IT), and the other on Professional Services.
Later this year, Modis Professional Services, Inc. plans to spin off our information technology division, modis, Inc. and
its subsidiaries, into a pure-play, separately traded IT company. The spin-off will be accomplished as soon as practicable,
subject to market and other conditions, including regulatory approvals, tax clearances and final board authorization.
After the spin-off, each shareholder will have his or her same ownership interest in both the new IT company, which
will retain the modis name, and the remaining Professional Services company, which will operate under a new identity.
We are making this move to bring even greater focus and enhanced execution to our strategic business plan and oper-
ating units, maximize our strengths in the marketplace and set the pace for long-term, sustainable growth. Our new
organizational structure should benefit each of our valued stakeholders: our shareholders, clients, and employees.
For our shareholders, increased focus arising from the new organizational structure should enable each company to
improve its agility, growth, and earnings potential. This, in turn, should result in a greater clarity of ownership, and
a better understanding of the types of businesses within each group. The new structure should also offer a better
allocation of capital and more appropriate acquisition currency.
For the clients of each company, the new structure should present a more effective delivery model for the
Information Technology and Professional Services businesses. Each company will continue to offer its customized
services through specialized brands in their respective business disciplines.
The new operating structure will also provide additional exciting career opportunities to the employees of each company,
as the further differentiated, highly focused businesses become even more attractive to potential employees in this tight
labor market.
modis, Inc. (IT), which had $1.35 billion in revenue in 1999, will be treated as a discontinued operation by Modis
Professional Services due to its pending spin-off. modis, Inc. or its successor entity will trade on a major, national
exchange (e.g. Nasdaq, NYSE) following the spin-off.
In addition to the spin-off of modis, Inc., the Board of Directors has authorized management to continue to explore
the opportunity for an initial public offering for modis’ Idea Integration e-business solutions unit. This unit, which
generated approximately $190 million in revenue in 1999, offers end-to-end e-business solutions.
The Professional Services Division, which had $592 million in revenue in 1999, will continue to trade on the New
York Stock Exchange, but will receive a new name and a new trading symbol. The Professional Services Division
consists of separately branded human resource and project-specific solution providers in five principal areas: accounting
and finance (which operates primarily under the Accounting Principals and Management Principals brand names in
the United States and under the Badenoch & Clark brand name throughout the United Kingdom); legal (Special
Counsel); technical and engineering (ENTEGEE); scientific (Scientific Staffing); and career management, consulting
and retained search (Manchester, Inc. and Diversified Search).

Page 2 M O D I S P R O F E S S I O N A L S E R V I C E S A N N U A L R E P O R T 1 9 9 9
OPERATING HIGHLIGHTS*
• Our 1999 financial performance reflects our continued emphasis on revenue growth and profitability. These results
reflect both continued and discontinued operations.
• For the year ended December 31, 1999, pro forma revenue totaled $1.94 billion, an increase of 14% over pro
forma revenue of $1.70 billion in the prior-year period.
• 1999 net income per diluted common share was $1.00 per share, including $0.15 per share for the sale of the
discontinued Strategix commercial staffing division. This compares with diluted net income per common share
of $2.79 for the prior year, which includes $2.18 related to the gain on the sale and operations of the discontin-
ued Strategix division and an extraordinary item.
• modis, Inc. successfully navigated through the challenging “lockdown” effect that Y2K preparation had on its
customers’ spending habits in 1999. modis fared better than many IT services providers, which we believe is
strong evidence of the underlying strength of that organization, the diversity in its businesses, and the focused
transition that has taken place in building a consultant base with strong Internet and e-business skills. modis has
offices in 120 markets worldwide and serves over 2,000 clients.
• Each Professional Services Division business experienced productivity gains in 1999, while improving overall operating
performance. The division’s positive performance demonstrates the commitment of all operating teams to leverage
existing resources while servicing the needs of clients, consultants, and employees. The division has approximately
9,800 professional consultants and about 150 offices throughout the United States and the United Kingdom.
modis DEVELOPMENTS
modis, Inc. has launched several initiatives to strengthen its positions in the e-business solutions and business-to-business
(B2B) procurement solutions markets.
BEELINE.COM
In December, modis initiated an industry-first comprehensive e-procurement solution called Beeline.com, which
lowers costs and leverages the power of the Internet. Offered in partnership with Commerce One (Nasdaq:CMRC),
the global leader in B2B electronic commerce, Beeline.com’s unique applications allow customers to purchase
information technology consulting resources, as well as many other types of goods and services, across a global
Internet trading network.
Beeline.com offers three integrated IT Procurement modules designed to streamline purchasing procedures and reduce
costs to its participants. The first module, Beeline IT Procurement (ITP), is an Internet-based procurement and
workflow application that automates the identification, selection, screening, and purchasing of IT consulting resources.
Beeline ITP also operates as an IT vendor management tool providing the technology which allows customers to set
up and manage an IT services tracking exchange. Beeline ITP is complemented by the modis network of value-added
recruiters and customer service professionals who insure quality and consultant “fit.”
A second module, Beeline Career Xchange, enables consultants who register to receive advanced technical training,
access to research, career mentoring, and other benefits. Registered consultants will have their skills marketed confi-
dentially to Fortune 1000 companies by more than 1,000 modis industry specialists.
1 9 9 9 M O D I S P R O F E S S I O N A L S E R V I C E S A N N U A L R E P O R T Page 3
A third module is Beeline TPS (Total Procurement Solution), which provides electronic aggregation of the catalog
content of suppliers, allowing companies to purchase virtually any type of good or service via an easy-to-use Internet
browser application. Beeline TPS provides all the functionality of the Commerce One BuySite™ application and
executes transactions through the Commerce One MarketSite™.
IDEA INTEGRATION
In January 2000, modis announced a new brand identity and company name for its e-business solutions unit — Idea
Integration. Idea Integration offers end-to-end e-business solutions encompassing e-commerce transformation, Business
Intelligence, Knowledge Management, Customer Relationship Management (CRM), Strategy and Management
Consulting, and Enterprise Application Integration (EAI).
The new brand builds on the company’s past use of the word “idea” in describing its e-business service offerings. The
new brand is a reference for the need to integrate e-business ideas and business models into the information technology
systems and business processes of the existing IT enterprise. The strategy is designed to enhance market awareness of
the Idea Integration solutions capabilities, help attract new consultants and clients, and better differentiate Idea
Integration from other business units within modis.
Adding support to the success of the Idea Integration branding is the Web site address we have secured: Idea.com.
This URL will make it easier for businesses and consultants to remember the site and will aid in the brand awareness
campaign being launched to drive traffic to it. The campaign is using the theme, “Business and technology converge
on the Web…at Idea.com.”
AWARD WINNING GROWTH
In December, Sm@rt Reseller magazine ranked modis No. 4 on a prestigious list of Smart 50 e-business companies.
The list, which the magazine said comprises “the real movers and shakers in the e-business revolution,” included
other e-business companies such as Sapient, Razorfish, and Whittman-Hart. Contributing to the distinguished ranking
were modis’ growth over the past three years and its ratio of revenue to employees.
The outlook for modis is very promising, considering these e-business initiatives and the improving post-Y2K
demand for information technology services. Propelled by Idea Integration’s e-business solutions and Beeline.com’s
e-procurement services, we expect to capture the enhanced growth predicted for the IT sector during the second half
of this year and into the future.
PROFESSIONAL SERVICES DEVELOPMENTS
During 1999, management of the Professional Services Division focused on improving market share, increasing
employee productivity, and improving integration efforts. The result of these focused initiatives was expected to
improve the overall results of the Professional Services Division.
We are pleased to report that the activities supporting these focused efforts have led to the improved overall perform-
ance of the division and has positioned it to become a professional service and sector-focused company as the new
organizational structure takes effect in 2000. While the total operating results improved in terms of revenue and
operating income growth (without regard to non-recurring items), we were most pleased with the efforts made by each
business unit to position itself in the marketplace to compete effectively with its local, national, and international
competitors.
Page 4 M O D I S P R O F E S S I O N A L S E R V I C E S A N N U A L R E P O R T 1 9 9 9
Fueling the division’s overall success is the continued growth in the outsourcing industry for companies, large and
small, continuing to seek variable cost effective alternatives to their project and skill-specific needs. In addition,
lifestyle changes by professionals who prefer alternative work arrangements rather than traditional employment have
increased the available supply of professionals to deliver our clients’ project and skill-specific needs.
Specifically, during the year, each business unit initiated activities to support the focused objectives of the division. As
improving market share is a key objective for each business, progress has been made to position them to better service
the needs of their clients by empowering management to make better and more timely decisions for each market to
support the client and candidate growth efforts. While client development is a key to the success of the Professional
Services Division, we also are focused on improving the professional development and growth of our employees and
candidates. We invested in several programs during the year supporting this effort and plan to focus more attention
on this initiative in 2000.
Additionally, our brand development and marketing efforts took shape in 1999, with several public relations wins
during the year as supported by research data made available to our clients, as well as national and trade publications.
We were also successful in revitalizing our collateral material in many of our business units in 1999, further distin-
guishing each business unit from its competitors.
Other activities to support professional development and motivational performance for our teams included several
award and recognition programs for several of the business units. The most notable program was the President’s Club,
which was formed to recognize and reward top performers in the business units to share their successes with others as
we build momentum into 2000.
All these activities and many more have led the division to achieve much success in 1999 with the anticipation for
this to continue into the future.
CONCLUSION
The result of all of our actions will be two companies ideally positioned for their marketplaces: a new, pure-play,
separately traded IT services company armed with our e-procurement solution, Beeline.com and our e-business
solutions unit, Idea Integration, and an independent, reorganized and renamed professional services company. The
businesses will be optimally structured to deliver the highest quality services to their clients, build teamwork and
career development for their people, and provide the best return on investment to their shareholders.
Sincerely,
Derek E. Dewan
Chairman of the Board, President, and Chief Executive Officer
*Pro forma results reflect the combined results of the Professional Services Division and the discontinued Information Technology Division.
SECURITIES AND EXCHANGE COMMISSIONWASHINGTON, D.C. 20549
FORM 10-K� Annual report pursuant to Section 13 or 15(d) of the Securities Exchange Act of
1934 for the fiscal year ended December 31, 1999
COMMISSION FILE NUMBER: 0-24484
MODIS PROFESSIONAL SERVICES, INC.(Exact name of registrant as specified in its charter)
Florida(State or other jurisdiction of incorporation or organization)
59-3116655(I.R.S. Employer Identification No.)
1 Independent Drive, Jacksonville, FL(Address of principal executive offices)
32202(Zip Code)
(Registrant’s telephone number including area code): (904) 360-2000
Securities registered pursuant to Section 12(b) of the Act:
Common Stock, Par Value $0.01 Per Share(Title of each class)
New York Stock Exchange(Name of each exchange on which registered)
Indicate by check mark whether the registrant (1) has filed all reports required to be filed by Section 13 or15(d) of the Securities Exchange Act of 1934 during the preceding 12 months (or for such shorter period thatthe registrant was required to file such reports), and (2) has been subject to such filing requirements for the past90 days. Yes � No □
Indicate by check mark if disclosure of delinquent filers pursuant to Item 405 of Regulation S-K is notcontained herein, and will not be contained, to the best of registrant’s knowledge, in definitive proxy orinformation statements incorporated by reference in Part III of this Form 10-K or any amendment to this Form10-K. □
The aggregate market value of the voting stock held by non-affiliates of the Registrant (assuming for thesepurposes, but not conceding, that all executive officers and directors are ‘‘affiliates’’ of the Registrant), basedupon the closing sale price of common stock on March 15, 2000 as reported by the New York Stock Exchange,was approximately $1,403,782,623.
As of March 15, 2000, the number of shares outstanding of the Registrant’s common stock was96,397,090.
DOCUMENTS INCORPORATED BY REFERENCE. Portions of the Registrant’s ProxyStatement for its 2000 Annual Meeting of shareholders are incorporated by reference in Part III.
FORWARD LOOKING STATEMENTS
This Annual Report on Form 10-K contains forward-looking statements that are subject to certain risks,uncertainties or assumptions and may be affected by certain other factors, including but not limited to thespecific factors discussed in Part I, Item 1 under ‘‘Business—Introduction and Recent Events’’, Part II, Item 5under ‘‘Market for Registrant’s Common Equity and Related Shareholder Matters’’ and in Part II under‘‘Liquidity and Capital Resources’’, ‘‘Other Matters—Year 2000 Compliance’’ and ‘‘Factors Which MayImpact Future Results and Financial Condition’’. In addition, except for historical facts, all informationprovided in Part II under ‘‘Quantitative and Qualitative Disclosures About Market Risk’’ should be consideredforward-looking statements. Should one or more of these risks, uncertainties or other factors materialize, orshould underlying assumptions prove incorrect, actual results, performance or achievements of the Companymay vary materially from any future results, performance or achievements expressed or implied by suchforward-looking statements.
Forward-looking statements are based on beliefs and assumptions of the Company’s management and oninformation currently available to such management. Forward looking statements speak only as of the date theyare made, and the Company undertakes no obligation to update publicly any of them in light of newinformation or future events. Undue reliance should not be placed on such forward-looking statements, whichare based on current expectations. Forward-looking statements are not guarantees of performance.
2
PART I
ITEM 1. BUSINESSGENERAL
Introduction and Recent Events
Modis Professional Services, Inc. (‘‘MPS’’ or the ‘‘Company’’) is an international provider ofprofessional business services, including consulting, outsourcing, training and strategic human resourcesolutions, to Fortune 1000 and other leading businesses. Historically, the Company’s services have beenprovided through its two business divisions: (i) Information Technology, which provides technology consulting,outsourcing and solutions services, and (ii) Professional Services, which provides personnel who performspecialized services such as accounting, legal, technical/engineering, scientific, and career management andconsulting.
On December 15, 1999, the Company’s Board of Directors approved a plan to split the Company into twoindependent companies with the Company continuing to operate the Professional Services business and todistribute to the stockholders of the Company all of the outstanding stock of the Information Technologydivision. The creation of two independent companies will enable management of each company to devote thetime and attention to the different needs of each business and to sharpen its focus on the core strategies of eachbusiness. The distribution is subject to market and other conditions, including regulatory approvals and taxclearances. The Company has requested that the Internal Revenue Service issue a ruling that the distributionwill be tax free to the Company and to its stockholders. This ruling, and the distribution, are expected to occurduring 2000.
Unless otherwise noted, the discussion of the Company’s business set forth below relates to theProfessional Services business and does not include information concerning the Information Technologybusiness. Information concerning the Information Technology division is included in Item 7, Management’sDiscussion of Financial Condition and Results of Operations,‘‘Results of discontinued operations’’.
Discussion of the Business
Headquartered in Jacksonville, Florida, the Company has approximately 150 offices throughout the UnitedStates and the United Kingdom. MPS’ objective is to concentrate its efforts and resources on profitable, high-growth, high-end professional services that have the ability to consistently generate strong earnings. TheCompany has experienced substantial growth in revenue and earnings driven primarily by (i) increased businesswith the Company’s existing clients; (ii) increased penetration of existing and new markets; (iii) trends towardthe increased outsourcing of non-core competency professional business services; and (iv) acquisitions of otherprofessional services companies.
Business Strategy
MPS seeks to expand its revenues and profitability by offering an extensive range of specialized humanresource and consulting services through a global network of branch offices. The Company markets anddelivers its services with an emphasis on local entrepreneurial spirit and decision-making at the branch levelcombined with strong corporate, technological and managerial support. The Company seeks to provideinnovative and customized solutions to human resource needs and to expand the Company’s relationships withits clients. MPS’ mission is to set the standard for the professional business services industry by empoweringits employees to provide quality services. Management believes the Company’s concentration on professionalservices allows faster growth and higher profit margins versus the more traditional commercial staffingbusinesses due to the specialized expertise of professional personnel. MPS’ principal competitors in theprofessional services areas generally consist of specialty firms in each of those fields, and to a lesser extent,diversified business services firms. The Company’s strategy is to continue to increase the overall revenue andgross profits by expanding current specialties into new geographic markets, identifying and adding new practiceareas, and leveraging wherever possible on existing specialty strengths.
3
GROWTH STRATEGY
The Company pursues a focused growth strategy designed to achieve both increased revenues andearnings. The key elements of this growth strategy are as follows:
Internal Growth
The Company’s internal growth strategy includes: (i) positioning in market locations, customer segmentsand skill areas that value high levels of service; (ii) increasing penetration of existing markets; (iii) expandinginto new and contiguous markets; and (iv) migrating to higher margin specialty practice areas. Several of themore distinguishing ways to facilitate the aforementioned internal growth strategies are as follows:
Staff Augmentation. Each business unit provides variable workforce solutions by providing intellectualcapital to meet the changing needs of clients. By establishing new relationships, forming strategic alliances andcontinually improving current client and consultant relationships, management believes the traditional staffaugmentation will continually be an integral component to its service mix.
Specialized Staffing and Specialty Solution Opportunities. Many of the Company’s offices providespecialty solutions and staffing to its corporate clients beyond the traditional professional staff augmentation.Management believes it can leverage these practice specialties and client relationships within each business unitby offering specialized services and solutions to other existing and prospective clients. Examples includedocument and trial management services, leadership development, executive coaching and specializedcomputer-aided design services.
Professional Development Opportunities. Enhancing the knowledge and skills of the consultants andemployees of the Company based on the needs of our clients will strengthen our overall relationship withclients, consultants, and employees. Generally, these strategies are intended to better serve our clients andstrengthen our professionalism throughout each business unit. Management believes this will improve overallclient relationships and profitability and improve consultant and employee retention.
Acquisitions
The Company’s growth strategy includes the acquisition of existing businesses with complementaryservice offerings, strong management, profitable operating results and recognized local and regional presence.The Company has acquired 13 professional services companies since 1996. Acquisition criteria considered bymanagement includes, among other things, financial performance, a desirable market location, significantmarket share, new or expanded specialties that can be added to the Company’s existing lines of business,efficient operating systems and existing management that will operate effectively within the Company’sexisting managerial structure. The Company believes that there is an opportunity, as a part of the consolidationin the global business services industry, to focus on acquisitions of companies that offer specializedprofessional services. The Company’s management has had success in identifying acquisition candidates thatcomplement existing businesses, integrating them into existing operations and utilizing them to enhance theCompany’s growth performance.
MARKET OVERVIEW
The need for professional services, specifically legal, accounting, career management and consulting,scientific, and engineering/technical solutions, has increased rapidly in response to the continuing shift in therespective industries in which these professionals operate. The focus of large corporations has migrated to amore flexible professional workforce which employs personnel on a skill-specific or project-specific basis. Thisshift has increased the reliance upon business service partners to be able to recruit and provide solutions tothese companies on a skill-specific or project-specific basis, or an economic basis. The trend towardoutsourcing these services is expected to be long term in nature.
4
Accounting Division
The Accounting division, which operates primarily under the Accounting Principals brand name in theUnited States and under the Badenoch and Clark brand name throughout the United Kingdom, providesprofessionals and project solutions and support in finance/banking, data processing and accounting, includingauditors, controllers/CFOs, CPAs, financial analysts, mortgage processors, loan processors, accounts receivableand accounts payable clerks, and tax accountants. By providing these accounting and financial services, theCompany offers customers a reliable and economic resource for financial professionals to address uncertain oruneven work loads caused by special projects or unforeseen emergencies. The Company entered the accountingservices industry in 1995 through the acquisition of a small, regional accounting firm and has since increasedthe division to encompass 45 branches in the U.S. and the United Kingdom, as of December 31, 1999.
Included within the Accounting division’s results is Management Principals, a new brand that providespersonnel with project management and implementation experience to the banking and financial servicesindustry to handle such matters as change management, financial projects, marketing, mergers and acquisitions,organizational development, and training. Management Principals also provides direct placement solutions inbanking and financial services. This unit started with the acquisition of Keystone Consulting Group in May1997 and as of December 31, 1999, it operates five branches across the United States.
Legal Division
The Legal division, which operates primarily under the Special Counsel brand name, provides litigationsupport and consulting as well as human resource services and solutions to corporate legal departments and lawfirms. These services include the provision of project teams/individuals consisting of: attorneys, paralegals,legal secretaries, and law librarians to corporate legal departments and private law firms for litigation support,as well as project and document management, document imaging and coding, and trial presentation services.The Company primarily competes with a few large companies and many local firms as this market is highlyfragmented. The Company entered the legal industry in 1995 through the acquisitions of Attorneys Per Diem, aBaltimore operation, (now Special Counsel) in 1995, and Special Counsel, Inc., a New York City operation. Asof December 31, 1999, the legal unit had 33 branches operating primarily in the United States, with capabilityin the United Kingdom through its Badenoch and Clark brand.
Technical and Engineering Division
The Technical and Engineering division, collectively called ENTEGEE, provides drafters, designers andengineers in the mechanical and electrical engineering fields as well as personnel to the chemical, plastics andother industries. ENTEGEE also provides high level engineering and drafting services, including theoutsourcing of specialized design services such as architectural design and drafting, tool designs and computer-aided design (‘‘CAD’’) services. ENTEGEE’s clients range from transportation and aerospace to engineeringfirms, print circuit board manufacturers, and other domestic and international businesses. As of December 31,1999, the technical and engineering unit operates 29 branches throughout the United States.
Scientific Division
The Scientific division, Scientific Staffing, provides trained and advanced-degreed scientists, laboratorytechnicians and support personnel to companies in the pharmaceutical, chemical, biotechnical, environmental,health care and consumer products industries. As of December 31, 1999, the Scientific unit operates 17 branchoffices throughout the United States.
Career Management and Consulting Division
The Career Management and Consulting division, Manchester, Inc. and Diversified Search, Inc. offerscorporate outplacement services, including career counseling, resume development, skills assessment, interview
5
and negotiating techniques, and employee guidance counseling. It also provides leadership development, careermanagement consulting, retained executive search and other human resource services to the banking, financialservices, healthcare, pharmaceutical, chemical and manufacturing industries. This division started with theacquisition of Manchester Partners International, Inc. (‘‘Manchester’’) in January 1997 and as of December 31,1999 it operates through a network of 26 branch offices throughout the United States.
COMPETITION
The business services industry has grown steadily in recent years as companies have utilized businessservice firms to provide value added solutions ranging from the outsourcing of non-core competencies to therecruitment of a flexible workforce able to provide a company with the unique skills it does not houseinternally. MPS believes that the increasing pressure that companies are experiencing to remain competitiveand efficient will cause companies to focus their permanent internal staff around their core competencies whileexpanding their use of business service partners to provide strategic solutions to fulfill their other businessneeds. MPS also believes that the business services industry is highly fragmented, but is experiencingincreasing consolidation largely in response to increased demand for companies to provide a wide range ofcomprehensive human resource solutions to regional and national accounts. A large percentage of businessservices firms are local operations with fewer than five offices. Within local markets, these firms activelycompete with the Company for business, and in most of these markets no single company has a dominant shareof the market. The Company also competes with larger full-service and specialized competitors in national,regional and local markets.
The principal national competitors of the Company include On Assignment, Inc., the legal division ofKelly Services, Inc., Adecco SA, CDI Corporation, Kforce.com, Inc., Acsys, Inc. and Robert Half International,Inc. The Company believes that the primary competitive factors in obtaining and retaining clients are anunderstanding of clients’ specific job requirements, the ability to provide professional personnel in a timelymanner, the monitoring of quality of job performance, and the price of services. The primary competitivefactors in obtaining qualified candidates for professional employment assignments are wages, responsiveness towork schedules, continuing professional education opportunities, and number of hours of work available.Management believes that MPS is highly competitive in all of these areas.
FULL-TIME EMPLOYEES
At March 15, 2000, the Company employed approximately 9,400 professional consultants andapproximately 1,400 corporate employees on a full-time equivalent basis. Approximately 60 of the employeeswork at corporate headquarters. Full-time employees are covered by life and disability insurance and receivehealth and other benefits.
GOVERNMENT REGULATIONS
Outside of the United States and Canada, the personnel outsourcing segment of the Company’s business isclosely regulated. These regulations differ among countries but generally may regulate: (i) the relationshipbetween the Company and its temporary employees; (ii) licensing and reporting requirements; and (iii) types ofoperations permitted. Regulation within the United States does not materially impact the Company’s operations.
SERVICE MARKS
The Company or its subsidiaries maintain a number of service marks and other intangible rights, includingfederally registered service marks for, ACCOUNTING PRINCIPALS (and logo), MANCHESTER,SCIENTIFIC STAFFING, SPECIAL COUNSEL, DIVERSIFIED SEARCH, CAREERSTAT, EXALT,MANCHESTER PARTNERS INTERNATIONAL, and ENTEGEE for its services generally. The Company orits subsidiaries have applications pending before the Patent and Trademark Office for federal registration of theservice marks for MODIS PROFESSIONAL SERVICES (and logo), PROCOACHING, DIVERSIFIED
6
TECHNOLOGY PARTNERS, and MANAGEMENT PRINCIPALS. The Company plans to file affidavits ofuse and timely renewals, as appropriate, for these and other intangible rights it maintains.
SALE OF COMMERCIAL AND HEALTH CARE DIVISIONS
The Company sold its Commercial operations and its Teleservices division to Randstad U.S., L.P., asubsidiary of Randstad Holding nv, for a final adjusted price of $826.2 million, in cash. The sale wascompleted on September 27, 1998. Effective March 30, 1998, the Company sold the operations and certainassets of its Health Care division for consideration of $8.0 million, consisting of $3.0 million in cash and $5.0million in a note receivable due March 30, 2000 bearing interest at 2% in excess of the prime rate. In addition,the Company retained the accounts receivable of the Health Care division of approximately $28.2 million. SeeItem 7 and Note 3 to the Company’s Consolidated Financial Statements for discussion of the sale of theCompany’s Commercial operations, Teleservices division, and Health Care operations.
SEASONALITY
The Company’s quarterly operating results are affected primarily by the number of billing days in thequarter and the seasonality of its customers’ businesses. Demand for the Company’s services has historicallybeen lower during the year-end holidays through February of the following year, showing gradual improvementover the remainder of the year.
ITEM 2. PROPERTIES
The Company owns no material real property. It leases its corporate headquarters as well as all of itsbranch offices. The branch office leases generally run for three to five-year terms. The Company believes thatits facilities are generally adequate for its needs and does not anticipate difficulty replacing such facilities orlocating additional facilities, if needed.
ITEM 3. LEGAL PROCEEDINGS
The Company, in the ordinary course of its business, is from time to time threatened with or named as adefendant in various lawsuits. The Company maintains insurance in such amounts and with such coverage anddeductibles as management believes are reasonable and prudent. There is no pending litigation that theCompany believes is likely to have a material adverse effect on the Company, its financial position or results ofits operations.
ITEM 4. SUBMISSION OF MATTERS TO A VOTE OF SECURITY HOLDERS
No matters were submitted to a vote of security holders during the fourth quarter of the twelve monthsended December 31, 1999.
7
PART II
ITEM 5. MARKET FOR REGISTRANT’S COMMON EQUITY AND RELATED SHAREHOLDERMATTERS
PRICE RANGE OF COMMON STOCK
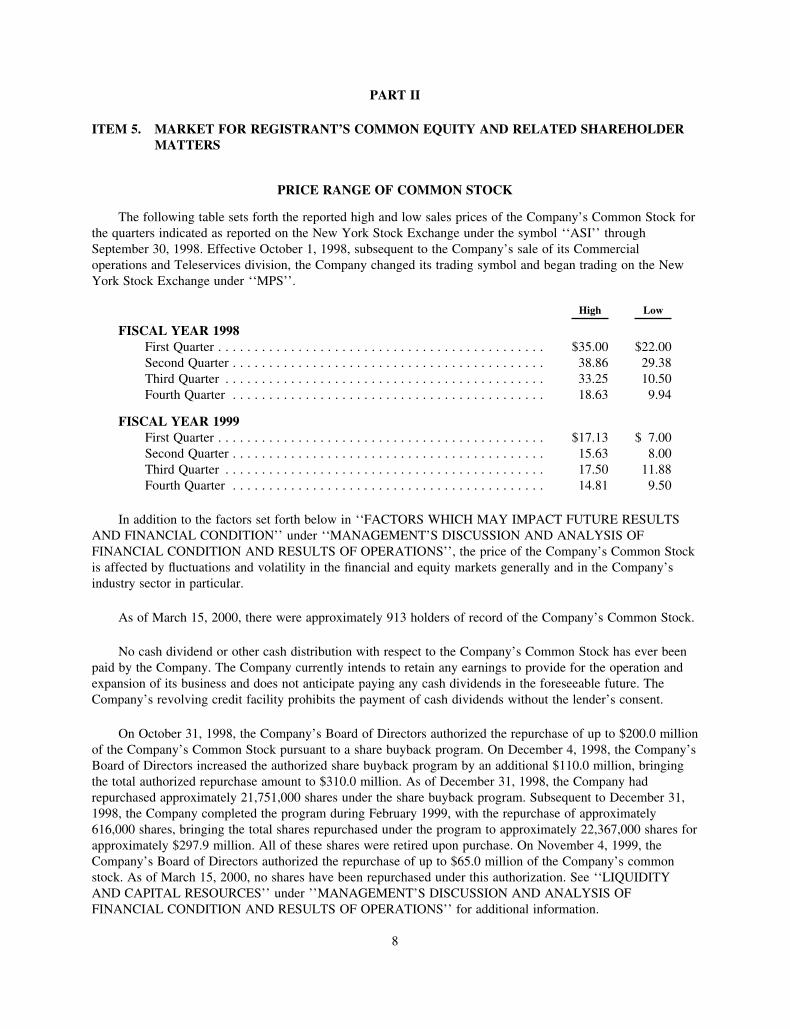
The following table sets forth the reported high and low sales prices of the Company’s Common Stock forthe quarters indicated as reported on the New York Stock Exchange under the symbol ‘‘ASI’’ throughSeptember 30, 1998. Effective October 1, 1998, subsequent to the Company’s sale of its Commercialoperations and Teleservices division, the Company changed its trading symbol and began trading on the NewYork Stock Exchange under ‘‘MPS’’.
High Low
FISCAL YEAR 1998First Quarter . . . . . . . . . . . . . . . . . . . . . . . . . . . . . . . . . . . . . . . . . . . . . $35.00 $22.00Second Quarter . . . . . . . . . . . . . . . . . . . . . . . . . . . . . . . . . . . . . . . . . . . 38.86 29.38Third Quarter . . . . . . . . . . . . . . . . . . . . . . . . . . . . . . . . . . . . . . . . . . . . 33.25 10.50Fourth Quarter . . . . . . . . . . . . . . . . . . . . . . . . . . . . . . . . . . . . . . . . . . . 18.63 9.94
FISCAL YEAR 1999First Quarter . . . . . . . . . . . . . . . . . . . . . . . . . . . . . . . . . . . . . . . . . . . . . $17.13 $ 7.00Second Quarter . . . . . . . . . . . . . . . . . . . . . . . . . . . . . . . . . . . . . . . . . . . 15.63 8.00Third Quarter . . . . . . . . . . . . . . . . . . . . . . . . . . . . . . . . . . . . . . . . . . . . 17.50 11.88Fourth Quarter . . . . . . . . . . . . . . . . . . . . . . . . . . . . . . . . . . . . . . . . . . . 14.81 9.50
In addition to the factors set forth below in ‘‘FACTORS WHICH MAY IMPACT FUTURE RESULTSAND FINANCIAL CONDITION’’ under ‘‘MANAGEMENT’S DISCUSSION AND ANALYSIS OFFINANCIAL CONDITION AND RESULTS OF OPERATIONS’’, the price of the Company’s Common Stockis affected by fluctuations and volatility in the financial and equity markets generally and in the Company’sindustry sector in particular.
As of March 15, 2000, there were approximately 913 holders of record of the Company’s Common Stock.
No cash dividend or other cash distribution with respect to the Company’s Common Stock has ever beenpaid by the Company. The Company currently intends to retain any earnings to provide for the operation andexpansion of its business and does not anticipate paying any cash dividends in the foreseeable future. TheCompany’s revolving credit facility prohibits the payment of cash dividends without the lender’s consent.
On October 31, 1998, the Company’s Board of Directors authorized the repurchase of up to $200.0 millionof the Company’s Common Stock pursuant to a share buyback program. On December 4, 1998, the Company’sBoard of Directors increased the authorized share buyback program by an additional $110.0 million, bringingthe total authorized repurchase amount to $310.0 million. As of December 31, 1998, the Company hadrepurchased approximately 21,751,000 shares under the share buyback program. Subsequent to December 31,1998, the Company completed the program during February 1999, with the repurchase of approximately616,000 shares, bringing the total shares repurchased under the program to approximately 22,367,000 shares forapproximately $297.9 million. All of these shares were retired upon purchase. On November 4, 1999, theCompany’s Board of Directors authorized the repurchase of up to $65.0 million of the Company’s commonstock. As of March 15, 2000, no shares have been repurchased under this authorization. See ‘‘LIQUIDITYAND CAPITAL RESOURCES’’ under ’’MANAGEMENT’S DISCUSSION AND ANALYSIS OFFINANCIAL CONDITION AND RESULTS OF OPERATIONS’’ for additional information.
8
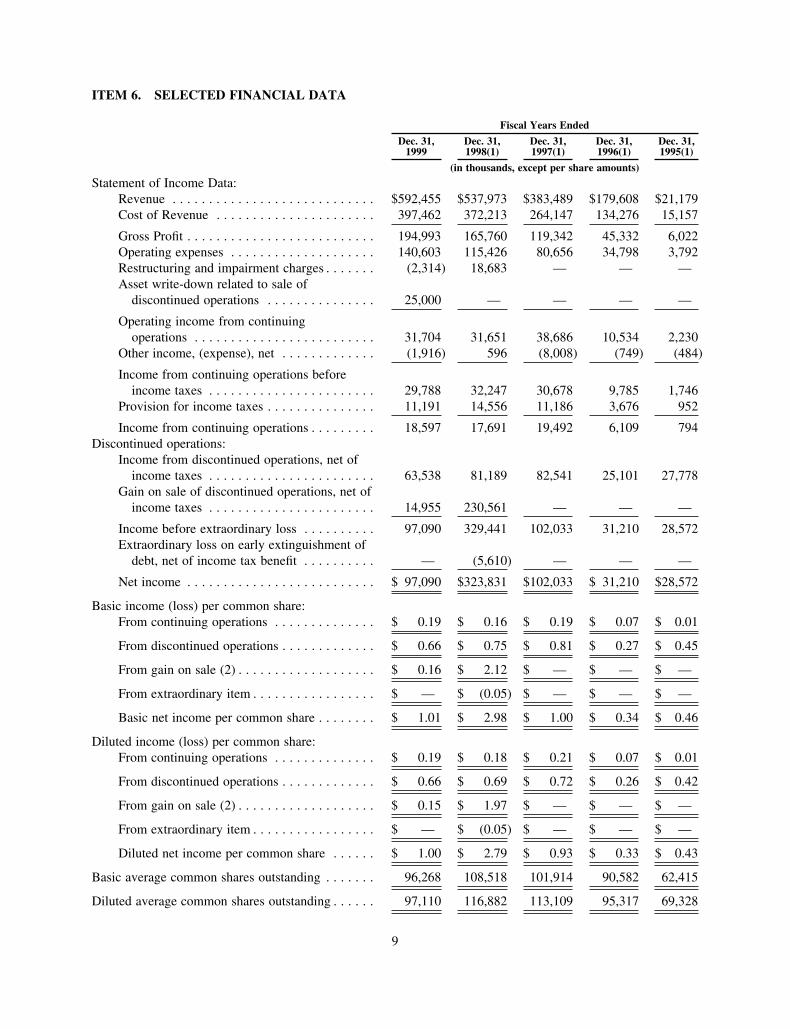
ITEM 6. SELECTED FINANCIAL DATA
Fiscal Years Ended
Dec. 31,1999
Dec. 31,1998(1)
Dec. 31,1997(1)
Dec. 31,1996(1)
Dec. 31,1995(1)
(in thousands, except per share amounts)
Statement of Income Data:Revenue . . . . . . . . . . . . . . . . . . . . . . . . . . . . $592,455 $537,973 $383,489 $179,608 $21,179Cost of Revenue . . . . . . . . . . . . . . . . . . . . . . 397,462 372,213 264,147 134,276 15,157
Gross Profit . . . . . . . . . . . . . . . . . . . . . . . . . . 194,993 165,760 119,342 45,332 6,022Operating expenses . . . . . . . . . . . . . . . . . . . . 140,603 115,426 80,656 34,798 3,792Restructuring and impairment charges . . . . . . . (2,314) 18,683 — — —Asset write-down related to sale of
discontinued operations . . . . . . . . . . . . . . . 25,000 — — — —
Operating income from continuingoperations . . . . . . . . . . . . . . . . . . . . . . . . . 31,704 31,651 38,686 10,534 2,230
Other income, (expense), net . . . . . . . . . . . . . (1,916) 596 (8,008) (749) (484)
Income from continuing operations beforeincome taxes . . . . . . . . . . . . . . . . . . . . . . . 29,788 32,247 30,678 9,785 1,746
Provision for income taxes . . . . . . . . . . . . . . . 11,191 14,556 11,186 3,676 952
Income from continuing operations . . . . . . . . . 18,597 17,691 19,492 6,109 794Discontinued operations:
Income from discontinued operations, net ofincome taxes . . . . . . . . . . . . . . . . . . . . . . . 63,538 81,189 82,541 25,101 27,778
Gain on sale of discontinued operations, net ofincome taxes . . . . . . . . . . . . . . . . . . . . . . . 14,955 230,561 — — —
Income before extraordinary loss . . . . . . . . . . 97,090 329,441 102,033 31,210 28,572Extraordinary loss on early extinguishment of
debt, net of income tax benefit . . . . . . . . . . — (5,610) — — —
Net income . . . . . . . . . . . . . . . . . . . . . . . . . . $ 97,090 $323,831 $102,033 $ 31,210 $28,572
Basic income (loss) per common share:From continuing operations . . . . . . . . . . . . . . $ 0.19 $ 0.16 $ 0.19 $ 0.07 $ 0.01
From discontinued operations . . . . . . . . . . . . . $ 0.66 $ 0.75 $ 0.81 $ 0.27 $ 0.45
From gain on sale (2) . . . . . . . . . . . . . . . . . . . $ 0.16 $ 2.12 $ — $ — $ —
From extraordinary item . . . . . . . . . . . . . . . . . $ — $ (0.05) $ — $ — $ —
Basic net income per common share . . . . . . . . $ 1.01 $ 2.98 $ 1.00 $ 0.34 $ 0.46
Diluted income (loss) per common share:From continuing operations . . . . . . . . . . . . . . $ 0.19 $ 0.18 $ 0.21 $ 0.07 $ 0.01
From discontinued operations . . . . . . . . . . . . . $ 0.66 $ 0.69 $ 0.72 $ 0.26 $ 0.42
From gain on sale (2) . . . . . . . . . . . . . . . . . . . $ 0.15 $ 1.97 $ — $ — $ —
From extraordinary item . . . . . . . . . . . . . . . . . $ — $ (0.05) $ — $ — $ —
Diluted net income per common share . . . . . . $ 1.00 $ 2.79 $ 0.93 $ 0.33 $ 0.43
Basic average common shares outstanding . . . . . . . 96,268 108,518 101,914 90,582 62,415
Diluted average common shares outstanding . . . . . . 97,110 116,882 113,109 95,317 69,328
9
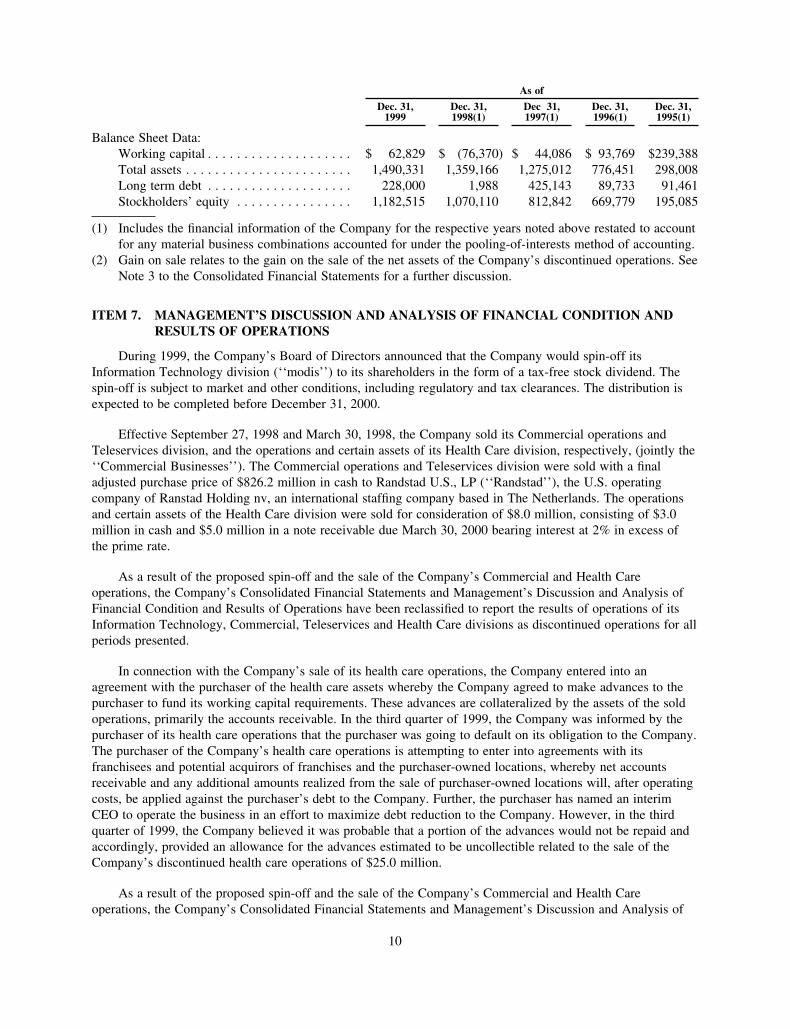
As of
Dec. 31,1999
Dec. 31,1998(1)
Dec 31,1997(1)
Dec. 31,1996(1)
Dec. 31,1995(1)
Balance Sheet Data:Working capital . . . . . . . . . . . . . . . . . . . . $ 62,829 $ (76,370) $ 44,086 $ 93,769 $239,388Total assets . . . . . . . . . . . . . . . . . . . . . . . 1,490,331 1,359,166 1,275,012 776,451 298,008Long term debt . . . . . . . . . . . . . . . . . . . . 228,000 1,988 425,143 89,733 91,461Stockholders’ equity . . . . . . . . . . . . . . . . 1,182,515 1,070,110 812,842 669,779 195,085
(1) Includes the financial information of the Company for the respective years noted above restated to accountfor any material business combinations accounted for under the pooling-of-interests method of accounting.
(2) Gain on sale relates to the gain on the sale of the net assets of the Company’s discontinued operations. SeeNote 3 to the Consolidated Financial Statements for a further discussion.
ITEM 7. MANAGEMENT’S DISCUSSION AND ANALYSIS OF FINANCIAL CONDITION ANDRESULTS OF OPERATIONS
During 1999, the Company’s Board of Directors announced that the Company would spin-off itsInformation Technology division (‘‘modis’’) to its shareholders in the form of a tax-free stock dividend. Thespin-off is subject to market and other conditions, including regulatory and tax clearances. The distribution isexpected to be completed before December 31, 2000.
Effective September 27, 1998 and March 30, 1998, the Company sold its Commercial operations andTeleservices division, and the operations and certain assets of its Health Care division, respectively, (jointly the‘‘Commercial Businesses’’). The Commercial operations and Teleservices division were sold with a finaladjusted purchase price of $826.2 million in cash to Randstad U.S., LP (‘‘Randstad’’), the U.S. operatingcompany of Ranstad Holding nv, an international staffing company based in The Netherlands. The operationsand certain assets of the Health Care division were sold for consideration of $8.0 million, consisting of $3.0million in cash and $5.0 million in a note receivable due March 30, 2000 bearing interest at 2% in excess ofthe prime rate.
As a result of the proposed spin-off and the sale of the Company’s Commercial and Health Careoperations, the Company’s Consolidated Financial Statements and Management’s Discussion and Analysis ofFinancial Condition and Results of Operations have been reclassified to report the results of operations of itsInformation Technology, Commercial, Teleservices and Health Care divisions as discontinued operations for allperiods presented.
In connection with the Company’s sale of its health care operations, the Company entered into anagreement with the purchaser of the health care assets whereby the Company agreed to make advances to thepurchaser to fund its working capital requirements. These advances are collateralized by the assets of the soldoperations, primarily the accounts receivable. In the third quarter of 1999, the Company was informed by thepurchaser of its health care operations that the purchaser was going to default on its obligation to the Company.The purchaser of the Company’s health care operations is attempting to enter into agreements with itsfranchisees and potential acquirors of franchises and the purchaser-owned locations, whereby net accountsreceivable and any additional amounts realized from the sale of purchaser-owned locations will, after operatingcosts, be applied against the purchaser’s debt to the Company. Further, the purchaser has named an interimCEO to operate the business in an effort to maximize debt reduction to the Company. However, in the thirdquarter of 1999, the Company believed it was probable that a portion of the advances would not be repaid andaccordingly, provided an allowance for the advances estimated to be uncollectible related to the sale of theCompany’s discontinued health care operations of $25.0 million.
As a result of the proposed spin-off and the sale of the Company’s Commercial and Health Careoperations, the Company’s Consolidated Financial Statements and Management’s Discussion and Analysis of
10

Financial Condition and Results of Operations have been reclassified to report the results of operations of itsInformation Technology, Commercial, Teleservices and Health Care divisions as discontinued operations for allperiods presented.
The following detailed analysis of operations should be read in conjunction with the 1999 FinancialStatements and related notes included elsewhere in this Form 10-K.
11
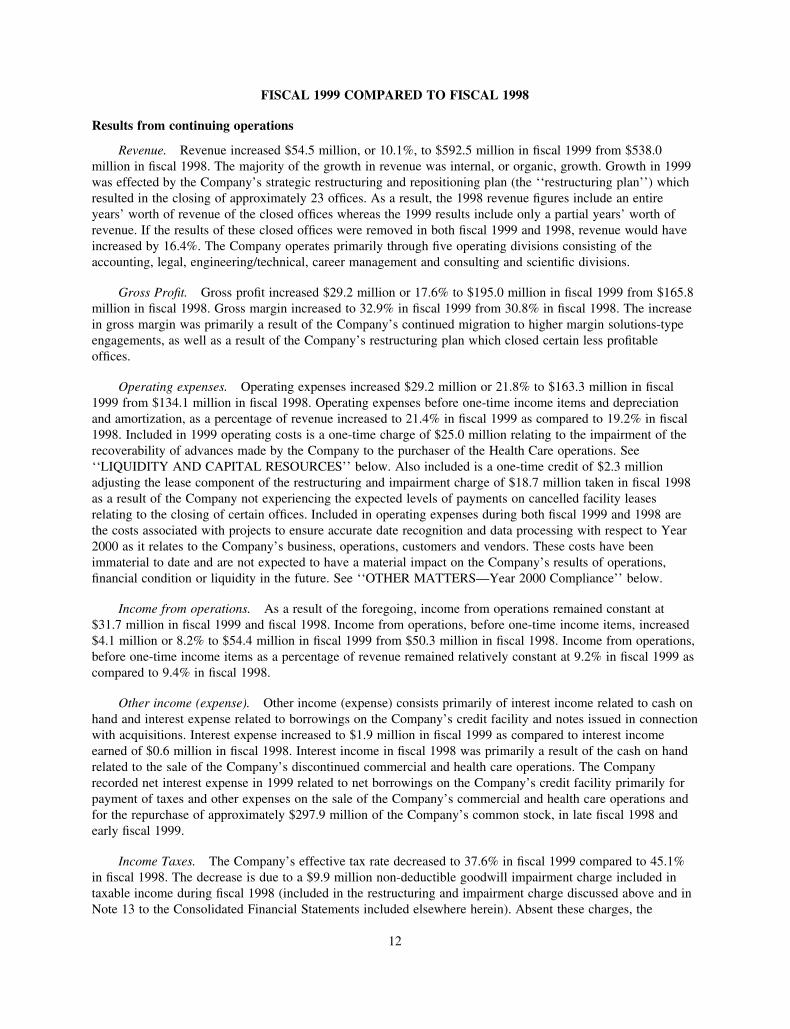
FISCAL 1999 COMPARED TO FISCAL 1998
Results from continuing operations
Revenue. Revenue increased $54.5 million, or 10.1%, to $592.5 million in fiscal 1999 from $538.0million in fiscal 1998. The majority of the growth in revenue was internal, or organic, growth. Growth in 1999was effected by the Company’s strategic restructuring and repositioning plan (the ‘‘restructuring plan’’) whichresulted in the closing of approximately 23 offices. As a result, the 1998 revenue figures include an entireyears’ worth of revenue of the closed offices whereas the 1999 results include only a partial years’ worth ofrevenue. If the results of these closed offices were removed in both fiscal 1999 and 1998, revenue would haveincreased by 16.4%. The Company operates primarily through five operating divisions consisting of theaccounting, legal, engineering/technical, career management and consulting and scientific divisions.
Gross Profit. Gross profit increased $29.2 million or 17.6% to $195.0 million in fiscal 1999 from $165.8million in fiscal 1998. Gross margin increased to 32.9% in fiscal 1999 from 30.8% in fiscal 1998. The increasein gross margin was primarily a result of the Company’s continued migration to higher margin solutions-typeengagements, as well as a result of the Company’s restructuring plan which closed certain less profitableoffices.
Operating expenses. Operating expenses increased $29.2 million or 21.8% to $163.3 million in fiscal1999 from $134.1 million in fiscal 1998. Operating expenses before one-time income items and depreciationand amortization, as a percentage of revenue increased to 21.4% in fiscal 1999 as compared to 19.2% in fiscal1998. Included in 1999 operating costs is a one-time charge of $25.0 million relating to the impairment of therecoverability of advances made by the Company to the purchaser of the Health Care operations. See‘‘LIQUIDITY AND CAPITAL RESOURCES’’ below. Also included is a one-time credit of $2.3 millionadjusting the lease component of the restructuring and impairment charge of $18.7 million taken in fiscal 1998as a result of the Company not experiencing the expected levels of payments on cancelled facility leasesrelating to the closing of certain offices. Included in operating expenses during both fiscal 1999 and 1998 arethe costs associated with projects to ensure accurate date recognition and data processing with respect to Year2000 as it relates to the Company’s business, operations, customers and vendors. These costs have beenimmaterial to date and are not expected to have a material impact on the Company’s results of operations,financial condition or liquidity in the future. See ‘‘OTHER MATTERS—Year 2000 Compliance’’ below.
Income from operations. As a result of the foregoing, income from operations remained constant at$31.7 million in fiscal 1999 and fiscal 1998. Income from operations, before one-time income items, increased$4.1 million or 8.2% to $54.4 million in fiscal 1999 from $50.3 million in fiscal 1998. Income from operations,before one-time income items as a percentage of revenue remained relatively constant at 9.2% in fiscal 1999 ascompared to 9.4% in fiscal 1998.
Other income (expense). Other income (expense) consists primarily of interest income related to cash onhand and interest expense related to borrowings on the Company’s credit facility and notes issued in connectionwith acquisitions. Interest expense increased to $1.9 million in fiscal 1999 as compared to interest incomeearned of $0.6 million in fiscal 1998. Interest income in fiscal 1998 was primarily a result of the cash on handrelated to the sale of the Company’s discontinued commercial and health care operations. The Companyrecorded net interest expense in 1999 related to net borrowings on the Company’s credit facility primarily forpayment of taxes and other expenses on the sale of the Company’s commercial and health care operations andfor the repurchase of approximately $297.9 million of the Company’s common stock, in late fiscal 1998 andearly fiscal 1999.
Income Taxes. The Company’s effective tax rate decreased to 37.6% in fiscal 1999 compared to 45.1%in fiscal 1998. The decrease is due to a $9.9 million non-deductible goodwill impairment charge included intaxable income during fiscal 1998 (included in the restructuring and impairment charge discussed above and inNote 13 to the Consolidated Financial Statements included elsewhere herein). Absent these charges, the
12
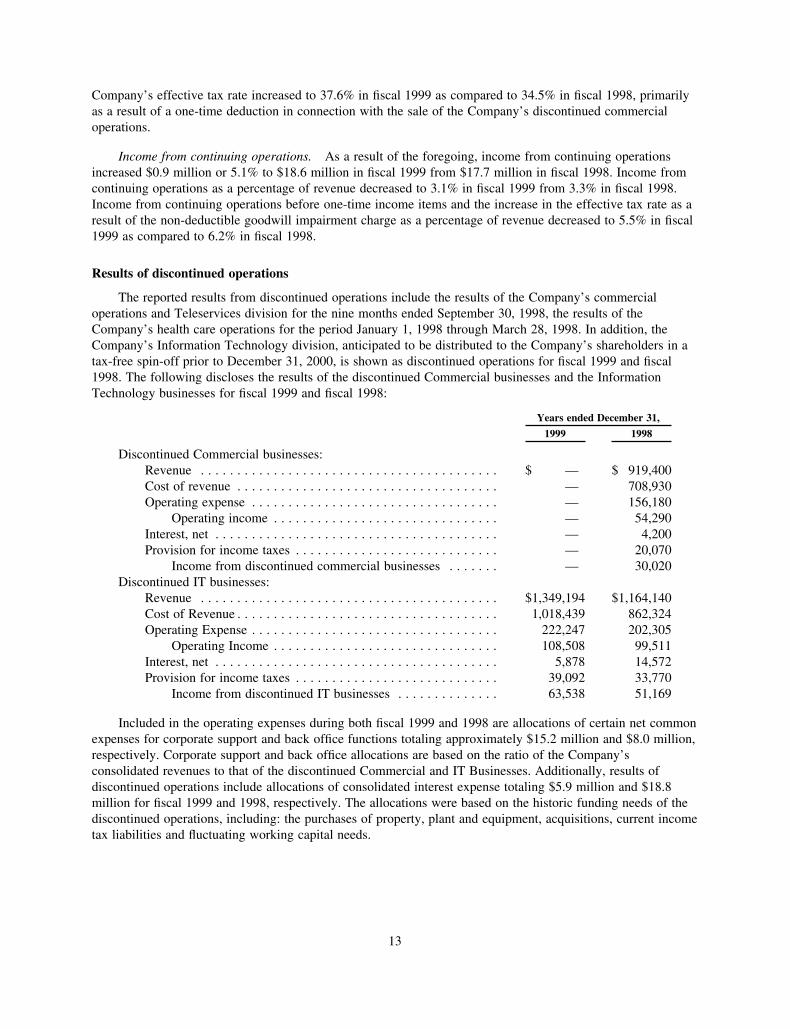
Company’s effective tax rate increased to 37.6% in fiscal 1999 as compared to 34.5% in fiscal 1998, primarilyas a result of a one-time deduction in connection with the sale of the Company’s discontinued commercialoperations.
Income from continuing operations. As a result of the foregoing, income from continuing operationsincreased $0.9 million or 5.1% to $18.6 million in fiscal 1999 from $17.7 million in fiscal 1998. Income fromcontinuing operations as a percentage of revenue decreased to 3.1% in fiscal 1999 from 3.3% in fiscal 1998.Income from continuing operations before one-time income items and the increase in the effective tax rate as aresult of the non-deductible goodwill impairment charge as a percentage of revenue decreased to 5.5% in fiscal1999 as compared to 6.2% in fiscal 1998.
Results of discontinued operations
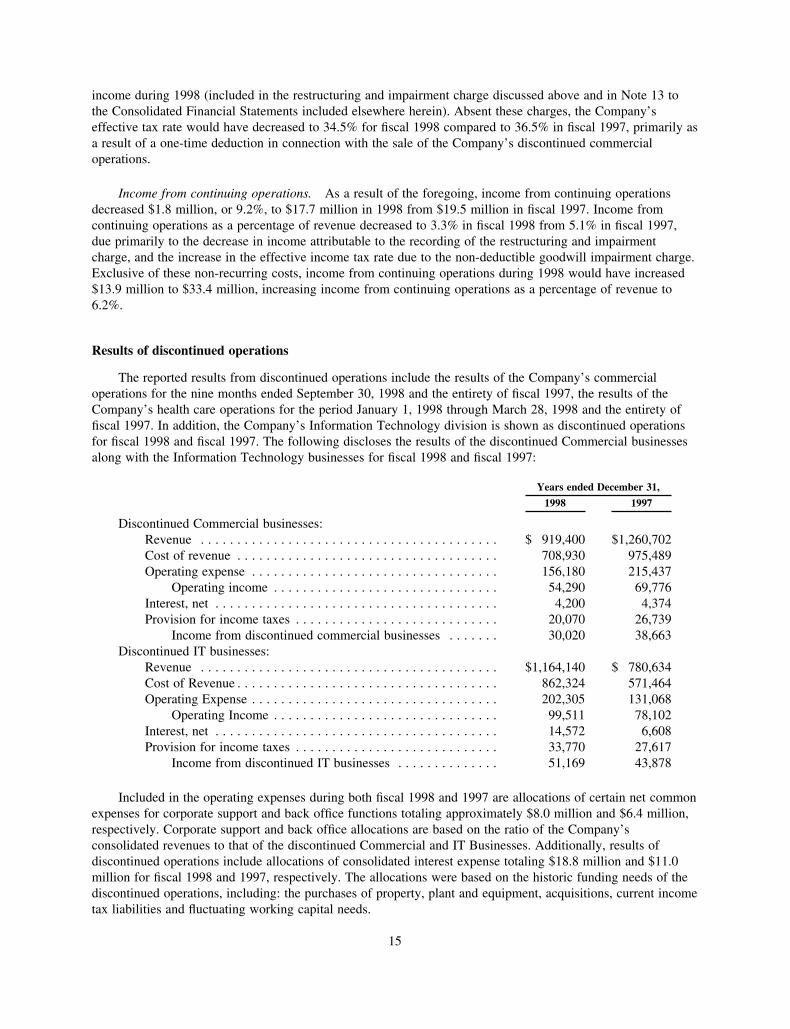
The reported results from discontinued operations include the results of the Company’s commercialoperations and Teleservices division for the nine months ended September 30, 1998, the results of theCompany’s health care operations for the period January 1, 1998 through March 28, 1998. In addition, theCompany’s Information Technology division, anticipated to be distributed to the Company’s shareholders in atax-free spin-off prior to December 31, 2000, is shown as discontinued operations for fiscal 1999 and fiscal1998. The following discloses the results of the discontinued Commercial businesses and the InformationTechnology businesses for fiscal 1999 and fiscal 1998:
Years ended December 31,
1999 1998
Discontinued Commercial businesses:Revenue . . . . . . . . . . . . . . . . . . . . . . . . . . . . . . . . . . . . . . . . . $ — $ 919,400Cost of revenue . . . . . . . . . . . . . . . . . . . . . . . . . . . . . . . . . . . . — 708,930Operating expense . . . . . . . . . . . . . . . . . . . . . . . . . . . . . . . . . . — 156,180
Operating income . . . . . . . . . . . . . . . . . . . . . . . . . . . . . . . — 54,290Interest, net . . . . . . . . . . . . . . . . . . . . . . . . . . . . . . . . . . . . . . . — 4,200Provision for income taxes . . . . . . . . . . . . . . . . . . . . . . . . . . . . — 20,070
Income from discontinued commercial businesses . . . . . . . — 30,020Discontinued IT businesses:
Revenue . . . . . . . . . . . . . . . . . . . . . . . . . . . . . . . . . . . . . . . . . $1,349,194 $1,164,140Cost of Revenue . . . . . . . . . . . . . . . . . . . . . . . . . . . . . . . . . . . . 1,018,439 862,324Operating Expense . . . . . . . . . . . . . . . . . . . . . . . . . . . . . . . . . . 222,247 202,305
Operating Income . . . . . . . . . . . . . . . . . . . . . . . . . . . . . . . 108,508 99,511Interest, net . . . . . . . . . . . . . . . . . . . . . . . . . . . . . . . . . . . . . . . 5,878 14,572Provision for income taxes . . . . . . . . . . . . . . . . . . . . . . . . . . . . 39,092 33,770
Income from discontinued IT businesses . . . . . . . . . . . . . . 63,538 51,169
Included in the operating expenses during both fiscal 1999 and 1998 are allocations of certain net commonexpenses for corporate support and back office functions totaling approximately $15.2 million and $8.0 million,respectively. Corporate support and back office allocations are based on the ratio of the Company’sconsolidated revenues to that of the discontinued Commercial and IT Businesses. Additionally, results ofdiscontinued operations include allocations of consolidated interest expense totaling $5.9 million and $18.8million for fiscal 1999 and 1998, respectively. The allocations were based on the historic funding needs of thediscontinued operations, including: the purchases of property, plant and equipment, acquisitions, current incometax liabilities and fluctuating working capital needs.
13
FISCAL 1998 VERSUS FISCAL 1997
Results from continuing operations
Revenue. Revenue increased $154.5 million, or 40.3% to $538.0 million in fiscal 1998 from $383.5million in fiscal 1997. A significant portion of the increase was the result of the acquisition of a large,international provider of accounting services during June 1997, which resulted in approximately six months ofpost acquisition revenue in fiscal 1997 results versus twelve months during fiscal 1998. Also included in the1998 revenues are revenues derived from a project in the Company’s Legal division and with a certaincustomer. The revenues from this project amounted to approximately $16.1 million, or 3.0% of total revenue.This project was completed during the early part of fiscal 1999. The Company operates primarily through fiveoperating divisions consisting of the accounting, legal, engineering/technical, career management andconsulting and scientific divisions.
Gross Profit. Gross profit increased $46.5 million, or 39.0%, to $165.8 million in fiscal 1998 from$119.3 million in fiscal 1997. Gross margin decreased to 30.8% in fiscal 1998 from 31.1% in fiscal 1997. Theoverall decrease in the gross margin was due primarily to an increased percentage of revenues from the UnitedKingdom, increased salary pressures due to a continued shortage of skilled workers, higher benefits costsincluding a matching 401(k) plan and holiday and vacation pay, and increased competition within the segmentincluding downward pricing pressure from competitors.
Operating Expenses. Operating expenses increased $53.4 million, or 66.2%, to $134.1 million in fiscal1998 from $80.7 million in fiscal 1997. Included in operating expenses in fiscal 1998 are $18.7 million inrestructuring and impairment charges associated with the Company’s Integration and Strategic RepositioningPlan (the ‘‘Restructuring Plan’’). Operating expenses before these non-recurring items as a percentage ofrevenue increased to 21.5% in fiscal 1998, from 21.0% in fiscal 1997. The Company’s general andadministrative (‘‘G&A’’) expenses before the non-recurring items increased $30.8 million or 42.5% to $103.2million in fiscal 1998 from $72.4 million in fiscal 1997. The increase in G&A expenses was primarily relatedto: the effects of acquisitions made by the Company; internal growth of the operating companies post-acquisition; investments made to improve infrastructure and to develop technical practices; and increasedexpenses at the corporate level to support the growth of the Company including sales, marketing and brandrecognition. Included in G&A expenses during both 1998 and 1997 are the costs associated with projects toensure accurate date recognition and data processing with respect to the Year 2000 as it relates to theCompany’s business, operations, customers and vendors. See ‘‘OTHER MATTERS—Year 2000 Compliance’’below.
Income from Operations. As a result of the foregoing, income from operations decreased $7.0 million, or18.1%, to $31.7 million in fiscal 1998 from $38.7 million in fiscal 1997. Income from operations before non-recurring items increased $11.6 million, or 30.0%, to $50.3 million in fiscal 1998 from $38.7 million in fiscal1997. Income from operations before non-recurring restructuring and impairment costs as a percentage ofrevenue decreased to 9.4% in fiscal 1998 from 10.1% in fiscal 1997.
Other Income (Expense). Interest expense decreased $8.6 million to $0.6 million of interest income infiscal 1998 from $8.0 million in interest expense in fiscal 1997. The decrease in interest expense resultedprimarily from four sources: (1) the sale of the Company’s Commercial and teleservices divisions and theresultant net cash proceeds of approximately $373.0 million (net of $477.0 million used to pay off andterminate the Company’s then existing credit facility) which earned interest income from October 1, 1998through December 31, 1998; (2) the resulting interest savings from October 1, 1998 through December 31,1998 from paying off the existing credit facility (the new facility did not have a balance as of December 31,1998); (3) investment income from certain investments owned by the Company; and (4) interest income earnedfrom cash on hand at certain subsidiaries of the Company.
Income Taxes. The Company’s effective tax rate was 45.1% in fiscal 1998 compared to 36.5% in fiscal1997. The increase is due to a $9.9 million non-deductible goodwill impairment charge included in taxable
14
income during 1998 (included in the restructuring and impairment charge discussed above and in Note 13 tothe Consolidated Financial Statements included elsewhere herein). Absent these charges, the Company’seffective tax rate would have decreased to 34.5% for fiscal 1998 compared to 36.5% in fiscal 1997, primarily asa result of a one-time deduction in connection with the sale of the Company’s discontinued commercialoperations.
Income from continuing operations. As a result of the foregoing, income from continuing operationsdecreased $1.8 million, or 9.2%, to $17.7 million in 1998 from $19.5 million in fiscal 1997. Income fromcontinuing operations as a percentage of revenue decreased to 3.3% in fiscal 1998 from 5.1% in fiscal 1997,due primarily to the decrease in income attributable to the recording of the restructuring and impairmentcharge, and the increase in the effective income tax rate due to the non-deductible goodwill impairment charge.Exclusive of these non-recurring costs, income from continuing operations during 1998 would have increased$13.9 million to $33.4 million, increasing income from continuing operations as a percentage of revenue to6.2%.
Results of discontinued operations
The reported results from discontinued operations include the results of the Company’s commercialoperations for the nine months ended September 30, 1998 and the entirety of fiscal 1997, the results of theCompany’s health care operations for the period January 1, 1998 through March 28, 1998 and the entirety offiscal 1997. In addition, the Company’s Information Technology division is shown as discontinued operationsfor fiscal 1998 and fiscal 1997. The following discloses the results of the discontinued Commercial businessesalong with the Information Technology businesses for fiscal 1998 and fiscal 1997:
Years ended December 31,
1998 1997
Discontinued Commercial businesses:Revenue . . . . . . . . . . . . . . . . . . . . . . . . . . . . . . . . . . . . . . . . . $ 919,400 $1,260,702Cost of revenue . . . . . . . . . . . . . . . . . . . . . . . . . . . . . . . . . . . . 708,930 975,489Operating expense . . . . . . . . . . . . . . . . . . . . . . . . . . . . . . . . . . 156,180 215,437
Operating income . . . . . . . . . . . . . . . . . . . . . . . . . . . . . . . 54,290 69,776Interest, net . . . . . . . . . . . . . . . . . . . . . . . . . . . . . . . . . . . . . . . 4,200 4,374Provision for income taxes . . . . . . . . . . . . . . . . . . . . . . . . . . . . 20,070 26,739
Income from discontinued commercial businesses . . . . . . . 30,020 38,663Discontinued IT businesses:
Revenue . . . . . . . . . . . . . . . . . . . . . . . . . . . . . . . . . . . . . . . . . $1,164,140 $ 780,634Cost of Revenue . . . . . . . . . . . . . . . . . . . . . . . . . . . . . . . . . . . . 862,324 571,464Operating Expense . . . . . . . . . . . . . . . . . . . . . . . . . . . . . . . . . . 202,305 131,068
Operating Income . . . . . . . . . . . . . . . . . . . . . . . . . . . . . . . 99,511 78,102Interest, net . . . . . . . . . . . . . . . . . . . . . . . . . . . . . . . . . . . . . . . 14,572 6,608Provision for income taxes . . . . . . . . . . . . . . . . . . . . . . . . . . . . 33,770 27,617
Income from discontinued IT businesses . . . . . . . . . . . . . . 51,169 43,878
Included in the operating expenses during both fiscal 1998 and 1997 are allocations of certain net commonexpenses for corporate support and back office functions totaling approximately $8.0 million and $6.4 million,respectively. Corporate support and back office allocations are based on the ratio of the Company’sconsolidated revenues to that of the discontinued Commercial and IT Businesses. Additionally, results ofdiscontinued operations include allocations of consolidated interest expense totaling $18.8 million and $11.0million for fiscal 1998 and 1997, respectively. The allocations were based on the historic funding needs of thediscontinued operations, including: the purchases of property, plant and equipment, acquisitions, current incometax liabilities and fluctuating working capital needs.
15

LIQUIDITY AND CAPITAL RESOURCES
The Company’s capital requirements have principally been related to the acquisition of businesses,working capital needs and capital expenditures. These requirements have been met through a combination ofbank debt, issuances of Common Stock and internally generated funds. The Company’s operating cash flowsand working capital requirements are affected significantly by the timing of payroll and by the receipt ofpayment from the customer. Generally, the Company pays its consultants weekly or semi-monthly, and receivespayments from customers within 30 to 80 days from the date of invoice.
The Company had working capital of $62.8 million and $(76.4) million as of December 31, 1999 and1998, respectively. Included in current liabilities as of December 31, 1999 and 1998 were amounts related toearn-out payments due to the former owners of acquired companies. The earn-out amounts were scheduled tobe paid in the first and second quarters of fiscal 2000 and 1999, respectively, and were capitalized to thegoodwill balances related to the respective acquired companies. See Note 13 to the Company’s ConsolidatedFinancial Statements for further discussion of the Restructuring Plan. The principal reason for the increase inthe Company’s working capital is the Company’s recognition of a $175.0 million current tax liability as ofDecember 31, 1998 relating to the sale of its Commercial operations and Teleservices division. The Companyused proceeds from borrowings under its credit facility to pay the tax liability. The majority of the proceedsfrom the sale were used to pay down long-term debt under its credit facility (which did not have a balance asof December 31, 1998) and to repurchase the Company’s Common Stock under an approved stock repurchaseplan. The Company had cash and cash equivalents of $0.9 million and $73.4 million as of December 31, 1999and 1998, respectively. For the years ended December 31, 1999 and 1998, the Company generated $45.7million and $27.7 million of cash flow from operations, respectively. For the year ended December 31, 1997,the Company used $2.7 million of cash for operations. The large increases in cash flows from operations yearover year are due to the cash flow provided from internal operations, as well as from acquired companies. Themajority of the Company’s acquisitions occurred throughout the years ended December 31, 1998 and 1997.Due to the timing of the acquisitions, the cash flow from operations has increased during the years endedDecember 31, 1999 and 1998, respectively.
For the year ended December 31, 1999, the Company used $252.0 million of cash for investing activities,primarily as a result of taxes and other expenses related to the Company’s sale of the Commercial businesses,of $191.4 million. The balance of $60.6 million relates to cash the Company used for acquisitions of $39.7million, for capital expenditures of $1.7 million, and advances related to the sale of its discontinued Healthcareoperations of $19.2 million.
For the year ended December 31, 1998, the Company generated $778.9 million of cash flow frominvesting activities, primarily as a result of net proceeds of $840.9 million received from the Company’s sale ofits Commercial operations and Teleservices division. The Company also used $62.0 million for investingactivities, which was comprised of cash the Company used for acquisitions of $38.4 million, for capitalexpenditures of $7.7 million, and advances related to the sale of its discontinued Healthcare operations of $15.9million.
In addition, the Company is subject to claims for indemnification arising from the sales of its Commercialoperations and Teleservices division and its Health Care division in 1998. For the year ended December 31,1999 and 1998, the Company did not pay any indemnification claims. Although the Company has receivedcertain claims for indemnification or notices of possible claims pursuant to such obligations, the Companybelieves that it has meritorious defenses against such claims and does not believe that such claims, ifsuccessful, would have a material adverse effect on the Company’s cash flows, financial condition or results ofoperations.
In connection with the Company’s sale of its Health Care operations, the Company entered into anagreement with the purchaser of the Health Care operations whereby the Company agreed to make advances tothe purchaser to fund its working capital requirements. Any amounts extended are collateralized by the
16
accounts receivable and certain other assets of the related health care operations. Advances made under thisagreement accrue interest at 10% per year. During fiscal 1999 and 1998, the Company had advancedapproximately $19.2 and $15.9 million, respectively, under this agreement. See Note 12 to the Company’sConsolidated Financial Statements for further discussion of this agreement and the Company’s write-down ofthis asset in fiscal 1999.
For the year ended December 31, 1997, the Company used $138.6 million for investing activities, ofwhich $135.4 million was used for acquisitions and $3.2 million was used for capital expenditures. TheCompany made one, four and eight acquisitions in each of the years ended December 31, 1999, 1998 and 1997,respectively.
For the year ended December 31, 1999, the Company generated $241.8 million from financing activities.During fiscal 1999, this amount primarily represented net borrowings from the Company’s credit facility, whichwas used primarily to pay the tax liability and other payments related to the sale of the Company’s Commercialoperations and Teleservices division.
For the year ended December 31, 1998, the Company used $648.8 million for financing activities of which$309.7 million were used to repurchase the Company’s Common Stock, $339.7 million which represents netrepayments on borrowings from the Company’s credit facility and notes issued in connection with theacquisition of certain companies, $23.6 million related to the repurchase of the Company’s 7% ConvertibleSenior Notes Due 2002, and $24.2 million related to the proceeds from stock options exercised. Therepayments on the Company’s credit facility were mainly funded from the sale of the Company’s Commercialoperations and Teleservices division.
On October 31, 1998, the Company’s Board of Directors authorized the repurchase of up to $200.0 millionof the Company’s Common Stock pursuant to a share buyback program. On December 4, 1998, the Company’sBoard of Directors increased the authorized share buyback program by an additional $110.0 million, bringingthe total authorized repurchase amount to $310.0 million. As of December 31, 1998, the Company hadrepurchased approximately 21,751,000 shares under the share buyback program. Included in the sharesrepurchased as of December 31, 1998 were approximately 6,150,000 shares repurchased under an acceleratedstock acquisition plan (‘‘ASAP’’). The Company entered into the ASAP with a certain brokerage firm whichagreed to sell to the Company shares of its Common Stock at a certain cost. The brokerage firm borrowed theseshares from its customers and was required to enter into market transactions, subject to Company approval, andpurchase shares of Company Common Stock to return to its customers. The Company, pursuant to the ASAP,agreed to compensate the brokerage firm for any increases in the Company’s stock price that would cause thebrokerage firm to pay an amount to purchase the stock over the ASAP price. Conversely, the Company wouldreceive a refund in the purchase price if the Company’s stock price fell below the ASAP price. Subsequent toDecember 31, 1998, the Company used refunded proceeds from the ASAP to complete the program duringJanuary and February 1999, with the repurchase of approximately 616,000 shares, bringing the total sharesrepurchased under the program to approximately 22,348,000 shares for approximately $297.9 million. All ofthese shares were retired upon purchase. On November 4, 1999, the Company’s Board of Directors authorizedthe repurchase of up to $65.0 million of the Company’s common stock. As of March 15, 2000, no shares havebeen repurchased under this authorization.
For the years ended December 31, 1997, the Company generated $352.5 million of cash flow fromfinancing activities. During fiscal 1997, this amount primarily represented net borrowings from the Company’scredit facility, which was used primarily to fund acquisitions.
The Company is also obligated under various acquisition agreements to make earn-out payments to formerstockholders of acquired companies over the next two years. The Company estimates that the amount of thesepayments will total $34.6 and $3.9 million annually, for the next two years. The $34.6 million estimate isincluded in the balance sheet in line item ‘‘Accounts payable and accrued expenses’ at December 31, 1999.
17
The Company anticipates that the cash generated by the operations of the acquired companies will provide asubstantial portion of the capital required to fund these payments.
The Company anticipates that capital expenditures for furniture and equipment, including improvements toits management information and operating systems during the next twelve months will be approximately $5.0million.
The Company believes that funds provided by operations, available borrowings under the credit facility,and current amounts of cash will be sufficient to meet its presently anticipated needs for working capital,capital expenditures and acquisitions for at least the next 12 months.
Indebtedness of the Company
On October 30, 1998, the Company entered into a new $500 million revolving credit facility which issyndicated to a group of 13 banks with NationsBank (Bank of America), as the principal agent. This facility iscomprised of a $350.0 million facility which expires on October 21, 2003 and a $150.0 million, 364 dayfacility. On October 27, 1999, the 364 day, $150.0 million portion of the original credit facility was replaced bya new $150.0 million 364 day credit facility. Pursuant to the 364 day credit facility, the Company has theoption to term out the 364 day component of the credit facility for up to one year. Outstanding amounts underthe credit facilities bear interest at certain floating rates as specified by the applicable credit facility. The creditfacilities contain certain financial and non-financial covenants relating to the Company’s operations, includingmaintaining certain financial ratios. Repayment of the credit facilities are guaranteed by the materialsubsidiaries of the Company. In addition, approval is required by the majority of the lenders when the cashconsideration of an individual acquisition exceeds 10% of consolidated stockholders’ equity of the Company.
As of March 15, 2000, the Company had a balance of approximately $279.0 million outstanding under thecredit facility. The Company also had outstanding letters of credit in the amount of $1.8 million, reducing theamount of funds available under the credit facility to approximately $219.2 million as of March 15, 2000. Aportion of the outstanding balance under the Company’s credit facility resulted from the Company’s funding ofModis. The Company funds Modis based on various needs including: purchases of furniture, equipment andleasehold improvements, acquisitions, current income tax liabilities and fluctuating working capital needs. Uponcompletion of the spin-off, Modis will repay to MPS an amount that represents the historical funding needswhich resulted from those items described above. As of December 31, 1999, approximately $105.9 million offunding was provided to Modis from MPS.
The Company has certain notes payable to shareholders of acquired companies which bear interest at ratesranging from 4.3% to 5.5% and have repayment terms from January 2000 to August 2000. As of December 31,1999, the Company owed approximately $2.2 million in such acquisition indebtedness.
INFLATION
The effects of inflation on the Company’s operations were not significant during the periods presented inthe financial statements. Generally, throughout the periods discussed above, the increases in revenue haveresulted primarily from higher volumes, rather than price increases.
RECENT ACCOUNTING PRONOUNCEMENTS
In June 1998, the Financial Accounting Standards Board issued Statement of Financial AccountingStandards (‘‘SFAS’’) No. 133, ‘‘Accounting for Derivative Instruments and for Hedging Activities.’’ SFASNo. 133 establishes accounting and reporting standards requiring that every derivative instrument be recordedon the balance sheet as either an asset or liability measured at fair value. SFAS No. 133 requires that changesin a derivative’s fair value be recognized currently in earnings unless specific hedge accounting criteria aremet. Special accounting for qualifying hedges allows a derivative’s gains and losses to offset related results
18
on the hedged item in the income statement and requires that a company formally document, designate andassess the effectiveness of transactions that receive hedge accounting. In June, 1999 the Financial AccountingStandards Board issued SFAS No. 137, an amendment to SFAS No. 133, deferring the effective date of SFASNo. 133. SFAS No. 133 is effective for all fiscal quarters of all fiscal years beginning after June 15, 2000, andcannot be applied retroactively. We have not yet quantified the impacts of adopting SFAS No. 133 on ourfinancial statements; however, SFAS No. 133 could increase the volatility of reported earnings and othercomprehensive income once adopted.
OTHER MATTERS
Year 2000 Compliance
The Year 2000 issue was the result of computer programs (whether related to IT systems or non-ITsystems) being written using two digits rather than four digits to define the applicable year. There wereconcerns that computer programs with time sensitive software might recognize a date using ‘‘00’’ as the Year1900 rather than the Year 2000. In preparation for such possibilities, the Company assembled a Year 2000compliance team to address such matters company-wide. The Company, to date, has not observed any instancesthat would indicate that the Company’s efforts in addressing the Year 2000 issue were not successful. Thefinancial impact of addressing the Year 2000 issue had no material impact on the Company’s financialcondition, results of operations or cash flows.
As to non-IT systems and vendor services, other than banking relationships and utilities (which includeselectrical power, water and related items), there is no single system or vendor service that is material to theCompany’s operations. As to banking needs, our banking relationships are primarily with large national andinternational financial institutions that addressed their own Year 2000 compliance procedures and certified theircompliance to the Company. Certain of our utility vendors certified their Year 2000 compliance to theCompany. The Company established a contingency plan, which ensured the needed back-up utility sourcesnecessary to maintain the critical information systems at the corporate headquarters. Utility failures at theCompany’s branch offices or the inability of the Company’s customers to operate, which did not occur, couldhave had a material adverse effect on revenue sources and could have disrupted customers’ payment cycle. Thecosts of Year 2000 compliance project for each matter individually and all matters in the aggregate were notmaterial to our financial condition, results of operations, or cash flows.
QUANTITATIVE AND QUALITATIVE DISCLOSURES ABOUT MARKET RISK
The following assessment of the Company’s market risks does not include uncertainties that are eithernonfinancial or nonquantifiable, such as political, economic, tax and other credit risks.
Interest Rates. The Company’s exposure to market risk for changes in interest rates relates primarily tothe Company’s short-term and long-term debt obligations and to the Company’s investments.
The Company’s investment portfolio consists of cash and cash equivalents including deposits in banks,government securities, money market funds, and short-term investments with maturities, when acquired, of 90days or less. The Company is adverse to principal loss and ensures the safety and preservation of its investedfunds by placing these funds with high credit quality issuers. The Company constantly evaluates its investedfunds to respond appropriately to a reduction in the credit rating of any investment issuer or guarantor.
The Company’s short-term and long-term debt obligations totaled $230.2 million as of December 31, 1999and the Company had $270.2 million available under its current credit facility. The debt obligations consist ofnotes payable to former shareholders of acquired corporations, are at a fixed rate of interest, and extend throughAugust 2000. The interest rate risk on these obligations is thus immaterial due to the dollar amount and fixednature of these obligations. The interest rate on the credit facility is variable.
19
Foreign currency exchange rates. Foreign currency exchange rate changes impact translations of foreigndenominated assets and liabilities into U.S. dollars and future earnings and cash flows from transactionsdenominated in different currencies. The Company generated approximately 27% of fiscal 1999 consolidatedrevenues from international operations, approximately 100% of which were from the United Kingdom. TheUnited Kingdom’s currency has not fluctuated materially against the United States dollar in fiscal 1999. SeeNote 15 to the Company’s Consolidated Financial Statements for effect of foreign currency translationadjustments on net income. The Company did not hold or enter into any foreign currency derivativeinstruments as of December 31, 1999.
The Proposed Distribution of the Information Technology Business
The distribution of the Information Technology business is subject to market and other conditions,including a determination that the distribution is tax free to the Company and its shareholders. Accordingly,there is some risk that the distribution will not take place. In such event, the price of the Company’s commonstock may decline if not distributing the Information Technology business is perceived as adversely impactingthe Company’s focus and market position. Conversely, there can be no assurance that if the proposeddistribution does occur that the price of the Company’s common stock will not decline (after taking intoaccount the value of any securities received in the distribution).
Effect of Fluctuations in the General Economy
Demand for the Company’s professional business services is significantly affected by the general level ofeconomic activity in the markets served by the Company. During periods of slowing economic activity,companies may reduce the use of outside consultants and staff augmentation services prior to undertakinglayoffs of full-time employees. As a result, any significant economic downturn could have a material adverseeffect on the Company’s results of operations or financial condition.
The Company may also be adversely effected by consolidations through mergers and otherwise of maincustomers or between major customers with non-customers. These consolidations as well as corporatedownsizings may result in redundant functions or services and a resulting reduction in demand by suchcustomers for the Company’s services. Also, spending for outsourced business services may be put on holduntil the consolidations are completed.
Competition
The Company’s industry is intensely competitive and highly fragmented, with few barriers to entry bypotential competitors. The Company faces significant competition in the markets that it serves and will facesignificant competition in any geographic market that it may enter. In each market in which the Companyoperates, it competes for both clients and qualified professionals with other firms offering similar services.Competition creates an aggressive pricing environment and higher wage costs, which puts pressure on grossmargins.
Ability to Recruit and Retain Professional Employees
The Company depends on its ability to recruit and retain employees who possess the skills, experienceand/or professional certifications necessary to meet the requirements of the Company’s clients. Competition forindividuals possessing the requisite criteria is intense, particularly in certain specialized professional skill areas.The Company often competes with its own clients in attracting and retaining qualified personnel. There can beno assurance that qualified personnel will be available and recruited in sufficient numbers on economic termsacceptable to the Company.
20
Ability to Continue Acquisition Strategy; Ability to Integrate Acquired Operations
The Company has experienced significant growth in the past through acquisitions. Although the Companycontinues to seek acquisition opportunities, there can be no assurance that the Company will be able tonegotiate acquisitions on economic terms acceptable to the Company or that the Company will be able tosuccessfully identify acquisition candidates and integrate all acquired operations into the Company.
Possible Changes in Governmental Regulations
From time to time, legislation is proposed in the United States Congress, state legislative bodies and byforeign governments that would have the effect of requiring employers to provide the same or similar employeebenefits to consultants and other temporary personnel as those provided to full-time employees. The enactmentof such legislation would eliminate one of the key economic reasons for outsourcing certain human resourcesand could significantly adversely impact the Company’s staff augmentation business. In addition, theCompany’s costs could increase as a result of future laws or regulations that address insurance, benefits orother employment-related matters. There can be no assurance that the Company could successfully pass anysuch increased costs to its clients.
ITEM 8. FINANCIAL STATEMENTS AND SUPPLEMENTARY DATA
(a) Consolidated Financial Statements: The following consolidated financial statements are included in thisAnnual Report on Form 10-K:
Report of Independent Certified Public AccountantsConsolidated Balance Sheets at December 31, 1999 and 1998Consolidated Statements of Income for the years ended December 31, 1999, 1998, and 1997Consolidated Statements of Stockholders’ Equity for the years ended December 31, 1999, 1998,
and 1997Consolidated Statements of Cash Flows for the years ended December 31, 1999, 1998, and 1997Notes to Consolidated Financial Statements
21
REPORT OF INDEPENDENT CERTIFIED PUBLIC ACCOUNTANTS
To the Board of Directors and Stockholders of Modis Professional Services, Inc.
In our opinion, the accompanying consolidated balance sheets and the related consolidated statements ofincome, of stockholders’ equity, and of cash flows present fairly, in all material respects, the financial positionof Modis Professional Services, Inc. and its Subsidiaries at December 31, 1999 and 1998, and the results oftheir operations and their cash flows for each of the three years in the period ended December 31, 1999, inconformity with accounting principles generally accepted in the United States. These financial statements arethe responsibility of the Company’s management; our responsibility is to express an opinion on these financialstatements based on our audits. We conducted our audits of these statements in accordance with auditingstandards generally accepted in the United States, which require that we plan and perform the audit to obtainreasonable assurance about whether the financial statements are free of material misstatement. An auditincludes examining, on a test basis, evidence supporting the amounts and disclosures in the financialstatements, assessing the accounting principles used and significant estimates made by management, andevaluating the overall financial statement presentation. We believe that our audits provide a reasonable basis forthe opinion expressed above.
PricewaterhouseCoopers, LLPJacksonville, FloridaMarch 30, 2000
22
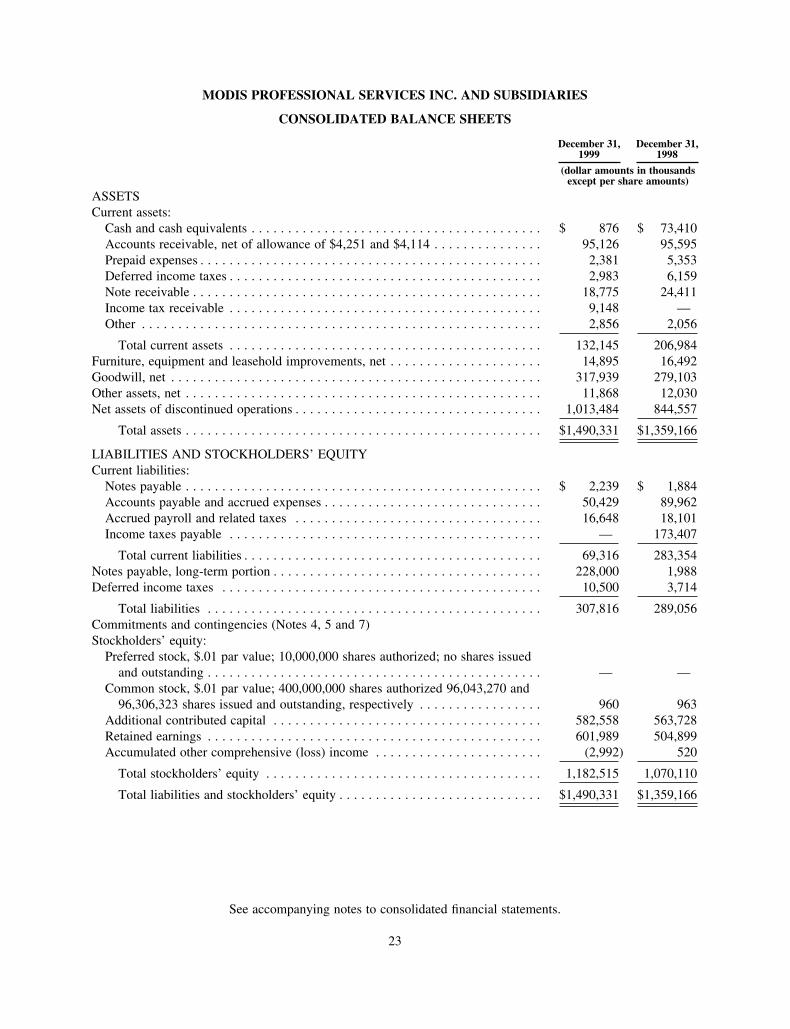
MODIS PROFESSIONAL SERVICES INC. AND SUBSIDIARIES
CONSOLIDATED BALANCE SHEETS
December 31,1999
December 31,1998
(dollar amounts in thousandsexcept per share amounts)
ASSETSCurrent assets:
Cash and cash equivalents . . . . . . . . . . . . . . . . . . . . . . . . . . . . . . . . . . . . . . . . $ 876 $ 73,410Accounts receivable, net of allowance of $4,251 and $4,114 . . . . . . . . . . . . . . . 95,126 95,595Prepaid expenses . . . . . . . . . . . . . . . . . . . . . . . . . . . . . . . . . . . . . . . . . . . . . . . 2,381 5,353Deferred income taxes . . . . . . . . . . . . . . . . . . . . . . . . . . . . . . . . . . . . . . . . . . . 2,983 6,159Note receivable . . . . . . . . . . . . . . . . . . . . . . . . . . . . . . . . . . . . . . . . . . . . . . . . 18,775 24,411Income tax receivable . . . . . . . . . . . . . . . . . . . . . . . . . . . . . . . . . . . . . . . . . . . 9,148 —Other . . . . . . . . . . . . . . . . . . . . . . . . . . . . . . . . . . . . . . . . . . . . . . . . . . . . . . . 2,856 2,056
Total current assets . . . . . . . . . . . . . . . . . . . . . . . . . . . . . . . . . . . . . . . . . . . 132,145 206,984Furniture, equipment and leasehold improvements, net . . . . . . . . . . . . . . . . . . . . . 14,895 16,492Goodwill, net . . . . . . . . . . . . . . . . . . . . . . . . . . . . . . . . . . . . . . . . . . . . . . . . . . . 317,939 279,103Other assets, net . . . . . . . . . . . . . . . . . . . . . . . . . . . . . . . . . . . . . . . . . . . . . . . . . 11,868 12,030Net assets of discontinued operations . . . . . . . . . . . . . . . . . . . . . . . . . . . . . . . . . . 1,013,484 844,557
Total assets . . . . . . . . . . . . . . . . . . . . . . . . . . . . . . . . . . . . . . . . . . . . . . . . . $1,490,331 $1,359,166
LIABILITIES AND STOCKHOLDERS’ EQUITYCurrent liabilities:
Notes payable . . . . . . . . . . . . . . . . . . . . . . . . . . . . . . . . . . . . . . . . . . . . . . . . . $ 2,239 $ 1,884Accounts payable and accrued expenses . . . . . . . . . . . . . . . . . . . . . . . . . . . . . . 50,429 89,962Accrued payroll and related taxes . . . . . . . . . . . . . . . . . . . . . . . . . . . . . . . . . . 16,648 18,101Income taxes payable . . . . . . . . . . . . . . . . . . . . . . . . . . . . . . . . . . . . . . . . . . . — 173,407
Total current liabilities . . . . . . . . . . . . . . . . . . . . . . . . . . . . . . . . . . . . . . . . . 69,316 283,354Notes payable, long-term portion . . . . . . . . . . . . . . . . . . . . . . . . . . . . . . . . . . . . . 228,000 1,988Deferred income taxes . . . . . . . . . . . . . . . . . . . . . . . . . . . . . . . . . . . . . . . . . . . . 10,500 3,714
Total liabilities . . . . . . . . . . . . . . . . . . . . . . . . . . . . . . . . . . . . . . . . . . . . . . 307,816 289,056Commitments and contingencies (Notes 4, 5 and 7)Stockholders’ equity:
Preferred stock, $.01 par value; 10,000,000 shares authorized; no shares issuedand outstanding . . . . . . . . . . . . . . . . . . . . . . . . . . . . . . . . . . . . . . . . . . . . . . — —
Common stock, $.01 par value; 400,000,000 shares authorized 96,043,270 and96,306,323 shares issued and outstanding, respectively . . . . . . . . . . . . . . . . . 960 963
Additional contributed capital . . . . . . . . . . . . . . . . . . . . . . . . . . . . . . . . . . . . . 582,558 563,728Retained earnings . . . . . . . . . . . . . . . . . . . . . . . . . . . . . . . . . . . . . . . . . . . . . . 601,989 504,899Accumulated other comprehensive (loss) income . . . . . . . . . . . . . . . . . . . . . . . (2,992) 520
Total stockholders’ equity . . . . . . . . . . . . . . . . . . . . . . . . . . . . . . . . . . . . . . 1,182,515 1,070,110
Total liabilities and stockholders’ equity . . . . . . . . . . . . . . . . . . . . . . . . . . . . $1,490,331 $1,359,166
See accompanying notes to consolidated financial statements.
23
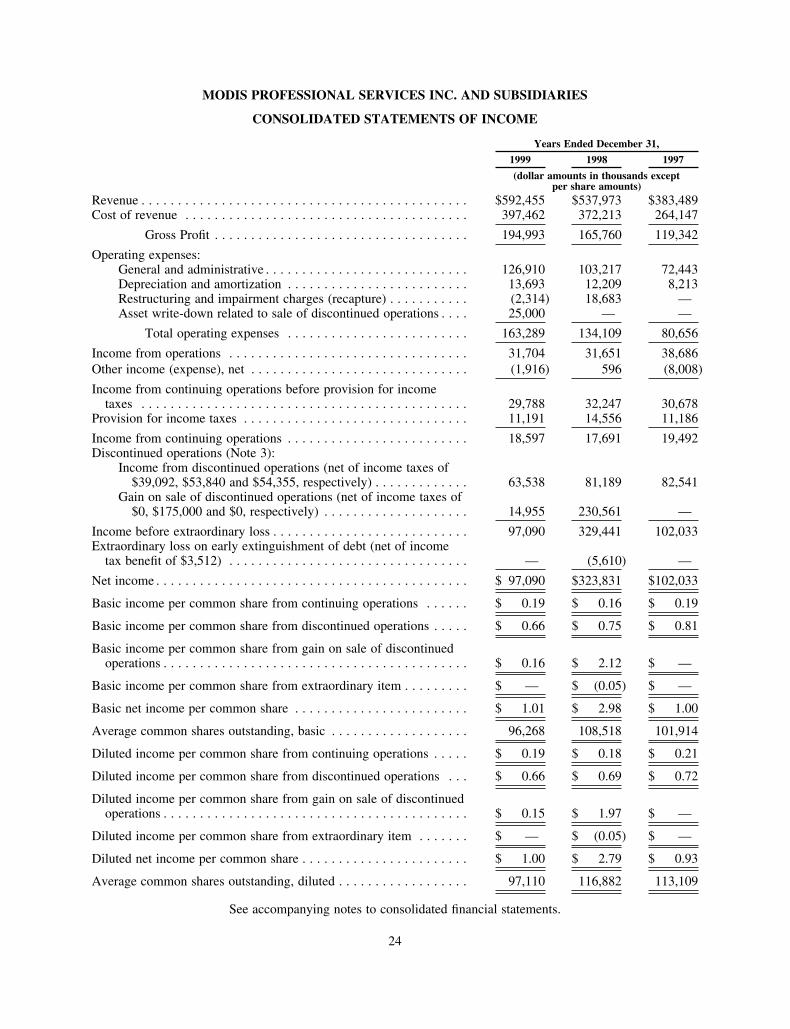
MODIS PROFESSIONAL SERVICES INC. AND SUBSIDIARIES
CONSOLIDATED STATEMENTS OF INCOME
Years Ended December 31,
1999 1998 1997
(dollar amounts in thousands exceptper share amounts)
Revenue . . . . . . . . . . . . . . . . . . . . . . . . . . . . . . . . . . . . . . . . . . . . . $592,455 $537,973 $383,489Cost of revenue . . . . . . . . . . . . . . . . . . . . . . . . . . . . . . . . . . . . . . . 397,462 372,213 264,147
Gross Profit . . . . . . . . . . . . . . . . . . . . . . . . . . . . . . . . . . . 194,993 165,760 119,342
Operating expenses:General and administrative . . . . . . . . . . . . . . . . . . . . . . . . . . . . 126,910 103,217 72,443Depreciation and amortization . . . . . . . . . . . . . . . . . . . . . . . . . 13,693 12,209 8,213Restructuring and impairment charges (recapture) . . . . . . . . . . . (2,314) 18,683 —Asset write-down related to sale of discontinued operations . . . . 25,000 — —
Total operating expenses . . . . . . . . . . . . . . . . . . . . . . . . . 163,289 134,109 80,656
Income from operations . . . . . . . . . . . . . . . . . . . . . . . . . . . . . . . . . 31,704 31,651 38,686Other income (expense), net . . . . . . . . . . . . . . . . . . . . . . . . . . . . . . (1,916) 596 (8,008)
Income from continuing operations before provision for incometaxes . . . . . . . . . . . . . . . . . . . . . . . . . . . . . . . . . . . . . . . . . . . . . 29,788 32,247 30,678
Provision for income taxes . . . . . . . . . . . . . . . . . . . . . . . . . . . . . . . 11,191 14,556 11,186
Income from continuing operations . . . . . . . . . . . . . . . . . . . . . . . . . 18,597 17,691 19,492Discontinued operations (Note 3):
Income from discontinued operations (net of income taxes of$39,092, $53,840 and $54,355, respectively) . . . . . . . . . . . . . 63,538 81,189 82,541
Gain on sale of discontinued operations (net of income taxes of$0, $175,000 and $0, respectively) . . . . . . . . . . . . . . . . . . . . 14,955 230,561 —
Income before extraordinary loss . . . . . . . . . . . . . . . . . . . . . . . . . . . 97,090 329,441 102,033Extraordinary loss on early extinguishment of debt (net of income
tax benefit of $3,512) . . . . . . . . . . . . . . . . . . . . . . . . . . . . . . . . . — (5,610) —
Net income . . . . . . . . . . . . . . . . . . . . . . . . . . . . . . . . . . . . . . . . . . . $ 97,090 $323,831 $102,033
Basic income per common share from continuing operations . . . . . . $ 0.19 $ 0.16 $ 0.19
Basic income per common share from discontinued operations . . . . . $ 0.66 $ 0.75 $ 0.81
Basic income per common share from gain on sale of discontinuedoperations . . . . . . . . . . . . . . . . . . . . . . . . . . . . . . . . . . . . . . . . . . $ 0.16 $ 2.12 $ —
Basic income per common share from extraordinary item . . . . . . . . . $ — $ (0.05) $ —
Basic net income per common share . . . . . . . . . . . . . . . . . . . . . . . . $ 1.01 $ 2.98 $ 1.00
Average common shares outstanding, basic . . . . . . . . . . . . . . . . . . . 96,268 108,518 101,914
Diluted income per common share from continuing operations . . . . . $ 0.19 $ 0.18 $ 0.21
Diluted income per common share from discontinued operations . . . $ 0.66 $ 0.69 $ 0.72
Diluted income per common share from gain on sale of discontinuedoperations . . . . . . . . . . . . . . . . . . . . . . . . . . . . . . . . . . . . . . . . . . $ 0.15 $ 1.97 $ —
Diluted income per common share from extraordinary item . . . . . . . $ — $ (0.05) $ —
Diluted net income per common share . . . . . . . . . . . . . . . . . . . . . . . $ 1.00 $ 2.79 $ 0.93
Average common shares outstanding, diluted . . . . . . . . . . . . . . . . . . 97,110 116,882 113,109
See accompanying notes to consolidated financial statements.
24
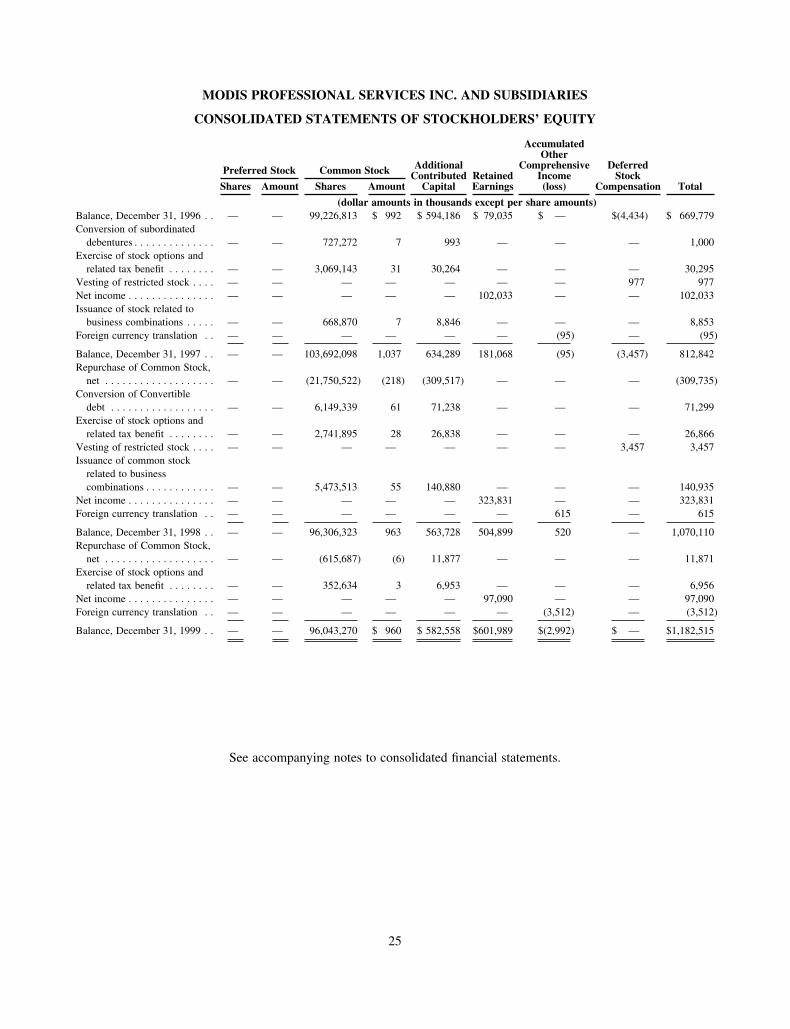
MODIS PROFESSIONAL SERVICES INC. AND SUBSIDIARIES
CONSOLIDATED STATEMENTS OF STOCKHOLDERS’ EQUITY
Preferred Stock Common Stock AdditionalContributed
CapitalRetainedEarnings
AccumulatedOther
ComprehensiveIncome(loss)
DeferredStock
Compensation TotalShares Amount Shares Amount
(dollar amounts in thousands except per share amounts)Balance, December 31, 1996 . . — — 99,226,813 $ 992 $ 594,186 $ 79,035 $ — $(4,434) $ 669,779Conversion of subordinated
debentures . . . . . . . . . . . . . . — — 727,272 7 993 — — — 1,000Exercise of stock options and
related tax benefit . . . . . . . . — — 3,069,143 31 30,264 — — — 30,295Vesting of restricted stock . . . . — — — — — — — 977 977Net income . . . . . . . . . . . . . . . — — — — — 102,033 — — 102,033Issuance of stock related to
business combinations . . . . . — — 668,870 7 8,846 — — — 8,853Foreign currency translation . . — — — — — — (95) — (95)
Balance, December 31, 1997 . . — — 103,692,098 1,037 634,289 181,068 (95) (3,457) 812,842Repurchase of Common Stock,
net . . . . . . . . . . . . . . . . . . . — — (21,750,522) (218) (309,517) — — — (309,735)Conversion of Convertible
debt . . . . . . . . . . . . . . . . . . — — 6,149,339 61 71,238 — — — 71,299Exercise of stock options and
related tax benefit . . . . . . . . — — 2,741,895 28 26,838 — — — 26,866Vesting of restricted stock . . . . — — — — — — — 3,457 3,457Issuance of common stock
related to businesscombinations . . . . . . . . . . . . — — 5,473,513 55 140,880 — — — 140,935
Net income . . . . . . . . . . . . . . . — — — — — 323,831 — — 323,831Foreign currency translation . . — — — — — — 615 — 615
Balance, December 31, 1998 . . — — 96,306,323 963 563,728 504,899 520 — 1,070,110Repurchase of Common Stock,
net . . . . . . . . . . . . . . . . . . . — — (615,687) (6) 11,877 — — — 11,871Exercise of stock options and
related tax benefit . . . . . . . . — — 352,634 3 6,953 — — — 6,956Net income . . . . . . . . . . . . . . . — — — — — 97,090 — — 97,090Foreign currency translation . . — — — — — — (3,512) — (3,512)
Balance, December 31, 1999 . . — — 96,043,270 $ 960 $ 582,558 $601,989 $(2,992) $ — $1,182,515
See accompanying notes to consolidated financial statements.
25
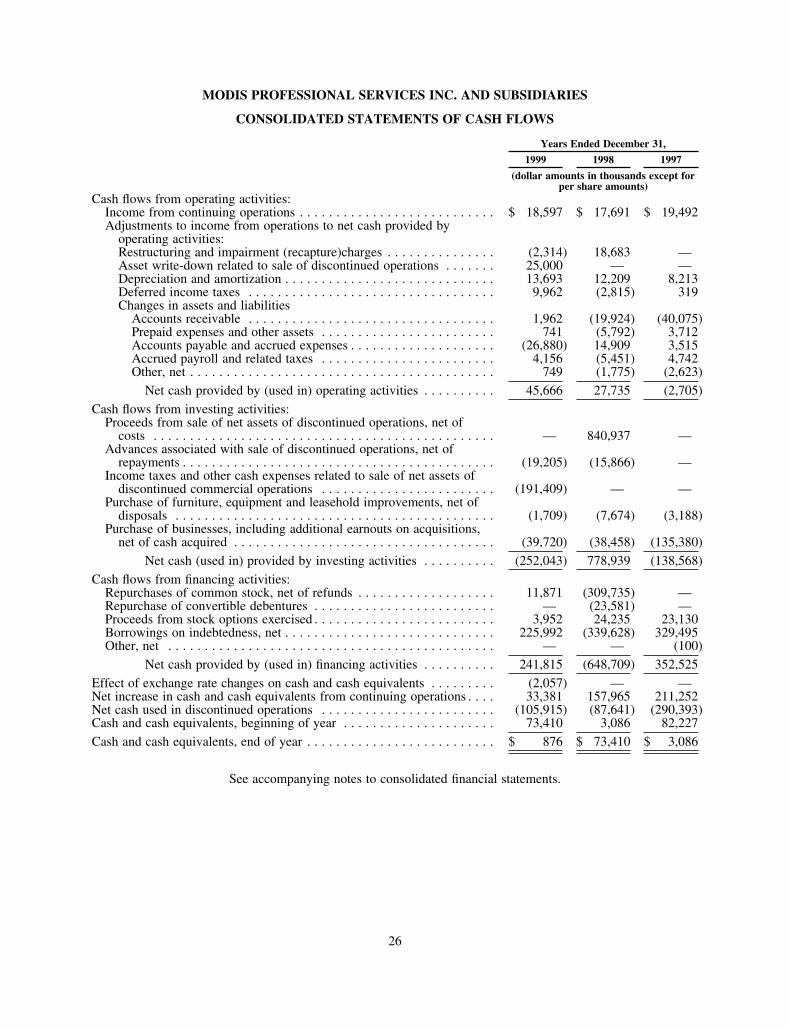
MODIS PROFESSIONAL SERVICES INC. AND SUBSIDIARIES
CONSOLIDATED STATEMENTS OF CASH FLOWS
Years Ended December 31,
1999 1998 1997
(dollar amounts in thousands except forper share amounts)
Cash flows from operating activities:Income from continuing operations . . . . . . . . . . . . . . . . . . . . . . . . . . . $ 18,597 $ 17,691 $ 19,492Adjustments to income from operations to net cash provided by
operating activities:Restructuring and impairment (recapture)charges . . . . . . . . . . . . . . . (2,314) 18,683 —Asset write-down related to sale of discontinued operations . . . . . . . 25,000 — —Depreciation and amortization . . . . . . . . . . . . . . . . . . . . . . . . . . . . . 13,693 12,209 8,213Deferred income taxes . . . . . . . . . . . . . . . . . . . . . . . . . . . . . . . . . . 9,962 (2,815) 319Changes in assets and liabilities
Accounts receivable . . . . . . . . . . . . . . . . . . . . . . . . . . . . . . . . . . 1,962 (19,924) (40,075)Prepaid expenses and other assets . . . . . . . . . . . . . . . . . . . . . . . . 741 (5,792) 3,712Accounts payable and accrued expenses . . . . . . . . . . . . . . . . . . . . (26,880) 14,909 3,515Accrued payroll and related taxes . . . . . . . . . . . . . . . . . . . . . . . . 4,156 (5,451) 4,742Other, net . . . . . . . . . . . . . . . . . . . . . . . . . . . . . . . . . . . . . . . . . . 749 (1,775) (2,623)
Net cash provided by (used in) operating activities . . . . . . . . . . 45,666 27,735 (2,705)
Cash flows from investing activities:Proceeds from sale of net assets of discontinued operations, net of
costs . . . . . . . . . . . . . . . . . . . . . . . . . . . . . . . . . . . . . . . . . . . . . . . — 840,937 —Advances associated with sale of discontinued operations, net of
repayments . . . . . . . . . . . . . . . . . . . . . . . . . . . . . . . . . . . . . . . . . . . (19,205) (15,866) —Income taxes and other cash expenses related to sale of net assets of
discontinued commercial operations . . . . . . . . . . . . . . . . . . . . . . . . (191,409) — —Purchase of furniture, equipment and leasehold improvements, net of
disposals . . . . . . . . . . . . . . . . . . . . . . . . . . . . . . . . . . . . . . . . . . . . (1,709) (7,674) (3,188)Purchase of businesses, including additional earnouts on acquisitions,
net of cash acquired . . . . . . . . . . . . . . . . . . . . . . . . . . . . . . . . . . . . (39,720) (38,458) (135,380)
Net cash (used in) provided by investing activities . . . . . . . . . . (252,043) 778,939 (138,568)
Cash flows from financing activities:Repurchases of common stock, net of refunds . . . . . . . . . . . . . . . . . . . 11,871 (309,735) —Repurchase of convertible debentures . . . . . . . . . . . . . . . . . . . . . . . . . — (23,581) —Proceeds from stock options exercised . . . . . . . . . . . . . . . . . . . . . . . . . 3,952 24,235 23,130Borrowings on indebtedness, net . . . . . . . . . . . . . . . . . . . . . . . . . . . . . 225,992 (339,628) 329,495Other, net . . . . . . . . . . . . . . . . . . . . . . . . . . . . . . . . . . . . . . . . . . . . . — — (100)
Net cash provided by (used in) financing activities . . . . . . . . . . 241,815 (648,709) 352,525
Effect of exchange rate changes on cash and cash equivalents . . . . . . . . . (2,057) — —Net increase in cash and cash equivalents from continuing operations . . . . 33,381 157,965 211,252Net cash used in discontinued operations . . . . . . . . . . . . . . . . . . . . . . . . (105,915) (87,641) (290,393)Cash and cash equivalents, beginning of year . . . . . . . . . . . . . . . . . . . . . 73,410 3,086 82,227
Cash and cash equivalents, end of year . . . . . . . . . . . . . . . . . . . . . . . . . . $ 876 $ 73,410 $ 3,086
See accompanying notes to consolidated financial statements.
26
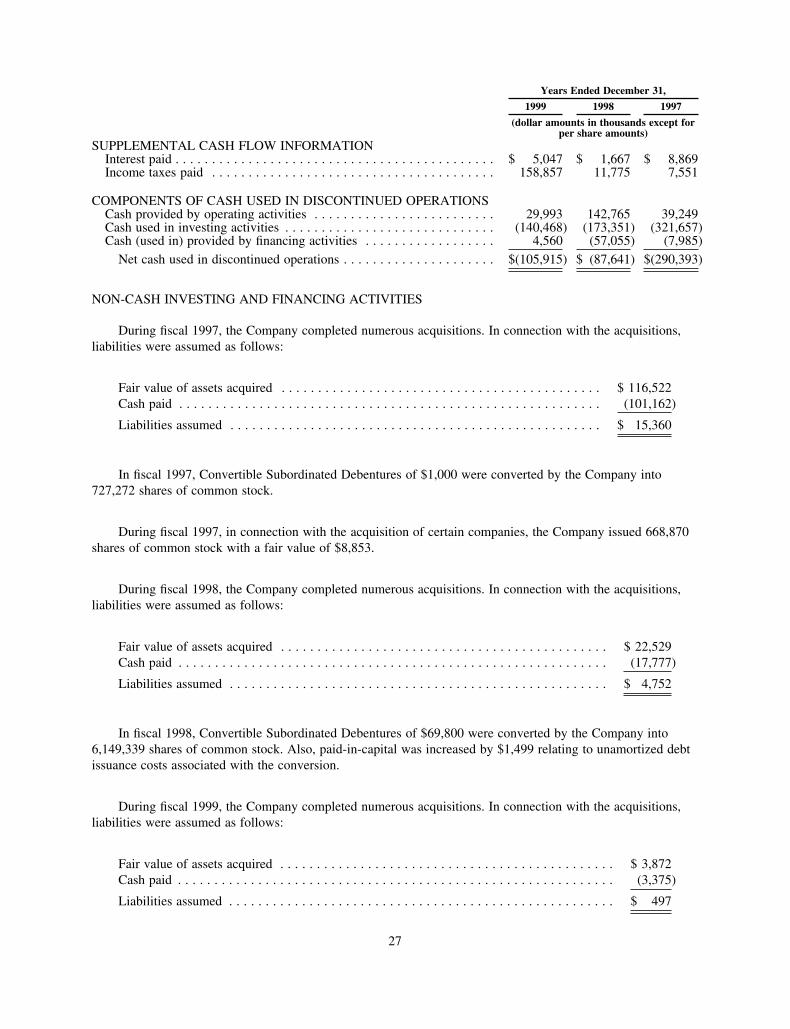
Years Ended December 31,
1999 1998 1997
(dollar amounts in thousands except forper share amounts)
SUPPLEMENTAL CASH FLOW INFORMATIONInterest paid . . . . . . . . . . . . . . . . . . . . . . . . . . . . . . . . . . . . . . . . . . . . $ 5,047 $ 1,667 $ 8,869Income taxes paid . . . . . . . . . . . . . . . . . . . . . . . . . . . . . . . . . . . . . . . 158,857 11,775 7,551
COMPONENTS OF CASH USED IN DISCONTINUED OPERATIONSCash provided by operating activities . . . . . . . . . . . . . . . . . . . . . . . . . 29,993 142,765 39,249Cash used in investing activities . . . . . . . . . . . . . . . . . . . . . . . . . . . . . (140,468) (173,351) (321,657)Cash (used in) provided by financing activities . . . . . . . . . . . . . . . . . . 4,560 (57,055) (7,985)
Net cash used in discontinued operations . . . . . . . . . . . . . . . . . . . . . $(105,915) $ (87,641) $(290,393)
NON-CASH INVESTING AND FINANCING ACTIVITIES
During fiscal 1997, the Company completed numerous acquisitions. In connection with the acquisitions,liabilities were assumed as follows:
Fair value of assets acquired . . . . . . . . . . . . . . . . . . . . . . . . . . . . . . . . . . . . . . . . . . . . $ 116,522Cash paid . . . . . . . . . . . . . . . . . . . . . . . . . . . . . . . . . . . . . . . . . . . . . . . . . . . . . . . . . . (101,162)
Liabilities assumed . . . . . . . . . . . . . . . . . . . . . . . . . . . . . . . . . . . . . . . . . . . . . . . . . . . $ 15,360
In fiscal 1997, Convertible Subordinated Debentures of $1,000 were converted by the Company into727,272 shares of common stock.
During fiscal 1997, in connection with the acquisition of certain companies, the Company issued 668,870shares of common stock with a fair value of $8,853.
During fiscal 1998, the Company completed numerous acquisitions. In connection with the acquisitions,liabilities were assumed as follows:
Fair value of assets acquired . . . . . . . . . . . . . . . . . . . . . . . . . . . . . . . . . . . . . . . . . . . . . $ 22,529Cash paid . . . . . . . . . . . . . . . . . . . . . . . . . . . . . . . . . . . . . . . . . . . . . . . . . . . . . . . . . . . (17,777)
Liabilities assumed . . . . . . . . . . . . . . . . . . . . . . . . . . . . . . . . . . . . . . . . . . . . . . . . . . . . $ 4,752
In fiscal 1998, Convertible Subordinated Debentures of $69,800 were converted by the Company into6,149,339 shares of common stock. Also, paid-in-capital was increased by $1,499 relating to unamortized debtissuance costs associated with the conversion.
During fiscal 1999, the Company completed numerous acquisitions. In connection with the acquisitions,liabilities were assumed as follows:
Fair value of assets acquired . . . . . . . . . . . . . . . . . . . . . . . . . . . . . . . . . . . . . . . . . . . . . . $ 3,872Cash paid . . . . . . . . . . . . . . . . . . . . . . . . . . . . . . . . . . . . . . . . . . . . . . . . . . . . . . . . . . . . (3,375)
Liabilities assumed . . . . . . . . . . . . . . . . . . . . . . . . . . . . . . . . . . . . . . . . . . . . . . . . . . . . . $ 497
27
MODIS PROFESSIONAL SERVICES INC. AND SUBSIDIARIES
NOTES TO CONSOLIDATED FINANCIAL STATEMENTS
1. DESCRIPTION OF BUSINESS
Modis Professional Services, Inc. (‘‘MPS’’ or the ‘‘Company’’) is an international provider ofprofessional business services, including consulting, outsourcing, training and strategic human resourcesolutions, to Fortune 1000 and other leading businesses. The Company provides professional personnel whoperform specialized services such as accounting, legal, technical/engineering, scientific, Project Consulting andcareer management and consulting.
2. SUMMARY OF SIGNIFICANT ACCOUNTING POLICIES
Basis of Presentation and Consolidation
The consolidated financial statements include the accounts of the Company and its wholly ownedsubsidiaries. All material intercompany transactions have been eliminated in the accompanying consolidatedfinancial statements.
Cash and Cash Equivalents
Cash and cash equivalents include deposits in banks, government securities, money market funds, andshort-term investments with maturities, when acquired, of 90 days or less.
Furniture, Equipment, and Leasehold Improvements
Furniture, equipment, and leasehold improvements are recorded at cost less accumulated depreciation.Depreciation of furniture and equipment is computed using the straight-line method over the estimated usefullives of the assets, ranging from 5 to 15 years. Amortization of leasehold improvements is computed using thestraight-line method over the useful life of the asset or the term of the lease, whichever is shorter. Totaldepreciation and amortization expense was $4.6, $4.1 and $2.3 for 1999, 1998 and 1997, respectively.Accumulated depreciation of furniture, equipment and leasehold improvements as of December 31, 1999 and1998 was $18,312 and $18,258, respectively.
Goodwill
The Company has allocated the purchase price of acquired companies according to the fair market valueof the assets acquired. Goodwill represents the excess of the cost over the fair value of the net tangible assetsacquired through these acquisitions, including any contingent consideration paid (as discussed in Note 4 to theConsolidated Financial Statements), and is being amortized on a straight-line basis over periods ranging from15 to 40 years, with an average amortization period of 32.3 years. Management periodically reviews thepotential impairment of goodwill on an undiscounted cash flow basis to assess recoverability. If the estimatedfuture cash flows are projected to be less than the carrying amount, an impairment write-down (representing thecarrying amount of the goodwill that exceeds the undiscounted expected future cash flows) would be recordedas a period expense. Accumulated amortization was $26,200 and $17,063 as of December 31, 1999 and 1998,respectively. See Note 13 for a discussion of goodwill impairment charge.
28
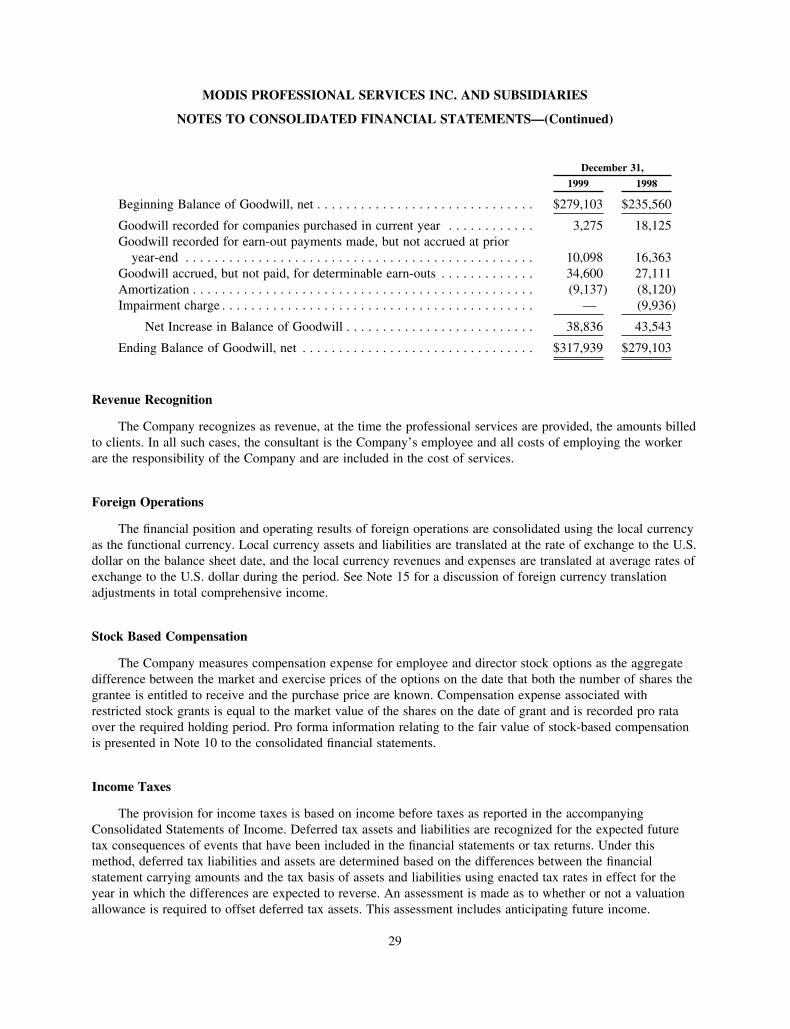
December 31,
1999 1998
Beginning Balance of Goodwill, net . . . . . . . . . . . . . . . . . . . . . . . . . . . . . . $279,103 $235,560
Goodwill recorded for companies purchased in current year . . . . . . . . . . . . 3,275 18,125Goodwill recorded for earn-out payments made, but not accrued at prior
year-end . . . . . . . . . . . . . . . . . . . . . . . . . . . . . . . . . . . . . . . . . . . . . . . . 10,098 16,363Goodwill accrued, but not paid, for determinable earn-outs . . . . . . . . . . . . . 34,600 27,111Amortization . . . . . . . . . . . . . . . . . . . . . . . . . . . . . . . . . . . . . . . . . . . . . . . (9,137) (8,120)Impairment charge . . . . . . . . . . . . . . . . . . . . . . . . . . . . . . . . . . . . . . . . . . . — (9,936)
Net Increase in Balance of Goodwill . . . . . . . . . . . . . . . . . . . . . . . . . . 38,836 43,543
Ending Balance of Goodwill, net . . . . . . . . . . . . . . . . . . . . . . . . . . . . . . . . $317,939 $279,103
Revenue Recognition
The Company recognizes as revenue, at the time the professional services are provided, the amounts billedto clients. In all such cases, the consultant is the Company’s employee and all costs of employing the workerare the responsibility of the Company and are included in the cost of services.
Foreign Operations
The financial position and operating results of foreign operations are consolidated using the local currencyas the functional currency. Local currency assets and liabilities are translated at the rate of exchange to the U.S.dollar on the balance sheet date, and the local currency revenues and expenses are translated at average rates ofexchange to the U.S. dollar during the period. See Note 15 for a discussion of foreign currency translationadjustments in total comprehensive income.
Stock Based Compensation
The Company measures compensation expense for employee and director stock options as the aggregatedifference between the market and exercise prices of the options on the date that both the number of shares thegrantee is entitled to receive and the purchase price are known. Compensation expense associated withrestricted stock grants is equal to the market value of the shares on the date of grant and is recorded pro rataover the required holding period. Pro forma information relating to the fair value of stock-based compensationis presented in Note 10 to the consolidated financial statements.
Income Taxes
The provision for income taxes is based on income before taxes as reported in the accompanyingConsolidated Statements of Income. Deferred tax assets and liabilities are recognized for the expected futuretax consequences of events that have been included in the financial statements or tax returns. Under thismethod, deferred tax liabilities and assets are determined based on the differences between the financialstatement carrying amounts and the tax basis of assets and liabilities using enacted tax rates in effect for theyear in which the differences are expected to reverse. An assessment is made as to whether or not a valuationallowance is required to offset deferred tax assets. This assessment includes anticipating future income.
MODIS PROFESSIONAL SERVICES INC. AND SUBSIDIARIES
NOTES TO CONSOLIDATED FINANCIAL STATEMENTS—(Continued)
29
Net Income Per Common Share
The financial statements include ‘‘basic’’ and ‘‘diluted’’ per share information. Basic per shareinformation is calculated by dividing net income by the weighted average number of shares outstanding.Diluted per share information is calculated by also considering the impact of potential common stock on bothnet income and the weighted average number of shares outstanding. The weighted average number of sharesused in the basic earnings per share computations were 96.3 million, 108.5 million, and 101.9 million in fiscal1999, 1998 and 1997, respectively. The only difference in the computation of basic and diluted earnings pershare is the inclusion of 0.8 million, 8.4 million, and 11.2 million potential common shares in fiscal 1999, 1998and 1997, respectively. The Company’s potential common stock consists of employee and director stockoptions, and the as-if converted effect of convertible debentures.
Pervasiveness of Estimates
The preparation of financial statements in conformity with generally accepted accounting principlesrequires management to make estimates and assumptions that affect the reported amount of assets and liabilitiesand disclosure of contingent assets and liabilities at the date of the financial statements and the reportedamounts of revenue and expenses during the reporting period. Although management believes these estimatesand assumptions are adequate, actual results may differ from the estimates and assumptions used.
Reclassifications
Certain amounts have been reclassified in 1997 and 1998 to conform to the 1999 presentation.
Recent Accounting Pronouncements
In June 1998, the Financial Accounting Standards Board issued Statement of Financial AccountingStandards (‘‘SFAS’’) No. 133, ‘‘Accounting for Derivative Instruments and for Hedging Activities.’’ SFASNo. 133 establishes accounting and reporting standards requiring that every derivative instrument be recordedon the balance sheet as either an asset or liability measured at fair value. SFAS No. 133 requires that changesin a derivative’s fair value be recognized currently in earnings unless specific hedge accounting criteria are met.Special accounting for qualifying hedges allows a derivative’s gains and losses to offset related results on thehedged item in the income statement and requires that a company formally document, designate and assess theeffectiveness of transactions that receive hedge accounting. In June 1999, the Financial Accounting StandardsBoard issued SFAS No. 137, an amendment to SFAS No. 133, deferring the effective date of SFAS No. 133.SFAS No. 133 is effective for all fiscal quarters of all fiscal years beginning after June 15, 2000, and cannot beapplied retroactively. The Company has not yet quantified the impacts of adopting SFAS No. 133; however,SFAS No. 133 could increase the volatility of reported earnings and other comprehensive income once adopted.
3. DISCONTINUED OPERATIONS
Effective September 27, 1998 and March 30, 1998, the Company sold its Commercial operations andTeleservices division and the operations and certain assets of its Health Care division, respectively, (jointly the‘‘Commercial Businesses’’). During 1999, the Company’s Board of Directors approved a plan in which theCompany would spin-off its Information Technology operations (‘‘IT Business’’) to its shareholders in theform of a stock dividend during 2000. This distribution is subject to a favorable private letter ruling from theInternal Revenue Service. As a result, the Commercial and IT Businesses have been reported as a discontinuedoperation and the consolidated financial statements have been reclassified to segregate the net assets and
MODIS PROFESSIONAL SERVICES INC. AND SUBSIDIARIES
NOTES TO CONSOLIDATED FINANCIAL STATEMENTS—(Continued)
30
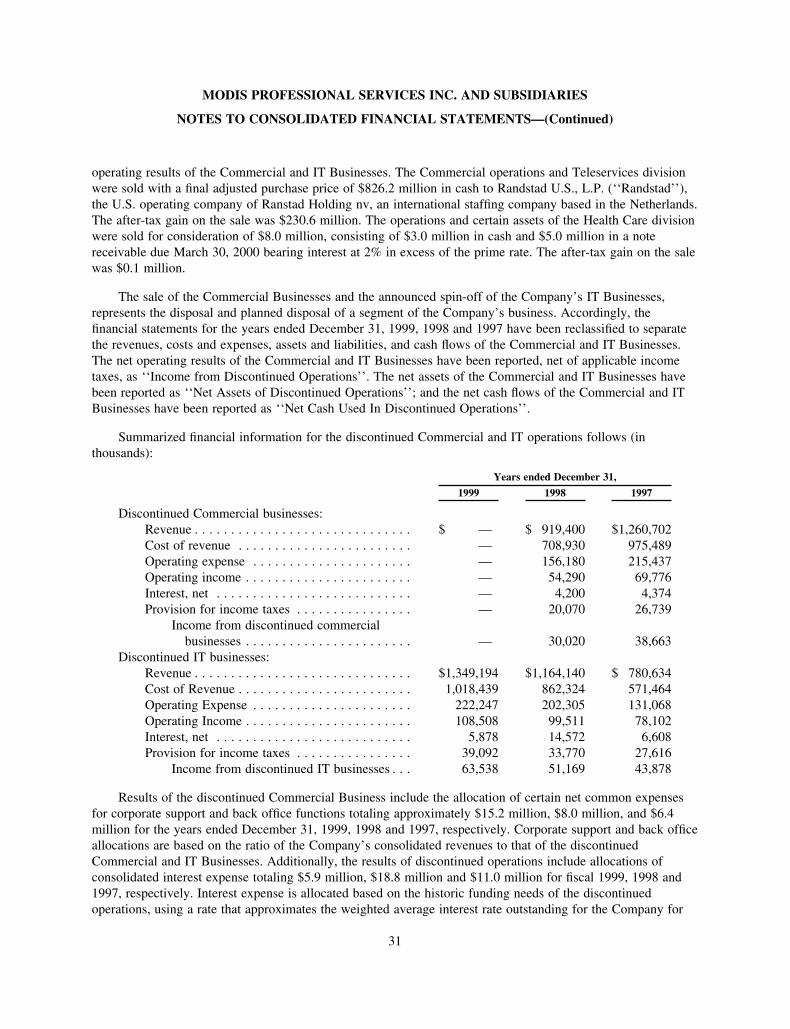
operating results of the Commercial and IT Businesses. The Commercial operations and Teleservices divisionwere sold with a final adjusted purchase price of $826.2 million in cash to Randstad U.S., L.P. (‘‘Randstad’’),the U.S. operating company of Ranstad Holding nv, an international staffing company based in the Netherlands.The after-tax gain on the sale was $230.6 million. The operations and certain assets of the Health Care divisionwere sold for consideration of $8.0 million, consisting of $3.0 million in cash and $5.0 million in a notereceivable due March 30, 2000 bearing interest at 2% in excess of the prime rate. The after-tax gain on the salewas $0.1 million.
The sale of the Commercial Businesses and the announced spin-off of the Company’s IT Businesses,represents the disposal and planned disposal of a segment of the Company’s business. Accordingly, thefinancial statements for the years ended December 31, 1999, 1998 and 1997 have been reclassified to separatethe revenues, costs and expenses, assets and liabilities, and cash flows of the Commercial and IT Businesses.The net operating results of the Commercial and IT Businesses have been reported, net of applicable incometaxes, as ‘‘Income from Discontinued Operations’’. The net assets of the Commercial and IT Businesses havebeen reported as ‘‘Net Assets of Discontinued Operations’’; and the net cash flows of the Commercial and ITBusinesses have been reported as ‘‘Net Cash Used In Discontinued Operations’’.
Summarized financial information for the discontinued Commercial and IT operations follows (inthousands):
Years ended December 31,
1999 1998 1997
Discontinued Commercial businesses:Revenue . . . . . . . . . . . . . . . . . . . . . . . . . . . . . . $ — $ 919,400 $1,260,702Cost of revenue . . . . . . . . . . . . . . . . . . . . . . . . — 708,930 975,489Operating expense . . . . . . . . . . . . . . . . . . . . . . — 156,180 215,437Operating income . . . . . . . . . . . . . . . . . . . . . . . — 54,290 69,776Interest, net . . . . . . . . . . . . . . . . . . . . . . . . . . . — 4,200 4,374Provision for income taxes . . . . . . . . . . . . . . . . — 20,070 26,739
Income from discontinued commercialbusinesses . . . . . . . . . . . . . . . . . . . . . . . — 30,020 38,663
Discontinued IT businesses:Revenue . . . . . . . . . . . . . . . . . . . . . . . . . . . . . . $1,349,194 $1,164,140 $ 780,634Cost of Revenue . . . . . . . . . . . . . . . . . . . . . . . . 1,018,439 862,324 571,464Operating Expense . . . . . . . . . . . . . . . . . . . . . . 222,247 202,305 131,068Operating Income . . . . . . . . . . . . . . . . . . . . . . . 108,508 99,511 78,102Interest, net . . . . . . . . . . . . . . . . . . . . . . . . . . . 5,878 14,572 6,608Provision for income taxes . . . . . . . . . . . . . . . . 39,092 33,770 27,616
Income from discontinued IT businesses . . . 63,538 51,169 43,878
Results of the discontinued Commercial Business include the allocation of certain net common expensesfor corporate support and back office functions totaling approximately $15.2 million, $8.0 million, and $6.4million for the years ended December 31, 1999, 1998 and 1997, respectively. Corporate support and back officeallocations are based on the ratio of the Company’s consolidated revenues to that of the discontinuedCommercial and IT Businesses. Additionally, the results of discontinued operations include allocations ofconsolidated interest expense totaling $5.9 million, $18.8 million and $11.0 million for fiscal 1999, 1998 and1997, respectively. Interest expense is allocated based on the historic funding needs of the discontinuedoperations, using a rate that approximates the weighted average interest rate outstanding for the Company for
MODIS PROFESSIONAL SERVICES INC. AND SUBSIDIARIES
NOTES TO CONSOLIDATED FINANCIAL STATEMENTS—(Continued)
31
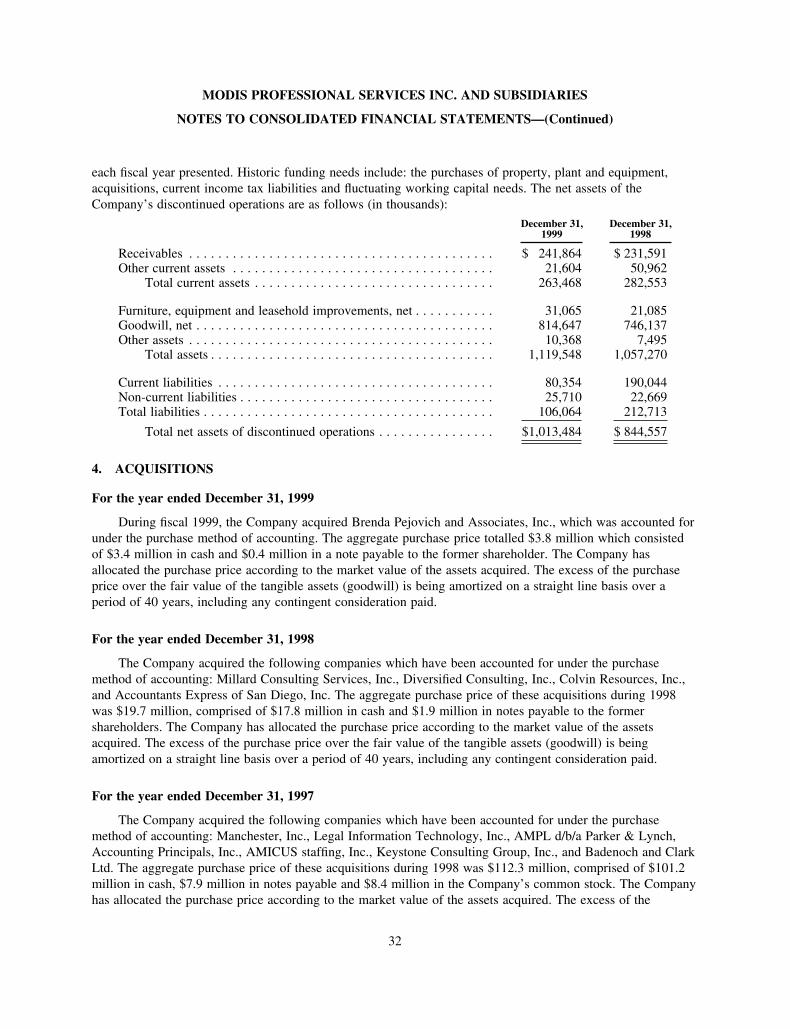
each fiscal year presented. Historic funding needs include: the purchases of property, plant and equipment,acquisitions, current income tax liabilities and fluctuating working capital needs. The net assets of theCompany’s discontinued operations are as follows (in thousands):
December 31,1999
December 31,1998
Receivables . . . . . . . . . . . . . . . . . . . . . . . . . . . . . . . . . . . . . . . . . . $ 241,864 $ 231,591Other current assets . . . . . . . . . . . . . . . . . . . . . . . . . . . . . . . . . . . . 21,604 50,962
Total current assets . . . . . . . . . . . . . . . . . . . . . . . . . . . . . . . . . 263,468 282,553
Furniture, equipment and leasehold improvements, net . . . . . . . . . . . 31,065 21,085Goodwill, net . . . . . . . . . . . . . . . . . . . . . . . . . . . . . . . . . . . . . . . . . 814,647 746,137Other assets . . . . . . . . . . . . . . . . . . . . . . . . . . . . . . . . . . . . . . . . . . 10,368 7,495
Total assets . . . . . . . . . . . . . . . . . . . . . . . . . . . . . . . . . . . . . . . 1,119,548 1,057,270
Current liabilities . . . . . . . . . . . . . . . . . . . . . . . . . . . . . . . . . . . . . . 80,354 190,044Non-current liabilities . . . . . . . . . . . . . . . . . . . . . . . . . . . . . . . . . . . 25,710 22,669Total liabilities . . . . . . . . . . . . . . . . . . . . . . . . . . . . . . . . . . . . . . . . 106,064 212,713
Total net assets of discontinued operations . . . . . . . . . . . . . . . . $1,013,484 $ 844,557
4. ACQUISITIONS
For the year ended December 31, 1999
During fiscal 1999, the Company acquired Brenda Pejovich and Associates, Inc., which was accounted forunder the purchase method of accounting. The aggregate purchase price totalled $3.8 million which consistedof $3.4 million in cash and $0.4 million in a note payable to the former shareholder. The Company hasallocated the purchase price according to the market value of the assets acquired. The excess of the purchaseprice over the fair value of the tangible assets (goodwill) is being amortized on a straight line basis over aperiod of 40 years, including any contingent consideration paid.
For the year ended December 31, 1998
The Company acquired the following companies which have been accounted for under the purchasemethod of accounting: Millard Consulting Services, Inc., Diversified Consulting, Inc., Colvin Resources, Inc.,and Accountants Express of San Diego, Inc. The aggregate purchase price of these acquisitions during 1998was $19.7 million, comprised of $17.8 million in cash and $1.9 million in notes payable to the formershareholders. The Company has allocated the purchase price according to the market value of the assetsacquired. The excess of the purchase price over the fair value of the tangible assets (goodwill) is beingamortized on a straight line basis over a period of 40 years, including any contingent consideration paid.
For the year ended December 31, 1997
The Company acquired the following companies which have been accounted for under the purchasemethod of accounting: Manchester, Inc., Legal Information Technology, Inc., AMPL d/b/a Parker & Lynch,Accounting Principals, Inc., AMICUS staffing, Inc., Keystone Consulting Group, Inc., and Badenoch and ClarkLtd. The aggregate purchase price of these acquisitions during 1998 was $112.3 million, comprised of $101.2million in cash, $7.9 million in notes payable and $8.4 million in the Company’s common stock. The Companyhas allocated the purchase price according to the market value of the assets acquired. The excess of the
MODIS PROFESSIONAL SERVICES INC. AND SUBSIDIARIES
NOTES TO CONSOLIDATED FINANCIAL STATEMENTS—(Continued)
32
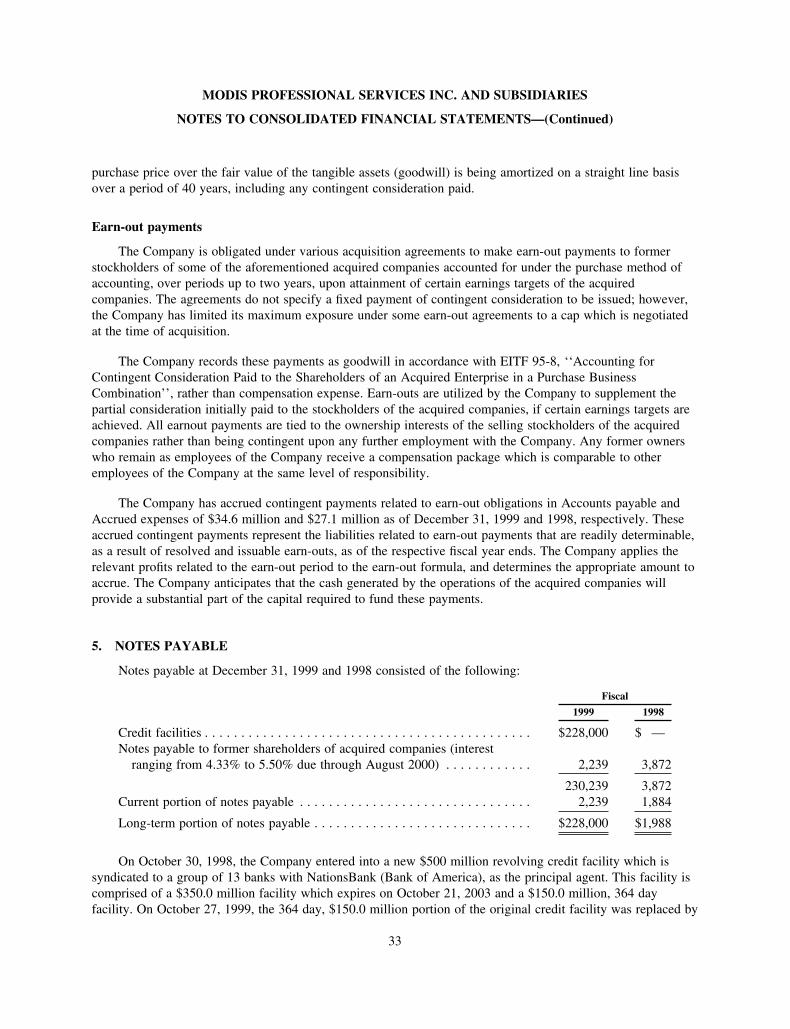
purchase price over the fair value of the tangible assets (goodwill) is being amortized on a straight line basisover a period of 40 years, including any contingent consideration paid.
Earn-out payments
The Company is obligated under various acquisition agreements to make earn-out payments to formerstockholders of some of the aforementioned acquired companies accounted for under the purchase method ofaccounting, over periods up to two years, upon attainment of certain earnings targets of the acquiredcompanies. The agreements do not specify a fixed payment of contingent consideration to be issued; however,the Company has limited its maximum exposure under some earn-out agreements to a cap which is negotiatedat the time of acquisition.
The Company records these payments as goodwill in accordance with EITF 95-8, ‘‘Accounting forContingent Consideration Paid to the Shareholders of an Acquired Enterprise in a Purchase BusinessCombination’’, rather than compensation expense. Earn-outs are utilized by the Company to supplement thepartial consideration initially paid to the stockholders of the acquired companies, if certain earnings targets areachieved. All earnout payments are tied to the ownership interests of the selling stockholders of the acquiredcompanies rather than being contingent upon any further employment with the Company. Any former ownerswho remain as employees of the Company receive a compensation package which is comparable to otheremployees of the Company at the same level of responsibility.
The Company has accrued contingent payments related to earn-out obligations in Accounts payable andAccrued expenses of $34.6 million and $27.1 million as of December 31, 1999 and 1998, respectively. Theseaccrued contingent payments represent the liabilities related to earn-out payments that are readily determinable,as a result of resolved and issuable earn-outs, as of the respective fiscal year ends. The Company applies therelevant profits related to the earn-out period to the earn-out formula, and determines the appropriate amount toaccrue. The Company anticipates that the cash generated by the operations of the acquired companies willprovide a substantial part of the capital required to fund these payments.
5. NOTES PAYABLE
Notes payable at December 31, 1999 and 1998 consisted of the following:
Fiscal
1999 1998
Credit facilities . . . . . . . . . . . . . . . . . . . . . . . . . . . . . . . . . . . . . . . . . . . . . $228,000 $ —Notes payable to former shareholders of acquired companies (interest
ranging from 4.33% to 5.50% due through August 2000) . . . . . . . . . . . . 2,239 3,872
230,239 3,872Current portion of notes payable . . . . . . . . . . . . . . . . . . . . . . . . . . . . . . . . 2,239 1,884
Long-term portion of notes payable . . . . . . . . . . . . . . . . . . . . . . . . . . . . . . $228,000 $1,988
On October 30, 1998, the Company entered into a new $500 million revolving credit facility which issyndicated to a group of 13 banks with NationsBank (Bank of America), as the principal agent. This facility iscomprised of a $350.0 million facility which expires on October 21, 2003 and a $150.0 million, 364 dayfacility. On October 27, 1999, the 364 day, $150.0 million portion of the original credit facility was replaced by
MODIS PROFESSIONAL SERVICES INC. AND SUBSIDIARIES
NOTES TO CONSOLIDATED FINANCIAL STATEMENTS—(Continued)
33
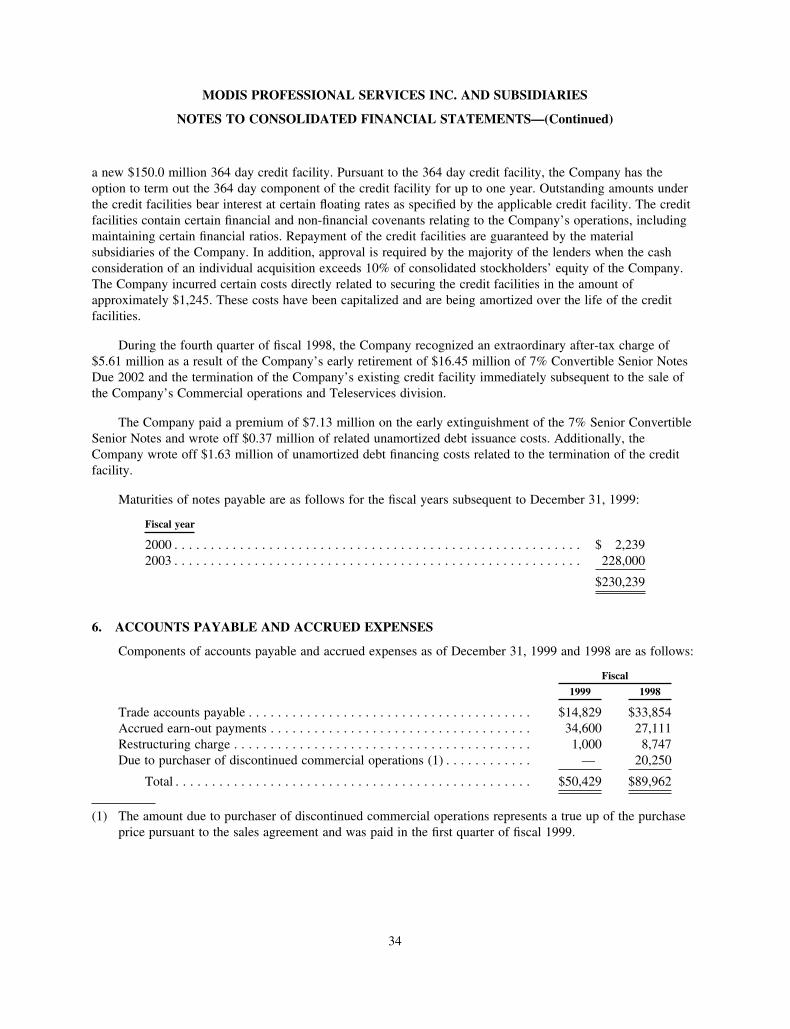
a new $150.0 million 364 day credit facility. Pursuant to the 364 day credit facility, the Company has theoption to term out the 364 day component of the credit facility for up to one year. Outstanding amounts underthe credit facilities bear interest at certain floating rates as specified by the applicable credit facility. The creditfacilities contain certain financial and non-financial covenants relating to the Company’s operations, includingmaintaining certain financial ratios. Repayment of the credit facilities are guaranteed by the materialsubsidiaries of the Company. In addition, approval is required by the majority of the lenders when the cashconsideration of an individual acquisition exceeds 10% of consolidated stockholders’ equity of the Company.The Company incurred certain costs directly related to securing the credit facilities in the amount ofapproximately $1,245. These costs have been capitalized and are being amortized over the life of the creditfacilities.
During the fourth quarter of fiscal 1998, the Company recognized an extraordinary after-tax charge of$5.61 million as a result of the Company’s early retirement of $16.45 million of 7% Convertible Senior NotesDue 2002 and the termination of the Company’s existing credit facility immediately subsequent to the sale ofthe Company’s Commercial operations and Teleservices division.
The Company paid a premium of $7.13 million on the early extinguishment of the 7% Senior ConvertibleSenior Notes and wrote off $0.37 million of related unamortized debt issuance costs. Additionally, theCompany wrote off $1.63 million of unamortized debt financing costs related to the termination of the creditfacility.
Maturities of notes payable are as follows for the fiscal years subsequent to December 31, 1999:
Fiscal year
2000 . . . . . . . . . . . . . . . . . . . . . . . . . . . . . . . . . . . . . . . . . . . . . . . . . . . . . . . . $ 2,2392003 . . . . . . . . . . . . . . . . . . . . . . . . . . . . . . . . . . . . . . . . . . . . . . . . . . . . . . . . 228,000
$230,239
6. ACCOUNTS PAYABLE AND ACCRUED EXPENSES
Components of accounts payable and accrued expenses as of December 31, 1999 and 1998 are as follows:
Fiscal
1999 1998
Trade accounts payable . . . . . . . . . . . . . . . . . . . . . . . . . . . . . . . . . . . . . . . $14,829 $33,854Accrued earn-out payments . . . . . . . . . . . . . . . . . . . . . . . . . . . . . . . . . . . . 34,600 27,111Restructuring charge . . . . . . . . . . . . . . . . . . . . . . . . . . . . . . . . . . . . . . . . . 1,000 8,747Due to purchaser of discontinued commercial operations (1) . . . . . . . . . . . . — 20,250
Total . . . . . . . . . . . . . . . . . . . . . . . . . . . . . . . . . . . . . . . . . . . . . . . . . $50,429 $89,962
(1) The amount due to purchaser of discontinued commercial operations represents a true up of the purchaseprice pursuant to the sales agreement and was paid in the first quarter of fiscal 1999.
MODIS PROFESSIONAL SERVICES INC. AND SUBSIDIARIES
NOTES TO CONSOLIDATED FINANCIAL STATEMENTS—(Continued)
34
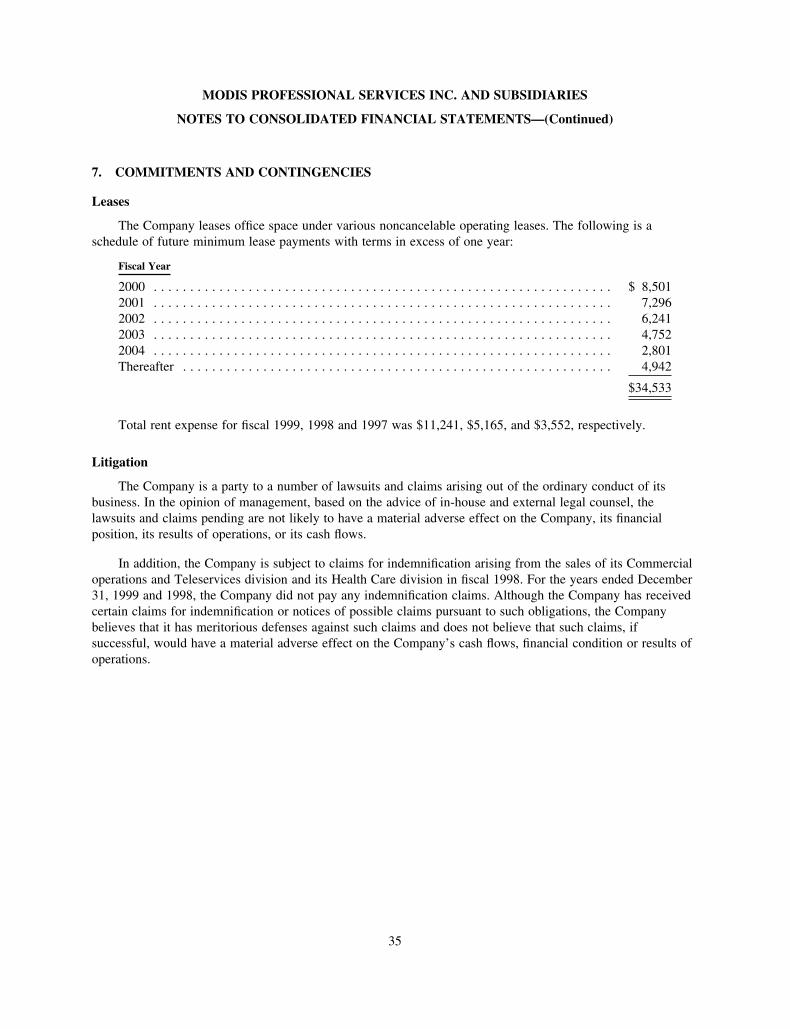
7. COMMITMENTS AND CONTINGENCIES
Leases
The Company leases office space under various noncancelable operating leases. The following is aschedule of future minimum lease payments with terms in excess of one year:
Fiscal Year
2000 . . . . . . . . . . . . . . . . . . . . . . . . . . . . . . . . . . . . . . . . . . . . . . . . . . . . . . . . . . . . . . . $ 8,5012001 . . . . . . . . . . . . . . . . . . . . . . . . . . . . . . . . . . . . . . . . . . . . . . . . . . . . . . . . . . . . . . . 7,2962002 . . . . . . . . . . . . . . . . . . . . . . . . . . . . . . . . . . . . . . . . . . . . . . . . . . . . . . . . . . . . . . . 6,2412003 . . . . . . . . . . . . . . . . . . . . . . . . . . . . . . . . . . . . . . . . . . . . . . . . . . . . . . . . . . . . . . . 4,7522004 . . . . . . . . . . . . . . . . . . . . . . . . . . . . . . . . . . . . . . . . . . . . . . . . . . . . . . . . . . . . . . . 2,801Thereafter . . . . . . . . . . . . . . . . . . . . . . . . . . . . . . . . . . . . . . . . . . . . . . . . . . . . . . . . . . . 4,942
$34,533
Total rent expense for fiscal 1999, 1998 and 1997 was $11,241, $5,165, and $3,552, respectively.
Litigation
The Company is a party to a number of lawsuits and claims arising out of the ordinary conduct of itsbusiness. In the opinion of management, based on the advice of in-house and external legal counsel, thelawsuits and claims pending are not likely to have a material adverse effect on the Company, its financialposition, its results of operations, or its cash flows.
In addition, the Company is subject to claims for indemnification arising from the sales of its Commercialoperations and Teleservices division and its Health Care division in fiscal 1998. For the years ended December31, 1999 and 1998, the Company did not pay any indemnification claims. Although the Company has receivedcertain claims for indemnification or notices of possible claims pursuant to such obligations, the Companybelieves that it has meritorious defenses against such claims and does not believe that such claims, ifsuccessful, would have a material adverse effect on the Company’s cash flows, financial condition or results ofoperations.
MODIS PROFESSIONAL SERVICES INC. AND SUBSIDIARIES
NOTES TO CONSOLIDATED FINANCIAL STATEMENTS—(Continued)
35
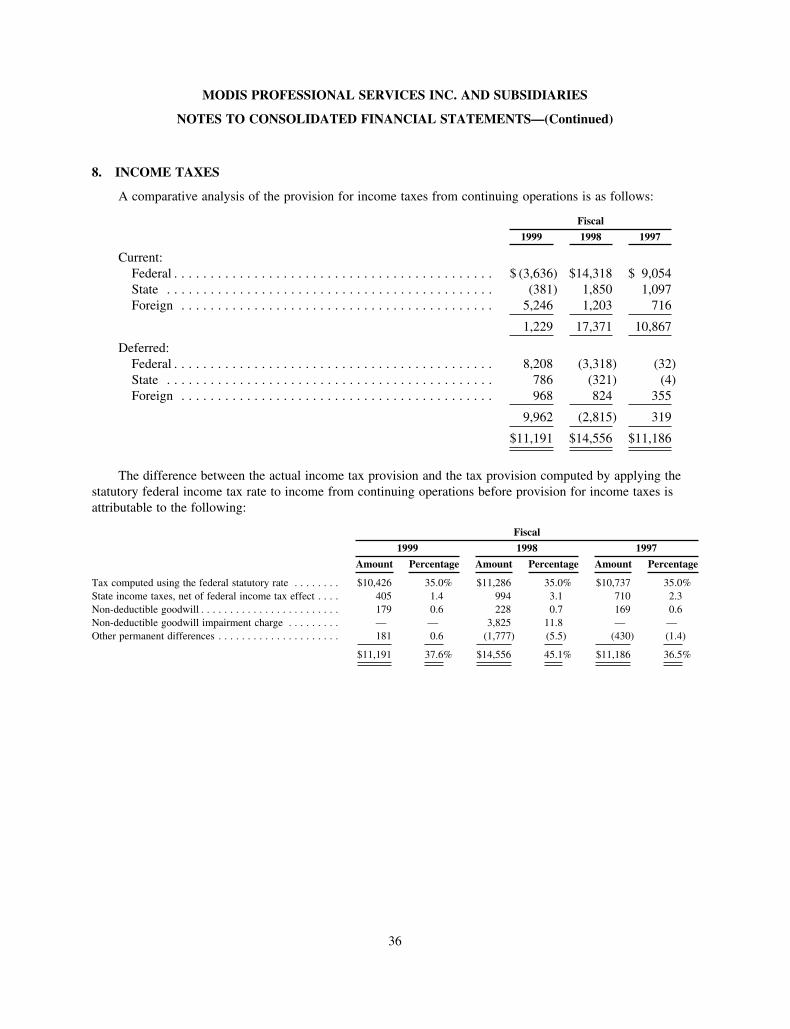
8. INCOME TAXES
A comparative analysis of the provision for income taxes from continuing operations is as follows:
Fiscal
1999 1998 1997
Current:Federal . . . . . . . . . . . . . . . . . . . . . . . . . . . . . . . . . . . . . . . . . . . . $ (3,636) $14,318 $ 9,054State . . . . . . . . . . . . . . . . . . . . . . . . . . . . . . . . . . . . . . . . . . . . . (381) 1,850 1,097Foreign . . . . . . . . . . . . . . . . . . . . . . . . . . . . . . . . . . . . . . . . . . . 5,246 1,203 716
1,229 17,371 10,867
Deferred:Federal . . . . . . . . . . . . . . . . . . . . . . . . . . . . . . . . . . . . . . . . . . . . 8,208 (3,318) (32)State . . . . . . . . . . . . . . . . . . . . . . . . . . . . . . . . . . . . . . . . . . . . . 786 (321) (4)Foreign . . . . . . . . . . . . . . . . . . . . . . . . . . . . . . . . . . . . . . . . . . . 968 824 355
9,962 (2,815) 319
$11,191 $14,556 $11,186
The difference between the actual income tax provision and the tax provision computed by applying thestatutory federal income tax rate to income from continuing operations before provision for income taxes isattributable to the following:
Fiscal
1999 1998 1997
Amount Percentage Amount Percentage Amount Percentage
Tax computed using the federal statutory rate . . . . . . . . $10,426 35.0% $11,286 35.0% $10,737 35.0%State income taxes, net of federal income tax effect . . . . 405 1.4 994 3.1 710 2.3Non-deductible goodwill . . . . . . . . . . . . . . . . . . . . . . . . 179 0.6 228 0.7 169 0.6Non-deductible goodwill impairment charge . . . . . . . . . — — 3,825 11.8 — —Other permanent differences . . . . . . . . . . . . . . . . . . . . . 181 0.6 (1,777) (5.5) (430) (1.4)
$11,191 37.6% $14,556 45.1% $11,186 36.5%
MODIS PROFESSIONAL SERVICES INC. AND SUBSIDIARIES
NOTES TO CONSOLIDATED FINANCIAL STATEMENTS—(Continued)
36
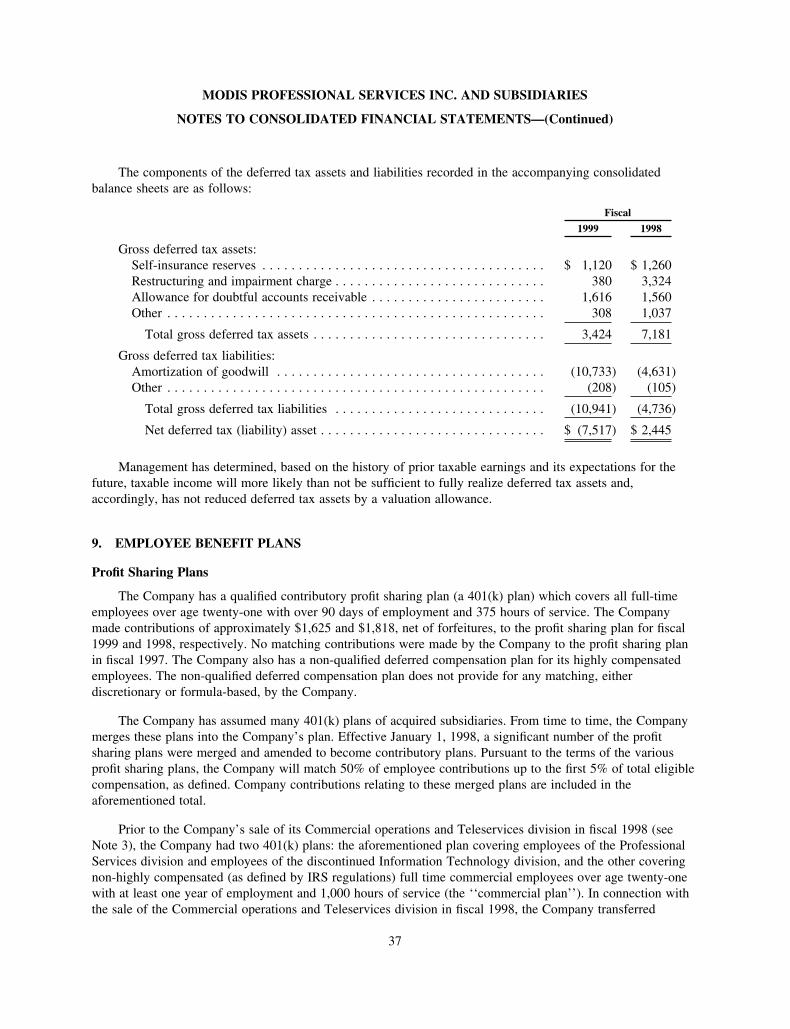
The components of the deferred tax assets and liabilities recorded in the accompanying consolidatedbalance sheets are as follows:
Fiscal
1999 1998
Gross deferred tax assets:Self-insurance reserves . . . . . . . . . . . . . . . . . . . . . . . . . . . . . . . . . . . . . . . $ 1,120 $ 1,260Restructuring and impairment charge . . . . . . . . . . . . . . . . . . . . . . . . . . . . . 380 3,324Allowance for doubtful accounts receivable . . . . . . . . . . . . . . . . . . . . . . . . 1,616 1,560Other . . . . . . . . . . . . . . . . . . . . . . . . . . . . . . . . . . . . . . . . . . . . . . . . . . . . 308 1,037
Total gross deferred tax assets . . . . . . . . . . . . . . . . . . . . . . . . . . . . . . . . 3,424 7,181
Gross deferred tax liabilities:Amortization of goodwill . . . . . . . . . . . . . . . . . . . . . . . . . . . . . . . . . . . . . (10,733) (4,631)Other . . . . . . . . . . . . . . . . . . . . . . . . . . . . . . . . . . . . . . . . . . . . . . . . . . . . (208) (105)
Total gross deferred tax liabilities . . . . . . . . . . . . . . . . . . . . . . . . . . . . . (10,941) (4,736)
Net deferred tax (liability) asset . . . . . . . . . . . . . . . . . . . . . . . . . . . . . . . $ (7,517) $ 2,445
Management has determined, based on the history of prior taxable earnings and its expectations for thefuture, taxable income will more likely than not be sufficient to fully realize deferred tax assets and,accordingly, has not reduced deferred tax assets by a valuation allowance.
9. EMPLOYEE BENEFIT PLANS
Profit Sharing Plans
The Company has a qualified contributory profit sharing plan (a 401(k) plan) which covers all full-timeemployees over age twenty-one with over 90 days of employment and 375 hours of service. The Companymade contributions of approximately $1,625 and $1,818, net of forfeitures, to the profit sharing plan for fiscal1999 and 1998, respectively. No matching contributions were made by the Company to the profit sharing planin fiscal 1997. The Company also has a non-qualified deferred compensation plan for its highly compensatedemployees. The non-qualified deferred compensation plan does not provide for any matching, eitherdiscretionary or formula-based, by the Company.
The Company has assumed many 401(k) plans of acquired subsidiaries. From time to time, the Companymerges these plans into the Company’s plan. Effective January 1, 1998, a significant number of the profitsharing plans were merged and amended to become contributory plans. Pursuant to the terms of the variousprofit sharing plans, the Company will match 50% of employee contributions up to the first 5% of total eligiblecompensation, as defined. Company contributions relating to these merged plans are included in theaforementioned total.
Prior to the Company’s sale of its Commercial operations and Teleservices division in fiscal 1998 (seeNote 3), the Company had two 401(k) plans: the aforementioned plan covering employees of the ProfessionalServices division and employees of the discontinued Information Technology division, and the other coveringnon-highly compensated (as defined by IRS regulations) full time commercial employees over age twenty-onewith at least one year of employment and 1,000 hours of service (the ‘‘commercial plan’’). In connection withthe sale of the Commercial operations and Teleservices division in fiscal 1998, the Company transferred
MODIS PROFESSIONAL SERVICES INC. AND SUBSIDIARIES
NOTES TO CONSOLIDATED FINANCIAL STATEMENTS—(Continued)
37
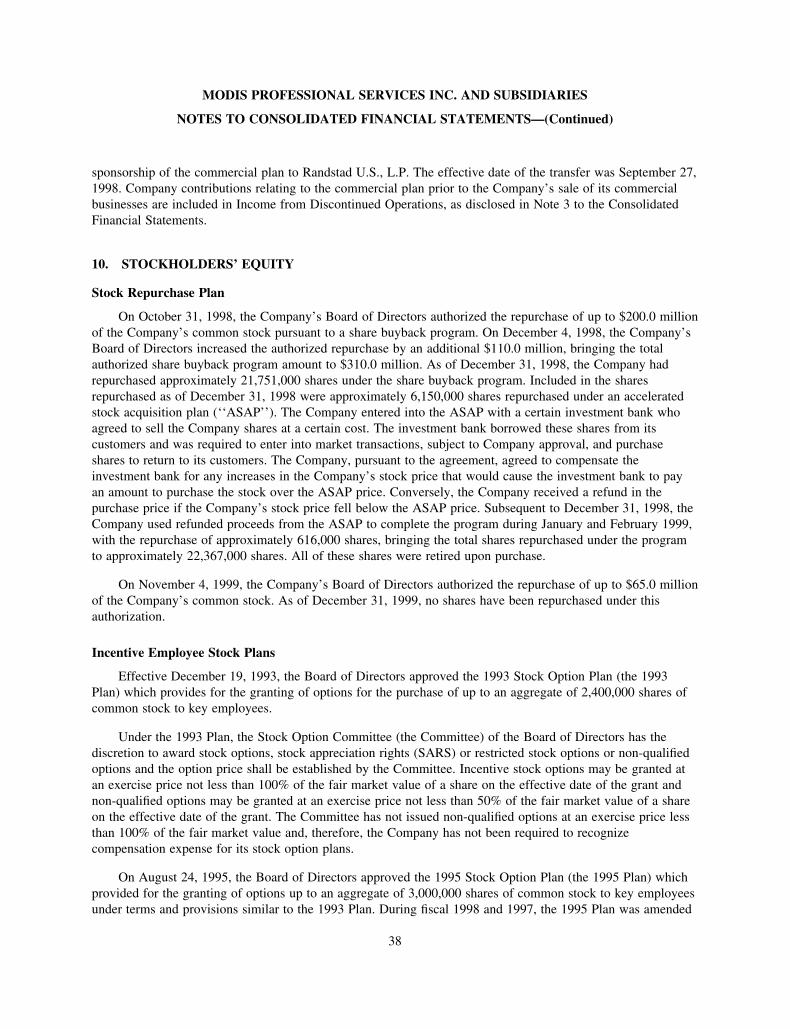
sponsorship of the commercial plan to Randstad U.S., L.P. The effective date of the transfer was September 27,1998. Company contributions relating to the commercial plan prior to the Company’s sale of its commercialbusinesses are included in Income from Discontinued Operations, as disclosed in Note 3 to the ConsolidatedFinancial Statements.
10. STOCKHOLDERS’ EQUITY
Stock Repurchase Plan
On October 31, 1998, the Company’s Board of Directors authorized the repurchase of up to $200.0 millionof the Company’s common stock pursuant to a share buyback program. On December 4, 1998, the Company’sBoard of Directors increased the authorized repurchase by an additional $110.0 million, bringing the totalauthorized share buyback program amount to $310.0 million. As of December 31, 1998, the Company hadrepurchased approximately 21,751,000 shares under the share buyback program. Included in the sharesrepurchased as of December 31, 1998 were approximately 6,150,000 shares repurchased under an acceleratedstock acquisition plan (‘‘ASAP’’). The Company entered into the ASAP with a certain investment bank whoagreed to sell the Company shares at a certain cost. The investment bank borrowed these shares from itscustomers and was required to enter into market transactions, subject to Company approval, and purchaseshares to return to its customers. The Company, pursuant to the agreement, agreed to compensate theinvestment bank for any increases in the Company’s stock price that would cause the investment bank to payan amount to purchase the stock over the ASAP price. Conversely, the Company received a refund in thepurchase price if the Company’s stock price fell below the ASAP price. Subsequent to December 31, 1998, theCompany used refunded proceeds from the ASAP to complete the program during January and February 1999,with the repurchase of approximately 616,000 shares, bringing the total shares repurchased under the programto approximately 22,367,000 shares. All of these shares were retired upon purchase.
On November 4, 1999, the Company’s Board of Directors authorized the repurchase of up to $65.0 millionof the Company’s common stock. As of December 31, 1999, no shares have been repurchased under thisauthorization.
Incentive Employee Stock Plans
Effective December 19, 1993, the Board of Directors approved the 1993 Stock Option Plan (the 1993Plan) which provides for the granting of options for the purchase of up to an aggregate of 2,400,000 shares ofcommon stock to key employees.
Under the 1993 Plan, the Stock Option Committee (the Committee) of the Board of Directors has thediscretion to award stock options, stock appreciation rights (SARS) or restricted stock options or non-qualifiedoptions and the option price shall be established by the Committee. Incentive stock options may be granted atan exercise price not less than 100% of the fair market value of a share on the effective date of the grant andnon-qualified options may be granted at an exercise price not less than 50% of the fair market value of a shareon the effective date of the grant. The Committee has not issued non-qualified options at an exercise price lessthan 100% of the fair market value and, therefore, the Company has not been required to recognizecompensation expense for its stock option plans.
On August 24, 1995, the Board of Directors approved the 1995 Stock Option Plan (the 1995 Plan) whichprovided for the granting of options up to an aggregate of 3,000,000 shares of common stock to key employeesunder terms and provisions similar to the 1993 Plan. During fiscal 1998 and 1997, the 1995 Plan was amended
MODIS PROFESSIONAL SERVICES INC. AND SUBSIDIARIES
NOTES TO CONSOLIDATED FINANCIAL STATEMENTS—(Continued)
38
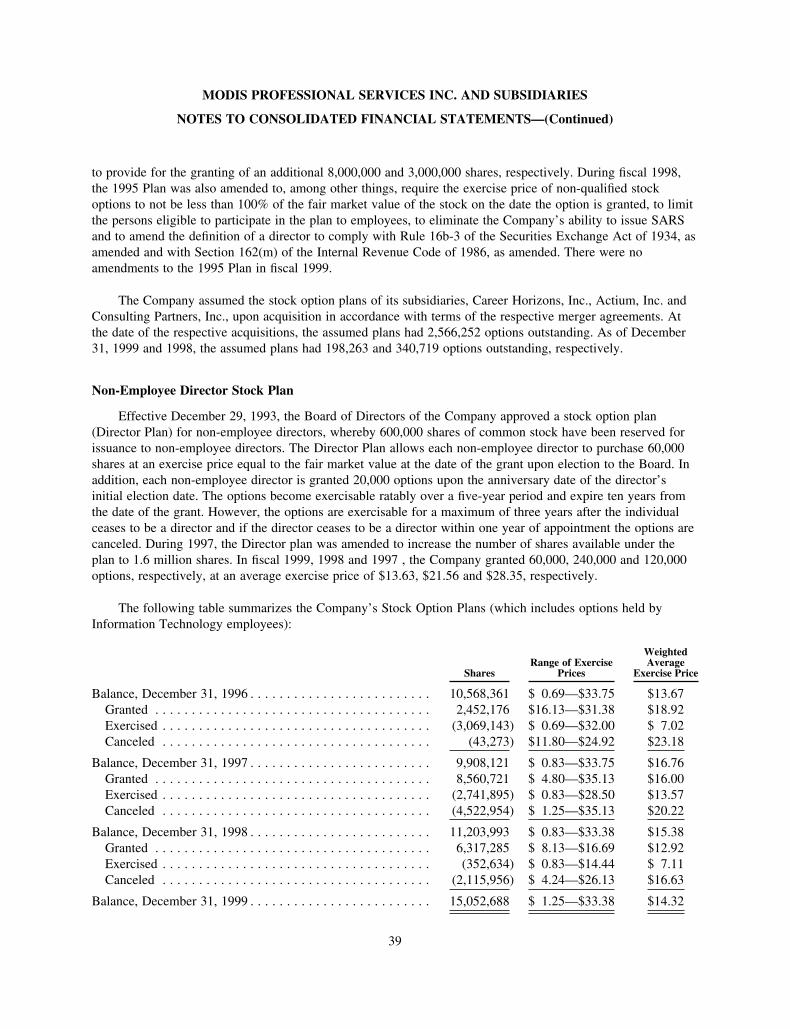
to provide for the granting of an additional 8,000,000 and 3,000,000 shares, respectively. During fiscal 1998,the 1995 Plan was also amended to, among other things, require the exercise price of non-qualified stockoptions to not be less than 100% of the fair market value of the stock on the date the option is granted, to limitthe persons eligible to participate in the plan to employees, to eliminate the Company’s ability to issue SARSand to amend the definition of a director to comply with Rule 16b-3 of the Securities Exchange Act of 1934, asamended and with Section 162(m) of the Internal Revenue Code of 1986, as amended. There were noamendments to the 1995 Plan in fiscal 1999.
The Company assumed the stock option plans of its subsidiaries, Career Horizons, Inc., Actium, Inc. andConsulting Partners, Inc., upon acquisition in accordance with terms of the respective merger agreements. Atthe date of the respective acquisitions, the assumed plans had 2,566,252 options outstanding. As of December31, 1999 and 1998, the assumed plans had 198,263 and 340,719 options outstanding, respectively.
Non-Employee Director Stock Plan
Effective December 29, 1993, the Board of Directors of the Company approved a stock option plan(Director Plan) for non-employee directors, whereby 600,000 shares of common stock have been reserved forissuance to non-employee directors. The Director Plan allows each non-employee director to purchase 60,000shares at an exercise price equal to the fair market value at the date of the grant upon election to the Board. Inaddition, each non-employee director is granted 20,000 options upon the anniversary date of the director’sinitial election date. The options become exercisable ratably over a five-year period and expire ten years fromthe date of the grant. However, the options are exercisable for a maximum of three years after the individualceases to be a director and if the director ceases to be a director within one year of appointment the options arecanceled. During 1997, the Director plan was amended to increase the number of shares available under theplan to 1.6 million shares. In fiscal 1999, 1998 and 1997 , the Company granted 60,000, 240,000 and 120,000options, respectively, at an average exercise price of $13.63, $21.56 and $28.35, respectively.
The following table summarizes the Company’s Stock Option Plans (which includes options held byInformation Technology employees):
SharesRange of Exercise
Prices
WeightedAverage
Exercise Price
Balance, December 31, 1996 . . . . . . . . . . . . . . . . . . . . . . . . . 10,568,361 $ 0.69—$33.75 $13.67Granted . . . . . . . . . . . . . . . . . . . . . . . . . . . . . . . . . . . . . . 2,452,176 $16.13—$31.38 $18.92Exercised . . . . . . . . . . . . . . . . . . . . . . . . . . . . . . . . . . . . . (3,069,143) $ 0.69—$32.00 $ 7.02Canceled . . . . . . . . . . . . . . . . . . . . . . . . . . . . . . . . . . . . . (43,273) $11.80—$24.92 $23.18
Balance, December 31, 1997 . . . . . . . . . . . . . . . . . . . . . . . . . 9,908,121 $ 0.83—$33.75 $16.76Granted . . . . . . . . . . . . . . . . . . . . . . . . . . . . . . . . . . . . . . 8,560,721 $ 4.80—$35.13 $16.00Exercised . . . . . . . . . . . . . . . . . . . . . . . . . . . . . . . . . . . . . (2,741,895) $ 0.83—$28.50 $13.57Canceled . . . . . . . . . . . . . . . . . . . . . . . . . . . . . . . . . . . . . (4,522,954) $ 1.25—$35.13 $20.22
Balance, December 31, 1998 . . . . . . . . . . . . . . . . . . . . . . . . . 11,203,993 $ 0.83—$33.38 $15.38Granted . . . . . . . . . . . . . . . . . . . . . . . . . . . . . . . . . . . . . . 6,317,285 $ 8.13—$16.69 $12.92Exercised . . . . . . . . . . . . . . . . . . . . . . . . . . . . . . . . . . . . . (352,634) $ 0.83—$14.44 $ 7.11Canceled . . . . . . . . . . . . . . . . . . . . . . . . . . . . . . . . . . . . . (2,115,956) $ 4.24—$26.13 $16.63
Balance, December 31, 1999 . . . . . . . . . . . . . . . . . . . . . . . . . 15,052,688 $ 1.25—$33.38 $14.32
MODIS PROFESSIONAL SERVICES INC. AND SUBSIDIARIES
NOTES TO CONSOLIDATED FINANCIAL STATEMENTS—(Continued)
39
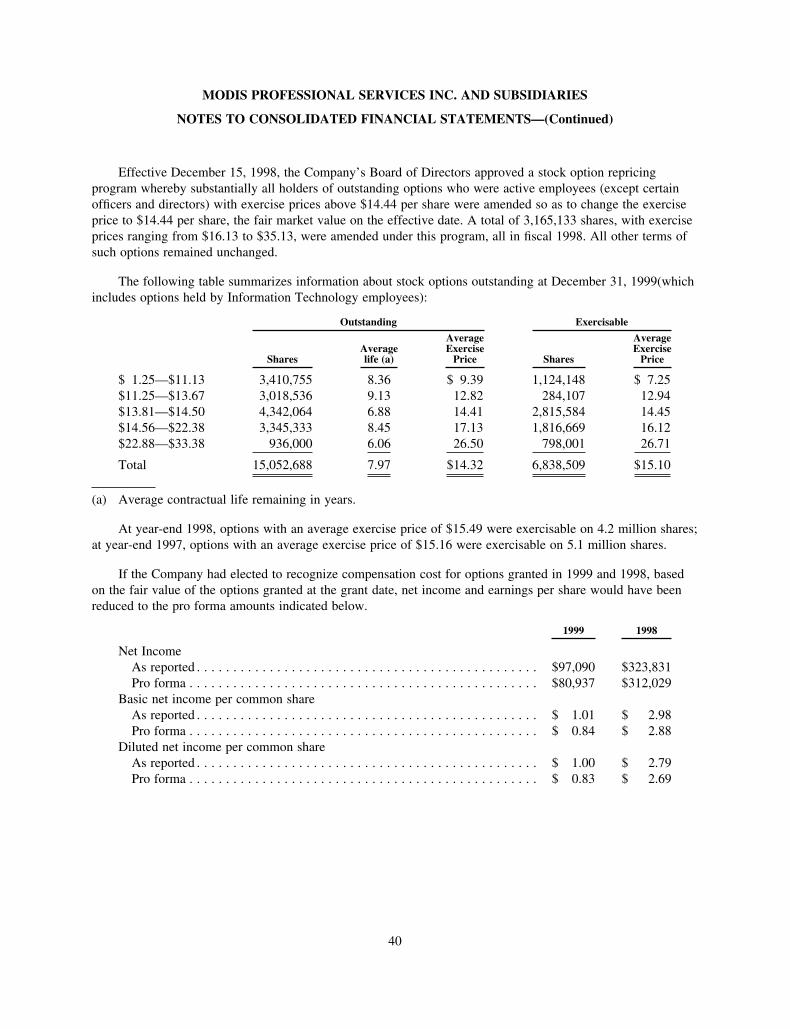
Effective December 15, 1998, the Company’s Board of Directors approved a stock option repricingprogram whereby substantially all holders of outstanding options who were active employees (except certainofficers and directors) with exercise prices above $14.44 per share were amended so as to change the exerciseprice to $14.44 per share, the fair market value on the effective date. A total of 3,165,133 shares, with exerciseprices ranging from $16.13 to $35.13, were amended under this program, all in fiscal 1998. All other terms ofsuch options remained unchanged.
The following table summarizes information about stock options outstanding at December 31, 1999(whichincludes options held by Information Technology employees):
Outstanding Exercisable
SharesAveragelife (a)
AverageExercise
Price Shares
AverageExercise
Price
$ 1.25—$11.13 3,410,755 8.36 $ 9.39 1,124,148 $ 7.25$11.25—$13.67 3,018,536 9.13 12.82 284,107 12.94$13.81—$14.50 4,342,064 6.88 14.41 2,815,584 14.45$14.56—$22.38 3,345,333 8.45 17.13 1,816,669 16.12$22.88—$33.38 936,000 6.06 26.50 798,001 26.71
Total 15,052,688 7.97 $14.32 6,838,509 $15.10
(a) Average contractual life remaining in years.
At year-end 1998, options with an average exercise price of $15.49 were exercisable on 4.2 million shares;at year-end 1997, options with an average exercise price of $15.16 were exercisable on 5.1 million shares.
If the Company had elected to recognize compensation cost for options granted in 1999 and 1998, basedon the fair value of the options granted at the grant date, net income and earnings per share would have beenreduced to the pro forma amounts indicated below.
1999 1998
Net IncomeAs reported . . . . . . . . . . . . . . . . . . . . . . . . . . . . . . . . . . . . . . . . . . . . . . . $97,090 $323,831Pro forma . . . . . . . . . . . . . . . . . . . . . . . . . . . . . . . . . . . . . . . . . . . . . . . . $80,937 $312,029
Basic net income per common shareAs reported . . . . . . . . . . . . . . . . . . . . . . . . . . . . . . . . . . . . . . . . . . . . . . . $ 1.01 $ 2.98Pro forma . . . . . . . . . . . . . . . . . . . . . . . . . . . . . . . . . . . . . . . . . . . . . . . . $ 0.84 $ 2.88
Diluted net income per common shareAs reported . . . . . . . . . . . . . . . . . . . . . . . . . . . . . . . . . . . . . . . . . . . . . . . $ 1.00 $ 2.79Pro forma . . . . . . . . . . . . . . . . . . . . . . . . . . . . . . . . . . . . . . . . . . . . . . . . $ 0.83 $ 2.69
MODIS PROFESSIONAL SERVICES INC. AND SUBSIDIARIES
NOTES TO CONSOLIDATED FINANCIAL STATEMENTS—(Continued)
40
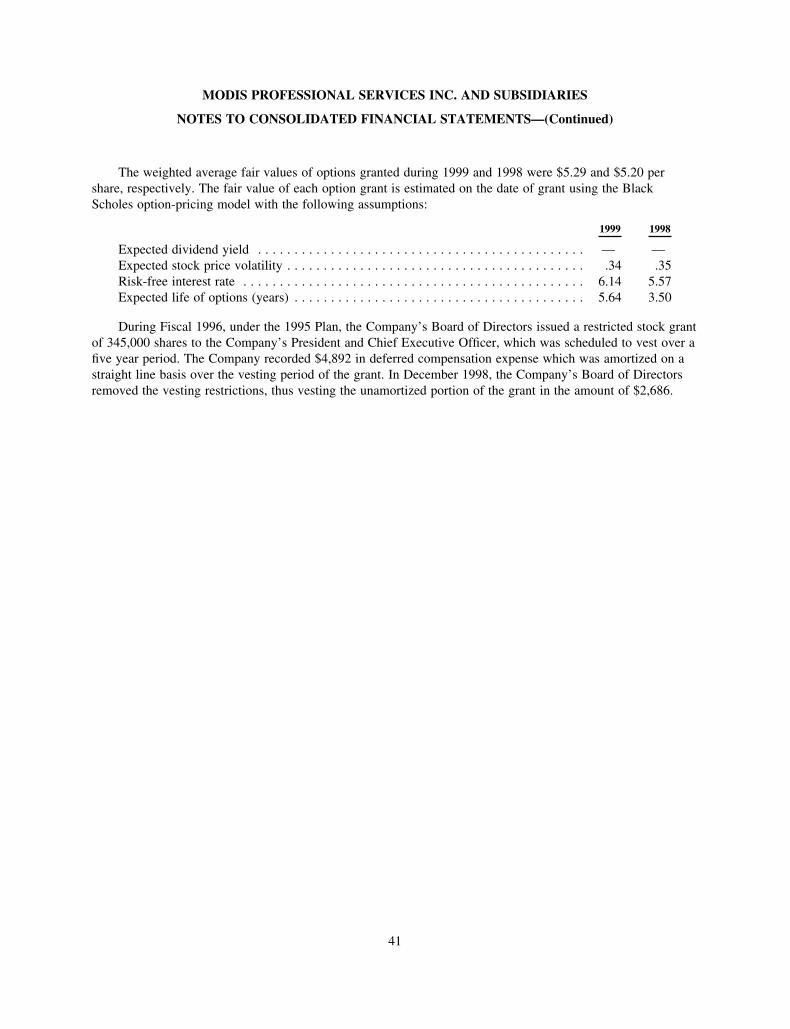
The weighted average fair values of options granted during 1999 and 1998 were $5.29 and $5.20 pershare, respectively. The fair value of each option grant is estimated on the date of grant using the BlackScholes option-pricing model with the following assumptions:
1999 1998
Expected dividend yield . . . . . . . . . . . . . . . . . . . . . . . . . . . . . . . . . . . . . . . . . . . . . — —Expected stock price volatility . . . . . . . . . . . . . . . . . . . . . . . . . . . . . . . . . . . . . . . . . .34 .35Risk-free interest rate . . . . . . . . . . . . . . . . . . . . . . . . . . . . . . . . . . . . . . . . . . . . . . . 6.14 5.57Expected life of options (years) . . . . . . . . . . . . . . . . . . . . . . . . . . . . . . . . . . . . . . . . 5.64 3.50
During Fiscal 1996, under the 1995 Plan, the Company’s Board of Directors issued a restricted stock grantof 345,000 shares to the Company’s President and Chief Executive Officer, which was scheduled to vest over afive year period. The Company recorded $4,892 in deferred compensation expense which was amortized on astraight line basis over the vesting period of the grant. In December 1998, the Company’s Board of Directorsremoved the vesting restrictions, thus vesting the unamortized portion of the grant in the amount of $2,686.
MODIS PROFESSIONAL SERVICES INC. AND SUBSIDIARIES
NOTES TO CONSOLIDATED FINANCIAL STATEMENTS—(Continued)
41
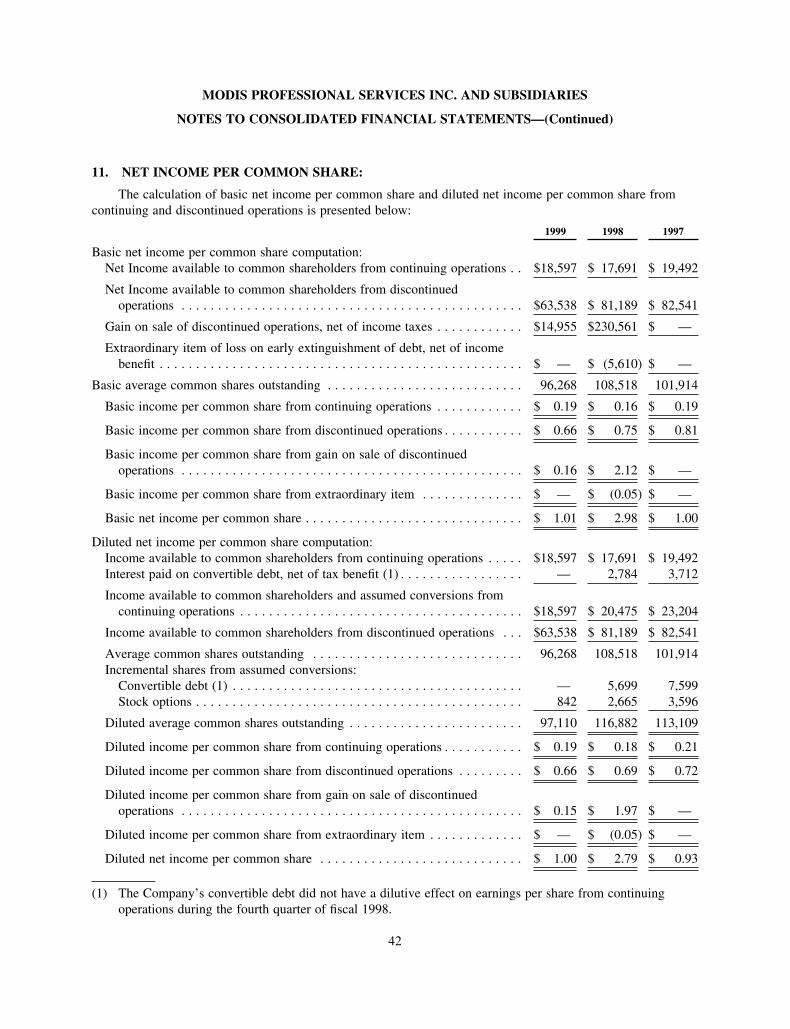
11. NET INCOME PER COMMON SHARE:
The calculation of basic net income per common share and diluted net income per common share fromcontinuing and discontinued operations is presented below:
1999 1998 1997
Basic net income per common share computation:Net Income available to common shareholders from continuing operations . . $18,597 $ 17,691 $ 19,492
Net Income available to common shareholders from discontinuedoperations . . . . . . . . . . . . . . . . . . . . . . . . . . . . . . . . . . . . . . . . . . . . . . . $63,538 $ 81,189 $ 82,541
Gain on sale of discontinued operations, net of income taxes . . . . . . . . . . . . $14,955 $230,561 $ —
Extraordinary item of loss on early extinguishment of debt, net of incomebenefit . . . . . . . . . . . . . . . . . . . . . . . . . . . . . . . . . . . . . . . . . . . . . . . . . . $ — $ (5,610) $ —
Basic average common shares outstanding . . . . . . . . . . . . . . . . . . . . . . . . . . . 96,268 108,518 101,914
Basic income per common share from continuing operations . . . . . . . . . . . . $ 0.19 $ 0.16 $ 0.19
Basic income per common share from discontinued operations . . . . . . . . . . . $ 0.66 $ 0.75 $ 0.81
Basic income per common share from gain on sale of discontinuedoperations . . . . . . . . . . . . . . . . . . . . . . . . . . . . . . . . . . . . . . . . . . . . . . . $ 0.16 $ 2.12 $ —
Basic income per common share from extraordinary item . . . . . . . . . . . . . . $ — $ (0.05) $ —
Basic net income per common share . . . . . . . . . . . . . . . . . . . . . . . . . . . . . . $ 1.01 $ 2.98 $ 1.00
Diluted net income per common share computation:Income available to common shareholders from continuing operations . . . . . $18,597 $ 17,691 $ 19,492Interest paid on convertible debt, net of tax benefit (1) . . . . . . . . . . . . . . . . . — 2,784 3,712
Income available to common shareholders and assumed conversions fromcontinuing operations . . . . . . . . . . . . . . . . . . . . . . . . . . . . . . . . . . . . . . . $18,597 $ 20,475 $ 23,204
Income available to common shareholders from discontinued operations . . . $63,538 $ 81,189 $ 82,541
Average common shares outstanding . . . . . . . . . . . . . . . . . . . . . . . . . . . . . 96,268 108,518 101,914Incremental shares from assumed conversions:
Convertible debt (1) . . . . . . . . . . . . . . . . . . . . . . . . . . . . . . . . . . . . . . . . — 5,699 7,599Stock options . . . . . . . . . . . . . . . . . . . . . . . . . . . . . . . . . . . . . . . . . . . . . 842 2,665 3,596
Diluted average common shares outstanding . . . . . . . . . . . . . . . . . . . . . . . . 97,110 116,882 113,109
Diluted income per common share from continuing operations . . . . . . . . . . . $ 0.19 $ 0.18 $ 0.21
Diluted income per common share from discontinued operations . . . . . . . . . $ 0.66 $ 0.69 $ 0.72
Diluted income per common share from gain on sale of discontinuedoperations . . . . . . . . . . . . . . . . . . . . . . . . . . . . . . . . . . . . . . . . . . . . . . . $ 0.15 $ 1.97 $ —
Diluted income per common share from extraordinary item . . . . . . . . . . . . . $ — $ (0.05) $ —
Diluted net income per common share . . . . . . . . . . . . . . . . . . . . . . . . . . . . $ 1.00 $ 2.79 $ 0.93
(1) The Company’s convertible debt did not have a dilutive effect on earnings per share from continuingoperations during the fourth quarter of fiscal 1998.
MODIS PROFESSIONAL SERVICES INC. AND SUBSIDIARIES
NOTES TO CONSOLIDATED FINANCIAL STATEMENTS—(Continued)
42
Options to purchase 9,231,486 shares of common stock that were outstanding during 1999 were notincluded in the computation of diluted earnings per share as the exercise prices of these options were greaterthan the average market price of the common shares.
12. CONCENTRATION OF CREDIT RISK
The Company’s financial instruments that are exposed to concentrations of credit risk consist primarily ofcash and trade accounts receivable. The Company places its cash with what it believes to be high credit qualityinstitutions. At times such investments may be in excess of the FDIC insurance limit. The Company routinelyassesses the financial strength of its customers and, as a consequence, believes that its trade accounts receivablecredit risk exposure is limited.
In connection with the Company’s sale of its health care operations, the Company entered into anagreement with the purchaser of the health care assets whereby the Company agreed to make advances to thepurchaser to fund its working capital requirements. These advances are collateralized by the assets of the soldoperations, primarily the accounts receivable. In the third quarter of 1999, the Company was informed by thepurchaser that they would default on their obligation to the Company. The purchaser is attempting to sell thepurchaser-owned locations and enter into agreements with its franchisees, whereby net accounts receivable andany amounts realized from the sale of purchaser-owned locations will, after operating costs, be applied againstthe purchaser’s debt to the Company. Further, the purchaser has named an interim executive to operate thebusiness in an effort to maximize debt reduction to the Company. However, in the third quarter of 1999, theCompany believed that, based upon an analysis of the assets and liabilities of the purchaser, it was probablethat a portion of the advances would not be repaid. Accordingly, the Company recorded a $25.0 millionreserve. At December 31, 1999, advances outstanding, net of the $25.0 million reserve, totaled $18.8 million.See Note 3.
13. RESTRUCTURING OF OPERATIONS AND IMPAIRMENT CHARGE
In December 1998, the Company’s Board of Directors approved an Integration and Strategic RepositioningPlan (the ‘‘Plan’’) to strengthen the overall profitability of the Company by implementing a back officeintegration program and branch repositioning plan in an effort to consolidate or close branches whose financialperformance did not meet the Company’s expectations. Pursuant to the Plan, during the fourth quarter of 1998the Company recorded a restructuring and impairment charge of $18,683. The restructuring component of thePlan is based, in part, on the evaluation of objective evidence of probable obligations to be incurred by theCompany or impairment of specifically identified assets.
The Plan provided for the consolidation or closing of 23 branches and certain organizationalimprovements. This restructuring, which will result in the elimination of approximately 100 positions, will becompleted over a 12- to 18-month period, which began during the first quarter of 1999. As of December 31,1999, the Company has consolidated the majority of the branches contemplated and expects to complete thePlan by mid-2000.
The major components of the restructuring and impairment charge include: (1) costs of $1,896 torecognize severance and related benefits for the approximately 100 employees to be terminated. The severanceand related benefit accruals are based on the Company’s severance plan and other contractual terminationprovisions. These accruals include amounts to be paid to employees upon termination of employment. Prior toDecember 31, 1998, management had approved and committed the Company to a plan that involved the
MODIS PROFESSIONAL SERVICES INC. AND SUBSIDIARIES
NOTES TO CONSOLIDATED FINANCIAL STATEMENTS—(Continued)
43
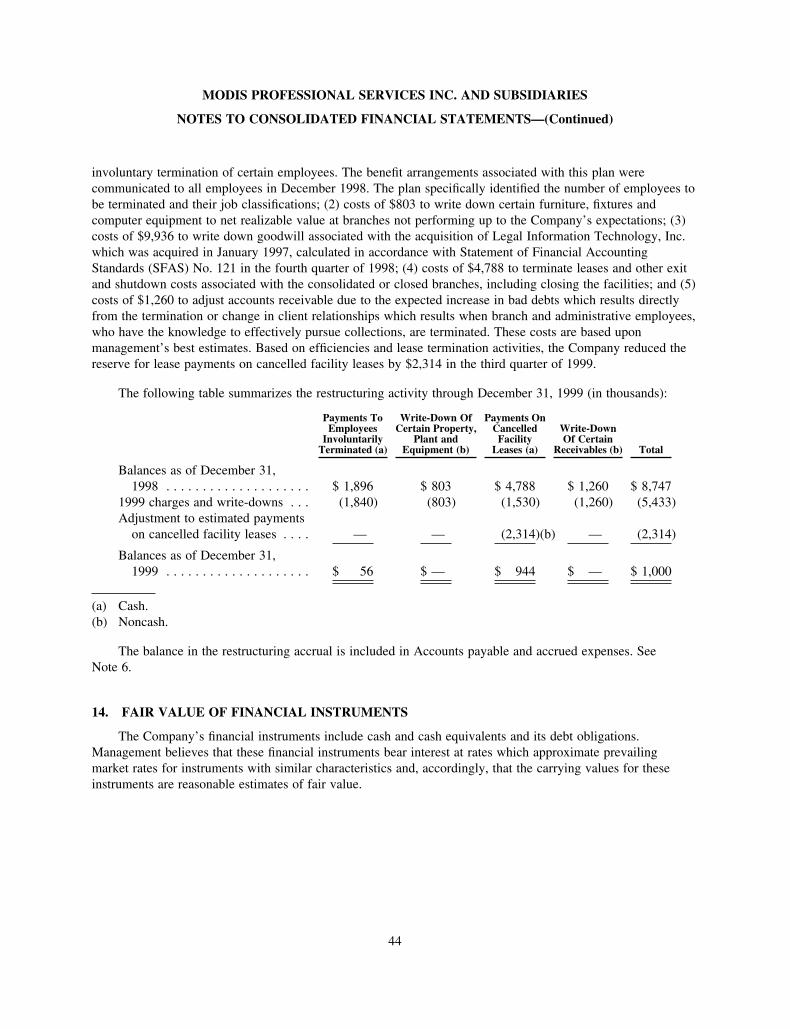
involuntary termination of certain employees. The benefit arrangements associated with this plan werecommunicated to all employees in December 1998. The plan specifically identified the number of employees tobe terminated and their job classifications; (2) costs of $803 to write down certain furniture, fixtures andcomputer equipment to net realizable value at branches not performing up to the Company’s expectations; (3)costs of $9,936 to write down goodwill associated with the acquisition of Legal Information Technology, Inc.which was acquired in January 1997, calculated in accordance with Statement of Financial AccountingStandards (SFAS) No. 121 in the fourth quarter of 1998; (4) costs of $4,788 to terminate leases and other exitand shutdown costs associated with the consolidated or closed branches, including closing the facilities; and (5)costs of $1,260 to adjust accounts receivable due to the expected increase in bad debts which results directlyfrom the termination or change in client relationships which results when branch and administrative employees,who have the knowledge to effectively pursue collections, are terminated. These costs are based uponmanagement’s best estimates. Based on efficiencies and lease termination activities, the Company reduced thereserve for lease payments on cancelled facility leases by $2,314 in the third quarter of 1999.
The following table summarizes the restructuring activity through December 31, 1999 (in thousands):
Payments ToEmployees
InvoluntarilyTerminated (a)
Write-Down OfCertain Property,
Plant andEquipment (b)
Payments OnCancelledFacility
Leases (a)
Write-DownOf Certain
Receivables (b) Total
Balances as of December 31,1998 . . . . . . . . . . . . . . . . . . . . $ 1,896 $ 803 $ 4,788 $ 1,260 $ 8,747
1999 charges and write-downs . . . (1,840) (803) (1,530) (1,260) (5,433)Adjustment to estimated payments
on cancelled facility leases . . . . — — (2,314)(b) — (2,314)
Balances as of December 31,1999 . . . . . . . . . . . . . . . . . . . . $ 56 $ — $ 944 $ — $ 1,000
(a) Cash.(b) Noncash.
The balance in the restructuring accrual is included in Accounts payable and accrued expenses. SeeNote 6.
14. FAIR VALUE OF FINANCIAL INSTRUMENTS
The Company’s financial instruments include cash and cash equivalents and its debt obligations.Management believes that these financial instruments bear interest at rates which approximate prevailingmarket rates for instruments with similar characteristics and, accordingly, that the carrying values for theseinstruments are reasonable estimates of fair value.
MODIS PROFESSIONAL SERVICES INC. AND SUBSIDIARIES
NOTES TO CONSOLIDATED FINANCIAL STATEMENTS—(Continued)
44
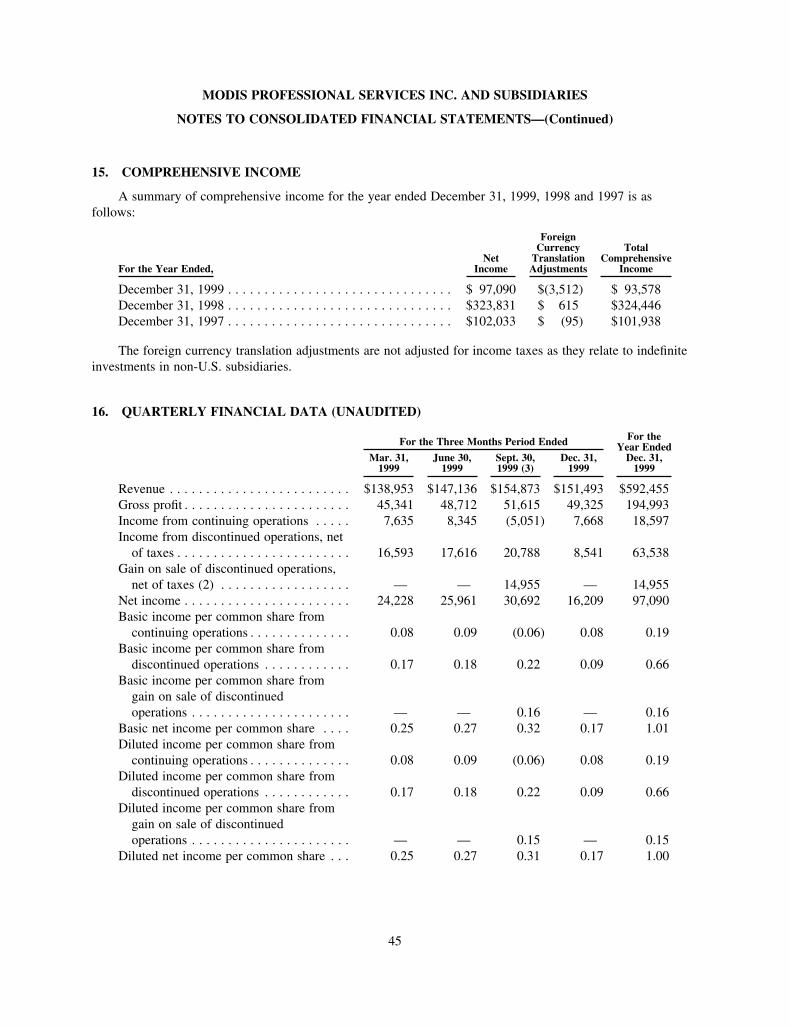
15. COMPREHENSIVE INCOME
A summary of comprehensive income for the year ended December 31, 1999, 1998 and 1997 is asfollows:
For the Year Ended,Net
Income
ForeignCurrency
TranslationAdjustments
TotalComprehensive
Income
December 31, 1999 . . . . . . . . . . . . . . . . . . . . . . . . . . . . . . . $ 97,090 $(3,512) $ 93,578December 31, 1998 . . . . . . . . . . . . . . . . . . . . . . . . . . . . . . . $323,831 $ 615 $324,446December 31, 1997 . . . . . . . . . . . . . . . . . . . . . . . . . . . . . . . $102,033 $ (95) $101,938
The foreign currency translation adjustments are not adjusted for income taxes as they relate to indefiniteinvestments in non-U.S. subsidiaries.
16. QUARTERLY FINANCIAL DATA (UNAUDITED)
For the Three Months Period Ended For theYear Ended
Dec. 31,1999
Mar. 31,1999
June 30,1999
Sept. 30,1999 (3)
Dec. 31,1999
Revenue . . . . . . . . . . . . . . . . . . . . . . . . . $138,953 $147,136 $154,873 $151,493 $592,455Gross profit . . . . . . . . . . . . . . . . . . . . . . . 45,341 48,712 51,615 49,325 194,993Income from continuing operations . . . . . 7,635 8,345 (5,051) 7,668 18,597Income from discontinued operations, net
of taxes . . . . . . . . . . . . . . . . . . . . . . . . 16,593 17,616 20,788 8,541 63,538Gain on sale of discontinued operations,
net of taxes (2) . . . . . . . . . . . . . . . . . . — — 14,955 — 14,955Net income . . . . . . . . . . . . . . . . . . . . . . . 24,228 25,961 30,692 16,209 97,090Basic income per common share from
continuing operations . . . . . . . . . . . . . . 0.08 0.09 (0.06) 0.08 0.19Basic income per common share from
discontinued operations . . . . . . . . . . . . 0.17 0.18 0.22 0.09 0.66Basic income per common share from
gain on sale of discontinuedoperations . . . . . . . . . . . . . . . . . . . . . . — — 0.16 — 0.16
Basic net income per common share . . . . 0.25 0.27 0.32 0.17 1.01Diluted income per common share from
continuing operations . . . . . . . . . . . . . . 0.08 0.09 (0.06) 0.08 0.19Diluted income per common share from
discontinued operations . . . . . . . . . . . . 0.17 0.18 0.22 0.09 0.66Diluted income per common share from
gain on sale of discontinuedoperations . . . . . . . . . . . . . . . . . . . . . . — — 0.15 — 0.15
Diluted net income per common share . . . 0.25 0.27 0.31 0.17 1.00
MODIS PROFESSIONAL SERVICES INC. AND SUBSIDIARIES
NOTES TO CONSOLIDATED FINANCIAL STATEMENTS—(Continued)
45
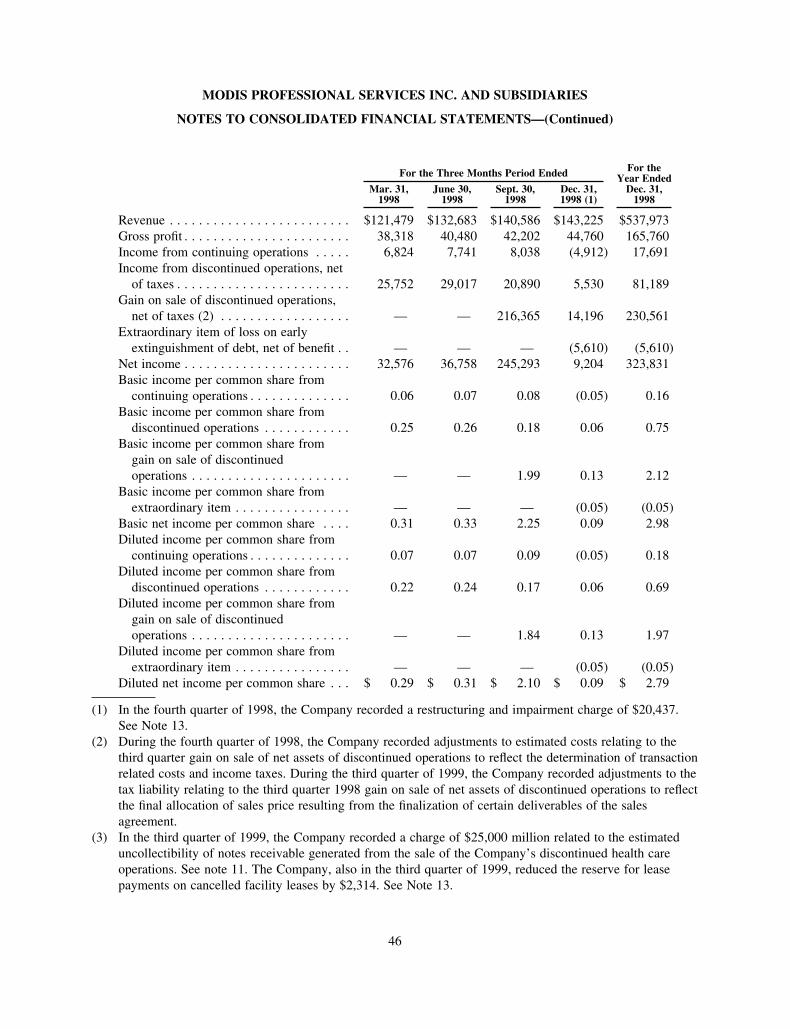
For the Three Months Period Ended For theYear Ended
Dec. 31,1998
Mar. 31,1998
June 30,1998
Sept. 30,1998
Dec. 31,1998 (1)
Revenue . . . . . . . . . . . . . . . . . . . . . . . . . $121,479 $132,683 $140,586 $143,225 $537,973Gross profit . . . . . . . . . . . . . . . . . . . . . . . 38,318 40,480 42,202 44,760 165,760Income from continuing operations . . . . . 6,824 7,741 8,038 (4,912) 17,691Income from discontinued operations, net
of taxes . . . . . . . . . . . . . . . . . . . . . . . . 25,752 29,017 20,890 5,530 81,189Gain on sale of discontinued operations,
net of taxes (2) . . . . . . . . . . . . . . . . . . — — 216,365 14,196 230,561Extraordinary item of loss on early
extinguishment of debt, net of benefit . . — — — (5,610) (5,610)Net income . . . . . . . . . . . . . . . . . . . . . . . 32,576 36,758 245,293 9,204 323,831Basic income per common share from
continuing operations . . . . . . . . . . . . . . 0.06 0.07 0.08 (0.05) 0.16Basic income per common share from
discontinued operations . . . . . . . . . . . . 0.25 0.26 0.18 0.06 0.75Basic income per common share from
gain on sale of discontinuedoperations . . . . . . . . . . . . . . . . . . . . . . — — 1.99 0.13 2.12
Basic income per common share fromextraordinary item . . . . . . . . . . . . . . . . — — — (0.05) (0.05)
Basic net income per common share . . . . 0.31 0.33 2.25 0.09 2.98Diluted income per common share from
continuing operations . . . . . . . . . . . . . . 0.07 0.07 0.09 (0.05) 0.18Diluted income per common share from
discontinued operations . . . . . . . . . . . . 0.22 0.24 0.17 0.06 0.69Diluted income per common share from
gain on sale of discontinuedoperations . . . . . . . . . . . . . . . . . . . . . . — — 1.84 0.13 1.97
Diluted income per common share fromextraordinary item . . . . . . . . . . . . . . . . — — — (0.05) (0.05)
Diluted net income per common share . . . $ 0.29 $ 0.31 $ 2.10 $ 0.09 $ 2.79
(1) In the fourth quarter of 1998, the Company recorded a restructuring and impairment charge of $20,437.See Note 13.
(2) During the fourth quarter of 1998, the Company recorded adjustments to estimated costs relating to thethird quarter gain on sale of net assets of discontinued operations to reflect the determination of transactionrelated costs and income taxes. During the third quarter of 1999, the Company recorded adjustments to thetax liability relating to the third quarter 1998 gain on sale of net assets of discontinued operations to reflectthe final allocation of sales price resulting from the finalization of certain deliverables of the salesagreement.
(3) In the third quarter of 1999, the Company recorded a charge of $25,000 million related to the estimateduncollectibility of notes receivable generated from the sale of the Company’s discontinued health careoperations. See note 11. The Company, also in the third quarter of 1999, reduced the reserve for leasepayments on cancelled facility leases by $2,314. See Note 13.
MODIS PROFESSIONAL SERVICES INC. AND SUBSIDIARIES
NOTES TO CONSOLIDATED FINANCIAL STATEMENTS—(Continued)
46
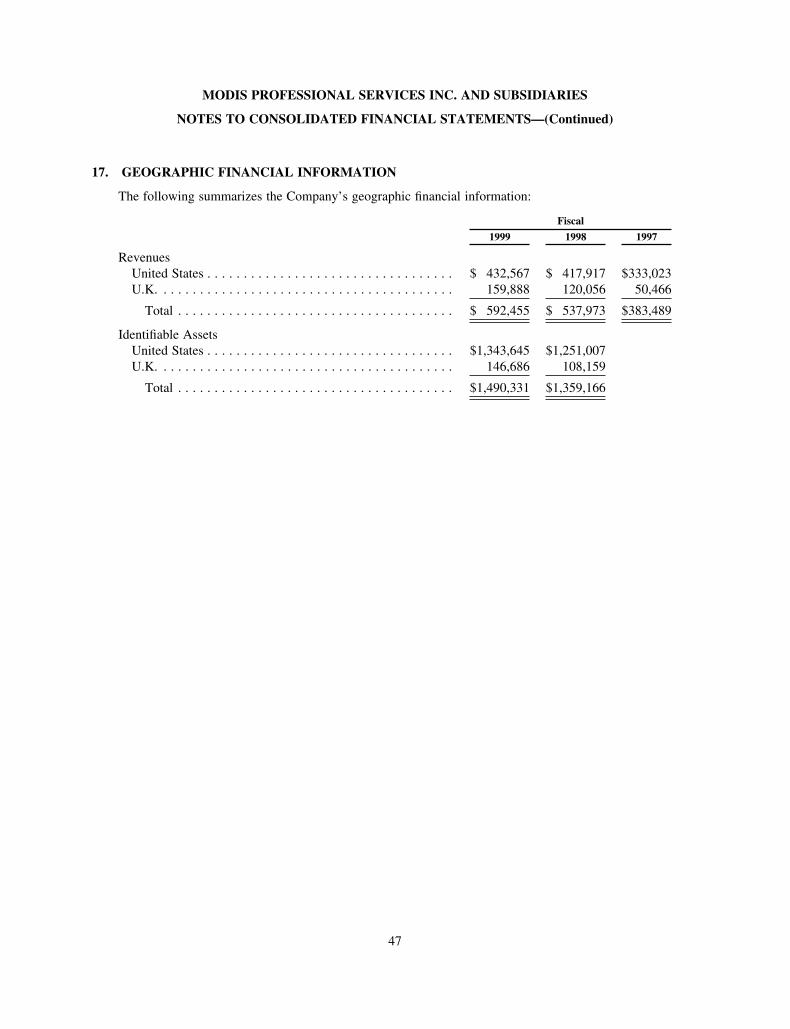
17. GEOGRAPHIC FINANCIAL INFORMATION
The following summarizes the Company’s geographic financial information:
Fiscal
1999 1998 1997
RevenuesUnited States . . . . . . . . . . . . . . . . . . . . . . . . . . . . . . . . . . $ 432,567 $ 417,917 $333,023U.K. . . . . . . . . . . . . . . . . . . . . . . . . . . . . . . . . . . . . . . . . 159,888 120,056 50,466
Total . . . . . . . . . . . . . . . . . . . . . . . . . . . . . . . . . . . . . . $ 592,455 $ 537,973 $383,489
Identifiable AssetsUnited States . . . . . . . . . . . . . . . . . . . . . . . . . . . . . . . . . . $1,343,645 $1,251,007U.K. . . . . . . . . . . . . . . . . . . . . . . . . . . . . . . . . . . . . . . . . 146,686 108,159
Total . . . . . . . . . . . . . . . . . . . . . . . . . . . . . . . . . . . . . . $1,490,331 $1,359,166
MODIS PROFESSIONAL SERVICES INC. AND SUBSIDIARIES
NOTES TO CONSOLIDATED FINANCIAL STATEMENTS—(Continued)
47
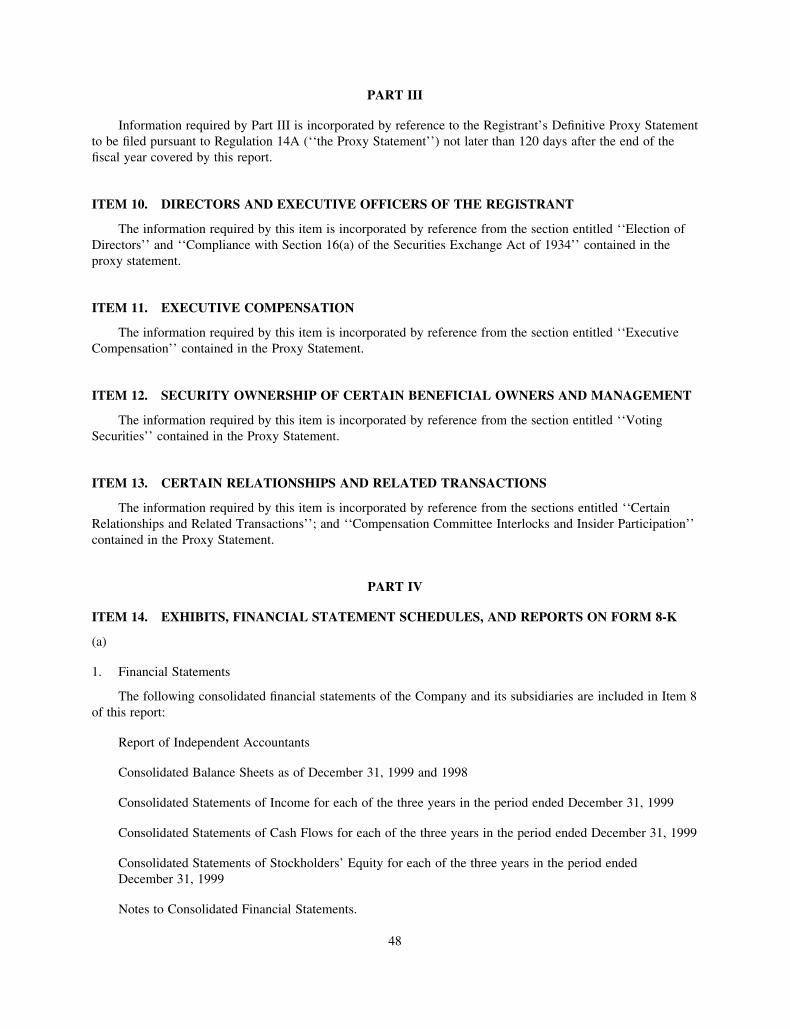
PART III
Information required by Part III is incorporated by reference to the Registrant’s Definitive Proxy Statementto be filed pursuant to Regulation 14A (‘‘the Proxy Statement’’) not later than 120 days after the end of thefiscal year covered by this report.
ITEM 10. DIRECTORS AND EXECUTIVE OFFICERS OF THE REGISTRANT
The information required by this item is incorporated by reference from the section entitled ‘‘Election ofDirectors’’ and ‘‘Compliance with Section 16(a) of the Securities Exchange Act of 1934’’ contained in theproxy statement.
ITEM 11. EXECUTIVE COMPENSATION
The information required by this item is incorporated by reference from the section entitled ‘‘ExecutiveCompensation’’ contained in the Proxy Statement.
ITEM 12. SECURITY OWNERSHIP OF CERTAIN BENEFICIAL OWNERS AND MANAGEMENT
The information required by this item is incorporated by reference from the section entitled ‘‘VotingSecurities’’ contained in the Proxy Statement.
ITEM 13. CERTAIN RELATIONSHIPS AND RELATED TRANSACTIONS
The information required by this item is incorporated by reference from the sections entitled ‘‘CertainRelationships and Related Transactions’’; and ‘‘Compensation Committee Interlocks and Insider Participation’’contained in the Proxy Statement.
PART IV
ITEM 14. EXHIBITS, FINANCIAL STATEMENT SCHEDULES, AND REPORTS ON FORM 8-K
(a)
1. Financial Statements
The following consolidated financial statements of the Company and its subsidiaries are included in Item 8of this report:
Report of Independent Accountants
Consolidated Balance Sheets as of December 31, 1999 and 1998
Consolidated Statements of Income for each of the three years in the period ended December 31, 1999
Consolidated Statements of Cash Flows for each of the three years in the period ended December 31, 1999
Consolidated Statements of Stockholders’ Equity for each of the three years in the period endedDecember 31, 1999
Notes to Consolidated Financial Statements.
48
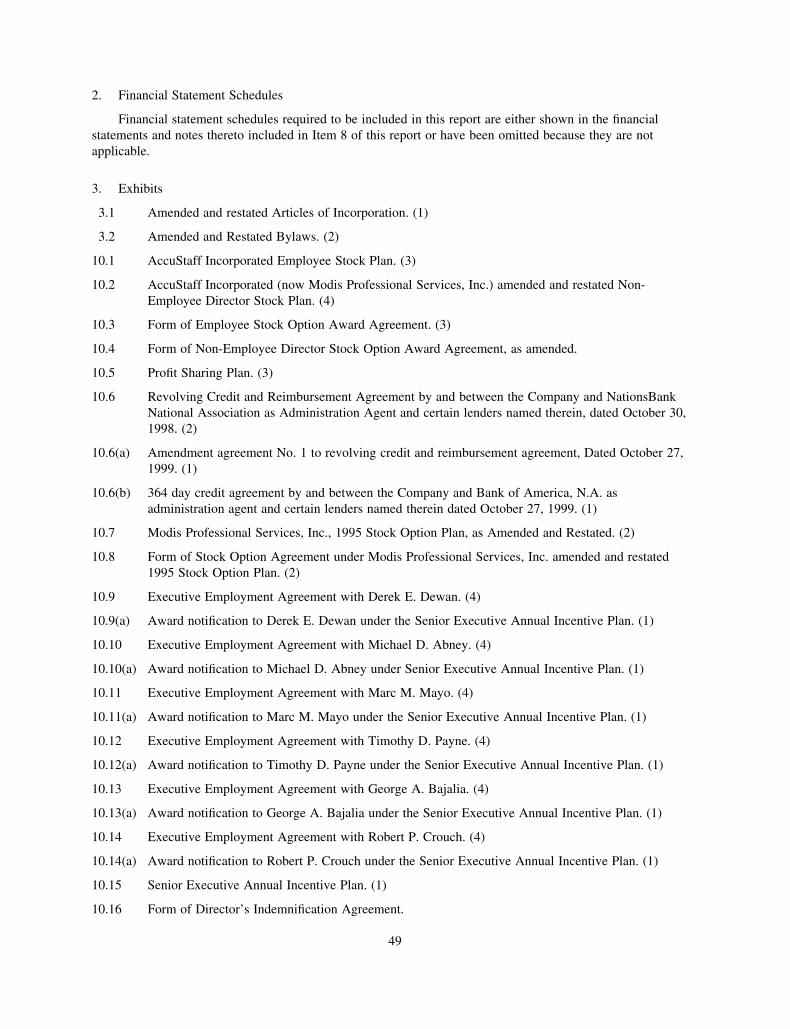
2. Financial Statement Schedules
Financial statement schedules required to be included in this report are either shown in the financialstatements and notes thereto included in Item 8 of this report or have been omitted because they are notapplicable.
3. Exhibits
3.1 Amended and restated Articles of Incorporation. (1)
3.2 Amended and Restated Bylaws. (2)
10.1 AccuStaff Incorporated Employee Stock Plan. (3)
10.2 AccuStaff Incorporated (now Modis Professional Services, Inc.) amended and restated Non-Employee Director Stock Plan. (4)
10.3 Form of Employee Stock Option Award Agreement. (3)
10.4 Form of Non-Employee Director Stock Option Award Agreement, as amended.
10.5 Profit Sharing Plan. (3)
10.6 Revolving Credit and Reimbursement Agreement by and between the Company and NationsBankNational Association as Administration Agent and certain lenders named therein, dated October 30,1998. (2)
10.6(a) Amendment agreement No. 1 to revolving credit and reimbursement agreement, Dated October 27,1999. (1)
10.6(b) 364 day credit agreement by and between the Company and Bank of America, N.A. asadministration agent and certain lenders named therein dated October 27, 1999. (1)
10.7 Modis Professional Services, Inc., 1995 Stock Option Plan, as Amended and Restated. (2)
10.8 Form of Stock Option Agreement under Modis Professional Services, Inc. amended and restated1995 Stock Option Plan. (2)
10.9 Executive Employment Agreement with Derek E. Dewan. (4)
10.9(a) Award notification to Derek E. Dewan under the Senior Executive Annual Incentive Plan. (1)
10.10 Executive Employment Agreement with Michael D. Abney. (4)
10.10(a) Award notification to Michael D. Abney under Senior Executive Annual Incentive Plan. (1)
10.11 Executive Employment Agreement with Marc M. Mayo. (4)
10.11(a) Award notification to Marc M. Mayo under the Senior Executive Annual Incentive Plan. (1)
10.12 Executive Employment Agreement with Timothy D. Payne. (4)
10.12(a) Award notification to Timothy D. Payne under the Senior Executive Annual Incentive Plan. (1)
10.13 Executive Employment Agreement with George A. Bajalia. (4)
10.13(a) Award notification to George A. Bajalia under the Senior Executive Annual Incentive Plan. (1)
10.14 Executive Employment Agreement with Robert P. Crouch. (4)
10.14(a) Award notification to Robert P. Crouch under the Senior Executive Annual Incentive Plan. (1)
10.15 Senior Executive Annual Incentive Plan. (1)
10.16 Form of Director’s Indemnification Agreement.
49
10.17 Form of Officer’s Indemnification Agreement.
21 Subsidiaries of the Registrant.
23 Consent of PricewaterhouseCoopers LLP.
27 Financial Data Schedule.
(1) Incorporated by reference to the Company’s Quarterly Report on Form 10-Q filed November 15, 1999.
(2) Incorporated by reference to the Company’s Annual Report on Form 10-K filed March 31, 1999.
(3) Incorporated by reference to the Company’s Registration on Form S-1 (No. 33-78906).
(4) Incorporated by reference to the Company’s Quarterly Report on Form 10-Q filed August 16, 1999.
(b) Reports on Form 8-K.
No reports on Form 8-K were filed during the final quarter of fiscal 1999.
50
SIGNATURES
Pursuant to the requirements of Section 13 or 15(d) of the Securities Exchange Act of 1934, the registranthas duly caused this report to be signed on its behalf by the undersigned, thereunto duly authorized.
MODIS PROFESSIONAL SERVICES, INC.
/S/ DEREK E. DEWANBy:Derek E. Dewan
President, Chairman of the Boardand Chief Executive Officer
Date: March 30, 2000
Pursuant to the requirements of Securities Exchange Act of 1934, this report has been signed below by thefollowing persons on behalf of the registrant and in the capacities and on the dates indicated.
Signatures Title Date
/s/ DEREK E. DEWAN
Derek E. Dewan
President, Chairman of the Boardand Chief Executive Officer
March 30, 2000
/S/ MICHAEL D. ABNEY
Michael D. Abney
Senior Vice President, ChiefFinancial Officer, Treasurer, andDirector
March 30, 2000
/S/ ROBERT P. CROUCH
Robert P. Crouch
Vice President and ChiefAccounting Officer
March 30, 2000
/S/ T. WAYNE DAVIS
T. Wayne Davis
Director March 30, 2000
/S/ PETER J. TANOUS
Peter J. Tanous
Director March 30, 2000
/S/ JOHN R. KENNEDY
John R. Kennedy
Director March 30, 2000
51

EXHIBIT INDEX
10.4 Form of Non-Employee Director Stock Option Award Agreement, as amended.
10.16 Form of Director’s Indemnification Agreement.
10.17 Form of Officer’s Indemnification Agreement.
21 Subsidiaries of the Registrant.
23 Consent of PricewaterhouseCoopers LLP.
27 Financial Data Schedule.
52
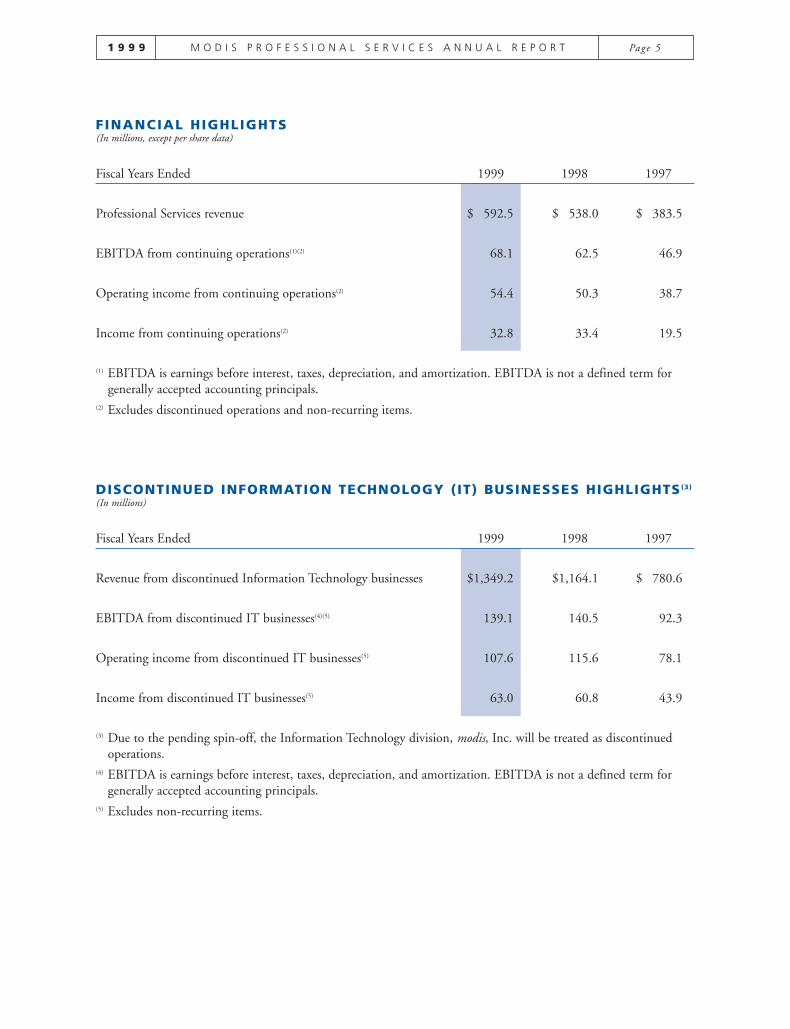
1 9 9 9 M O D I S P R O F E S S I O N A L S E R V I C E S A N N U A L R E P O R T Page 5
FINANCIAL HIGHLIGHTS(In millions, except per share data)
Fiscal Years Ended 1999 1998 1997
Professional Services revenue $1,592.5 $1,538.0 $1,383.5
EBITDA from continuing operations(1)(2) 68.1 62.5 46.9
Operating income from continuing operations(2) 54.4 50.3 38.7
Income from continuing operations(2) 32.8 33.4 19.5
(1) EBITDA is earnings before interest, taxes, depreciation, and amortization. EBITDA is not a defined term forgenerally accepted accounting principals.
(2) Excludes discontinued operations and non-recurring items.
DISCONTINUED INFORMATION TECHNOLOGY (IT) BUSINESSES HIGHLIGHTS(3)
(In millions)
Fiscal Years Ended 1999 1998 1997
Revenue from discontinued Information Technology businesses $1,349.2 $1,164.1 $1,780.6
EBITDA from discontinued IT businesses(4)(5) 139.1 140.5 92.3
Operating income from discontinued IT businesses(5) 107.6 115.6 78.1
Income from discontinued IT businesses(5) 63.0 60.8 43.9
(3) Due to the pending spin-off, the Information Technology division, modis, Inc. will be treated as discontinuedoperations.
(4) EBITDA is earnings before interest, taxes, depreciation, and amortization. EBITDA is not a defined term forgenerally accepted accounting principals.
(5) Excludes non-recurring items.
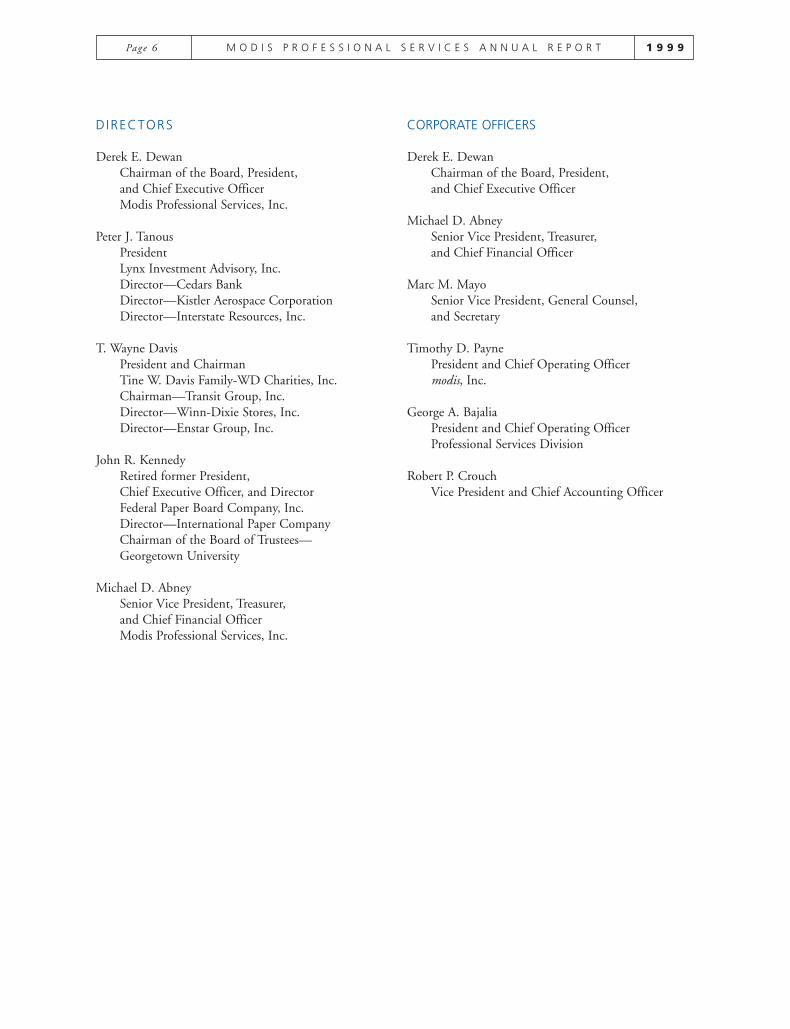
Page 6 M O D I S P R O F E S S I O N A L S E R V I C E S A N N U A L R E P O R T 1 9 9 9
DIRECTORS
Derek E. DewanChairman of the Board, President,and Chief Executive OfficerModis Professional Services, Inc.
Peter J. TanousPresidentLynx Investment Advisory, Inc.Director—Cedars BankDirector—Kistler Aerospace CorporationDirector—Interstate Resources, Inc.
T. Wayne DavisPresident and ChairmanTine W. Davis Family-WD Charities, Inc.Chairman—Transit Group, Inc.Director—Winn-Dixie Stores, Inc.Director—Enstar Group, Inc.
John R. KennedyRetired former President, Chief Executive Officer, and DirectorFederal Paper Board Company, Inc.Director—International Paper CompanyChairman of the Board of Trustees—Georgetown University
Michael D. AbneySenior Vice President, Treasurer,and Chief Financial OfficerModis Professional Services, Inc.
CORPORATE OFFICERS
Derek E. DewanChairman of the Board, President,and Chief Executive Officer
Michael D. AbneySenior Vice President, Treasurer,and Chief Financial Officer
Marc M. MayoSenior Vice President, General Counsel, and Secretary
Timothy D. PaynePresident and Chief Operating Officermodis, Inc.
George A. BajaliaPresident and Chief Operating OfficerProfessional Services Division
Robert P. CrouchVice President and Chief Accounting Officer
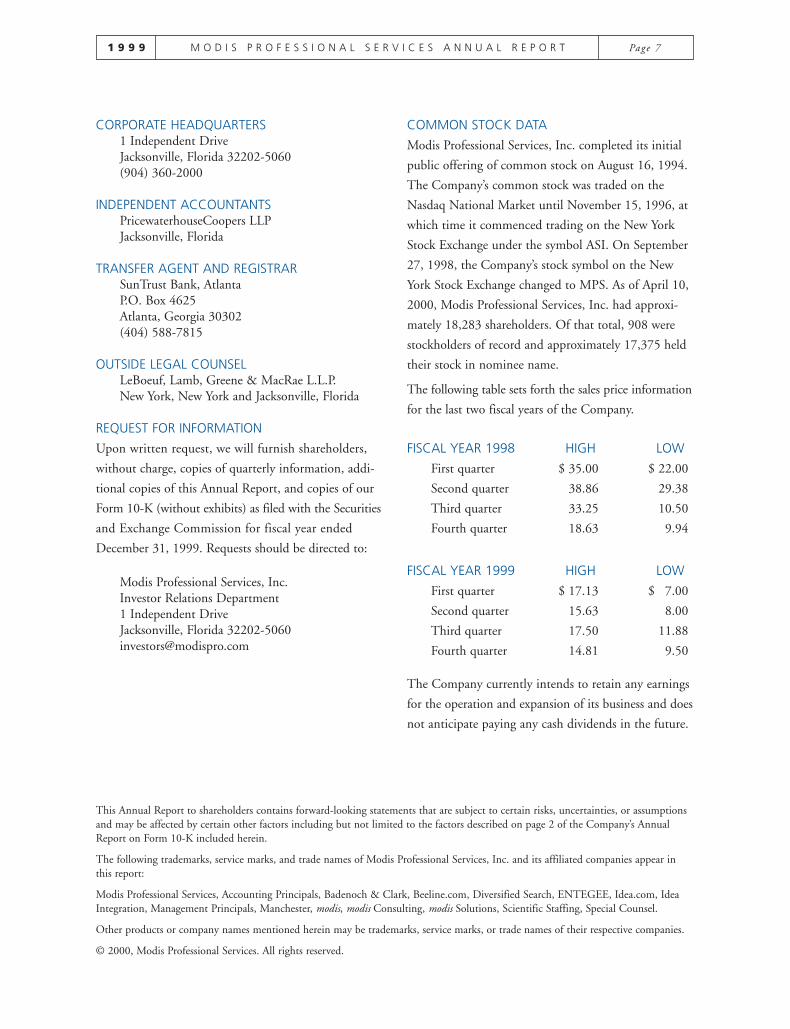
1 9 9 9 M O D I S P R O F E S S I O N A L S E R V I C E S A N N U A L R E P O R T Page 7
CORPORATE HEADQUARTERS1 Independent DriveJacksonville, Florida 32202-5060(904) 360-2000
INDEPENDENT ACCOUNTANTSPricewaterhouseCoopers LLPJacksonville, Florida
TRANSFER AGENT AND REGISTRARSunTrust Bank, AtlantaP.O. Box 4625Atlanta, Georgia 30302(404) 588-7815
OUTSIDE LEGAL COUNSELLeBoeuf, Lamb, Greene & MacRae L.L.P.New York, New York and Jacksonville, Florida
REQUEST FOR INFORMATION
Upon written request, we will furnish shareholders,
without charge, copies of quarterly information, addi-
tional copies of this Annual Report, and copies of our
Form 10-K (without exhibits) as filed with the Securities
and Exchange Commission for fiscal year ended
December 31, 1999. Requests should be directed to:
Modis Professional Services, Inc.Investor Relations Department1 Independent DriveJacksonville, Florida [email protected]
COMMON STOCK DATA
Modis Professional Services, Inc. completed its initial
public offering of common stock on August 16, 1994.
The Company’s common stock was traded on the
Nasdaq National Market until November 15, 1996, at
which time it commenced trading on the New York
Stock Exchange under the symbol ASI. On September
27, 1998, the Company’s stock symbol on the New
York Stock Exchange changed to MPS. As of April 10,
2000, Modis Professional Services, Inc. had approxi-
mately 18,283 shareholders. Of that total, 908 were
stockholders of record and approximately 17,375 held
their stock in nominee name.
The following table sets forth the sales price information
for the last two fiscal years of the Company.
FISCAL YEAR 1998 HIGH LOW
First quarter $ 35.00 $ 22.00
Second quarter 38.86 29.38
Third quarter 33.25 10.50
Fourth quarter 18.63 9.94
FISCAL YEAR 1999 HIGH LOW
First quarter $ 17.13 $ 17.00
Second quarter 15.63 8.00
Third quarter 17.50 11.88
Fourth quarter 14.81 9.50
The Company currently intends to retain any earnings
for the operation and expansion of its business and does
not anticipate paying any cash dividends in the future.
This Annual Report to shareholders contains forward-looking statements that are subject to certain risks, uncertainties, or assumptionsand may be affected by certain other factors including but not limited to the factors described on page 2 of the Company’s AnnualReport on Form 10-K included herein.
The following trademarks, service marks, and trade names of Modis Professional Services, Inc. and its affiliated companies appear inthis report:
Modis Professional Services, Accounting Principals, Badenoch & Clark, Beeline.com, Diversified Search, ENTEGEE, Idea.com, IdeaIntegration, Management Principals, Manchester, modis, modis Consulting, modis Solutions, Scientific Staffing, Special Counsel.
Other products or company names mentioned herein may be trademarks, service marks, or trade names of their respective companies.
© 2000, Modis Professional Services. All rights reserved.
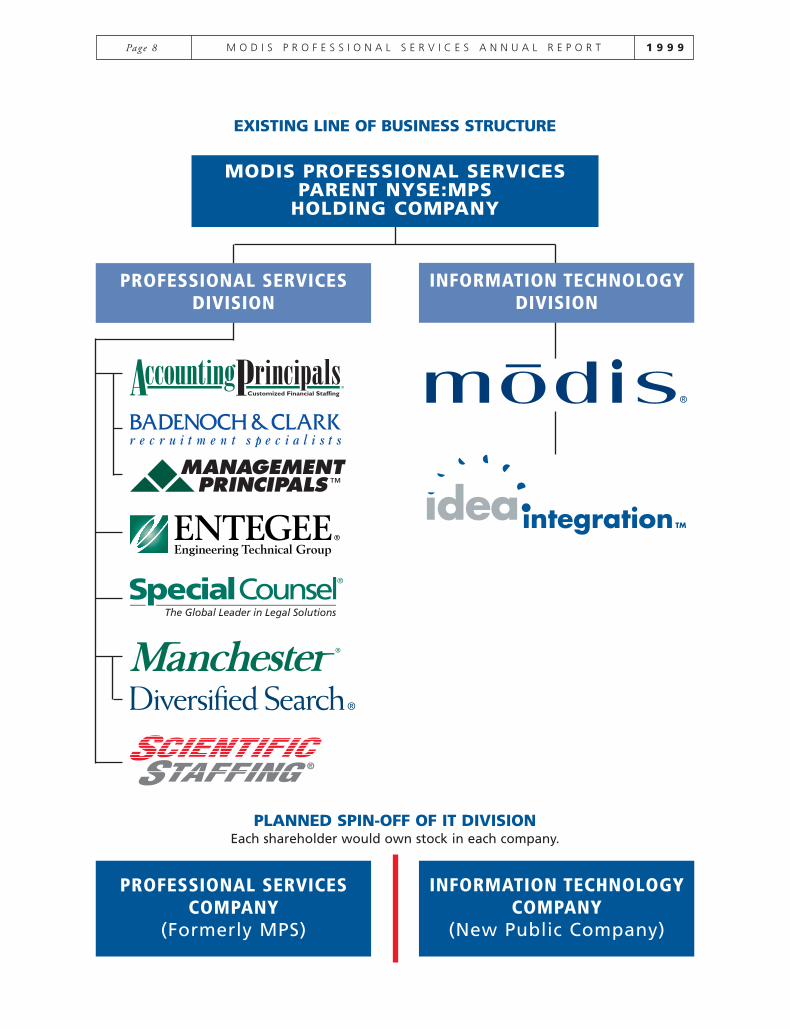
Page 8 M O D I S P R O F E S S I O N A L S E R V I C E S A N N U A L R E P O R T 1 9 9 9
PROFESSIONAL SERVICESDIVISION
INFORMATION TECHNOLOGYDIVISION
MODIS PROFESSIONAL SERVICESPARENT NYSE:MPS
HOLDING COMPANY
PROFESSIONAL SERVICESCOMPANY
(Formerly MPS)
PLANNED SPIN-OFF OF IT DIVISIONEach shareholder would own stock in each company.
INFORMATION TECHNOLOGYCOMPANY
(New Public Company)
EXISTING LINE OF BUSINESS STRUCTURE


1 INDEPENDENT DRIVE
JACKSONVILLE, FLORIDA 32202-5060
(904) 360-2000
WWW.MODISPRO.COM