Embed Size (px)
DESCRIPTION
1988-Stuberg-marcha niños
Citation preview
1988; 68:1221-1225.PHYS THER. Wendy BruceWayne A Stuberg, Vicki L Colerick, Daniel J Blanke and16-mm CinematographyVideography and Temporal-Distance Measures with Comparison of a Clinical Gait Analysis Method Using
http://ptjournal.apta.org/content/68/8/1221be found online at: The online version of this article, along with updated information and services, can
Collections
Tests and Measurements Kinesiology/Biomechanics
Gait Disorders Cerebral Palsy (Pediatrics)
Cerebral Palsy in the following collection(s): This article, along with others on similar topics, appears
e-Letters
"Responses" in the online version of this article. "Submit a response" in the right-hand menu under
or click onhere To submit an e-Letter on this article, click
E-mail alerts to receive free e-mail alerts hereSign up
at Universidad Del Rosario on July 15, 2014http://ptjournal.apta.org/Downloaded from at Universidad Del Rosario on July 15, 2014http://ptjournal.apta.org/Downloaded from
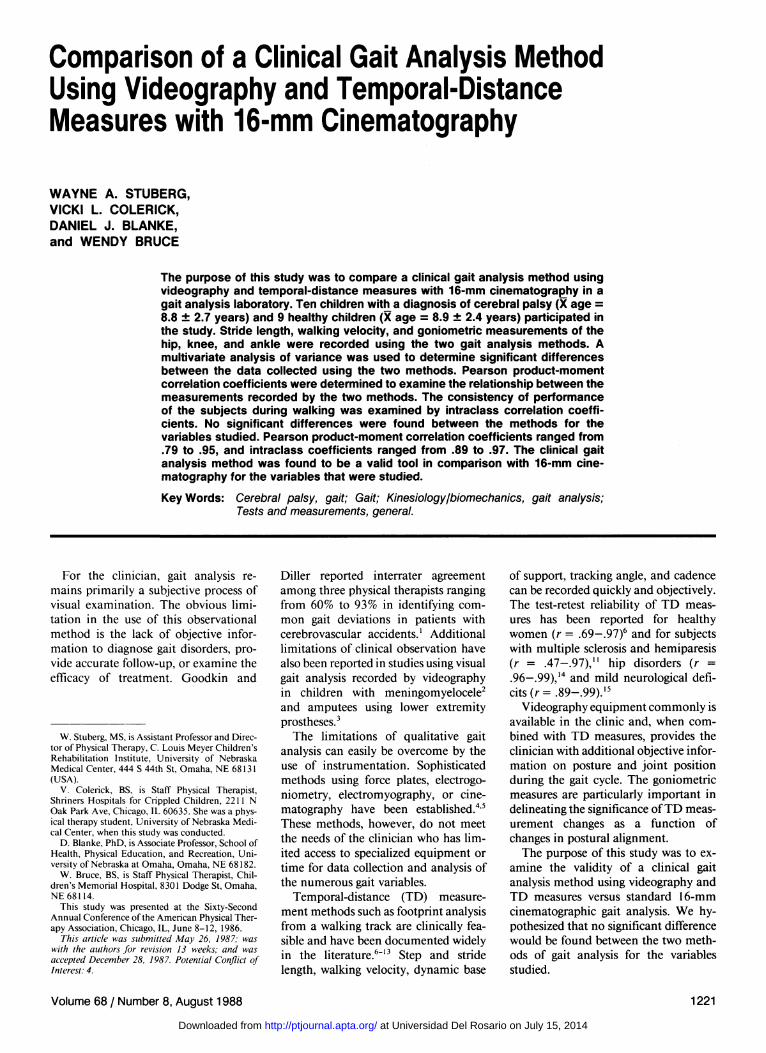
Comparison of a Clinical Gait Analysis Method Using Videography and Temporal-Distance Measures with 16-mm Cinematography
WAYNE A. STUBERG, VICKI L. COLERICK, DANIEL J. BLANKE, and WENDY BRUCE
The purpose of this study was to compare a clinical gait analysis method using videography and temporal-distance measures with 16-mm cinematography in a gait analysis laboratory. Ten children with a diagnosis of cerebral palsy ( age = 8.8 ± 2.7 years) and 9 healthy children ( age = 8.9 ± 2.4 years) participated in the study. Stride length, walking velocity, and goniometric measurements of the hip, knee, and ankle were recorded using the two gait analysis methods. A multivariate analysis of variance was used to determine significant differences between the data collected using the two methods. Pearson product-moment correlation coefficients were determined to examine the relationship between the measurements recorded by the two methods. The consistency of performance of the subjects during walking was examined by intraclass correlation coefficients. No significant differences were found between the methods for the variables studied. Pearson product-moment correlation coefficients ranged from .79 to .95, and intraclass coefficients ranged from .89 to .97. The clinical gait analysis method was found to be a valid tool in comparison with 16-mm cinematography for the variables that were studied.
Key words: Cerebral palsy, gait; Gait; Kinesiology/biomechanics, gait analysis; Tests and measurements, general.
For the clinician, gait analysis remains primarily a subjective process of visual examination. The obvious limitation in the use of this observational method is the lack of objective information to diagnose gait disorders, provide accurate follow-up, or examine the efficacy of treatment. Goodkin and
Diller reported interrater agreement among three physical therapists ranging from 60% to 93% in identifying common gait deviations in patients with cerebrovascular accidents.1 Additional limitations of clinical observation have also been reported in studies using visual gait analysis recorded by videography in children with meningomyelocele2
and amputees using lower extremity prostheses.3
The limitations of qualitative gait analysis can easily be overcome by the use of instrumentation. Sophisticated methods using force plates, electrogo-niometry, electromyography, or cinematography have been established.4,5
These methods, however, do not meet the needs of the clinician who has limited access to specialized equipment or time for data collection and analysis of the numerous gait variables.
Temporal-distance (TD) measurement methods such as footprint analysis from a walking track are clinically feasible and have been documented widely in the literature.6-13 Step and stride length, walking velocity, dynamic base
of support, tracking angle, and cadence can be recorded quickly and objectively. The test-retest reliability of TD measures has been reported for healthy women (r = .69-.97)6 and for subjects with multiple sclerosis and hemiparesis (r = .47-.97),11 hip disorders (r = .96-.99),14 and mild neurological deficits(r = .89-.99).15
Videography equipment commonly is available in the clinic and, when combined with TD measures, provides the clinician with additional objective information on posture and joint position during the gait cycle. The goniometric measures are particularly important in delineating the significance of TD measurement changes as a function of changes in postural alignment.
The purpose of this study was to examine the validity of a clinical gait analysis method using videography and TD measures versus standard 16-mm cinematographic gait analysis. We hypothesized that no significant difference would be found between the two methods of gait analysis for the variables studied.
W. Stuberg, MS, is Assistant Professor and Director of Physical Therapy, C. Louis Meyer Children's Rehabilitation Institute, University of Nebraska Medical Center, 444 S 44th St, Omaha, NE 68131 (USA).
V. Colerick, BS, is Staff Physical Therapist, Shriners Hospitals for Crippled Children, 2211 N Oak Park Ave, Chicago, IL 60635. She was a physical therapy student, University of Nebraska Medical Center, when this study was conducted.
D. Blanke, PhD, is Associate Professor, School of Health, Physical Education, and Recreation, University of Nebraska at Omaha, Omaha, NE 68182.
W. Bruce, BS, is Staff Physical Therapist, Children's Memorial Hospital, 8301 Dodge St, Omaha, NE 68114.
This study was presented at the Sixty-Second Annual Conference of the American Physical Therapy Association, Chicago, IL, June 8—12, 1986.
This article was submitted May 26, 1987; was with the authors for revision 13 weeks; and was accepted December 28, 1987. Potential Conflict of Interest: 4.
Volume 68 / Number 8, August 1988 1221
at Universidad Del Rosario on July 15, 2014http://ptjournal.apta.org/Downloaded from
METHOD
Subjects Nineteen children, aged 7 to 12 years,
participated in the project. Ten children were diagnosed as having cerebral palsy (5 with spastic diplegia, 3 with spastic quadriplegia, and 2 with spastic left hemiplegia), and the other 9 children had no history of neuromuscular disorders. The children in the Cerebral Palsy Group ( age = 8.8 ± 2.7 years) were receiving therapy services at C. Louis Meyer Children's Rehabilitation Institute, and the children in the Unimpaired Group ( age = 8.9 ± 2.4 years) were siblings or volunteers. All children were independently ambulatory for distances greater than 50 m without orthoses or assistive devices. Informed consent following university guidelines for research involving human subjects was obtained before data collection.
Instrumentation
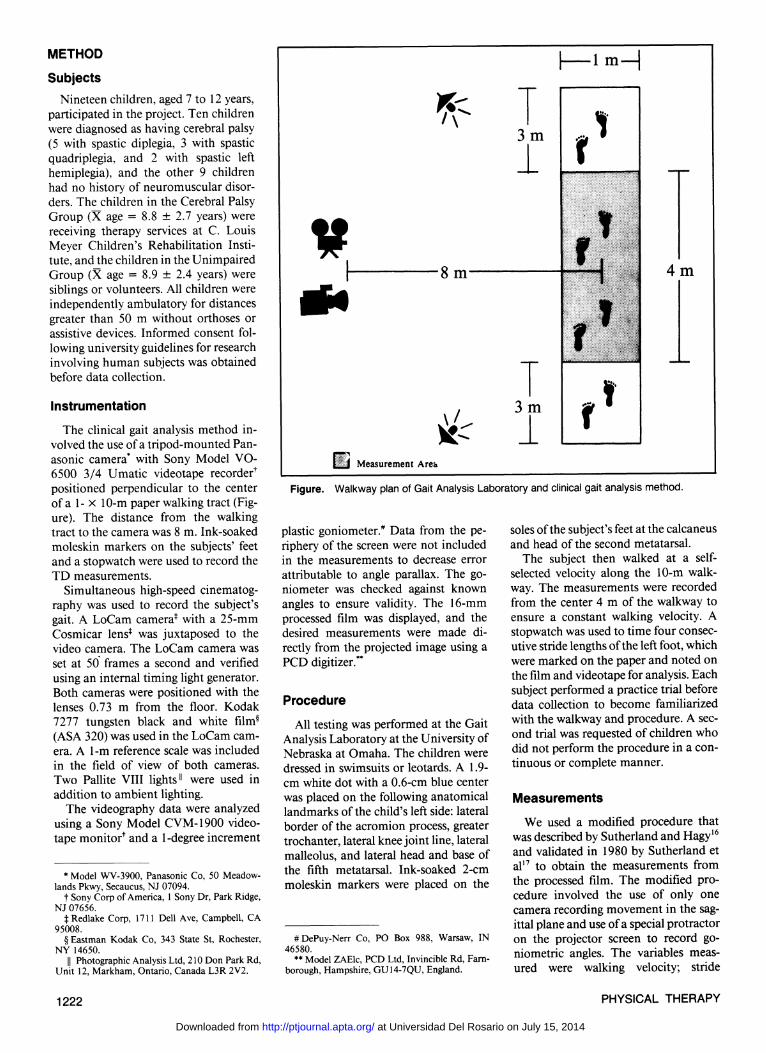
The clinical gait analysis method involved the use of a tripod-mounted Panasonic camera* with Sony Model VO-6500 3/4 Umatic videotape recorder†
positioned perpendicular to the center of a 1- × 10-m paper walking tract (Figure). The distance from the walking tract to the camera was 8 m. Ink-soaked moleskin markers on the subjects' feet and a stopwatch were used to record the TD measurements.
Simultaneous high-speed cinematography was used to record the subject's gait. A LoCam camera‡ with a 25-mm Cosmicar lens‡ was juxtaposed to the video camera. The LoCam camera was set at 50 frames a second and verified using an internal timing light generator. Both cameras were positioned with the lenses 0.73 m from the floor. Kodak 7277 tungsten black and white film§
(ASA 320) was used in the LoCam camera. A 1-m reference scale was included in the field of view of both cameras. Two Pallite VIII lights║ were used in addition to ambient lighting.
The videography data were analyzed using a Sony Model CVM-1900 videotape monitor† and a 1-degree increment
plastic goniometer.# Data from the periphery of the screen were not included in the measurements to decrease error attributable to angle parallax. The goniometer was checked against known angles to ensure validity. The 16-mm processed film was displayed, and the desired measurements were made directly from the projected image using a PCD digitizer.**
Procedure
All testing was performed at the Gait Analysis Laboratory at the University of Nebraska at Omaha. The children were dressed in swimsuits or leotards. A 1.9-cm white dot with a 0.6-cm blue center was placed on the following anatomical landmarks of the child's left side: lateral border of the acromion process, greater trochanter, lateral knee joint line, lateral malleolus, and lateral head and base of the fifth metatarsal. Ink-soaked 2-cm moleskin markers were placed on the
soles of the subject's feet at the calcaneus and head of the second metatarsal.
The subject then walked at a self-selected velocity along the 10-m walkway. The measurements were recorded from the center 4 m of the walkway to ensure a constant walking velocity. A stopwatch was used to time four consecutive stride lengths of the left foot, which were marked on the paper and noted on the film and videotape for analysis. Each subject performed a practice trial before data collection to become familiarized with the walkway and procedure. A second trial was requested of children who did not perform the procedure in a continuous or complete manner.
Measurements
We used a modified procedure that was described by Sutherland and Hagy16
and validated in 1980 by Sutherland et al17 to obtain the measurements from the processed film. The modified procedure involved the use of only one camera recording movement in the sagittal plane and use of a special protractor on the projector screen to record go-niometric angles. The variables measured were walking velocity; stride
Figure. Walkway plan of Gait Analysis Laboratory and clinical gait analysis method.
* Model WV-3900, Panasonic Co, 50 Meadow-lands Pkwy, Secaucus, NJ 07094.
† Sony Corp of America, 1 Sony Dr, Park Ridge, NJ 07656.
‡ Redlake Corp, 1711 Dell Ave, Campbell, CA 95008.
§ Eastman Kodak Co, 343 State St, Rochester, NY 14650.
|| Photographic Analysis Ltd, 210 Don Park Rd, Unit 12, Markham, Ontario, Canada L3R 2V2.
# DePuy-Nerr Co, PO Box 988, Warsaw, IN 46580.
** Model ZAElc, PCD Ltd, Invincible Rd, Farn-borough, Hampshire, GU14-7QU, England.
1222 PHYSICAL THERAPY
at Universidad Del Rosario on July 15, 2014http://ptjournal.apta.org/Downloaded from
RESEARCH length; and hip, knee, and ankle angle at mid-stance. Mid-stance was defined as the point in the gait cycle when a line bisecting the trochanter and lateral malleolar marker was perpendicular to the floor. Stride length was measured as the distance between two consecutive left heel-strikes. Actual stride length was calculated by multiplying the scale factor obtained from the 1-m reference scale in the camera view by the measured film stride length. Average walking velocity was recorded as the total distance traveled during three consecutive strides divided by the amount of time elapsed during the movements. The amount of time elapsed was calculated by counting the number of frames for the desired movement and dividing the number of frames by the film speed of the camera. Walking velocity was then calculated by dividing the distance by the amount of time elapsed. Three strides were used for the data analysis because the fourth stride was commonly on the edge of the video monitor. Four strides could have been measured for all children using the film data. Goniometric angles were measured directly from the viewing screen using the digitizer's protractor. The axis of the protractor was positioned over the corresponding joint marker (eg, at the knee), and the protractor arms were then positioned to bisect the adjacent joint markers (eg, at the hip and ankle).
Stride lengths for the clinical gait analysis method were measured directly from the walkway footprints. Walking velocity was calculated by dividing the distance between the first and fourth heel prints by the amount of time elapsed on the stopwatch.
Goniometric measurements of the hip, knee, and ankle were measured from the videotape monitor screen using a 1-degree increment goniometer. Stop action of the videotape and a plumb line on the screen were used to identify the mid-stance phase of the gait cycle. The measurements were then recorded for the three consecutive gait cycles corresponding to the measurements obtained from the film data. All videotape and film measurements were recorded by one author (W.A.S.), and the walkway measurements were recorded by another author (V.L.C.).
Data Analysis
A multivariate analysis of variance (ANOVA) was used to compare average left stride length and goniometric meas
urements at the hip, knee, and ankle as recorded by 16-mm cinematography versus videography and the TD measurements. A paired t test was used to compare the determination of walking velocity by the two methods. The t test was used for walking velocity because only one measurement per child was obtained, as opposed to the three repeated measurements for the other variables. Pearson product-moment correlation coefficients were also calculated to determine the relationship between the two methods of gait analysis. The two groups of children were combined for the data analysis, and the correlations were calculated using the mean value of the three strides for each variable except walking velocity. Intraclass correlation coefficients (ICC[3,1]) were calculated to determine the consistency of performance between the three strides used for the data analysis. All comparisons were evaluated at the .05 level of significance.
RESULTS
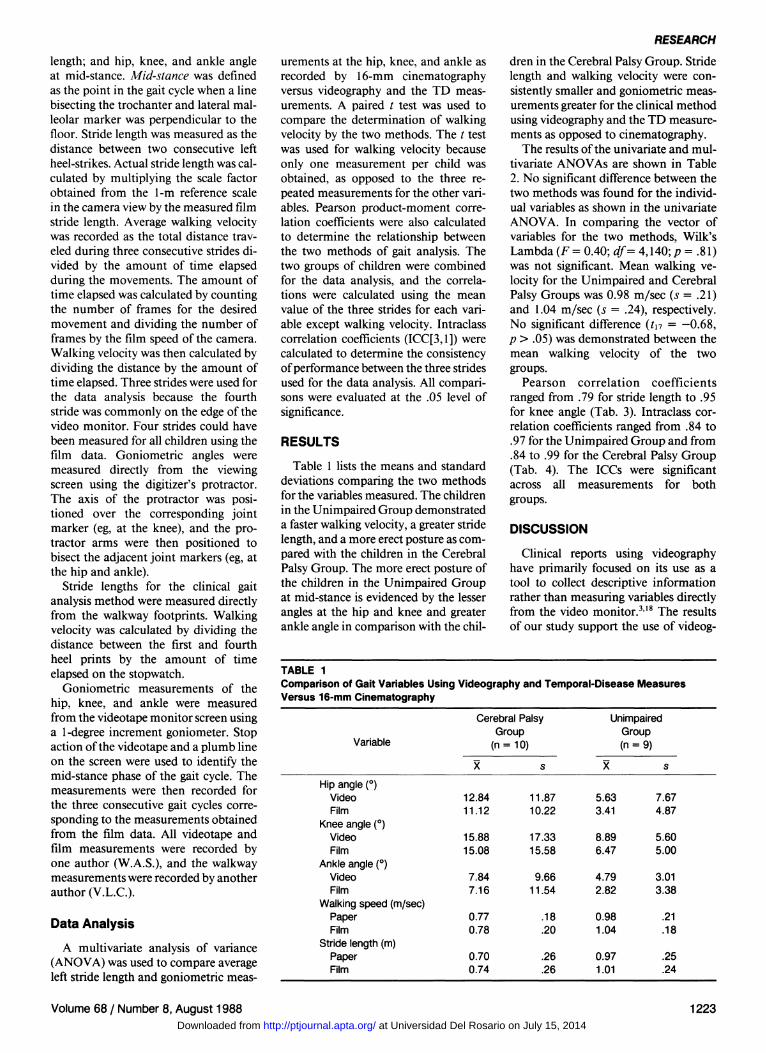
Table 1 lists the means and standard deviations comparing the two methods for the variables measured. The children in the Unimpaired Group demonstrated a faster walking velocity, a greater stride length, and a more erect posture as compared with the children in the Cerebral Palsy Group. The more erect posture of the children in the Unimpaired Group at mid-stance is evidenced by the lesser angles at the hip and knee and greater ankle angle in comparison with the chil
dren in the Cerebral Palsy Group. Stride length and walking velocity were consistently smaller and goniometric measurements greater for the clinical method using videography and the TD measurements as opposed to cinematography.
The results of the univariate and multivariate ANOVAs are shown in Table 2. No significant difference between the two methods was found for the individual variables as shown in the univariate ANOVA. In comparing the vector of variables for the two methods, Wilk's Lambda (F = 0.40; df= 4,140; p = .81) was not significant. Mean walking velocity for the Unimpaired and Cerebral Palsy Groups was 0.98 m/sec (s = .21) and 1.04 m/sec (s = .24), respectively. No significant difference (t17 = -0.68, p > .05) was demonstrated between the mean walking velocity of the two groups.
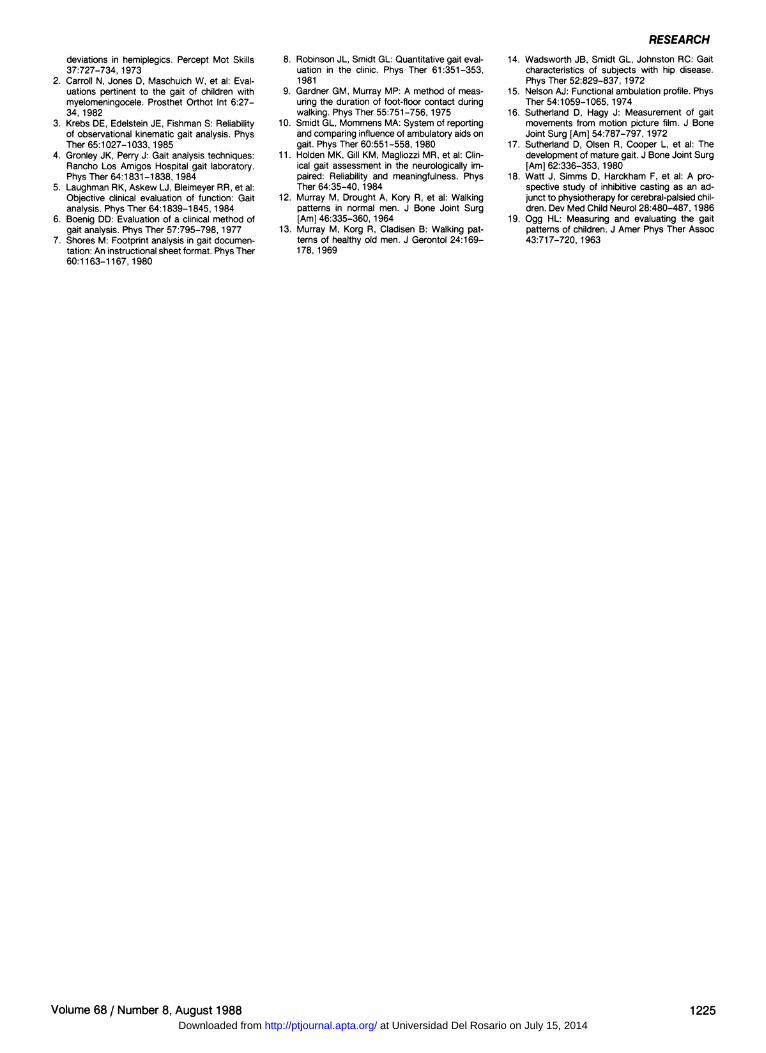
Pearson correlation coefficients ranged from .79 for stride length to .95 for knee angle (Tab. 3). Intraclass correlation coefficients ranged from .84 to .97 for the Unimpaired Group and from .84 to .99 for the Cerebral Palsy Group (Tab. 4). The ICCs were significant across all measurements for both groups.
DISCUSSION
Clinical reports using videography have primarily focused on its use as a tool to collect descriptive information rather than measuring variables directly from the video monitor.3,18 The results of our study support the use of videog-
TABLE 1 Comparison of Gait Variables Using Videography and Temporal-Disease Measures Versus 16-mm Cinematography
Variable
Hip angle (°) Video Film
Knee angle (°) Video Film
Ankle angle (°) Video Film
Walking speed (m/sec) Paper Film
Stride length (m) Paper Film
Cerebral Palsy Group
(n = 10)
12.84 11.12
15.88 15.08
7.84 7.16
0.77 0.78
0.70 0.74
s
11.87 10.22
17.33 15.58
9.66 11.54
.18
.20
.26
.26
Unimpaired Group (n = 9)
5.63 3.41
8.89 6.47
4.79 2.82
0.98 1.04
0.97 1.01
s
7.67 4.87
5.60 5.00
3.01 3.38
.21
.18
.25
.24
Volume 68 / Number 8, August 1988 1223 at Universidad Del Rosario on July 15, 2014http://ptjournal.apta.org/Downloaded from
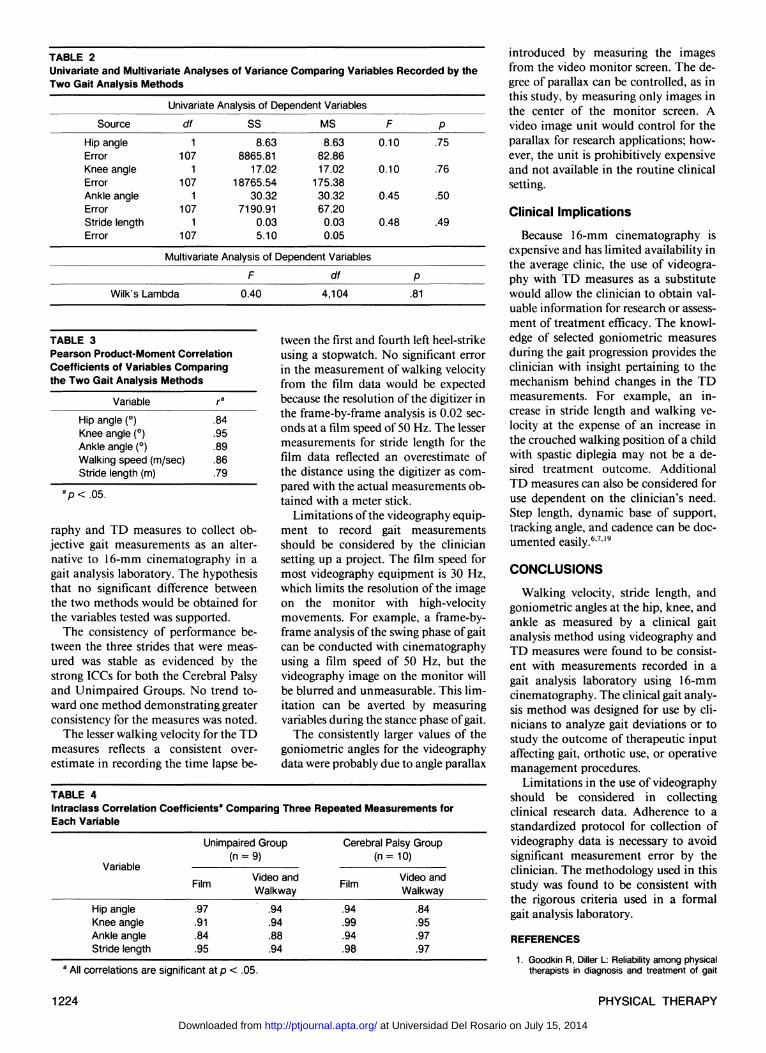
TABLE 2 Univariate and Multivariate Analyses of Variance Comparing Variables Recorded by the Two Gait Analysis Methods
Source
Hip angle Error Knee angle Error Ankle angle Error Stride length Error
Univariate Analysis of Dependent Variables
df
1 107
1 107
1 107
1 107
SS
8.63 8865.81
17.02 18765.54
30.32 7190.91
0.03 5.10
MS
8.63 82.86 17.02
175.38 30.32 67.20
0.03 0.05
F
0.10
0.10
0.45
0.48
Multivariate Analysis of Dependent Variables
Wilk's Lambda
F
0.40
df
4,104 P
.81
P .75
.76
.50
.49
TABLE 3 Pearson Product-Moment Correlation Coefficients of Variables Comparing the Two Gait Analysis Methods
Variable
Hip angle (°) Knee angle (°) Ankle angle (°) Walking speed (m/sec) Stride length (m)
ra
.84
.95
.89
.86
.79
raphy and TD measures to collect objective gait measurements as an alternative to 16-mm cinematography in a gait analysis laboratory. The hypothesis that no significant difference between the two methods would be obtained for the variables tested was supported.
The consistency of performance between the three strides that were measured was stable as evidenced by the strong ICCs for both the Cerebral Palsy and Unimpaired Groups. No trend toward one method demonstrating greater consistency for the measures was noted.
The lesser walking velocity for the TD measures reflects a consistent overestimate in recording the time lapse be
tween the first and fourth left heel-strike using a stopwatch. No significant error in the measurement of walking velocity from the film data would be expected because the resolution of the digitizer in the frame-by-frame analysis is 0.02 seconds at a film speed of 50 Hz. The lesser measurements for stride length for the film data reflected an overestimate of the distance using the digitizer as compared with the actual measurements obtained with a meter stick.
Limitations of the videography equipment to record gait measurements should be considered by the clinician setting up a project. The film speed for most videography equipment is 30 Hz, which limits the resolution of the image on the monitor with high-velocity movements. For example, a frame-by-frame analysis of the swing phase of gait can be conducted with cinematography using a film speed of 50 Hz, but the videography image on the monitor will be blurred and unmeasurable. This limitation can be averted by measuring variables during the stance phase of gait.
The consistently larger values of the goniometric angles for the videography data were probably due to angle parallax
introduced by measuring the images from the video monitor screen. The degree of parallax can be controlled, as in this study, by measuring only images in the center of the monitor screen. A video image unit would control for the parallax for research applications; however, the unit is prohibitively expensive and not available in the routine clinical setting.
Clinical Implications Because 16-mm cinematography is
expensive and has limited availability in the average clinic, the use of videography with TD measures as a substitute would allow the clinician to obtain valuable information for research or assessment of treatment efficacy. The knowledge of selected goniometric measures during the gait progression provides the clinician with insight pertaining to the mechanism behind changes in the TD measurements. For example, an increase in stride length and walking velocity at the expense of an increase in the crouched walking position of a child with spastic diplegia may not be a desired treatment outcome. Additional TD measures can also be considered for use dependent on the clinician's need. Step length, dynamic base of support, tracking angle, and cadence can be documented easily.6,7,19
CONCLUSIONS Walking velocity, stride length, and
goniometric angles at the hip, knee, and ankle as measured by a clinical gait analysis method using videography and TD measures were found to be consistent with measurements recorded in a gait analysis laboratory using 16-mm cinematography. The clinical gait analysis method was designed for use by clinicians to analyze gait deviations or to study the outcome of therapeutic input affecting gait, orthotic use, or operative management procedures.
Limitations in the use of videography should be considered in collecting clinical research data. Adherence to a standardized protocol for collection of videography data is necessary to avoid significant measurement error by the clinician. The methodology used in this study was found to be consistent with the rigorous criteria used in a formal gait analysis laboratory.
REFERENCES 1. Goodkin R, Diller L: Reliability among physical
therapists in diagnosis and treatment of gait
TABLE 4 Intraclass Correlation Coefficientsa Comparing Three Repeated Measurements for Each Variable
Variable
Hip angle Knee angle Ankle angle Stride length
Unimpaired Group (n = 9)
Film
.97
.91
.84
.95
Video and Walkway
.94
.94
.88
.94
Cerebral Palsy Group (n = 10)
Film
.94
.99
.94
.98
Video and Walkway
.84
.95
.97
.97
a p < .05.
a All correlations are significant at p < .05.
1224 PHYSICAL THERAPY
at Universidad Del Rosario on July 15, 2014http://ptjournal.apta.org/Downloaded from
RESEARCH deviations in hemiplegics. Percept Mot Skills 37:727-734, 1973
2. Carroll N, Jones D, Maschuich W, et al: Evaluations pertinent to the gait of children with myelomeningocele. Prosthet Orthot Int 6:27-34, 1982
3. Krebs DE, Edelstein JE, Fishman S: Reliability of observational kinematic gait analysis. Phys Ther 65:1027-1033, 1985
4. Gronley JK, Perry J: Gait analysis techniques: Rancho Los Amigos Hospital gait laboratory. Phys Ther 64:1831-1838, 1984
5. Laughman RK, Askew LJ, Bleimeyer RR, et al: Objective clinical evaluation of function: Gait analysis. Phys Ther 64:1839-1845, 1984
6. Boenig DD: Evaluation of a clinical method of gait analysis. Phys Ther 57:795-798, 1977
7. Shores M: Footprint analysis in gait documentation: An instructional sheet format. Phys Ther 60:1163-1167, 1980
8. Robinson JL, Smidt GL: Quantitative gait evaluation in the clinic. Phys Ther 61:351-353, 1981
9. Gardner GM, Murray MP: A method of measuring the duration of foot-floor contact during walking. Phys Ther 55:751-756, 1975
10. Smidt GL, Mommens MA: System of reporting and comparing influence of ambulatory aids on gait. Phys Ther 60:551-558, 1980
11. Holden MK, Gill KM, Magliozzi MR, et al: Clinical gait assessment in the neurologically impaired: Reliability and meaningfulness. Phys Ther 64:35-40, 1984
12. Murray M, Drought A, Kory R, et al: Walking patterns in normal men. J Bone Joint Surg [Am] 46:335-360, 1964
13. Murray M, Korg R, Cladisen B: Walking patterns of healthy old men. J Gerontol 24:169-178, 1969
14. Wadsworth JB, Smidt GL, Johnston RC: Gait characteristics of subjects with hip disease. Phys Ther 52:829-837, 1972
15. Nelson AJ: Functional ambulation profile. Phys Ther 54:1059-1065, 1974
16. Sutherland D, Hagy J: Measurement of gait movements from motion picture film. J Bone Joint Surg [Am] 54:787-797, 1972
17. Sutherland D, Olsen R, Cooper L, et al: The development of mature gait. J Bone Joint Surg [Am] 62:336-353, 1980
18. Watt J, Simms D, Harckham F, et al: A prospective study of inhibitive casting as an adjunct to physiotherapy for cerebral-palsied children. Dev Med Child Neurol 28:480-487, 1986
19. Ogg HL: Measuring and evaluating the gait patterns of children. J Amer Phys Ther Assoc 43:717-720, 1963
Volume 68 / Number 8, August 1988 1225 at Universidad Del Rosario on July 15, 2014http://ptjournal.apta.org/Downloaded from
1988; 68:1221-1225.PHYS THER. Wendy BruceWayne A Stuberg, Vicki L Colerick, Daniel J Blanke and16-mm CinematographyVideography and Temporal-Distance Measures with Comparison of a Clinical Gait Analysis Method Using
Information Subscription http://ptjournal.apta.org/subscriptions/
Permissions and Reprints http://ptjournal.apta.org/site/misc/terms.xhtml
Information for Authors http://ptjournal.apta.org/site/misc/ifora.xhtml
at Universidad Del Rosario on July 15, 2014http://ptjournal.apta.org/Downloaded from