Embed Size (px)
Citation preview
University of California, San Diego Scripps Institution of Oceanography
Visibility Laboratory La Jolla, California 92093
FLUOROMETRIC TECHNIQUES FOR THE MEASUREMENT OF OCEANIC CHLOROPHYLL
IN THE SUPPORT OF REMOTE SENSING
Raymond C. Smith, Karen S. Baker, Phillip Dustan
SIO Ref. 81-17
MAY 1981
Supported by
NATIONAL AERONAUTICS AND SPACE ADMINISTRATION GRANT NO. NSG-1641
U.S. DEPARTMENT OF COMMERCE NATIONAL OCEANIC AND ATMOSPHERIC ADMINISTRATION
GRANT NO. 04-6-158-44033 GRANT NO. 80AA-D-0OO07
Approved:
Roswell W. Austin, Director
Visibility Laboratory
Approved:
William A. Nierenberg, Director f y ^
Scripps Institution of Oceanography
TABLE OF CONTENTS
1. INTRODUCTION 1
2. FLUOROMETRY 1
CONCEPTS 1
Sensitivity 2
Specificity 2
Linearity 2
FLUORESCENCE AS A MEASURE OF CHLOROPHYLL 2
3. DISCRETE FLUOROMETER CALIBRATION FOR CHLOROPHYLL 2
PIGMENT DEGRADATION 3
CHLOROPHYLL EXTRACT PREPARATION 3
CALIBRATIONS 4
4. DISCRETE DETERMINATION OF CHLOROPHYLL AND PHAEOPHYTIN BY FLUORESCENCE 4
PROCEDURE 4
THEORETICAL BASIS 6
5. CONTINUOUS ESTIMATION OF CHLOROPHYLL BY FLUORESCENCE 8
PROCEDURE 8
THEORETICAL BASIS ; 8
BLANKING 9
6. FIELD DATA AND DISCUSSION 9
FILTER TYPES 9
FILTER TREATMENT II
FLUORESCENCE NUMBER 11
7. CONCLUSIONS 12
8. ACKNOWLEDGEMENTS 13
PREFERENCES 13
FLUOROMETRIC TECHNIQUES FOR THE MEASUREMENT OF OCEANIC CHLOROPHYLL
IN THE SUPPORT OF REMOTE SENSING
1. INTRODUCTION Satellite imagery is now being used to estimate the
near-surface chlorophyll concentration for large ocean areas. To assess the accuracy and precision of these remote sensing techniques, contemporaneous ship and satellite data for the determination of oceanic chlorophyll concentrations have been collected. Since chlorophyll fluorometry is a widely used technique for the determination of chlorophylls at sea, our analyses have led us to review the literature of fluorometry in order to re-examine the assumptions and approximations made when using this field technique.
This report gives a summary of the general concepts of fluorometry, examines important assumptions, presents an outline of an established fluorometer calibration technique, and estimates the accuracy and precision of this methodology. Also included are field observations of the discrete chlorophyll to fluorescence ratio, of the variability of discrete chlorophyll determinations using various particle collecting filters, and of diurnal fluorescence ratio comparisons.
The launch of the Nimbus-7 satellite in October 1978 carrying the Coastal Zone Color Scanner (CZCS) has made possible optical measurements of the oceans from space. Algorithms are presently being developed to relate these optical spectral measurements to the chlorophyll present in the water. Our purpose is to outline our own consistent methodology of along track shipboard fluorescence for the concurrent comparison with satellite derived values of chlorophyll. This report is not intended as a definitive statement on fluorometric techniques, but rather a working document describing our field techniques. Hence, although the theory is general, the specifics apply to the Turner and Turner Designs fluorometers.
2. FLUOROMETRY Fluorometry, the measurement and use of fluoroes-
cence, is a technique of quantitative chemical analysis ideally suited to field use. This technique of optical measurement is inherently sensitive, offers specificity, and is versatile, simple and relatively inexpensive. As a result, fluorometry has found a wide range of applications in the study of natural waters including: chlorophyll and phaeo-pigment analysis, nephelometry, detection of fluorescent
pollutants as well as a host of analyses which make use of fluorescent dyes as tracers.
Fluorometric techniques have the further advantage that several field proven instruments are commercially available to the potential user. These instruments are distinguished not only by their reliability but also by the thoroughness of the accompanying operational instructions and supporting scientific reference material. Consequently, it is a relatively efficient process, starting with little or no experience, to put fluorometric techniques into use. On the other hand, there are a number of approximations and possible variations in methodology which can reduce the potential accuracy and precision of fluorometric techniques. Our objective is to choose a methodology that optimizes the accuracy and precision of determining oceanic chlorophyll concentrations from shipboard, especially for the purpose of comparison with concurrent satellite imagery.
CONCEPTS Absorption and "instantaneous" re-emission of radi
ant energy from a molecule or atom accompanied by a change in wavelength as well as direction, is known as fluorescence. When a quantum of light is absorbed by a molecule, the molecule is raised to an excited state. There are a variety of ways the excited molecule can manifest or dissipate this energy. First, if the energy of the absorbed quanta exceeds the energy of the chemical bonds that hold the molecule together, the molecule may be torn apart. This is called photolysis. Second, if ah excited state is produced, the molecule is in an unstable condition and can achieve a more stable state by converting this excitation to vibrational energy, which in turn is dissipated as heat to the surroundings. Third, an excited molecule can cause chemical transformation to occur. An important example of this is photosynthesis.
In addition to these "radiationless" processes there are a number of light-scattering processes in which an incident photon at one frequency is absorbed resulting in remission at a different (lower) frequency. When the absorption and re-emissibn occurs as a single transition, the phenomenon is called the Raman effect (Jenkins and White, 1957). The intensity of light scattered in the Raman effect is much lower than that of fluorescence.
1
Finally, a molecule or atom raised to an excited state by the absorption of a quantum (photon) can loose energy in separate steps, first to a lower excited state and then from the intermediate state to the ground state. If the decay and emission of radiation take place from this intermediate level in a microsecond or less, the phenomena is called fluorescence. If the re-emission shows a persistence that lasts seconds, or longer, it is termed phosphorescence. Since energy is lost in dropping to the intermediate state, the emitted light (fluorescing light) is of longer wavelength than the absorbed (exciting) light.
Several texts and articles (Jenkins and White, 1957; Hercules, 1966; Udenfriend, 1968; Wehry, 1976; White and Arzaver, 1970; Oster, 1968) give detailed discussions of fluorescence. The practical application of fluorometry and description of available instrumentation are given in a number of trade monographs and catalogues (Turner Associates, 1977; Turner, 1977). The following is a brief outline of the significant characteristics of fluorometric methods.
Sensitivity. Accurate measurements can be made with fluorometers of solutions or suspensions having concentrations as low as a few parts in 1012. Fluorescence is directly proportional to the intensity of the exciting light, the concentration of the fluorescent material being investigated, and various instrumental factors. As a consequence, fluorometers can be adjusted to accommodate a wide dynamic range of concentrations while maintaining high accuracy. In addition, since fluorescence is a direct result of light absorbed (in contrast to absorption spectroscopy where the result is obtained indirectly by the comparison of two measurements), high accuracies are achievable independent of concentration.
Specificity. Since fluorescent materials are relatively rare (which limits the application of the techniques), fluorometry is also a more specific analytic technique than absorption spectroscopy. A useful aspect of fluorescence specificity is that the fluorescent molecule has two characteristic spectra: the excitation spectrum, the relative efficiency of different incident wavelengths that cause fluorescence; and the emission spectrum, the relative spectral distribution of emitted light. The wavelength of the fluorescence is always longer than the wavelength of excitation in accordance with Planck's fundamental equation E = hv. Also, the fluorescence emission spectrum is specific to the material. Thus it is possible to avoid interfering radiation caused by direct scattering of the exciting radiation or by fluorescence of other substances, by using spectrally selective filters or monochromators in the fluorescence detector.
Linearity. The level of fluorescence is proportional to concentration, frequently over a range of concentration of several orders of magnitude. The linearity breaks down at very high concentrations but this can be overcome either by simple dilution of the samples or by preparing a calibration curve of fluorescence versus concentration.
FLUORESCENCE AS A MEASURE OF CHLOROPHYLL*
The early work of Yentsch and Menzel (1963) suggests that, since the chlorophyll in phytoplankton is fluorescent, chlorophylls could be determined fluorometri-cally. Subsequent development and standardization of techniques (Strickland and Parsons, 1968; Holm-Hansen et al., 1965; Lorenzen, 1966) have led to the widespread use of fluorometric techniques for chlorophyll and phaeo-pigment assay of natural waters. (Lorenzen, 1966, uses the term "phaeopigments" which encompasses phaeophor-bide and phaeophytin and possibly other products rather than the term "phaeophytin" which was originally used in a context such as this. We follow his lead except in the theoretical discussions based upon other reseachers definitions.) These techniques have replaced the traditional spectrophotometric methods in many laboratories, and have made analysis in the field practical. The reasons for the popularity of the fluorometric methods are:
1. They are more sensitive by a factor of at least 20 than the spectrophotometric techniques (Holm-Hansen et al., 1965; Yentsch and Menzel, 1963).
2. They are faster and require smaller sample volumes than the spectrophotometric techniques, which require determination of optical density at several wavelengths (Holm-Hansen et al., 1965; Strickland and Parsons, 1968).
3. They are better adapted to routine laboratory and field use, since they do not depend on manually set critical wavelength settings (Holm-Hansen et al., 1965; Strickland and Parsons, 1968).
4. They are not critically dependent on cuvette handling and matching. When using fluorometric techniques, round borosilicate culture tubes normally are used as cuvettes.
Filters, light sources and photomultipliers of fluorometers can be optimized for the determination of chlorophylls and phaeopigments. The appropriate instrument manuals can be consulted for these choices.
3. DISCRETE FLUOROMETER CALIBRATION FOR CHLOROPHYLL
The fluorometer is calibrated against solutions of chlorophyll from two and sometimes three sources:
1. Purified chlorophyll-a from Sigma Chemical Corporation supplied in 1 mg lots (C-5753).
2. Whole cell extracts of algal cultures such as:
Peridinium trochoidium Emiliana (Cocolothus) huxleyi Skeletonema costatum.
'Some materials in the following sections come almost verbatim from G.K. Turner (1977), with permission.
3. Whole cell extracts of freshly collected coastal phy-toplankton and marine algae.
The standard chosen for the fluorometric determination of chlorophylls depends on the nature of the problem being studied and frequently varies with each investigator. Some investigators prepare standards from a few phyto-plankton groups selected to have ratios of chlorophyll-a, -b, and -c concentrations typical of those the investigator anticipates finding "in the field". Others have used pure chlorophyll-a (Sigma Chemical Corporation), which facilitates "intercalibration" of the instrument of various workers. The preparation of pure standards of chlorophylls-a and -b and phaeopigments-a and -b have been discussed (Marker, 1972; Jones etai, 1968). The preparation of pure standards of chlorophylls-a and -c, and phaeopigments-a and -c have been discussed (Holm-Hansen et al, 1965). Preparation of and care for standards is discussed by Turner (1977). Procedures for the calibration of fluorometers are discussed in Strickland and Parsons, (1968) and by Turner (1979).
PIGMENT DEGRADATION
General procedures followed to protect against pigment degredation are as follows: 1. Extracts are buffered with a small amount of
MgiCOi to prevent acidification and the loss of Mg from the tetrapyrrolic nucleus of the chlorophyll molecule.
2. Extracts are kept cold (0° C). 3. Acetone is used at a concentration of 90% since
lower concentrations have been shown to be less effective (Jeffrey, 1977). The acetone is taken from a freshly opened source.
4. Work is carried out in subdued light or darkness.
5. Extracts are used for calibration the same day they are made.
CHLOROPHYLL EXTRACT PREPARATION 1. Samples of Sigma Chlorophyll a are dissolved in
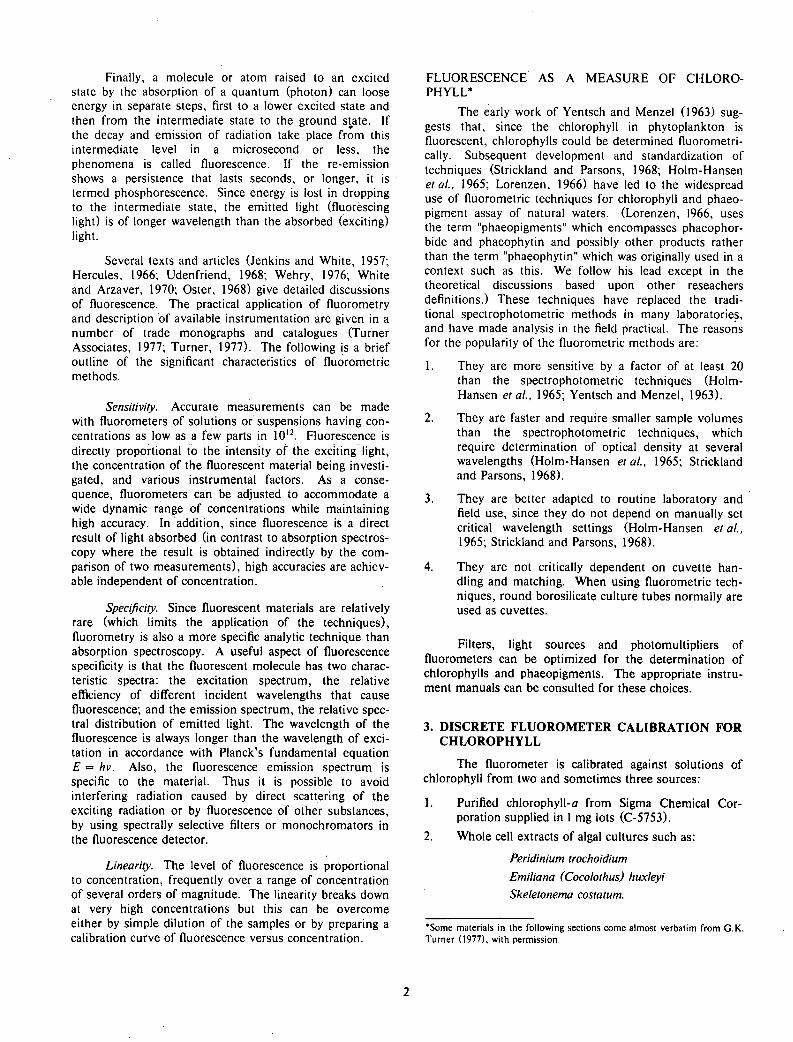
250ml of 90% acetone and measured in a Cary 14 spectrophotometer producing a spectrum as in Fig. 1. The chlorophyll a content of the solution is determined using the equation (Jeffrey and Humphrey, 1975):
Cc = £663 / 87.67
for chlorophyll a from Sigma, where £\ is the extinction (absorbance) at wavelength k and Cc has units of g-T1 (using a 1cm pathlength). The £663 would be divided by 88.15 if the chlorophyll a is dissolved in 100% acetone.
2. Samples of algal cultures and phytoplankton collections are collected on a GFC filter by vacuum filtra-
. tion (8-10psi), extracted in 90% acetone in a glass tissue homogenizer with MgiCOz arid clarified by centrifugation. The extract is then made up to a known volume that is green to the eye and measured in a Cary 14 scanning spectrophotometer (Strickland and Parsons, 1968, paragraph IV.3). The chlorophyll a content, Cc, of the solution is determined from the spectrophotometric data using the equation:
Cc = 11.85£664 - 1.54£M7 - 0.08£, 630
for mixed phytoplankton extracts (Jeffrey and Humphry, 1975). This equation was derived for a chlorophyll estimation in 90% acetone. Results are expressed in fig-ml'1 (using a 1cm cell pathlength). The symbol Ek denotes the extinction (absorbance) at wavelength \ . Evaluation of this and other trichromatic spectrophotometric equations in current use have been discussed in detail by Lorenzen and Jeffrey (1980).
0.5
0.4
g 0.3 < CQ
g 0.2 g < o.i
1409 430 1 1 1
/ 1 \ \— CHLOROPHYLL a
1 1
<•£>
1
/ ̂ \ / <>\
1 1
If + HCI—\ \ / 1 \
1 ' M / ' M / / \
— - ' V BASELlNE-%, V \ _ ^ ' ^ - ^ ^ ~ _ £"t^ ^~""
/ 1 \
1 ' M / ' M / / \
— - ' V
1 1 1 1 1 1 1 1 0-77.
350 400 450 500 550 600
WAVELENGTH (nm)
650 700 750
Fig. 1. Absorption spectra of chlorophyll-o in 90% acetone (Sigma C -5753, 4 mg / _ 1 before (solid curve) and after (dashed curve) acidification.
Note the spectral shift and change in absorbance after the addition of two drops of 10% HCI.
3
If both equations are applied to a solution of Sigma Chi a made up to a known volume, the first (Jeffrey and Humphry) overestimates the Chi a content by about 1% while the second (Jeffrey) underestimates by about 1-2%. Sigma Chemical Corporation suggests that these estimates were within the accuracy of their ability to weigh 1.0 mg of purified Chi a. The agreement between the two equations suggests that the procedures are consistent and for most purposes are within acceptable limits of accuracy (i.e. about ±1-2%, see Lorenzen and Jeffrey, 1980).
CALIBRATIONS
Since fluorometry is much more sensitive than spectrophotometry, it is necessary to make accurate and precise dilutions of the stock chlorophyll extract. Three stock dilutions are made up to 100ml using volumetric flasks:
VOLUME VOLUME DILUTION STOCK ACETONE OF STOCK
1.0 99.0 1:100
2.0 98.0 1:50
4.0 96.0 1:25
These dilutions are further diluted in 1:10 and 1:100 dilution increments until the fluorescence is reduced to levels that are within the linear range of the fluorometer. All solutions are prepared in duplicate after the initial stock dilutions are made. In practice this secondary dilution is usually dilute enough that it can usually be read on more than one scale. The solutions are acidified with 10% HCI and their fluorescence remeasured to determine the acidification factor used in calculating phaeopigment content. We have found a variation of 1.97-1.86 in acid factors measured for purified Sigma Chi a. Calibration is completed by calculating a calibration constant for each fluorometer door to be used and each sensitivity range (see Eqs. (l)-(4) below):
/r - 1 - a
F°~~K;-~b'
where a = mg. chl a/ml of solution obtained by dilution of previously determined Cc, and b = fluorometer reading in units before acidification. Final calibration factors used are the mean values determined using several different stock solution for each range. A check and intercalibra-tion of ranges may be obtained by ratioing the raw fluorescence readings of the same solutions read at different sensitivity ranges. It should also be noted that the "acid factor" is a function of the response of the particular instrument used and its components. A change in components (e.g., PMT, filter, etc.) requires a recalibration.
4. DISCRETE DETERMINATION OF CHLOROPHYLL AND PHAEOPHYTIN BY FLUORESCENCE
Procedures for estimating chlorophyll pigment by fluorescence are detailed in several references (Holm-Hansen etal, 1965; Strickland and Parsons, 1968; E.P.A., 1971). Basically, the procedure consists of filtration, extraction, measurement, acidification, measurement of acidified extract and calibration of results.
PROCEDURE
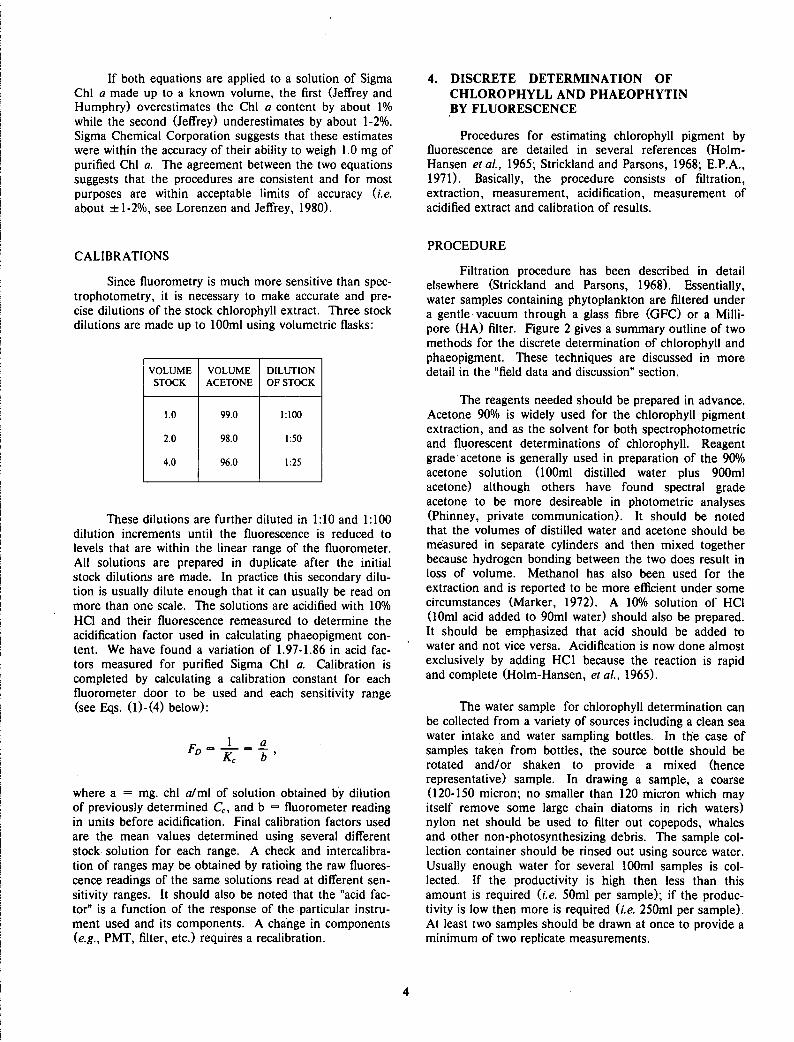
Filtration procedure has been described in detail elsewhere (Strickland and Parsons, 1968). Essentially, water samples containing phytoplankton are filtered under a gentle vacuum through a glass fibre (GFC) or a Milli-pore (HA) filter. Figure 2 gives a summary outline of two methods for the discrete determination of chlorophyll and phaeopigment. These techniques are discussed in more detail in the "field data and discussion" section.
The reagents needed should be prepared in advance. Acetone 90% is widely used for the chlorophyll pigment extraction, and as the solvent for both spectrophotometric and fluorescent determinations of chlorophyll. Reagent grade acetone is generally used in preparation of the 90% acetone solution (100ml distilled water plus 900ml acetone) although others have found spectral grade acetone to be more desireable in photometric analyses (Phinney, private communication). It should be noted that the volumes of distilled water and acetone should be measured in separate cylinders and then mixed together because hydrogen bonding between the two does result in loss of volume. Methanol has also been used for the extraction and is reported to be more efficient under some circumstances (Marker, 1972). A 10% solution of HCI (10ml acid added to 90ml water) should also be prepared. It should be emphasized that acid should be added to water and not vice versa. Acidification is now done almost exclusively by adding HCI because the reaction is rapid and complete (Holm-Hansen, etal, 1965).
The water sample for chlorophyll determination can be collected from a variety of sources including a clean sea water intake and water sampling bottles. In the case of samples taken from bottles, the source bottle should be rotated and/or shaken to provide a mixed (hence representative) sample. In drawing a sample, a coarse (120-150 micron; no smaller than 120 micron which may itself remove some large chain diatoms in rich waters) nylon net should be used to filter out copepods, whales and other non-photosynthesizing debris. The sample collection container should be rinsed out using source water. Usually enough water for several 100ml samples is collected. If the productivity is high then less than this amount is required (i.e. 50ml per sample); if the productivity is low then more is required (i.e. 250ml per sample). At least two samples should be drawn at once to provide a minimum of two replicate measurements.
4
OUTLINE OF DISCRETE CHLOROPHYLL PROCEDURE
• COLLECT-
- mix or integrate source if necessary - use coarse filter for zooplankton - rinse sample container - take enough for several 100ml replicates
WHATMAN GFC .8M
METHOD
-GRIND-
- filler into grinding tube - add —5ml 90% acetone • grind —12 strokes - pour into centrifuge tube • rinse grinding tube, filling
centrifuge tube to 10ml - put in dark, cold for 1 hour
-CENTRIFUGE-
. shake centrifuge tube • 3-5 minutes centrifuge • pour into Turner cuvette
-BLANK-
-90% acetone blank
• FILTER-
• put filter in place • vacuum less than 10 psi . filter 100ml usually • handle with tweezers
MILLIPORE HA .45M
METHOD
- DISSOLVE
- filter into 20ml scintillation vial - add 10ml 90% acetone - shake to dissolve filter
-BLANK-
- 90% acetone plus filter blank
T
- FLUORESCENCE -
- wipe Turner cuvette - read fluorescence, FB
- add 3 drops HCI
- read fluorescence, FA
-CLEAN-
FILTER APPARATUS
- no cleaning between samples - when finished with a sequence of samples
- rinse with tap water - filter —100ml tap water with no filter
CENTRIFUGE TUBES
• rinse in tap water - rinse in 90% acetone - cap and leave wet
TURNER CUVETTES
- clean after each sample measured - rinse 3,4 limes in tap water - rinse 2,3 times in 90% acetone solution - make certain all ACID is removed
Fig. 2. Outline of discrete chlorophyll procedure.
5
The correct filter should be placed on the filter apparatus with the vacuum pump at less than 10 psi. Insure the extract is mixed by shaking the sample container before measuring out 100ml from the container. This filtered quantity is critical so it should be carefully measured. Filtration procedure has been described in detail elsewhere (Strickland and Parsons, 1968). The filter should be removed using tweezers to avoid contamination with acid from the hands. It should be noted that chlorophyll extracts are notoriously unstable. Sunlight and light from fluorescent lamps will destroy- them. very rapidly; incandescent light, in a matter of tens of minutes. Therefore, all handling should be done in subdued light and where possible, the samples held in the dark between steps.
Extraction of pigments by grinding is now almost universally recommended (Holm-Hansen, et al, 1965; Yentsch and Menzel, 1963; E.P.A., 1971). A study of the efficiency of extraction of chlorophyll shows that the chlorophyll released increases from 5% to 60% when grinding is used (Yentsch and Menzel, 1963). In this grinding method, a Whatman GFC 0.8/im filter is usually used. The wadded up filter from the filter apparatus is put into a tissue grinding test tube and 5ml of the 90% acetone solution is added. The grinding should be done in a consistent manner using the same treatment (i.e. number of strokes). The resulting solution is poured into a centrifuge tube with a 10ml mark on its side. The grinding rod and tube is rinsed three times into the centrifuge tube keeping the total volunie less than 10ml. The centrifuge tube is then topped to 10ml and put in a cold dark place such as a refrigerator for one hour. After this time, the centrifuge tube is shaken to mix the contents and put into the centrifuge for three to five minutes. There is debate whether this step may be omitted since fluorescent techniques are very insensitive to turbidity. The solution which contains the chlorophyll extract (filtrate) is then poured off into a Turner cuvette leaving the precipitate in the centrifuge tube. The Turner fluorometer is set to zero using a 90% acetone solution. The fluorescence of the sample is then measured.
The non-grinding technique varies from the above. This change is based upon the use of a Millipore HA 0.45/1 m filter. The wadded up filter is put into a 20ml
scintillation vial. A 90% acetone solution is added to bring the volume to 10ml. The cuvette is shaken well to allow the filter to dissolve. The Turner fluorometer is blanked against a 90% acetone solution with a dissolved filter in it. Then, the sample fluorescence reading is made.
Measurement details vary with the instrument model and design, so the manufacturer's literature should be consulted. The fluorescence, FB, of the sample can be read. There is a range of four scales available (xl, x3, xlO, x30). If the reading is offscale on the xl scale, increase the acetone volume by 10ml and note the dilution. Where phaeopigments are not present in the extract, this reading is directly proportional to the chlorophyll concentration. After recording the reading, add three drops of 10% HCI directly to the Turner cuvette containing the chlorophyll extract while it is still sitting in the fluorometer. Conversion is nearly complete in about two minutes for chlorophyll- b and complete in about three minutes for chlorophyll-c (Loftus and Carpenter, 1971). The fluorescence, FA, should now be recorded. This acid technique allows calculation of the phaeopigment concentration present (Eqs. (6) and (7).
Careful records must be maintained for all chlorophyll measurements made. A sample form for the data collection at sea is shown in Fig. 3. An example of an actual ship setup for discrete and continuous measurements is shown in Fig.4.
The clean-up procedure is outlined in Fig. 2. The filter apparatus requires no cleaning between samples. After a sequence of samples, rinse the filter apparatus in tap water and filter 100ml of tap water through the system with no filter. The centrifuge tubes are rinsed in tap water and then rinsed in 90% acetone. They should be capped and left wet. The Turner cuvettes must be cleaned after each use. They should be rinsed three times in tap water and then rinsed three times in 90% acetone solution in order to remove all traces of acid. It is also possible to use cheap disposable tubes that then do not require cleaning.
THEORETICAL BASIS
Formulas for the calculation of chlorophyll-a and phaeopigment-a are given in the literature, without deriva-
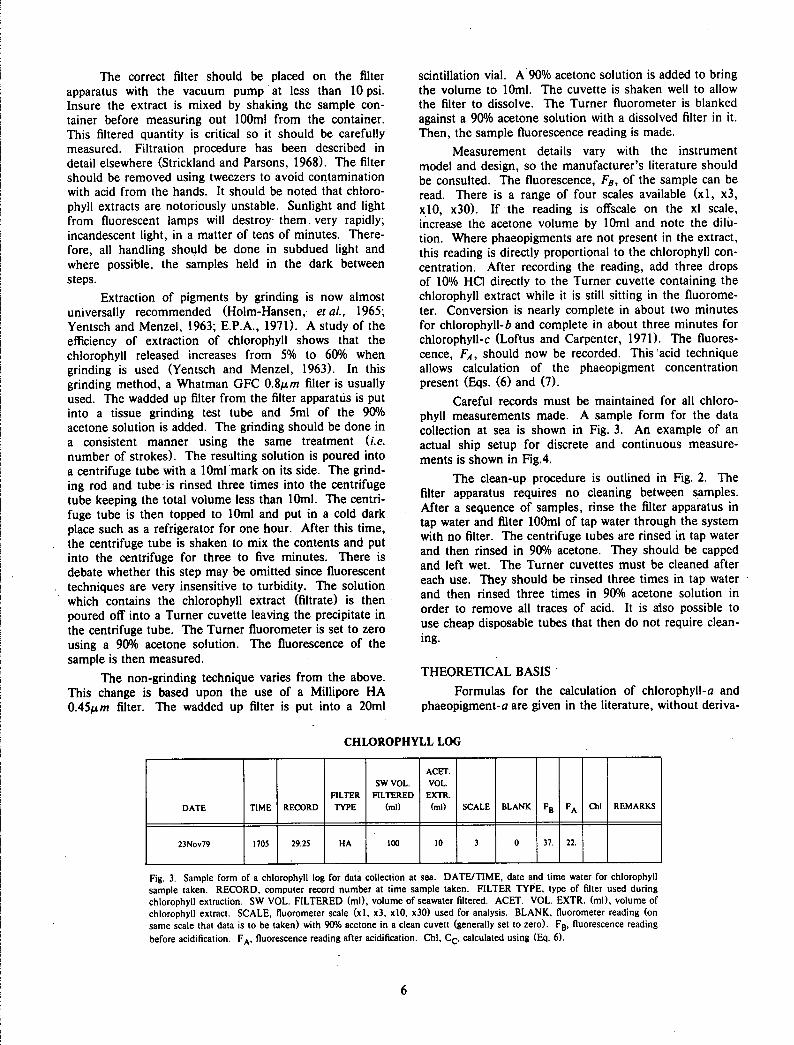
CHLOROPHYLL LOG
ACET.
SW VOL. VOL.
FILTER FILTERED EXTR.
DATE TIME RECORD TYPE (ml) (ml) SCALE BLANK FB FA Chi REMARKS
23Nov79 1705 29.25 HA 100 10 3 0 37. 22.
Fig. 3. Sample form of a chlorophyll log for data collection at sea. DATE/TIME, date and time water for chlorophyll sample taken. RECORD, computer record number at time sample taken. FILTER TYPE, type of filter used during chlorophyll extraction. SW VOL. FILTERED (ml), volume of seawater filtered. ACET. VOL. EXTR. (ml), volume of chlorophyll extract. SCALE, fluorometer scale (xl, x3, xlO, x30) used for analysis. BLANK, fluorometer reading (on same scale that data is to be taken) with 90% acetone in a clean cuvett (generally set to zero). FB, fluorescence reading before acidification. FA , fluorescence reading after acidification. Chi, C c , calculated using (Eq. 6).
6
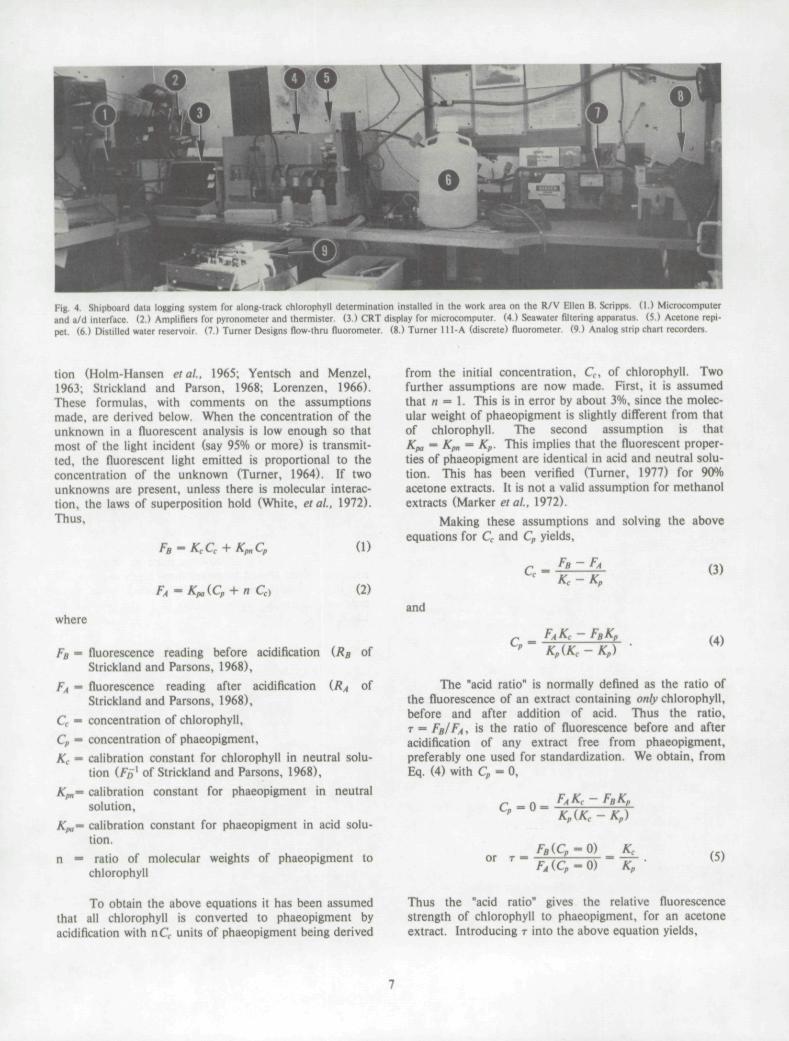
Fig 4 Shipboard data logging system for along-track chlorophyll determination installed in the work area on the R/V Ellen B. Scripps. (1.) Microcomputer IOd l/d micil.Ke (2.) Amplifiers for pyronometer and thermister. (3.) CRT display for microcomputer. (4.) Seawater filtering apparatus. (5.) Acetone repi-pet. (6.) Distilled water reservoir. (7.) Turner Designs flow-thru fluorometer. (8.) Turner 111-A (discrete) fluorometer. (9.) Analog strip chart recorders.
tion (Holm-Hansen etal., 1965; Yentsch and Menzel, 1963; Strickland and Parson, 1968; Lorenzen, 1966). These formulas, with comments on the assumptions made, are derived below. When the concentration of the unknown in a fluorescent analysis is low enough so that most of the light incident (say 95% or more) is transmitted, the fluorescent light emitted is proportional to the concentration of the unknown (Turner, 1964). If two unknowns are present, unless there is molecular interaction, the laws of superposition hold (White, etal., 1972). Thus,
FB m KCCC + KpnCp
FA ^Kpa(Cp + n Cc)
(1)
(2)
where
FB - fluorescence reading before acidification (RB of Strickland and Parsons, 1968),
FA - fluorescence reading after acidification (RA of Strickland and Parsons, 1968),
Cc — concentration of chlorophyll,
Cp — concentration of phaeopigment,
Kc - calibration constant for chlorophyll in neutral solution (Fp1 of Strickland and Parsons, 1968),
Kpn— calibration constant for phaeopigment in neutral solution,
Kpa— calibration constant for phaeopigment in acid solution.
n — ratio of molecular weights of phaeopigment to chlorophyll
To obtain the above equations it has been assumed that all chlorophyll is converted to phaeopigment by acidification with nC( units of phaeopigment being derived
from the initial concentration, Cf, of chlorophyll. Two further assumptions are now made. First, it is assumed that n = 1. This is in error by about 3%, since the molecular weight of phaeopigment is slightly different from that of chlorophyll. The second assumption is that Kpa - Kpn - Kp. This implies that the fluorescent properties of phaeopigment are identical in acid and neutral solution. This has been verified (Turner, 1977) for 90% acetone extracts. It is not a valid assumption for methanol extracts (Marker etal, 1972).
Making these assumptions and solving the above equations for Cc and Cp yields,
Cc
and
FB-FA
Kc — Kp
FAKC ~ FBKP
K„\KC lip)
(3)
(4)
The "acid ratio" is normally defined as the ratio of the fluorescence of an extract containing only chlorophyll, before and after addition of acid. Thus the ratio, T = FB/FA, is the ratio of fluorescence before and after acidification of any extract free from phaeopigment, preferably one used for standardization. We obtain, from Eq. (4) with Cp - 0,
or
cP- 0 FAKC-FBKP cP- Kp\Kc — Kp)
FB(Cp = 0) mm Kc
FA (Cp - 0) A„ (5)
Thus the "acid ratio" gives the relative fluorescence strength of chlorophyll to phaeopigment, for an acetone extract. Introducing T into the above equation yields.
7
Cc [mg chlorophyll—a • m 3] = -=-'-"-£ T
T - l • ( / i - F J (6)
,-'i = JL T (rF. - Fn) (1) Cp[mg phaeopigment • m"3] = -p ~- (TFA - FB) (7) Kc T—1
which are the equations given by (Strickland and Parson, 1968, § IV.3.IV).
Adding together Eqs. (6) and (7) gives an equation for total pigments.
(Cc + Cp) [mg pigment • m"3] = - J - T FA . (8) K
Some field workers make the assumption
This is strictly true only for pure chlorophyll extracts and almost true for a fresh algal culture in log phase growth. Resulting approximation for total pigments using Eqs. (8) becomes,
(Cc + Cp) [mg • pigment • m"3] = - J - FB . (9) Kc
Equation (9) allows one to skip the acidification step in discrete chlorophyll determinations. The authors emphasize that this equation should only be used when one is fully cognizant of its limitations.
Acid ratios vary from unity (for extracts containing only chlorophyll) to values greater than unity and change values due to a number of factors including: shifts in the excitation wavelength when chlorophyll-a is converted to phaeopigment-o (Saijo and Nishzawa, 1969); individual instrument characteristics (photomultiplier, lamp, optical filters) that require that T be determined individually for each instrument and checked if components are changed; different mixtures of chlorophylls-a, -b, and -c, each with quite different excitation and emission spectra.
5. CONTINUOUS ESTIMATION OF CHLOROPHYLL BY FLUORESCENCE
This method is derived from the work of Lorenzen (1966) and Strickland (1968), and has been fully discussed in detail by Strickland and Parsons (1968.
PROCEDURE
Sea water is pumped through a flow through cuvette in a Turner or Turner Designs Fluorometer and the fluorescence of the living plankton cells is measured directly. As noted by Strickland and Parsons (1968) the
method is an invaluable semiquantitative tool for measuring the surface concentration of phytoplankton from an underway ship " but frequent standardization is required if it is to be used as a precise technique in eutrophic waters." Discrete samples, taken from the continuous flow during measurement, are generally used to "calibrate" the continuous flow data (Kiefer, 1973a, 1973b). Frequent calibration of the continuous in-vivo determination of chlorophyll is necessary because:
1. The amount of organic substance associated with a given quantity of plant pigment varies widely, depending on class and health. For example, the factor for converting chlorophyll-a to total plant carbon can vary from 25 to 100 (Strickland and Parsons, 1968), and in special cases, even more (Weber, 1973). It is unknown how a change in the chlorophyll to carbon ratio influences fluorescence.
2. The fluorescence efficiency of chlorophyll, when measured in-vivo is species dependent (Strickland, 1968; Loftus etal, 1972; Kiefer, 1973a,b; Piatt, 1972; Flemer, 1969; Loftus and Seliger, 1975).
3. The fluorescence efficiency of chlorophyll, when measured in-vivo is dependent on its history of exposure to light, leading to diurnal variations (Berman, 1972; Lavorel and Joliot, 1972; Kiefer, 1973a,b; Loftus and Seliger, 1975; Smith and Baker, unpublished).
4. The fluorescence efficiency of chlorophyll depends on stress caused by lack of nutrients and by toxic materials (Kiefer, 1973; Dunstan etal, 1975; Loftus and Seliger, 1975).
THEORETICAL BASIS
The continuous underway fluorescence, Fc, can be written
Fc — Kc Cc + Kp Cp + B (10)
where
Fc is the continuous fluorescence reading (for a specific instrument gain setting and sensitivity)
Cc is the concentration of chlorophyll
Cp is the concentration of phaeophytin
Kc' is the calibration constant for chlorophyll in living phytoplankton cells
Kp' is the calibration constant for phaeophytin suspended in the sea water passing thru the flow thru cuvette
B is a "blank" reading (for the same instrument gain setting and sensitivity).
Kiefer (1973) has shown that the in-situ fluorescence of phaeopigments is extremely small. Thus Kp' « Kc' and the in-situ variation of phaeopigments is

of little importance in determining Fc. To the extent that this is universally true, and if the concentration of phaeopigments is not very much greater than the chlorophyll concentration, Eq. (10) reduces to,
Fc == Kc Cc •+• B
Fc-B or Cc K'
(11)
(12)
where Kc' is determined from periodic "discrete" determinations of chlorophyll, Q(ti) by
Kc'(0 Fc(t,) - BO,)
Cc(t,) (13)
Here // refers to the time at which a sample for a discrete determination of chlorophyll is obtained. It is the variation in Kc'(ti) that limits the accuracy of continuous estimations of chlorophyll by fluorescence. Thus frequent standardization via discrete chlorophyll determinations are required. An example from one cruise of discrete chlorophyll versus fluorescence measurements is shown in Fig. 5. The calibration of the fluorescence track between the points where discrete data were obtained is discussed in the following section on fluorescence number.
> 0-
o a. O _i X u
0 1 2 3 FLUORESCENCE
Fig. S. Plot showing fluoroescence (as measured for along-track data using the Turner Design flow-thru fluorometer) vs. chlorophyll (as measured from a discrete sample, taken from the output of the flow-thru system, using the Turner 111-A fluorometer).
BLANKING The blanking procedure provides an estimate of the
background signal inherent in the fluorometer system in
operation. This background signal changes with time as the cuvette becomes ever so slightly fouled from the sea-water flowing through it. The background signal also varies with the individual optical properties of cuvettes. Still a third source of background signal variability comes from extracellular chlorophyll which may be dissolved in seawater.- In actual field trials we have not seen any trace of dissolved chlorophyll in the California Current and adjacent oceanic waters, however it must be kept in mind, especially when plankton blooms are encountered.
The fluorometer is disconnected from the seawater system and the cuvette filled with distilled water at ambient seawater temperature. This reduces the chances of cuvette fogging which results in an elevated blank. The signal from the fluorometer is then read on the appropriate scales (Fig. 6) and the instrument reconnected to the seawater system.
We have considered the possible merit of using sea water filtered through a 0.45um Millipore filter rather than distilled water for the purpose of blanking the flow through fluorometer. Using filtered sea water blanks would have the advantage of blanking out those substances such as the dissolved organic material, DOM, which may contribute to the fluorescence of the flow through fluorometer. In using both the filtered sea water and distilled water each day, a comparison was made of the two methods. The sea water was filtered and used for that day's blanking. The same filtered sea water was used for the next day's blanking. The same variability of about 6% on all scales occurred for both methods indicating the variability most probably was due to instrument drift.
The filtered sea water consistently gave a 10% or greater reading than the distilled water. Of course, to accurately use this blanking technique, the fluorometers must be blanked as often as the DOM type constituents of the water change. Blanking is usually carried out two or more times each day, more often if the ship is operating in very turbid waters, and before and after cleaning the cuvette. To facilitate this procedure, the Visibility Laboratory has modified the standard Turner Designs fluorometer by replacing the fluorometer cover plate with a more easily removed plate to provide easier cuvette access. Our results indicate that filtered sea water blanking can provide more consistent along track chlorophyll estimates.
6. FIELD DATA AND DISCUSSION
FILTER TYPES
The two standard techniques adopted by the Visibility Laboratory are shown in Fig. 2. The use of Millipore (HA) filters rather Whatman (GFC) glass fiber filters was explored for the following reasons: (1) The Millipore filter dissolves in 90% acetone. (2) In oceanic waters small cyanobacteria (i.e. blue-green algae) comprise a significant portion of the plankton population. The Millipore HA filter possesses a smaller pore size than the Whatman GFC (0.45/xm vs 0.8 .̂̂ 2) and therefore captures a greater percentage of the algal populations. This difference may amount to as much as a 20% difference in chlorophyll con-
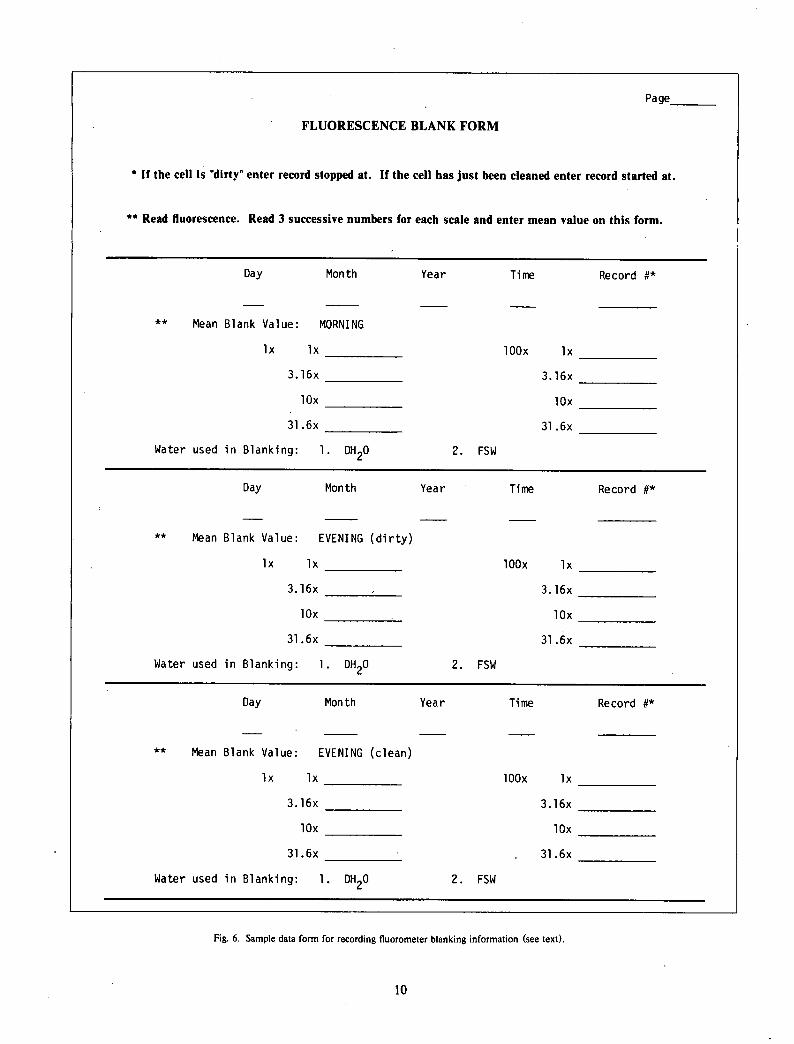
Page_
FLUORESCENCE BLANK FORM
* If the cell is "dirty" enter record stopped at. If the cell has just been cleaned enter record started at.
** Read fluorescence. Read 3 successive numbers for each scale and enter mean value on this form.
Day Month Year Time Record §*
lOOx lx
3.16x
lOx
31.6x
2. FSW
Day Month Year Time Record #*
lOOx lx
3.16x
lOx
31.6x
2. FSW
Day Month Year Time Record #*
lOOx lx
3.16x
lOx
31.6x
2. FSW
Fig. 6. Sample data form for recording fluorometer blanking information (see text).
** Mean Blank Value: MORNING
lx lx
3.16x
lOx
31.6x
Water used in Blanking: 1. DH?0
** Mean Blank Value: EVENING (d i r t y )
lx lx
3.16x ,
lOx
31.6x
Water used in Blanking: 1. DH?0
** Mean Blank Value: EVENING (clean)
lx lx
3.16x
lOx
31.6x
Water used in Blanking: 1. DH?0
10
tent of the extract for open ocean waters. In coastal and nearshore waters this difference becomes insignificant. (3) The slow filtration rate of the HA in comparison with the GFC was of minor consequence for the California Current region since working extract volumes are often between 50 and 200ml seawater.
There is continuing debate among biologists as to the best filter type to employ (Sheldon and Sutcliffe, 1969; Salonen, 1979). Some years ago the Whatman GFC 0.8/um filter was recommended to be used with the grinding technique although some researchers preferred other methods of extraction. In recent years many biologists have questioned the ability of this size filter to capture the cyanobacteria. Hence, several researchers investigated the Millipore (HA) OAS/xm filter. Being an acetate filter, the Millipore dissolves in acetone which also led to the development of the non-grinding technique. There is controversy with respect to not grinding since it implies the solvent gets through the cell membranes without added stress (see next section). More recently researchers are emphasizing that the proper technique to use may depend upon what is present in the water and what is to be investigated. For instance, the membranes of dinoflagellates may be more efficiently penetrated by acetone than the more complicated membrane structure of the diatoms. Further, researchers today are finding (Yentsch, Phinney, private communication) that not even grinding is enough to extract all of the chlorophyll of the cyanobacteria.
The GFC grinding technique has been used in all Visibility Laboratory chlorophyll work prior to 1979. After this time, the HA no grind method has been alternatively used in waters shown to permit the use of this technique (next section). Some researchers are investigating the use of the Whateman GFF 0.45^m rather than the Millipore 0.45/aAw. With the new knowledge with respect to cyanobacteria, use of the 0.45/u.m filter size seems advisable.
FILTER TREATMENT While it is common practice to homogenize GFC
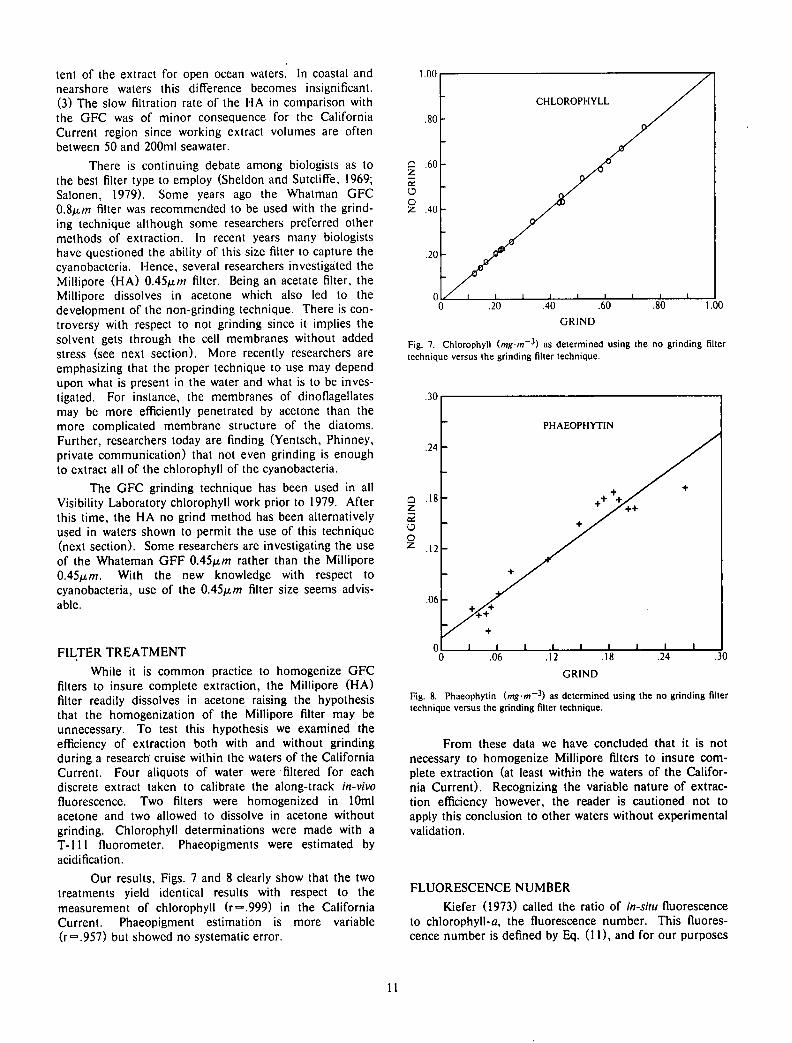
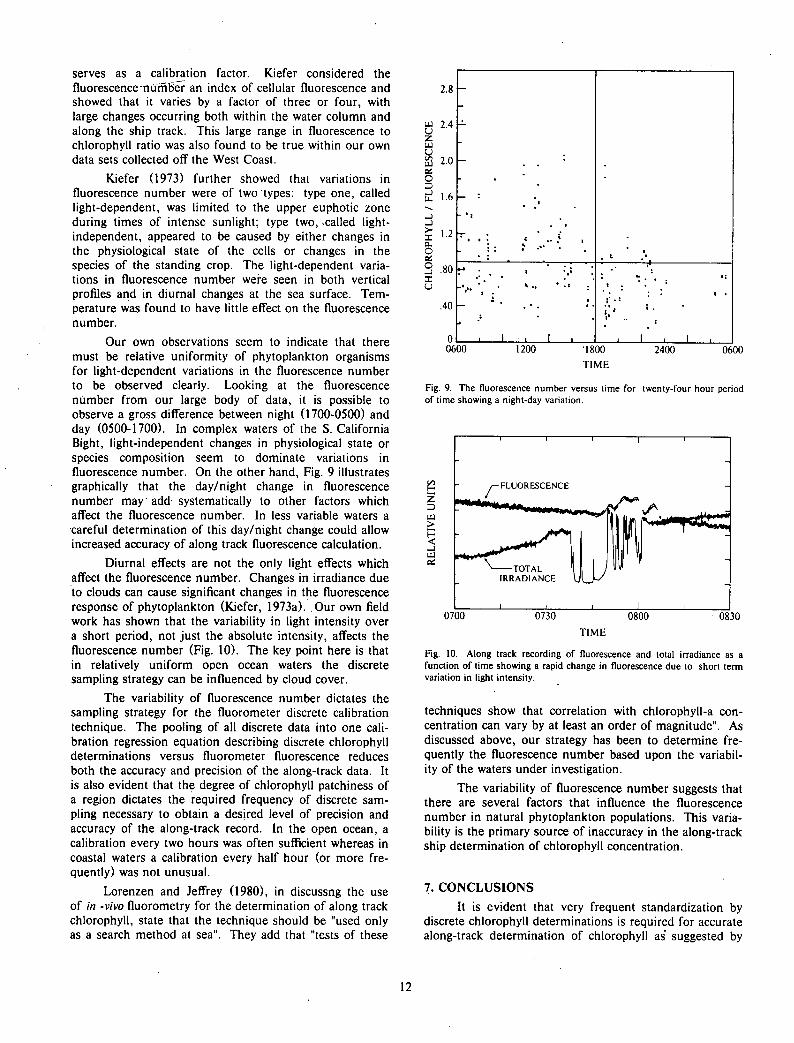
filters to insure complete extraction, the Millipore (HA) filter readily dissolves in acetone raising the hypothesis that the homogenization of the Millipore filter may be unnecessary. To test this hypothesis we examined the efficiency of extraction both with and without grinding during a research cruise within the waters of the California Current. Four aliquots of water were filtered for each discrete extract taken to calibrate the along-track in-vivo fluorescence. Two filters were homogenized in 10ml acetone and two allowed to dissolve in acetone without grinding. Chlorophyll determinations were made with a T-lll fluorometer. Phaeopigments were estimated by acidification.
Our results, Figs. 7 and 8 clearly show that the two treatments yield identical results with respect to the measurement of chlorophyll (r=.999) in the California Current. Phaeopigment estimation is more variable (r=.957) but showed no systematic error.
1.00
.80-
.60 Q Z
o o Z .40
.20
CHLOROPHYLL
n i x i i i i i i i i 1— 0 .20 .40 .60 .80 1.00
GRIND
Fig. 7. Chlorophyll (.mgm-3) as determined using the no grinding filter technique versus the grinding filter technique.
Q Z as O O
z
Fig. 8. Phaeophytin (mgm~*) as determined using the no grinding filter technique versus the grinding filter technique.
From these data we have concluded that it is not necessary to homogenize Millipore filters to insure complete extraction (at least within the waters of the California Current). Recognizing the variable nature of extraction efficiency however, the reader is cautioned not to apply this conclusion to other waters without experimental validation.
FLUORESCENCE NUMBER
Kiefer (1973) called the ratio of in-situ fluorescence to chlorophyll-a, the fluorescence number. This fluorescence number is defined by Eq. (11), and for our purposes
11
serves as a calibration factor. Kiefer considered the fluorescence number an index of cellular fluorescence and showed that it varies by a factor of three or four, with large changes occurring both within the water column and along the ship track. This large range in fluorescence to chlorophyll ratio was also found to be true within our own data sets collected off the West Coast.
Kiefer (1973) further showed that variations in fluorescence number were of two types: type one, called light-dependent, was limited to the upper euphotic zone during times of intense sunlight; type two, called light-independent, appeared to be caused by either changes in the physiological state of the cells or changes in the species of the standing crop. The light-dependent variations in fluorescence number were seen in both vertical profiles and in diurnal changes at the sea surface. Temperature was found to have little effect on the fluorescence number.
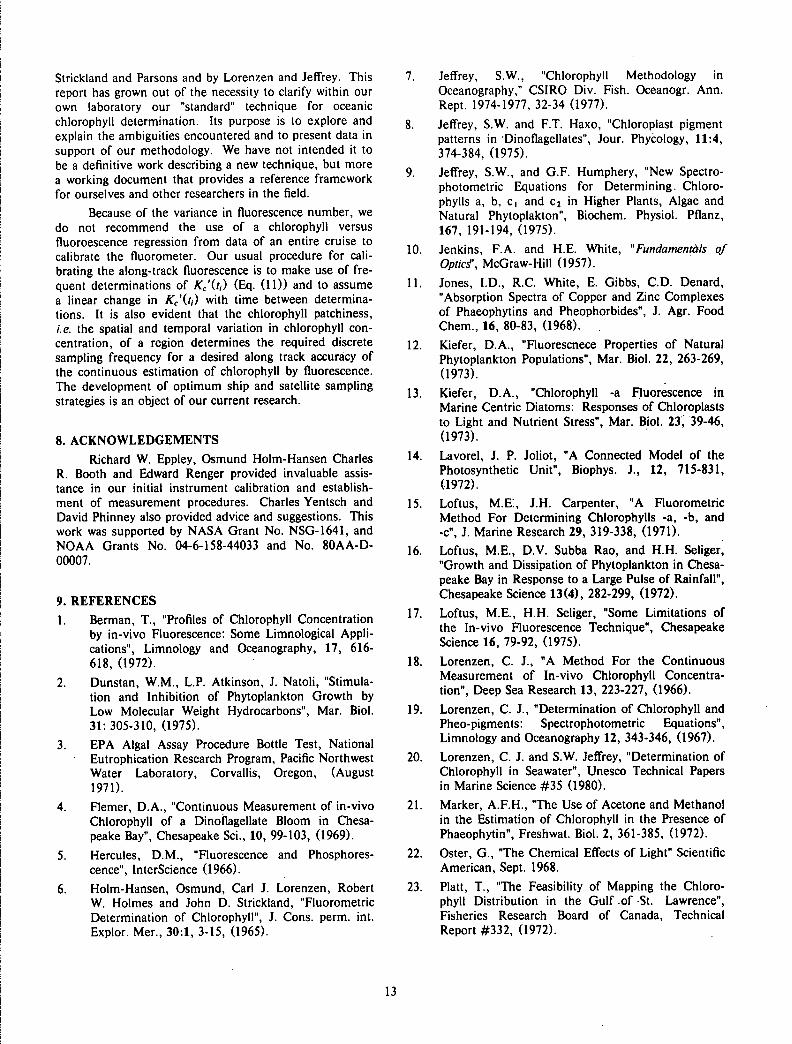
Our own observations seem to indicate that there must be relative uniformity of phytoplankton organisms for light-dependent variations in the fluorescence number to be observed clearly. Looking at the fluorescence number from our large body of data, it is possible to observe a gross difference between night (1700-0500) and day (0500-1700). In complex waters of the S. California Bight, light-independent changes in physiological state or species composition seem to dominate variations in fluorescence number. On the other hand, Fig. 9 illustrates graphically that the day/night change in fluorescence number may add systematically to other factors which affect the fluorescence number. In less variable waters a careful determination of this day/night change could allow increased accuracy of along track fluorescence calculation.
Diurnal effects are not the only light effects which affect the fluorescence number. Changes in irradiance due to clouds can cause significant changes in the fluorescence response of phytoplankton (Kiefer, 1973a). Our own field work has shown that the variability in light intensity over a short period, not just the absolute intensity, affects the fluorescence number (Fig. 10). The key point here is that in relatively uniform open ocean waters the discrete sampling strategy can be influenced by cloud cover.
The variability of fluorescence number dictates the sampling strategy for the fluorometer discrete calibration technique. The pooling of all discrete data into one calibration regression equation describing discrete chlorophyll determinations versus fluorometer fluorescence reduces both the accuracy and precision of the along-track data. It is also evident that the degree of chlorophyll patchiness of a region dictates the required frequency of discrete sampling necessary to obtain a desjred level of precision and accuracy of the along-track record. In the open ocean, a calibration every two hours was often sufficient whereas in coastal waters a calibration every half hour (or more frequently) was not unusual.
Lorenzen and Jeffrey (1980), in discussng the use of in -vivo fluorometry for the determination of along track chlorophyll, state that the technique should be "used only as a search method at sea". They add that "tests of these
2.8 -
u; 2.4 z UJ
2 2.0
O
rt i,6
£ 1.2rr a. O a. 8 .80 F X u
.40 -
0600
I
: . * •• . • : " . t .'•
• -; . — . — . ^-i
r* : . . v : . •
"'''•'•V '" ':' ;"•;.; ':: — * • • •• , i
1200 1800
TIME 2400 0600
Fig. 9. The fluorescence number versus time for twenty-four hour period of time showing a night-day variation.
H
Z 3 UJ > < - 1 l±J
a
-FLUORESCENCE
-TOTAL IRRADIANCE
0700 0730 0800 0830
TIME
Fig. 10. Along track recording of fluorescence and total irradiance as a function of time showing a rapid change in fluorescence due to short term variation in light intensity.
techniques show that correlation with chlorophyU-a concentration can vary by at least an order of magnitude". As discussed above, our strategy has been to determine frequently the fluorescence number based upon the variability of the waters under investigation.
The variability of fluorescence number suggests that there are several factors that influence the fluorescence number in natural phytoplankton populations. This variability is the primary source of inaccuracy in the along-track ship determination of chlorophyll concentration.
7. CONCLUSIONS
It is evident that very frequent standardization by discrete chlorophyll determinations is required for accurate along-track determination of chlorophyll as' suggested by
12
Strickland and Parsons and by Lorenzen and Jeffrey. This report has grown out of the necessity to clarify within our own laboratory our "standard" technique for oceanic chlorophyll determination. Its purpose is to explore and explain the ambiguities encountered and to present data in support of our methodology. We have not intended it to be a definitive work describing a new technique, but more a working document that provides a reference framework for ourselves and other researchers in the field.
Because of the variance in fluorescence number, we do not recommend the use of a chlorophyll versus fluoroescence regression from data of an entire cruise to calibrate the fluorometer. Our usual procedure for calibrating the along-track fluorescence is to make use of frequent determinations of Kc'(t,) (Eq. (11)) and to assume a linear change in Kc'(tj) with time between determinations. It is also evident that the chlorophyll patchiness, i.e. the spatial and temporal variation in chlorophyll concentration, of a region determines the required discrete sampling frequency for a desired along track accuracy of the continuous estimation of chlorophyll by fluorescence. The development of optimum ship and satellite sampling strategies is an object of our current research.
8. ACKNOWLEDGEMENTS
Richard W. Eppley, Osmund Holm-Hansen Charles R. Booth and Edward Renger provided invaluable assistance in our initial instrument calibration and establishment of measurement procedures. Charles Yentsch and David Phinney also provided advice and suggestions. This work was supported by NASA Grant No. NSG-1641, and NOAA Grants No. 04-6-158-44033 and No. 80AA-D-00007.
9. REFERENCES 1. Berman, T., "Profiles of Chlorophyll Concentration
by in-vivo Fluorescence: Some Limnological Applications", Limnology and Oceanography, 17, 616-618, (1972).
2. Dunstan, W.M., L.P. Atkinson, J. Natoli, "Stimulation and Inhibition of Phytoplankton Growth by Low Molecular Weight Hydrocarbons", Mar. Biol. 31: 305-310, (1975).
3. EPA Algal Assay Procedure Bottle Test, National Eutrophication Research Program, Pacific Northwest Water Laboratory, Corvallis, Oregon, (August 1971).
4. Flemer, D.A., "Continuous Measurement of in-vivo Chlorophyll of a Dinoflagellate Bloom in Chesapeake Bay", Chesapeake Sci., 10, 99-103, (1969).
5. Hercules, D.M., "Fluorescence and Phosphorescence", InterScience (1966).
6. Holm-Hansen, Osmund, Carl J. Lorenzen, Robert W. Holmes and John D. Strickland, "Fluorometric Determination of Chlorophyll", J. Cons. perm. int. Explor. Mer., 30:1, 3-15, (1965).
7. Jeffrey, S.W., "Chlorophyll Methodology in Oceanography," CSIRO Div. Fish. Oceanogr. Ann. Rept. 1974-1977, 32-34 (1977).
8. Jeffrey, S.W. and FT. Haxo, "Chloroplast pigment patterns in Dinoflagellates", Jour. Phycology, 11:4, 374-384, (1975).
9. Jeffrey, S.W., and G.F. Humphery, "New Spectrophotometric Equations for Determining. Chlorophylls a, b, c, and c2 in Higher Plants, Algae and Natural Phytoplakton", Biochem. Physiol. Pflanz, 167, 191-194, (1975).
10. Jenkins, F.A. and H.E. White, "Fundamentals of Optics", McGraw-Hill (1957).
11. Jones, I.D., R.C. White, E. Gibbs, CD. Denard, "Absorption Spectra of Copper and Zinc Complexes of Phaeophytins and Pheophorbides", J. Agr. Food Chem., 16, 80-83, (1968).
12. Kiefer, D.A., "Fluorescnece Properties of Natural Phytoplankton Populations", Mar. Biol. 22, 263-269, (1973).
13. Kiefer, D.A., "Chlorophyll -a Fluorescence in Marine Centric Diatoms: Responses of Chloroplasts to Light and Nutrient Stress", Mar. Biol. 23, 39-46, (1973).
14. Lavorel, J. P. Joliot, "A Connected Model of the Photosynthetic Unit", Biophys. J., 12, 715-831, (1972).
15. Loftus, M.E., J.H. Carpenter, "A Fluorometric Method For Determining Chlorophylls -a, -b, and -c", J. Marine Research 29, 319-338, (1971).
16. Loftus, M.E., D.V. Subba Rao, and H.H. Seliger, "Growth and Dissipation of Phytoplankton in Chesapeake Bay in Response to a Large Pulse of Rainfall", Chesapeake Science 13(4), 282-299, (1972).
17. Loftus, M.E., H.H. Seliger, "Some Limitations of the In-vivo Fluorescence Technique", Chesapeake Science 16, 79-92, (1975).
18. Lorenzen, C. J., "A Method For the Continuous Measurement of In-vivo Chlorophyll Concentration", Deep Sea Research 13, 223-227, (1966).
19. Lorenzen, C. J., "Determination of Chlorophyll and Pheo-pigments: Spectrophotometric Equations", Limnology and Oceanography 12, 343-346, (1967).
20. Lorenzen, C. J. and S.W. Jeffrey, "Determination of Chlorophyll in Seawater", Unesco Technical Papers in Marine Science #35 (1980).
21. Marker, A.F.H., "The Use of Acetone and Methanol in the Estimation of Chlorophyll in the Presence of Phaeophytin", Freshwat. Biol. 2, 361-385, (1972).
22. Oster, G., "The Chemical Effects of Light" Scientific American, Sept. 1968.
23. Piatt, T., "The Feasibility of Mapping the Chlorophyll Distribution in the Gulf of St. Lawrence", Fisheries Research Board of Canada, Technical Report #332, (1972).

24. Saijo, Y., and S. Nishizawa, "Excitation Spectra in the Fluorometric Determination of Chlorophyll-a and Phaeophytin-a", Mar. Bio. 2, 135-136, (1969).
25. Salonen, Kalevi, "Comparison of Different Glass Fibre and Silver Metal Filters for the Determination of Particulate Organic Carbon", Hydrobiologia 67,
. 29-32 (1979).
26. Sheldon, R.W. and W.H. Suteliffe, Jr., "Retention of Marine Particles by Screen and Filters", Limn.
' Oceanogr. 14-3, 441-444, (1969).
27. Sigma Chemical Corporation, P.O. Box 14508, St. Louis, Missouri 63178 - Product #C5753, Chlorophyll-a.
28. Strickland, J.D.H., "Continuous Measurement of In-vivo Chlorophyll; A Precautionary Note", Deep Sea Research, IS, 225-227, (1968).
29. Strickland, J.D.H., T.R. Parsons, "A Practical Handbook of the Sea Water Analysis", Fisheries Research Board of Canada, Ottawa, Canada (1968).
30. Turner Associates, Turner Laboratory Instruments, 1040 Cindy Way, Carpenteria, CA. 93013, (1977).
3L Turner, G.K., "An Absolute Spectrofluorometer", Science 146, 183-189, (1964).
32. Turner, G. K., Monograph "Chlorophyll and Phaeophytin", available from Turner Designs, 2247A Old Middlefield Way, Mountain View, CA 94043, (1977).
33. Udefriend, S., "Fluorescence Assay in Biology and Medicine", Vol. II, Academic Press (1969).
34. Weber, C.I., "Bioassay Techniques and Environmental Chemistry", 119-137, Ann Arbor Science Publishers, Inc., (1973).
35. White, C. E. and R. J. Arzaver, "Fluorescence Analysis, A Practical Approach", Marcel Dekker Inc., N.Y. (1970).
36. Wehry, E. L., "Modern Fluorescence Spectroscopy', Vols. I, II, Plenum Publishing Co. (1976).
37. White, R.C., I.D. Jones, E. Gibbs, L.S. Butler, "Fluorometric Estimation of Chlorophyllides, Pheo-phytins and Pheophorbides in Mixtures", J. Agr. Food Chem., 20, 773-778, (1972).
38. Yentsch, Charles S. and David W. Menzel,. "A Method for Determination of Phytoplankton Chlorophyll and Phaeophytin by Fluorescence", Deep Sea Research 10, 221-231, (1963).
14